Zip Codes with the Highest Percentage of Population Employed in Food Preparation & Serving in Enid, OK
RELATED REPORTS & OPTIONS
Food Preparation & Serving
Enid
Compare Zip Codes
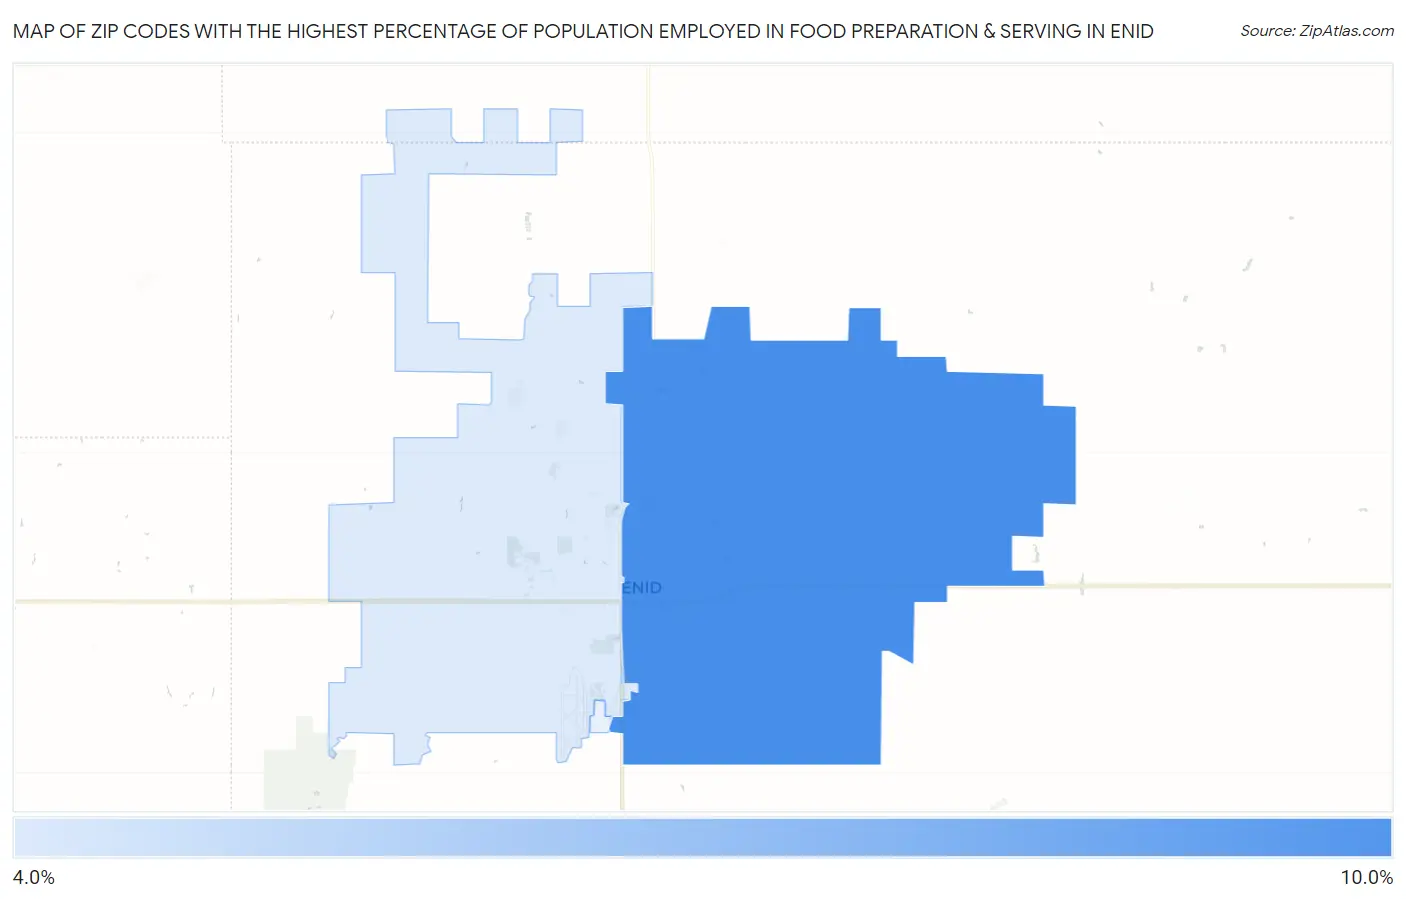
Map of Zip Codes with the Highest Percentage of Population Employed in Food Preparation & Serving in Enid
4.9%
9.0%
Zip Codes with the Highest Percentage of Population Employed in Food Preparation & Serving in Enid, OK
| Zip Code | % Employed | vs State | vs National | |
| 1. | 73701 | 9.0% | 5.6%(+3.40)#78 | 5.3%(+3.71)#3,531 |
| 2. | 73703 | 4.9% | 5.6%(-0.676)#283 | 5.3%(-0.367)#13,271 |
1
Common Questions
What are the Top Zip Codes with the Highest Percentage of Population Employed in Food Preparation & Serving in Enid, OK?
Top Zip Codes with the Highest Percentage of Population Employed in Food Preparation & Serving in Enid, OK are:
What zip code has the Highest Percentage of Population Employed in Food Preparation & Serving in Enid, OK?
73701 has the Highest Percentage of Population Employed in Food Preparation & Serving in Enid, OK with 9.0%.
What is the Percentage of Population Employed in Food Preparation & Serving in Enid, OK?
Percentage of Population Employed in Food Preparation & Serving in Enid is 7.1%.
What is the Percentage of Population Employed in Food Preparation & Serving in Oklahoma?
Percentage of Population Employed in Food Preparation & Serving in Oklahoma is 5.6%.
What is the Percentage of Population Employed in Food Preparation & Serving in the United States?
Percentage of Population Employed in Food Preparation & Serving in the United States is 5.3%.