Cities with the Highest Percentage of Comanche Population in Oklahoma
RELATED REPORTS & OPTIONS
Comanche
Oklahoma
Compare Cities
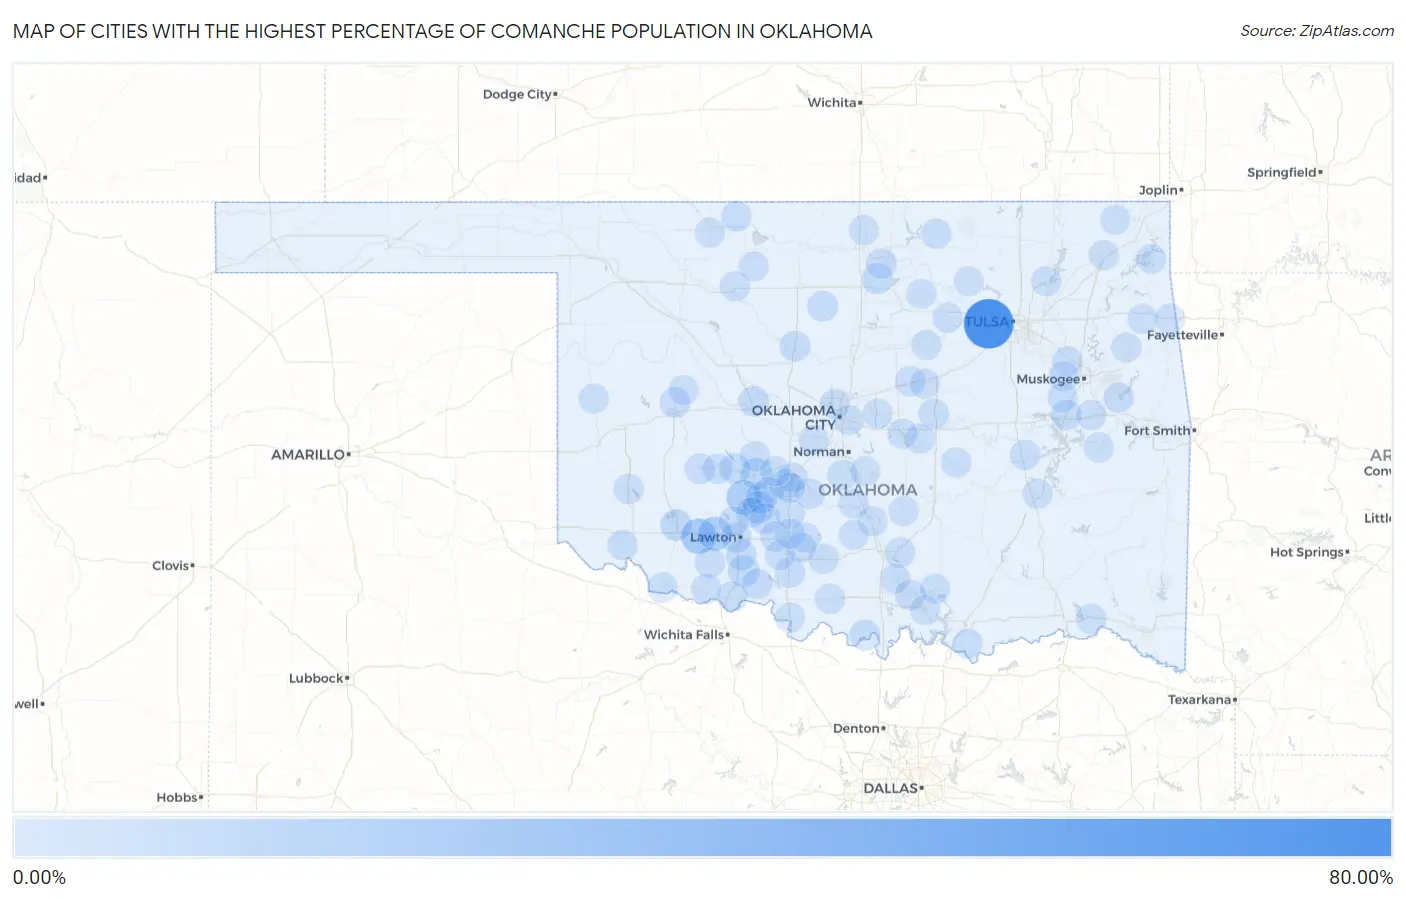
Map of Cities with the Highest Percentage of Comanche Population in Oklahoma
0.00%
80.00%
Cities with the Highest Percentage of Comanche Population in Oklahoma
| City | Comanche | vs State | vs National | |
| 1. | Lotsee | 80.00% | 0.23%(+79.8)#1 | 0.0096%(+80.0)#1 |
| 2. | Indiahoma | 20.49% | 0.23%(+20.3)#2 | 0.0096%(+20.5)#4 |
| 3. | Apache | 17.46% | 0.23%(+17.2)#3 | 0.0096%(+17.5)#5 |
| 4. | Cache | 15.87% | 0.23%(+15.6)#4 | 0.0096%(+15.9)#6 |
| 5. | Fletcher | 7.14% | 0.23%(+6.91)#5 | 0.0096%(+7.13)#8 |
| 6. | Mountain Park | 6.34% | 0.23%(+6.11)#6 | 0.0096%(+6.33)#10 |
| 7. | Anadarko | 6.22% | 0.23%(+5.99)#7 | 0.0096%(+6.21)#11 |
| 8. | Walters | 5.79% | 0.23%(+5.56)#8 | 0.0096%(+5.78)#12 |
| 9. | Cyril | 5.75% | 0.23%(+5.52)#9 | 0.0096%(+5.74)#13 |
| 10. | Fort Cobb | 4.01% | 0.23%(+3.78)#10 | 0.0096%(+4.00)#16 |
| 11. | Red Rock | 3.70% | 0.23%(+3.48)#11 | 0.0096%(+3.69)#18 |
| 12. | Geronimo | 3.27% | 0.23%(+3.05)#12 | 0.0096%(+3.26)#20 |
| 13. | Burneyville | 3.26% | 0.23%(+3.03)#13 | 0.0096%(+3.25)#22 |
| 14. | Douglas | 3.12% | 0.23%(+2.90)#14 | 0.0096%(+3.12)#24 |
| 15. | Cement | 2.99% | 0.23%(+2.76)#15 | 0.0096%(+2.98)#27 |
| 16. | Sterling | 2.85% | 0.23%(+2.62)#16 | 0.0096%(+2.84)#28 |
| 17. | Lawton | 2.78% | 0.23%(+2.55)#17 | 0.0096%(+2.77)#29 |
| 18. | Lake Ellsworth Addition | 2.73% | 0.23%(+2.50)#18 | 0.0096%(+2.72)#31 |
| 19. | Norge | 2.68% | 0.23%(+2.46)#19 | 0.0096%(+2.67)#32 |
| 20. | Geary | 2.46% | 0.23%(+2.23)#20 | 0.0096%(+2.45)#34 |
| 21. | Dover | 2.43% | 0.23%(+2.20)#21 | 0.0096%(+2.42)#35 |
| 22. | Checotah | 2.36% | 0.23%(+2.13)#22 | 0.0096%(+2.35)#38 |
| 23. | Arapaho | 2.14% | 0.23%(+1.91)#23 | 0.0096%(+2.13)#42 |
| 24. | Chattanooga | 2.08% | 0.23%(+1.85)#24 | 0.0096%(+2.07)#43 |
| 25. | Marland | 2.01% | 0.23%(+1.79)#25 | 0.0096%(+2.00)#44 |
| 26. | Mountain View | 1.99% | 0.23%(+1.76)#26 | 0.0096%(+1.98)#45 |
| 27. | Chandler | 1.80% | 0.23%(+1.57)#27 | 0.0096%(+1.79)#47 |
| 28. | Temple | 1.66% | 0.23%(+1.43)#28 | 0.0096%(+1.65)#54 |
| 29. | Central High | 1.62% | 0.23%(+1.39)#29 | 0.0096%(+1.61)#56 |
| 30. | Comanche | 1.53% | 0.23%(+1.30)#30 | 0.0096%(+1.52)#61 |
| 31. | Washington | 1.52% | 0.23%(+1.29)#31 | 0.0096%(+1.51)#62 |
| 32. | Velma | 1.25% | 0.23%(+1.03)#32 | 0.0096%(+1.24)#78 |
| 33. | Mannsville | 1.24% | 0.23%(+1.01)#33 | 0.0096%(+1.23)#79 |
| 34. | Paradise Hill | 1.20% | 0.23%(+0.976)#35 | 0.0096%(+1.20)#82 |
| 35. | Hanna | 1.20% | 0.23%(+0.976)#36 | 0.0096%(+1.20)#83 |
| 36. | Sulphur | 1.17% | 0.23%(+0.946)#37 | 0.0096%(+1.16)#86 |
| 37. | Bray | 1.17% | 0.23%(+0.943)#38 | 0.0096%(+1.16)#87 |
| 38. | Randlett | 1.10% | 0.23%(+0.868)#39 | 0.0096%(+1.09)#92 |
| 39. | Burlington | 1.09% | 0.23%(+0.865)#40 | 0.0096%(+1.08)#93 |
| 40. | Olustee | 1.06% | 0.23%(+0.834)#41 | 0.0096%(+1.05)#95 |
| 41. | Taft | 1.03% | 0.23%(+0.803)#42 | 0.0096%(+1.02)#97 |
| 42. | Shidler | 1.02% | 0.23%(+0.787)#43 | 0.0096%(+1.01)#98 |
| 43. | Achille | 0.97% | 0.23%(+0.738)#44 | 0.0096%(+0.957)#101 |
| 44. | Prague | 0.95% | 0.23%(+0.726)#45 | 0.0096%(+0.945)#102 |
| 45. | Alex | 0.95% | 0.23%(+0.719)#46 | 0.0096%(+0.938)#103 |
| 46. | Carnegie | 0.88% | 0.23%(+0.655)#47 | 0.0096%(+0.874)#110 |
| 47. | Elgin | 0.86% | 0.23%(+0.629)#48 | 0.0096%(+0.848)#113 |
| 48. | Wainwright | 0.85% | 0.23%(+0.619)#49 | 0.0096%(+0.838)#115 |
| 49. | Warner | 0.83% | 0.23%(+0.598)#50 | 0.0096%(+0.816)#117 |
| 50. | Welch | 0.81% | 0.23%(+0.583)#51 | 0.0096%(+0.802)#118 |
| 51. | Davidson | 0.81% | 0.23%(+0.581)#52 | 0.0096%(+0.800)#119 |
| 52. | Empire City | 0.79% | 0.23%(+0.560)#53 | 0.0096%(+0.779)#121 |
| 53. | Wewoka | 0.77% | 0.23%(+0.540)#54 | 0.0096%(+0.759)#124 |
| 54. | Cornish | 0.76% | 0.23%(+0.529)#55 | 0.0096%(+0.748)#127 |
| 55. | Maysville | 0.74% | 0.23%(+0.515)#56 | 0.0096%(+0.734)#130 |
| 56. | Chickasha | 0.73% | 0.23%(+0.505)#57 | 0.0096%(+0.724)#133 |
| 57. | Oaks | 0.72% | 0.23%(+0.494)#58 | 0.0096%(+0.712)#135 |
| 58. | Jennings | 0.69% | 0.23%(+0.459)#59 | 0.0096%(+0.678)#140 |
| 59. | Gracemont | 0.68% | 0.23%(+0.457)#60 | 0.0096%(+0.675)#142 |
| 60. | Granite | 0.68% | 0.23%(+0.451)#61 | 0.0096%(+0.669)#144 |
| 61. | Grandfield | 0.66% | 0.23%(+0.430)#62 | 0.0096%(+0.648)#147 |
| 62. | Earlsboro | 0.61% | 0.23%(+0.378)#63 | 0.0096%(+0.596)#155 |
| 63. | Marlow | 0.59% | 0.23%(+0.360)#64 | 0.0096%(+0.579)#159 |
| 64. | Mcalester | 0.56% | 0.23%(+0.329)#65 | 0.0096%(+0.548)#163 |
| 65. | Cleo Springs | 0.56% | 0.23%(+0.327)#66 | 0.0096%(+0.546)#164 |
| 66. | Fort Towson | 0.55% | 0.23%(+0.319)#67 | 0.0096%(+0.538)#165 |
| 67. | Madill | 0.53% | 0.23%(+0.306)#68 | 0.0096%(+0.525)#169 |
| 68. | Alva | 0.52% | 0.23%(+0.290)#69 | 0.0096%(+0.508)#171 |
| 69. | Porter | 0.52% | 0.23%(+0.288)#70 | 0.0096%(+0.507)#172 |
| 70. | West Siloam Springs | 0.51% | 0.23%(+0.283)#71 | 0.0096%(+0.502)#174 |
| 71. | Ninnekah | 0.51% | 0.23%(+0.277)#72 | 0.0096%(+0.496)#178 |
| 72. | Oologah | 0.50% | 0.23%(+0.276)#73 | 0.0096%(+0.495)#179 |
| 73. | Grandview | 0.49% | 0.23%(+0.266)#74 | 0.0096%(+0.484)#182 |
| 74. | Cheyenne | 0.49% | 0.23%(+0.261)#75 | 0.0096%(+0.480)#183 |
| 75. | Ryan | 0.49% | 0.23%(+0.257)#76 | 0.0096%(+0.476)#184 |
| 76. | Gene Autry | 0.48% | 0.23%(+0.252)#77 | 0.0096%(+0.471)#186 |
| 77. | Slaughterville | 0.48% | 0.23%(+0.249)#78 | 0.0096%(+0.468)#189 |
| 78. | Duncan | 0.47% | 0.23%(+0.237)#79 | 0.0096%(+0.456)#193 |
| 79. | Cushing | 0.46% | 0.23%(+0.227)#80 | 0.0096%(+0.446)#196 |
| 80. | Tishomingo | 0.45% | 0.23%(+0.222)#81 | 0.0096%(+0.441)#199 |
| 81. | Whitefield | 0.43% | 0.23%(+0.199)#82 | 0.0096%(+0.418)#206 |
| 82. | Harrah | 0.42% | 0.23%(+0.187)#83 | 0.0096%(+0.406)#210 |
| 83. | Pawnee | 0.41% | 0.23%(+0.186)#84 | 0.0096%(+0.405)#211 |
| 84. | Tuttle | 0.41% | 0.23%(+0.183)#85 | 0.0096%(+0.402)#213 |
| 85. | Verden | 0.40% | 0.23%(+0.172)#86 | 0.0096%(+0.390)#219 |
| 86. | Rush Springs | 0.40% | 0.23%(+0.167)#87 | 0.0096%(+0.386)#221 |
| 87. | Del City | 0.37% | 0.23%(+0.145)#88 | 0.0096%(+0.364)#228 |
| 88. | Stratford | 0.37% | 0.23%(+0.141)#89 | 0.0096%(+0.360)#230 |
| 89. | Custer City | 0.34% | 0.23%(+0.115)#90 | 0.0096%(+0.334)#234 |
| 90. | Helena | 0.34% | 0.23%(+0.114)#91 | 0.0096%(+0.333)#235 |
| 91. | Blackwell | 0.34% | 0.23%(+0.114)#92 | 0.0096%(+0.333)#237 |
| 92. | Medicine Park | 0.31% | 0.23%(+0.085)#93 | 0.0096%(+0.304)#250 |
| 93. | Pauls Valley | 0.30% | 0.23%(+0.070)#94 | 0.0096%(+0.289)#256 |
| 94. | Davenport | 0.29% | 0.23%(+0.063)#95 | 0.0096%(+0.282)#257 |
| 95. | Elmore City | 0.27% | 0.23%(+0.046)#96 | 0.0096%(+0.265)#264 |
| 96. | Grove | 0.27% | 0.23%(+0.043)#97 | 0.0096%(+0.261)#267 |
| 97. | Hominy | 0.27% | 0.23%(+0.042)#98 | 0.0096%(+0.261)#268 |
| 98. | Vinita | 0.25% | 0.23%(+0.021)#99 | 0.0096%(+0.240)#274 |
| 99. | Shawnee | 0.24% | 0.23%(+0.011)#100 | 0.0096%(+0.229)#282 |
| 100. | The Village | 0.23% | 0.23%(+0.004)#101 | 0.0096%(+0.222)#284 |
Common Questions
What are the Top 10 Cities with the Highest Percentage of Comanche Population in Oklahoma?
Top 10 Cities with the Highest Percentage of Comanche Population in Oklahoma are:
What city has the Highest Percentage of Comanche Population in Oklahoma?
Lotsee has the Highest Percentage of Comanche Population in Oklahoma with 80.00%.
What is the Percentage of Comanche Population in the State of Oklahoma?
Percentage of Comanche Population in Oklahoma is 0.23%.
What is the Percentage of Comanche Population in the United States?
Percentage of Comanche Population in the United States is 0.0096%.