Okemah, OK Map & Demographics
Okemah Map
Okemah Overview
$18,309
PER CAPITA INCOME
$37,538
AVG FAMILY INCOME
$34,882
AVG HOUSEHOLD INCOME
3.4%
WAGE / INCOME GAP [ % ]
96.6¢/ $1
WAGE / INCOME GAP [ $ ]
$12,613
FAMILY INCOME DEFICIT
0.46
INEQUALITY / GINI INDEX
3,078
TOTAL POPULATION
1,493
MALE POPULATION
1,585
FEMALE POPULATION
94.20
MALES / 100 FEMALES
106.16
FEMALES / 100 MALES
34.1
MEDIAN AGE
3.1
AVG FAMILY SIZE
2.5
AVG HOUSEHOLD SIZE
1,069
LABOR FORCE [ PEOPLE ]
45.9%
PERCENT IN LABOR FORCE
1.1%
UNEMPLOYMENT RATE
Okemah Zip Codes
Income in Okemah
Income Overview in Okemah
Per Capita Income in Okemah is $18,309, while median incomes of families and households are $37,538 and $34,882 respectively.
| Characteristic | Number | Measure |
| Per Capita Income | 3,078 | $18,309 |
| Median Family Income | 761 | $37,538 |
| Mean Family Income | 761 | $50,313 |
| Median Household Income | 1,151 | $34,882 |
| Mean Household Income | 1,151 | $45,786 |
| Income Deficit | 761 | $12,613 |
| Wage / Income Gap (%) | 3,078 | 3.37% |
| Wage / Income Gap ($) | 3,078 | 96.63¢ per $1 |
| Gini / Inequality Index | 3,078 | 0.46 |
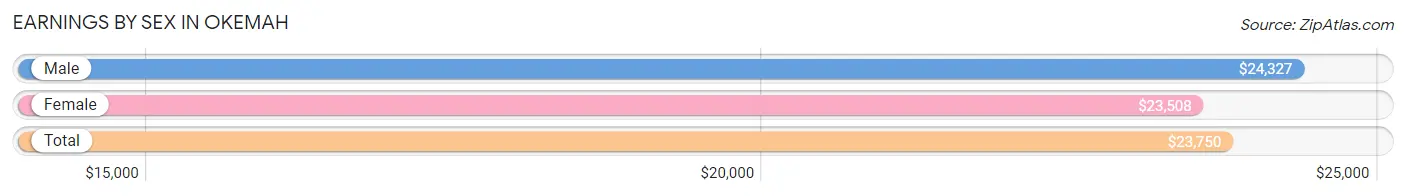
Earnings by Sex in Okemah
Average Earnings in Okemah are $23,750, $24,327 for men and $23,508 for women, a difference of 3.4%.
| Sex | Number | Average Earnings |
| Male | 571 (48.1%) | $24,327 |
| Female | 617 (51.9%) | $23,508 |
| Total | 1,188 (100.0%) | $23,750 |
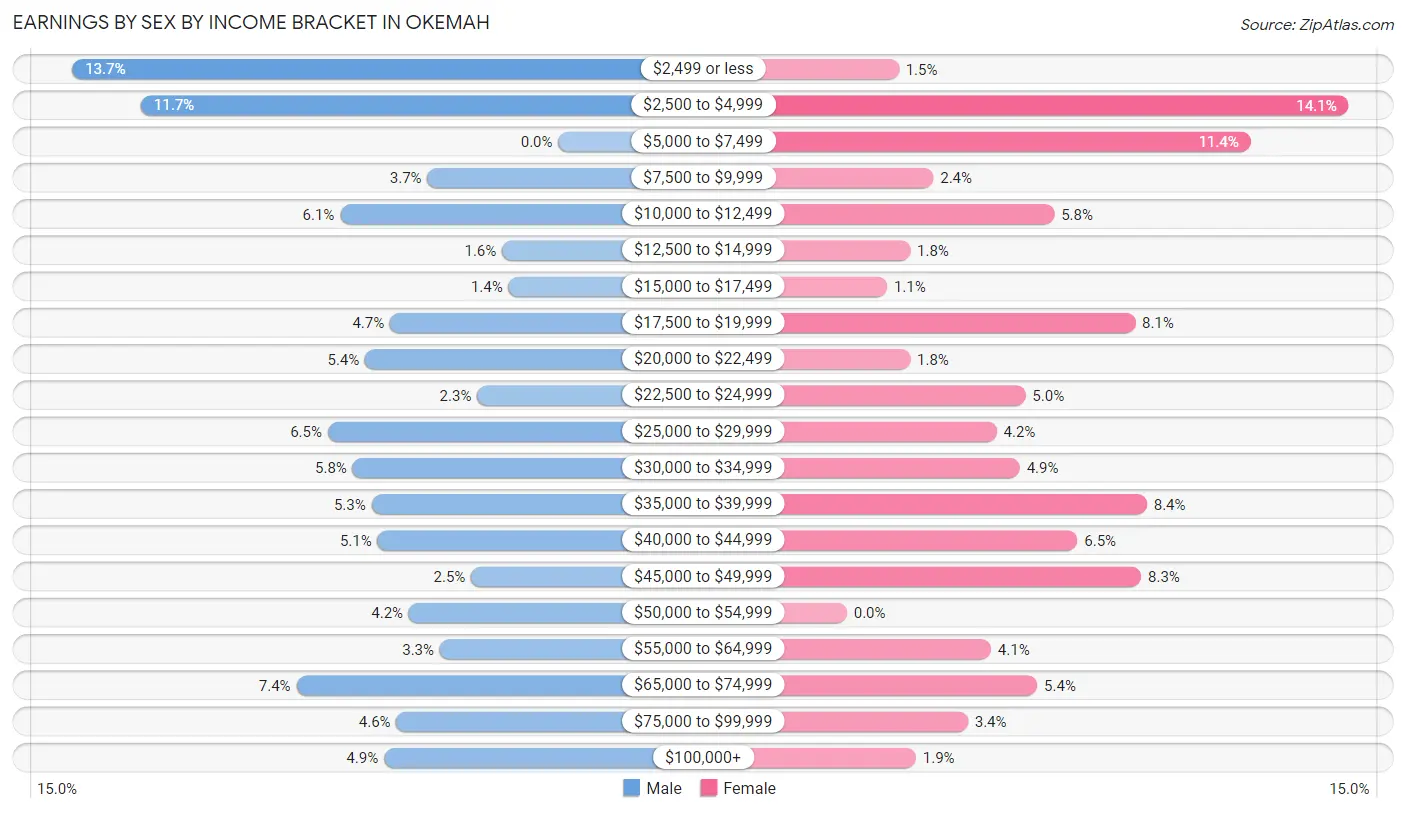
Earnings by Sex by Income Bracket in Okemah
The most common earnings brackets in Okemah are $2,499 or less for men (78 | 13.7%) and $2,500 to $4,999 for women (87 | 14.1%).
| Income | Male | Female |
| $2,499 or less | 78 (13.7%) | 9 (1.5%) |
| $2,500 to $4,999 | 67 (11.7%) | 87 (14.1%) |
| $5,000 to $7,499 | 0 (0.0%) | 70 (11.4%) |
| $7,500 to $9,999 | 21 (3.7%) | 15 (2.4%) |
| $10,000 to $12,499 | 35 (6.1%) | 36 (5.8%) |
| $12,500 to $14,999 | 9 (1.6%) | 11 (1.8%) |
| $15,000 to $17,499 | 8 (1.4%) | 7 (1.1%) |
| $17,500 to $19,999 | 27 (4.7%) | 50 (8.1%) |
| $20,000 to $22,499 | 31 (5.4%) | 11 (1.8%) |
| $22,500 to $24,999 | 13 (2.3%) | 31 (5.0%) |
| $25,000 to $29,999 | 37 (6.5%) | 26 (4.2%) |
| $30,000 to $34,999 | 33 (5.8%) | 30 (4.9%) |
| $35,000 to $39,999 | 30 (5.2%) | 52 (8.4%) |
| $40,000 to $44,999 | 29 (5.1%) | 40 (6.5%) |
| $45,000 to $49,999 | 14 (2.5%) | 51 (8.3%) |
| $50,000 to $54,999 | 24 (4.2%) | 0 (0.0%) |
| $55,000 to $64,999 | 19 (3.3%) | 25 (4.1%) |
| $65,000 to $74,999 | 42 (7.4%) | 33 (5.3%) |
| $75,000 to $99,999 | 26 (4.5%) | 21 (3.4%) |
| $100,000+ | 28 (4.9%) | 12 (1.9%) |
| Total | 571 (100.0%) | 617 (100.0%) |
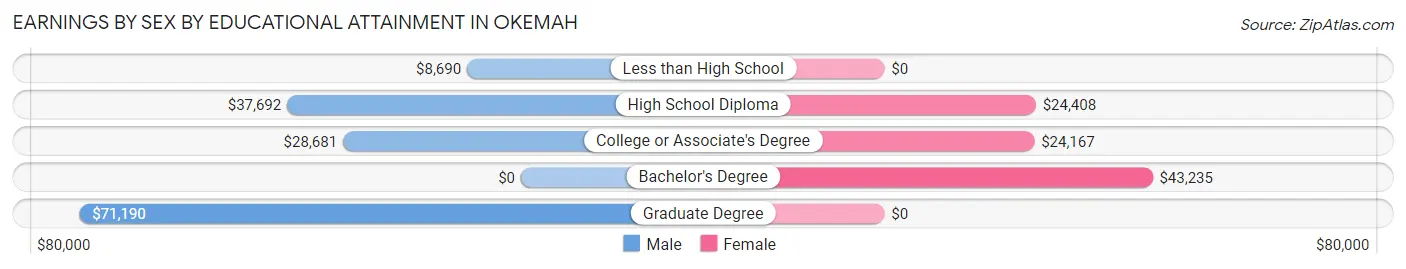
Earnings by Sex by Educational Attainment in Okemah
Average earnings in Okemah are $35,139 for men and $30,938 for women, a difference of 12.0%. Men with an educational attainment of graduate degree enjoy the highest average annual earnings of $71,190, while those with less than high school education earn the least with $8,690. Women with an educational attainment of bachelor's degree earn the most with the average annual earnings of $43,235, while those with college or associate's degree education have the smallest earnings of $24,167.
| Educational Attainment | Male Income | Female Income |
| Less than High School | $8,690 | $0 |
| High School Diploma | $37,692 | $24,408 |
| College or Associate's Degree | $28,681 | $24,167 |
| Bachelor's Degree | - | - |
| Graduate Degree | $71,190 | $0 |
| Total | $35,139 | $30,938 |
Family Income in Okemah
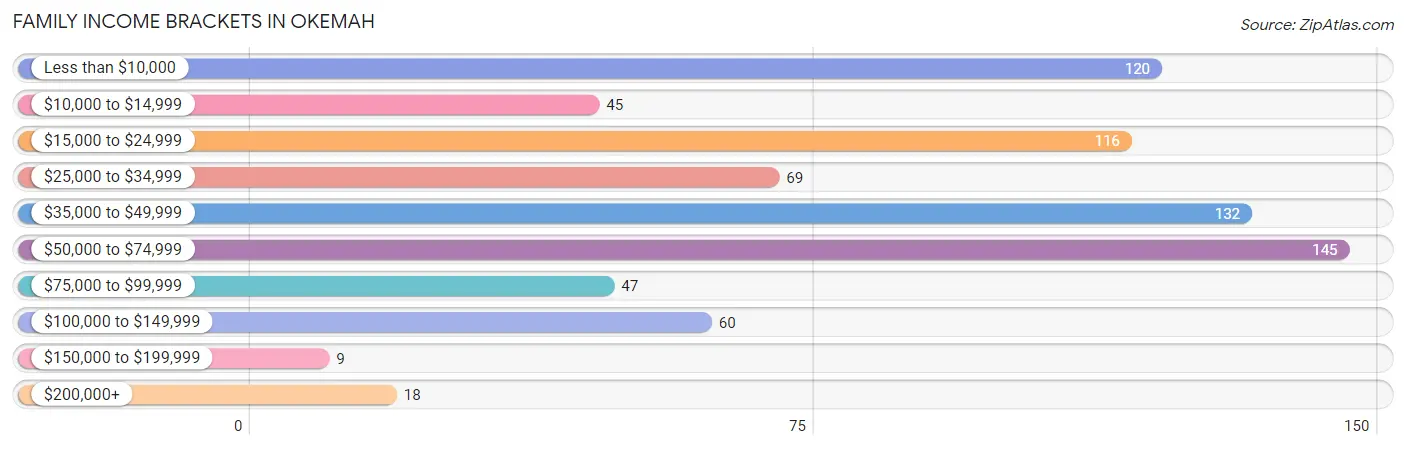
Family Income Brackets in Okemah
According to the Okemah family income data, there are 145 families falling into the $50,000 to $74,999 income range, which is the most common income bracket and makes up 19.1% of all families. Conversely, the $150,000 to $199,999 income bracket is the least frequent group with only 9 families (1.2%) belonging to this category.
| Income Bracket | # Families | % Families |
| Less than $10,000 | 120 | 15.8% |
| $10,000 to $14,999 | 45 | 5.9% |
| $15,000 to $24,999 | 116 | 15.2% |
| $25,000 to $34,999 | 69 | 9.1% |
| $35,000 to $49,999 | 132 | 17.3% |
| $50,000 to $74,999 | 145 | 19.1% |
| $75,000 to $99,999 | 47 | 6.2% |
| $100,000 to $149,999 | 60 | 7.9% |
| $150,000 to $199,999 | 9 | 1.2% |
| $200,000+ | 18 | 2.4% |
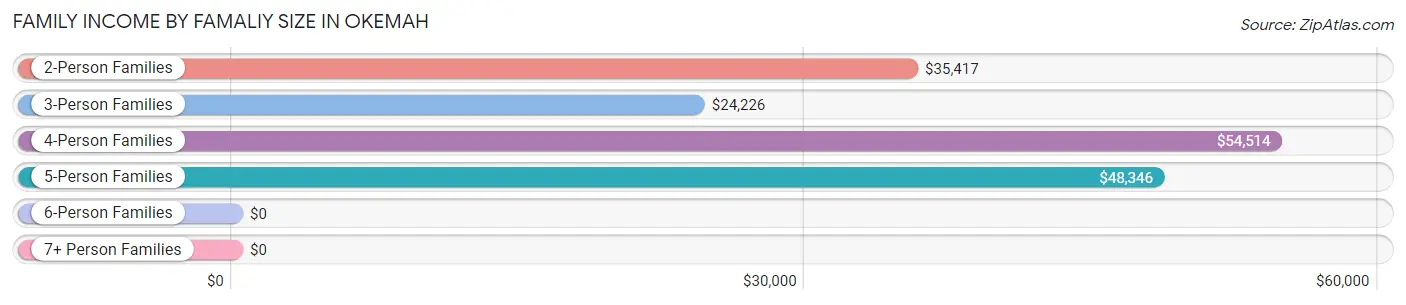
Family Income by Famaliy Size in Okemah
4-person families (99 | 13.0%) account for the highest median family income in Okemah with $54,514 per family, while 2-person families (358 | 47.0%) have the highest median income of $17,708 per family member.
| Income Bracket | # Families | Median Income |
| 2-Person Families | 358 (47.0%) | $35,417 |
| 3-Person Families | 153 (20.1%) | $24,226 |
| 4-Person Families | 99 (13.0%) | $54,514 |
| 5-Person Families | 111 (14.6%) | $48,346 |
| 6-Person Families | 9 (1.2%) | $0 |
| 7+ Person Families | 31 (4.1%) | $0 |
| Total | 761 (100.0%) | $37,538 |
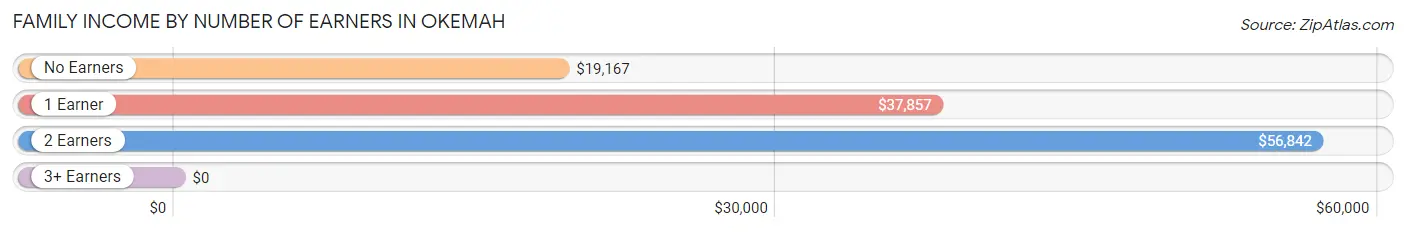
Family Income by Number of Earners in Okemah
| Number of Earners | # Families | Median Income |
| No Earners | 170 (22.3%) | $19,167 |
| 1 Earner | 350 (46.0%) | $37,857 |
| 2 Earners | 202 (26.5%) | $56,842 |
| 3+ Earners | 39 (5.1%) | $0 |
| Total | 761 (100.0%) | $37,538 |
Household Income in Okemah
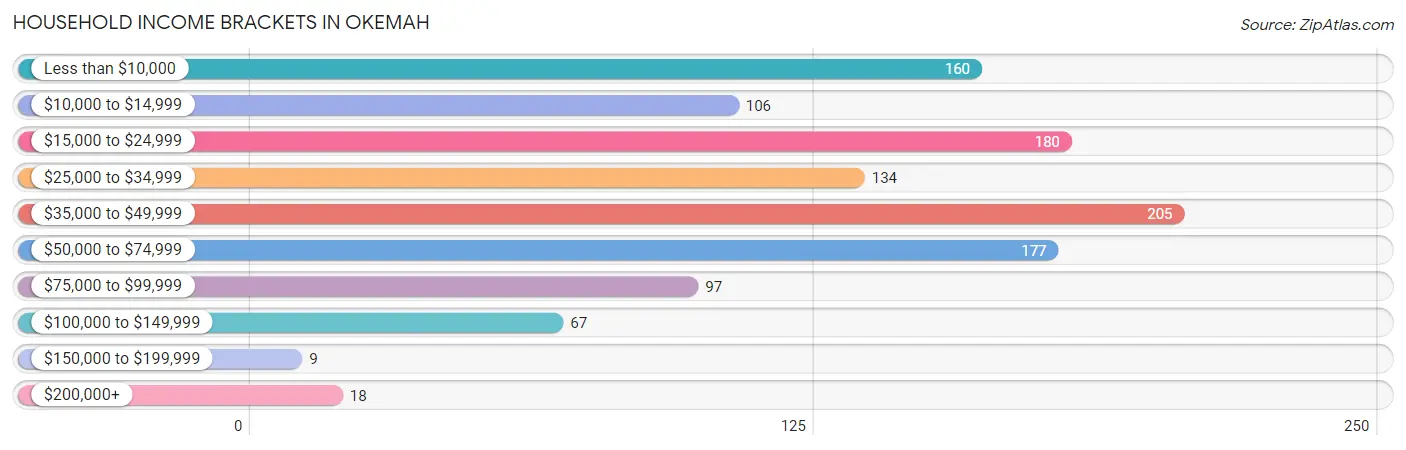
Household Income Brackets in Okemah
With 205 households falling in the category, the $35,000 to $49,999 income range is the most frequent in Okemah, accounting for 17.8% of all households. In contrast, only 9 households (0.8%) fall into the $150,000 to $199,999 income bracket, making it the least populous group.
| Income Bracket | # Households | % Households |
| Less than $10,000 | 160 | 13.9% |
| $10,000 to $14,999 | 106 | 9.2% |
| $15,000 to $24,999 | 180 | 15.6% |
| $25,000 to $34,999 | 134 | 11.6% |
| $35,000 to $49,999 | 205 | 17.8% |
| $50,000 to $74,999 | 177 | 15.4% |
| $75,000 to $99,999 | 97 | 8.4% |
| $100,000 to $149,999 | 67 | 5.8% |
| $150,000 to $199,999 | 9 | 0.8% |
| $200,000+ | 18 | 1.6% |
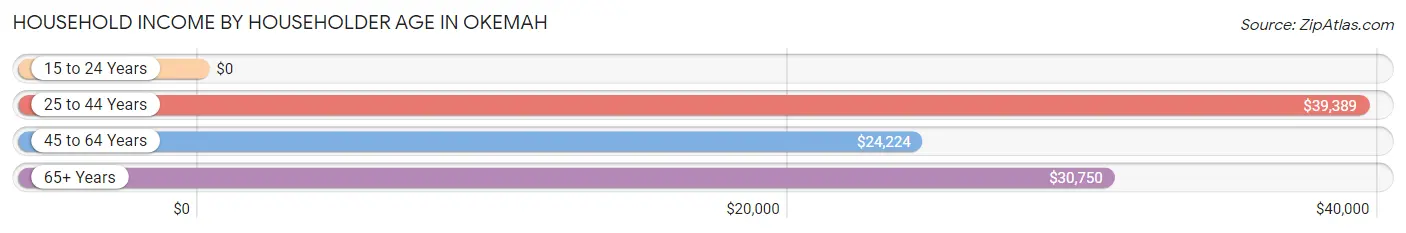
Household Income by Householder Age in Okemah
The median household income in Okemah is $34,882, with the highest median household income of $39,389 found in the 25 to 44 years age bracket for the primary householder. A total of 460 households (40.0%) fall into this category. Meanwhile, the 15 to 24 years age bracket for the primary householder has the lowest median household income of $0, with 85 households (7.4%) in this group.
| Income Bracket | # Households | Median Income |
| 15 to 24 Years | 85 (7.4%) | $0 |
| 25 to 44 Years | 460 (40.0%) | $39,389 |
| 45 to 64 Years | 338 (29.4%) | $24,224 |
| 65+ Years | 268 (23.3%) | $30,750 |
| Total | 1,151 (100.0%) | $34,882 |
Poverty in Okemah
Income Below Poverty by Sex and Age in Okemah
With 35.5% poverty level for males and 38.9% for females among the residents of Okemah, 12 to 14 year old males and 5 year old females are the most vulnerable to poverty, with 34 males (91.9%) and 29 females (78.4%) in their respective age groups living below the poverty level.
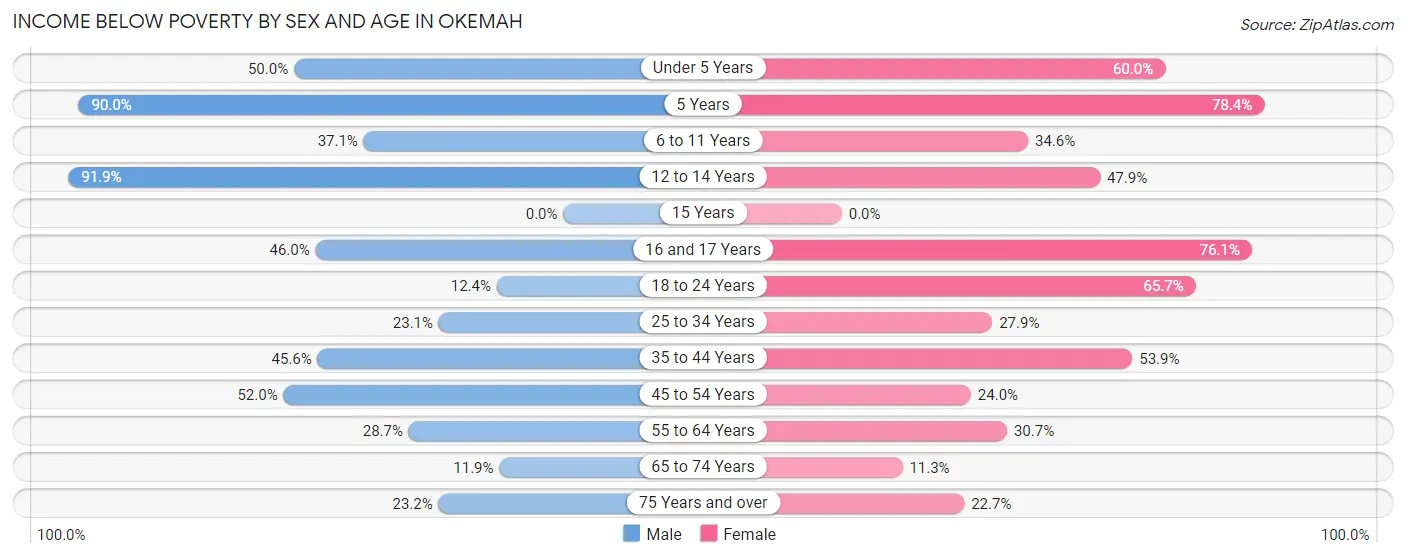
| Age Bracket | Male | Female |
| Under 5 Years | 68 (50.0%) | 69 (60.0%) |
| 5 Years | 27 (90.0%) | 29 (78.4%) |
| 6 to 11 Years | 63 (37.1%) | 56 (34.6%) |
| 12 to 14 Years | 34 (91.9%) | 23 (47.9%) |
| 15 Years | 0 (0.0%) | 0 (0.0%) |
| 16 and 17 Years | 23 (46.0%) | 35 (76.1%) |
| 18 to 24 Years | 20 (12.3%) | 88 (65.7%) |
| 25 to 34 Years | 49 (23.1%) | 55 (27.9%) |
| 35 to 44 Years | 73 (45.6%) | 110 (53.9%) |
| 45 to 54 Years | 80 (51.9%) | 35 (24.0%) |
| 55 to 64 Years | 37 (28.7%) | 42 (30.7%) |
| 65 to 74 Years | 12 (11.9%) | 17 (11.3%) |
| 75 Years and over | 19 (23.2%) | 25 (22.7%) |
| Total | 505 (35.5%) | 584 (38.9%) |
Income Above Poverty by Sex and Age in Okemah
According to the poverty statistics in Okemah, males aged 65 to 74 years and females aged 15 years are the age groups that are most secure financially, with 88.1% of males and 100.0% of females in these age groups living above the poverty line.
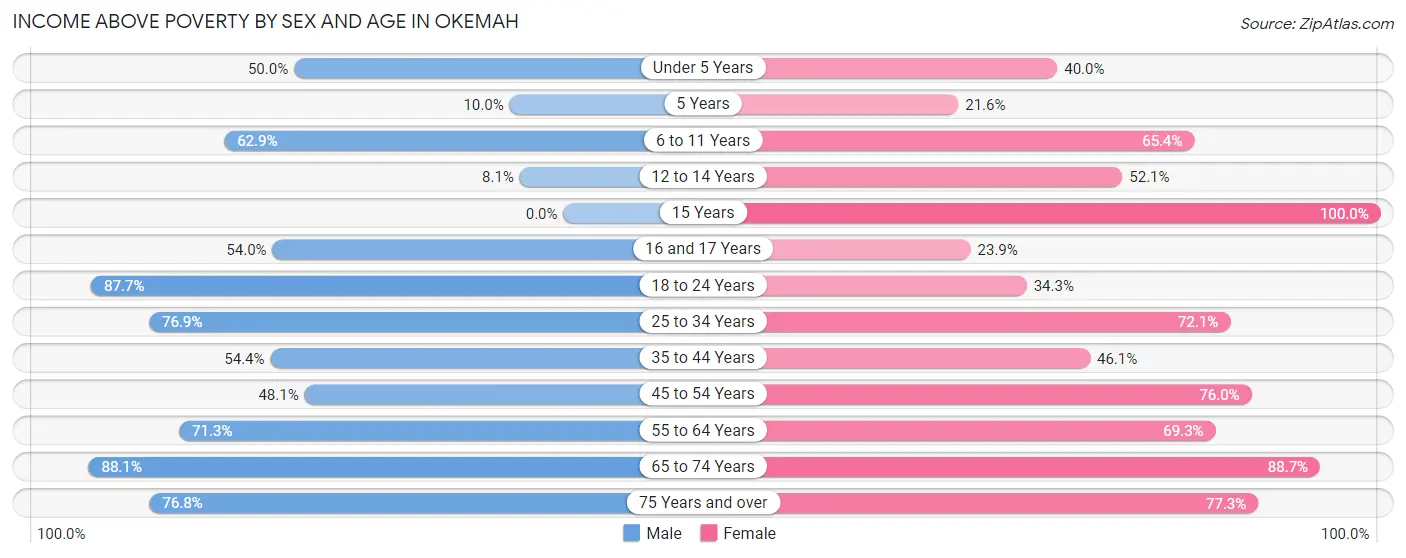
| Age Bracket | Male | Female |
| Under 5 Years | 68 (50.0%) | 46 (40.0%) |
| 5 Years | 3 (10.0%) | 8 (21.6%) |
| 6 to 11 Years | 107 (62.9%) | 106 (65.4%) |
| 12 to 14 Years | 3 (8.1%) | 25 (52.1%) |
| 15 Years | 0 (0.0%) | 14 (100.0%) |
| 16 and 17 Years | 27 (54.0%) | 11 (23.9%) |
| 18 to 24 Years | 142 (87.6%) | 46 (34.3%) |
| 25 to 34 Years | 163 (76.9%) | 142 (72.1%) |
| 35 to 44 Years | 87 (54.4%) | 94 (46.1%) |
| 45 to 54 Years | 74 (48.0%) | 111 (76.0%) |
| 55 to 64 Years | 92 (71.3%) | 95 (69.3%) |
| 65 to 74 Years | 89 (88.1%) | 134 (88.7%) |
| 75 Years and over | 63 (76.8%) | 85 (77.3%) |
| Total | 918 (64.5%) | 917 (61.1%) |
Income Below Poverty Among Married-Couple Families in Okemah
The poverty statistics for married-couple families in Okemah show that 16.0% or 55 of the total 343 families live below the poverty line. Families with 5 or more children have the highest poverty rate of 100.0%, comprising of 31 families. On the other hand, families with 3 or 4 children have the lowest poverty rate of 0.0%, which includes 0 families.
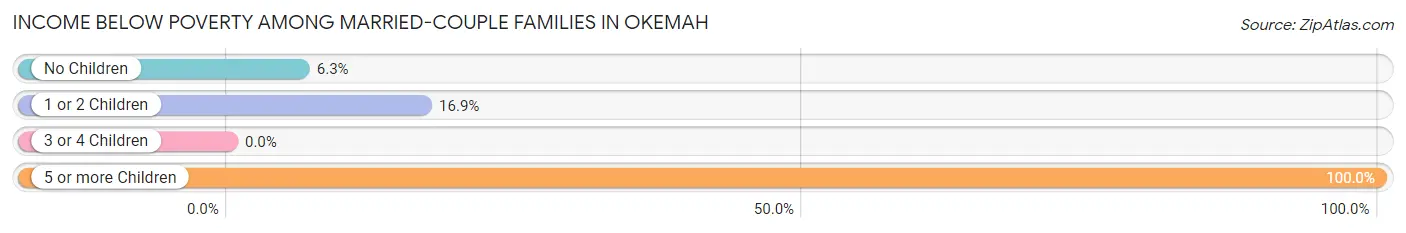
| Children | Above Poverty | Below Poverty |
| No Children | 180 (93.8%) | 12 (6.2%) |
| 1 or 2 Children | 59 (83.1%) | 12 (16.9%) |
| 3 or 4 Children | 49 (100.0%) | 0 (0.0%) |
| 5 or more Children | 0 (0.0%) | 31 (100.0%) |
| Total | 288 (84.0%) | 55 (16.0%) |
Income Below Poverty Among Single-Parent Households in Okemah
According to the poverty data in Okemah, 47.1% or 49 single-father households and 51.0% or 160 single-mother households are living below the poverty line. Among single-father households, those with 1 or 2 children have the highest poverty rate, with 34 households (54.8%) experiencing poverty. Likewise, among single-mother households, those with 1 or 2 children have the highest poverty rate, with 92 households (69.7%) falling below the poverty line.
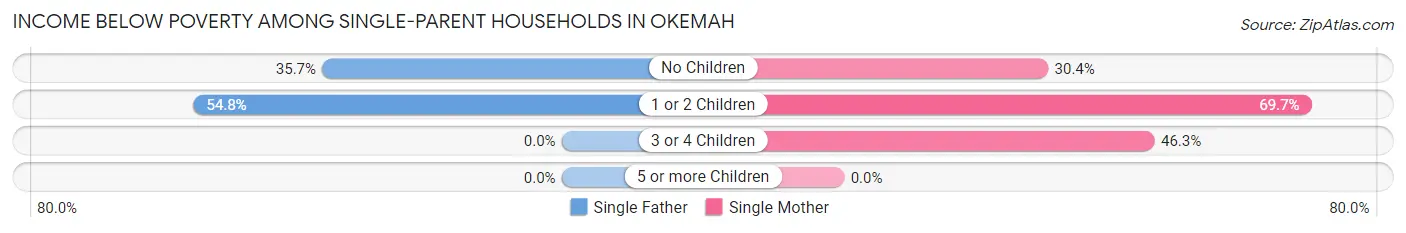
| Children | Single Father | Single Mother |
| No Children | 15 (35.7%) | 31 (30.4%) |
| 1 or 2 Children | 34 (54.8%) | 92 (69.7%) |
| 3 or 4 Children | 0 (0.0%) | 37 (46.3%) |
| 5 or more Children | 0 (0.0%) | 0 (0.0%) |
| Total | 49 (47.1%) | 160 (51.0%) |
Income Below Poverty Among Married-Couple vs Single-Parent Households in Okemah
The poverty data for Okemah shows that 55 of the married-couple family households (16.0%) and 209 of the single-parent households (50.0%) are living below the poverty level. Within the married-couple family households, those with 5 or more children have the highest poverty rate, with 31 households (100.0%) falling below the poverty line. Among the single-parent households, those with 1 or 2 children have the highest poverty rate, with 126 household (64.9%) living below poverty.
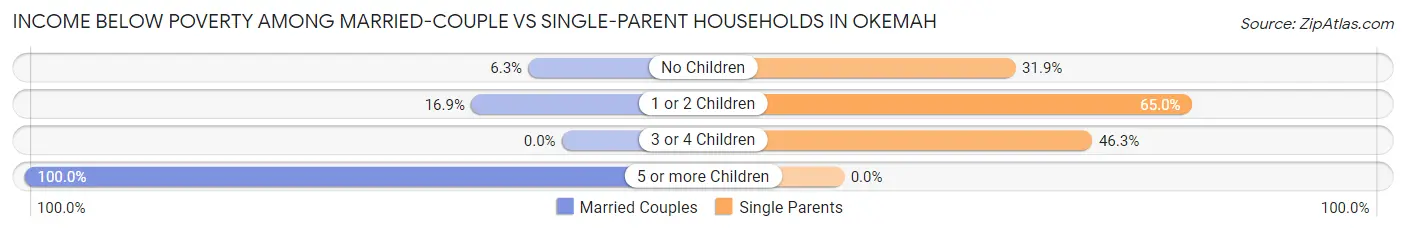
| Children | Married-Couple Families | Single-Parent Households |
| No Children | 12 (6.2%) | 46 (31.9%) |
| 1 or 2 Children | 12 (16.9%) | 126 (64.9%) |
| 3 or 4 Children | 0 (0.0%) | 37 (46.3%) |
| 5 or more Children | 31 (100.0%) | 0 (0.0%) |
| Total | 55 (16.0%) | 209 (50.0%) |
Race in Okemah
The most populous races in Okemah are White / Caucasian (1,890 | 61.4%), Native / Alaskan (697 | 22.6%), and Two or more Races (426 | 13.8%).
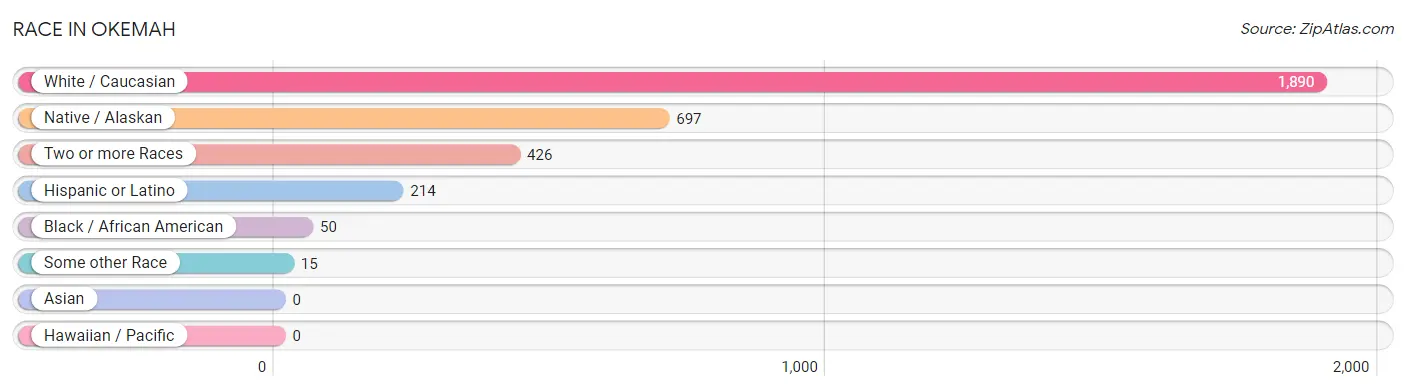
| Race | # Population | % Population |
| Asian | 0 | 0.0% |
| Black / African American | 50 | 1.6% |
| Hawaiian / Pacific | 0 | 0.0% |
| Hispanic or Latino | 214 | 7.0% |
| Native / Alaskan | 697 | 22.6% |
| White / Caucasian | 1,890 | 61.4% |
| Two or more Races | 426 | 13.8% |
| Some other Race | 15 | 0.5% |
| Total | 3,078 | 100.0% |
Ancestry in Okemah
The most populous ancestries reported in Okemah are Creek (728 | 23.6%), American (262 | 8.5%), Cherokee (202 | 6.6%), Irish (182 | 5.9%), and German (166 | 5.4%), together accounting for 50.0% of all Okemah residents.
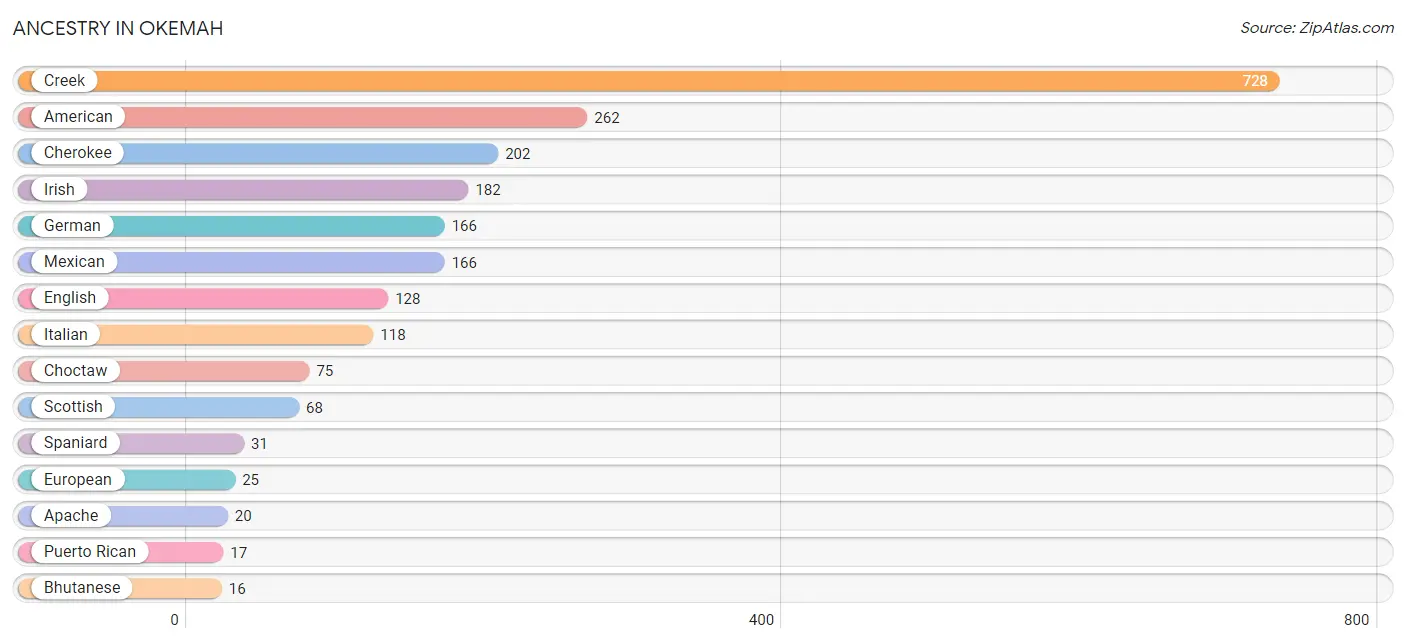
| Ancestry | # Population | % Population |
| American | 262 | 8.5% |
| Apache | 20 | 0.6% |
| Bhutanese | 16 | 0.5% |
| Cherokee | 202 | 6.6% |
| Chickasaw | 7 | 0.2% |
| Choctaw | 75 | 2.4% |
| Creek | 728 | 23.6% |
| Dutch | 7 | 0.2% |
| Dutch West Indian | 6 | 0.2% |
| Eastern European | 8 | 0.3% |
| English | 128 | 4.2% |
| European | 25 | 0.8% |
| German | 166 | 5.4% |
| Hungarian | 5 | 0.2% |
| Irish | 182 | 5.9% |
| Italian | 118 | 3.8% |
| Mexican | 166 | 5.4% |
| Norwegian | 4 | 0.1% |
| Polish | 9 | 0.3% |
| Puerto Rican | 17 | 0.5% |
| Scotch-Irish | 10 | 0.3% |
| Scottish | 68 | 2.2% |
| Spaniard | 31 | 1.0% |
| Swedish | 5 | 0.2% | View All 24 Rows |
Immigrants in Okemah

| Immigration Origin | # Population | % Population | View All 0 Rows |
Sex and Age in Okemah
Sex and Age in Okemah
The most populous age groups in Okemah are 5 to 9 Years (164 | 11.0%) for men and 5 to 9 Years (157 | 9.9%) for women.
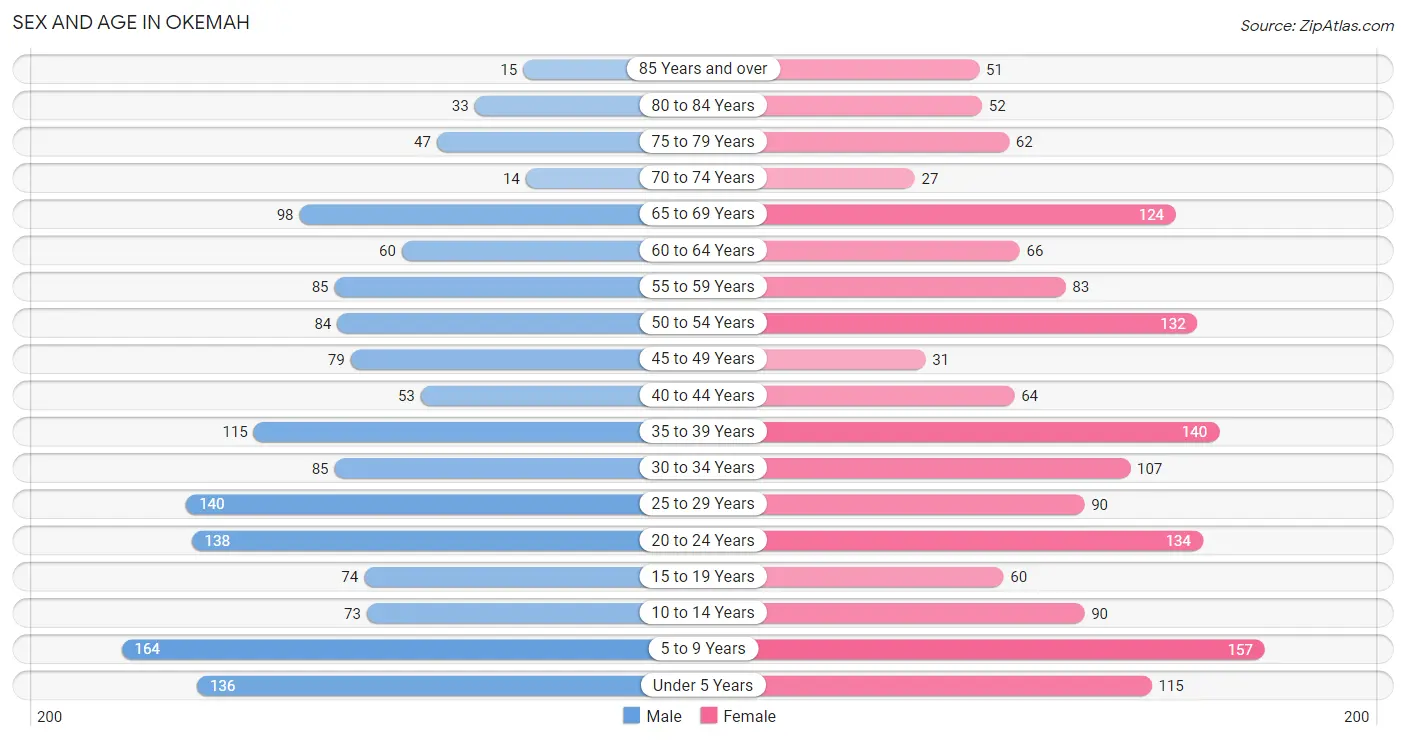
| Age Bracket | Male | Female |
| Under 5 Years | 136 (9.1%) | 115 (7.3%) |
| 5 to 9 Years | 164 (11.0%) | 157 (9.9%) |
| 10 to 14 Years | 73 (4.9%) | 90 (5.7%) |
| 15 to 19 Years | 74 (5.0%) | 60 (3.8%) |
| 20 to 24 Years | 138 (9.2%) | 134 (8.5%) |
| 25 to 29 Years | 140 (9.4%) | 90 (5.7%) |
| 30 to 34 Years | 85 (5.7%) | 107 (6.8%) |
| 35 to 39 Years | 115 (7.7%) | 140 (8.8%) |
| 40 to 44 Years | 53 (3.5%) | 64 (4.0%) |
| 45 to 49 Years | 79 (5.3%) | 31 (2.0%) |
| 50 to 54 Years | 84 (5.6%) | 132 (8.3%) |
| 55 to 59 Years | 85 (5.7%) | 83 (5.2%) |
| 60 to 64 Years | 60 (4.0%) | 66 (4.2%) |
| 65 to 69 Years | 98 (6.6%) | 124 (7.8%) |
| 70 to 74 Years | 14 (0.9%) | 27 (1.7%) |
| 75 to 79 Years | 47 (3.2%) | 62 (3.9%) |
| 80 to 84 Years | 33 (2.2%) | 52 (3.3%) |
| 85 Years and over | 15 (1.0%) | 51 (3.2%) |
| Total | 1,493 (100.0%) | 1,585 (100.0%) |
Families and Households in Okemah
Median Family Size in Okemah
The median family size in Okemah is 3.09 persons per family, with married-couple families (343 | 45.1%) accounting for the largest median family size of 3.38 persons per family. On the other hand, single male/father families (104 | 13.7%) represent the smallest median family size with 2.56 persons per family.
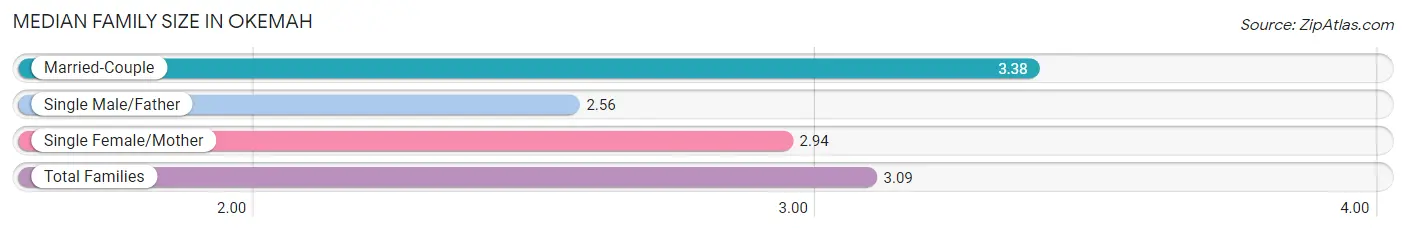
| Family Type | # Families | Family Size |
| Married-Couple | 343 (45.1%) | 3.38 |
| Single Male/Father | 104 (13.7%) | 2.56 |
| Single Female/Mother | 314 (41.3%) | 2.94 |
| Total Families | 761 (100.0%) | 3.09 |
Median Household Size in Okemah
The median household size in Okemah is 2.51 persons per household, with married-couple households (343 | 29.8%) accounting for the largest median household size of 3.38 persons per household. non-family households (390 | 33.9%) represent the smallest median household size with 1.04 persons per household.
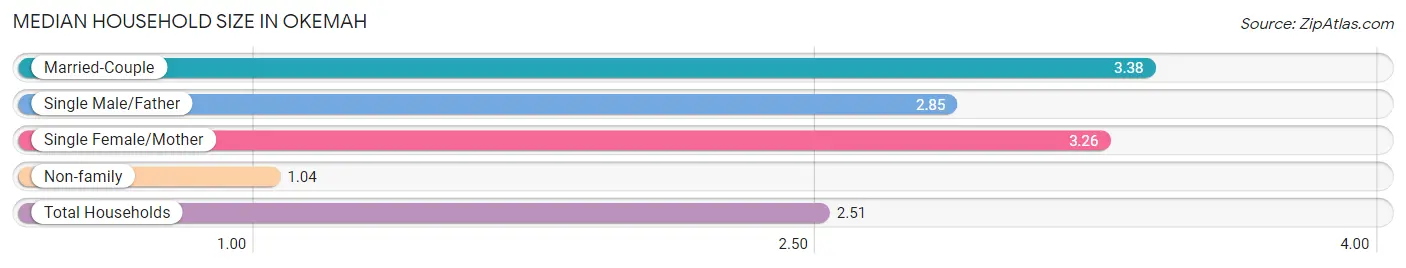
| Household Type | # Households | Household Size |
| Married-Couple | 343 (29.8%) | 3.38 |
| Single Male/Father | 104 (9.0%) | 2.85 |
| Single Female/Mother | 314 (27.3%) | 3.26 |
| Non-family | 390 (33.9%) | 1.04 |
| Total Households | 1,151 (100.0%) | 2.51 |
Household Size by Marriage Status in Okemah
Out of a total of 1,151 households in Okemah, 761 (66.1%) are family households, while 390 (33.9%) are nonfamily households. The most numerous type of family households are 2-person households, comprising 323, and the most common type of nonfamily households are 1-person households, comprising 368.
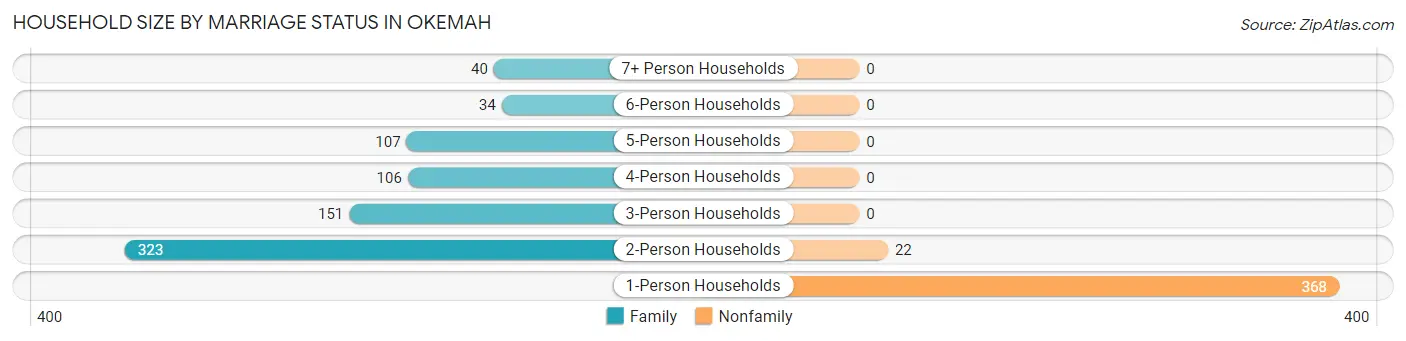
| Household Size | Family Households | Nonfamily Households |
| 1-Person Households | - | 368 (32.0%) |
| 2-Person Households | 323 (28.1%) | 22 (1.9%) |
| 3-Person Households | 151 (13.1%) | 0 (0.0%) |
| 4-Person Households | 106 (9.2%) | 0 (0.0%) |
| 5-Person Households | 107 (9.3%) | 0 (0.0%) |
| 6-Person Households | 34 (2.9%) | 0 (0.0%) |
| 7+ Person Households | 40 (3.5%) | 0 (0.0%) |
| Total | 761 (66.1%) | 390 (33.9%) |
Female Fertility in Okemah
Fertility by Age in Okemah
Average fertility rate in Okemah is 35.0 births per 1,000 women. Women in the age bracket of 20 to 34 years have the highest fertility rate with 66.0 births per 1,000 women. Women in the age bracket of 20 to 34 years acount for 100.0% of all women with births.
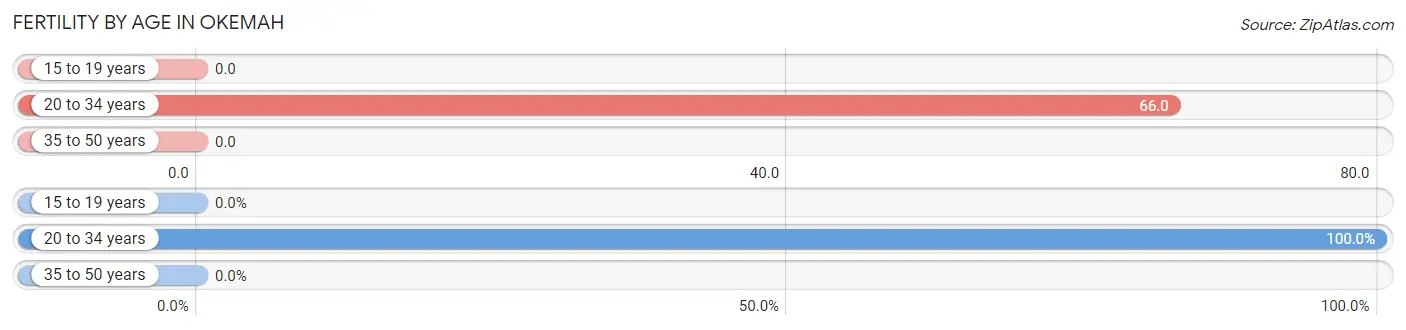
| Age Bracket | Women with Births | Births / 1,000 Women |
| 15 to 19 years | 0 (0.0%) | 0.0 |
| 20 to 34 years | 22 (100.0%) | 66.0 |
| 35 to 50 years | 0 (0.0%) | 0.0 |
| Total | 22 (100.0%) | 35.0 |
Fertility by Age by Marriage Status in Okemah
40.9% of women with births (22) in Okemah are married. The highest percentage of unmarried women with births falls into 20 to 34 years age bracket with 59.1% of them unmarried at the time of birth, while the lowest percentage of unmarried women with births belong to 20 to 34 years age bracket with 59.1% of them unmarried.
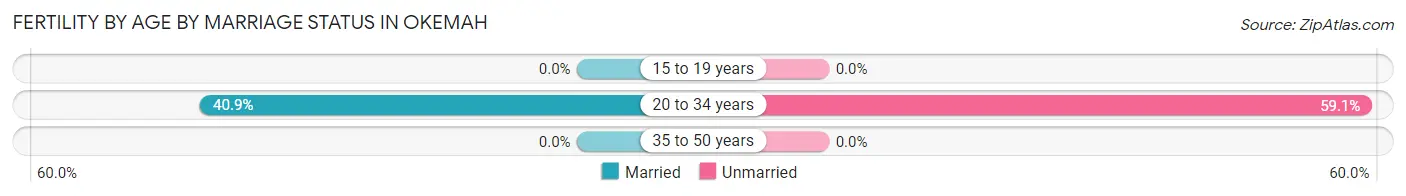
| Age Bracket | Married | Unmarried |
| 15 to 19 years | 0 (0.0%) | 0 (0.0%) |
| 20 to 34 years | 9 (40.9%) | 13 (59.1%) |
| 35 to 50 years | 0 (0.0%) | 0 (0.0%) |
| Total | 9 (40.9%) | 13 (59.1%) |
Fertility by Education in Okemah
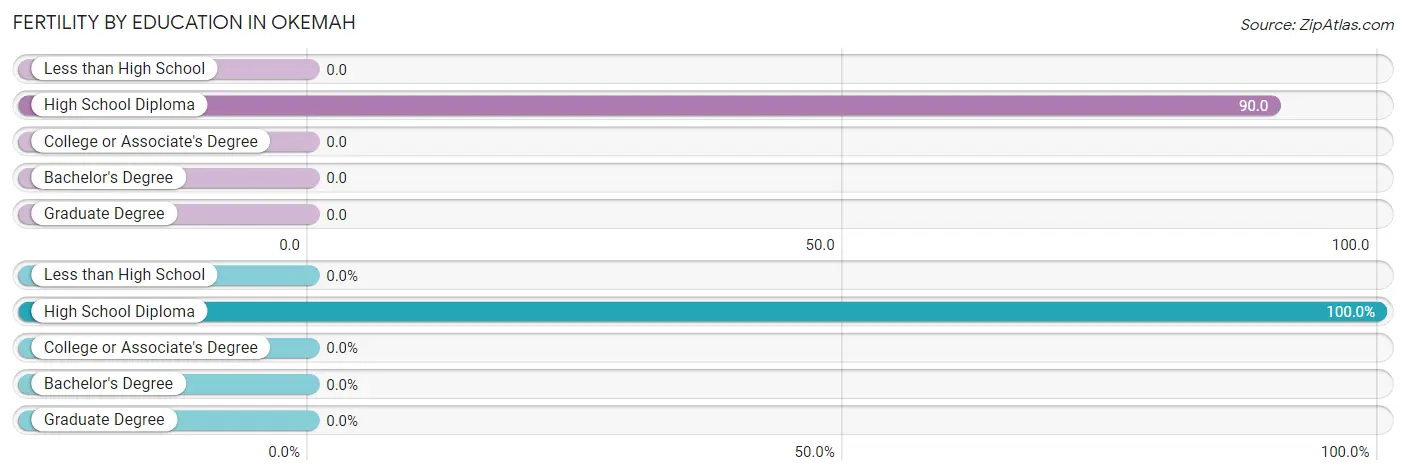
| Educational Attainment | Women with Births | Births / 1,000 Women |
| Less than High School | 0 (0.0%) | 0.0 |
| High School Diploma | 22 (100.0%) | 90.0 |
| College or Associate's Degree | 0 (0.0%) | 0.0 |
| Bachelor's Degree | 0 (0.0%) | 0.0 |
| Graduate Degree | 0 (0.0%) | 0.0 |
| Total | 22 (100.0%) | 35.0 |
Fertility by Education by Marriage Status in Okemah
59.1% of women with births in Okemah are unmarried. Women with the educational attainment of high school diploma are most likely to be married with 40.9% of them married at childbirth, while women with the educational attainment of high school diploma are least likely to be married with 59.1% of them unmarried at childbirth.
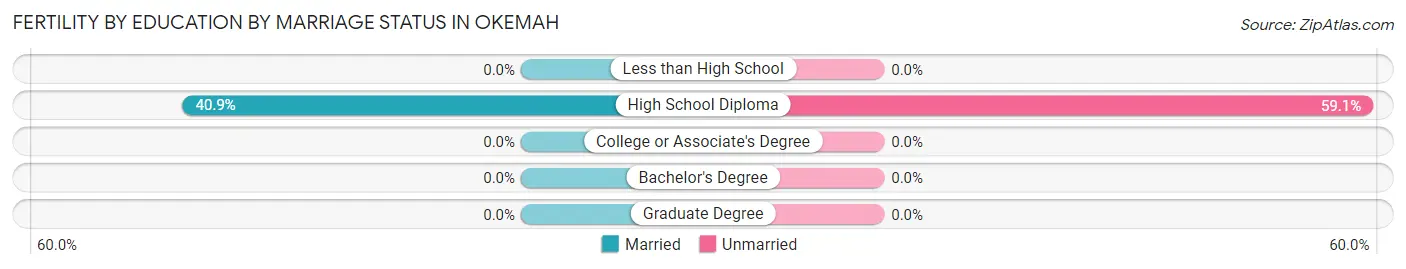
| Educational Attainment | Married | Unmarried |
| Less than High School | 0 (0.0%) | 0 (0.0%) |
| High School Diploma | 9 (40.9%) | 13 (59.1%) |
| College or Associate's Degree | 0 (0.0%) | 0 (0.0%) |
| Bachelor's Degree | 0 (0.0%) | 0 (0.0%) |
| Graduate Degree | 0 (0.0%) | 0 (0.0%) |
| Total | 9 (40.9%) | 13 (59.1%) |
Employment Characteristics in Okemah
Employment by Class of Employer in Okemah
Among the 994 employed individuals in Okemah, private company employees (697 | 70.1%), federal government employees (113 | 11.4%), and local government employees (73 | 7.3%) make up the most common classes of employment.
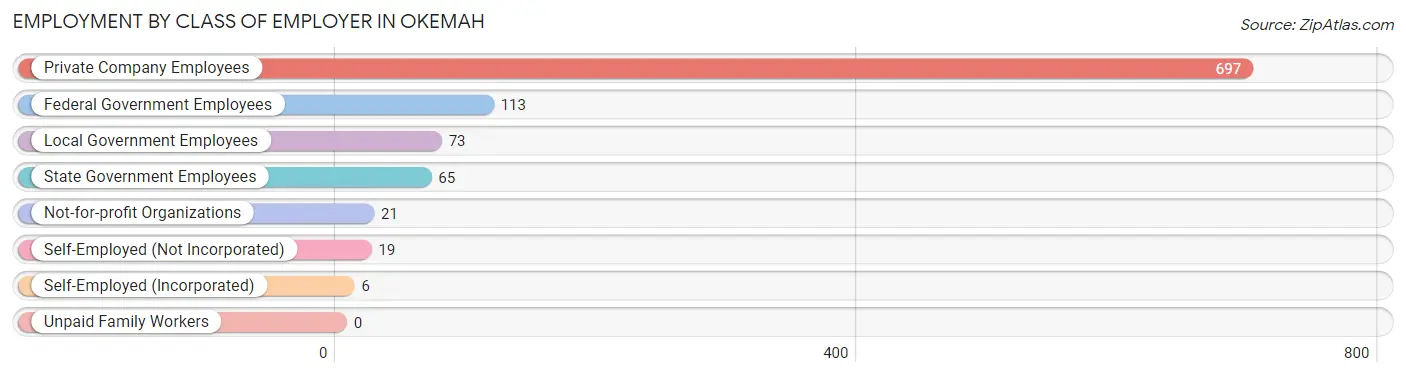
| Employer Class | # Employees | % Employees |
| Private Company Employees | 697 | 70.1% |
| Self-Employed (Incorporated) | 6 | 0.6% |
| Self-Employed (Not Incorporated) | 19 | 1.9% |
| Not-for-profit Organizations | 21 | 2.1% |
| Local Government Employees | 73 | 7.3% |
| State Government Employees | 65 | 6.5% |
| Federal Government Employees | 113 | 11.4% |
| Unpaid Family Workers | 0 | 0.0% |
| Total | 994 | 100.0% |
Employment Status by Age in Okemah
According to the labor force statistics for Okemah, out of the total population over 16 years of age (2,329), 45.9% or 1,069 individuals are in the labor force, with 1.1% or 12 of them unemployed. The age group with the highest labor force participation rate is 30 to 34 years, with 73.4% or 141 individuals in the labor force. Within the labor force, the 25 to 29 years age range has the highest percentage of unemployed individuals, with 7.4% or 12 of them being unemployed.
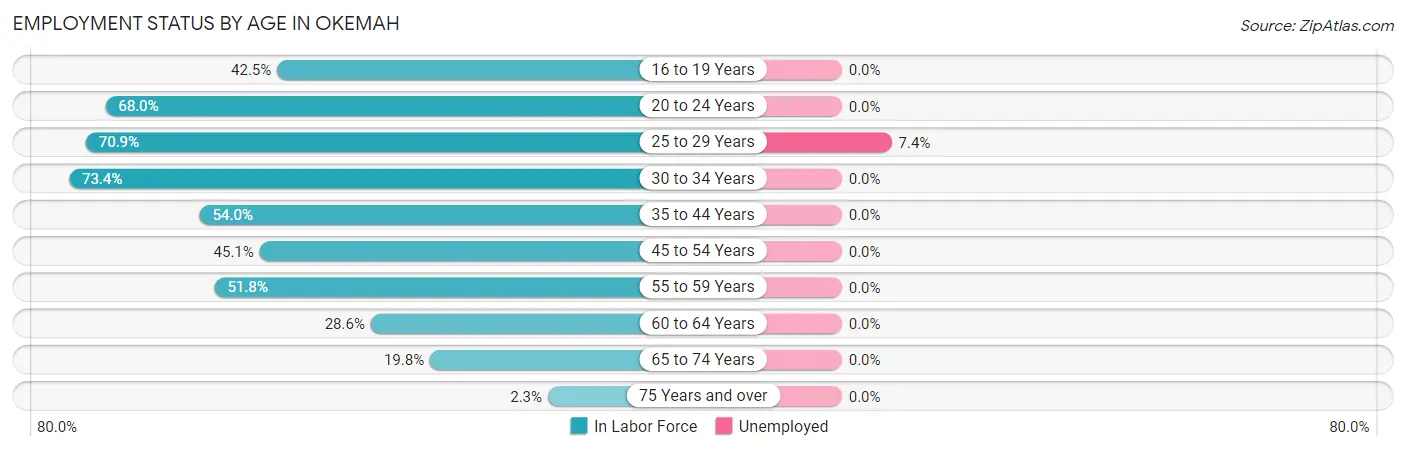
| Age Bracket | In Labor Force | Unemployed |
| 16 to 19 Years | 51 (42.5%) | 0 (0.0%) |
| 20 to 24 Years | 185 (68.0%) | 0 (0.0%) |
| 25 to 29 Years | 163 (70.9%) | 12 (7.4%) |
| 30 to 34 Years | 141 (73.4%) | 0 (0.0%) |
| 35 to 44 Years | 201 (54.0%) | 0 (0.0%) |
| 45 to 54 Years | 147 (45.1%) | 0 (0.0%) |
| 55 to 59 Years | 87 (51.8%) | 0 (0.0%) |
| 60 to 64 Years | 36 (28.6%) | 0 (0.0%) |
| 65 to 74 Years | 52 (19.8%) | 0 (0.0%) |
| 75 Years and over | 6 (2.3%) | 0 (0.0%) |
| Total | 1,069 (45.9%) | 12 (1.1%) |
Employment Status by Educational Attainment in Okemah
According to labor force statistics for Okemah, 54.8% of individuals (775) out of the total population between 25 and 64 years of age (1,414) are in the labor force, with 1.5% or 12 of them being unemployed. The group with the highest labor force participation rate are those with the educational attainment of bachelor's degree or higher, with 88.3% or 113 individuals in the labor force. Within the labor force, individuals with less than high school education have the highest percentage of unemployment, with 14.6% or 12 of them being unemployed.
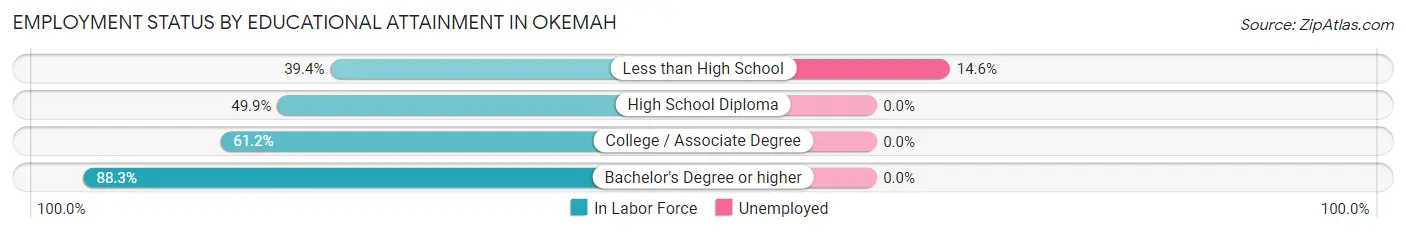
| Educational Attainment | In Labor Force | Unemployed |
| Less than High School | 82 (39.4%) | 30 (14.6%) |
| High School Diploma | 351 (49.9%) | 0 (0.0%) |
| College / Associate Degree | 229 (61.2%) | 0 (0.0%) |
| Bachelor's Degree or higher | 113 (88.3%) | 0 (0.0%) |
| Total | 775 (54.8%) | 21 (1.5%) |
Employment Occupations by Sex in Okemah
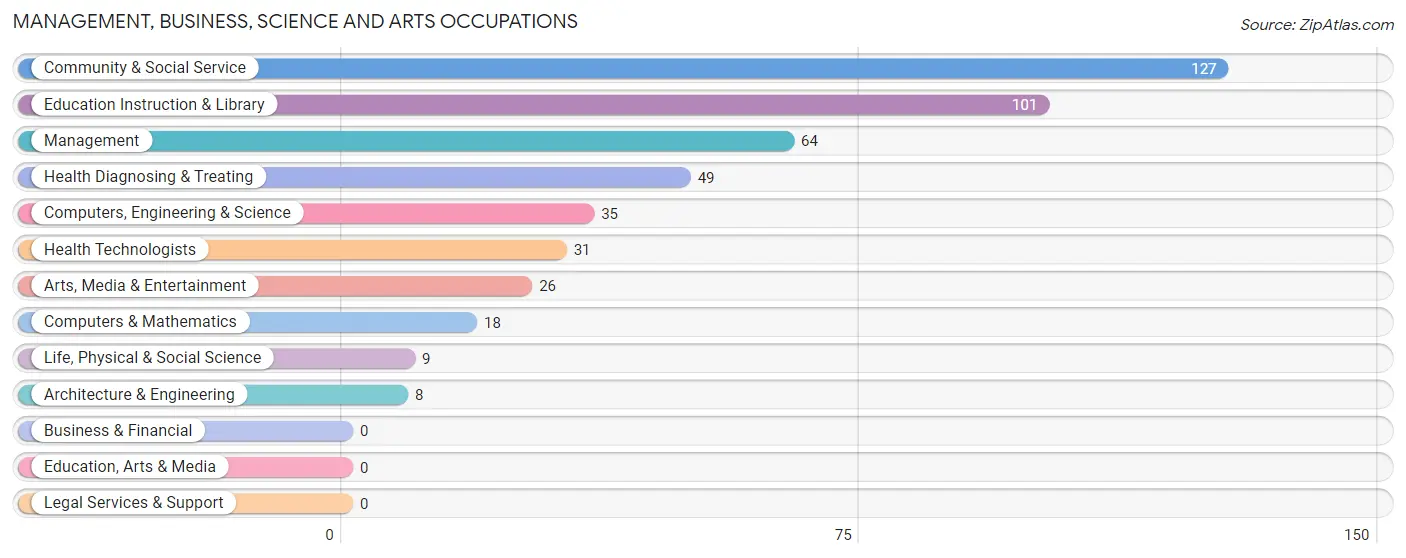
Management, Business, Science and Arts Occupations
The most common Management, Business, Science and Arts occupations in Okemah are Community & Social Service (127 | 12.0%), Education Instruction & Library (101 | 9.6%), Management (64 | 6.0%), Health Diagnosing & Treating (49 | 4.6%), and Computers, Engineering & Science (35 | 3.3%).
Management, Business, Science and Arts Occupations by Sex
Within the Management, Business, Science and Arts occupations in Okemah, the most male-oriented occupations are Computers & Mathematics (100.0%), Architecture & Engineering (100.0%), and Computers, Engineering & Science (74.3%), while the most female-oriented occupations are Life, Physical & Social Science (100.0%), Health Diagnosing & Treating (85.7%), and Arts, Media & Entertainment (84.6%).
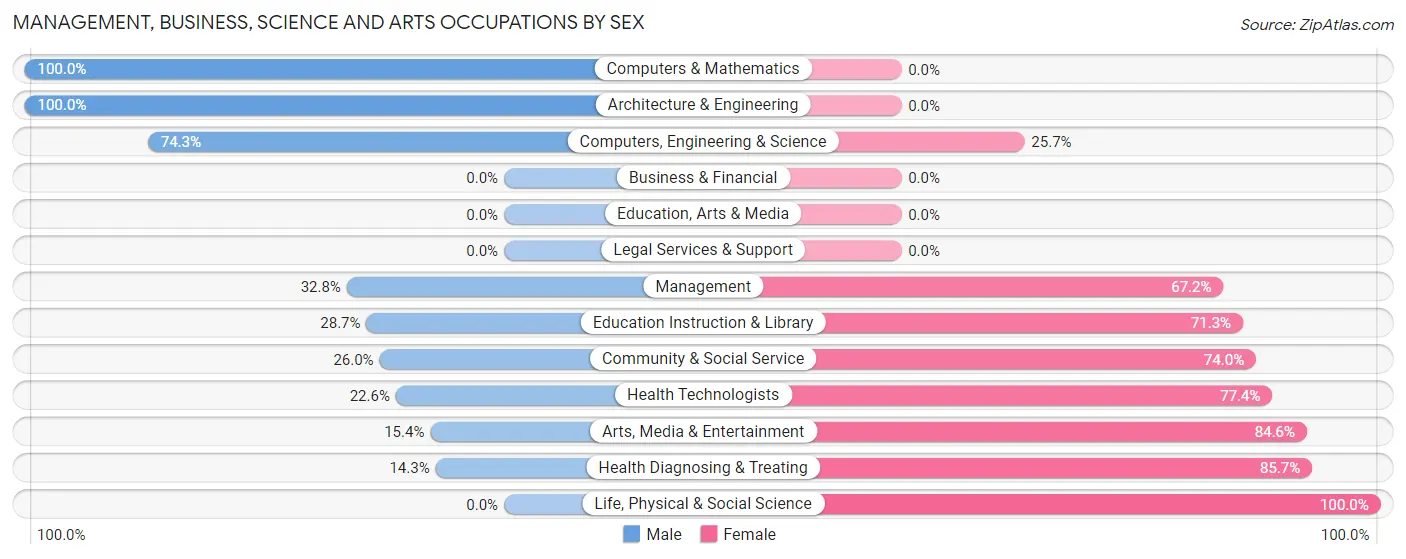
| Occupation | Male | Female |
| Management | 21 (32.8%) | 43 (67.2%) |
| Business & Financial | 0 (0.0%) | 0 (0.0%) |
| Computers, Engineering & Science | 26 (74.3%) | 9 (25.7%) |
| Computers & Mathematics | 18 (100.0%) | 0 (0.0%) |
| Architecture & Engineering | 8 (100.0%) | 0 (0.0%) |
| Life, Physical & Social Science | 0 (0.0%) | 9 (100.0%) |
| Community & Social Service | 33 (26.0%) | 94 (74.0%) |
| Education, Arts & Media | 0 (0.0%) | 0 (0.0%) |
| Legal Services & Support | 0 (0.0%) | 0 (0.0%) |
| Education Instruction & Library | 29 (28.7%) | 72 (71.3%) |
| Arts, Media & Entertainment | 4 (15.4%) | 22 (84.6%) |
| Health Diagnosing & Treating | 7 (14.3%) | 42 (85.7%) |
| Health Technologists | 7 (22.6%) | 24 (77.4%) |
| Total (Category) | 87 (31.6%) | 188 (68.4%) |
| Total (Overall) | 492 (46.6%) | 565 (53.4%) |
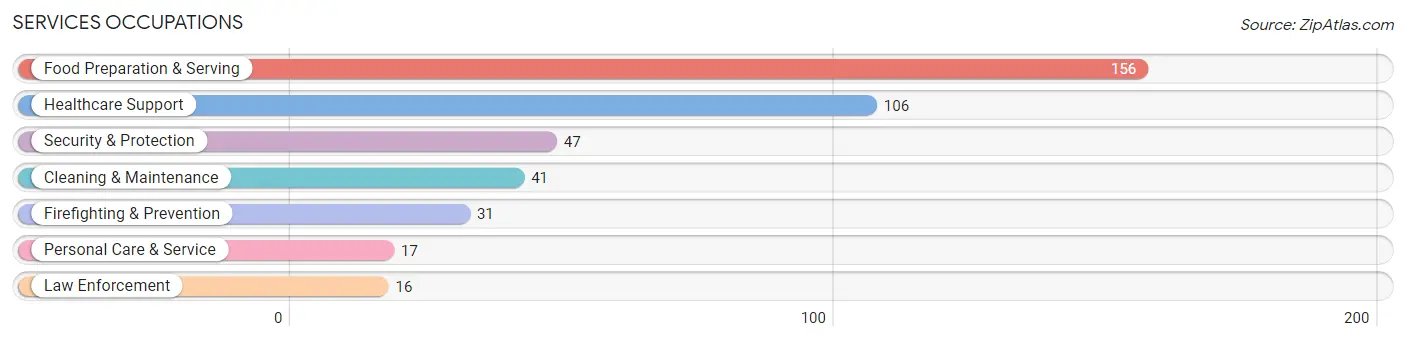
Services Occupations
The most common Services occupations in Okemah are Food Preparation & Serving (156 | 14.8%), Healthcare Support (106 | 10.0%), Security & Protection (47 | 4.4%), Cleaning & Maintenance (41 | 3.9%), and Firefighting & Prevention (31 | 2.9%).
Services Occupations by Sex
Within the Services occupations in Okemah, the most male-oriented occupations are Security & Protection (100.0%), Firefighting & Prevention (100.0%), and Law Enforcement (100.0%), while the most female-oriented occupations are Personal Care & Service (100.0%), Healthcare Support (73.6%), and Food Preparation & Serving (35.9%).
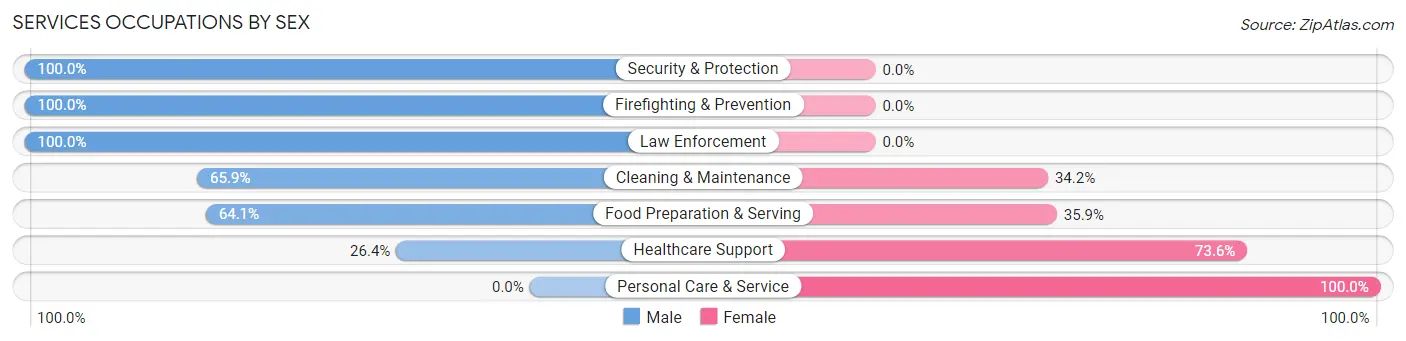
| Occupation | Male | Female |
| Healthcare Support | 28 (26.4%) | 78 (73.6%) |
| Security & Protection | 47 (100.0%) | 0 (0.0%) |
| Firefighting & Prevention | 31 (100.0%) | 0 (0.0%) |
| Law Enforcement | 16 (100.0%) | 0 (0.0%) |
| Food Preparation & Serving | 100 (64.1%) | 56 (35.9%) |
| Cleaning & Maintenance | 27 (65.8%) | 14 (34.2%) |
| Personal Care & Service | 0 (0.0%) | 17 (100.0%) |
| Total (Category) | 202 (55.0%) | 165 (45.0%) |
| Total (Overall) | 492 (46.6%) | 565 (53.4%) |
Sales and Office Occupations
The most common Sales and Office occupations in Okemah are Sales & Related (81 | 7.7%), and Office & Administration (81 | 7.7%).
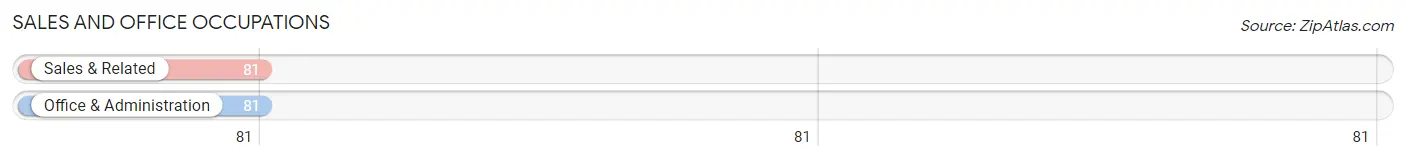
Sales and Office Occupations by Sex
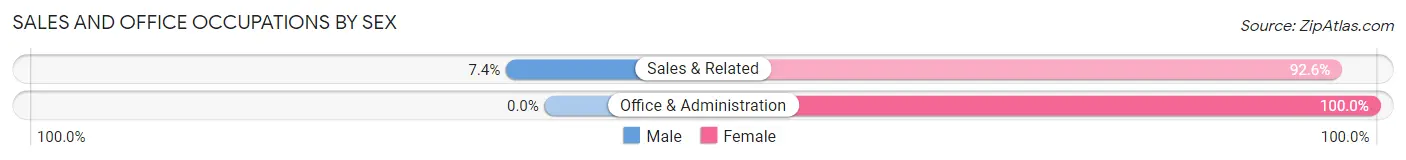
| Occupation | Male | Female |
| Sales & Related | 6 (7.4%) | 75 (92.6%) |
| Office & Administration | 0 (0.0%) | 81 (100.0%) |
| Total (Category) | 6 (3.7%) | 156 (96.3%) |
| Total (Overall) | 492 (46.6%) | 565 (53.4%) |
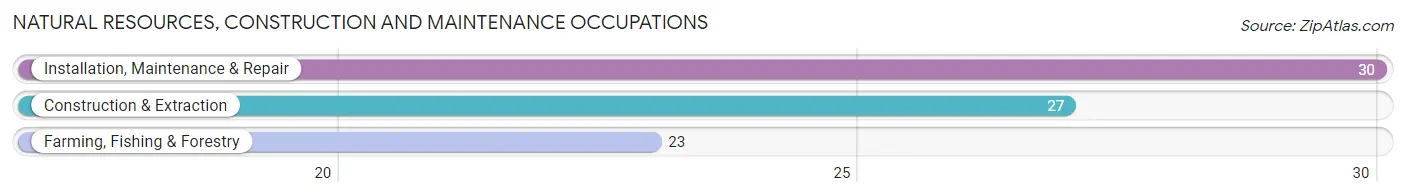
Natural Resources, Construction and Maintenance Occupations
The most common Natural Resources, Construction and Maintenance occupations in Okemah are Installation, Maintenance & Repair (30 | 2.8%), Construction & Extraction (27 | 2.5%), and Farming, Fishing & Forestry (23 | 2.2%).
Natural Resources, Construction and Maintenance Occupations by Sex
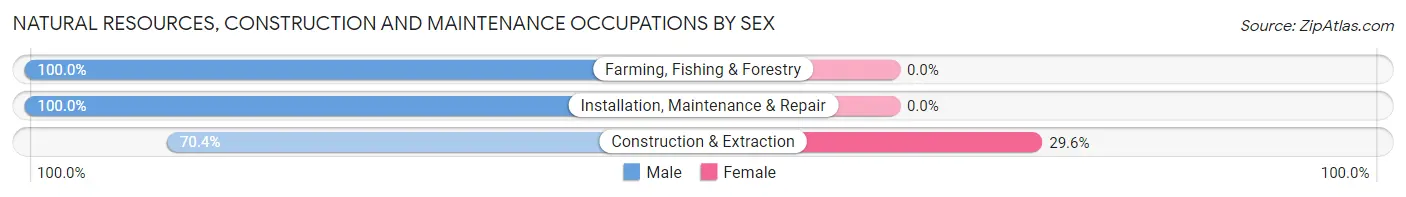
| Occupation | Male | Female |
| Farming, Fishing & Forestry | 23 (100.0%) | 0 (0.0%) |
| Construction & Extraction | 19 (70.4%) | 8 (29.6%) |
| Installation, Maintenance & Repair | 30 (100.0%) | 0 (0.0%) |
| Total (Category) | 72 (90.0%) | 8 (10.0%) |
| Total (Overall) | 492 (46.6%) | 565 (53.4%) |
Production, Transportation and Moving Occupations
The most common Production, Transportation and Moving occupations in Okemah are Production (84 | 8.0%), Material Moving (61 | 5.8%), and Transportation (28 | 2.6%).
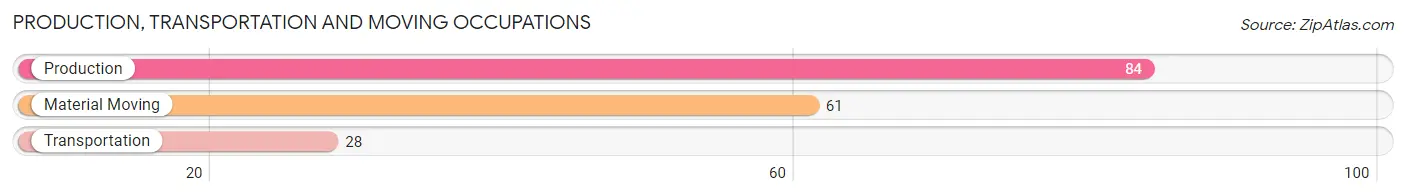
Production, Transportation and Moving Occupations by Sex
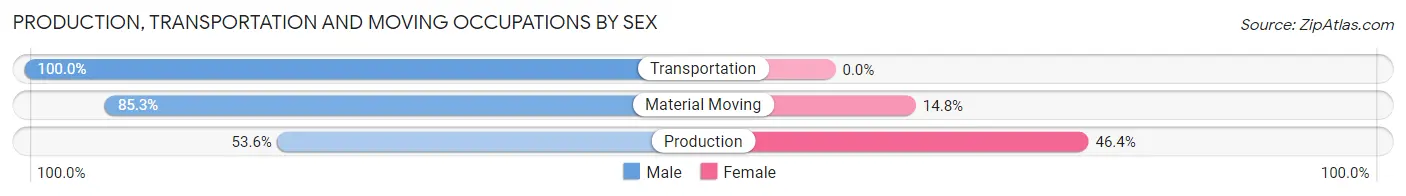
| Occupation | Male | Female |
| Production | 45 (53.6%) | 39 (46.4%) |
| Transportation | 28 (100.0%) | 0 (0.0%) |
| Material Moving | 52 (85.3%) | 9 (14.7%) |
| Total (Category) | 125 (72.3%) | 48 (27.8%) |
| Total (Overall) | 492 (46.6%) | 565 (53.4%) |
Employment Industries by Sex in Okemah
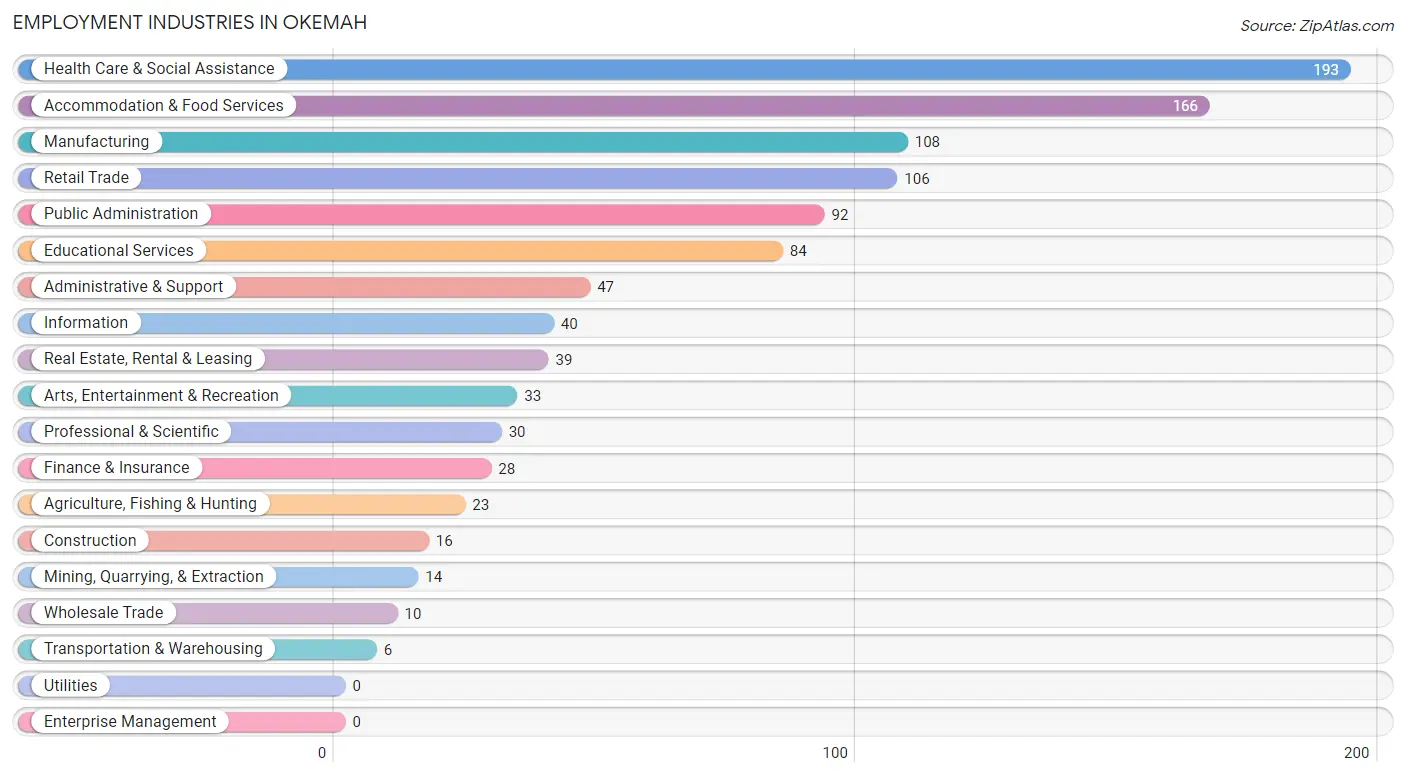
Employment Industries in Okemah
The major employment industries in Okemah include Health Care & Social Assistance (193 | 18.3%), Accommodation & Food Services (166 | 15.7%), Manufacturing (108 | 10.2%), Retail Trade (106 | 10.0%), and Public Administration (92 | 8.7%).
Employment Industries by Sex in Okemah
The Okemah industries that see more men than women are Agriculture, Fishing & Hunting (100.0%), Mining, Quarrying, & Extraction (100.0%), and Construction (100.0%), whereas the industries that tend to have a higher number of women are Finance & Insurance (100.0%), Health Care & Social Assistance (79.8%), and Arts, Entertainment & Recreation (66.7%).
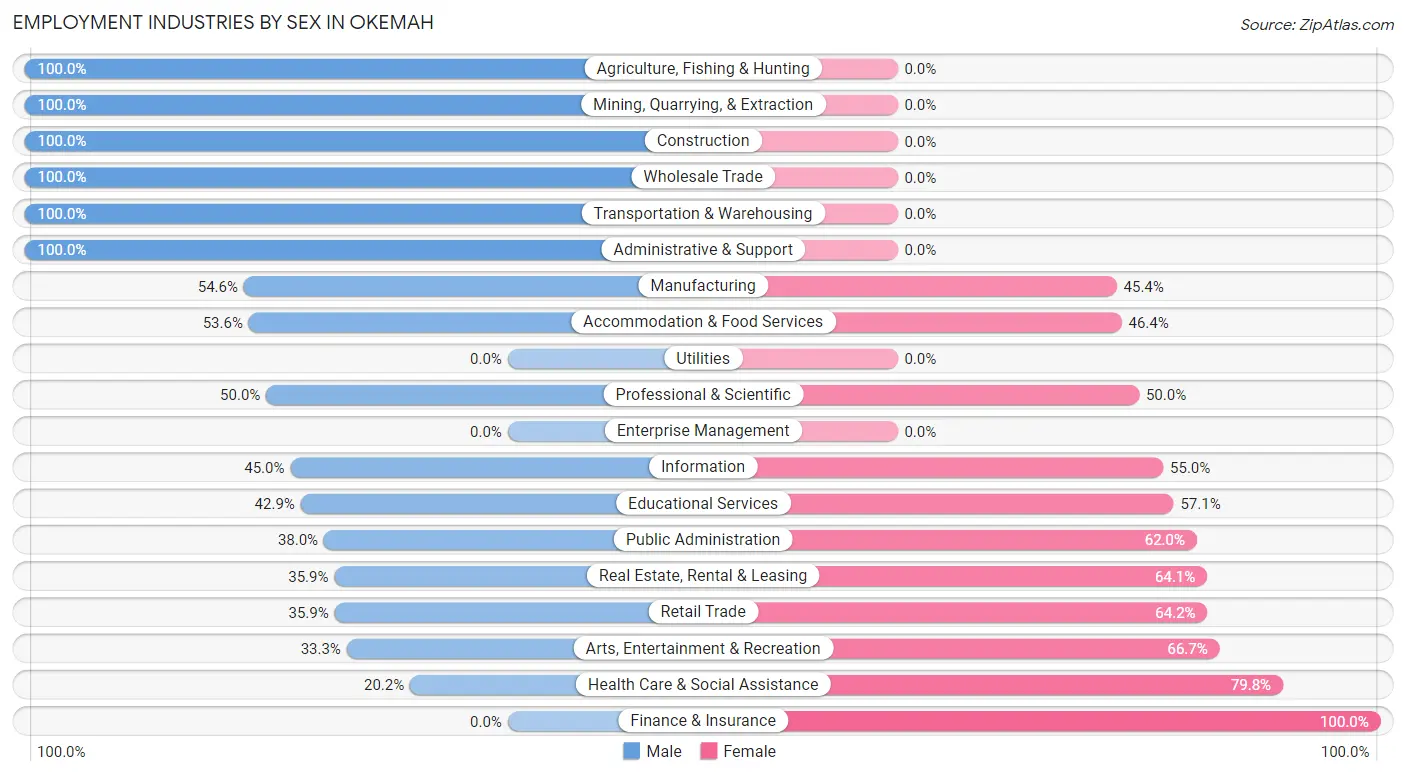
| Industry | Male | Female |
| Agriculture, Fishing & Hunting | 23 (100.0%) | 0 (0.0%) |
| Mining, Quarrying, & Extraction | 14 (100.0%) | 0 (0.0%) |
| Construction | 16 (100.0%) | 0 (0.0%) |
| Manufacturing | 59 (54.6%) | 49 (45.4%) |
| Wholesale Trade | 10 (100.0%) | 0 (0.0%) |
| Retail Trade | 38 (35.8%) | 68 (64.1%) |
| Transportation & Warehousing | 6 (100.0%) | 0 (0.0%) |
| Utilities | 0 (0.0%) | 0 (0.0%) |
| Information | 18 (45.0%) | 22 (55.0%) |
| Finance & Insurance | 0 (0.0%) | 28 (100.0%) |
| Real Estate, Rental & Leasing | 14 (35.9%) | 25 (64.1%) |
| Professional & Scientific | 15 (50.0%) | 15 (50.0%) |
| Enterprise Management | 0 (0.0%) | 0 (0.0%) |
| Administrative & Support | 47 (100.0%) | 0 (0.0%) |
| Educational Services | 36 (42.9%) | 48 (57.1%) |
| Health Care & Social Assistance | 39 (20.2%) | 154 (79.8%) |
| Arts, Entertainment & Recreation | 11 (33.3%) | 22 (66.7%) |
| Accommodation & Food Services | 89 (53.6%) | 77 (46.4%) |
| Public Administration | 35 (38.0%) | 57 (62.0%) |
| Total | 492 (46.6%) | 565 (53.4%) |
Education in Okemah
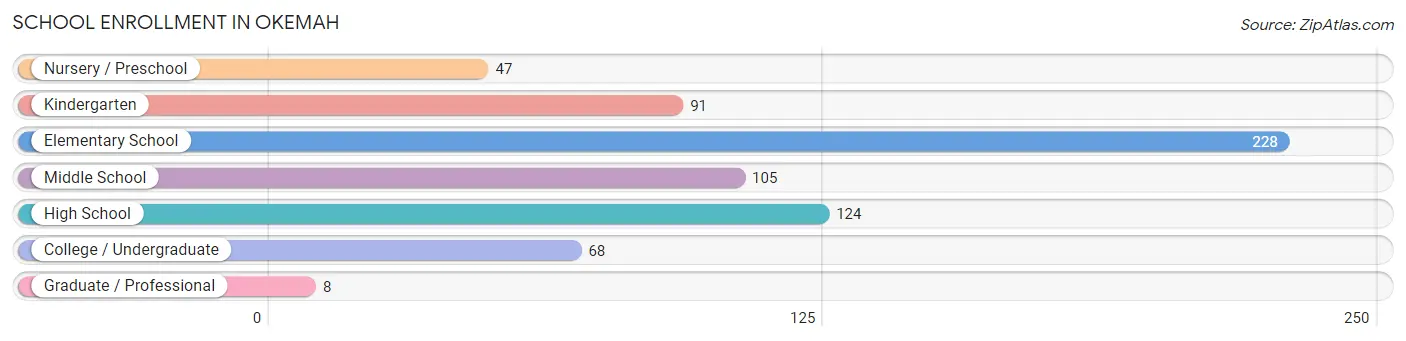
School Enrollment in Okemah
The most common levels of schooling among the 671 students in Okemah are elementary school (228 | 34.0%), high school (124 | 18.5%), and middle school (105 | 15.7%).
| School Level | # Students | % Students |
| Nursery / Preschool | 47 | 7.0% |
| Kindergarten | 91 | 13.6% |
| Elementary School | 228 | 34.0% |
| Middle School | 105 | 15.7% |
| High School | 124 | 18.5% |
| College / Undergraduate | 68 | 10.1% |
| Graduate / Professional | 8 | 1.2% |
| Total | 671 | 100.0% |
School Enrollment by Age by Funding Source in Okemah
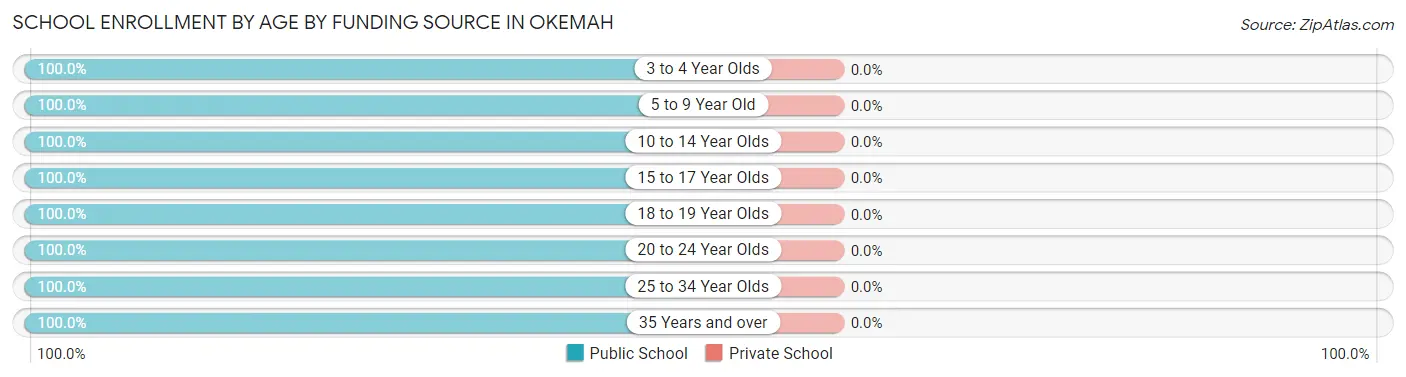
| Age Bracket | Public School | Private School |
| 3 to 4 Year Olds | 28 (100.0%) | 0 (0.0%) |
| 5 to 9 Year Old | 303 (100.0%) | 0 (0.0%) |
| 10 to 14 Year Olds | 140 (100.0%) | 0 (0.0%) |
| 15 to 17 Year Olds | 110 (100.0%) | 0 (0.0%) |
| 18 to 19 Year Olds | 14 (100.0%) | 0 (0.0%) |
| 20 to 24 Year Olds | 43 (100.0%) | 0 (0.0%) |
| 25 to 34 Year Olds | 26 (100.0%) | 0 (0.0%) |
| 35 Years and over | 7 (100.0%) | 0 (0.0%) |
| Total | 671 (100.0%) | 0 (0.0%) |
Educational Attainment by Field of Study in Okemah
Computers & mathematics (29 | 15.9%), communications (29 | 15.9%), education (27 | 14.7%), multidisciplinary studies (17 | 9.3%), and social sciences (15 | 8.2%) are the most common fields of study among 183 individuals in Okemah who have obtained a bachelor's degree or higher.
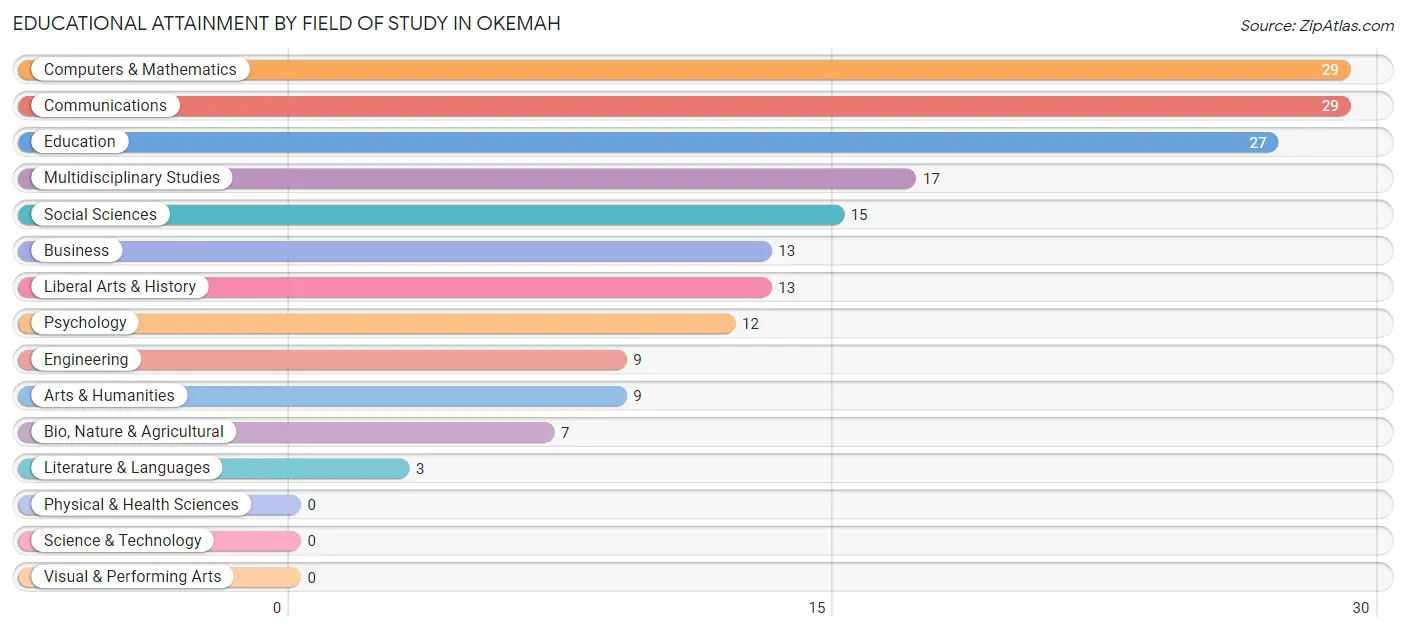
| Field of Study | # Graduates | % Graduates |
| Computers & Mathematics | 29 | 15.9% |
| Bio, Nature & Agricultural | 7 | 3.8% |
| Physical & Health Sciences | 0 | 0.0% |
| Psychology | 12 | 6.6% |
| Social Sciences | 15 | 8.2% |
| Engineering | 9 | 4.9% |
| Multidisciplinary Studies | 17 | 9.3% |
| Science & Technology | 0 | 0.0% |
| Business | 13 | 7.1% |
| Education | 27 | 14.7% |
| Literature & Languages | 3 | 1.6% |
| Liberal Arts & History | 13 | 7.1% |
| Visual & Performing Arts | 0 | 0.0% |
| Communications | 29 | 15.9% |
| Arts & Humanities | 9 | 4.9% |
| Total | 183 | 100.0% |
Transportation & Commute in Okemah
Vehicle Availability by Sex in Okemah
The most prevalent vehicle ownership categories in Okemah are males with 2 vehicles (177, accounting for 37.7%) and females with 2 vehicles (221, making up 33.7%).
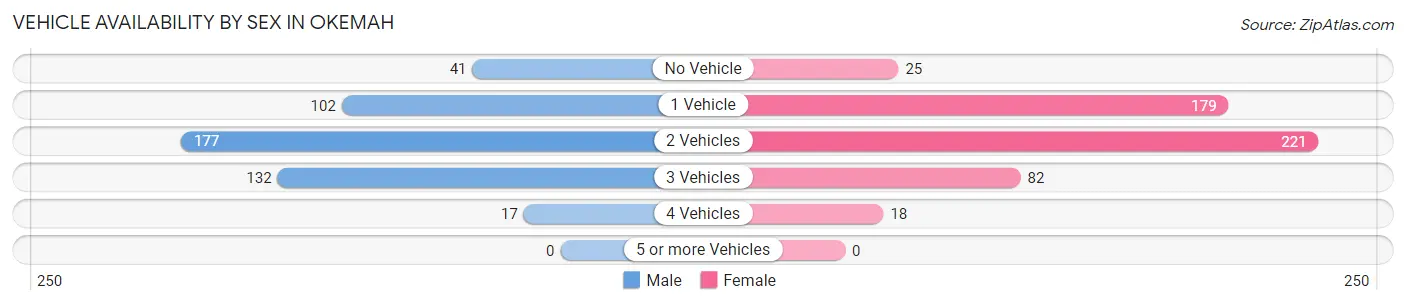
| Vehicles Available | Male | Female |
| No Vehicle | 41 (8.7%) | 25 (4.8%) |
| 1 Vehicle | 102 (21.7%) | 179 (34.1%) |
| 2 Vehicles | 177 (37.7%) | 221 (42.1%) |
| 3 Vehicles | 132 (28.1%) | 82 (15.6%) |
| 4 Vehicles | 17 (3.6%) | 18 (3.4%) |
| 5 or more Vehicles | 0 (0.0%) | 0 (0.0%) |
| Total | 469 (100.0%) | 525 (100.0%) |
Commute Time in Okemah
The most frequently occuring commute durations in Okemah are 5 to 9 minutes (273 commuters, 28.4%), less than 5 minutes (113 commuters, 11.8%), and 15 to 19 minutes (108 commuters, 11.2%).
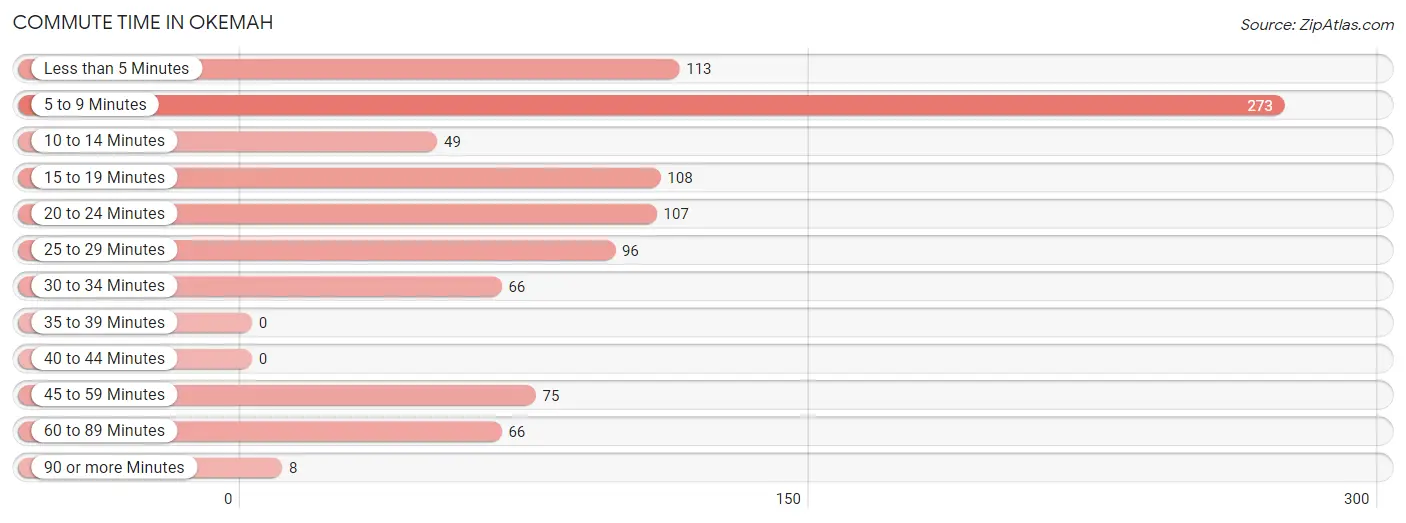
| Commute Time | # Commuters | % Commuters |
| Less than 5 Minutes | 113 | 11.8% |
| 5 to 9 Minutes | 273 | 28.4% |
| 10 to 14 Minutes | 49 | 5.1% |
| 15 to 19 Minutes | 108 | 11.2% |
| 20 to 24 Minutes | 107 | 11.1% |
| 25 to 29 Minutes | 96 | 10.0% |
| 30 to 34 Minutes | 66 | 6.9% |
| 35 to 39 Minutes | 0 | 0.0% |
| 40 to 44 Minutes | 0 | 0.0% |
| 45 to 59 Minutes | 75 | 7.8% |
| 60 to 89 Minutes | 66 | 6.9% |
| 90 or more Minutes | 8 | 0.8% |
Commute Time by Sex in Okemah
The most common commute times in Okemah are 5 to 9 minutes (137 commuters, 30.4%) for males and 5 to 9 minutes (136 commuters, 26.7%) for females.
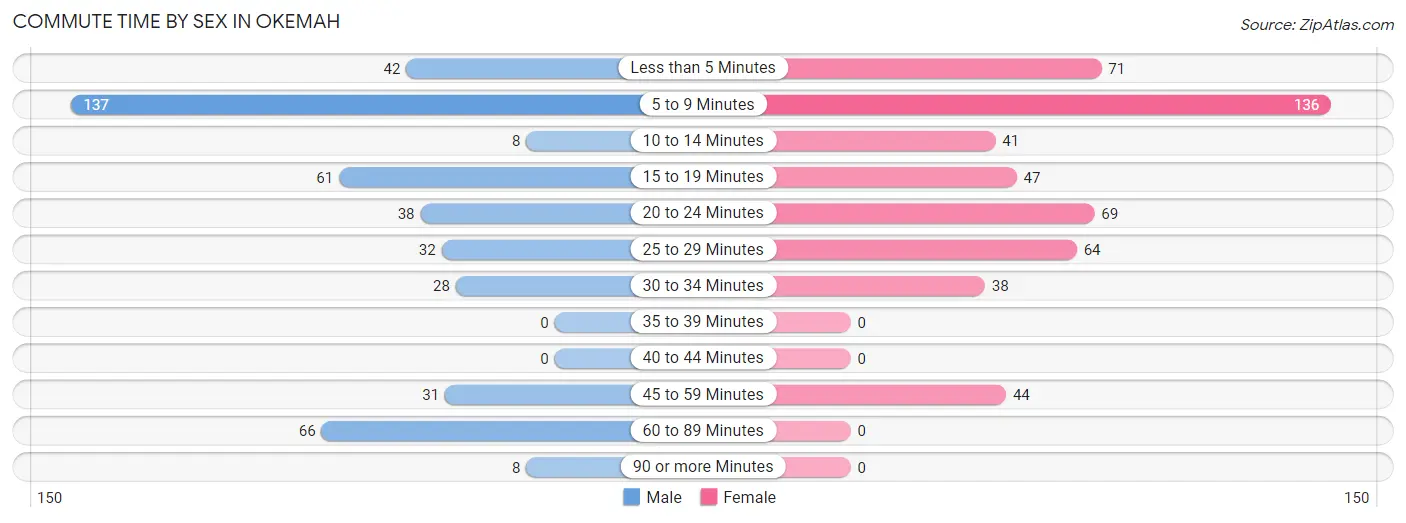
| Commute Time | Male | Female |
| Less than 5 Minutes | 42 (9.3%) | 71 (13.9%) |
| 5 to 9 Minutes | 137 (30.4%) | 136 (26.7%) |
| 10 to 14 Minutes | 8 (1.8%) | 41 (8.0%) |
| 15 to 19 Minutes | 61 (13.5%) | 47 (9.2%) |
| 20 to 24 Minutes | 38 (8.4%) | 69 (13.5%) |
| 25 to 29 Minutes | 32 (7.1%) | 64 (12.6%) |
| 30 to 34 Minutes | 28 (6.2%) | 38 (7.4%) |
| 35 to 39 Minutes | 0 (0.0%) | 0 (0.0%) |
| 40 to 44 Minutes | 0 (0.0%) | 0 (0.0%) |
| 45 to 59 Minutes | 31 (6.9%) | 44 (8.6%) |
| 60 to 89 Minutes | 66 (14.6%) | 0 (0.0%) |
| 90 or more Minutes | 8 (1.8%) | 0 (0.0%) |
Time of Departure to Work by Sex in Okemah
The most frequent times of departure to work in Okemah are 9:00 AM to 9:59 AM (70, 15.5%) for males and 7:00 AM to 7:29 AM (101, 19.8%) for females.
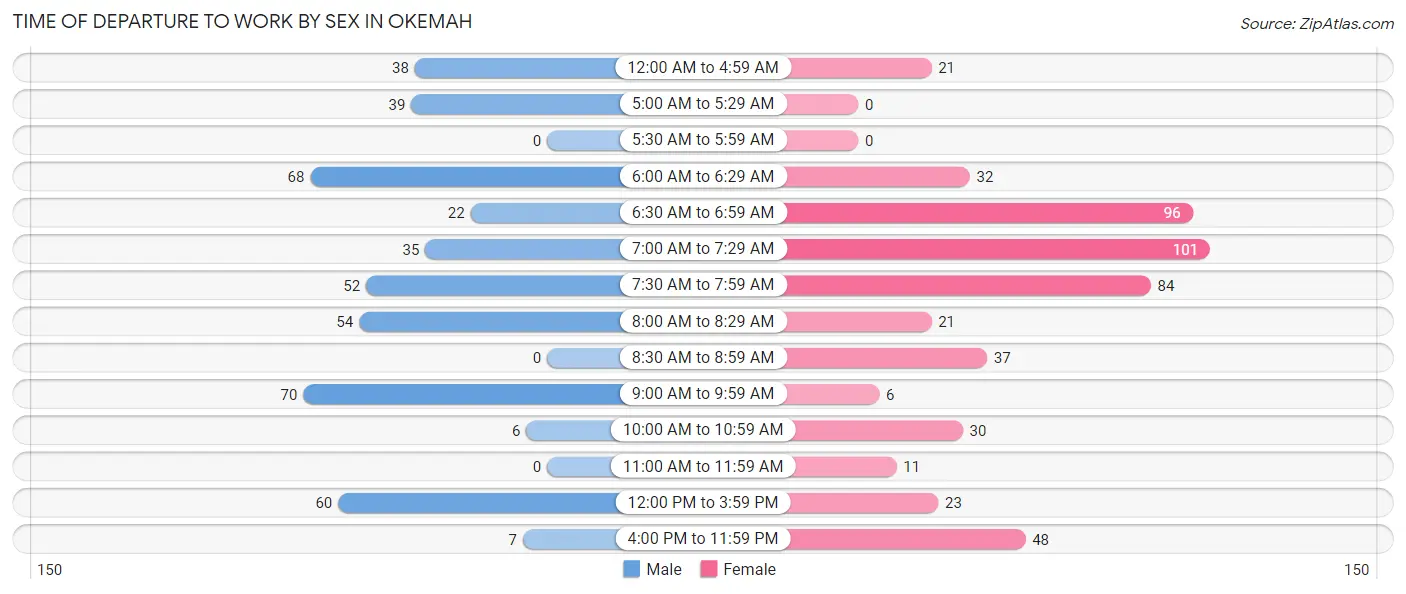
| Time of Departure | Male | Female |
| 12:00 AM to 4:59 AM | 38 (8.4%) | 21 (4.1%) |
| 5:00 AM to 5:29 AM | 39 (8.6%) | 0 (0.0%) |
| 5:30 AM to 5:59 AM | 0 (0.0%) | 0 (0.0%) |
| 6:00 AM to 6:29 AM | 68 (15.1%) | 32 (6.3%) |
| 6:30 AM to 6:59 AM | 22 (4.9%) | 96 (18.8%) |
| 7:00 AM to 7:29 AM | 35 (7.8%) | 101 (19.8%) |
| 7:30 AM to 7:59 AM | 52 (11.5%) | 84 (16.5%) |
| 8:00 AM to 8:29 AM | 54 (12.0%) | 21 (4.1%) |
| 8:30 AM to 8:59 AM | 0 (0.0%) | 37 (7.2%) |
| 9:00 AM to 9:59 AM | 70 (15.5%) | 6 (1.2%) |
| 10:00 AM to 10:59 AM | 6 (1.3%) | 30 (5.9%) |
| 11:00 AM to 11:59 AM | 0 (0.0%) | 11 (2.2%) |
| 12:00 PM to 3:59 PM | 60 (13.3%) | 23 (4.5%) |
| 4:00 PM to 11:59 PM | 7 (1.5%) | 48 (9.4%) |
| Total | 451 (100.0%) | 510 (100.0%) |
Housing Occupancy in Okemah
Occupancy by Ownership in Okemah
Of the total 1,151 dwellings in Okemah, owner-occupied units account for 507 (44.1%), while renter-occupied units make up 644 (55.9%).
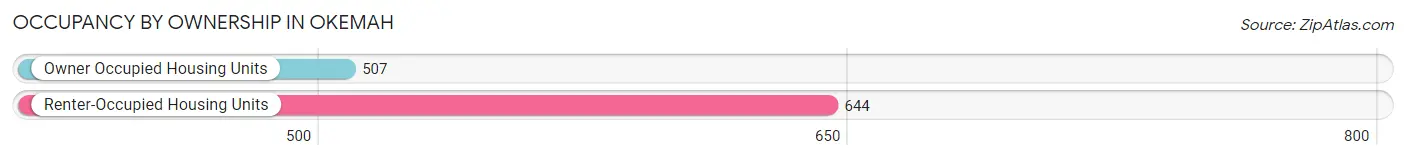
| Occupancy | # Housing Units | % Housing Units |
| Owner Occupied Housing Units | 507 | 44.1% |
| Renter-Occupied Housing Units | 644 | 55.9% |
| Total Occupied Housing Units | 1,151 | 100.0% |
Occupancy by Household Size in Okemah
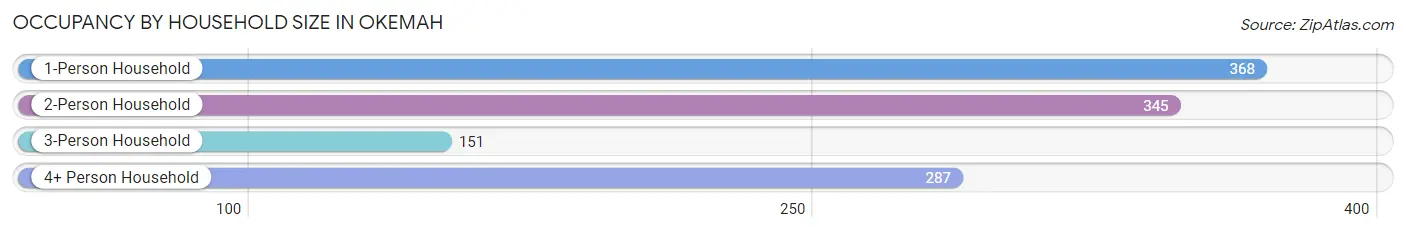
| Household Size | # Housing Units | % Housing Units |
| 1-Person Household | 368 | 32.0% |
| 2-Person Household | 345 | 30.0% |
| 3-Person Household | 151 | 13.1% |
| 4+ Person Household | 287 | 24.9% |
| Total Housing Units | 1,151 | 100.0% |
Occupancy by Ownership by Household Size in Okemah
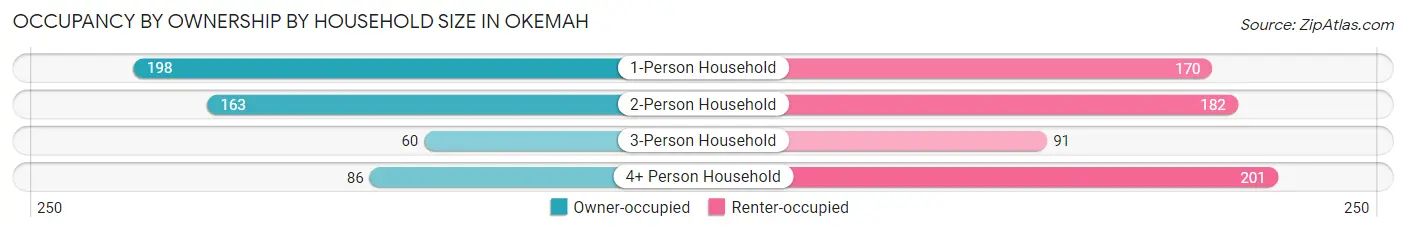
| Household Size | Owner-occupied | Renter-occupied |
| 1-Person Household | 198 (53.8%) | 170 (46.2%) |
| 2-Person Household | 163 (47.2%) | 182 (52.7%) |
| 3-Person Household | 60 (39.7%) | 91 (60.3%) |
| 4+ Person Household | 86 (30.0%) | 201 (70.0%) |
| Total Housing Units | 507 (44.1%) | 644 (55.9%) |
Occupancy by Educational Attainment in Okemah
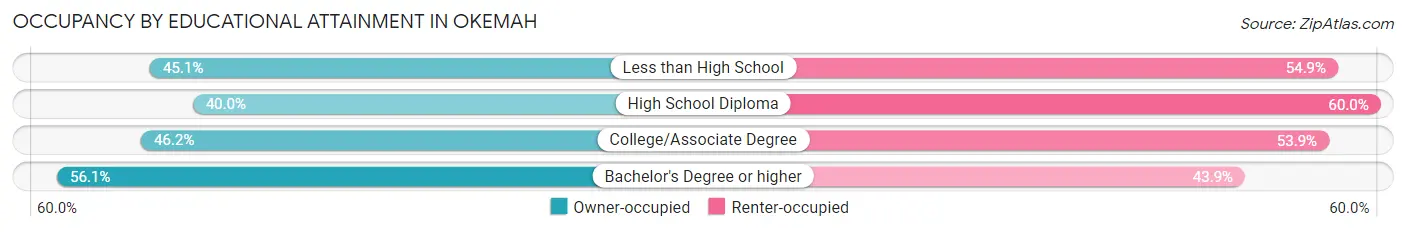
| Household Size | Owner-occupied | Renter-occupied |
| Less than High School | 87 (45.1%) | 106 (54.9%) |
| High School Diploma | 218 (40.0%) | 327 (60.0%) |
| College/Associate Degree | 138 (46.2%) | 161 (53.8%) |
| Bachelor's Degree or higher | 64 (56.1%) | 50 (43.9%) |
Occupancy by Age of Householder in Okemah
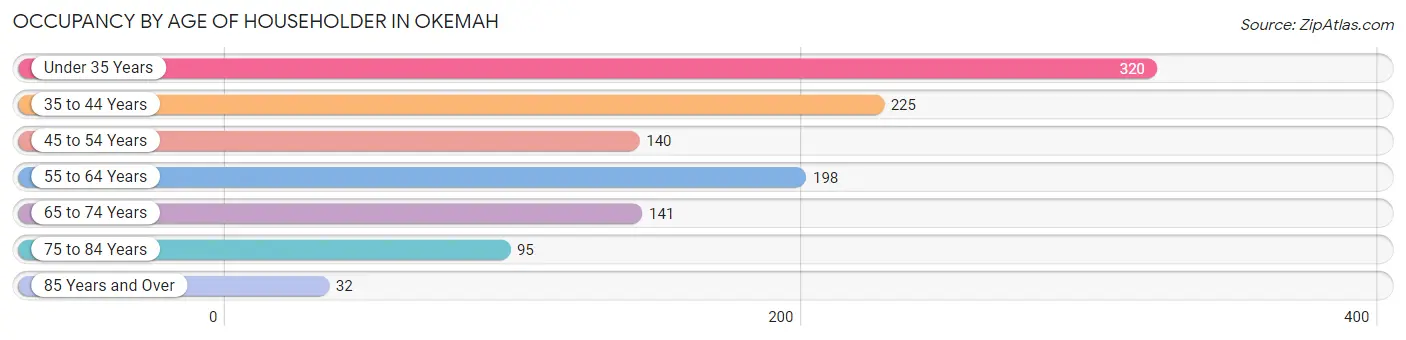
| Age Bracket | # Households | % Households |
| Under 35 Years | 320 | 27.8% |
| 35 to 44 Years | 225 | 19.6% |
| 45 to 54 Years | 140 | 12.2% |
| 55 to 64 Years | 198 | 17.2% |
| 65 to 74 Years | 141 | 12.2% |
| 75 to 84 Years | 95 | 8.3% |
| 85 Years and Over | 32 | 2.8% |
| Total | 1,151 | 100.0% |
Housing Finances in Okemah
Median Income by Occupancy in Okemah
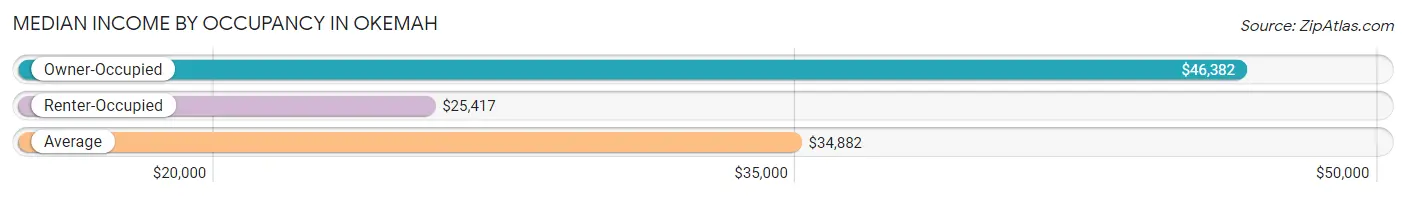
| Occupancy Type | # Households | Median Income |
| Owner-Occupied | 507 (44.1%) | $46,382 |
| Renter-Occupied | 644 (55.9%) | $25,417 |
| Average | 1,151 (100.0%) | $34,882 |
Occupancy by Householder Income Bracket in Okemah
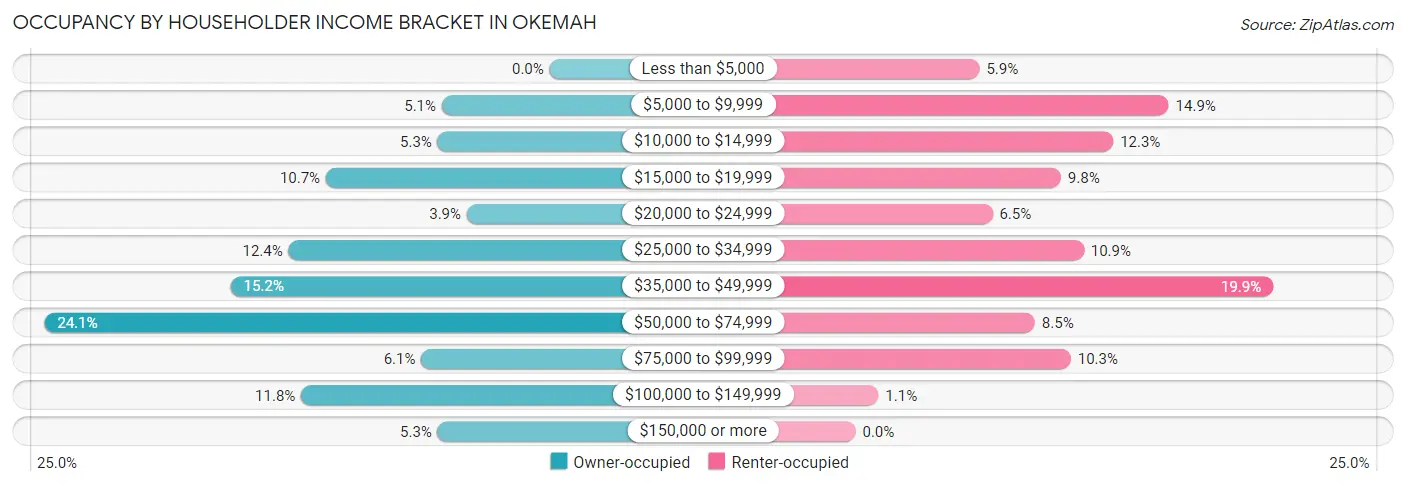
| Income Bracket | Owner-occupied | Renter-occupied |
| Less than $5,000 | 0 (0.0%) | 38 (5.9%) |
| $5,000 to $9,999 | 26 (5.1%) | 96 (14.9%) |
| $10,000 to $14,999 | 27 (5.3%) | 79 (12.3%) |
| $15,000 to $19,999 | 54 (10.6%) | 63 (9.8%) |
| $20,000 to $24,999 | 20 (3.9%) | 42 (6.5%) |
| $25,000 to $34,999 | 63 (12.4%) | 70 (10.9%) |
| $35,000 to $49,999 | 77 (15.2%) | 128 (19.9%) |
| $50,000 to $74,999 | 122 (24.1%) | 55 (8.5%) |
| $75,000 to $99,999 | 31 (6.1%) | 66 (10.2%) |
| $100,000 to $149,999 | 60 (11.8%) | 7 (1.1%) |
| $150,000 or more | 27 (5.3%) | 0 (0.0%) |
| Total | 507 (100.0%) | 644 (100.0%) |
Monthly Housing Cost Tiers in Okemah
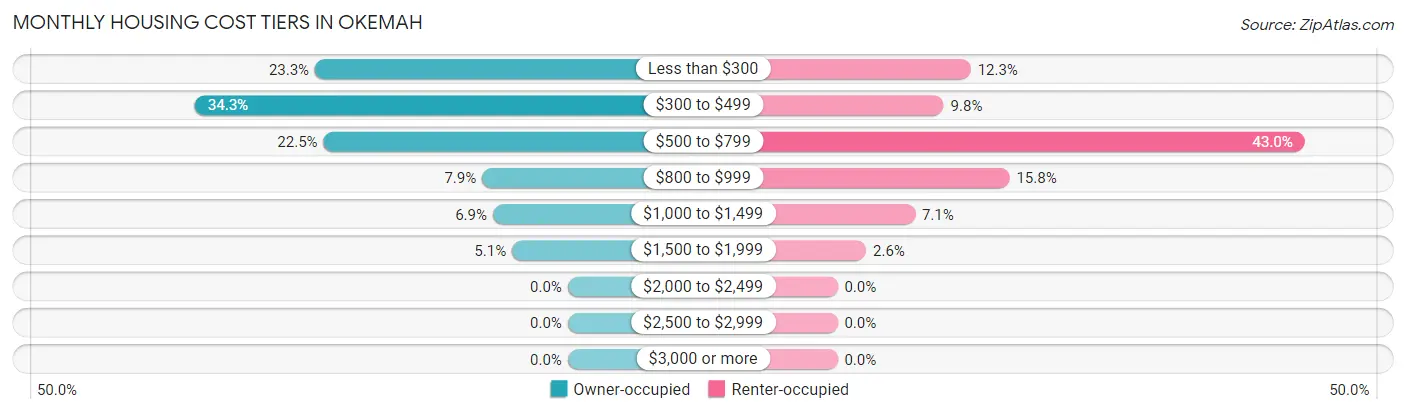
| Monthly Cost | Owner-occupied | Renter-occupied |
| Less than $300 | 118 (23.3%) | 79 (12.3%) |
| $300 to $499 | 174 (34.3%) | 63 (9.8%) |
| $500 to $799 | 114 (22.5%) | 277 (43.0%) |
| $800 to $999 | 40 (7.9%) | 102 (15.8%) |
| $1,000 to $1,499 | 35 (6.9%) | 46 (7.1%) |
| $1,500 to $1,999 | 26 (5.1%) | 17 (2.6%) |
| $2,000 to $2,499 | 0 (0.0%) | 0 (0.0%) |
| $2,500 to $2,999 | 0 (0.0%) | 0 (0.0%) |
| $3,000 or more | 0 (0.0%) | 0 (0.0%) |
| Total | 507 (100.0%) | 644 (100.0%) |
Physical Housing Characteristics in Okemah
Housing Structures in Okemah
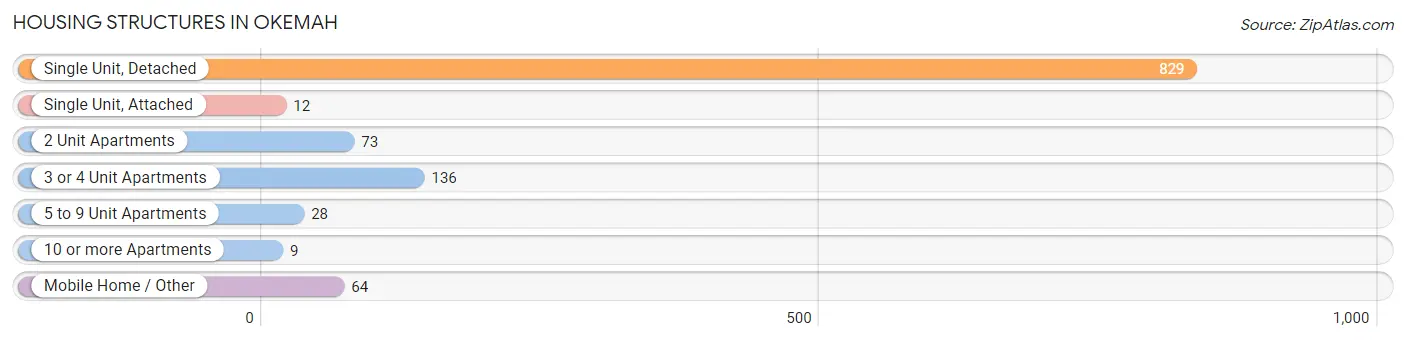
| Structure Type | # Housing Units | % Housing Units |
| Single Unit, Detached | 829 | 72.0% |
| Single Unit, Attached | 12 | 1.0% |
| 2 Unit Apartments | 73 | 6.3% |
| 3 or 4 Unit Apartments | 136 | 11.8% |
| 5 to 9 Unit Apartments | 28 | 2.4% |
| 10 or more Apartments | 9 | 0.8% |
| Mobile Home / Other | 64 | 5.6% |
| Total | 1,151 | 100.0% |
Housing Structures by Occupancy in Okemah
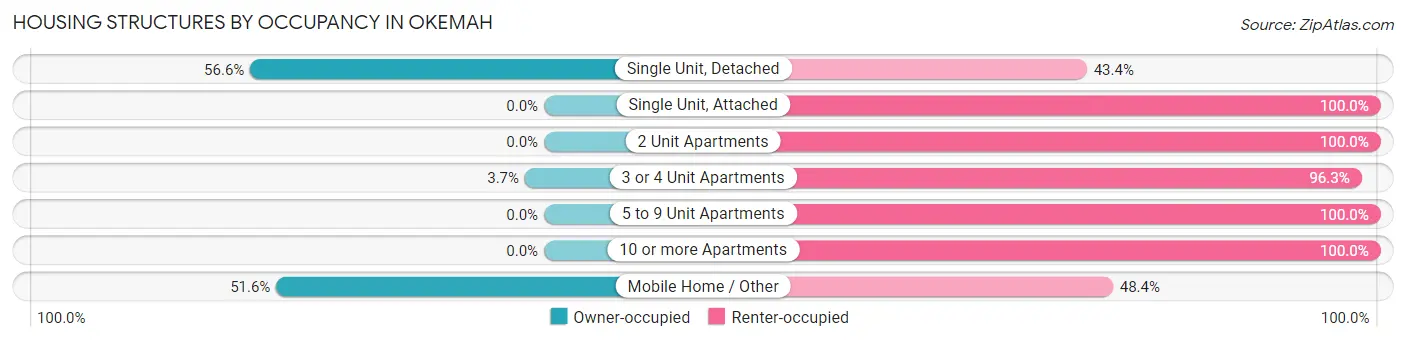
| Structure Type | Owner-occupied | Renter-occupied |
| Single Unit, Detached | 469 (56.6%) | 360 (43.4%) |
| Single Unit, Attached | 0 (0.0%) | 12 (100.0%) |
| 2 Unit Apartments | 0 (0.0%) | 73 (100.0%) |
| 3 or 4 Unit Apartments | 5 (3.7%) | 131 (96.3%) |
| 5 to 9 Unit Apartments | 0 (0.0%) | 28 (100.0%) |
| 10 or more Apartments | 0 (0.0%) | 9 (100.0%) |
| Mobile Home / Other | 33 (51.6%) | 31 (48.4%) |
| Total | 507 (44.1%) | 644 (55.9%) |
Housing Structures by Number of Rooms in Okemah
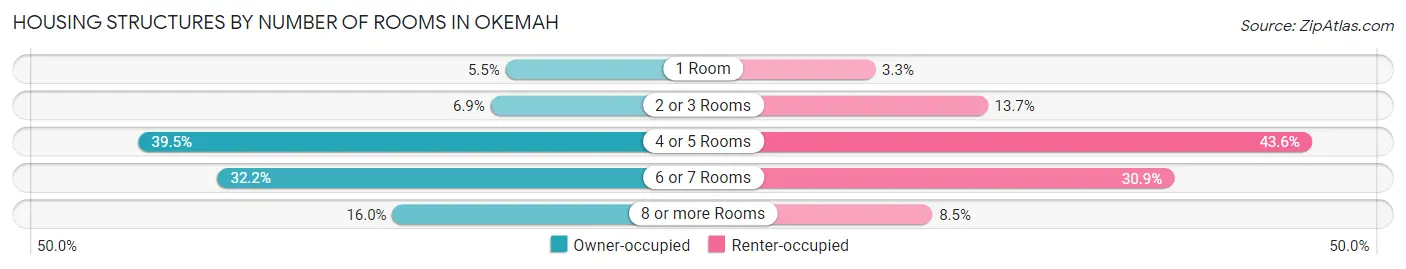
| Number of Rooms | Owner-occupied | Renter-occupied |
| 1 Room | 28 (5.5%) | 21 (3.3%) |
| 2 or 3 Rooms | 35 (6.9%) | 88 (13.7%) |
| 4 or 5 Rooms | 200 (39.5%) | 281 (43.6%) |
| 6 or 7 Rooms | 163 (32.2%) | 199 (30.9%) |
| 8 or more Rooms | 81 (16.0%) | 55 (8.5%) |
| Total | 507 (100.0%) | 644 (100.0%) |
Housing Structure by Heating Type in Okemah
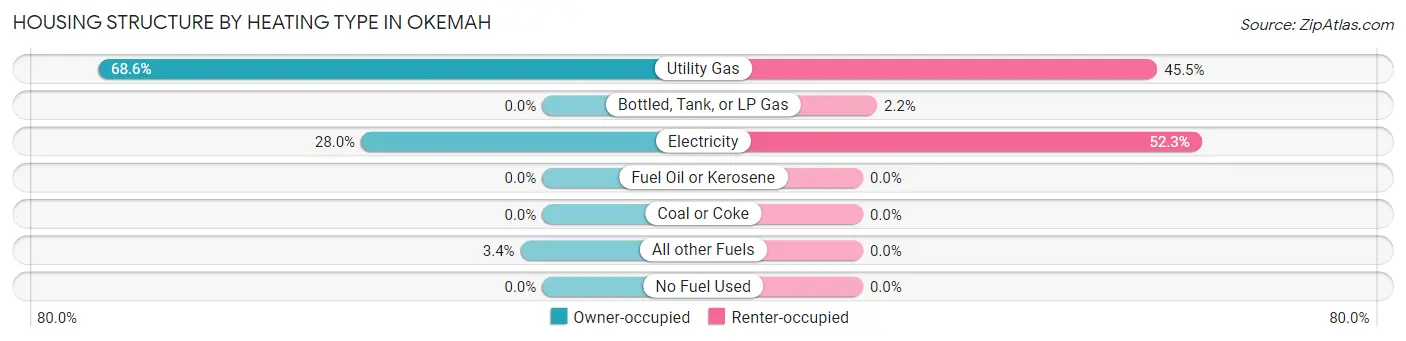
| Heating Type | Owner-occupied | Renter-occupied |
| Utility Gas | 348 (68.6%) | 293 (45.5%) |
| Bottled, Tank, or LP Gas | 0 (0.0%) | 14 (2.2%) |
| Electricity | 142 (28.0%) | 337 (52.3%) |
| Fuel Oil or Kerosene | 0 (0.0%) | 0 (0.0%) |
| Coal or Coke | 0 (0.0%) | 0 (0.0%) |
| All other Fuels | 17 (3.4%) | 0 (0.0%) |
| No Fuel Used | 0 (0.0%) | 0 (0.0%) |
| Total | 507 (100.0%) | 644 (100.0%) |
Household Vehicle Usage in Okemah
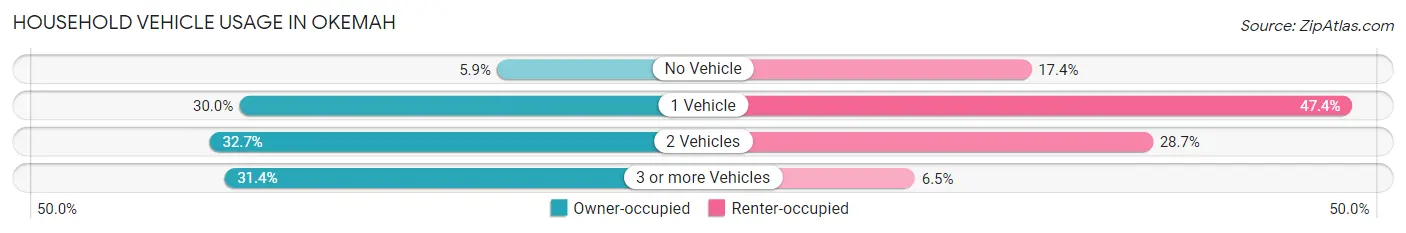
| Vehicles per Household | Owner-occupied | Renter-occupied |
| No Vehicle | 30 (5.9%) | 112 (17.4%) |
| 1 Vehicle | 152 (30.0%) | 305 (47.4%) |
| 2 Vehicles | 166 (32.7%) | 185 (28.7%) |
| 3 or more Vehicles | 159 (31.4%) | 42 (6.5%) |
| Total | 507 (100.0%) | 644 (100.0%) |
Real Estate & Mortgages in Okemah
Real Estate and Mortgage Overview in Okemah
| Characteristic | Without Mortgage | With Mortgage |
| Housing Units | 329 | 178 |
| Median Property Value | $59,400 | $64,100 |
| Median Household Income | $33,750 | $5 |
| Monthly Housing Costs | $346 | $0 |
| Real Estate Taxes | $330 | $11 |
Property Value by Mortgage Status in Okemah
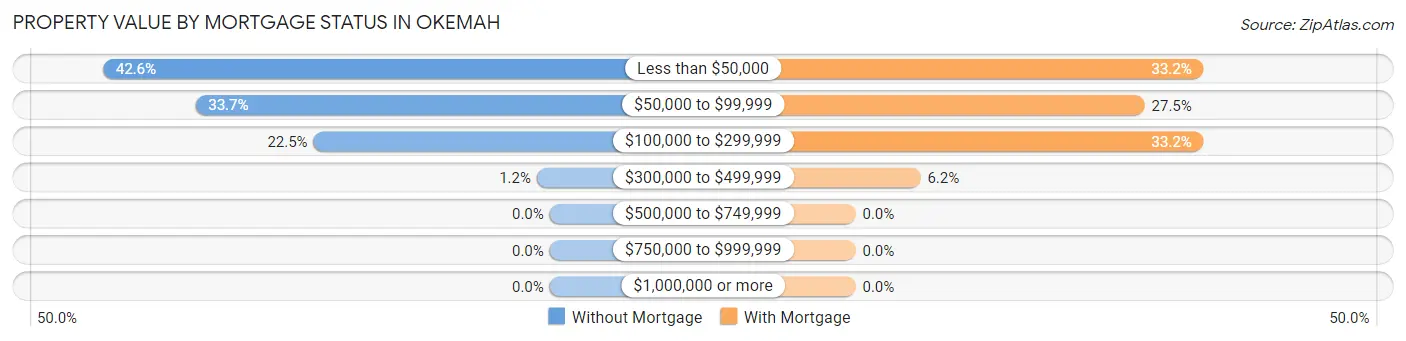
| Property Value | Without Mortgage | With Mortgage |
| Less than $50,000 | 140 (42.5%) | 59 (33.2%) |
| $50,000 to $99,999 | 111 (33.7%) | 49 (27.5%) |
| $100,000 to $299,999 | 74 (22.5%) | 59 (33.2%) |
| $300,000 to $499,999 | 4 (1.2%) | 11 (6.2%) |
| $500,000 to $749,999 | 0 (0.0%) | 0 (0.0%) |
| $750,000 to $999,999 | 0 (0.0%) | 0 (0.0%) |
| $1,000,000 or more | 0 (0.0%) | 0 (0.0%) |
| Total | 329 (100.0%) | 178 (100.0%) |
Household Income by Mortgage Status in Okemah
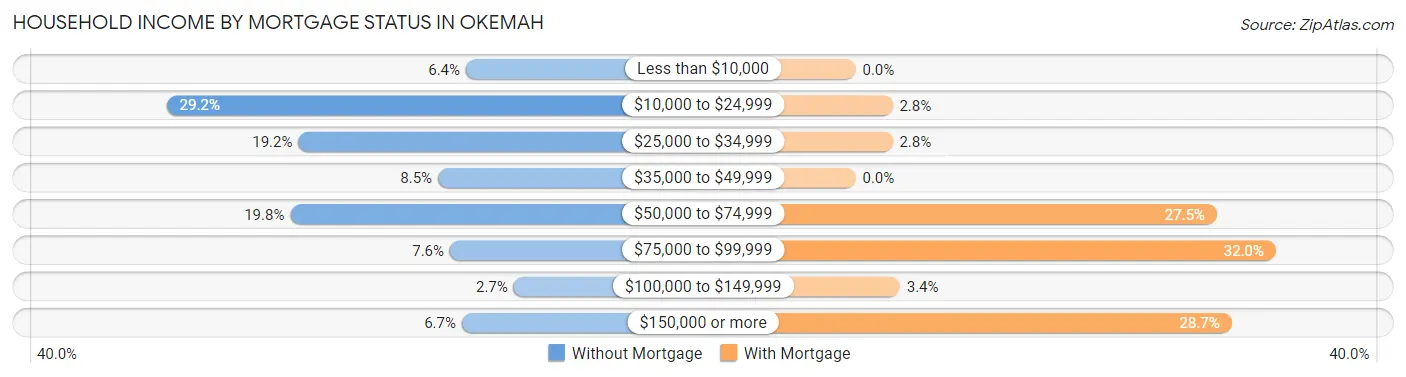
| Household Income | Without Mortgage | With Mortgage |
| Less than $10,000 | 21 (6.4%) | 0 (0.0%) |
| $10,000 to $24,999 | 96 (29.2%) | 5 (2.8%) |
| $25,000 to $34,999 | 63 (19.2%) | 5 (2.8%) |
| $35,000 to $49,999 | 28 (8.5%) | 0 (0.0%) |
| $50,000 to $74,999 | 65 (19.8%) | 49 (27.5%) |
| $75,000 to $99,999 | 25 (7.6%) | 57 (32.0%) |
| $100,000 to $149,999 | 9 (2.7%) | 6 (3.4%) |
| $150,000 or more | 22 (6.7%) | 51 (28.6%) |
| Total | 329 (100.0%) | 178 (100.0%) |
Property Value to Household Income Ratio in Okemah

| Value-to-Income Ratio | Without Mortgage | With Mortgage |
| Less than 2.0x | 214 (65.0%) | 66,250 (37,219.1%) |
| 2.0x to 2.9x | 22 (6.7%) | 145 (81.5%) |
| 3.0x to 3.9x | 23 (7.0%) | 0 (0.0%) |
| 4.0x or more | 70 (21.3%) | 0 (0.0%) |
| Total | 329 (100.0%) | 178 (100.0%) |
Real Estate Taxes by Mortgage Status in Okemah
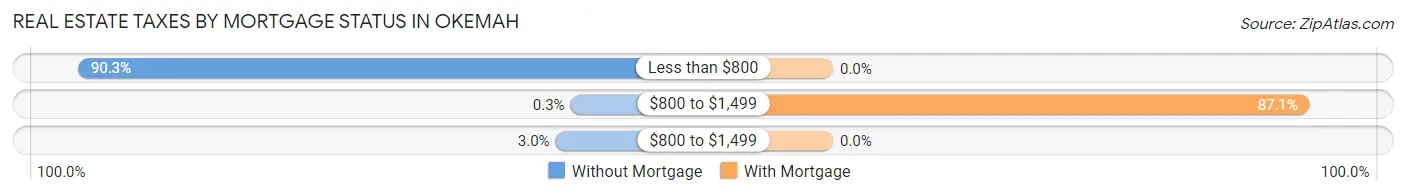
| Property Taxes | Without Mortgage | With Mortgage |
| Less than $800 | 297 (90.3%) | 0 (0.0%) |
| $800 to $1,499 | 1 (0.3%) | 155 (87.1%) |
| $800 to $1,499 | 10 (3.0%) | 0 (0.0%) |
| Total | 329 (100.0%) | 178 (100.0%) |
Health & Disability in Okemah
Health Insurance Coverage by Age in Okemah
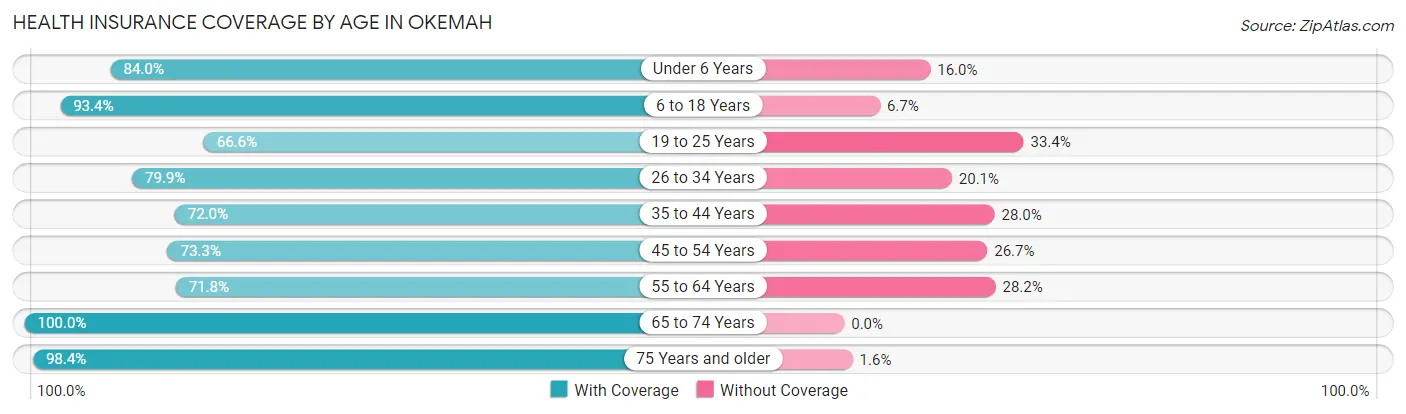
| Age Bracket | With Coverage | Without Coverage |
| Under 6 Years | 267 (84.0%) | 51 (16.0%) |
| 6 to 18 Years | 505 (93.3%) | 36 (6.7%) |
| 19 to 25 Years | 231 (66.6%) | 116 (33.4%) |
| 26 to 34 Years | 275 (79.9%) | 69 (20.1%) |
| 35 to 44 Years | 262 (72.0%) | 102 (28.0%) |
| 45 to 54 Years | 220 (73.3%) | 80 (26.7%) |
| 55 to 64 Years | 191 (71.8%) | 75 (28.2%) |
| 65 to 74 Years | 252 (100.0%) | 0 (0.0%) |
| 75 Years and older | 189 (98.4%) | 3 (1.6%) |
| Total | 2,392 (81.8%) | 532 (18.2%) |
Health Insurance Coverage by Citizenship Status in Okemah
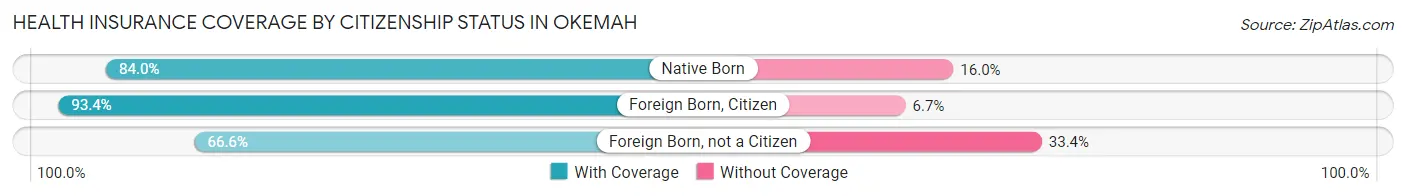
| Citizenship Status | With Coverage | Without Coverage |
| Native Born | 267 (84.0%) | 51 (16.0%) |
| Foreign Born, Citizen | 505 (93.3%) | 36 (6.7%) |
| Foreign Born, not a Citizen | 231 (66.6%) | 116 (33.4%) |
Health Insurance Coverage by Household Income in Okemah
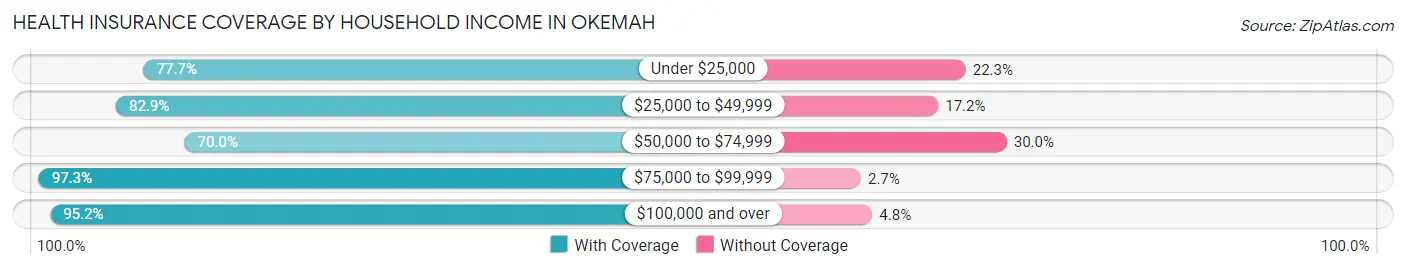
| Household Income | With Coverage | Without Coverage |
| Under $25,000 | 725 (77.7%) | 208 (22.3%) |
| $25,000 to $49,999 | 686 (82.9%) | 142 (17.2%) |
| $50,000 to $74,999 | 376 (70.0%) | 161 (30.0%) |
| $75,000 to $99,999 | 328 (97.3%) | 9 (2.7%) |
| $100,000 and over | 238 (95.2%) | 12 (4.8%) |
Public vs Private Health Insurance Coverage by Age in Okemah
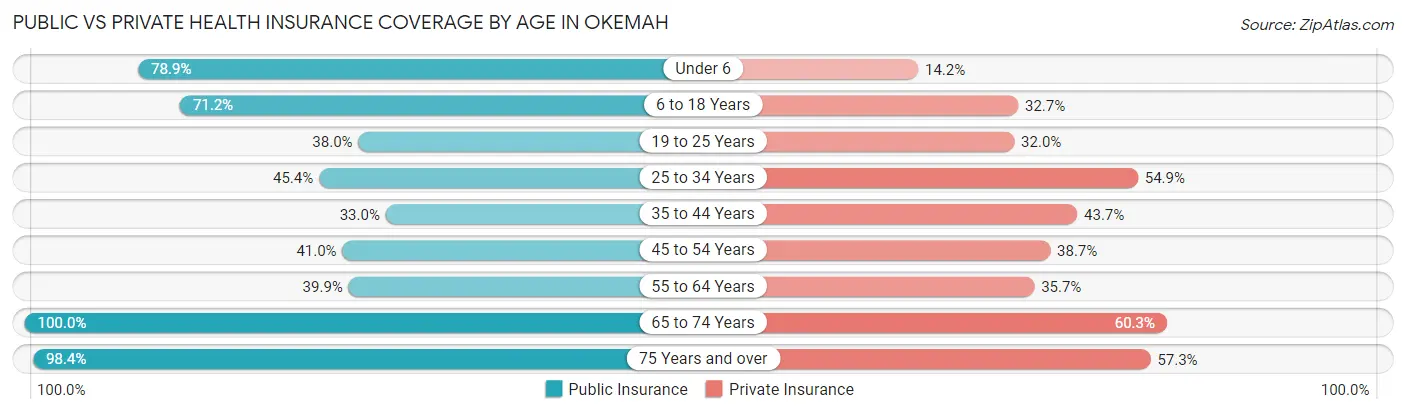
| Age Bracket | Public Insurance | Private Insurance |
| Under 6 | 251 (78.9%) | 45 (14.1%) |
| 6 to 18 Years | 385 (71.2%) | 177 (32.7%) |
| 19 to 25 Years | 132 (38.0%) | 111 (32.0%) |
| 25 to 34 Years | 156 (45.4%) | 189 (54.9%) |
| 35 to 44 Years | 120 (33.0%) | 159 (43.7%) |
| 45 to 54 Years | 123 (41.0%) | 116 (38.7%) |
| 55 to 64 Years | 106 (39.9%) | 95 (35.7%) |
| 65 to 74 Years | 252 (100.0%) | 152 (60.3%) |
| 75 Years and over | 189 (98.4%) | 110 (57.3%) |
| Total | 1,714 (58.6%) | 1,154 (39.5%) |
Disability Status by Sex by Age in Okemah
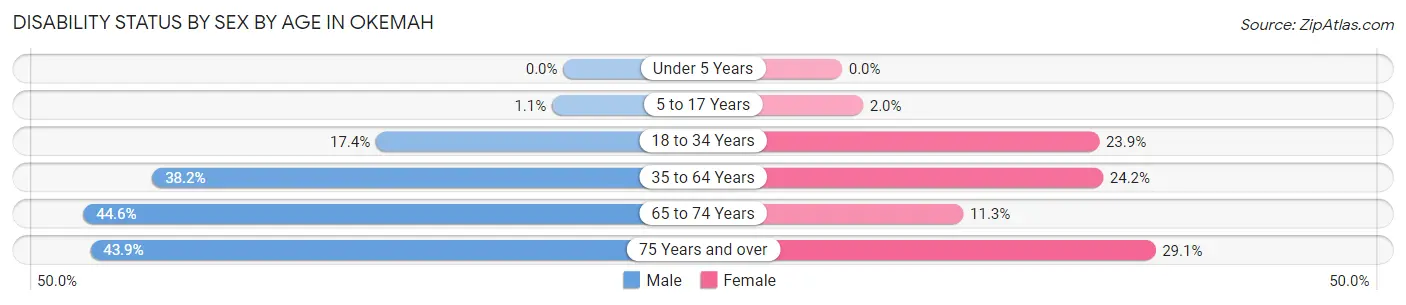
| Age Bracket | Male | Female |
| Under 5 Years | 0 (0.0%) | 0 (0.0%) |
| 5 to 17 Years | 3 (1.1%) | 6 (1.9%) |
| 18 to 34 Years | 65 (17.4%) | 79 (23.9%) |
| 35 to 64 Years | 169 (38.2%) | 118 (24.2%) |
| 65 to 74 Years | 45 (44.6%) | 17 (11.3%) |
| 75 Years and over | 36 (43.9%) | 32 (29.1%) |
Disability Class by Sex by Age in Okemah
Disability Class: Hearing Difficulty
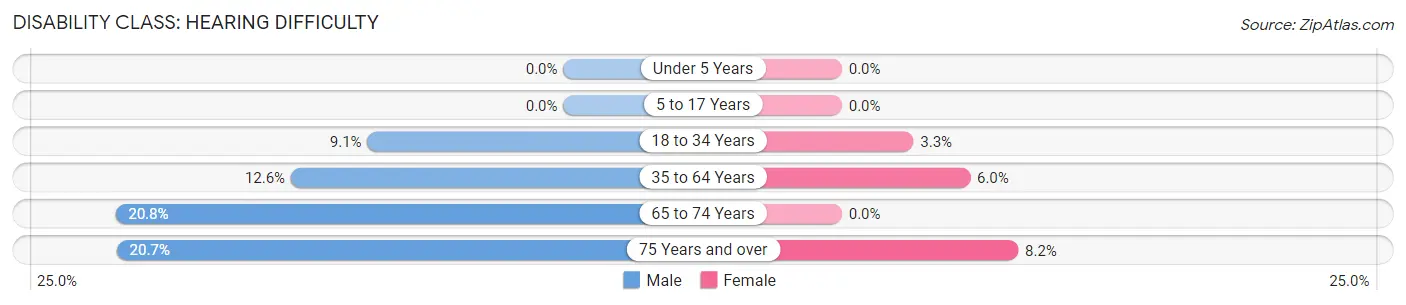
| Age Bracket | Male | Female |
| Under 5 Years | 0 (0.0%) | 0 (0.0%) |
| 5 to 17 Years | 0 (0.0%) | 0 (0.0%) |
| 18 to 34 Years | 34 (9.1%) | 11 (3.3%) |
| 35 to 64 Years | 56 (12.6%) | 29 (5.9%) |
| 65 to 74 Years | 21 (20.8%) | 0 (0.0%) |
| 75 Years and over | 17 (20.7%) | 9 (8.2%) |
Disability Class: Vision Difficulty
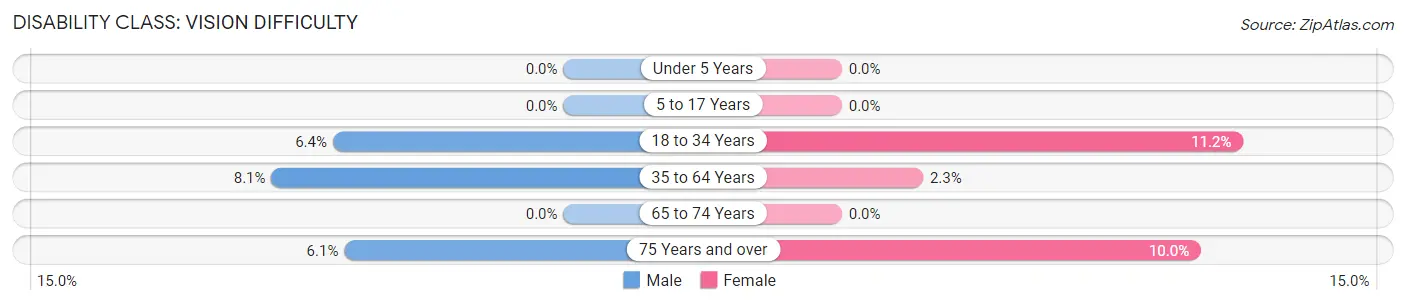
| Age Bracket | Male | Female |
| Under 5 Years | 0 (0.0%) | 0 (0.0%) |
| 5 to 17 Years | 0 (0.0%) | 0 (0.0%) |
| 18 to 34 Years | 24 (6.4%) | 37 (11.2%) |
| 35 to 64 Years | 36 (8.1%) | 11 (2.3%) |
| 65 to 74 Years | 0 (0.0%) | 0 (0.0%) |
| 75 Years and over | 5 (6.1%) | 11 (10.0%) |
Disability Class: Cognitive Difficulty
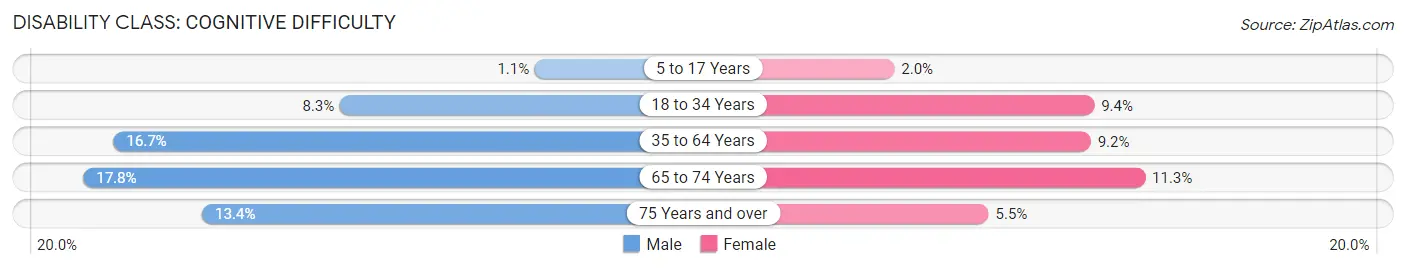
| Age Bracket | Male | Female |
| 5 to 17 Years | 3 (1.1%) | 6 (1.9%) |
| 18 to 34 Years | 31 (8.3%) | 31 (9.4%) |
| 35 to 64 Years | 74 (16.7%) | 45 (9.2%) |
| 65 to 74 Years | 18 (17.8%) | 17 (11.3%) |
| 75 Years and over | 11 (13.4%) | 6 (5.4%) |
Disability Class: Ambulatory Difficulty
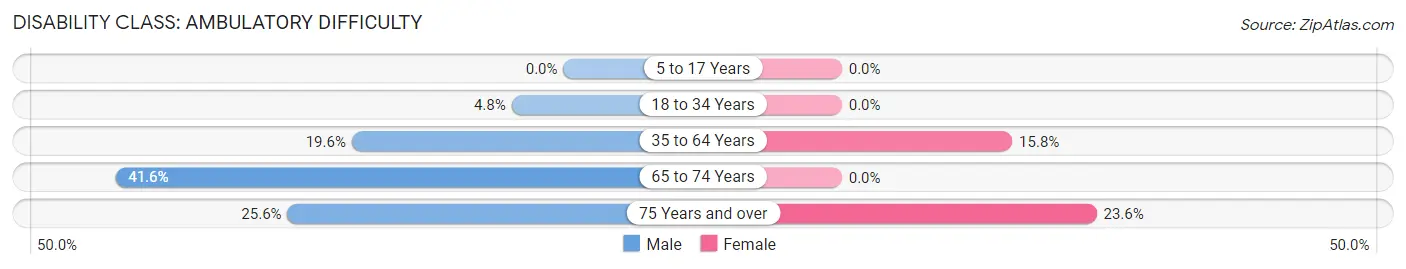
| Age Bracket | Male | Female |
| 5 to 17 Years | 0 (0.0%) | 0 (0.0%) |
| 18 to 34 Years | 18 (4.8%) | 0 (0.0%) |
| 35 to 64 Years | 87 (19.6%) | 77 (15.8%) |
| 65 to 74 Years | 42 (41.6%) | 0 (0.0%) |
| 75 Years and over | 21 (25.6%) | 26 (23.6%) |
Disability Class: Self-Care Difficulty
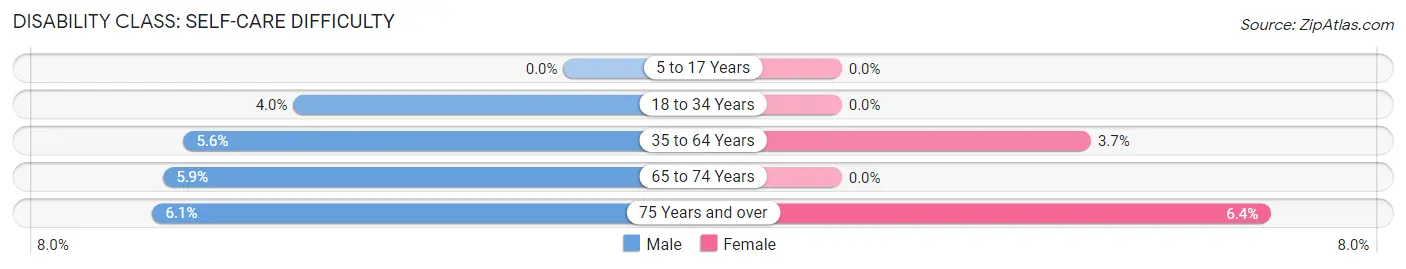
| Age Bracket | Male | Female |
| 5 to 17 Years | 0 (0.0%) | 0 (0.0%) |
| 18 to 34 Years | 15 (4.0%) | 0 (0.0%) |
| 35 to 64 Years | 25 (5.6%) | 18 (3.7%) |
| 65 to 74 Years | 6 (5.9%) | 0 (0.0%) |
| 75 Years and over | 5 (6.1%) | 7 (6.4%) |
Technology Access in Okemah
Computing Device Access in Okemah
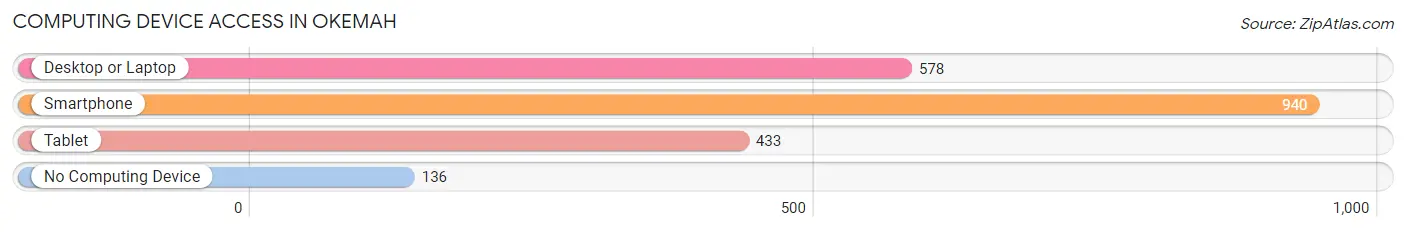
| Device Type | # Households | % Households |
| Desktop or Laptop | 578 | 50.2% |
| Smartphone | 940 | 81.7% |
| Tablet | 433 | 37.6% |
| No Computing Device | 136 | 11.8% |
| Total | 1,151 | 100.0% |
Internet Access in Okemah
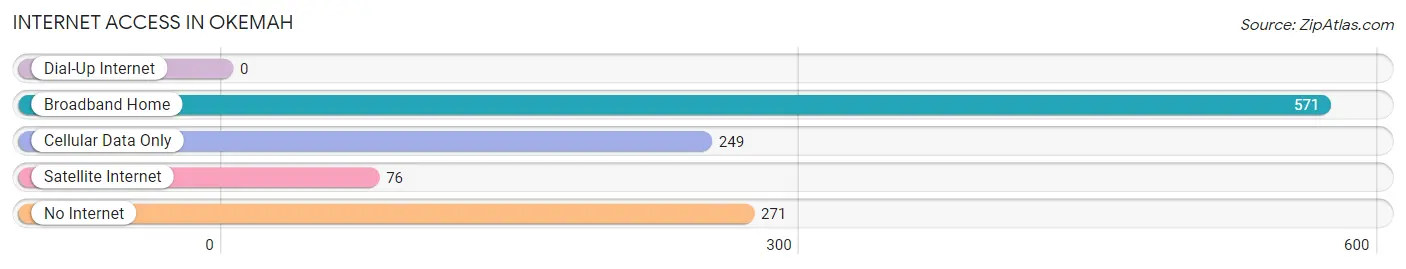
| Internet Type | # Households | % Households |
| Dial-Up Internet | 0 | 0.0% |
| Broadband Home | 571 | 49.6% |
| Cellular Data Only | 249 | 21.6% |
| Satellite Internet | 76 | 6.6% |
| No Internet | 271 | 23.5% |
| Total | 1,151 | 100.0% |
Okemah Summary
Okemah is a small town located in Okfuskee County, Oklahoma. It is situated in the foothills of the Ozark Mountains, approximately 50 miles east of Oklahoma City. The town was founded in 1902 and has a population of approximately 3,000 people.
Geography
Okemah is located in the foothills of the Ozark Mountains, approximately 50 miles east of Oklahoma City. The town is situated on the banks of the Deep Fork River, which flows through the town and provides a source of recreation for the locals. The town is surrounded by rolling hills and is home to a variety of wildlife, including deer, turkey, and quail. The climate in Okemah is generally mild, with temperatures ranging from the mid-50s in the winter to the mid-80s in the summer.
History
Okemah was founded in 1902 by the Choctaw Nation. The town was named after the Choctaw word for “big chief” and was intended to be a center of commerce for the local Native American tribes. The town quickly grew and by 1910, it had a population of over 1,000 people.
In the early 20th century, Okemah was a major center of the oil and gas industry. The town was home to several oil refineries and was the site of the first oil well in Oklahoma. The town also became a major center of the cotton industry, with several cotton gins and warehouses located in the area.
In the mid-20th century, Okemah began to decline as the oil and gas industry moved away from the area. The town’s population decreased and many of the businesses closed. However, in recent years, the town has seen a resurgence in population and economic activity.
Economy
Okemah’s economy is largely based on agriculture and tourism. The town is home to several farms and ranches, which produce a variety of crops, including cotton, corn, and soybeans. The town is also home to several tourist attractions, including the Okemah Historical Museum and the Okemah Lake.
The town is also home to several small businesses, including restaurants, retail stores, and service providers. The town is also home to several manufacturing companies, including a furniture factory and a metal fabrication plant.
Demographics
As of the 2010 census, Okemah had a population of 3,082 people. The racial makeup of the town was 79.3% White, 15.2% Native American, 0.7% Asian, 0.3% African American, and 4.5% from other races. The median household income was $30,938 and the median family income was $37,813.
Conclusion
Okemah is a small town located in Okfuskee County, Oklahoma. It is situated in the foothills of the Ozark Mountains, approximately 50 miles east of Oklahoma City. The town was founded in 1902 and has a population of approximately 3,000 people. The town’s economy is largely based on agriculture and tourism, and it is home to several small businesses, manufacturing companies, and tourist attractions. The town has a diverse population, with a median household income of $30,938 and a median family income of $37,813.
Common Questions
What is Per Capita Income in Okemah?
Per Capita income in Okemah is $18,309.
What is the Median Family Income in Okemah?
Median Family Income in Okemah is $37,538.
What is the Median Household income in Okemah?
Median Household Income in Okemah is $34,882.
What is Income or Wage Gap in Okemah?
Income or Wage Gap in Okemah is 3.4%.
Women in Okemah earn 96.6 cents for every dollar earned by a man.
What is Family Income Deficit in Okemah?
Family Income Deficit in Okemah is $12,613.
Families that are below poverty line in Okemah earn $12,613 less on average than the poverty threshold level.
What is Inequality or Gini Index in Okemah?
Inequality or Gini Index in Okemah is 0.46.
What is the Total Population of Okemah?
Total Population of Okemah is 3,078.
What is the Total Male Population of Okemah?
Total Male Population of Okemah is 1,493.
What is the Total Female Population of Okemah?
Total Female Population of Okemah is 1,585.
What is the Ratio of Males per 100 Females in Okemah?
There are 94.20 Males per 100 Females in Okemah.
What is the Ratio of Females per 100 Males in Okemah?
There are 106.16 Females per 100 Males in Okemah.
What is the Median Population Age in Okemah?
Median Population Age in Okemah is 34.1 Years.
What is the Average Family Size in Okemah
Average Family Size in Okemah is 3.1 People.
What is the Average Household Size in Okemah
Average Household Size in Okemah is 2.5 People.
How Large is the Labor Force in Okemah?
There are 1,069 People in the Labor Forcein in Okemah.
What is the Percentage of People in the Labor Force in Okemah?
45.9% of People are in the Labor Force in Okemah.
What is the Unemployment Rate in Okemah?
Unemployment Rate in Okemah is 1.1%.