Zip Codes with the Highest Percentage of Population Employed in Food Preparation & Serving in Stillwater, OK
RELATED REPORTS & OPTIONS
Food Preparation & Serving
Stillwater
Compare Zip Codes
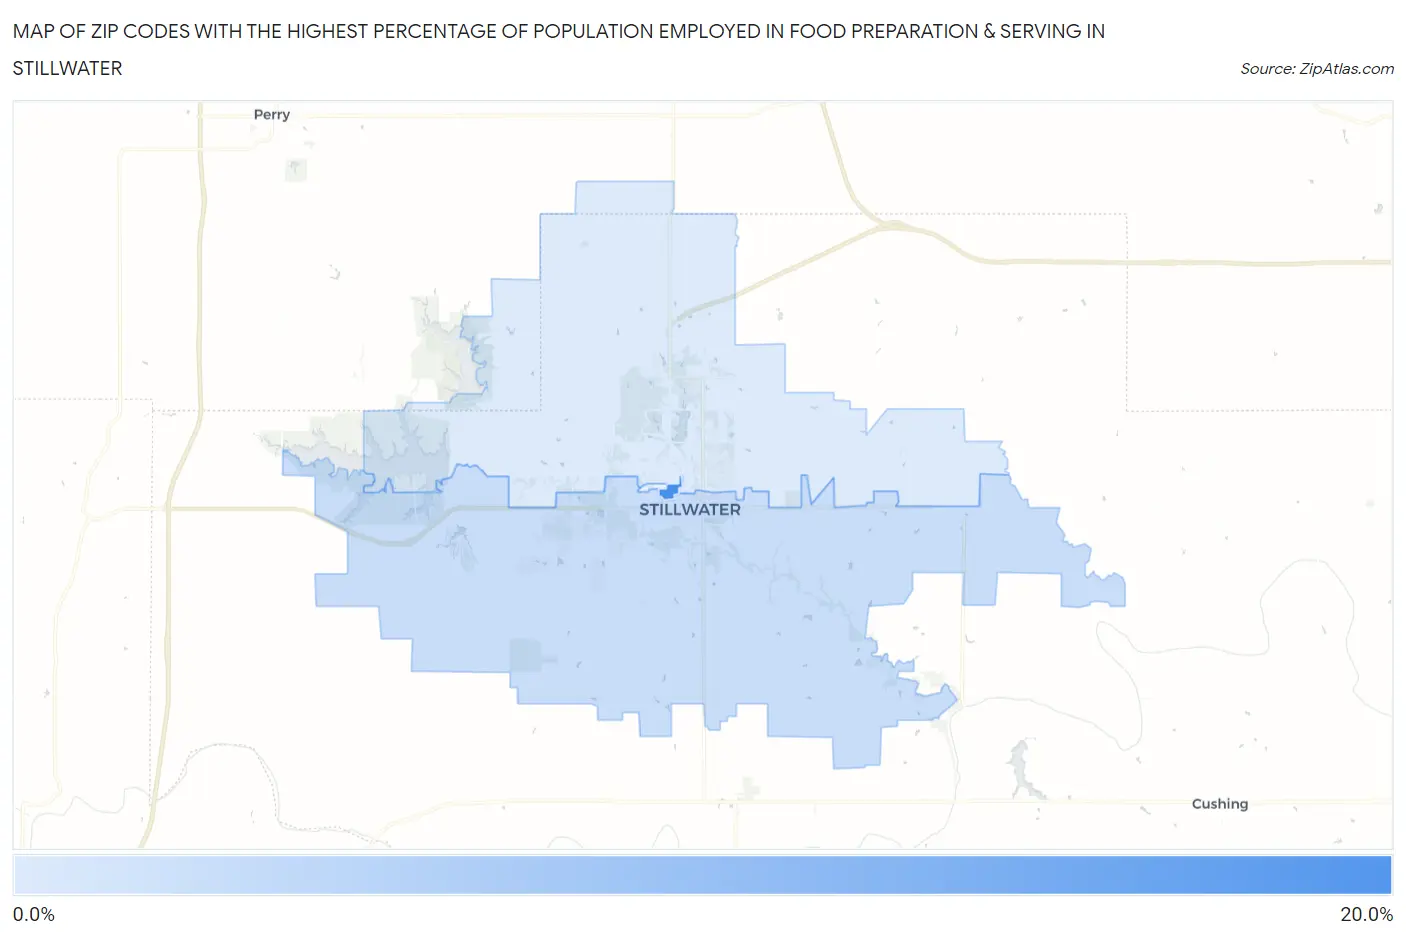
Map of Zip Codes with the Highest Percentage of Population Employed in Food Preparation & Serving in Stillwater
7.1%
15.3%
Zip Codes with the Highest Percentage of Population Employed in Food Preparation & Serving in Stillwater, OK
| Zip Code | % Employed | vs State | vs National | |
| 1. | 74077 | 15.3% | 5.6%(+9.70)#11 | 5.3%(+10.0)#945 |
| 2. | 74074 | 8.2% | 5.6%(+2.58)#97 | 5.3%(+2.89)#4,471 |
| 3. | 74075 | 7.1% | 5.6%(+1.51)#137 | 5.3%(+1.82)#6,331 |
1
Common Questions
What are the Top 3 Zip Codes with the Highest Percentage of Population Employed in Food Preparation & Serving in Stillwater, OK?
Top 3 Zip Codes with the Highest Percentage of Population Employed in Food Preparation & Serving in Stillwater, OK are:
What zip code has the Highest Percentage of Population Employed in Food Preparation & Serving in Stillwater, OK?
74077 has the Highest Percentage of Population Employed in Food Preparation & Serving in Stillwater, OK with 15.3%.
What is the Percentage of Population Employed in Food Preparation & Serving in Stillwater, OK?
Percentage of Population Employed in Food Preparation & Serving in Stillwater is 7.9%.
What is the Percentage of Population Employed in Food Preparation & Serving in Oklahoma?
Percentage of Population Employed in Food Preparation & Serving in Oklahoma is 5.6%.
What is the Percentage of Population Employed in Food Preparation & Serving in the United States?
Percentage of Population Employed in Food Preparation & Serving in the United States is 5.3%.