Pauls Valley, OK Map & Demographics
Pauls Valley Map
Pauls Valley Overview
$26,358
PER CAPITA INCOME
$54,519
AVG FAMILY INCOME
$45,400
AVG HOUSEHOLD INCOME
39.1%
WAGE / INCOME GAP [ % ]
60.9¢/ $1
WAGE / INCOME GAP [ $ ]
0.44
INEQUALITY / GINI INDEX
6,031
TOTAL POPULATION
3,095
MALE POPULATION
2,936
FEMALE POPULATION
105.42
MALES / 100 FEMALES
94.86
FEMALES / 100 MALES
39.2
MEDIAN AGE
3.3
AVG FAMILY SIZE
2.4
AVG HOUSEHOLD SIZE
2,620
LABOR FORCE [ PEOPLE ]
53.7%
PERCENT IN LABOR FORCE
3.1%
UNEMPLOYMENT RATE
Pauls Valley Zip Codes
Pauls Valley Area Codes
Income in Pauls Valley
Income Overview in Pauls Valley
Per Capita Income in Pauls Valley is $26,358, while median incomes of families and households are $54,519 and $45,400 respectively.
| Characteristic | Number | Measure |
| Per Capita Income | 6,031 | $26,358 |
| Median Family Income | 1,287 | $54,519 |
| Mean Family Income | 1,287 | $76,614 |
| Median Household Income | 2,412 | $45,400 |
| Mean Household Income | 2,412 | $60,299 |
| Income Deficit | 1,287 | $0 |
| Wage / Income Gap (%) | 6,031 | 39.08% |
| Wage / Income Gap ($) | 6,031 | 60.92¢ per $1 |
| Gini / Inequality Index | 6,031 | 0.44 |
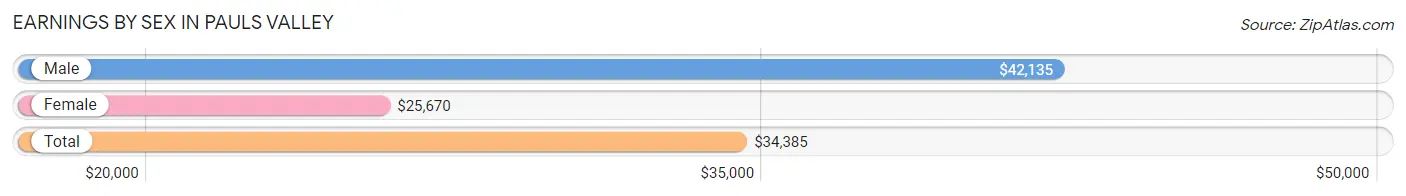
Earnings by Sex in Pauls Valley
Average Earnings in Pauls Valley are $34,385, $42,135 for men and $25,670 for women, a difference of 39.1%.
| Sex | Number | Average Earnings |
| Male | 1,444 (55.2%) | $42,135 |
| Female | 1,170 (44.8%) | $25,670 |
| Total | 2,614 (100.0%) | $34,385 |
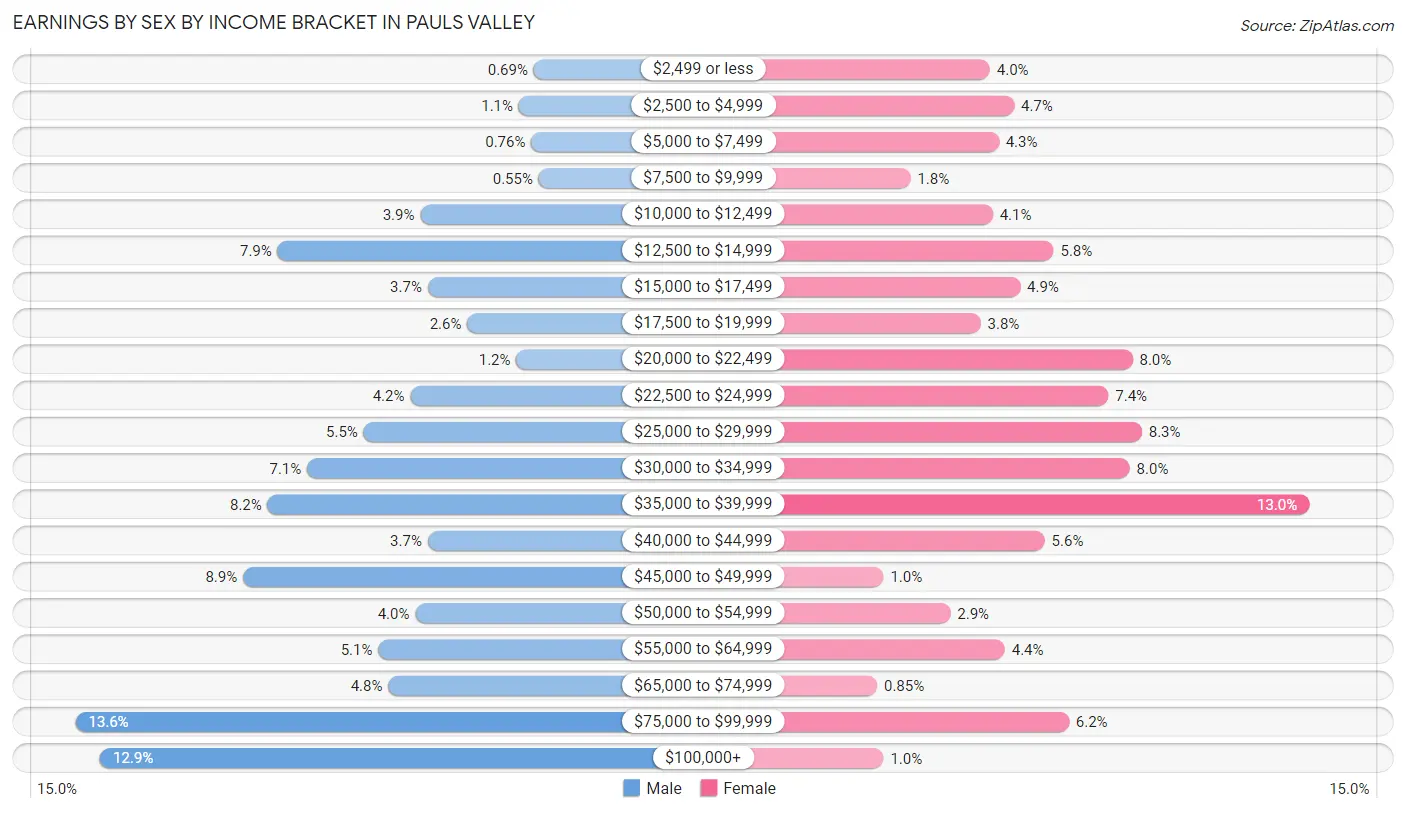
Earnings by Sex by Income Bracket in Pauls Valley
The most common earnings brackets in Pauls Valley are $75,000 to $99,999 for men (196 | 13.6%) and $35,000 to $39,999 for women (152 | 13.0%).
| Income | Male | Female |
| $2,499 or less | 10 (0.7%) | 47 (4.0%) |
| $2,500 to $4,999 | 16 (1.1%) | 55 (4.7%) |
| $5,000 to $7,499 | 11 (0.8%) | 50 (4.3%) |
| $7,500 to $9,999 | 8 (0.5%) | 21 (1.8%) |
| $10,000 to $12,499 | 56 (3.9%) | 48 (4.1%) |
| $12,500 to $14,999 | 114 (7.9%) | 68 (5.8%) |
| $15,000 to $17,499 | 53 (3.7%) | 57 (4.9%) |
| $17,500 to $19,999 | 37 (2.6%) | 44 (3.8%) |
| $20,000 to $22,499 | 17 (1.2%) | 94 (8.0%) |
| $22,500 to $24,999 | 60 (4.2%) | 86 (7.3%) |
| $25,000 to $29,999 | 79 (5.5%) | 97 (8.3%) |
| $30,000 to $34,999 | 102 (7.1%) | 93 (8.0%) |
| $35,000 to $39,999 | 118 (8.2%) | 152 (13.0%) |
| $40,000 to $44,999 | 53 (3.7%) | 65 (5.6%) |
| $45,000 to $49,999 | 128 (8.9%) | 12 (1.0%) |
| $50,000 to $54,999 | 58 (4.0%) | 34 (2.9%) |
| $55,000 to $64,999 | 73 (5.1%) | 52 (4.4%) |
| $65,000 to $74,999 | 69 (4.8%) | 10 (0.9%) |
| $75,000 to $99,999 | 196 (13.6%) | 73 (6.2%) |
| $100,000+ | 186 (12.9%) | 12 (1.0%) |
| Total | 1,444 (100.0%) | 1,170 (100.0%) |
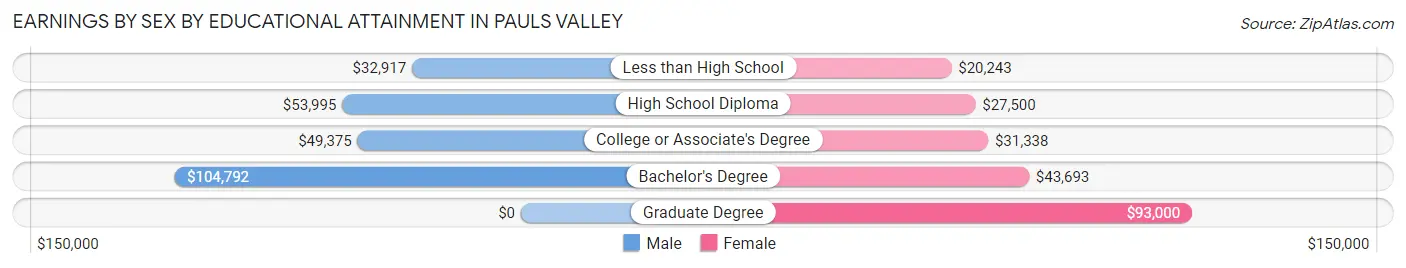
Earnings by Sex by Educational Attainment in Pauls Valley
Average earnings in Pauls Valley are $47,104 for men and $31,108 for women, a difference of 34.0%. Men with an educational attainment of bachelor's degree enjoy the highest average annual earnings of $104,792, while those with less than high school education earn the least with $32,917. Women with an educational attainment of graduate degree earn the most with the average annual earnings of $93,000, while those with less than high school education have the smallest earnings of $20,243.
| Educational Attainment | Male Income | Female Income |
| Less than High School | $32,917 | $20,243 |
| High School Diploma | $53,995 | $27,500 |
| College or Associate's Degree | $49,375 | $31,338 |
| Bachelor's Degree | $104,792 | $43,693 |
| Graduate Degree | - | - |
| Total | $47,104 | $31,108 |
Family Income in Pauls Valley
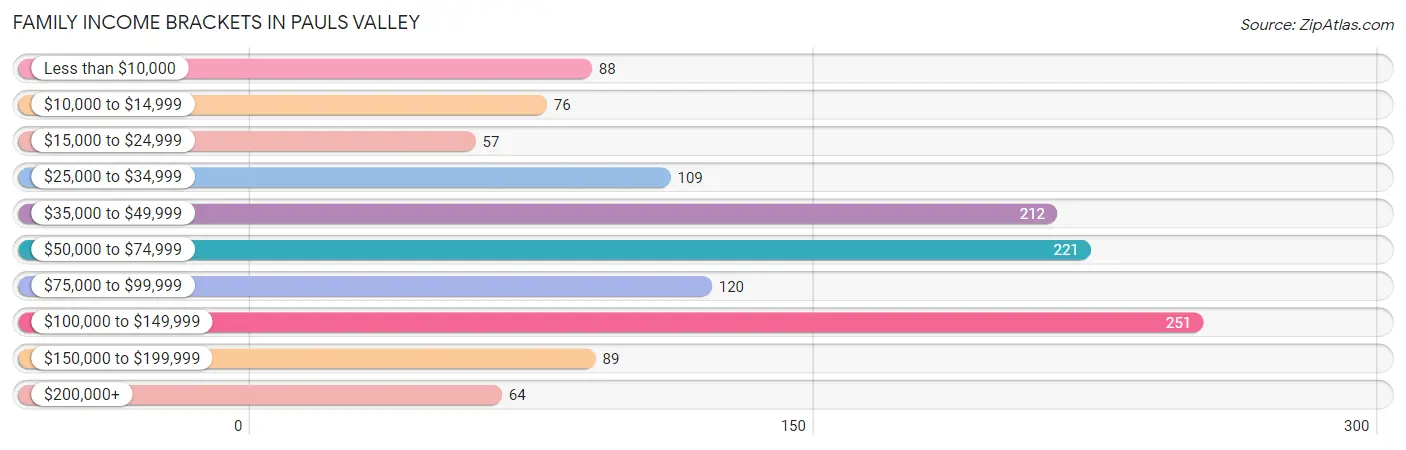
Family Income Brackets in Pauls Valley
According to the Pauls Valley family income data, there are 251 families falling into the $100,000 to $149,999 income range, which is the most common income bracket and makes up 19.5% of all families. Conversely, the $15,000 to $24,999 income bracket is the least frequent group with only 57 families (4.4%) belonging to this category.
| Income Bracket | # Families | % Families |
| Less than $10,000 | 88 | 6.8% |
| $10,000 to $14,999 | 76 | 5.9% |
| $15,000 to $24,999 | 57 | 4.4% |
| $25,000 to $34,999 | 109 | 8.5% |
| $35,000 to $49,999 | 212 | 16.5% |
| $50,000 to $74,999 | 221 | 17.2% |
| $75,000 to $99,999 | 120 | 9.3% |
| $100,000 to $149,999 | 251 | 19.5% |
| $150,000 to $199,999 | 89 | 6.9% |
| $200,000+ | 64 | 5.0% |
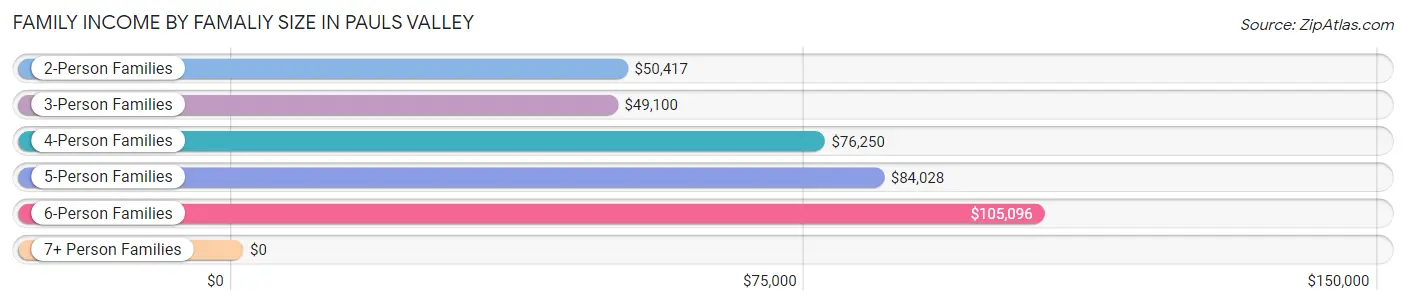
Family Income by Famaliy Size in Pauls Valley
6-person families (53 | 4.1%) account for the highest median family income in Pauls Valley with $105,096 per family, while 2-person families (593 | 46.1%) have the highest median income of $25,208 per family member.
| Income Bracket | # Families | Median Income |
| 2-Person Families | 593 (46.1%) | $50,417 |
| 3-Person Families | 234 (18.2%) | $49,100 |
| 4-Person Families | 320 (24.9%) | $76,250 |
| 5-Person Families | 85 (6.6%) | $84,028 |
| 6-Person Families | 53 (4.1%) | $105,096 |
| 7+ Person Families | 2 (0.2%) | $0 |
| Total | 1,287 (100.0%) | $54,519 |
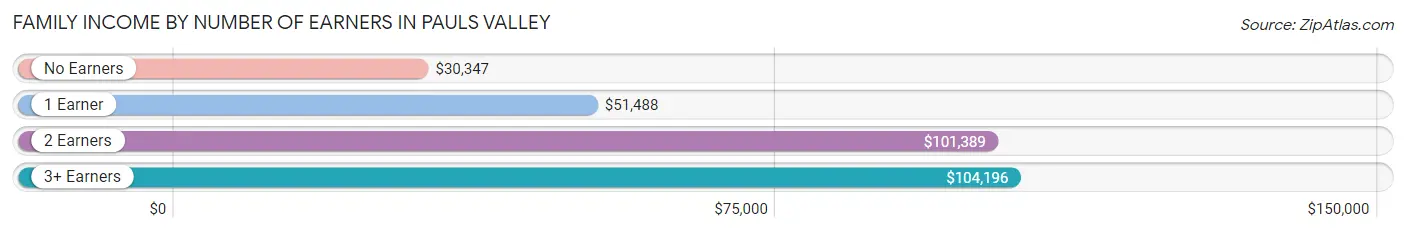
Family Income by Number of Earners in Pauls Valley
The median family income in Pauls Valley is $54,519, with families comprising 3+ earners (91) having the highest median family income of $104,196, while families with no earners (291) have the lowest median family income of $30,347, accounting for 7.1% and 22.6% of families, respectively.
| Number of Earners | # Families | Median Income |
| No Earners | 291 (22.6%) | $30,347 |
| 1 Earner | 451 (35.0%) | $51,488 |
| 2 Earners | 454 (35.3%) | $101,389 |
| 3+ Earners | 91 (7.1%) | $104,196 |
| Total | 1,287 (100.0%) | $54,519 |
Household Income in Pauls Valley
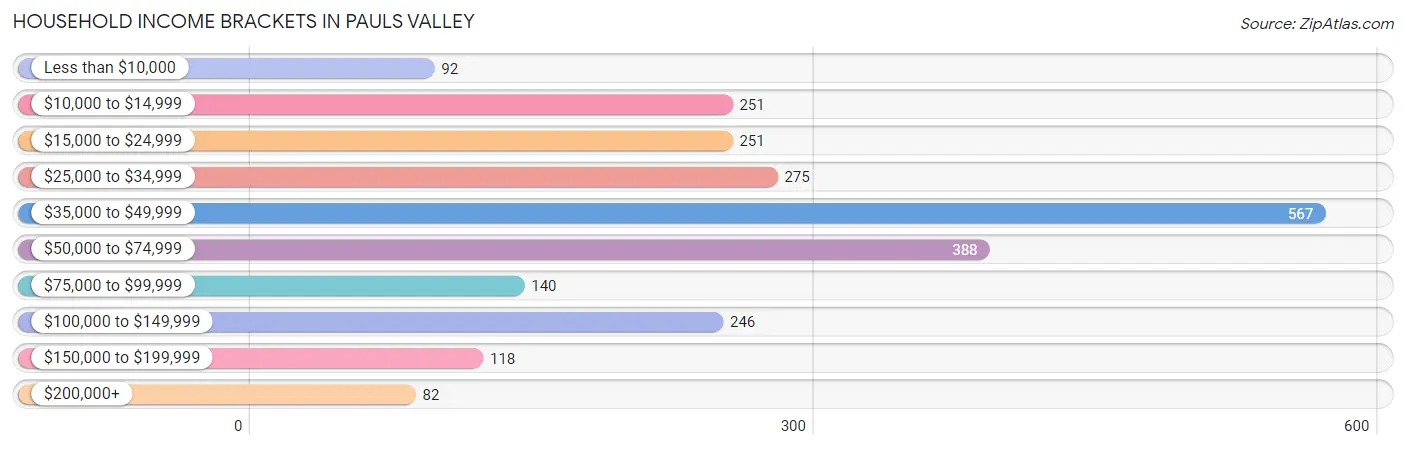
Household Income Brackets in Pauls Valley
With 567 households falling in the category, the $35,000 to $49,999 income range is the most frequent in Pauls Valley, accounting for 23.5% of all households. In contrast, only 82 households (3.4%) fall into the $200,000+ income bracket, making it the least populous group.
| Income Bracket | # Households | % Households |
| Less than $10,000 | 92 | 3.8% |
| $10,000 to $14,999 | 251 | 10.4% |
| $15,000 to $24,999 | 251 | 10.4% |
| $25,000 to $34,999 | 275 | 11.4% |
| $35,000 to $49,999 | 567 | 23.5% |
| $50,000 to $74,999 | 388 | 16.1% |
| $75,000 to $99,999 | 140 | 5.8% |
| $100,000 to $149,999 | 246 | 10.2% |
| $150,000 to $199,999 | 118 | 4.9% |
| $200,000+ | 82 | 3.4% |
Household Income by Householder Age in Pauls Valley
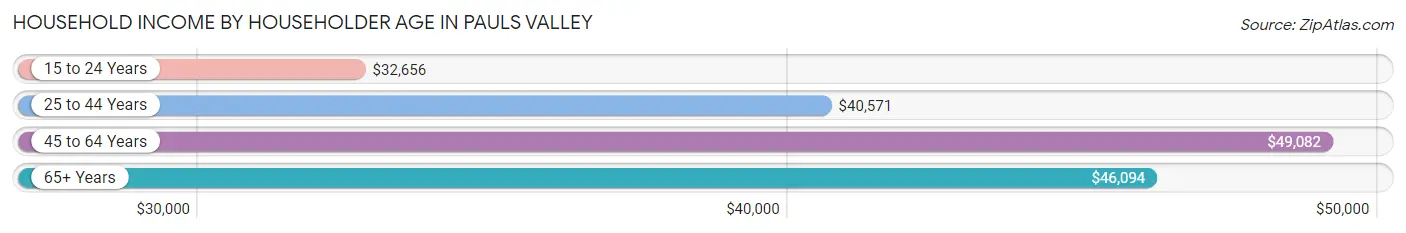
The median household income in Pauls Valley is $45,400, with the highest median household income of $49,082 found in the 45 to 64 years age bracket for the primary householder. A total of 814 households (33.8%) fall into this category. Meanwhile, the 15 to 24 years age bracket for the primary householder has the lowest median household income of $32,656, with 99 households (4.1%) in this group.
| Income Bracket | # Households | Median Income |
| 15 to 24 Years | 99 (4.1%) | $32,656 |
| 25 to 44 Years | 732 (30.3%) | $40,571 |
| 45 to 64 Years | 814 (33.8%) | $49,082 |
| 65+ Years | 767 (31.8%) | $46,094 |
| Total | 2,412 (100.0%) | $45,400 |
Poverty in Pauls Valley
Income Below Poverty by Sex and Age in Pauls Valley
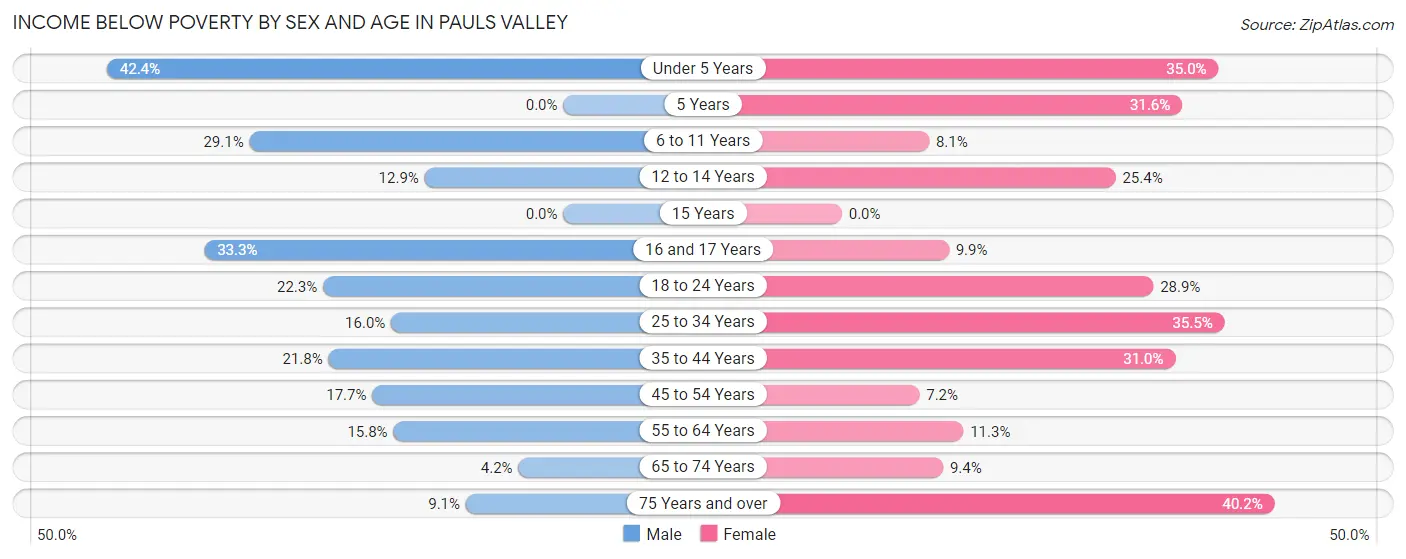
With 18.4% poverty level for males and 21.8% for females among the residents of Pauls Valley, under 5 year old males and 75 year old and over females are the most vulnerable to poverty, with 61 males (42.4%) and 98 females (40.2%) in their respective age groups living below the poverty level.
| Age Bracket | Male | Female |
| Under 5 Years | 61 (42.4%) | 72 (34.9%) |
| 5 Years | 0 (0.0%) | 6 (31.6%) |
| 6 to 11 Years | 67 (29.1%) | 19 (8.1%) |
| 12 to 14 Years | 22 (12.9%) | 16 (25.4%) |
| 15 Years | 0 (0.0%) | 0 (0.0%) |
| 16 and 17 Years | 31 (33.3%) | 13 (9.9%) |
| 18 to 24 Years | 68 (22.3%) | 63 (28.9%) |
| 25 to 34 Years | 66 (16.0%) | 135 (35.5%) |
| 35 to 44 Years | 85 (21.8%) | 108 (30.9%) |
| 45 to 54 Years | 72 (17.7%) | 22 (7.2%) |
| 55 to 64 Years | 50 (15.8%) | 48 (11.3%) |
| 65 to 74 Years | 13 (4.2%) | 23 (9.4%) |
| 75 Years and over | 18 (9.0%) | 98 (40.2%) |
| Total | 553 (18.4%) | 623 (21.8%) |
Income Above Poverty by Sex and Age in Pauls Valley
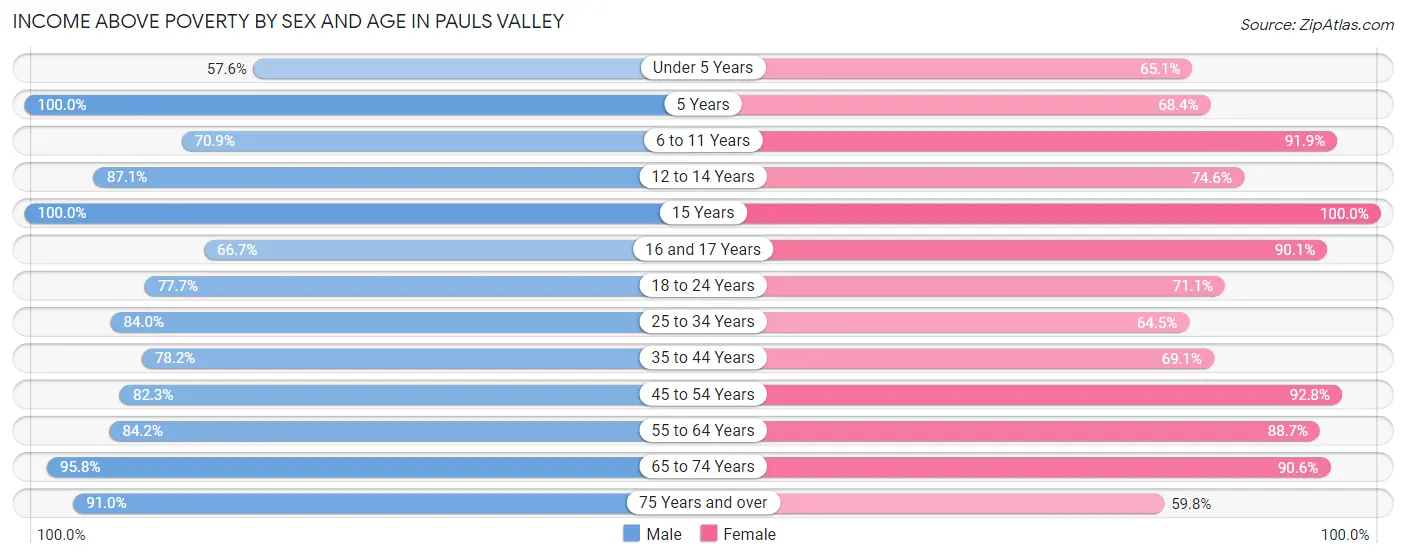
According to the poverty statistics in Pauls Valley, males aged 5 years and females aged 15 years are the age groups that are most secure financially, with 100.0% of males and 100.0% of females in these age groups living above the poverty line.
| Age Bracket | Male | Female |
| Under 5 Years | 83 (57.6%) | 134 (65.0%) |
| 5 Years | 9 (100.0%) | 13 (68.4%) |
| 6 to 11 Years | 163 (70.9%) | 216 (91.9%) |
| 12 to 14 Years | 149 (87.1%) | 47 (74.6%) |
| 15 Years | 15 (100.0%) | 30 (100.0%) |
| 16 and 17 Years | 62 (66.7%) | 118 (90.1%) |
| 18 to 24 Years | 237 (77.7%) | 155 (71.1%) |
| 25 to 34 Years | 347 (84.0%) | 245 (64.5%) |
| 35 to 44 Years | 305 (78.2%) | 241 (69.1%) |
| 45 to 54 Years | 334 (82.3%) | 284 (92.8%) |
| 55 to 64 Years | 267 (84.2%) | 378 (88.7%) |
| 65 to 74 Years | 299 (95.8%) | 222 (90.6%) |
| 75 Years and over | 181 (90.9%) | 146 (59.8%) |
| Total | 2,451 (81.6%) | 2,229 (78.2%) |
Income Below Poverty Among Married-Couple Families in Pauls Valley
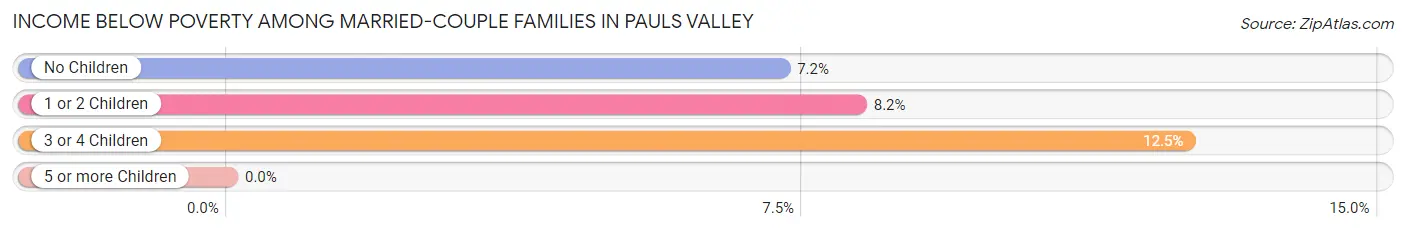
The poverty statistics for married-couple families in Pauls Valley show that 8.0% or 67 of the total 837 families live below the poverty line. Families with 3 or 4 children have the highest poverty rate of 12.5%, comprising of 8 families. On the other hand, families with no children have the lowest poverty rate of 7.2%, which includes 32 families.
| Children | Above Poverty | Below Poverty |
| No Children | 412 (92.8%) | 32 (7.2%) |
| 1 or 2 Children | 302 (91.8%) | 27 (8.2%) |
| 3 or 4 Children | 56 (87.5%) | 8 (12.5%) |
| 5 or more Children | 0 (0.0%) | 0 (0.0%) |
| Total | 770 (92.0%) | 67 (8.0%) |
Income Below Poverty Among Single-Parent Households in Pauls Valley
According to the poverty data in Pauls Valley, 13.9% or 18 single-father households and 37.5% or 120 single-mother households are living below the poverty line. Among single-father households, those with no children have the highest poverty rate, with 18 households (52.9%) experiencing poverty. Likewise, among single-mother households, those with 3 or 4 children have the highest poverty rate, with 32 households (84.2%) falling below the poverty line.
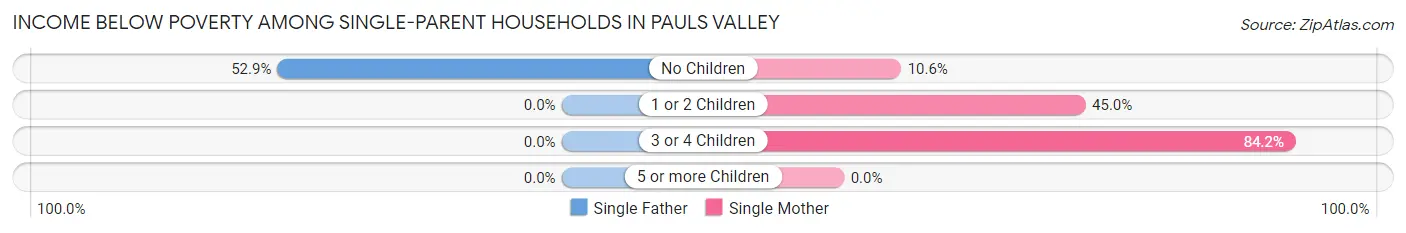
| Children | Single Father | Single Mother |
| No Children | 18 (52.9%) | 12 (10.6%) |
| 1 or 2 Children | 0 (0.0%) | 76 (45.0%) |
| 3 or 4 Children | 0 (0.0%) | 32 (84.2%) |
| 5 or more Children | 0 (0.0%) | 0 (0.0%) |
| Total | 18 (13.9%) | 120 (37.5%) |
Income Below Poverty Among Married-Couple vs Single-Parent Households in Pauls Valley
The poverty data for Pauls Valley shows that 67 of the married-couple family households (8.0%) and 138 of the single-parent households (30.7%) are living below the poverty level. Within the married-couple family households, those with 3 or 4 children have the highest poverty rate, with 8 households (12.5%) falling below the poverty line. Among the single-parent households, those with 3 or 4 children have the highest poverty rate, with 32 household (57.1%) living below poverty.
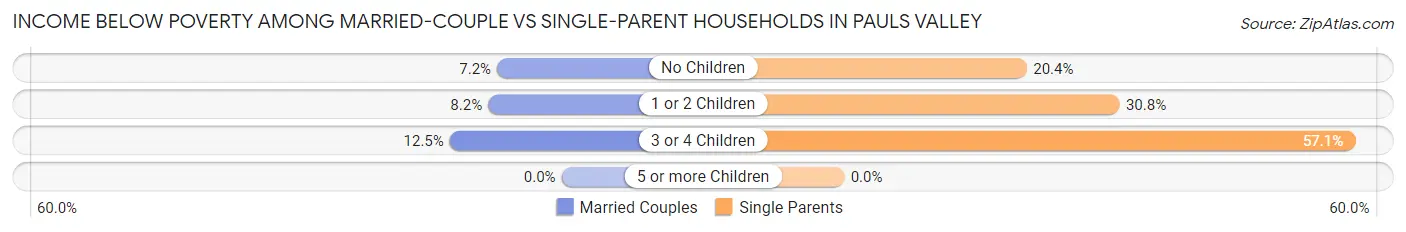
| Children | Married-Couple Families | Single-Parent Households |
| No Children | 32 (7.2%) | 30 (20.4%) |
| 1 or 2 Children | 27 (8.2%) | 76 (30.8%) |
| 3 or 4 Children | 8 (12.5%) | 32 (57.1%) |
| 5 or more Children | 0 (0.0%) | 0 (0.0%) |
| Total | 67 (8.0%) | 138 (30.7%) |
Race in Pauls Valley
The most populous races in Pauls Valley are White / Caucasian (4,675 | 77.5%), Hispanic or Latino (1,183 | 19.6%), and Two or more Races (638 | 10.6%).
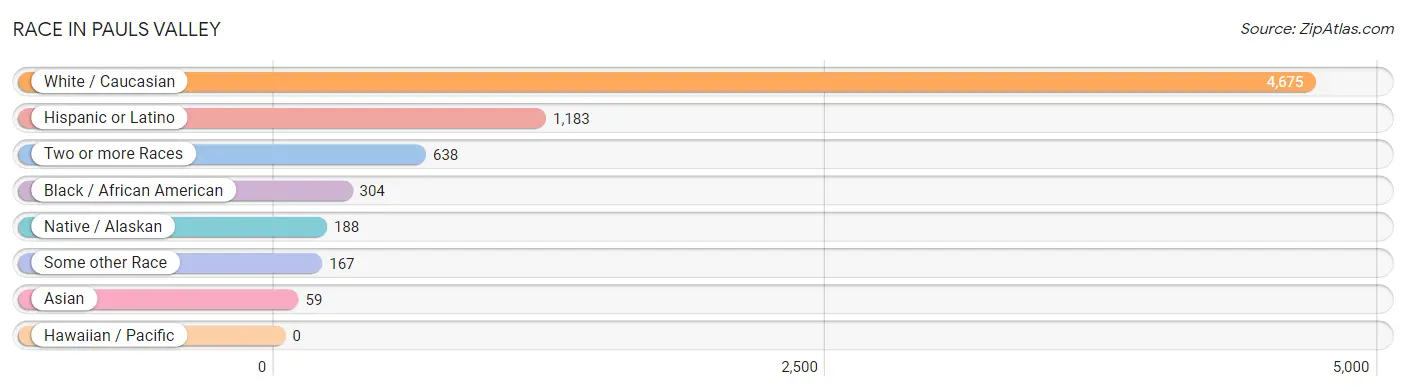
| Race | # Population | % Population |
| Asian | 59 | 1.0% |
| Black / African American | 304 | 5.0% |
| Hawaiian / Pacific | 0 | 0.0% |
| Hispanic or Latino | 1,183 | 19.6% |
| Native / Alaskan | 188 | 3.1% |
| White / Caucasian | 4,675 | 77.5% |
| Two or more Races | 638 | 10.6% |
| Some other Race | 167 | 2.8% |
| Total | 6,031 | 100.0% |
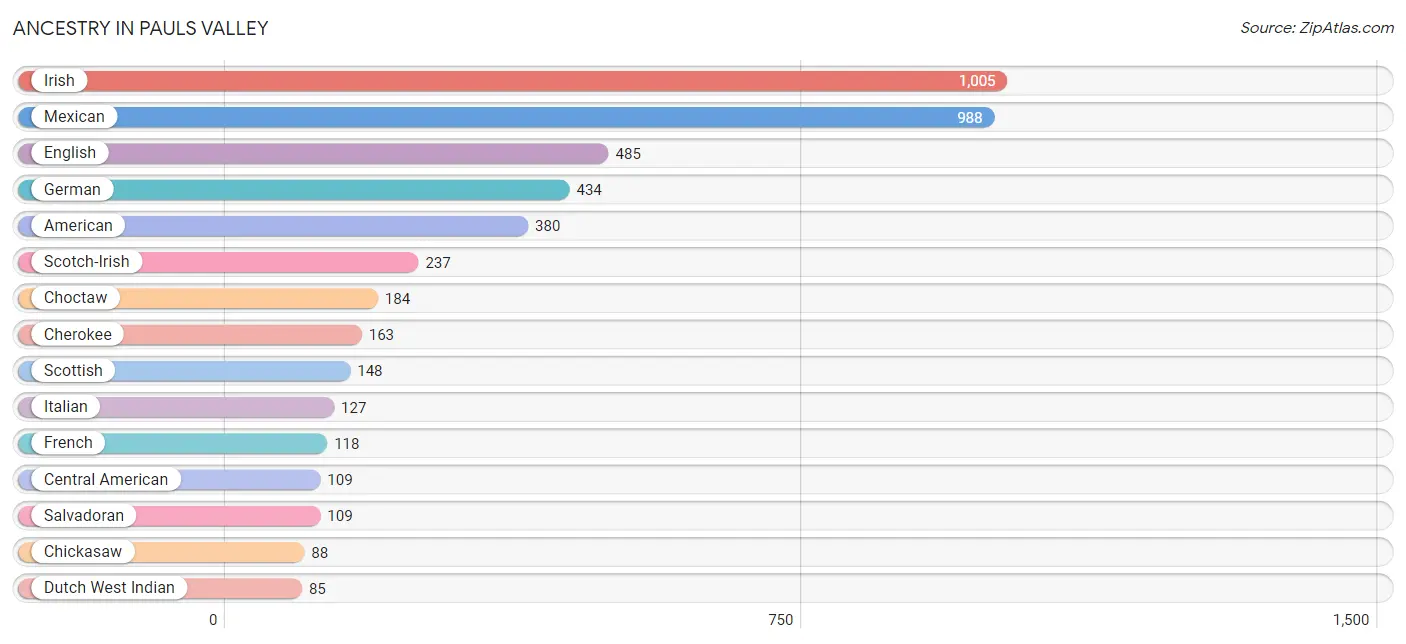
Ancestry in Pauls Valley
The most populous ancestries reported in Pauls Valley are Irish (1,005 | 16.7%), Mexican (988 | 16.4%), English (485 | 8.0%), German (434 | 7.2%), and American (380 | 6.3%), together accounting for 54.6% of all Pauls Valley residents.
| Ancestry | # Population | % Population |
| African | 8 | 0.1% |
| American | 380 | 6.3% |
| Apache | 12 | 0.2% |
| Arab | 8 | 0.1% |
| Armenian | 15 | 0.3% |
| Assyrian / Chaldean / Syriac | 10 | 0.2% |
| Blackfeet | 10 | 0.2% |
| British | 63 | 1.0% |
| Central American | 109 | 1.8% |
| Cherokee | 163 | 2.7% |
| Chickasaw | 88 | 1.5% |
| Choctaw | 184 | 3.0% |
| Comanche | 18 | 0.3% |
| Creek | 21 | 0.4% |
| Czech | 23 | 0.4% |
| Dutch | 74 | 1.2% |
| Dutch West Indian | 85 | 1.4% |
| English | 485 | 8.0% |
| European | 81 | 1.3% |
| Filipino | 24 | 0.4% |
| French | 118 | 2.0% |
| French Canadian | 20 | 0.3% |
| German | 434 | 7.2% |
| Irish | 1,005 | 16.7% |
| Italian | 127 | 2.1% |
| Korean | 11 | 0.2% |
| Lebanese | 8 | 0.1% |
| Mexican | 988 | 16.4% |
| Osage | 13 | 0.2% |
| Pakistani | 7 | 0.1% |
| Pima | 6 | 0.1% |
| Polish | 25 | 0.4% |
| Potawatomi | 17 | 0.3% |
| Russian | 4 | 0.1% |
| Salvadoran | 109 | 1.8% |
| Scandinavian | 23 | 0.4% |
| Scotch-Irish | 237 | 3.9% |
| Scottish | 148 | 2.5% |
| Slavic | 7 | 0.1% |
| Spaniard | 60 | 1.0% |
| Spanish | 9 | 0.2% |
| Sri Lankan | 25 | 0.4% |
| Subsaharan African | 8 | 0.1% |
| Swedish | 16 | 0.3% |
| Thai | 41 | 0.7% |
| Welsh | 19 | 0.3% |
| Yuman | 5 | 0.1% | View All 47 Rows |
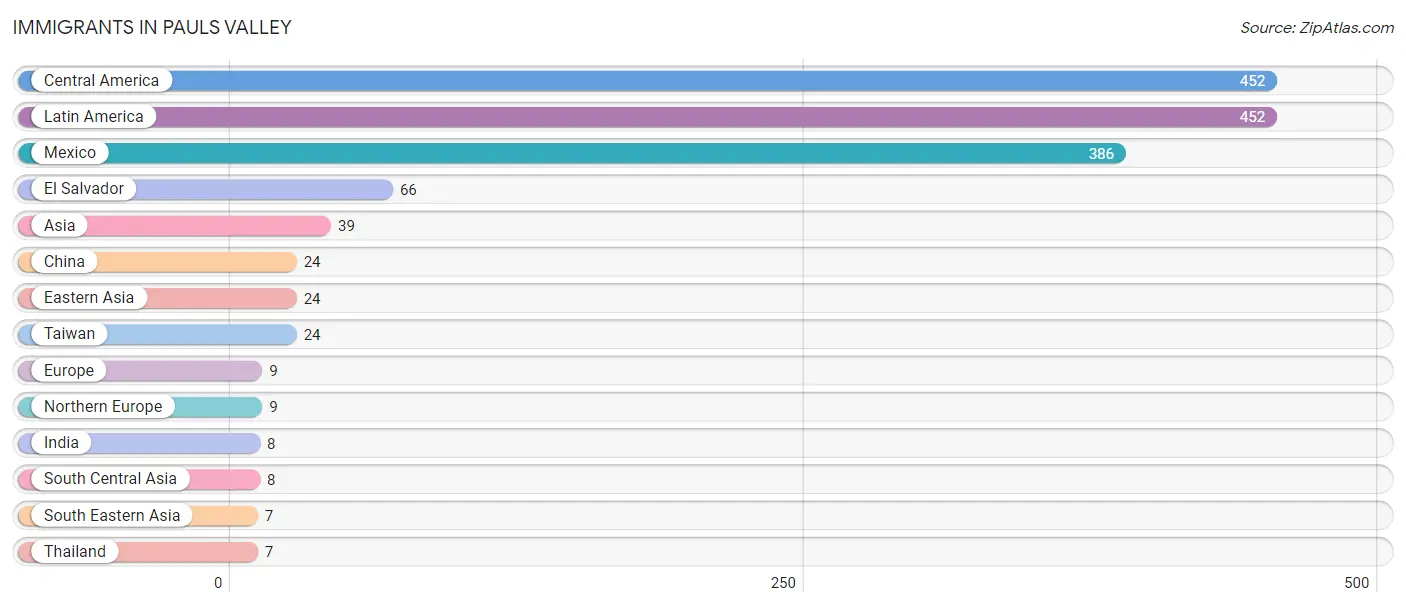
Immigrants in Pauls Valley
The most numerous immigrant groups reported in Pauls Valley came from Central America (452 | 7.5%), Latin America (452 | 7.5%), Mexico (386 | 6.4%), El Salvador (66 | 1.1%), and Asia (39 | 0.6%), together accounting for 23.1% of all Pauls Valley residents.
| Immigration Origin | # Population | % Population |
| Asia | 39 | 0.6% |
| Central America | 452 | 7.5% |
| China | 24 | 0.4% |
| Eastern Asia | 24 | 0.4% |
| El Salvador | 66 | 1.1% |
| Europe | 9 | 0.2% |
| India | 8 | 0.1% |
| Latin America | 452 | 7.5% |
| Mexico | 386 | 6.4% |
| Northern Europe | 9 | 0.2% |
| South Central Asia | 8 | 0.1% |
| South Eastern Asia | 7 | 0.1% |
| Taiwan | 24 | 0.4% |
| Thailand | 7 | 0.1% | View All 14 Rows |
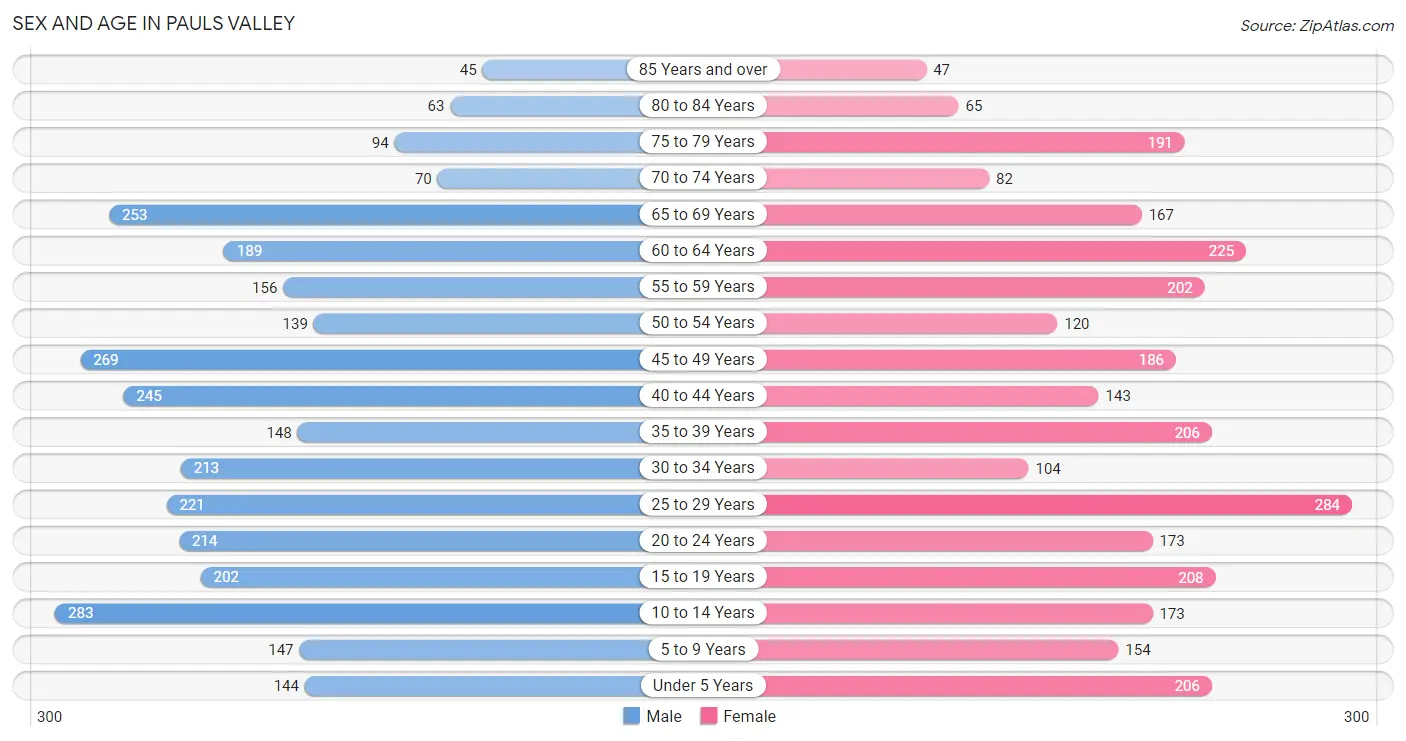
Sex and Age in Pauls Valley
Sex and Age in Pauls Valley
The most populous age groups in Pauls Valley are 10 to 14 Years (283 | 9.1%) for men and 25 to 29 Years (284 | 9.7%) for women.
| Age Bracket | Male | Female |
| Under 5 Years | 144 (4.6%) | 206 (7.0%) |
| 5 to 9 Years | 147 (4.8%) | 154 (5.2%) |
| 10 to 14 Years | 283 (9.1%) | 173 (5.9%) |
| 15 to 19 Years | 202 (6.5%) | 208 (7.1%) |
| 20 to 24 Years | 214 (6.9%) | 173 (5.9%) |
| 25 to 29 Years | 221 (7.1%) | 284 (9.7%) |
| 30 to 34 Years | 213 (6.9%) | 104 (3.5%) |
| 35 to 39 Years | 148 (4.8%) | 206 (7.0%) |
| 40 to 44 Years | 245 (7.9%) | 143 (4.9%) |
| 45 to 49 Years | 269 (8.7%) | 186 (6.3%) |
| 50 to 54 Years | 139 (4.5%) | 120 (4.1%) |
| 55 to 59 Years | 156 (5.0%) | 202 (6.9%) |
| 60 to 64 Years | 189 (6.1%) | 225 (7.7%) |
| 65 to 69 Years | 253 (8.2%) | 167 (5.7%) |
| 70 to 74 Years | 70 (2.3%) | 82 (2.8%) |
| 75 to 79 Years | 94 (3.0%) | 191 (6.5%) |
| 80 to 84 Years | 63 (2.0%) | 65 (2.2%) |
| 85 Years and over | 45 (1.5%) | 47 (1.6%) |
| Total | 3,095 (100.0%) | 2,936 (100.0%) |
Families and Households in Pauls Valley
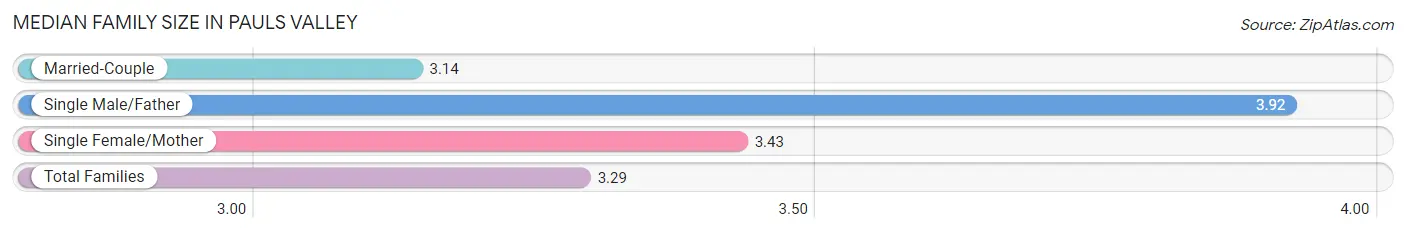
Median Family Size in Pauls Valley
The median family size in Pauls Valley is 3.29 persons per family, with single male/father families (130 | 10.1%) accounting for the largest median family size of 3.92 persons per family. On the other hand, married-couple families (837 | 65.0%) represent the smallest median family size with 3.14 persons per family.
| Family Type | # Families | Family Size |
| Married-Couple | 837 (65.0%) | 3.14 |
| Single Male/Father | 130 (10.1%) | 3.92 |
| Single Female/Mother | 320 (24.9%) | 3.43 |
| Total Families | 1,287 (100.0%) | 3.29 |
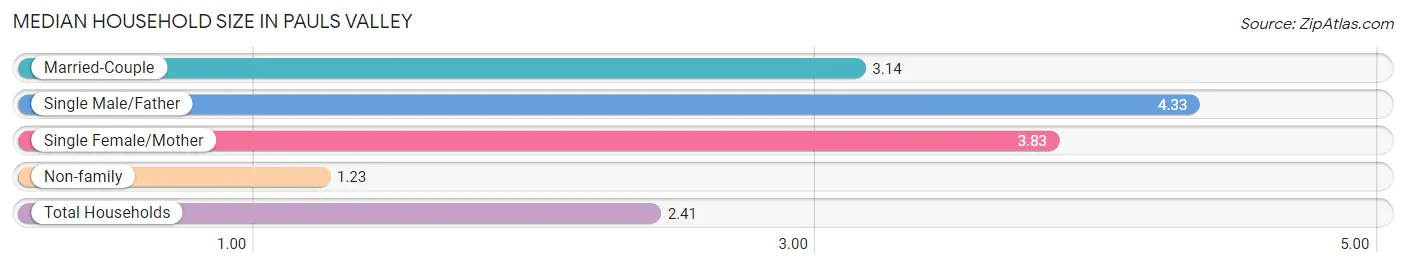
Median Household Size in Pauls Valley
The median household size in Pauls Valley is 2.41 persons per household, with single male/father households (130 | 5.4%) accounting for the largest median household size of 4.33 persons per household. non-family households (1,125 | 46.6%) represent the smallest median household size with 1.23 persons per household.
| Household Type | # Households | Household Size |
| Married-Couple | 837 (34.7%) | 3.14 |
| Single Male/Father | 130 (5.4%) | 4.33 |
| Single Female/Mother | 320 (13.3%) | 3.83 |
| Non-family | 1,125 (46.6%) | 1.23 |
| Total Households | 2,412 (100.0%) | 2.41 |
Household Size by Marriage Status in Pauls Valley
Out of a total of 2,412 households in Pauls Valley, 1,287 (53.4%) are family households, while 1,125 (46.6%) are nonfamily households. The most numerous type of family households are 2-person households, comprising 543, and the most common type of nonfamily households are 1-person households, comprising 980.

| Household Size | Family Households | Nonfamily Households |
| 1-Person Households | - | 980 (40.6%) |
| 2-Person Households | 543 (22.5%) | 98 (4.1%) |
| 3-Person Households | 238 (9.9%) | 47 (1.9%) |
| 4-Person Households | 345 (14.3%) | 0 (0.0%) |
| 5-Person Households | 87 (3.6%) | 0 (0.0%) |
| 6-Person Households | 72 (3.0%) | 0 (0.0%) |
| 7+ Person Households | 2 (0.1%) | 0 (0.0%) |
| Total | 1,287 (53.4%) | 1,125 (46.6%) |
Female Fertility in Pauls Valley
Fertility by Age in Pauls Valley
Average fertility rate in Pauls Valley is 50.0 births per 1,000 women. Women in the age bracket of 35 to 50 years have the highest fertility rate with 61.0 births per 1,000 women. Women in the age bracket of 35 to 50 years acount for 52.9% of all women with births.
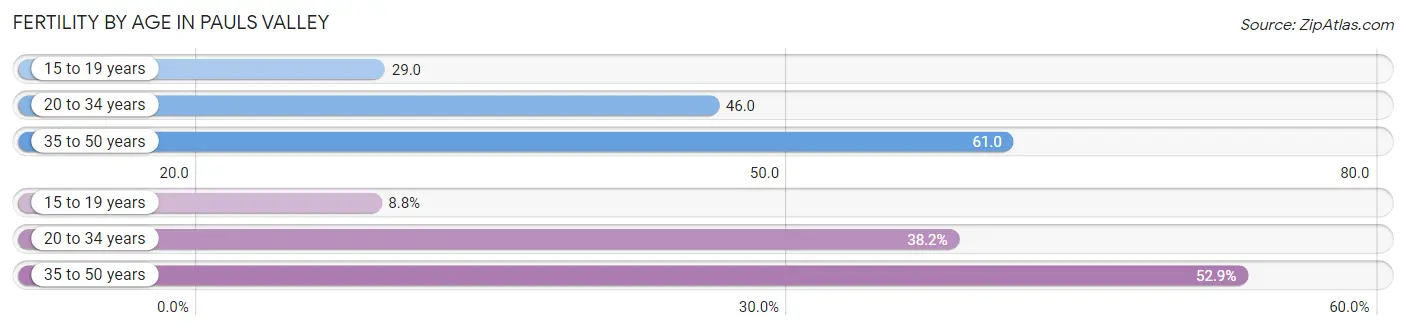
| Age Bracket | Women with Births | Births / 1,000 Women |
| 15 to 19 years | 6 (8.8%) | 29.0 |
| 20 to 34 years | 26 (38.2%) | 46.0 |
| 35 to 50 years | 36 (52.9%) | 61.0 |
| Total | 68 (100.0%) | 50.0 |
Fertility by Age by Marriage Status in Pauls Valley
64.7% of women with births (68) in Pauls Valley are married. The highest percentage of unmarried women with births falls into 15 to 19 years age bracket with 100.0% of them unmarried at the time of birth, while the lowest percentage of unmarried women with births belong to 20 to 34 years age bracket with 7.7% of them unmarried.
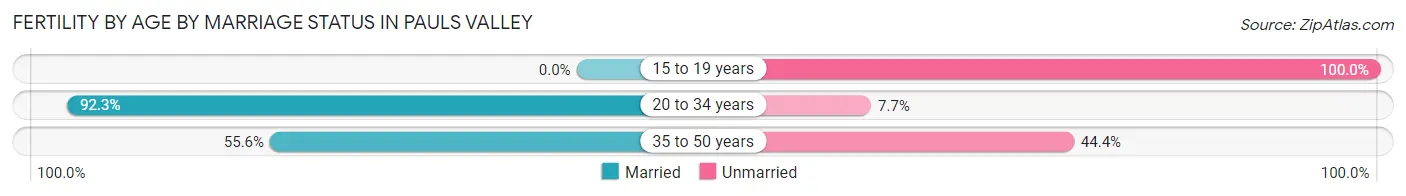
| Age Bracket | Married | Unmarried |
| 15 to 19 years | 0 (0.0%) | 6 (100.0%) |
| 20 to 34 years | 24 (92.3%) | 2 (7.7%) |
| 35 to 50 years | 20 (55.6%) | 16 (44.4%) |
| Total | 44 (64.7%) | 24 (35.3%) |
Fertility by Education in Pauls Valley
Average fertility rate in Pauls Valley is 50.0 births per 1,000 women. Women with the education attainment of graduate degree have the highest fertility rate of 152.0 births per 1,000 women, while women with the education attainment of college or associate's degree have the lowest fertility at 44.0 births per 1,000 women. Women with the education attainment of college or associate's degree represent 35.3% of all women with births.
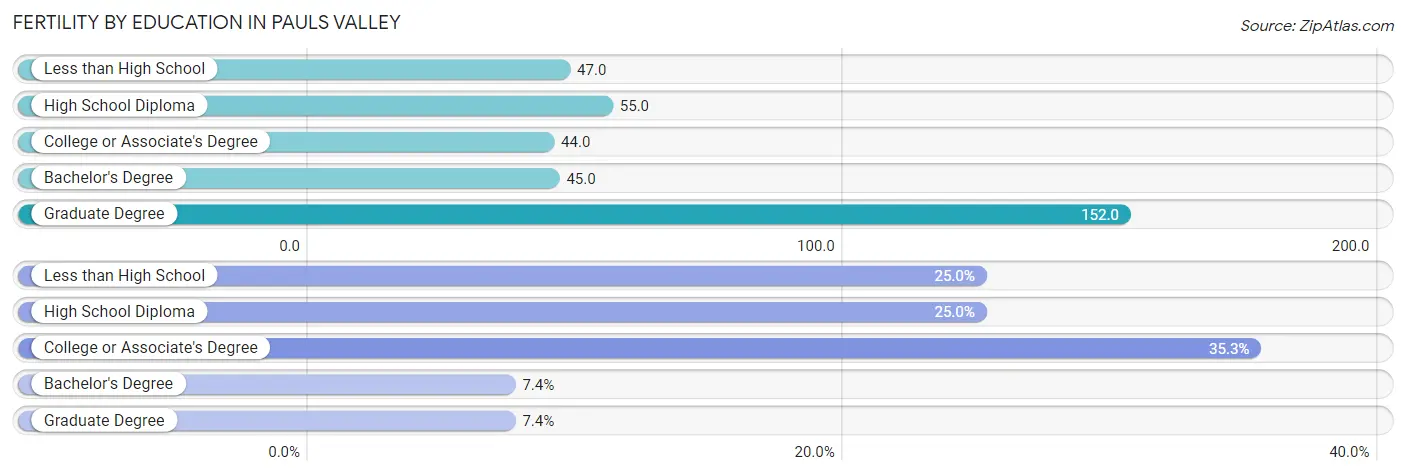
| Educational Attainment | Women with Births | Births / 1,000 Women |
| Less than High School | 17 (25.0%) | 47.0 |
| High School Diploma | 17 (25.0%) | 55.0 |
| College or Associate's Degree | 24 (35.3%) | 44.0 |
| Bachelor's Degree | 5 (7.3%) | 45.0 |
| Graduate Degree | 5 (7.3%) | 152.0 |
| Total | 68 (100.0%) | 50.0 |
Fertility by Education by Marriage Status in Pauls Valley
35.3% of women with births in Pauls Valley are unmarried. Women with the educational attainment of college or associate's degree are most likely to be married with 100.0% of them married at childbirth, while women with the educational attainment of high school diploma are least likely to be married with 100.0% of them unmarried at childbirth.
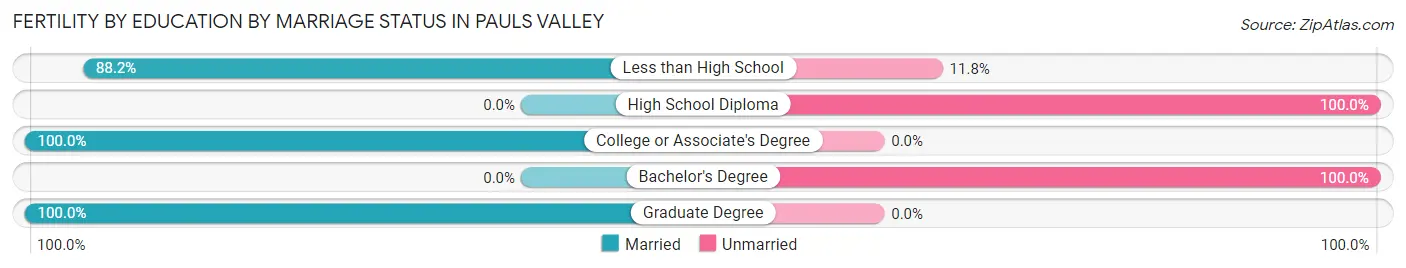
| Educational Attainment | Married | Unmarried |
| Less than High School | 15 (88.2%) | 2 (11.8%) |
| High School Diploma | 0 (0.0%) | 17 (100.0%) |
| College or Associate's Degree | 24 (100.0%) | 0 (0.0%) |
| Bachelor's Degree | 0 (0.0%) | 5 (100.0%) |
| Graduate Degree | 5 (100.0%) | 0 (0.0%) |
| Total | 44 (64.7%) | 24 (35.3%) |
Employment Characteristics in Pauls Valley
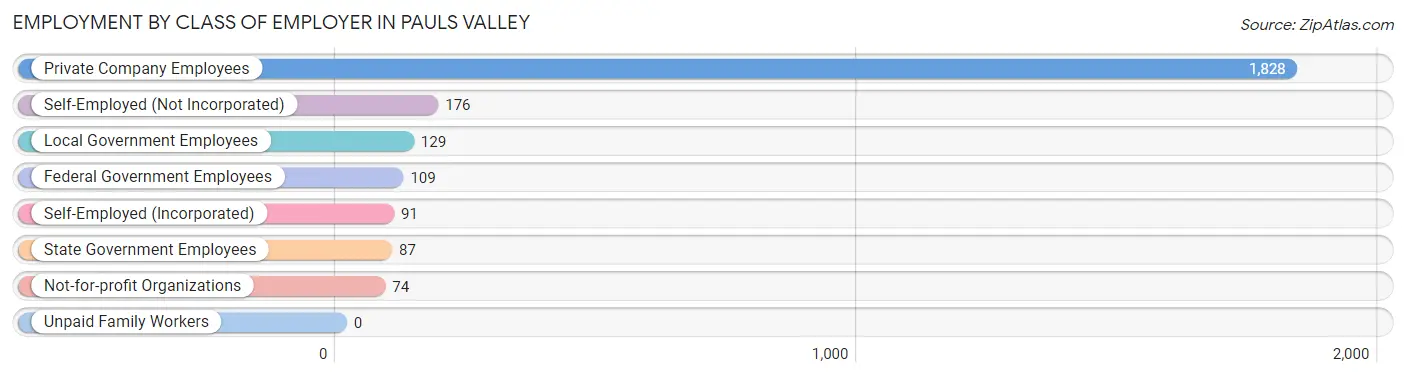
Employment by Class of Employer in Pauls Valley
Among the 2,494 employed individuals in Pauls Valley, private company employees (1,828 | 73.3%), self-employed (not incorporated) (176 | 7.1%), and local government employees (129 | 5.2%) make up the most common classes of employment.
| Employer Class | # Employees | % Employees |
| Private Company Employees | 1,828 | 73.3% |
| Self-Employed (Incorporated) | 91 | 3.6% |
| Self-Employed (Not Incorporated) | 176 | 7.1% |
| Not-for-profit Organizations | 74 | 3.0% |
| Local Government Employees | 129 | 5.2% |
| State Government Employees | 87 | 3.5% |
| Federal Government Employees | 109 | 4.4% |
| Unpaid Family Workers | 0 | 0.0% |
| Total | 2,494 | 100.0% |
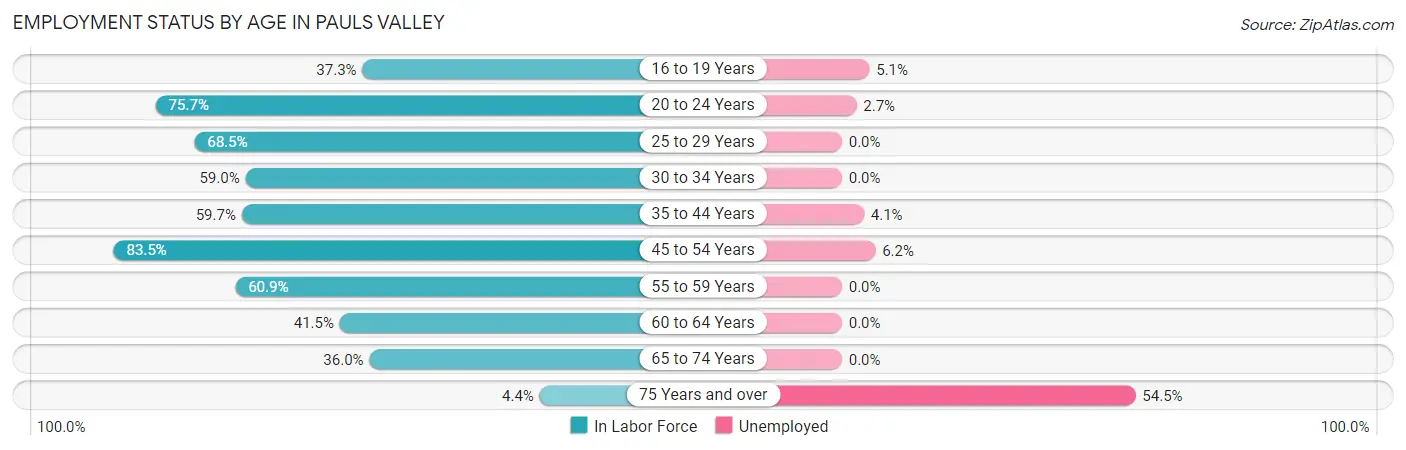
Employment Status by Age in Pauls Valley
According to the labor force statistics for Pauls Valley, out of the total population over 16 years of age (4,879), 53.7% or 2,620 individuals are in the labor force, with 3.1% or 81 of them unemployed. The age group with the highest labor force participation rate is 45 to 54 years, with 83.5% or 596 individuals in the labor force. Within the labor force, the 75 years and over age range has the highest percentage of unemployed individuals, with 54.5% or 12 of them being unemployed.
| Age Bracket | In Labor Force | Unemployed |
| 16 to 19 Years | 136 (37.3%) | 7 (5.1%) |
| 20 to 24 Years | 293 (75.7%) | 8 (2.7%) |
| 25 to 29 Years | 346 (68.5%) | 0 (0.0%) |
| 30 to 34 Years | 187 (59.0%) | 0 (0.0%) |
| 35 to 44 Years | 443 (59.7%) | 18 (4.1%) |
| 45 to 54 Years | 596 (83.5%) | 37 (6.2%) |
| 55 to 59 Years | 218 (60.9%) | 0 (0.0%) |
| 60 to 64 Years | 172 (41.5%) | 0 (0.0%) |
| 65 to 74 Years | 206 (36.0%) | 0 (0.0%) |
| 75 Years and over | 22 (4.4%) | 12 (54.5%) |
| Total | 2,620 (53.7%) | 81 (3.1%) |
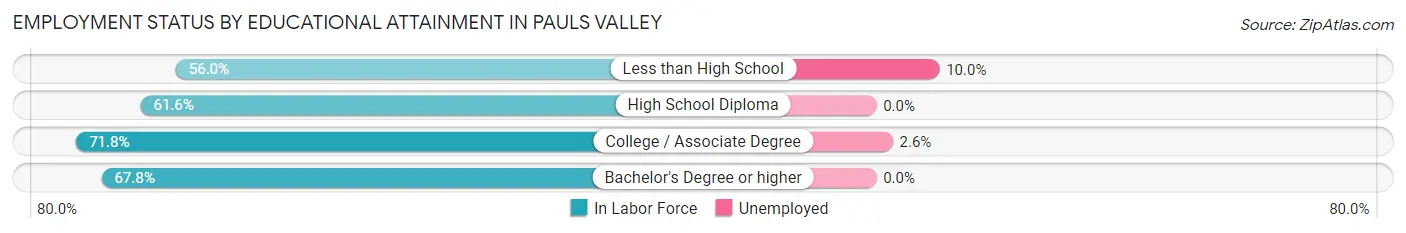
Employment Status by Educational Attainment in Pauls Valley
According to labor force statistics for Pauls Valley, 64.3% of individuals (1,961) out of the total population between 25 and 64 years of age (3,050) are in the labor force, with 2.8% or 55 of them being unemployed. The group with the highest labor force participation rate are those with the educational attainment of college / associate degree, with 71.8% or 694 individuals in the labor force. Within the labor force, individuals with less than high school education have the highest percentage of unemployment, with 10.0% or 37 of them being unemployed.
| Educational Attainment | In Labor Force | Unemployed |
| Less than High School | 370 (56.0%) | 66 (10.0%) |
| High School Diploma | 656 (61.6%) | 0 (0.0%) |
| College / Associate Degree | 694 (71.8%) | 25 (2.6%) |
| Bachelor's Degree or higher | 242 (67.8%) | 0 (0.0%) |
| Total | 1,961 (64.3%) | 85 (2.8%) |
Employment Occupations by Sex in Pauls Valley
Management, Business, Science and Arts Occupations
The most common Management, Business, Science and Arts occupations in Pauls Valley are Management (200 | 7.9%), Community & Social Service (175 | 6.9%), Health Diagnosing & Treating (109 | 4.3%), Education Instruction & Library (77 | 3.0%), and Education, Arts & Media (40 | 1.6%).
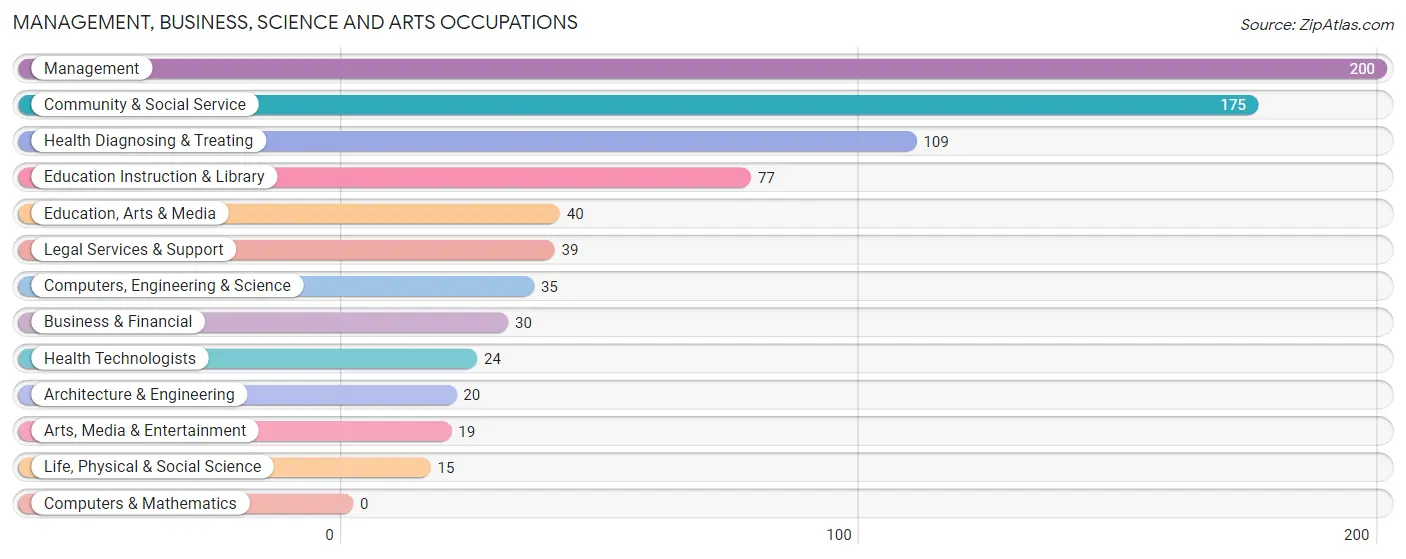
Management, Business, Science and Arts Occupations by Sex
Within the Management, Business, Science and Arts occupations in Pauls Valley, the most male-oriented occupations are Computers, Engineering & Science (100.0%), Architecture & Engineering (100.0%), and Life, Physical & Social Science (100.0%), while the most female-oriented occupations are Education, Arts & Media (100.0%), Education Instruction & Library (96.1%), and Health Technologists (91.7%).
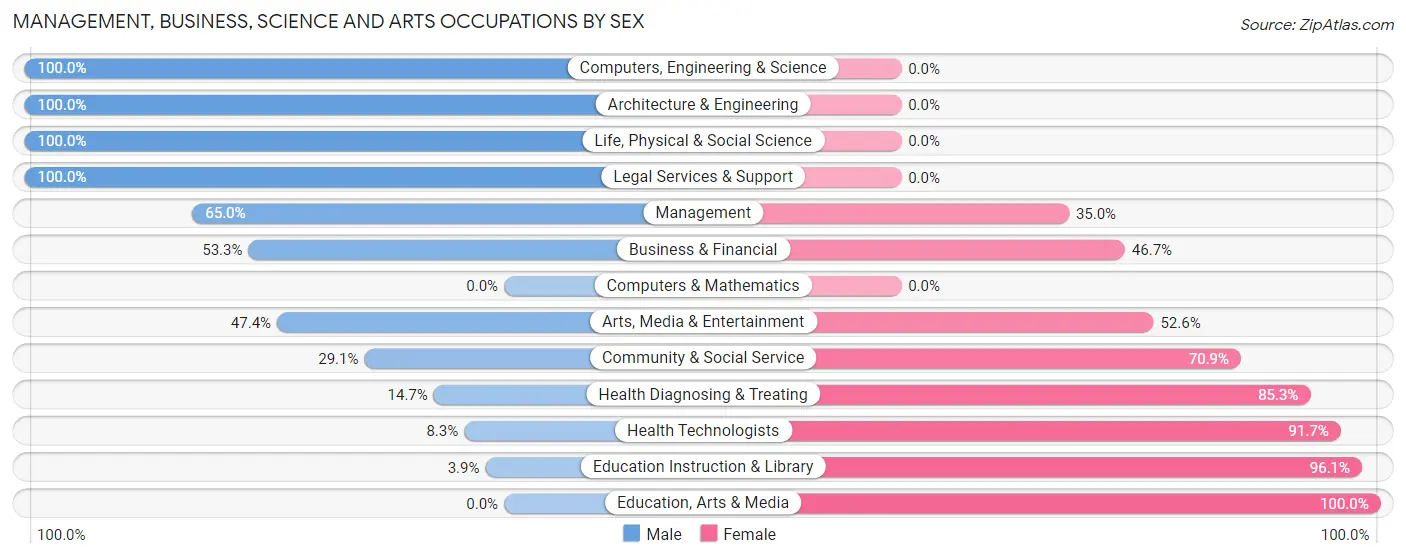
| Occupation | Male | Female |
| Management | 130 (65.0%) | 70 (35.0%) |
| Business & Financial | 16 (53.3%) | 14 (46.7%) |
| Computers, Engineering & Science | 35 (100.0%) | 0 (0.0%) |
| Computers & Mathematics | 0 (0.0%) | 0 (0.0%) |
| Architecture & Engineering | 20 (100.0%) | 0 (0.0%) |
| Life, Physical & Social Science | 15 (100.0%) | 0 (0.0%) |
| Community & Social Service | 51 (29.1%) | 124 (70.9%) |
| Education, Arts & Media | 0 (0.0%) | 40 (100.0%) |
| Legal Services & Support | 39 (100.0%) | 0 (0.0%) |
| Education Instruction & Library | 3 (3.9%) | 74 (96.1%) |
| Arts, Media & Entertainment | 9 (47.4%) | 10 (52.6%) |
| Health Diagnosing & Treating | 16 (14.7%) | 93 (85.3%) |
| Health Technologists | 2 (8.3%) | 22 (91.7%) |
| Total (Category) | 248 (45.2%) | 301 (54.8%) |
| Total (Overall) | 1,429 (56.3%) | 1,108 (43.7%) |
Services Occupations
The most common Services occupations in Pauls Valley are Food Preparation & Serving (347 | 13.7%), Security & Protection (71 | 2.8%), Firefighting & Prevention (58 | 2.3%), Cleaning & Maintenance (56 | 2.2%), and Personal Care & Service (40 | 1.6%).
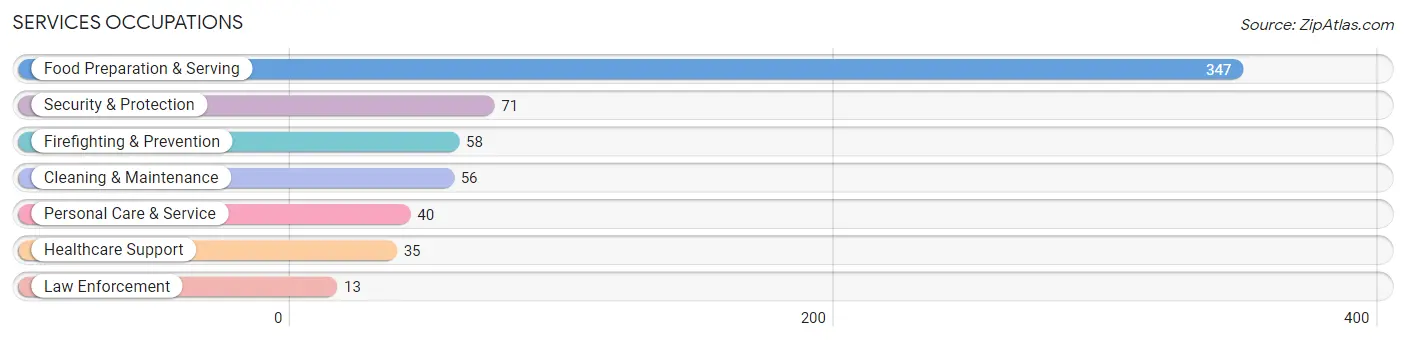
Services Occupations by Sex
Within the Services occupations in Pauls Valley, the most male-oriented occupations are Security & Protection (100.0%), Firefighting & Prevention (100.0%), and Law Enforcement (100.0%), while the most female-oriented occupations are Healthcare Support (100.0%), Personal Care & Service (100.0%), and Food Preparation & Serving (67.7%).
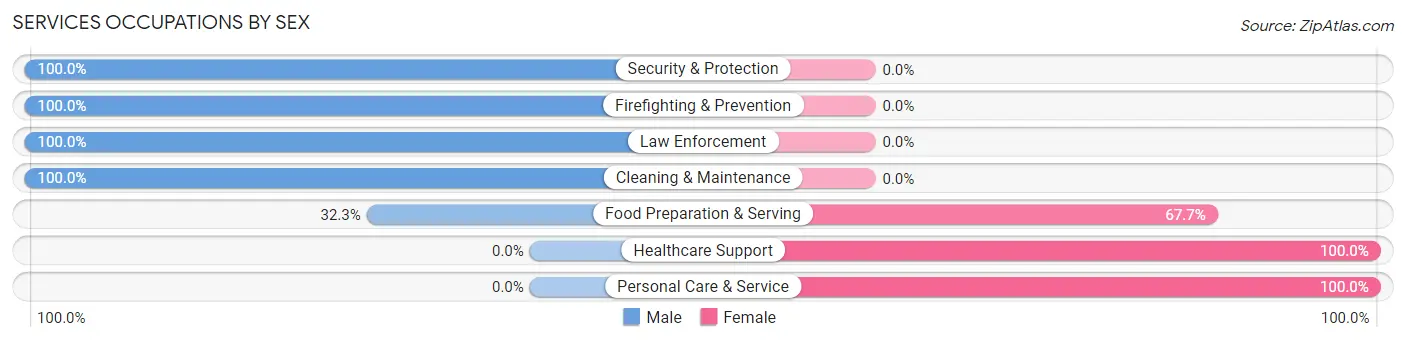
| Occupation | Male | Female |
| Healthcare Support | 0 (0.0%) | 35 (100.0%) |
| Security & Protection | 71 (100.0%) | 0 (0.0%) |
| Firefighting & Prevention | 58 (100.0%) | 0 (0.0%) |
| Law Enforcement | 13 (100.0%) | 0 (0.0%) |
| Food Preparation & Serving | 112 (32.3%) | 235 (67.7%) |
| Cleaning & Maintenance | 56 (100.0%) | 0 (0.0%) |
| Personal Care & Service | 0 (0.0%) | 40 (100.0%) |
| Total (Category) | 239 (43.5%) | 310 (56.5%) |
| Total (Overall) | 1,429 (56.3%) | 1,108 (43.7%) |
Sales and Office Occupations
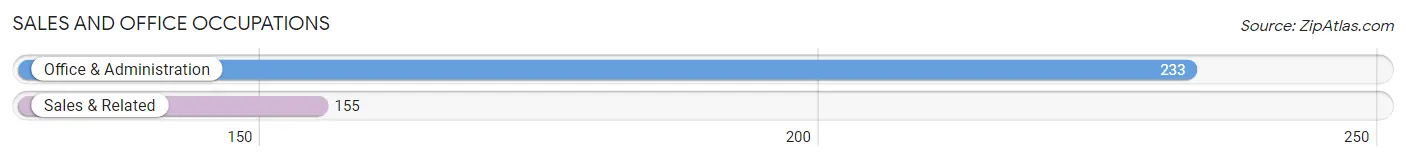
The most common Sales and Office occupations in Pauls Valley are Office & Administration (233 | 9.2%), and Sales & Related (155 | 6.1%).
Sales and Office Occupations by Sex
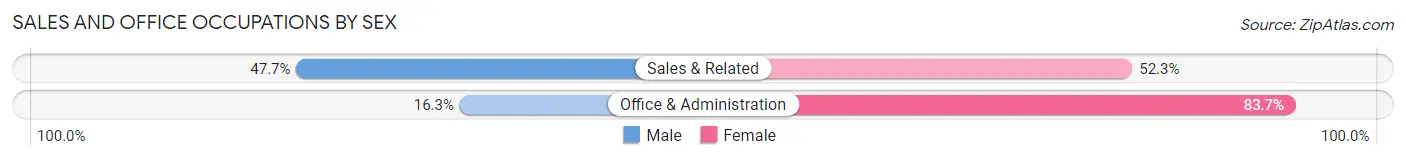
| Occupation | Male | Female |
| Sales & Related | 74 (47.7%) | 81 (52.3%) |
| Office & Administration | 38 (16.3%) | 195 (83.7%) |
| Total (Category) | 112 (28.9%) | 276 (71.1%) |
| Total (Overall) | 1,429 (56.3%) | 1,108 (43.7%) |
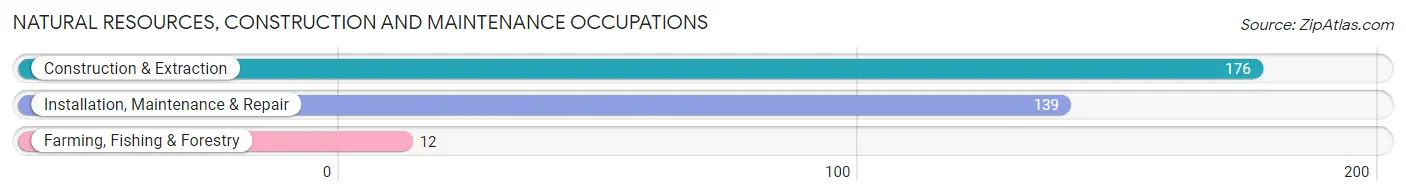
Natural Resources, Construction and Maintenance Occupations
The most common Natural Resources, Construction and Maintenance occupations in Pauls Valley are Construction & Extraction (176 | 6.9%), Installation, Maintenance & Repair (139 | 5.5%), and Farming, Fishing & Forestry (12 | 0.5%).
Natural Resources, Construction and Maintenance Occupations by Sex
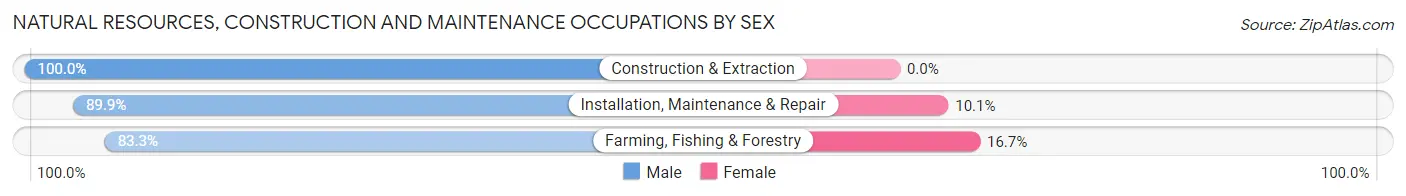
| Occupation | Male | Female |
| Farming, Fishing & Forestry | 10 (83.3%) | 2 (16.7%) |
| Construction & Extraction | 176 (100.0%) | 0 (0.0%) |
| Installation, Maintenance & Repair | 125 (89.9%) | 14 (10.1%) |
| Total (Category) | 311 (95.1%) | 16 (4.9%) |
| Total (Overall) | 1,429 (56.3%) | 1,108 (43.7%) |
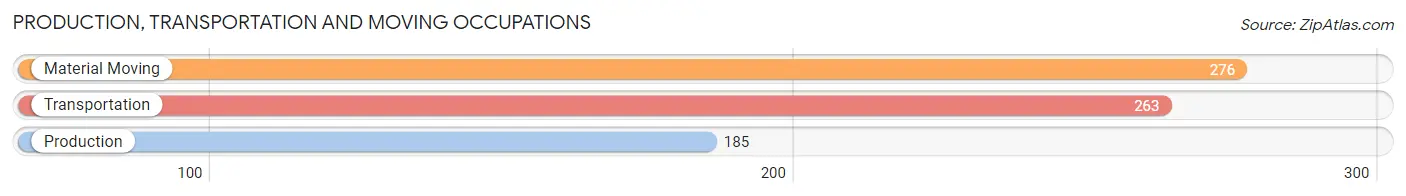
Production, Transportation and Moving Occupations
The most common Production, Transportation and Moving occupations in Pauls Valley are Material Moving (276 | 10.9%), Transportation (263 | 10.4%), and Production (185 | 7.3%).
Production, Transportation and Moving Occupations by Sex
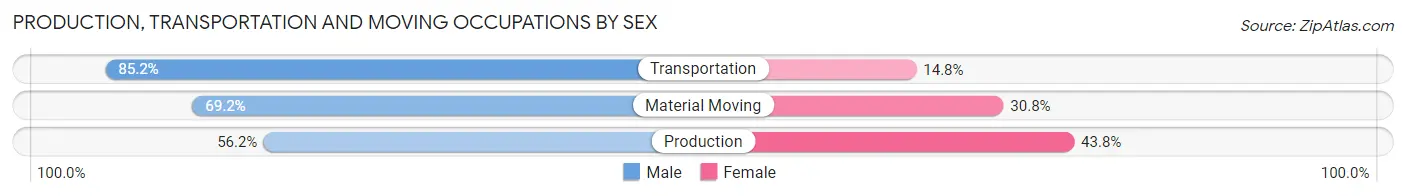
| Occupation | Male | Female |
| Production | 104 (56.2%) | 81 (43.8%) |
| Transportation | 224 (85.2%) | 39 (14.8%) |
| Material Moving | 191 (69.2%) | 85 (30.8%) |
| Total (Category) | 519 (71.7%) | 205 (28.3%) |
| Total (Overall) | 1,429 (56.3%) | 1,108 (43.7%) |
Employment Industries by Sex in Pauls Valley
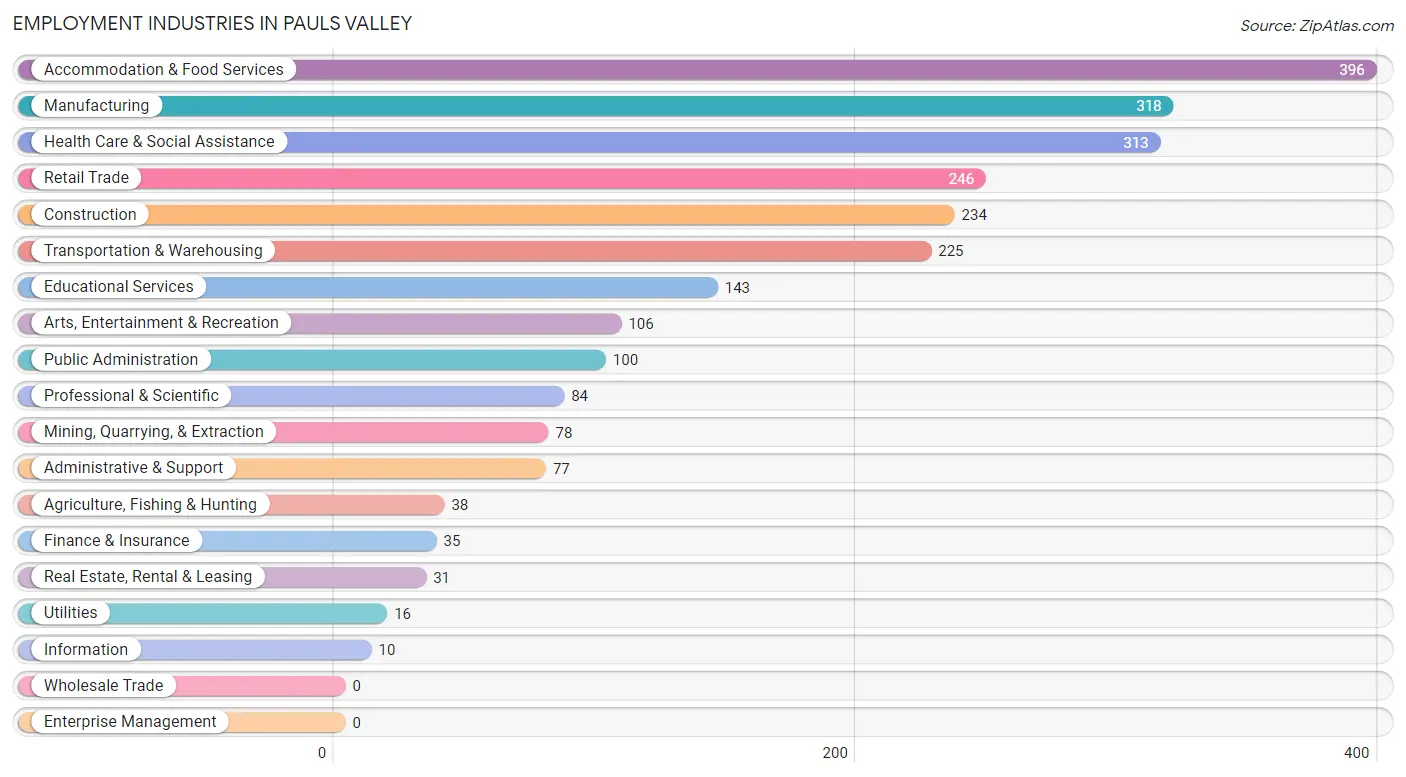
Employment Industries in Pauls Valley
The major employment industries in Pauls Valley include Accommodation & Food Services (396 | 15.6%), Manufacturing (318 | 12.5%), Health Care & Social Assistance (313 | 12.3%), Retail Trade (246 | 9.7%), and Construction (234 | 9.2%).
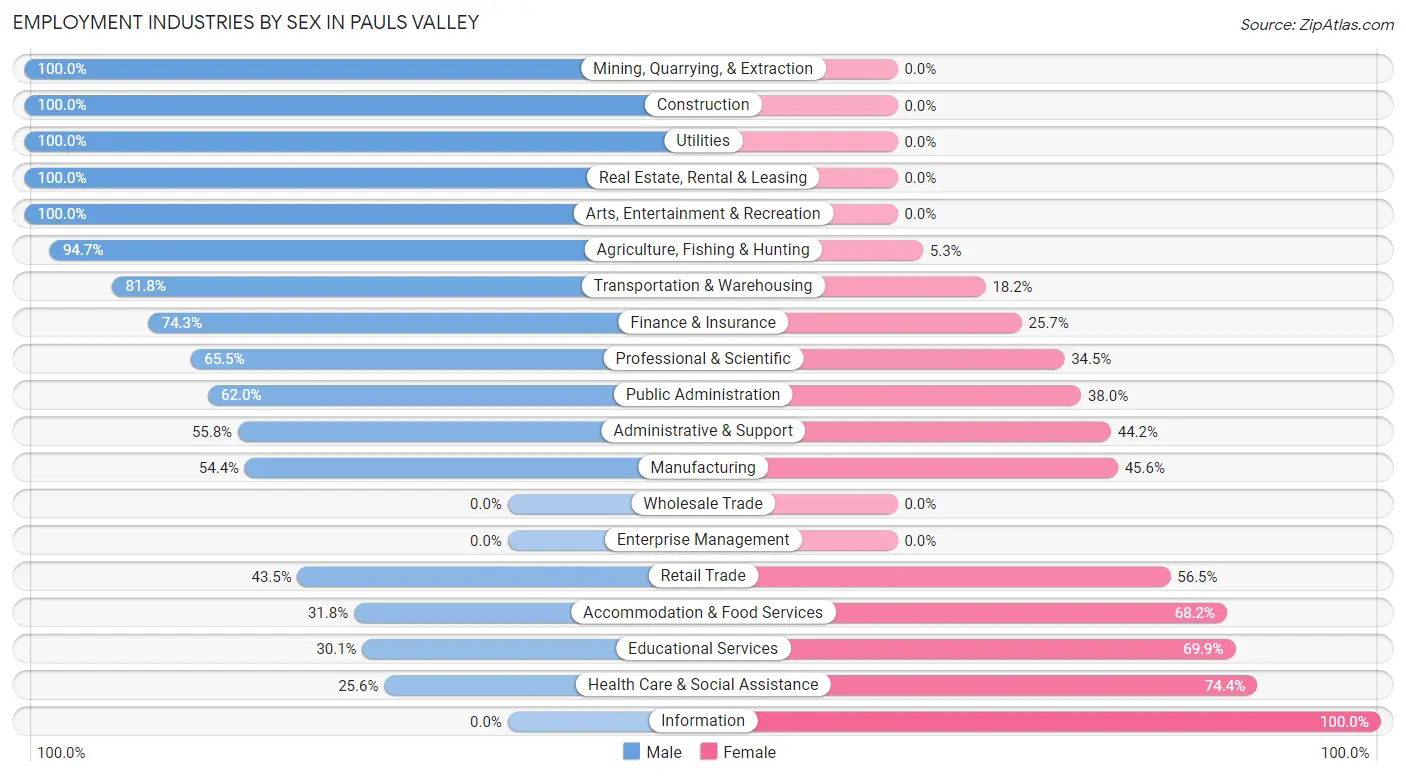
Employment Industries by Sex in Pauls Valley
The Pauls Valley industries that see more men than women are Mining, Quarrying, & Extraction (100.0%), Construction (100.0%), and Utilities (100.0%), whereas the industries that tend to have a higher number of women are Information (100.0%), Health Care & Social Assistance (74.4%), and Educational Services (69.9%).
| Industry | Male | Female |
| Agriculture, Fishing & Hunting | 36 (94.7%) | 2 (5.3%) |
| Mining, Quarrying, & Extraction | 78 (100.0%) | 0 (0.0%) |
| Construction | 234 (100.0%) | 0 (0.0%) |
| Manufacturing | 173 (54.4%) | 145 (45.6%) |
| Wholesale Trade | 0 (0.0%) | 0 (0.0%) |
| Retail Trade | 107 (43.5%) | 139 (56.5%) |
| Transportation & Warehousing | 184 (81.8%) | 41 (18.2%) |
| Utilities | 16 (100.0%) | 0 (0.0%) |
| Information | 0 (0.0%) | 10 (100.0%) |
| Finance & Insurance | 26 (74.3%) | 9 (25.7%) |
| Real Estate, Rental & Leasing | 31 (100.0%) | 0 (0.0%) |
| Professional & Scientific | 55 (65.5%) | 29 (34.5%) |
| Enterprise Management | 0 (0.0%) | 0 (0.0%) |
| Administrative & Support | 43 (55.8%) | 34 (44.2%) |
| Educational Services | 43 (30.1%) | 100 (69.9%) |
| Health Care & Social Assistance | 80 (25.6%) | 233 (74.4%) |
| Arts, Entertainment & Recreation | 106 (100.0%) | 0 (0.0%) |
| Accommodation & Food Services | 126 (31.8%) | 270 (68.2%) |
| Public Administration | 62 (62.0%) | 38 (38.0%) |
| Total | 1,429 (56.3%) | 1,108 (43.7%) |
Education in Pauls Valley
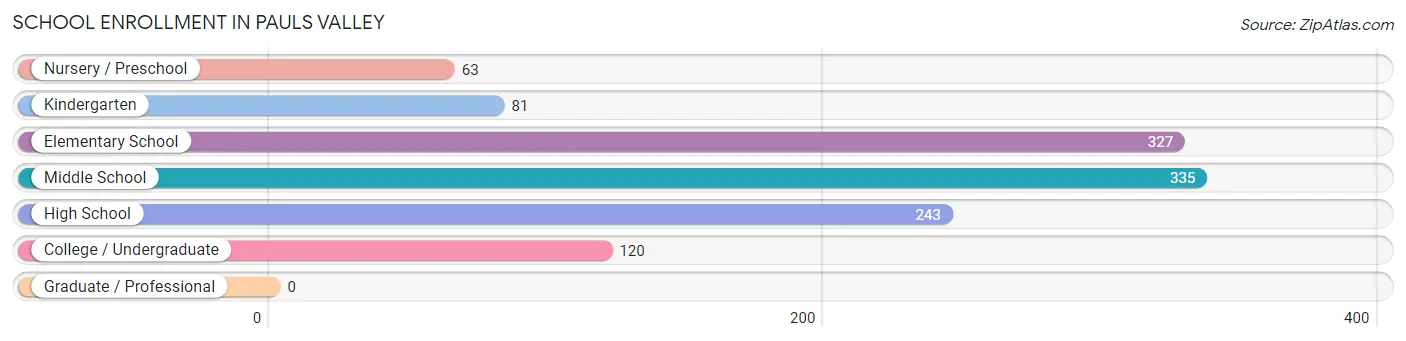
School Enrollment in Pauls Valley
The most common levels of schooling among the 1,169 students in Pauls Valley are middle school (335 | 28.7%), elementary school (327 | 28.0%), and high school (243 | 20.8%).
| School Level | # Students | % Students |
| Nursery / Preschool | 63 | 5.4% |
| Kindergarten | 81 | 6.9% |
| Elementary School | 327 | 28.0% |
| Middle School | 335 | 28.7% |
| High School | 243 | 20.8% |
| College / Undergraduate | 120 | 10.3% |
| Graduate / Professional | 0 | 0.0% |
| Total | 1,169 | 100.0% |
School Enrollment by Age by Funding Source in Pauls Valley
Out of a total of 1,169 students who are enrolled in schools in Pauls Valley, 25 (2.1%) attend a private institution, while the remaining 1,144 (97.9%) are enrolled in public schools. The age group of 35 years and over has the highest likelihood of being enrolled in private schools, with 6 (18.2% in the age bracket) enrolled. Conversely, the age group of 3 to 4 year olds has the lowest likelihood of being enrolled in a private school, with 59 (100.0% in the age bracket) attending a public institution.
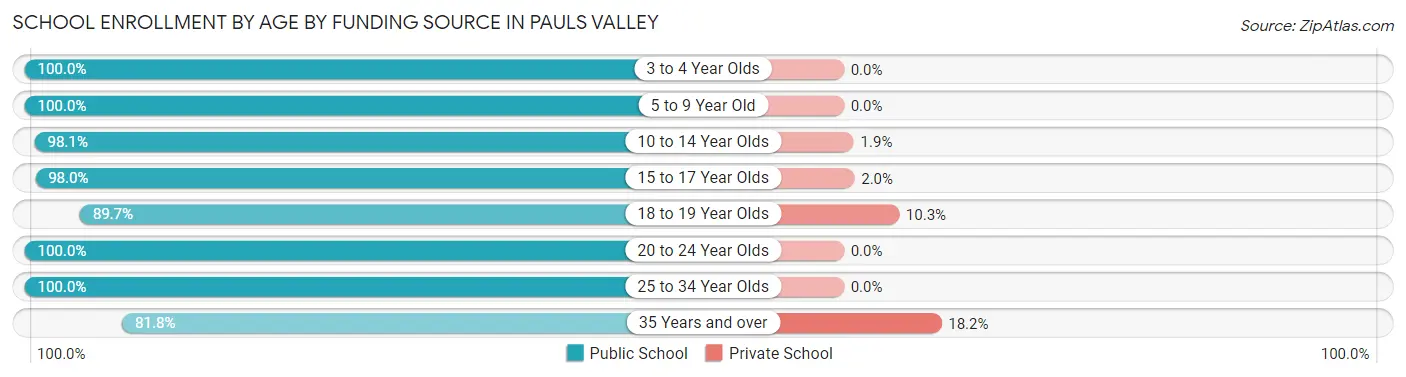
| Age Bracket | Public School | Private School |
| 3 to 4 Year Olds | 59 (100.0%) | 0 (0.0%) |
| 5 to 9 Year Old | 272 (100.0%) | 0 (0.0%) |
| 10 to 14 Year Olds | 422 (98.1%) | 8 (1.9%) |
| 15 to 17 Year Olds | 198 (98.0%) | 4 (2.0%) |
| 18 to 19 Year Olds | 61 (89.7%) | 7 (10.3%) |
| 20 to 24 Year Olds | 40 (100.0%) | 0 (0.0%) |
| 25 to 34 Year Olds | 65 (100.0%) | 0 (0.0%) |
| 35 Years and over | 27 (81.8%) | 6 (18.2%) |
| Total | 1,144 (97.9%) | 25 (2.1%) |
Educational Attainment by Field of Study in Pauls Valley
Education (210 | 28.2%), business (104 | 14.0%), arts & humanities (86 | 11.6%), science & technology (70 | 9.4%), and visual & performing arts (60 | 8.1%) are the most common fields of study among 744 individuals in Pauls Valley who have obtained a bachelor's degree or higher.
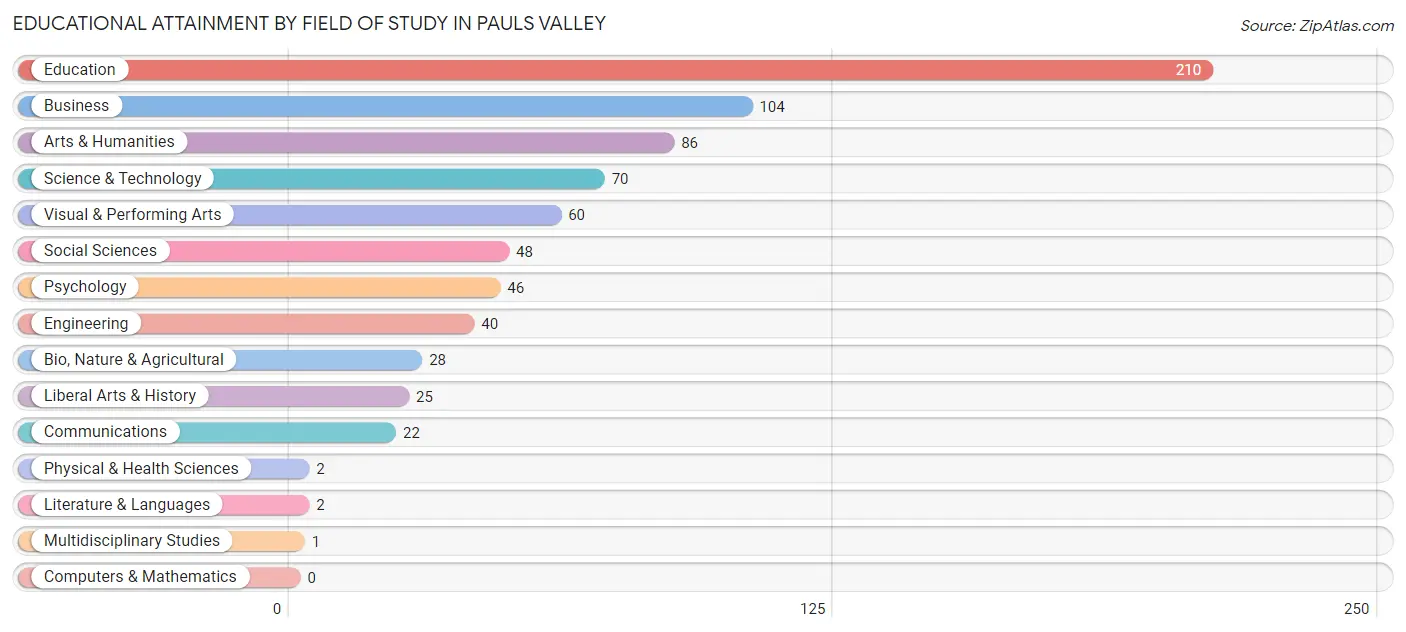
| Field of Study | # Graduates | % Graduates |
| Computers & Mathematics | 0 | 0.0% |
| Bio, Nature & Agricultural | 28 | 3.8% |
| Physical & Health Sciences | 2 | 0.3% |
| Psychology | 46 | 6.2% |
| Social Sciences | 48 | 6.5% |
| Engineering | 40 | 5.4% |
| Multidisciplinary Studies | 1 | 0.1% |
| Science & Technology | 70 | 9.4% |
| Business | 104 | 14.0% |
| Education | 210 | 28.2% |
| Literature & Languages | 2 | 0.3% |
| Liberal Arts & History | 25 | 3.4% |
| Visual & Performing Arts | 60 | 8.1% |
| Communications | 22 | 3.0% |
| Arts & Humanities | 86 | 11.6% |
| Total | 744 | 100.0% |
Transportation & Commute in Pauls Valley
Vehicle Availability by Sex in Pauls Valley
The most prevalent vehicle ownership categories in Pauls Valley are males with 2 vehicles (568, accounting for 40.8%) and females with 2 vehicles (500, making up 51.9%).
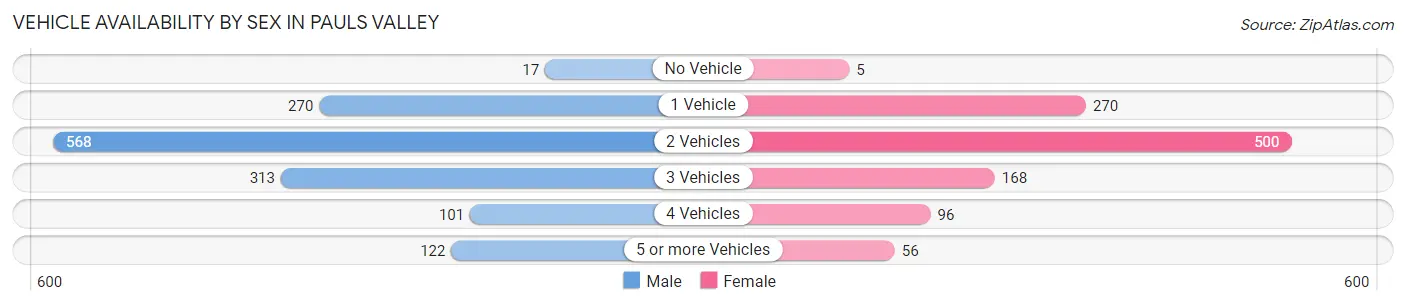
| Vehicles Available | Male | Female |
| No Vehicle | 17 (1.2%) | 5 (0.5%) |
| 1 Vehicle | 270 (19.4%) | 270 (24.7%) |
| 2 Vehicles | 568 (40.8%) | 500 (45.7%) |
| 3 Vehicles | 313 (22.5%) | 168 (15.3%) |
| 4 Vehicles | 101 (7.3%) | 96 (8.8%) |
| 5 or more Vehicles | 122 (8.8%) | 56 (5.1%) |
| Total | 1,391 (100.0%) | 1,095 (100.0%) |
Commute Time in Pauls Valley
The most frequently occuring commute durations in Pauls Valley are 10 to 14 minutes (650 commuters, 27.1%), 5 to 9 minutes (415 commuters, 17.3%), and 60 to 89 minutes (229 commuters, 9.5%).
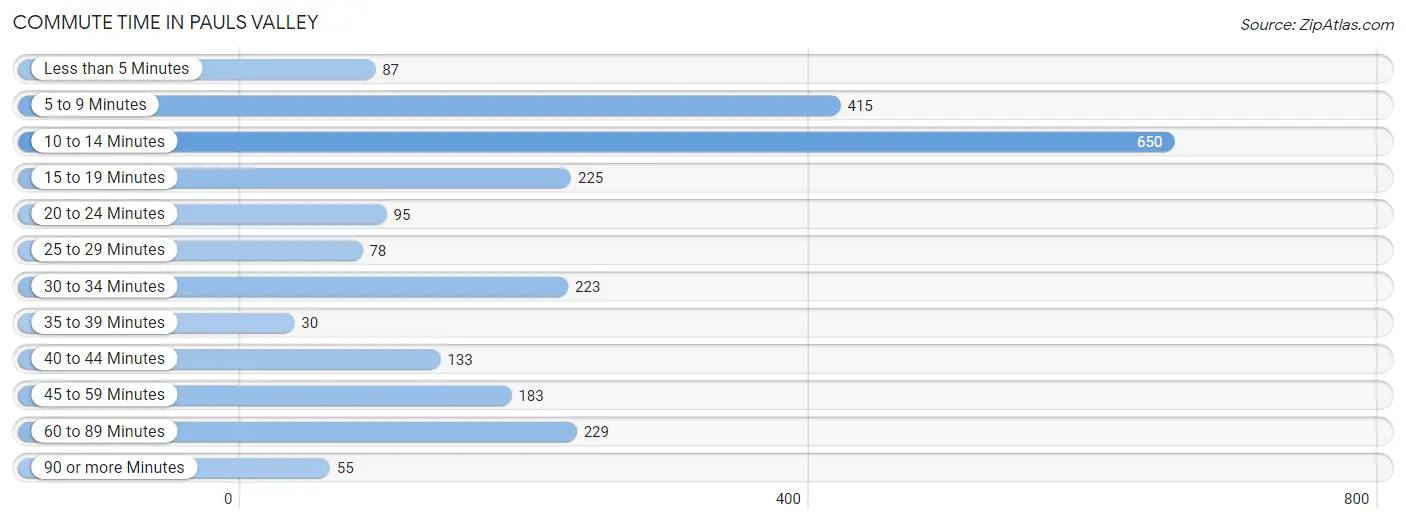
| Commute Time | # Commuters | % Commuters |
| Less than 5 Minutes | 87 | 3.6% |
| 5 to 9 Minutes | 415 | 17.3% |
| 10 to 14 Minutes | 650 | 27.1% |
| 15 to 19 Minutes | 225 | 9.4% |
| 20 to 24 Minutes | 95 | 4.0% |
| 25 to 29 Minutes | 78 | 3.3% |
| 30 to 34 Minutes | 223 | 9.3% |
| 35 to 39 Minutes | 30 | 1.3% |
| 40 to 44 Minutes | 133 | 5.5% |
| 45 to 59 Minutes | 183 | 7.6% |
| 60 to 89 Minutes | 229 | 9.5% |
| 90 or more Minutes | 55 | 2.3% |
Commute Time by Sex in Pauls Valley
The most common commute times in Pauls Valley are 10 to 14 minutes (290 commuters, 21.1%) for males and 10 to 14 minutes (360 commuters, 35.0%) for females.
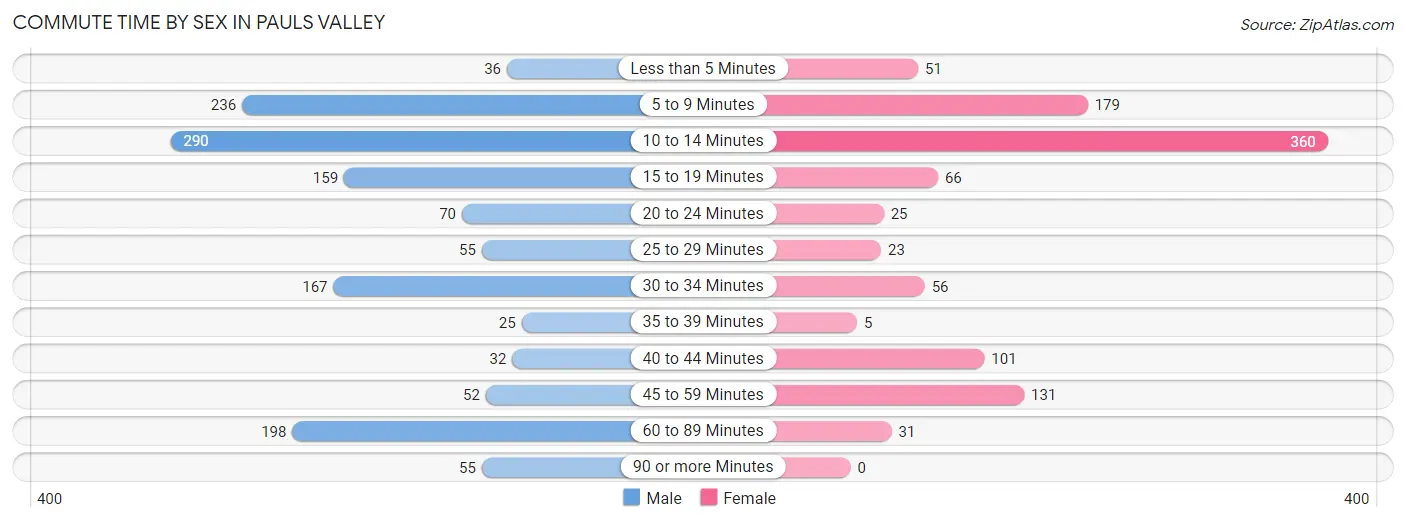
| Commute Time | Male | Female |
| Less than 5 Minutes | 36 (2.6%) | 51 (5.0%) |
| 5 to 9 Minutes | 236 (17.2%) | 179 (17.4%) |
| 10 to 14 Minutes | 290 (21.1%) | 360 (35.0%) |
| 15 to 19 Minutes | 159 (11.6%) | 66 (6.4%) |
| 20 to 24 Minutes | 70 (5.1%) | 25 (2.4%) |
| 25 to 29 Minutes | 55 (4.0%) | 23 (2.2%) |
| 30 to 34 Minutes | 167 (12.1%) | 56 (5.4%) |
| 35 to 39 Minutes | 25 (1.8%) | 5 (0.5%) |
| 40 to 44 Minutes | 32 (2.3%) | 101 (9.8%) |
| 45 to 59 Minutes | 52 (3.8%) | 131 (12.7%) |
| 60 to 89 Minutes | 198 (14.4%) | 31 (3.0%) |
| 90 or more Minutes | 55 (4.0%) | 0 (0.0%) |
Time of Departure to Work by Sex in Pauls Valley
The most frequent times of departure to work in Pauls Valley are 6:00 AM to 6:29 AM (208, 15.1%) for males and 7:30 AM to 7:59 AM (174, 16.9%) for females.
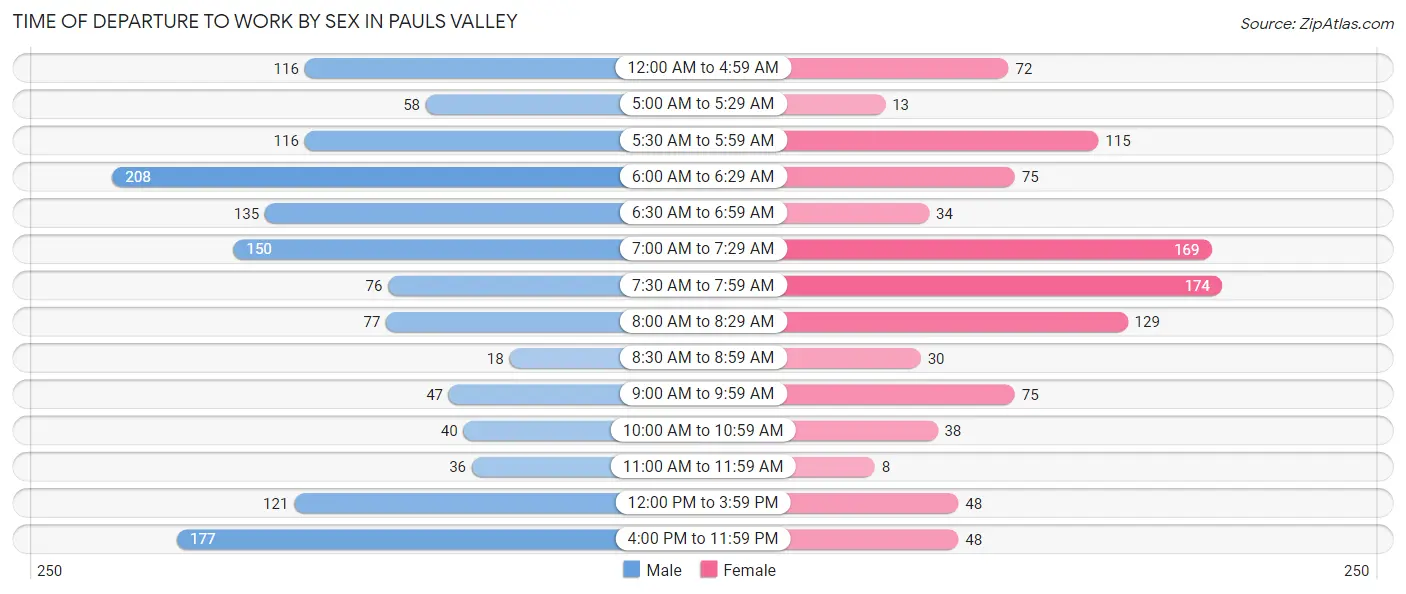
| Time of Departure | Male | Female |
| 12:00 AM to 4:59 AM | 116 (8.4%) | 72 (7.0%) |
| 5:00 AM to 5:29 AM | 58 (4.2%) | 13 (1.3%) |
| 5:30 AM to 5:59 AM | 116 (8.4%) | 115 (11.2%) |
| 6:00 AM to 6:29 AM | 208 (15.1%) | 75 (7.3%) |
| 6:30 AM to 6:59 AM | 135 (9.8%) | 34 (3.3%) |
| 7:00 AM to 7:29 AM | 150 (10.9%) | 169 (16.4%) |
| 7:30 AM to 7:59 AM | 76 (5.5%) | 174 (16.9%) |
| 8:00 AM to 8:29 AM | 77 (5.6%) | 129 (12.6%) |
| 8:30 AM to 8:59 AM | 18 (1.3%) | 30 (2.9%) |
| 9:00 AM to 9:59 AM | 47 (3.4%) | 75 (7.3%) |
| 10:00 AM to 10:59 AM | 40 (2.9%) | 38 (3.7%) |
| 11:00 AM to 11:59 AM | 36 (2.6%) | 8 (0.8%) |
| 12:00 PM to 3:59 PM | 121 (8.8%) | 48 (4.7%) |
| 4:00 PM to 11:59 PM | 177 (12.9%) | 48 (4.7%) |
| Total | 1,375 (100.0%) | 1,028 (100.0%) |
Housing Occupancy in Pauls Valley
Occupancy by Ownership in Pauls Valley
Of the total 2,412 dwellings in Pauls Valley, owner-occupied units account for 1,273 (52.8%), while renter-occupied units make up 1,139 (47.2%).
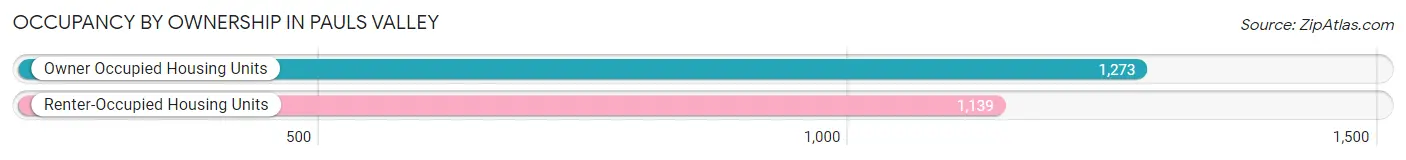
| Occupancy | # Housing Units | % Housing Units |
| Owner Occupied Housing Units | 1,273 | 52.8% |
| Renter-Occupied Housing Units | 1,139 | 47.2% |
| Total Occupied Housing Units | 2,412 | 100.0% |
Occupancy by Household Size in Pauls Valley
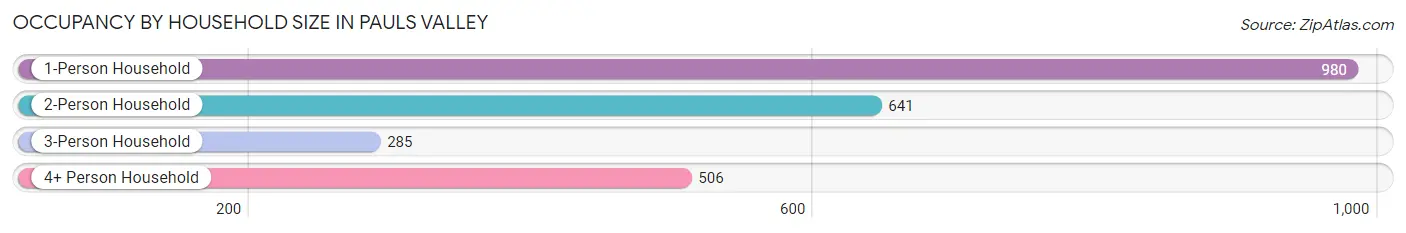
| Household Size | # Housing Units | % Housing Units |
| 1-Person Household | 980 | 40.6% |
| 2-Person Household | 641 | 26.6% |
| 3-Person Household | 285 | 11.8% |
| 4+ Person Household | 506 | 21.0% |
| Total Housing Units | 2,412 | 100.0% |
Occupancy by Ownership by Household Size in Pauls Valley
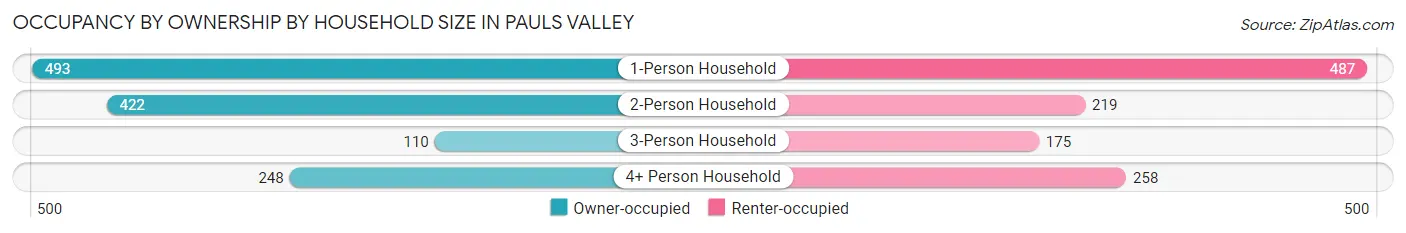
| Household Size | Owner-occupied | Renter-occupied |
| 1-Person Household | 493 (50.3%) | 487 (49.7%) |
| 2-Person Household | 422 (65.8%) | 219 (34.2%) |
| 3-Person Household | 110 (38.6%) | 175 (61.4%) |
| 4+ Person Household | 248 (49.0%) | 258 (51.0%) |
| Total Housing Units | 1,273 (52.8%) | 1,139 (47.2%) |
Occupancy by Educational Attainment in Pauls Valley
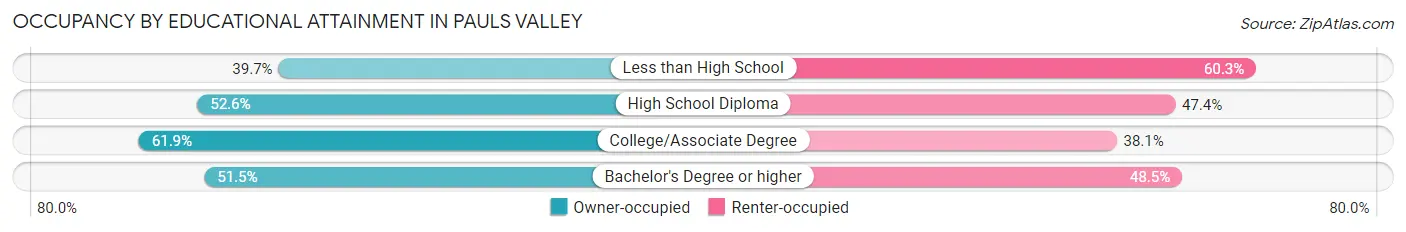
| Household Size | Owner-occupied | Renter-occupied |
| Less than High School | 184 (39.7%) | 279 (60.3%) |
| High School Diploma | 425 (52.6%) | 383 (47.4%) |
| College/Associate Degree | 456 (61.9%) | 281 (38.1%) |
| Bachelor's Degree or higher | 208 (51.5%) | 196 (48.5%) |
Occupancy by Age of Householder in Pauls Valley
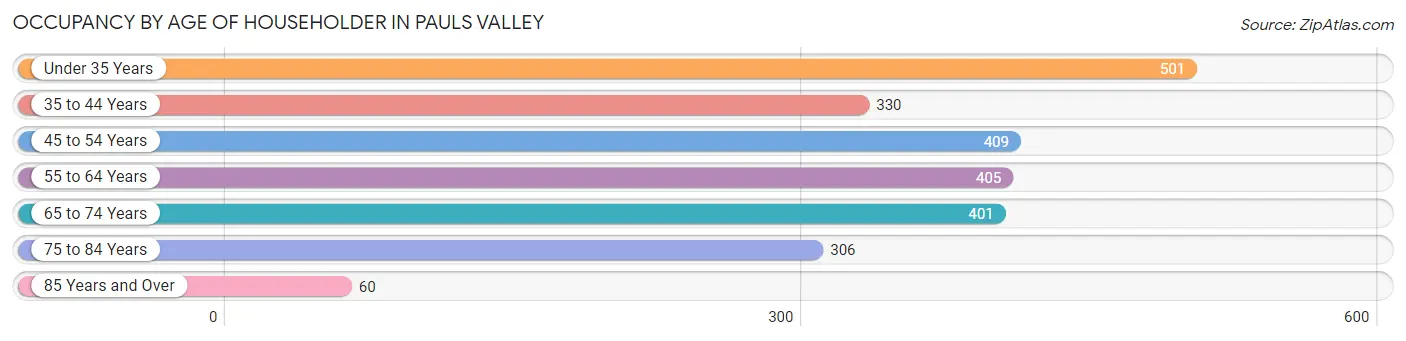
| Age Bracket | # Households | % Households |
| Under 35 Years | 501 | 20.8% |
| 35 to 44 Years | 330 | 13.7% |
| 45 to 54 Years | 409 | 17.0% |
| 55 to 64 Years | 405 | 16.8% |
| 65 to 74 Years | 401 | 16.6% |
| 75 to 84 Years | 306 | 12.7% |
| 85 Years and Over | 60 | 2.5% |
| Total | 2,412 | 100.0% |
Housing Finances in Pauls Valley
Median Income by Occupancy in Pauls Valley
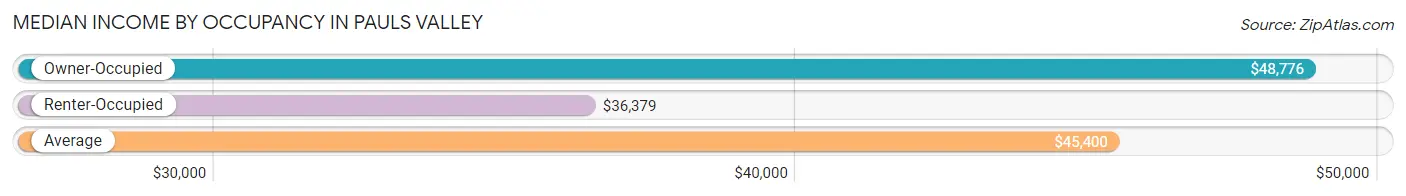
| Occupancy Type | # Households | Median Income |
| Owner-Occupied | 1,273 (52.8%) | $48,776 |
| Renter-Occupied | 1,139 (47.2%) | $36,379 |
| Average | 2,412 (100.0%) | $45,400 |
Occupancy by Householder Income Bracket in Pauls Valley
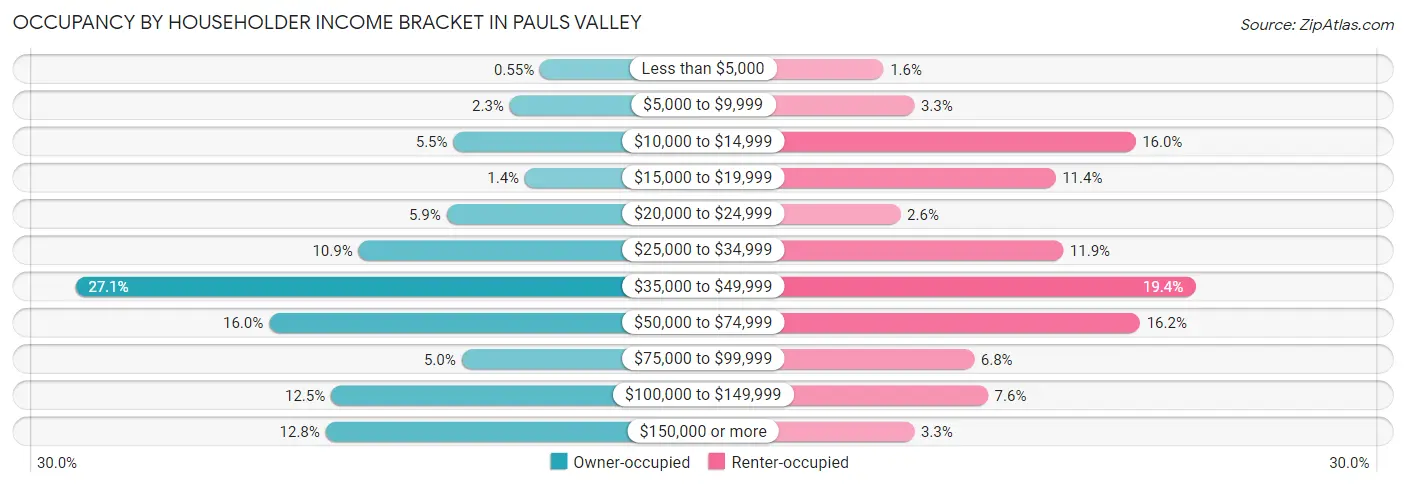
| Income Bracket | Owner-occupied | Renter-occupied |
| Less than $5,000 | 7 (0.5%) | 18 (1.6%) |
| $5,000 to $9,999 | 29 (2.3%) | 38 (3.3%) |
| $10,000 to $14,999 | 70 (5.5%) | 182 (16.0%) |
| $15,000 to $19,999 | 18 (1.4%) | 130 (11.4%) |
| $20,000 to $24,999 | 75 (5.9%) | 29 (2.5%) |
| $25,000 to $34,999 | 139 (10.9%) | 135 (11.8%) |
| $35,000 to $49,999 | 345 (27.1%) | 221 (19.4%) |
| $50,000 to $74,999 | 204 (16.0%) | 185 (16.2%) |
| $75,000 to $99,999 | 64 (5.0%) | 77 (6.8%) |
| $100,000 to $149,999 | 159 (12.5%) | 86 (7.5%) |
| $150,000 or more | 163 (12.8%) | 38 (3.3%) |
| Total | 1,273 (100.0%) | 1,139 (100.0%) |
Monthly Housing Cost Tiers in Pauls Valley
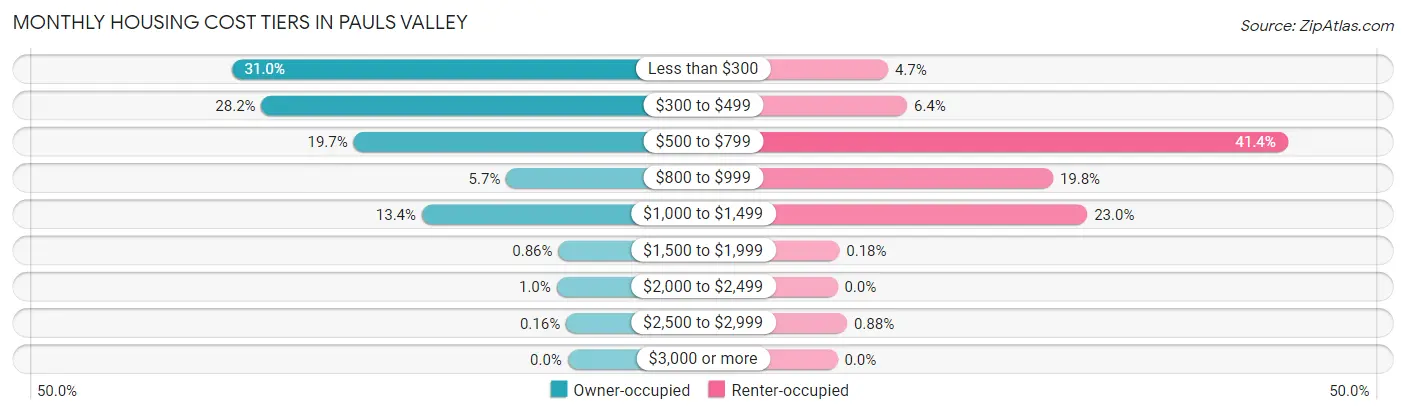
| Monthly Cost | Owner-occupied | Renter-occupied |
| Less than $300 | 394 (30.9%) | 53 (4.6%) |
| $300 to $499 | 359 (28.2%) | 73 (6.4%) |
| $500 to $799 | 251 (19.7%) | 472 (41.4%) |
| $800 to $999 | 72 (5.7%) | 226 (19.8%) |
| $1,000 to $1,499 | 171 (13.4%) | 262 (23.0%) |
| $1,500 to $1,999 | 11 (0.9%) | 2 (0.2%) |
| $2,000 to $2,499 | 13 (1.0%) | 0 (0.0%) |
| $2,500 to $2,999 | 2 (0.2%) | 10 (0.9%) |
| $3,000 or more | 0 (0.0%) | 0 (0.0%) |
| Total | 1,273 (100.0%) | 1,139 (100.0%) |
Physical Housing Characteristics in Pauls Valley
Housing Structures in Pauls Valley
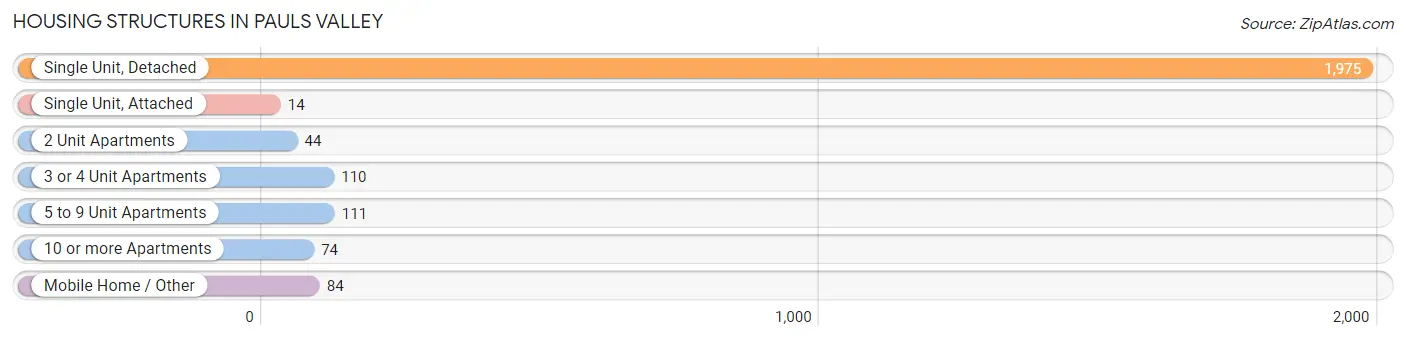
| Structure Type | # Housing Units | % Housing Units |
| Single Unit, Detached | 1,975 | 81.9% |
| Single Unit, Attached | 14 | 0.6% |
| 2 Unit Apartments | 44 | 1.8% |
| 3 or 4 Unit Apartments | 110 | 4.6% |
| 5 to 9 Unit Apartments | 111 | 4.6% |
| 10 or more Apartments | 74 | 3.1% |
| Mobile Home / Other | 84 | 3.5% |
| Total | 2,412 | 100.0% |
Housing Structures by Occupancy in Pauls Valley
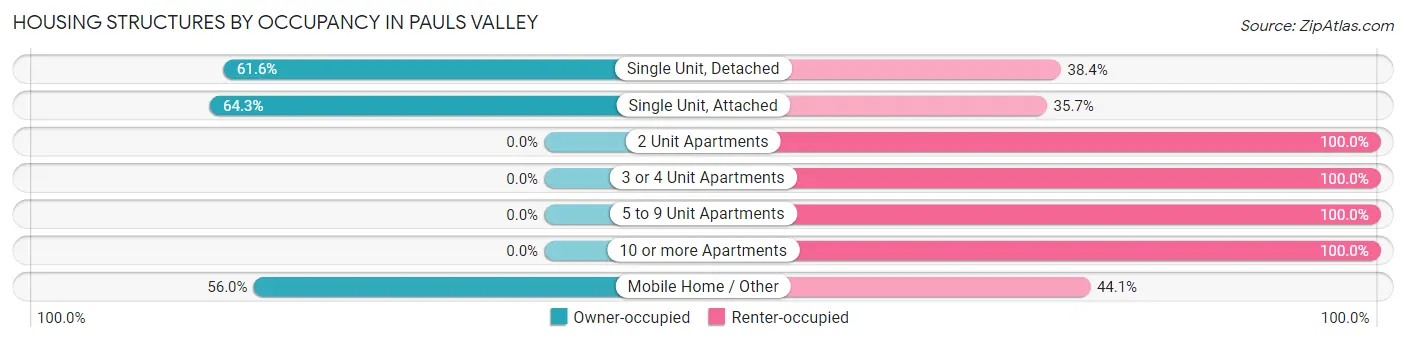
| Structure Type | Owner-occupied | Renter-occupied |
| Single Unit, Detached | 1,217 (61.6%) | 758 (38.4%) |
| Single Unit, Attached | 9 (64.3%) | 5 (35.7%) |
| 2 Unit Apartments | 0 (0.0%) | 44 (100.0%) |
| 3 or 4 Unit Apartments | 0 (0.0%) | 110 (100.0%) |
| 5 to 9 Unit Apartments | 0 (0.0%) | 111 (100.0%) |
| 10 or more Apartments | 0 (0.0%) | 74 (100.0%) |
| Mobile Home / Other | 47 (55.9%) | 37 (44.1%) |
| Total | 1,273 (52.8%) | 1,139 (47.2%) |
Housing Structures by Number of Rooms in Pauls Valley
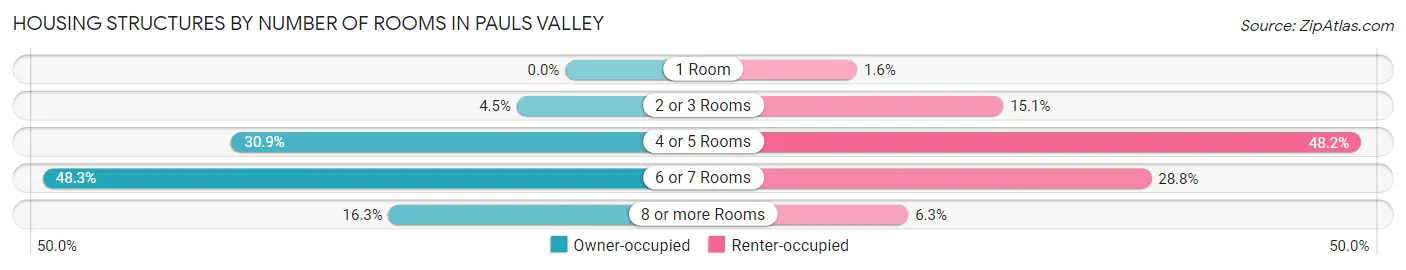
| Number of Rooms | Owner-occupied | Renter-occupied |
| 1 Room | 0 (0.0%) | 18 (1.6%) |
| 2 or 3 Rooms | 57 (4.5%) | 172 (15.1%) |
| 4 or 5 Rooms | 393 (30.9%) | 549 (48.2%) |
| 6 or 7 Rooms | 615 (48.3%) | 328 (28.8%) |
| 8 or more Rooms | 208 (16.3%) | 72 (6.3%) |
| Total | 1,273 (100.0%) | 1,139 (100.0%) |
Housing Structure by Heating Type in Pauls Valley
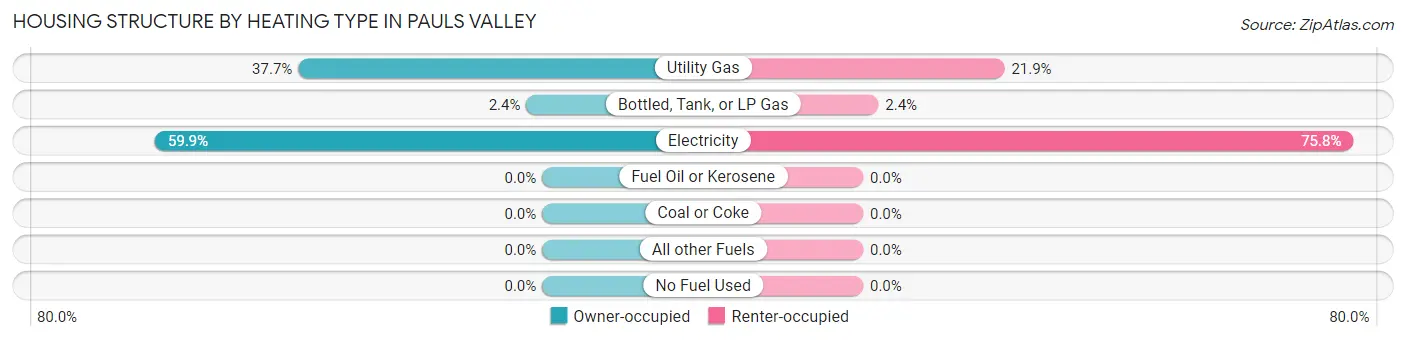
| Heating Type | Owner-occupied | Renter-occupied |
| Utility Gas | 480 (37.7%) | 249 (21.9%) |
| Bottled, Tank, or LP Gas | 31 (2.4%) | 27 (2.4%) |
| Electricity | 762 (59.9%) | 863 (75.8%) |
| Fuel Oil or Kerosene | 0 (0.0%) | 0 (0.0%) |
| Coal or Coke | 0 (0.0%) | 0 (0.0%) |
| All other Fuels | 0 (0.0%) | 0 (0.0%) |
| No Fuel Used | 0 (0.0%) | 0 (0.0%) |
| Total | 1,273 (100.0%) | 1,139 (100.0%) |
Household Vehicle Usage in Pauls Valley
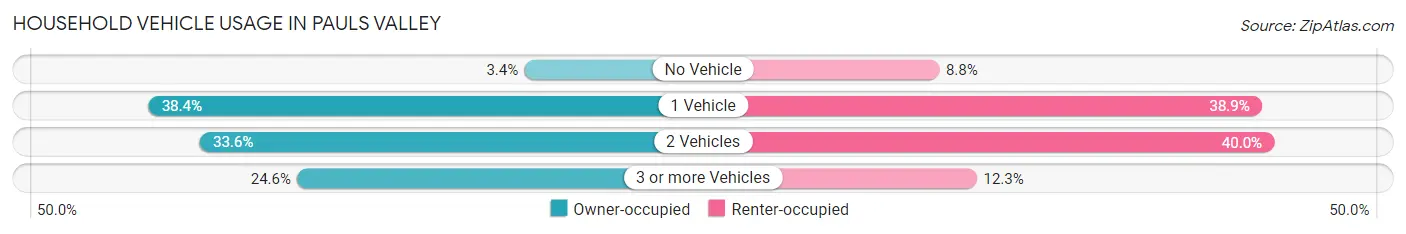
| Vehicles per Household | Owner-occupied | Renter-occupied |
| No Vehicle | 43 (3.4%) | 100 (8.8%) |
| 1 Vehicle | 489 (38.4%) | 443 (38.9%) |
| 2 Vehicles | 428 (33.6%) | 456 (40.0%) |
| 3 or more Vehicles | 313 (24.6%) | 140 (12.3%) |
| Total | 1,273 (100.0%) | 1,139 (100.0%) |
Real Estate & Mortgages in Pauls Valley
Real Estate and Mortgage Overview in Pauls Valley
| Characteristic | Without Mortgage | With Mortgage |
| Housing Units | 849 | 424 |
| Median Property Value | $60,300 | $120,200 |
| Median Household Income | $47,146 | $75 |
| Monthly Housing Costs | $313 | $0 |
| Real Estate Taxes | $473 | $17 |
Property Value by Mortgage Status in Pauls Valley
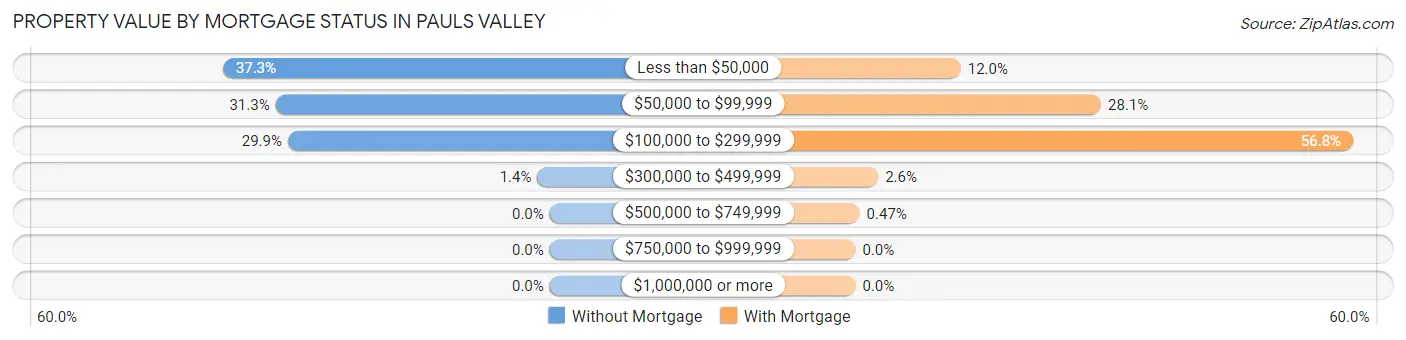
| Property Value | Without Mortgage | With Mortgage |
| Less than $50,000 | 317 (37.3%) | 51 (12.0%) |
| $50,000 to $99,999 | 266 (31.3%) | 119 (28.1%) |
| $100,000 to $299,999 | 254 (29.9%) | 241 (56.8%) |
| $300,000 to $499,999 | 12 (1.4%) | 11 (2.6%) |
| $500,000 to $749,999 | 0 (0.0%) | 2 (0.5%) |
| $750,000 to $999,999 | 0 (0.0%) | 0 (0.0%) |
| $1,000,000 or more | 0 (0.0%) | 0 (0.0%) |
| Total | 849 (100.0%) | 424 (100.0%) |
Household Income by Mortgage Status in Pauls Valley
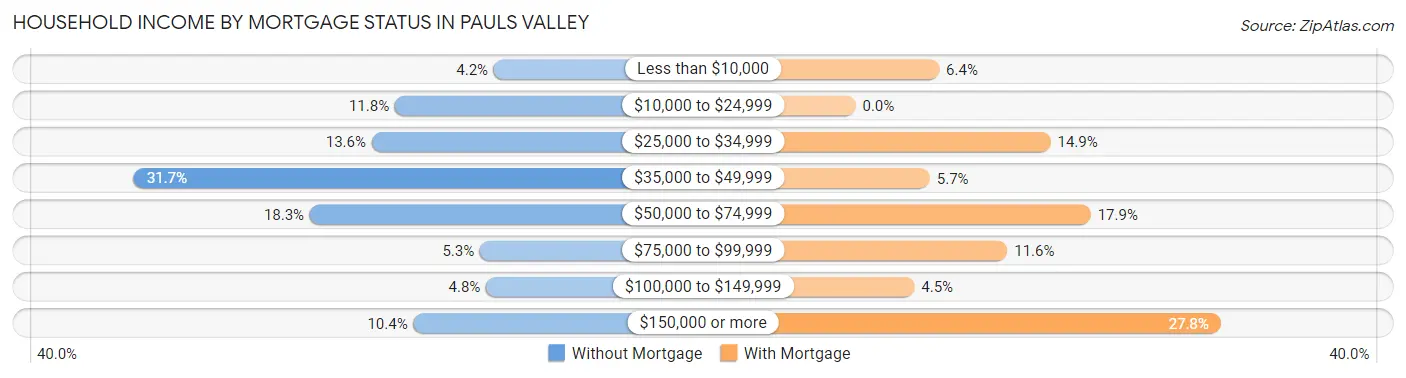
| Household Income | Without Mortgage | With Mortgage |
| Less than $10,000 | 36 (4.2%) | 27 (6.4%) |
| $10,000 to $24,999 | 100 (11.8%) | 0 (0.0%) |
| $25,000 to $34,999 | 115 (13.6%) | 63 (14.9%) |
| $35,000 to $49,999 | 269 (31.7%) | 24 (5.7%) |
| $50,000 to $74,999 | 155 (18.3%) | 76 (17.9%) |
| $75,000 to $99,999 | 45 (5.3%) | 49 (11.6%) |
| $100,000 to $149,999 | 41 (4.8%) | 19 (4.5%) |
| $150,000 or more | 88 (10.4%) | 118 (27.8%) |
| Total | 849 (100.0%) | 424 (100.0%) |
Property Value to Household Income Ratio in Pauls Valley
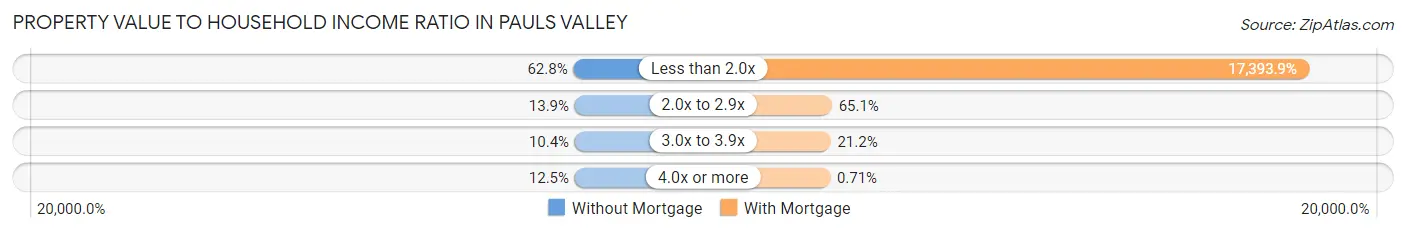
| Value-to-Income Ratio | Without Mortgage | With Mortgage |
| Less than 2.0x | 533 (62.8%) | 73,750 (17,393.9%) |
| 2.0x to 2.9x | 118 (13.9%) | 276 (65.1%) |
| 3.0x to 3.9x | 88 (10.4%) | 90 (21.2%) |
| 4.0x or more | 106 (12.5%) | 3 (0.7%) |
| Total | 849 (100.0%) | 424 (100.0%) |
Real Estate Taxes by Mortgage Status in Pauls Valley
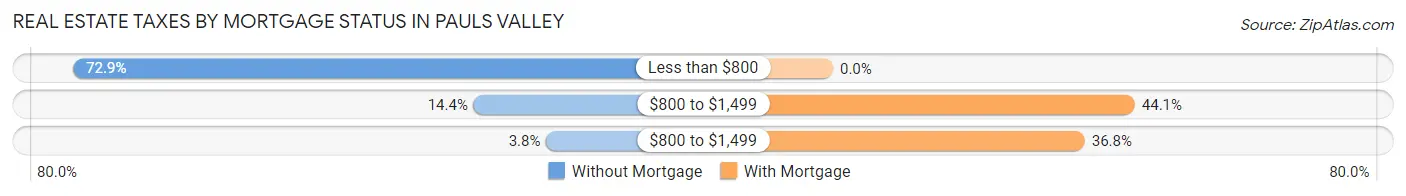
| Property Taxes | Without Mortgage | With Mortgage |
| Less than $800 | 619 (72.9%) | 0 (0.0%) |
| $800 to $1,499 | 122 (14.4%) | 187 (44.1%) |
| $800 to $1,499 | 32 (3.8%) | 156 (36.8%) |
| Total | 849 (100.0%) | 424 (100.0%) |
Health & Disability in Pauls Valley
Health Insurance Coverage by Age in Pauls Valley
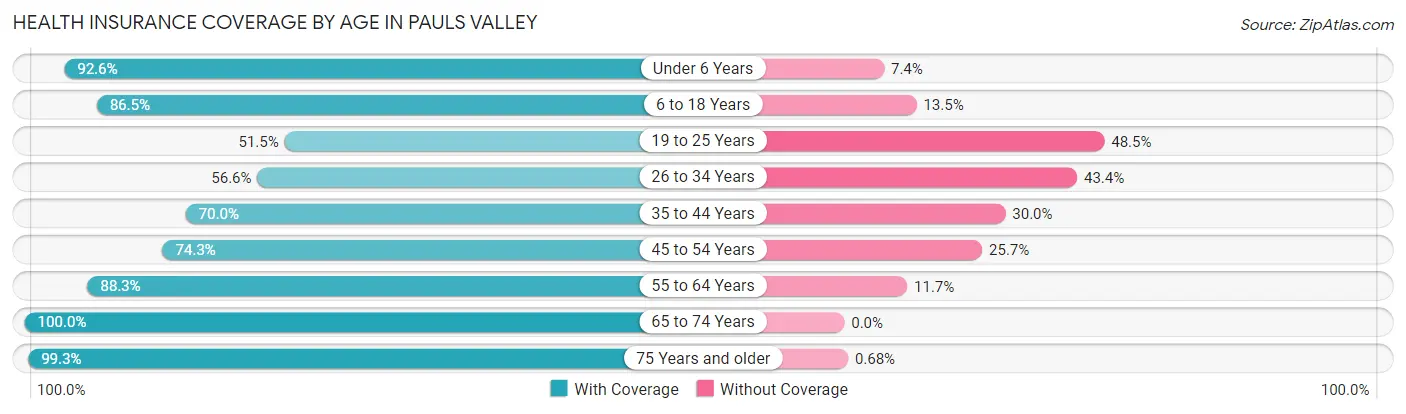
| Age Bracket | With Coverage | Without Coverage |
| Under 6 Years | 350 (92.6%) | 28 (7.4%) |
| 6 to 18 Years | 913 (86.5%) | 142 (13.5%) |
| 19 to 25 Years | 289 (51.5%) | 272 (48.5%) |
| 26 to 34 Years | 395 (56.6%) | 303 (43.4%) |
| 35 to 44 Years | 517 (70.0%) | 222 (30.0%) |
| 45 to 54 Years | 529 (74.3%) | 183 (25.7%) |
| 55 to 64 Years | 656 (88.3%) | 87 (11.7%) |
| 65 to 74 Years | 557 (100.0%) | 0 (0.0%) |
| 75 Years and older | 440 (99.3%) | 3 (0.7%) |
| Total | 4,646 (78.9%) | 1,240 (21.1%) |
Health Insurance Coverage by Citizenship Status in Pauls Valley
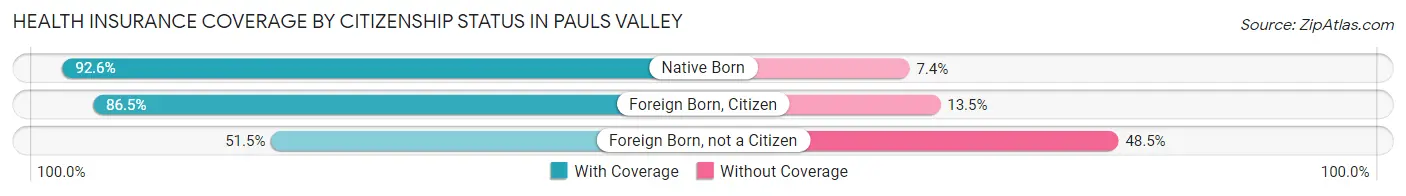
| Citizenship Status | With Coverage | Without Coverage |
| Native Born | 350 (92.6%) | 28 (7.4%) |
| Foreign Born, Citizen | 913 (86.5%) | 142 (13.5%) |
| Foreign Born, not a Citizen | 289 (51.5%) | 272 (48.5%) |
Health Insurance Coverage by Household Income in Pauls Valley
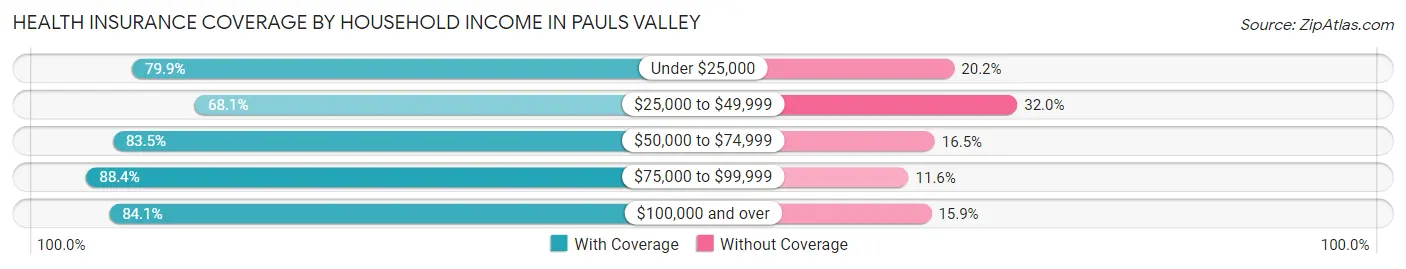
| Household Income | With Coverage | Without Coverage |
| Under $25,000 | 860 (79.8%) | 217 (20.2%) |
| $25,000 to $49,999 | 1,144 (68.0%) | 537 (32.0%) |
| $50,000 to $74,999 | 708 (83.5%) | 140 (16.5%) |
| $75,000 to $99,999 | 397 (88.4%) | 52 (11.6%) |
| $100,000 and over | 1,470 (84.1%) | 277 (15.9%) |
Public vs Private Health Insurance Coverage by Age in Pauls Valley
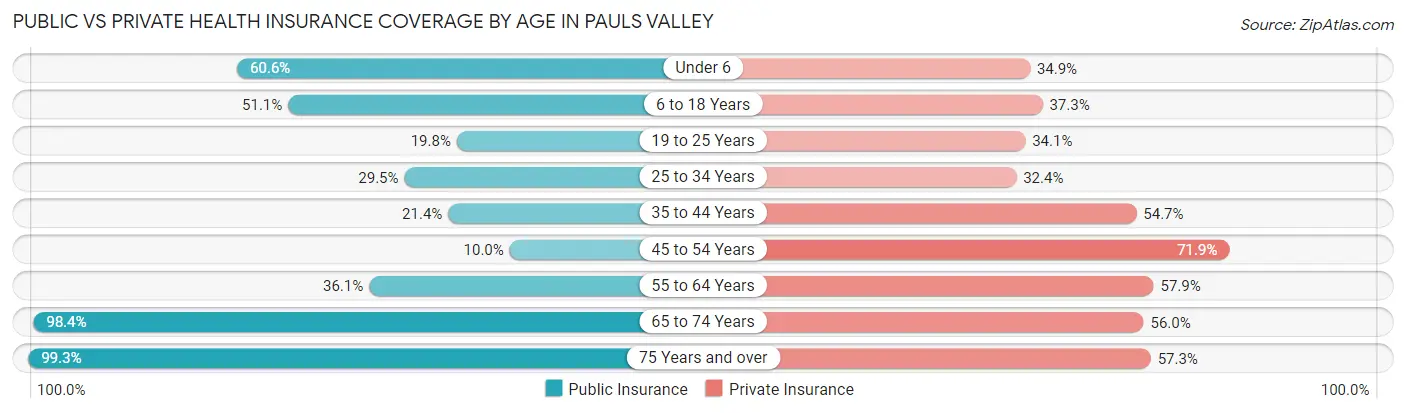
| Age Bracket | Public Insurance | Private Insurance |
| Under 6 | 229 (60.6%) | 132 (34.9%) |
| 6 to 18 Years | 539 (51.1%) | 393 (37.2%) |
| 19 to 25 Years | 111 (19.8%) | 191 (34.1%) |
| 25 to 34 Years | 206 (29.5%) | 226 (32.4%) |
| 35 to 44 Years | 158 (21.4%) | 404 (54.7%) |
| 45 to 54 Years | 71 (10.0%) | 512 (71.9%) |
| 55 to 64 Years | 268 (36.1%) | 430 (57.9%) |
| 65 to 74 Years | 548 (98.4%) | 312 (56.0%) |
| 75 Years and over | 440 (99.3%) | 254 (57.3%) |
| Total | 2,570 (43.7%) | 2,854 (48.5%) |
Disability Status by Sex by Age in Pauls Valley
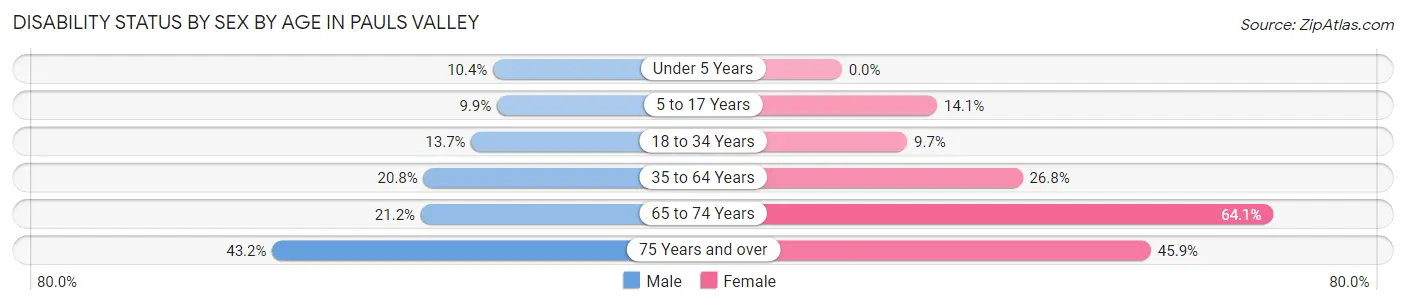
| Age Bracket | Male | Female |
| Under 5 Years | 15 (10.4%) | 0 (0.0%) |
| 5 to 17 Years | 53 (9.9%) | 69 (14.1%) |
| 18 to 34 Years | 98 (13.7%) | 58 (9.7%) |
| 35 to 64 Years | 231 (20.7%) | 290 (26.8%) |
| 65 to 74 Years | 66 (21.1%) | 157 (64.1%) |
| 75 Years and over | 86 (43.2%) | 112 (45.9%) |
Disability Class by Sex by Age in Pauls Valley
Disability Class: Hearing Difficulty
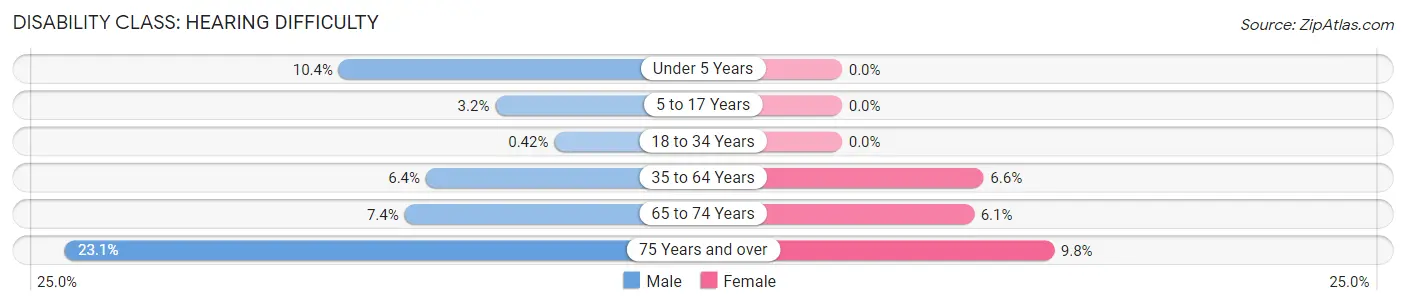
| Age Bracket | Male | Female |
| Under 5 Years | 15 (10.4%) | 0 (0.0%) |
| 5 to 17 Years | 17 (3.2%) | 0 (0.0%) |
| 18 to 34 Years | 3 (0.4%) | 0 (0.0%) |
| 35 to 64 Years | 71 (6.4%) | 71 (6.6%) |
| 65 to 74 Years | 23 (7.4%) | 15 (6.1%) |
| 75 Years and over | 46 (23.1%) | 24 (9.8%) |
Disability Class: Vision Difficulty
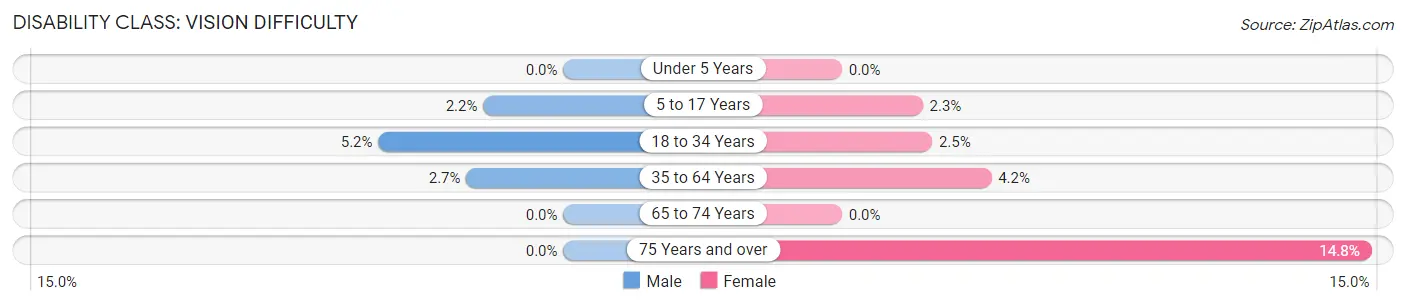
| Age Bracket | Male | Female |
| Under 5 Years | 0 (0.0%) | 0 (0.0%) |
| 5 to 17 Years | 12 (2.2%) | 11 (2.2%) |
| 18 to 34 Years | 37 (5.1%) | 15 (2.5%) |
| 35 to 64 Years | 30 (2.7%) | 45 (4.2%) |
| 65 to 74 Years | 0 (0.0%) | 0 (0.0%) |
| 75 Years and over | 0 (0.0%) | 36 (14.7%) |
Disability Class: Cognitive Difficulty
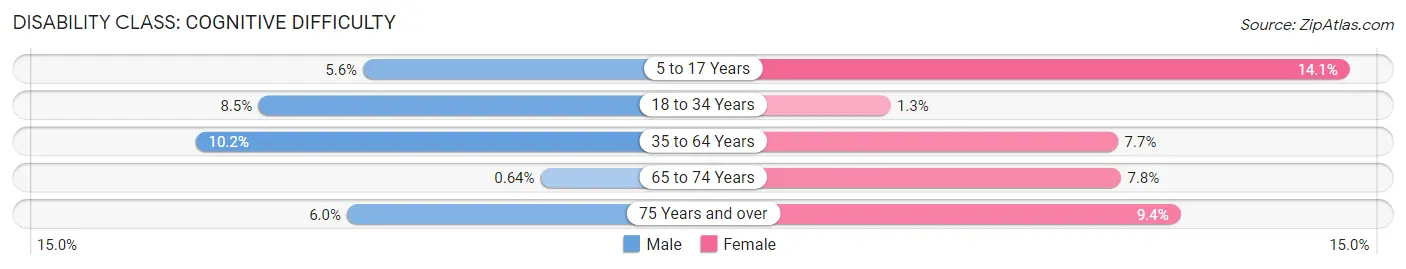
| Age Bracket | Male | Female |
| 5 to 17 Years | 30 (5.6%) | 69 (14.1%) |
| 18 to 34 Years | 61 (8.5%) | 8 (1.3%) |
| 35 to 64 Years | 114 (10.2%) | 83 (7.7%) |
| 65 to 74 Years | 2 (0.6%) | 19 (7.8%) |
| 75 Years and over | 12 (6.0%) | 23 (9.4%) |
Disability Class: Ambulatory Difficulty
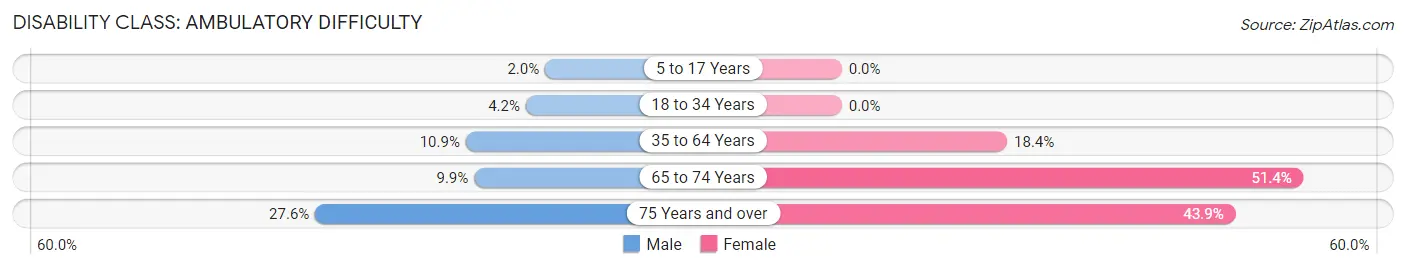
| Age Bracket | Male | Female |
| 5 to 17 Years | 11 (2.0%) | 0 (0.0%) |
| 18 to 34 Years | 30 (4.2%) | 0 (0.0%) |
| 35 to 64 Years | 121 (10.9%) | 199 (18.4%) |
| 65 to 74 Years | 31 (9.9%) | 126 (51.4%) |
| 75 Years and over | 55 (27.6%) | 107 (43.9%) |
Disability Class: Self-Care Difficulty
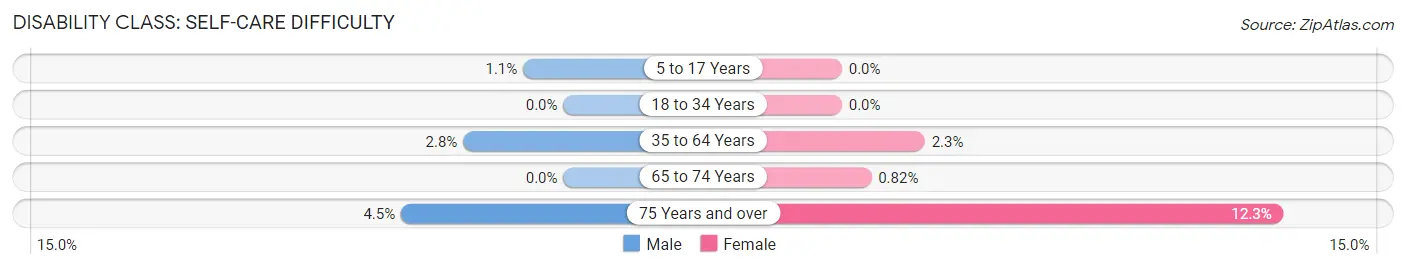
| Age Bracket | Male | Female |
| 5 to 17 Years | 6 (1.1%) | 0 (0.0%) |
| 18 to 34 Years | 0 (0.0%) | 0 (0.0%) |
| 35 to 64 Years | 31 (2.8%) | 25 (2.3%) |
| 65 to 74 Years | 0 (0.0%) | 2 (0.8%) |
| 75 Years and over | 9 (4.5%) | 30 (12.3%) |
Technology Access in Pauls Valley
Computing Device Access in Pauls Valley
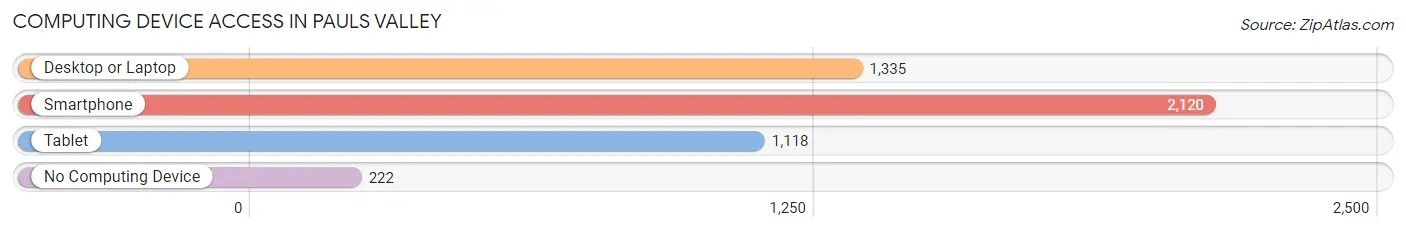
| Device Type | # Households | % Households |
| Desktop or Laptop | 1,335 | 55.3% |
| Smartphone | 2,120 | 87.9% |
| Tablet | 1,118 | 46.4% |
| No Computing Device | 222 | 9.2% |
| Total | 2,412 | 100.0% |
Internet Access in Pauls Valley
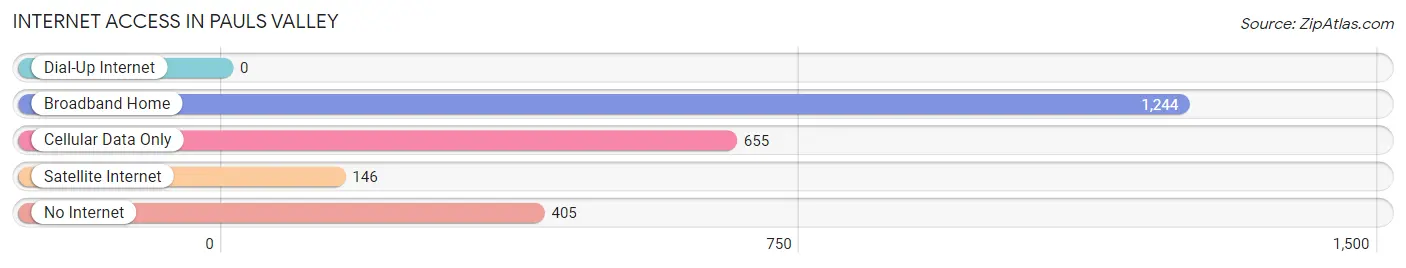
| Internet Type | # Households | % Households |
| Dial-Up Internet | 0 | 0.0% |
| Broadband Home | 1,244 | 51.6% |
| Cellular Data Only | 655 | 27.2% |
| Satellite Internet | 146 | 6.0% |
| No Internet | 405 | 16.8% |
| Total | 2,412 | 100.0% |
Pauls Valley Summary
Pauls Valley is a city located in Garvin County, Oklahoma. It is situated in the Arbuckle Mountains, about 70 miles south of Oklahoma City. The city was founded in 1887 by William Paul, a rancher and businessman from Texas. The city was named after him.
Geography
Pauls Valley is located at 34°42'N 97°14'W (34.7, -97.23). It is situated in the Arbuckle Mountains, about 70 miles south of Oklahoma City. The city has a total area of 8.2 square miles, all of which is land. The city is located in the Red River Valley, which is part of the Great Plains region. The climate is characterized by hot, humid summers and cold, dry winters.
Demographics
As of the 2010 census, the population of Pauls Valley was 6,187. The racial makeup of the city was 73.2% White, 15.2% African American, 0.7% Native American, 0.4% Asian, 0.1% Pacific Islander, and 8.4% from other races. Hispanic or Latino of any race were 11.2% of the population.
Economy
Pauls Valley is a small city with a diverse economy. The city is home to several manufacturing companies, including a plastics plant, a paper mill, and a metal fabrication plant. The city also has a large agricultural sector, with cotton, wheat, and soybeans being the main crops. The city is also home to several retail stores, restaurants, and other businesses.
The city is served by the Pauls Valley Municipal Airport, which provides general aviation services. The city is also served by the Pauls Valley Railroad, which connects the city to Oklahoma City and other cities in the region.
History
Pauls Valley was founded in 1887 by William Paul, a rancher and businessman from Texas. The city was named after him. The city was incorporated in 1901 and has since grown to become a major economic center in the region.
In the early 1900s, the city was a major center for the oil and gas industry. The city was also home to several large cotton gins and other agricultural businesses.
In the 1950s, the city began to diversify its economy, with the opening of several manufacturing plants. The city also began to attract more tourists, with the opening of several tourist attractions, such as the Arbuckle Mountains and Lake Murray.
In the late 20th century, the city began to experience a decline in population, as many residents moved to larger cities in the region. However, the city has since seen a resurgence in population, as more people have moved to the city for its small-town charm and economic opportunities.
Conclusion
Pauls Valley is a small city located in Garvin County, Oklahoma. It is situated in the Arbuckle Mountains, about 70 miles south of Oklahoma City. The city was founded in 1887 by William Paul, a rancher and businessman from Texas. The city has a total area of 8.2 square miles, all of which is land. As of the 2010 census, the population of Pauls Valley was 6,187. The city has a diverse economy, with manufacturing, agriculture, retail, and tourism being the main industries. The city has also seen a resurgence in population in recent years, as more people have moved to the city for its small-town charm and economic opportunities.
Common Questions
What is Per Capita Income in Pauls Valley?
Per Capita income in Pauls Valley is $26,358.
What is the Median Family Income in Pauls Valley?
Median Family Income in Pauls Valley is $54,519.
What is the Median Household income in Pauls Valley?
Median Household Income in Pauls Valley is $45,400.
What is Income or Wage Gap in Pauls Valley?
Income or Wage Gap in Pauls Valley is 39.1%.
Women in Pauls Valley earn 60.9 cents for every dollar earned by a man.
What is Inequality or Gini Index in Pauls Valley?
Inequality or Gini Index in Pauls Valley is 0.44.
What is the Total Population of Pauls Valley?
Total Population of Pauls Valley is 6,031.
What is the Total Male Population of Pauls Valley?
Total Male Population of Pauls Valley is 3,095.
What is the Total Female Population of Pauls Valley?
Total Female Population of Pauls Valley is 2,936.
What is the Ratio of Males per 100 Females in Pauls Valley?
There are 105.42 Males per 100 Females in Pauls Valley.
What is the Ratio of Females per 100 Males in Pauls Valley?
There are 94.86 Females per 100 Males in Pauls Valley.
What is the Median Population Age in Pauls Valley?
Median Population Age in Pauls Valley is 39.2 Years.
What is the Average Family Size in Pauls Valley
Average Family Size in Pauls Valley is 3.3 People.
What is the Average Household Size in Pauls Valley
Average Household Size in Pauls Valley is 2.4 People.
How Large is the Labor Force in Pauls Valley?
There are 2,620 People in the Labor Forcein in Pauls Valley.
What is the Percentage of People in the Labor Force in Pauls Valley?
53.7% of People are in the Labor Force in Pauls Valley.
What is the Unemployment Rate in Pauls Valley?
Unemployment Rate in Pauls Valley is 3.1%.