Oakland, OK Map & Demographics
Oakland Map
Oakland Overview
$20,049
PER CAPITA INCOME
$64,028
AVG FAMILY INCOME
$58,021
AVG HOUSEHOLD INCOME
33.3%
WAGE / INCOME GAP [ % ]
66.7¢/ $1
WAGE / INCOME GAP [ $ ]
0.38
INEQUALITY / GINI INDEX
1,163
TOTAL POPULATION
671
MALE POPULATION
492
FEMALE POPULATION
136.38
MALES / 100 FEMALES
73.32
FEMALES / 100 MALES
36.2
MEDIAN AGE
4.5
AVG FAMILY SIZE
3.6
AVG HOUSEHOLD SIZE
618
LABOR FORCE [ PEOPLE ]
68.3%
PERCENT IN LABOR FORCE
11.7%
UNEMPLOYMENT RATE
Oakland Area Codes
Income in Oakland
Income Overview in Oakland
Per Capita Income in Oakland is $20,049, while median incomes of families and households are $64,028 and $58,021 respectively.
| Characteristic | Number | Measure |
| Per Capita Income | 1,163 | $20,049 |
| Median Family Income | 223 | $64,028 |
| Mean Family Income | 223 | $70,439 |
| Median Household Income | 319 | $58,021 |
| Mean Household Income | 319 | $63,417 |
| Income Deficit | 223 | $0 |
| Wage / Income Gap (%) | 1,163 | 33.33% |
| Wage / Income Gap ($) | 1,163 | 66.67¢ per $1 |
| Gini / Inequality Index | 1,163 | 0.38 |
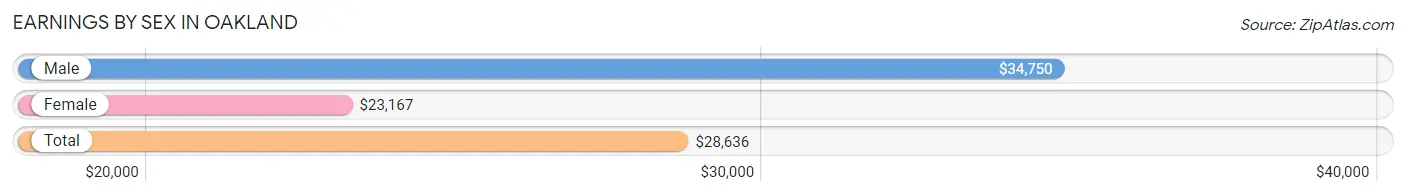
Earnings by Sex in Oakland
Average Earnings in Oakland are $28,636, $34,750 for men and $23,167 for women, a difference of 33.3%.
| Sex | Number | Average Earnings |
| Male | 316 (53.4%) | $34,750 |
| Female | 276 (46.6%) | $23,167 |
| Total | 592 (100.0%) | $28,636 |
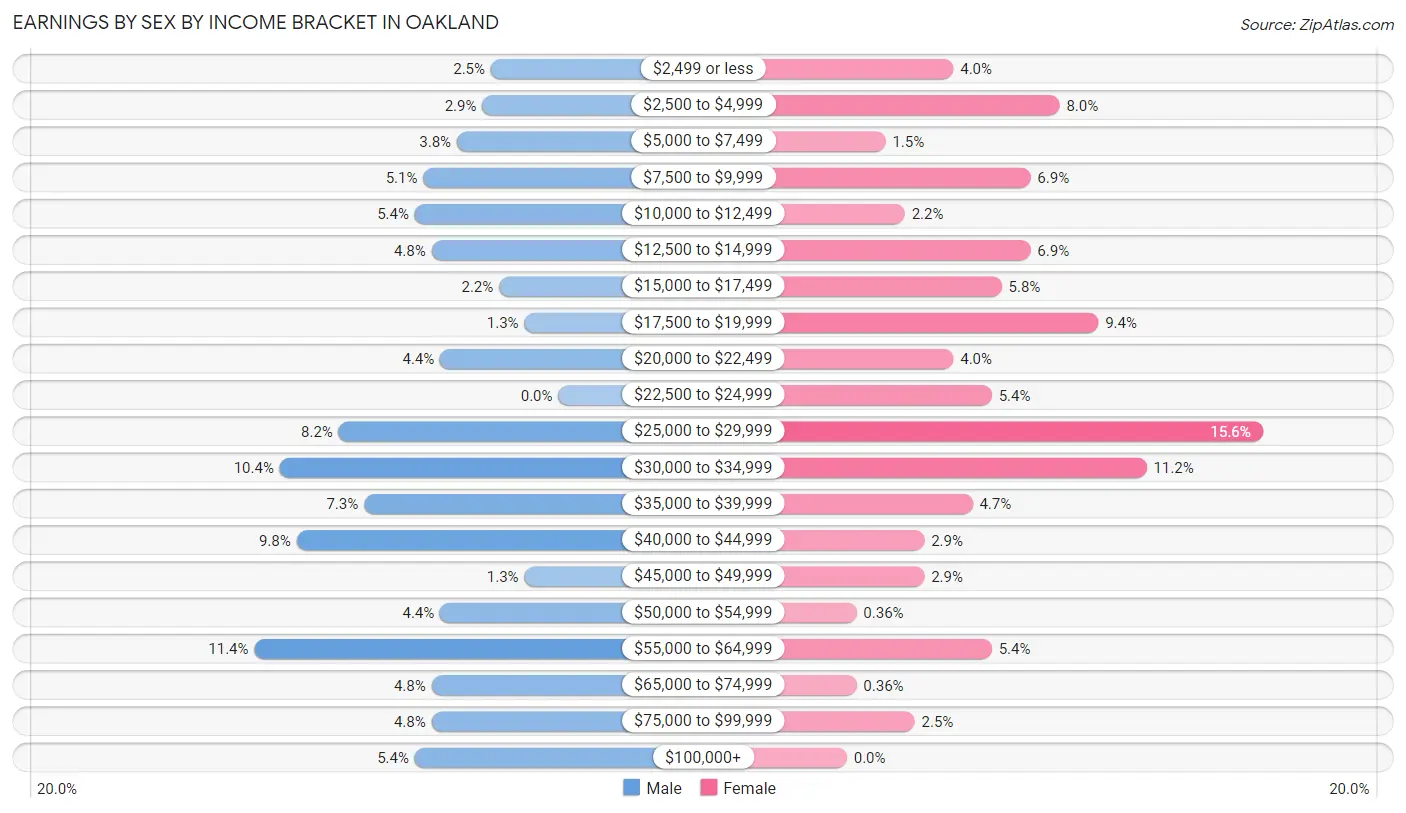
Earnings by Sex by Income Bracket in Oakland
The most common earnings brackets in Oakland are $55,000 to $64,999 for men (36 | 11.4%) and $25,000 to $29,999 for women (43 | 15.6%).
| Income | Male | Female |
| $2,499 or less | 8 (2.5%) | 11 (4.0%) |
| $2,500 to $4,999 | 9 (2.9%) | 22 (8.0%) |
| $5,000 to $7,499 | 12 (3.8%) | 4 (1.5%) |
| $7,500 to $9,999 | 16 (5.1%) | 19 (6.9%) |
| $10,000 to $12,499 | 17 (5.4%) | 6 (2.2%) |
| $12,500 to $14,999 | 15 (4.8%) | 19 (6.9%) |
| $15,000 to $17,499 | 7 (2.2%) | 16 (5.8%) |
| $17,500 to $19,999 | 4 (1.3%) | 26 (9.4%) |
| $20,000 to $22,499 | 14 (4.4%) | 11 (4.0%) |
| $22,500 to $24,999 | 0 (0.0%) | 15 (5.4%) |
| $25,000 to $29,999 | 26 (8.2%) | 43 (15.6%) |
| $30,000 to $34,999 | 33 (10.4%) | 31 (11.2%) |
| $35,000 to $39,999 | 23 (7.3%) | 13 (4.7%) |
| $40,000 to $44,999 | 31 (9.8%) | 8 (2.9%) |
| $45,000 to $49,999 | 4 (1.3%) | 8 (2.9%) |
| $50,000 to $54,999 | 14 (4.4%) | 1 (0.4%) |
| $55,000 to $64,999 | 36 (11.4%) | 15 (5.4%) |
| $65,000 to $74,999 | 15 (4.8%) | 1 (0.4%) |
| $75,000 to $99,999 | 15 (4.8%) | 7 (2.5%) |
| $100,000+ | 17 (5.4%) | 0 (0.0%) |
| Total | 316 (100.0%) | 276 (100.0%) |
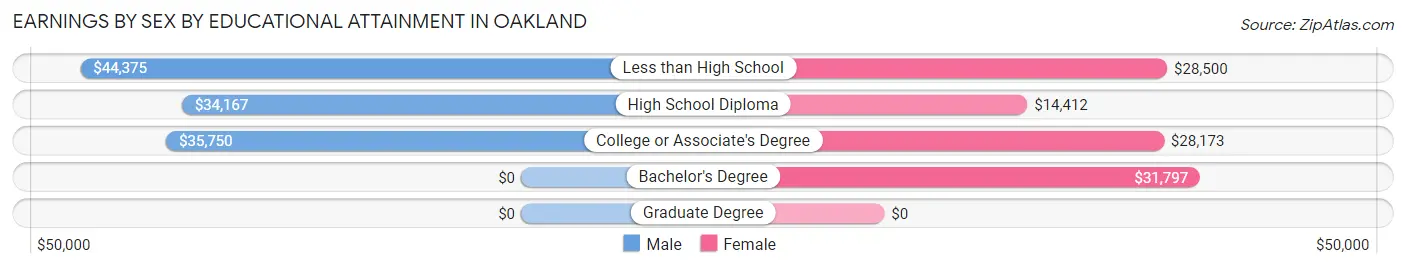
Earnings by Sex by Educational Attainment in Oakland
Average earnings in Oakland are $39,038 for men and $25,625 for women, a difference of 34.4%. Men with an educational attainment of less than high school enjoy the highest average annual earnings of $44,375, while those with high school diploma education earn the least with $34,167. Women with an educational attainment of bachelor's degree earn the most with the average annual earnings of $31,797, while those with high school diploma education have the smallest earnings of $14,412.
| Educational Attainment | Male Income | Female Income |
| Less than High School | $44,375 | $28,500 |
| High School Diploma | $34,167 | $14,412 |
| College or Associate's Degree | $35,750 | $28,173 |
| Bachelor's Degree | - | - |
| Graduate Degree | - | - |
| Total | $39,038 | $25,625 |
Family Income in Oakland
Family Income Brackets in Oakland
According to the Oakland family income data, there are 54 families falling into the $100,000 to $149,999 income range, which is the most common income bracket and makes up 24.2% of all families. Conversely, the $150,000 to $199,999 income bracket is the least frequent group with only 2 families (0.9%) belonging to this category.
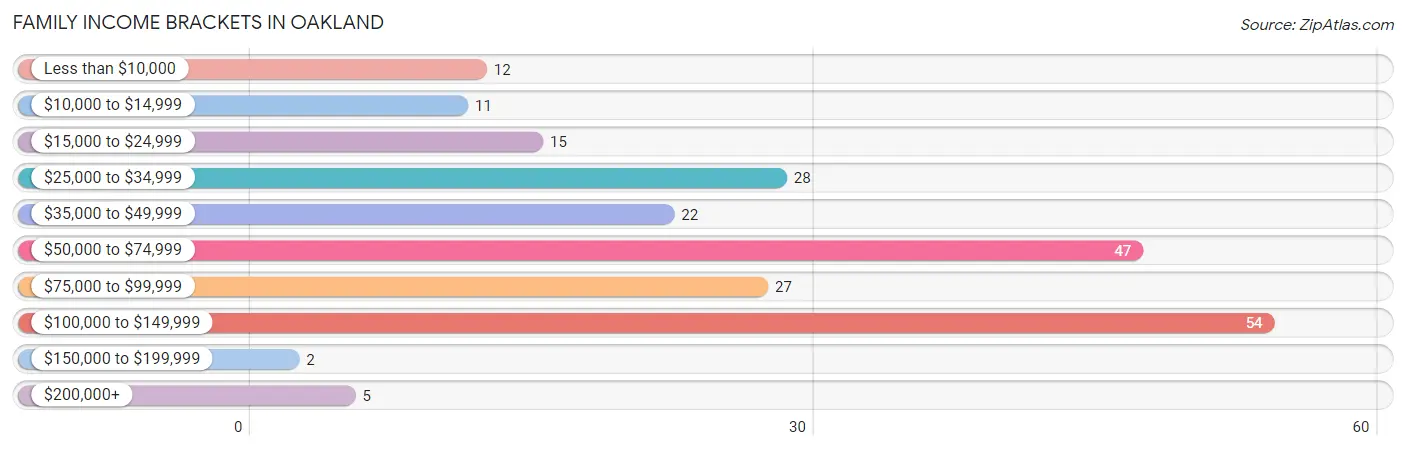
| Income Bracket | # Families | % Families |
| Less than $10,000 | 12 | 5.4% |
| $10,000 to $14,999 | 11 | 4.9% |
| $15,000 to $24,999 | 15 | 6.7% |
| $25,000 to $34,999 | 28 | 12.6% |
| $35,000 to $49,999 | 22 | 9.9% |
| $50,000 to $74,999 | 47 | 21.1% |
| $75,000 to $99,999 | 27 | 12.1% |
| $100,000 to $149,999 | 54 | 24.2% |
| $150,000 to $199,999 | 2 | 0.9% |
| $200,000+ | 5 | 2.2% |
Family Income by Famaliy Size in Oakland
7+ person families (23 | 10.3%) account for the highest median family income in Oakland with $99,107 per family, while 2-person families (71 | 31.8%) have the highest median income of $18,958 per family member.
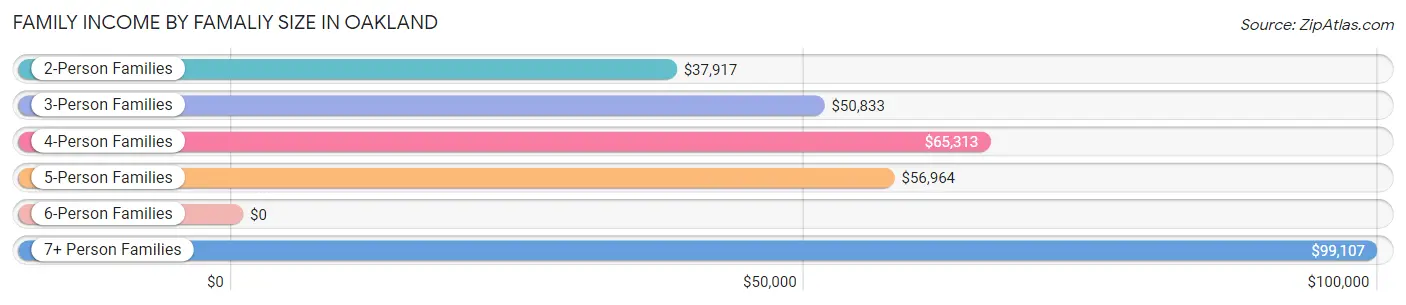
| Income Bracket | # Families | Median Income |
| 2-Person Families | 71 (31.8%) | $37,917 |
| 3-Person Families | 64 (28.7%) | $50,833 |
| 4-Person Families | 19 (8.5%) | $65,313 |
| 5-Person Families | 31 (13.9%) | $56,964 |
| 6-Person Families | 15 (6.7%) | $0 |
| 7+ Person Families | 23 (10.3%) | $99,107 |
| Total | 223 (100.0%) | $64,028 |
Family Income by Number of Earners in Oakland
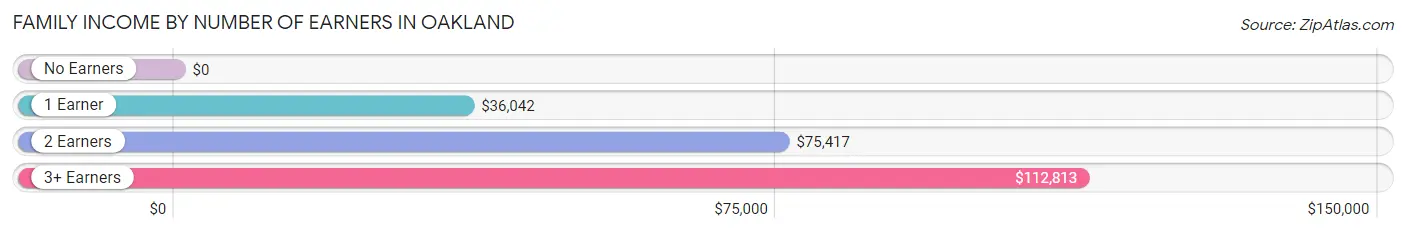
| Number of Earners | # Families | Median Income |
| No Earners | 22 (9.9%) | $0 |
| 1 Earner | 77 (34.5%) | $36,042 |
| 2 Earners | 63 (28.2%) | $75,417 |
| 3+ Earners | 61 (27.4%) | $112,813 |
| Total | 223 (100.0%) | $64,028 |
Household Income in Oakland
Household Income Brackets in Oakland
With 75 households falling in the category, the $50,000 to $74,999 income range is the most frequent in Oakland, accounting for 23.5% of all households. In contrast, only 2 households (0.6%) fall into the $150,000 to $199,999 income bracket, making it the least populous group.
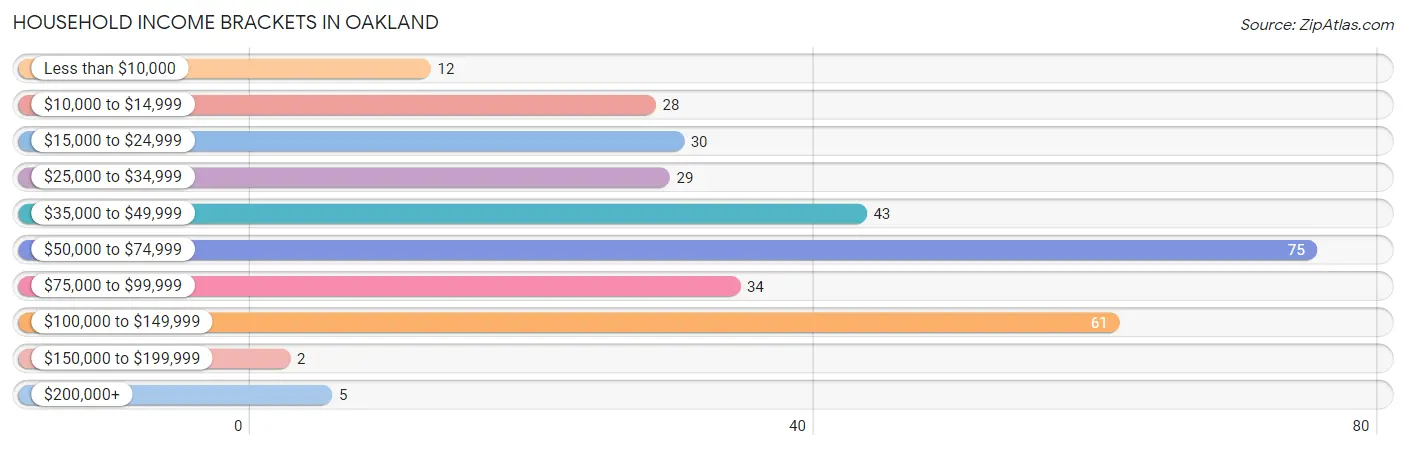
| Income Bracket | # Households | % Households |
| Less than $10,000 | 12 | 3.8% |
| $10,000 to $14,999 | 28 | 8.8% |
| $15,000 to $24,999 | 30 | 9.4% |
| $25,000 to $34,999 | 29 | 9.1% |
| $35,000 to $49,999 | 43 | 13.5% |
| $50,000 to $74,999 | 75 | 23.5% |
| $75,000 to $99,999 | 34 | 10.7% |
| $100,000 to $149,999 | 61 | 19.1% |
| $150,000 to $199,999 | 2 | 0.6% |
| $200,000+ | 5 | 1.6% |
Household Income by Householder Age in Oakland
The median household income in Oakland is $58,021, with the highest median household income of $70,179 found in the 45 to 64 years age bracket for the primary householder. A total of 129 households (40.4%) fall into this category. Meanwhile, the 15 to 24 years age bracket for the primary householder has the lowest median household income of $0, with 3 households (0.9%) in this group.
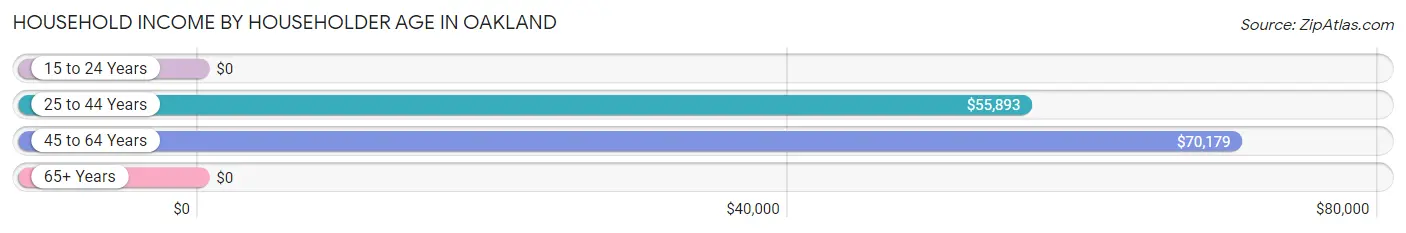
| Income Bracket | # Households | Median Income |
| 15 to 24 Years | 3 (0.9%) | $0 |
| 25 to 44 Years | 121 (37.9%) | $55,893 |
| 45 to 64 Years | 129 (40.4%) | $70,179 |
| 65+ Years | 66 (20.7%) | $0 |
| Total | 319 (100.0%) | $58,021 |
Poverty in Oakland
Income Below Poverty by Sex and Age in Oakland
With 14.8% poverty level for males and 22.2% for females among the residents of Oakland, 16 and 17 year old males and 12 to 14 year old females are the most vulnerable to poverty, with 12 males (52.2%) and 7 females (46.7%) in their respective age groups living below the poverty level.
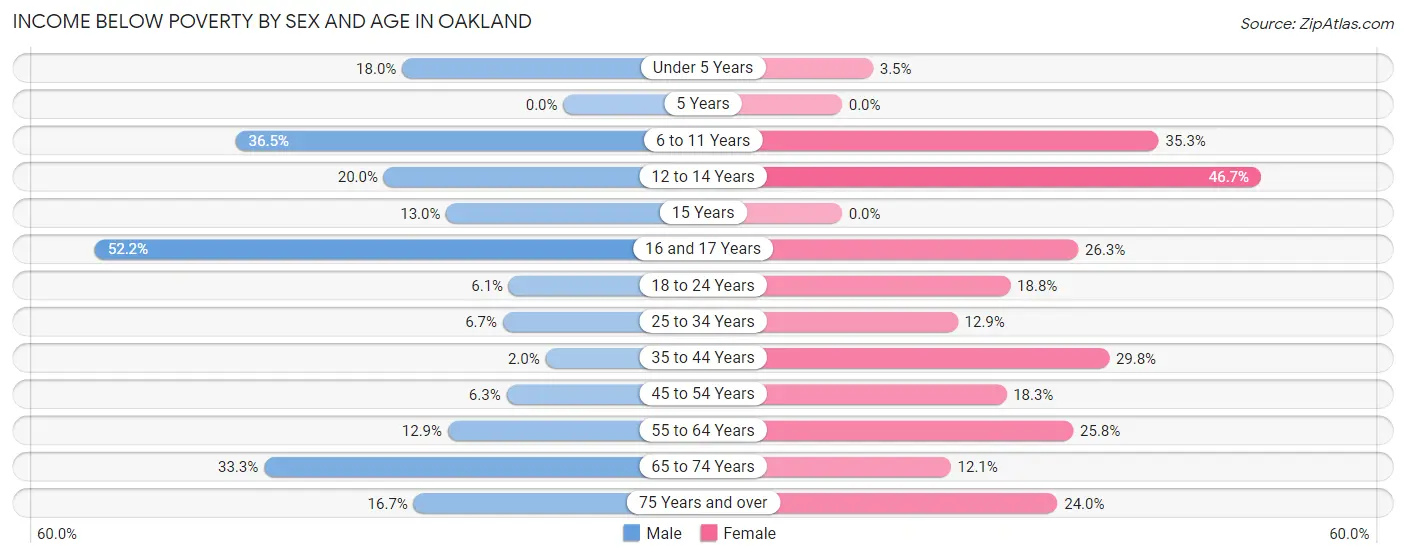
| Age Bracket | Male | Female |
| Under 5 Years | 7 (17.9%) | 1 (3.5%) |
| 5 Years | 0 (0.0%) | 0 (0.0%) |
| 6 to 11 Years | 27 (36.5%) | 6 (35.3%) |
| 12 to 14 Years | 9 (20.0%) | 7 (46.7%) |
| 15 Years | 3 (13.0%) | 0 (0.0%) |
| 16 and 17 Years | 12 (52.2%) | 5 (26.3%) |
| 18 to 24 Years | 4 (6.1%) | 6 (18.8%) |
| 25 to 34 Years | 6 (6.7%) | 8 (12.9%) |
| 35 to 44 Years | 2 (2.0%) | 36 (29.7%) |
| 45 to 54 Years | 5 (6.3%) | 13 (18.3%) |
| 55 to 64 Years | 9 (12.9%) | 17 (25.8%) |
| 65 to 74 Years | 12 (33.3%) | 4 (12.1%) |
| 75 Years and over | 2 (16.7%) | 6 (24.0%) |
| Total | 98 (14.8%) | 109 (22.2%) |
Income Above Poverty by Sex and Age in Oakland
According to the poverty statistics in Oakland, males aged 5 years and females aged 5 years are the age groups that are most secure financially, with 100.0% of males and 100.0% of females in these age groups living above the poverty line.
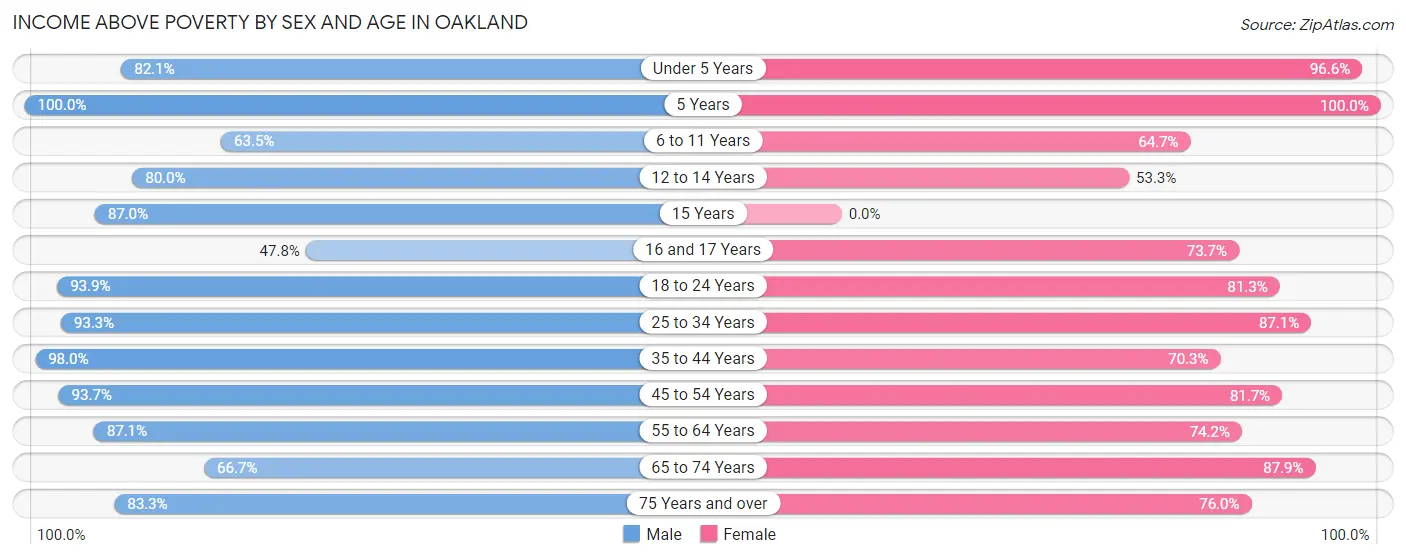
| Age Bracket | Male | Female |
| Under 5 Years | 32 (82.1%) | 28 (96.6%) |
| 5 Years | 5 (100.0%) | 2 (100.0%) |
| 6 to 11 Years | 47 (63.5%) | 11 (64.7%) |
| 12 to 14 Years | 36 (80.0%) | 8 (53.3%) |
| 15 Years | 20 (87.0%) | 0 (0.0%) |
| 16 and 17 Years | 11 (47.8%) | 14 (73.7%) |
| 18 to 24 Years | 62 (93.9%) | 26 (81.2%) |
| 25 to 34 Years | 83 (93.3%) | 54 (87.1%) |
| 35 to 44 Years | 99 (98.0%) | 85 (70.3%) |
| 45 to 54 Years | 74 (93.7%) | 58 (81.7%) |
| 55 to 64 Years | 61 (87.1%) | 49 (74.2%) |
| 65 to 74 Years | 24 (66.7%) | 29 (87.9%) |
| 75 Years and over | 10 (83.3%) | 19 (76.0%) |
| Total | 564 (85.2%) | 383 (77.8%) |
Income Below Poverty Among Married-Couple Families in Oakland
The poverty statistics for married-couple families in Oakland show that 8.1% or 13 of the total 161 families live below the poverty line. Families with 3 or 4 children have the highest poverty rate of 18.2%, comprising of 4 families. On the other hand, families with 1 or 2 children have the lowest poverty rate of 0.0%, which includes 0 families.
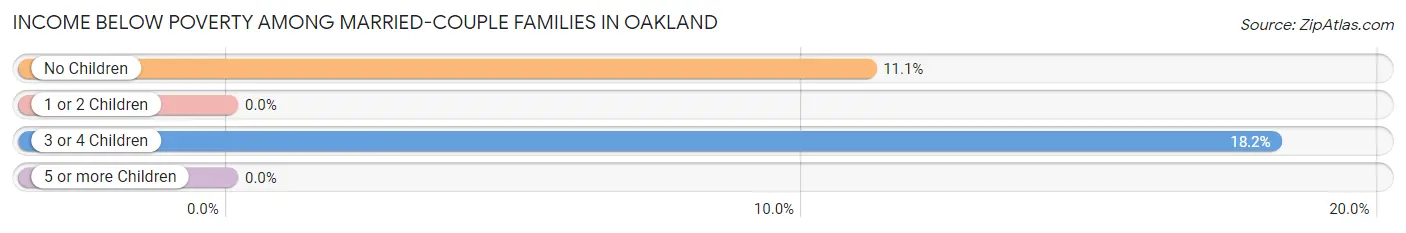
| Children | Above Poverty | Below Poverty |
| No Children | 72 (88.9%) | 9 (11.1%) |
| 1 or 2 Children | 49 (100.0%) | 0 (0.0%) |
| 3 or 4 Children | 18 (81.8%) | 4 (18.2%) |
| 5 or more Children | 9 (100.0%) | 0 (0.0%) |
| Total | 148 (91.9%) | 13 (8.1%) |
Income Below Poverty Among Single-Parent Households in Oakland
According to the poverty data in Oakland, 23.1% or 3 single-father households and 59.2% or 29 single-mother households are living below the poverty line. Among single-father households, those with 3 or 4 children have the highest poverty rate, with 3 households (100.0%) experiencing poverty. Likewise, among single-mother households, those with 5 or more children have the highest poverty rate, with 2 households (100.0%) falling below the poverty line.
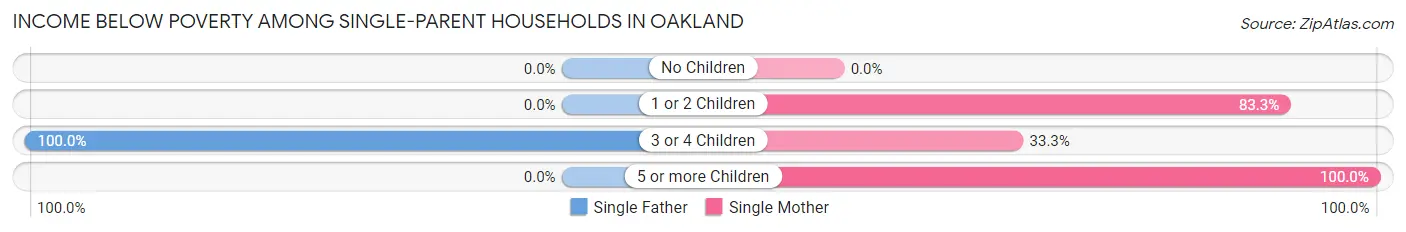
| Children | Single Father | Single Mother |
| No Children | 0 (0.0%) | 0 (0.0%) |
| 1 or 2 Children | 0 (0.0%) | 25 (83.3%) |
| 3 or 4 Children | 3 (100.0%) | 2 (33.3%) |
| 5 or more Children | 0 (0.0%) | 2 (100.0%) |
| Total | 3 (23.1%) | 29 (59.2%) |
Income Below Poverty Among Married-Couple vs Single-Parent Households in Oakland
The poverty data for Oakland shows that 13 of the married-couple family households (8.1%) and 32 of the single-parent households (51.6%) are living below the poverty level. Within the married-couple family households, those with 3 or 4 children have the highest poverty rate, with 4 households (18.2%) falling below the poverty line. Among the single-parent households, those with 5 or more children have the highest poverty rate, with 2 household (100.0%) living below poverty.
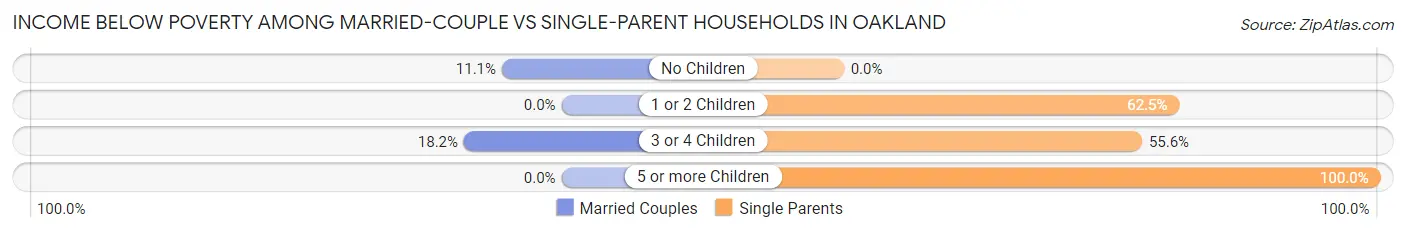
| Children | Married-Couple Families | Single-Parent Households |
| No Children | 9 (11.1%) | 0 (0.0%) |
| 1 or 2 Children | 0 (0.0%) | 25 (62.5%) |
| 3 or 4 Children | 4 (18.2%) | 5 (55.6%) |
| 5 or more Children | 0 (0.0%) | 2 (100.0%) |
| Total | 13 (8.1%) | 32 (51.6%) |
Race in Oakland
The most populous races in Oakland are White / Caucasian (619 | 53.2%), Hispanic or Latino (398 | 34.2%), and Two or more Races (259 | 22.3%).
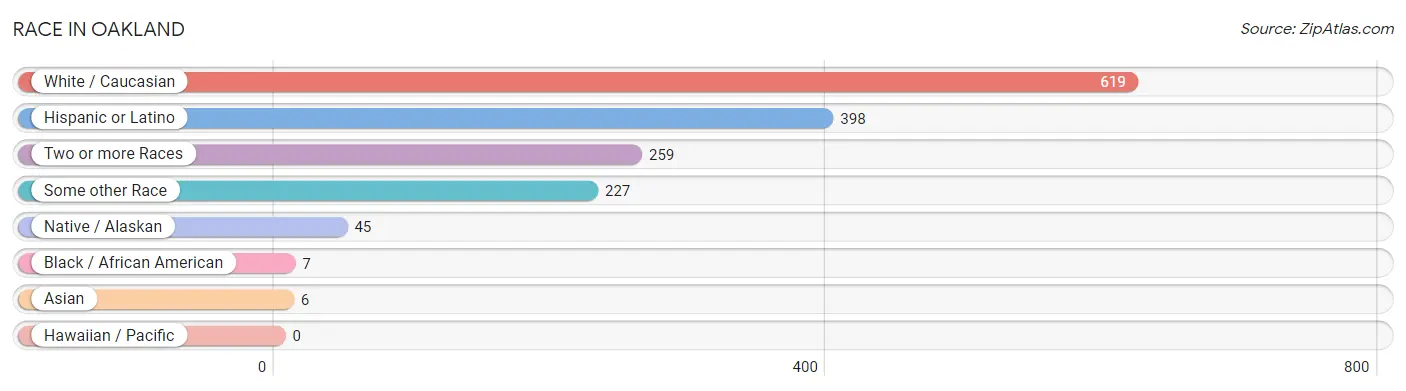
| Race | # Population | % Population |
| Asian | 6 | 0.5% |
| Black / African American | 7 | 0.6% |
| Hawaiian / Pacific | 0 | 0.0% |
| Hispanic or Latino | 398 | 34.2% |
| Native / Alaskan | 45 | 3.9% |
| White / Caucasian | 619 | 53.2% |
| Two or more Races | 259 | 22.3% |
| Some other Race | 227 | 19.5% |
| Total | 1,163 | 100.0% |
Ancestry in Oakland
The most populous ancestries reported in Oakland are Mexican (398 | 34.2%), German (158 | 13.6%), English (131 | 11.3%), Irish (127 | 10.9%), and Choctaw (69 | 5.9%), together accounting for 75.9% of all Oakland residents.
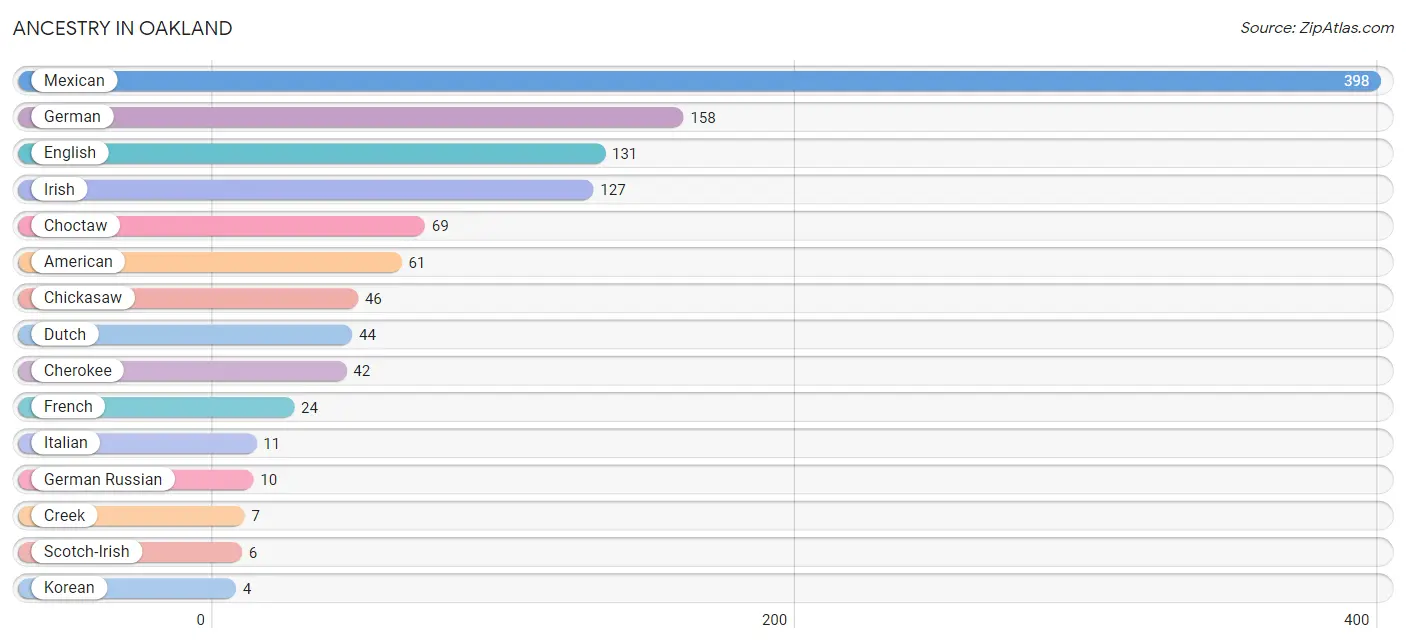
| Ancestry | # Population | % Population |
| American | 61 | 5.2% |
| Bhutanese | 2 | 0.2% |
| Cherokee | 42 | 3.6% |
| Chickasaw | 46 | 4.0% |
| Choctaw | 69 | 5.9% |
| Creek | 7 | 0.6% |
| Dutch | 44 | 3.8% |
| English | 131 | 11.3% |
| French | 24 | 2.1% |
| German | 158 | 13.6% |
| German Russian | 10 | 0.9% |
| Irish | 127 | 10.9% |
| Italian | 11 | 0.9% |
| Korean | 4 | 0.3% |
| Mexican | 398 | 34.2% |
| Navajo | 2 | 0.2% |
| Scandinavian | 2 | 0.2% |
| Scotch-Irish | 6 | 0.5% |
| Scottish | 1 | 0.1% | View All 19 Rows |
Immigrants in Oakland
The most numerous immigrant groups reported in Oakland came from Central America (202 | 17.4%), Latin America (202 | 17.4%), Mexico (202 | 17.4%), Asia (6 | 0.5%), and Philippines (4 | 0.3%), together accounting for 53.0% of all Oakland residents.
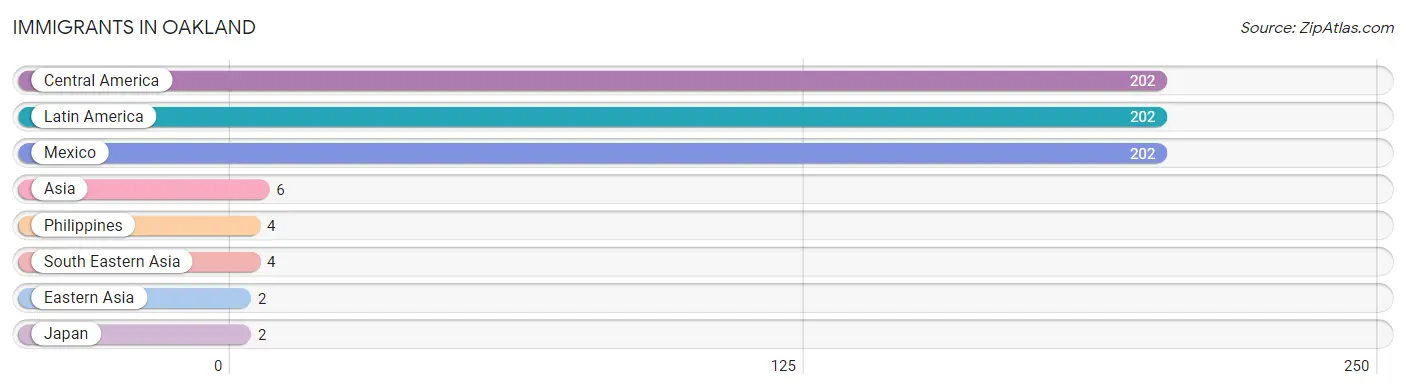
| Immigration Origin | # Population | % Population |
| Asia | 6 | 0.5% |
| Central America | 202 | 17.4% |
| Eastern Asia | 2 | 0.2% |
| Japan | 2 | 0.2% |
| Latin America | 202 | 17.4% |
| Mexico | 202 | 17.4% |
| Philippines | 4 | 0.3% |
| South Eastern Asia | 4 | 0.3% | View All 8 Rows |
Sex and Age in Oakland
Sex and Age in Oakland
The most populous age groups in Oakland are 10 to 14 Years (83 | 12.4%) for men and 35 to 39 Years (66 | 13.4%) for women.
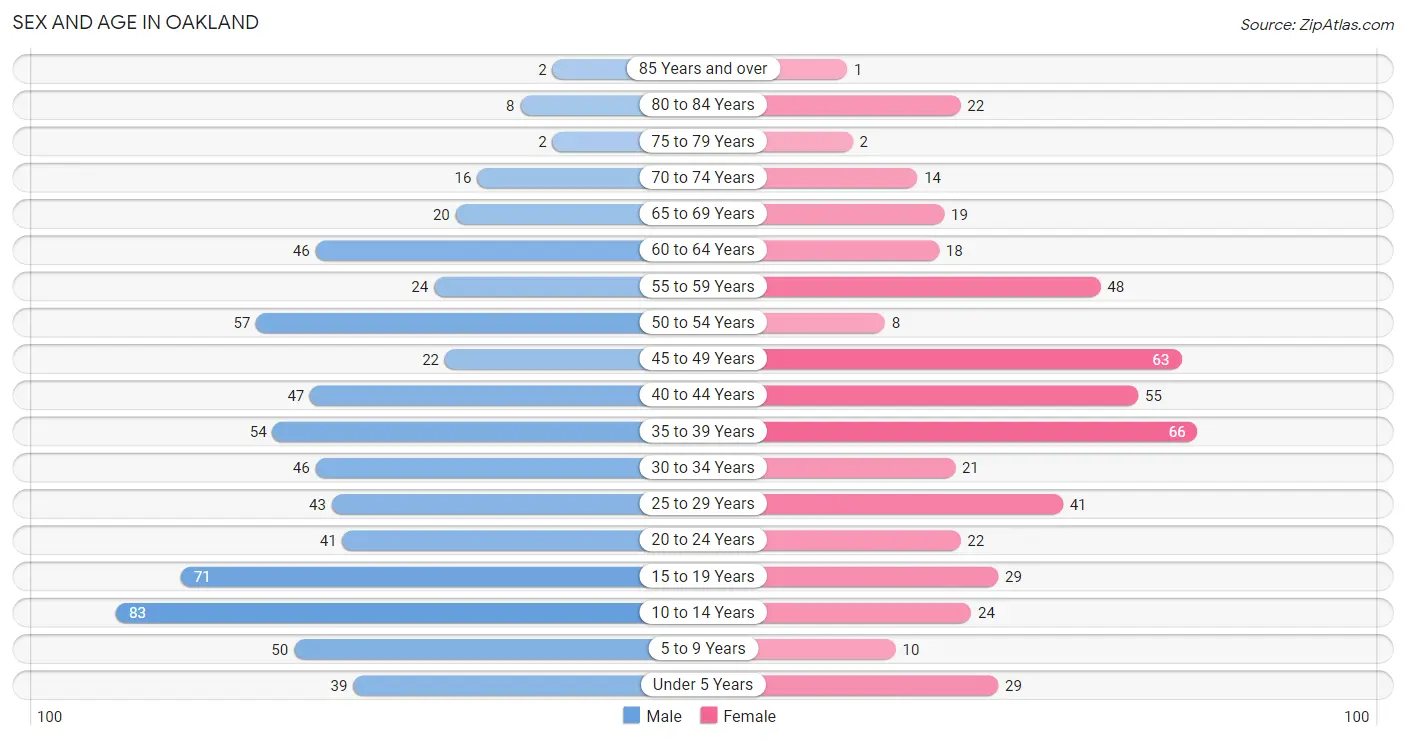
| Age Bracket | Male | Female |
| Under 5 Years | 39 (5.8%) | 29 (5.9%) |
| 5 to 9 Years | 50 (7.4%) | 10 (2.0%) |
| 10 to 14 Years | 83 (12.4%) | 24 (4.9%) |
| 15 to 19 Years | 71 (10.6%) | 29 (5.9%) |
| 20 to 24 Years | 41 (6.1%) | 22 (4.5%) |
| 25 to 29 Years | 43 (6.4%) | 41 (8.3%) |
| 30 to 34 Years | 46 (6.9%) | 21 (4.3%) |
| 35 to 39 Years | 54 (8.1%) | 66 (13.4%) |
| 40 to 44 Years | 47 (7.0%) | 55 (11.2%) |
| 45 to 49 Years | 22 (3.3%) | 63 (12.8%) |
| 50 to 54 Years | 57 (8.5%) | 8 (1.6%) |
| 55 to 59 Years | 24 (3.6%) | 48 (9.8%) |
| 60 to 64 Years | 46 (6.9%) | 18 (3.7%) |
| 65 to 69 Years | 20 (3.0%) | 19 (3.9%) |
| 70 to 74 Years | 16 (2.4%) | 14 (2.9%) |
| 75 to 79 Years | 2 (0.3%) | 2 (0.4%) |
| 80 to 84 Years | 8 (1.2%) | 22 (4.5%) |
| 85 Years and over | 2 (0.3%) | 1 (0.2%) |
| Total | 671 (100.0%) | 492 (100.0%) |
Families and Households in Oakland
Median Family Size in Oakland
The median family size in Oakland is 4.51 persons per family, with married-couple families (161 | 72.2%) accounting for the largest median family size of 4.98 persons per family. On the other hand, single male/father families (13 | 5.8%) represent the smallest median family size with 3.23 persons per family.
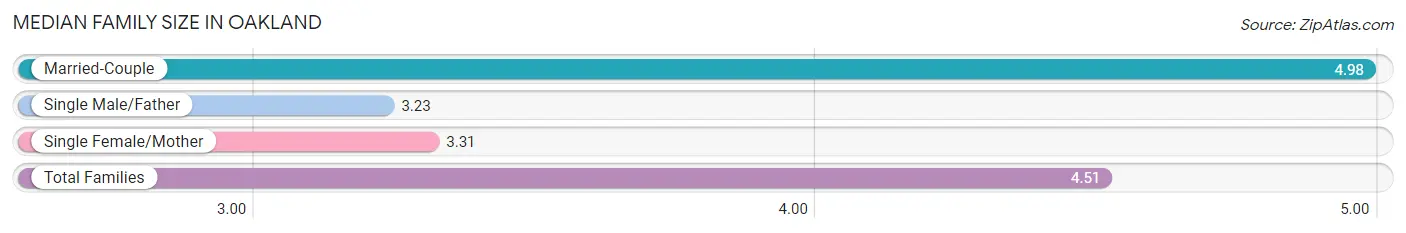
| Family Type | # Families | Family Size |
| Married-Couple | 161 (72.2%) | 4.98 |
| Single Male/Father | 13 (5.8%) | 3.23 |
| Single Female/Mother | 49 (22.0%) | 3.31 |
| Total Families | 223 (100.0%) | 4.51 |
Median Household Size in Oakland
The median household size in Oakland is 3.65 persons per household, with married-couple households (161 | 50.5%) accounting for the largest median household size of 5.02 persons per household. non-family households (96 | 30.1%) represent the smallest median household size with 1.31 persons per household.
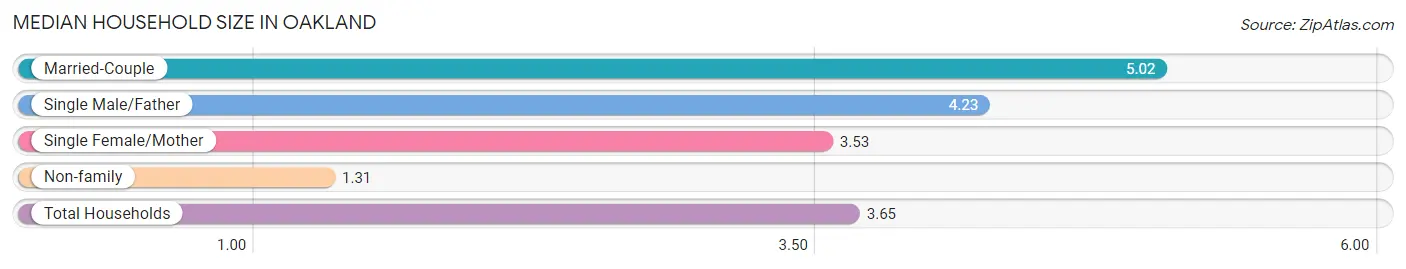
| Household Type | # Households | Household Size |
| Married-Couple | 161 (50.5%) | 5.02 |
| Single Male/Father | 13 (4.1%) | 4.23 |
| Single Female/Mother | 49 (15.4%) | 3.53 |
| Non-family | 96 (30.1%) | 1.31 |
| Total Households | 319 (100.0%) | 3.65 |
Household Size by Marriage Status in Oakland
Out of a total of 319 households in Oakland, 223 (69.9%) are family households, while 96 (30.1%) are nonfamily households. The most numerous type of family households are 2-person households, comprising 63, and the most common type of nonfamily households are 1-person households, comprising 84.
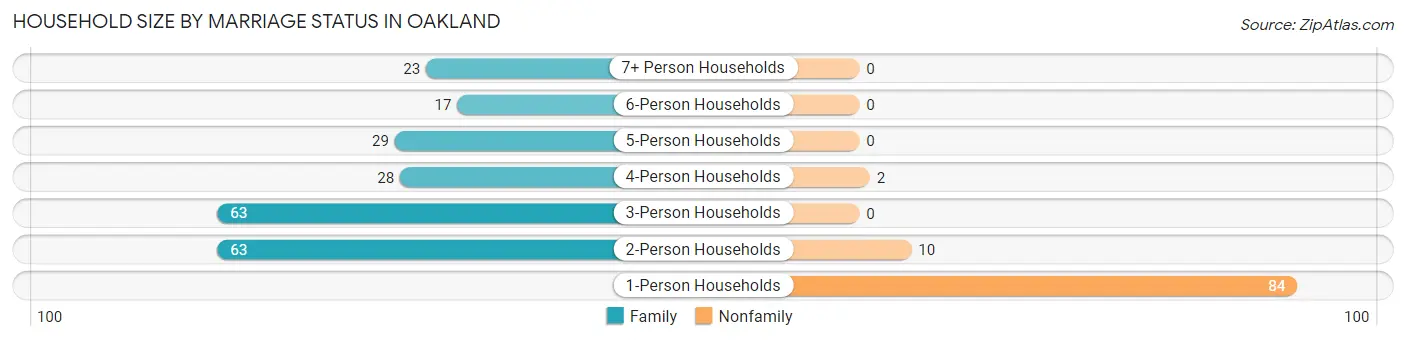
| Household Size | Family Households | Nonfamily Households |
| 1-Person Households | - | 84 (26.3%) |
| 2-Person Households | 63 (19.8%) | 10 (3.1%) |
| 3-Person Households | 63 (19.8%) | 0 (0.0%) |
| 4-Person Households | 28 (8.8%) | 2 (0.6%) |
| 5-Person Households | 29 (9.1%) | 0 (0.0%) |
| 6-Person Households | 17 (5.3%) | 0 (0.0%) |
| 7+ Person Households | 23 (7.2%) | 0 (0.0%) |
| Total | 223 (69.9%) | 96 (30.1%) |
Female Fertility in Oakland
Fertility by Age in Oakland
Average fertility rate in Oakland is 141.0 births per 1,000 women. Women in the age bracket of 35 to 50 years have the highest fertility rate with 162.0 births per 1,000 women. Women in the age bracket of 35 to 50 years acount for 71.4% of all women with births.
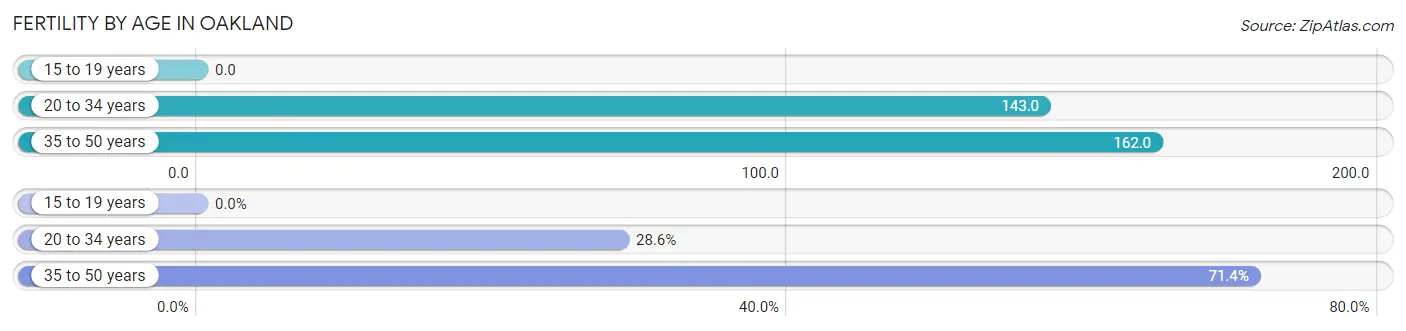
| Age Bracket | Women with Births | Births / 1,000 Women |
| 15 to 19 years | 0 (0.0%) | 0.0 |
| 20 to 34 years | 12 (28.6%) | 143.0 |
| 35 to 50 years | 30 (71.4%) | 162.0 |
| Total | 42 (100.0%) | 141.0 |
Fertility by Age by Marriage Status in Oakland
14.3% of women with births (42) in Oakland are married. The highest percentage of unmarried women with births falls into 35 to 50 years age bracket with 100.0% of them unmarried at the time of birth, while the lowest percentage of unmarried women with births belong to 20 to 34 years age bracket with 50.0% of them unmarried.
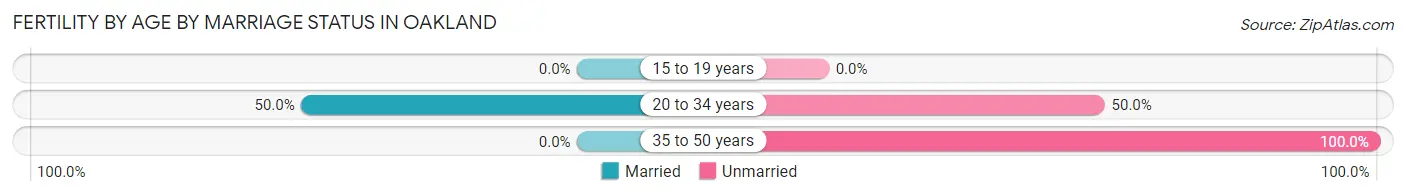
| Age Bracket | Married | Unmarried |
| 15 to 19 years | 0 (0.0%) | 0 (0.0%) |
| 20 to 34 years | 6 (50.0%) | 6 (50.0%) |
| 35 to 50 years | 0 (0.0%) | 30 (100.0%) |
| Total | 6 (14.3%) | 36 (85.7%) |
Fertility by Education in Oakland
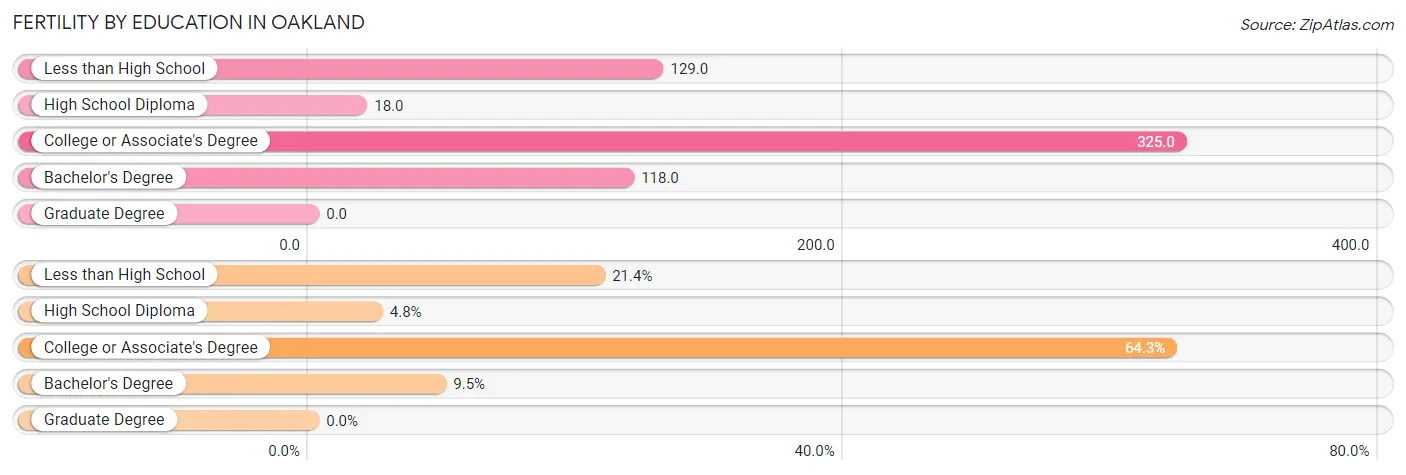
| Educational Attainment | Women with Births | Births / 1,000 Women |
| Less than High School | 9 (21.4%) | 129.0 |
| High School Diploma | 2 (4.8%) | 18.0 |
| College or Associate's Degree | 27 (64.3%) | 325.0 |
| Bachelor's Degree | 4 (9.5%) | 118.0 |
| Graduate Degree | 0 (0.0%) | 0.0 |
| Total | 42 (100.0%) | 141.0 |
Fertility by Education by Marriage Status in Oakland
85.7% of women with births in Oakland are unmarried. Women with the educational attainment of college or associate's degree are most likely to be married with 22.2% of them married at childbirth, while women with the educational attainment of less than high school are least likely to be married with 100.0% of them unmarried at childbirth.
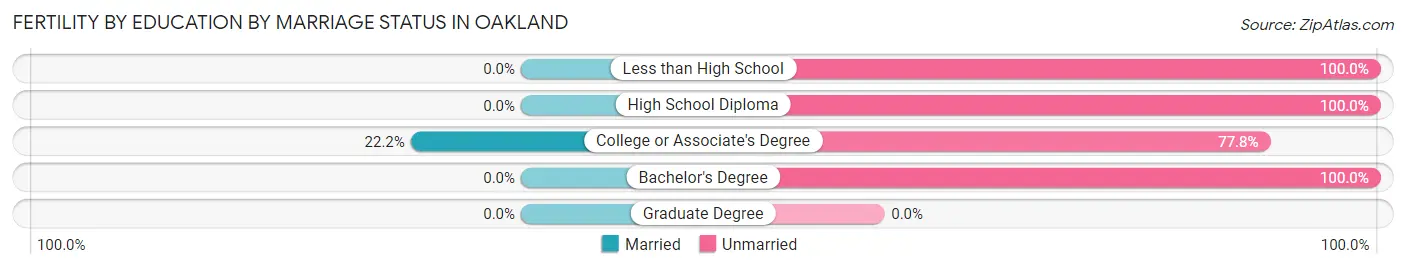
| Educational Attainment | Married | Unmarried |
| Less than High School | 0 (0.0%) | 9 (100.0%) |
| High School Diploma | 0 (0.0%) | 2 (100.0%) |
| College or Associate's Degree | 6 (22.2%) | 21 (77.8%) |
| Bachelor's Degree | 0 (0.0%) | 4 (100.0%) |
| Graduate Degree | 0 (0.0%) | 0 (0.0%) |
| Total | 6 (14.3%) | 36 (85.7%) |
Employment Characteristics in Oakland
Employment by Class of Employer in Oakland
Among the 520 employed individuals in Oakland, private company employees (358 | 68.9%), local government employees (50 | 9.6%), and state government employees (28 | 5.4%) make up the most common classes of employment.
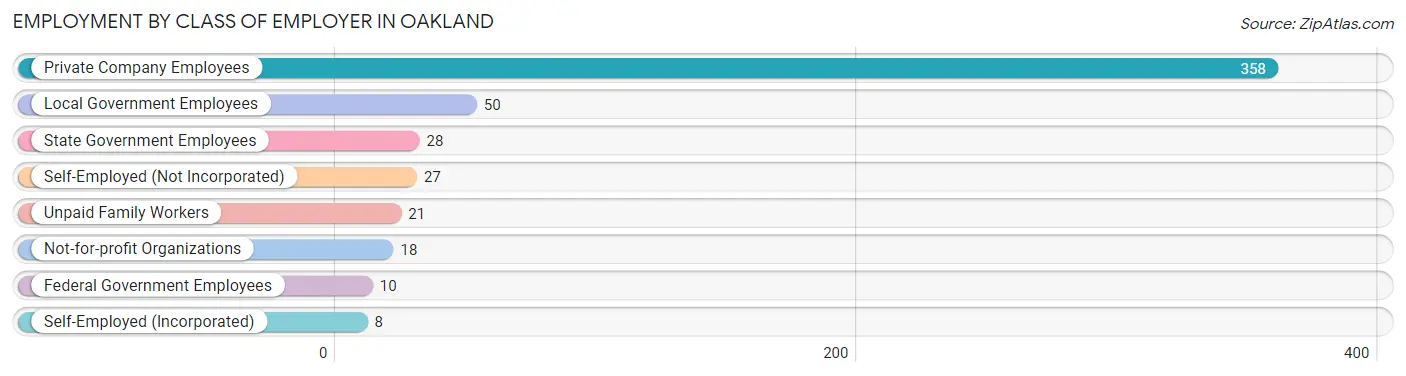
| Employer Class | # Employees | % Employees |
| Private Company Employees | 358 | 68.9% |
| Self-Employed (Incorporated) | 8 | 1.5% |
| Self-Employed (Not Incorporated) | 27 | 5.2% |
| Not-for-profit Organizations | 18 | 3.5% |
| Local Government Employees | 50 | 9.6% |
| State Government Employees | 28 | 5.4% |
| Federal Government Employees | 10 | 1.9% |
| Unpaid Family Workers | 21 | 4.0% |
| Total | 520 | 100.0% |
Employment Status by Age in Oakland
According to the labor force statistics for Oakland, out of the total population over 16 years of age (905), 68.3% or 618 individuals are in the labor force, with 11.7% or 72 of them unemployed. The age group with the highest labor force participation rate is 45 to 54 years, with 93.3% or 140 individuals in the labor force. Within the labor force, the 25 to 29 years age range has the highest percentage of unemployed individuals, with 33.8% or 24 of them being unemployed.
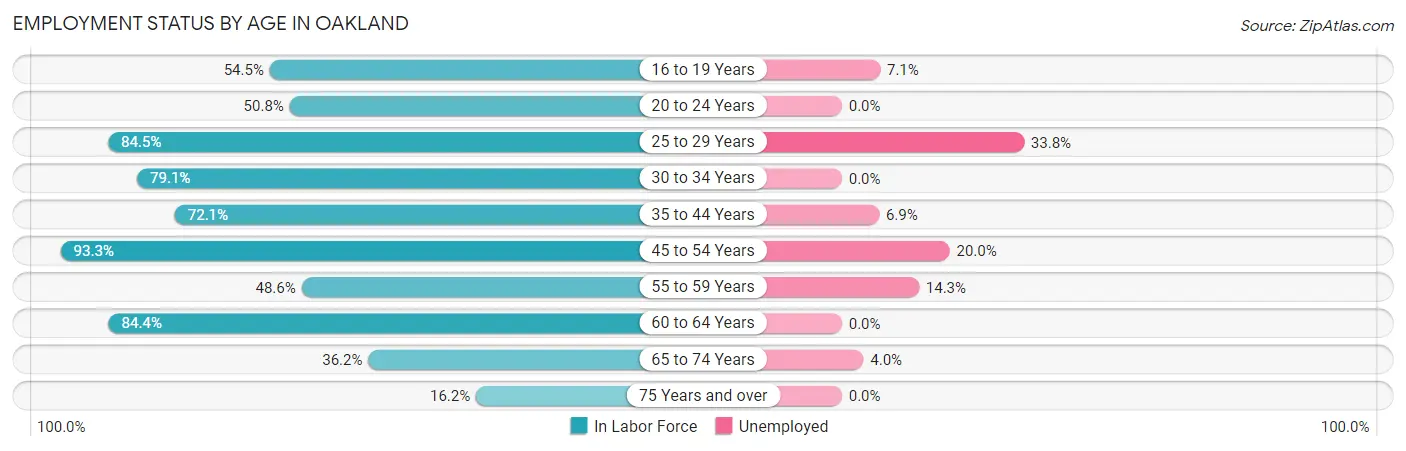
| Age Bracket | In Labor Force | Unemployed |
| 16 to 19 Years | 42 (54.5%) | 3 (7.1%) |
| 20 to 24 Years | 32 (50.8%) | 0 (0.0%) |
| 25 to 29 Years | 71 (84.5%) | 24 (33.8%) |
| 30 to 34 Years | 53 (79.1%) | 0 (0.0%) |
| 35 to 44 Years | 160 (72.1%) | 11 (6.9%) |
| 45 to 54 Years | 140 (93.3%) | 28 (20.0%) |
| 55 to 59 Years | 35 (48.6%) | 5 (14.3%) |
| 60 to 64 Years | 54 (84.4%) | 0 (0.0%) |
| 65 to 74 Years | 25 (36.2%) | 1 (4.0%) |
| 75 Years and over | 6 (16.2%) | 0 (0.0%) |
| Total | 618 (68.3%) | 72 (11.7%) |
Employment Status by Educational Attainment in Oakland
According to labor force statistics for Oakland, 77.8% of individuals (513) out of the total population between 25 and 64 years of age (659) are in the labor force, with 13.3% or 68 of them being unemployed. The group with the highest labor force participation rate are those with the educational attainment of college / associate degree, with 91.2% or 114 individuals in the labor force. Within the labor force, individuals with high school diploma education have the highest percentage of unemployment, with 21.8% or 50 of them being unemployed.
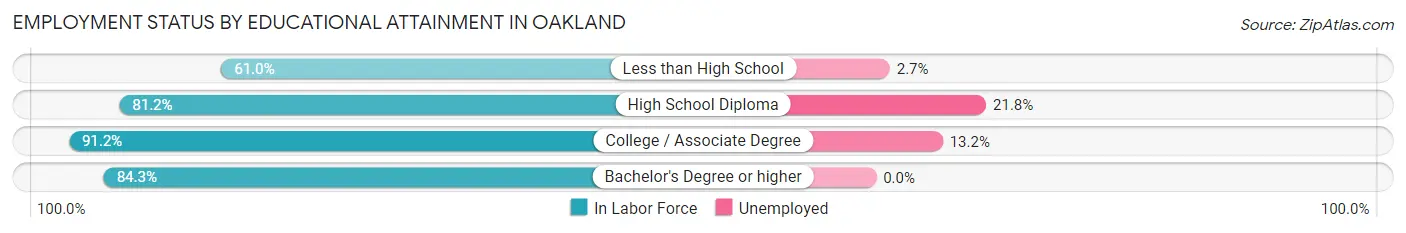
| Educational Attainment | In Labor Force | Unemployed |
| Less than High School | 111 (61.0%) | 5 (2.7%) |
| High School Diploma | 229 (81.2%) | 61 (21.8%) |
| College / Associate Degree | 114 (91.2%) | 16 (13.2%) |
| Bachelor's Degree or higher | 59 (84.3%) | 0 (0.0%) |
| Total | 513 (77.8%) | 88 (13.3%) |
Employment Occupations by Sex in Oakland
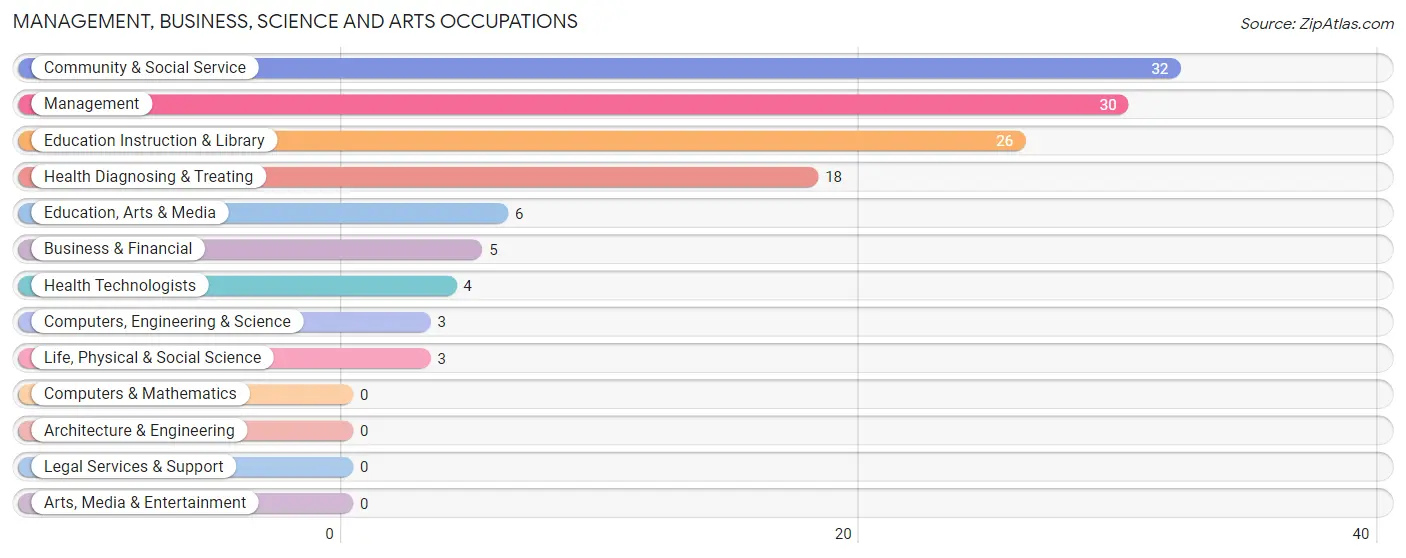
Management, Business, Science and Arts Occupations
The most common Management, Business, Science and Arts occupations in Oakland are Community & Social Service (32 | 5.9%), Management (30 | 5.5%), Education Instruction & Library (26 | 4.8%), Health Diagnosing & Treating (18 | 3.3%), and Education, Arts & Media (6 | 1.1%).
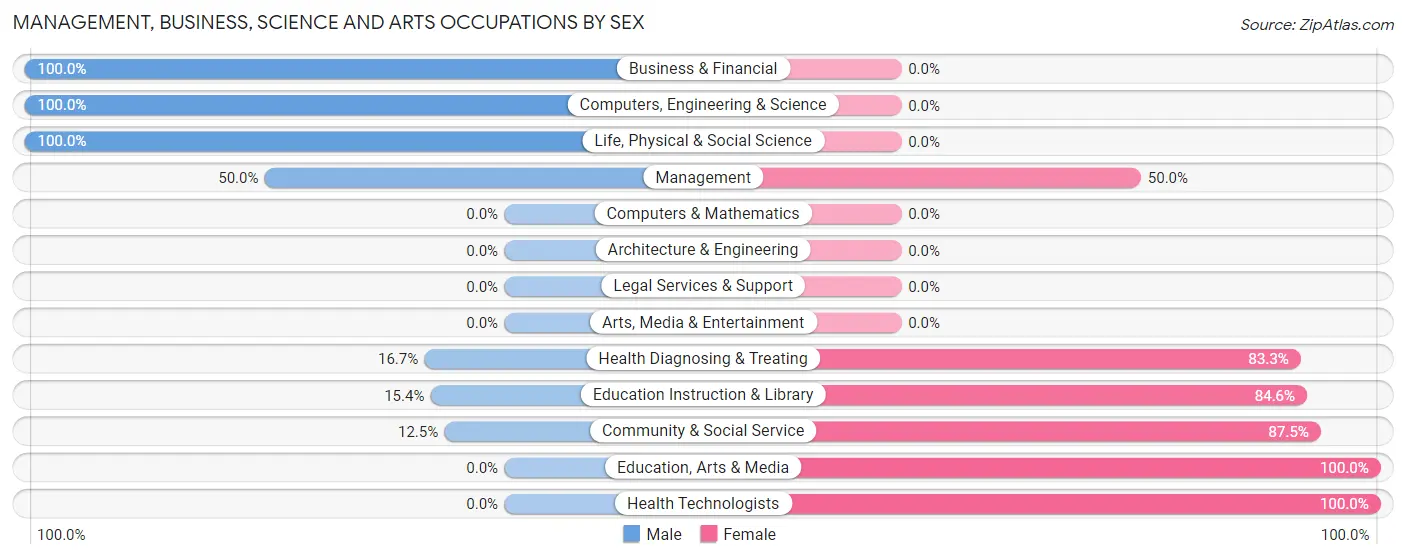
Management, Business, Science and Arts Occupations by Sex
Within the Management, Business, Science and Arts occupations in Oakland, the most male-oriented occupations are Business & Financial (100.0%), Computers, Engineering & Science (100.0%), and Life, Physical & Social Science (100.0%), while the most female-oriented occupations are Education, Arts & Media (100.0%), Health Technologists (100.0%), and Community & Social Service (87.5%).
| Occupation | Male | Female |
| Management | 15 (50.0%) | 15 (50.0%) |
| Business & Financial | 5 (100.0%) | 0 (0.0%) |
| Computers, Engineering & Science | 3 (100.0%) | 0 (0.0%) |
| Computers & Mathematics | 0 (0.0%) | 0 (0.0%) |
| Architecture & Engineering | 0 (0.0%) | 0 (0.0%) |
| Life, Physical & Social Science | 3 (100.0%) | 0 (0.0%) |
| Community & Social Service | 4 (12.5%) | 28 (87.5%) |
| Education, Arts & Media | 0 (0.0%) | 6 (100.0%) |
| Legal Services & Support | 0 (0.0%) | 0 (0.0%) |
| Education Instruction & Library | 4 (15.4%) | 22 (84.6%) |
| Arts, Media & Entertainment | 0 (0.0%) | 0 (0.0%) |
| Health Diagnosing & Treating | 3 (16.7%) | 15 (83.3%) |
| Health Technologists | 0 (0.0%) | 4 (100.0%) |
| Total (Category) | 30 (34.1%) | 58 (65.9%) |
| Total (Overall) | 297 (54.4%) | 249 (45.6%) |
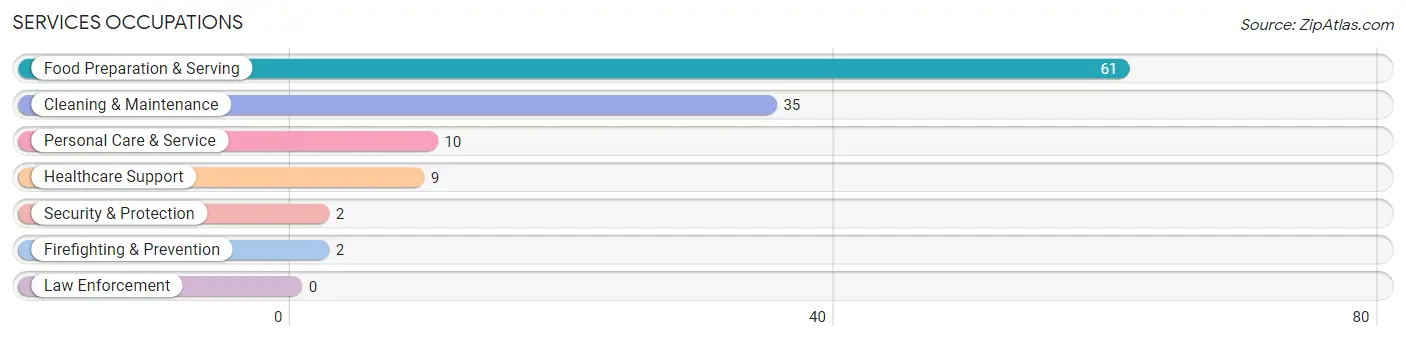
Services Occupations
The most common Services occupations in Oakland are Food Preparation & Serving (61 | 11.2%), Cleaning & Maintenance (35 | 6.4%), Personal Care & Service (10 | 1.8%), Healthcare Support (9 | 1.7%), and Security & Protection (2 | 0.4%).
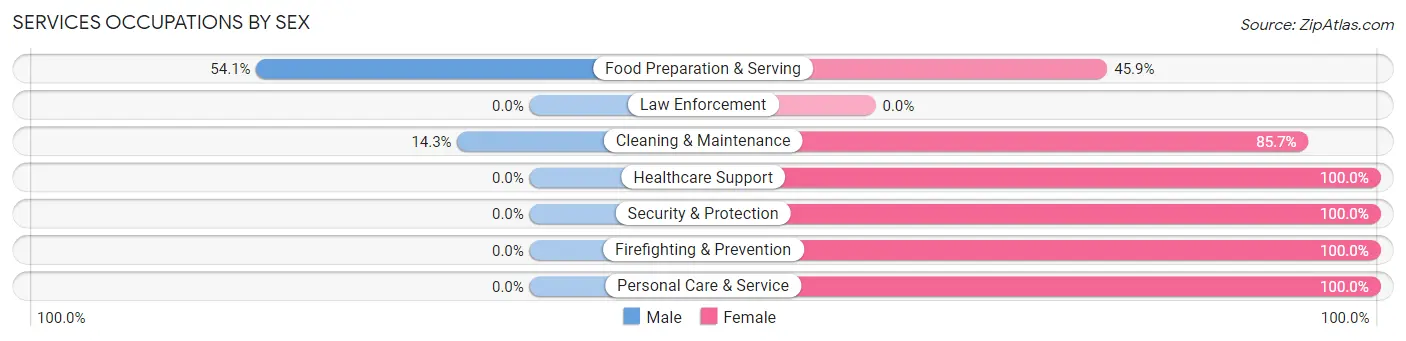
Services Occupations by Sex
Within the Services occupations in Oakland, the most male-oriented occupations are Food Preparation & Serving (54.1%), and Cleaning & Maintenance (14.3%), while the most female-oriented occupations are Healthcare Support (100.0%), Security & Protection (100.0%), and Firefighting & Prevention (100.0%).
| Occupation | Male | Female |
| Healthcare Support | 0 (0.0%) | 9 (100.0%) |
| Security & Protection | 0 (0.0%) | 2 (100.0%) |
| Firefighting & Prevention | 0 (0.0%) | 2 (100.0%) |
| Law Enforcement | 0 (0.0%) | 0 (0.0%) |
| Food Preparation & Serving | 33 (54.1%) | 28 (45.9%) |
| Cleaning & Maintenance | 5 (14.3%) | 30 (85.7%) |
| Personal Care & Service | 0 (0.0%) | 10 (100.0%) |
| Total (Category) | 38 (32.5%) | 79 (67.5%) |
| Total (Overall) | 297 (54.4%) | 249 (45.6%) |
Sales and Office Occupations
The most common Sales and Office occupations in Oakland are Sales & Related (63 | 11.5%), and Office & Administration (32 | 5.9%).
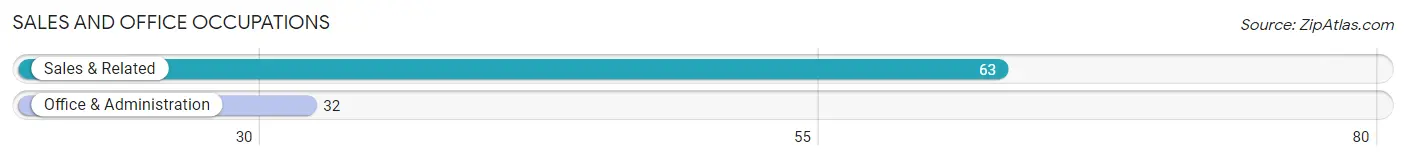
Sales and Office Occupations by Sex
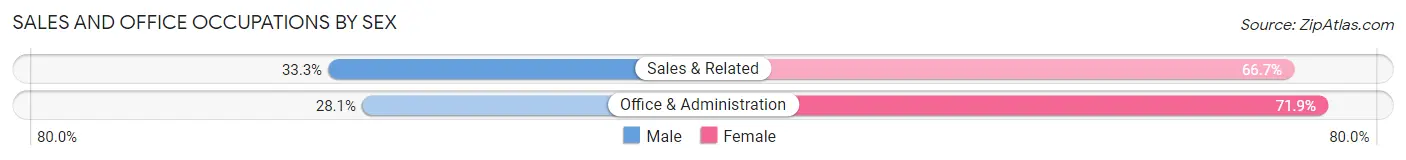
| Occupation | Male | Female |
| Sales & Related | 21 (33.3%) | 42 (66.7%) |
| Office & Administration | 9 (28.1%) | 23 (71.9%) |
| Total (Category) | 30 (31.6%) | 65 (68.4%) |
| Total (Overall) | 297 (54.4%) | 249 (45.6%) |
Natural Resources, Construction and Maintenance Occupations
The most common Natural Resources, Construction and Maintenance occupations in Oakland are Construction & Extraction (46 | 8.4%), and Installation, Maintenance & Repair (7 | 1.3%).
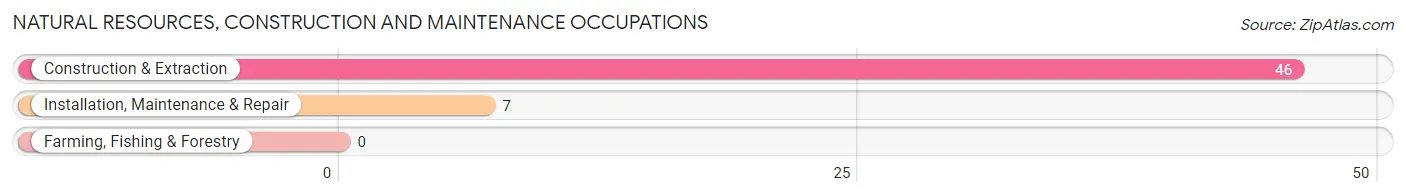
Natural Resources, Construction and Maintenance Occupations by Sex
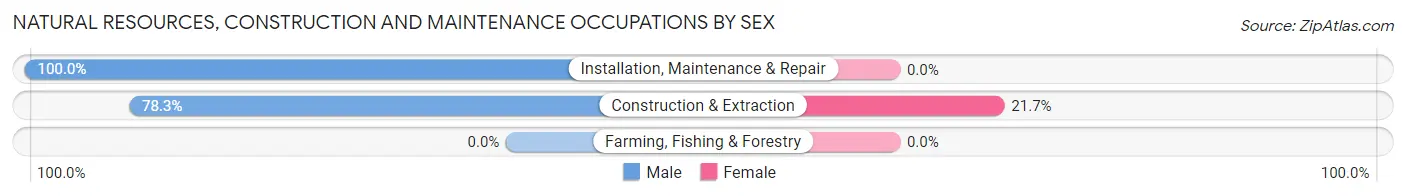
| Occupation | Male | Female |
| Farming, Fishing & Forestry | 0 (0.0%) | 0 (0.0%) |
| Construction & Extraction | 36 (78.3%) | 10 (21.7%) |
| Installation, Maintenance & Repair | 7 (100.0%) | 0 (0.0%) |
| Total (Category) | 43 (81.1%) | 10 (18.9%) |
| Total (Overall) | 297 (54.4%) | 249 (45.6%) |
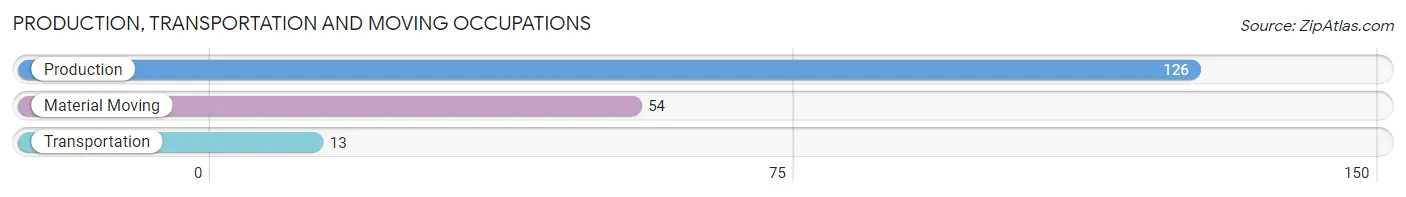
Production, Transportation and Moving Occupations
The most common Production, Transportation and Moving occupations in Oakland are Production (126 | 23.1%), Material Moving (54 | 9.9%), and Transportation (13 | 2.4%).
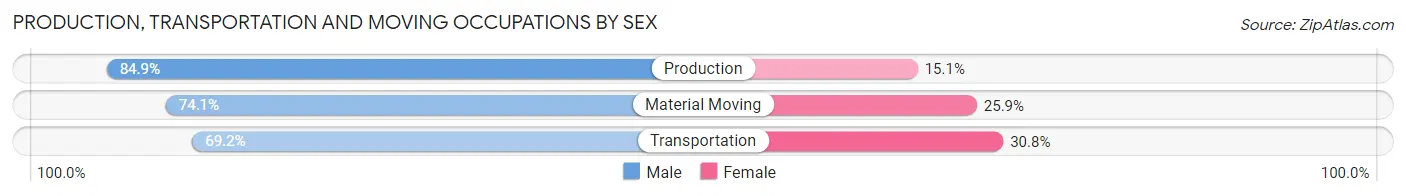
Production, Transportation and Moving Occupations by Sex
| Occupation | Male | Female |
| Production | 107 (84.9%) | 19 (15.1%) |
| Transportation | 9 (69.2%) | 4 (30.8%) |
| Material Moving | 40 (74.1%) | 14 (25.9%) |
| Total (Category) | 156 (80.8%) | 37 (19.2%) |
| Total (Overall) | 297 (54.4%) | 249 (45.6%) |
Employment Industries by Sex in Oakland
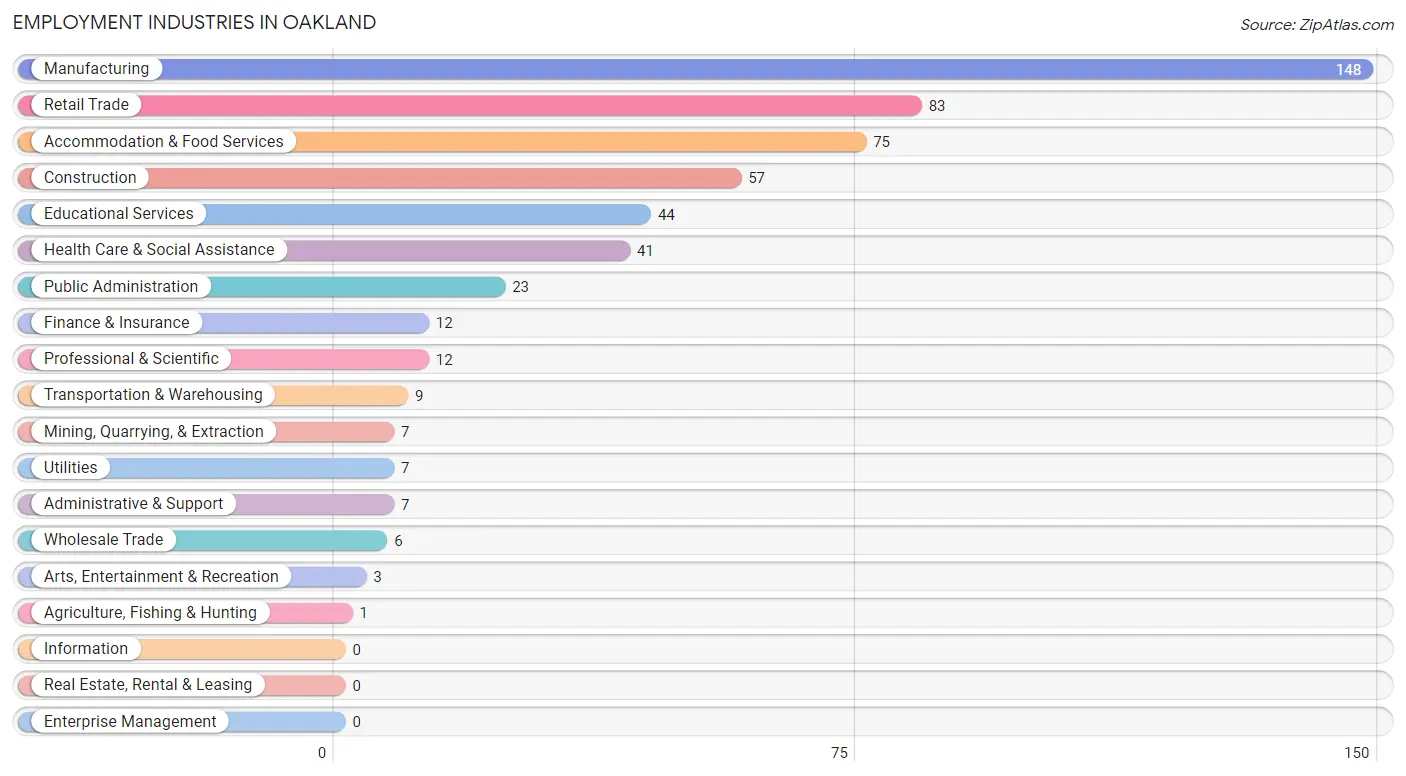
Employment Industries in Oakland
The major employment industries in Oakland include Manufacturing (148 | 27.1%), Retail Trade (83 | 15.2%), Accommodation & Food Services (75 | 13.7%), Construction (57 | 10.4%), and Educational Services (44 | 8.1%).
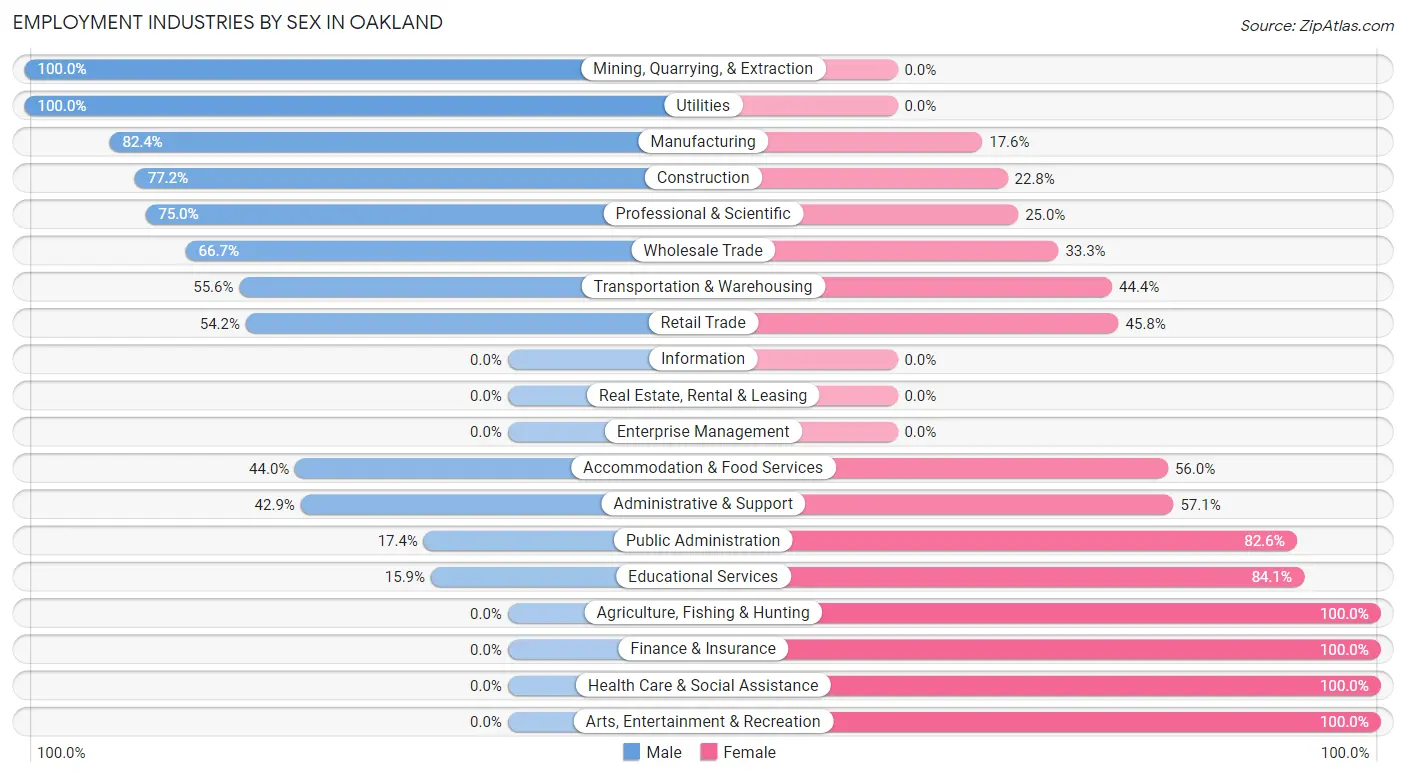
Employment Industries by Sex in Oakland
The Oakland industries that see more men than women are Mining, Quarrying, & Extraction (100.0%), Utilities (100.0%), and Manufacturing (82.4%), whereas the industries that tend to have a higher number of women are Agriculture, Fishing & Hunting (100.0%), Finance & Insurance (100.0%), and Health Care & Social Assistance (100.0%).
| Industry | Male | Female |
| Agriculture, Fishing & Hunting | 0 (0.0%) | 1 (100.0%) |
| Mining, Quarrying, & Extraction | 7 (100.0%) | 0 (0.0%) |
| Construction | 44 (77.2%) | 13 (22.8%) |
| Manufacturing | 122 (82.4%) | 26 (17.6%) |
| Wholesale Trade | 4 (66.7%) | 2 (33.3%) |
| Retail Trade | 45 (54.2%) | 38 (45.8%) |
| Transportation & Warehousing | 5 (55.6%) | 4 (44.4%) |
| Utilities | 7 (100.0%) | 0 (0.0%) |
| Information | 0 (0.0%) | 0 (0.0%) |
| Finance & Insurance | 0 (0.0%) | 12 (100.0%) |
| Real Estate, Rental & Leasing | 0 (0.0%) | 0 (0.0%) |
| Professional & Scientific | 9 (75.0%) | 3 (25.0%) |
| Enterprise Management | 0 (0.0%) | 0 (0.0%) |
| Administrative & Support | 3 (42.9%) | 4 (57.1%) |
| Educational Services | 7 (15.9%) | 37 (84.1%) |
| Health Care & Social Assistance | 0 (0.0%) | 41 (100.0%) |
| Arts, Entertainment & Recreation | 0 (0.0%) | 3 (100.0%) |
| Accommodation & Food Services | 33 (44.0%) | 42 (56.0%) |
| Public Administration | 4 (17.4%) | 19 (82.6%) |
| Total | 297 (54.4%) | 249 (45.6%) |
Education in Oakland
School Enrollment in Oakland
The most common levels of schooling among the 305 students in Oakland are high school (86 | 28.2%), middle school (74 | 24.3%), and elementary school (63 | 20.7%).
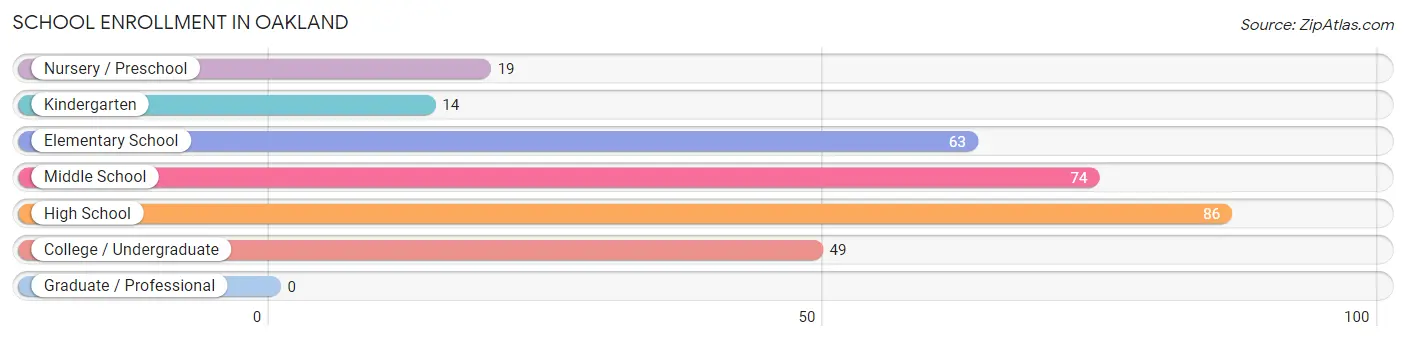
| School Level | # Students | % Students |
| Nursery / Preschool | 19 | 6.2% |
| Kindergarten | 14 | 4.6% |
| Elementary School | 63 | 20.7% |
| Middle School | 74 | 24.3% |
| High School | 86 | 28.2% |
| College / Undergraduate | 49 | 16.1% |
| Graduate / Professional | 0 | 0.0% |
| Total | 305 | 100.0% |
School Enrollment by Age by Funding Source in Oakland
Out of a total of 305 students who are enrolled in schools in Oakland, 15 (4.9%) attend a private institution, while the remaining 290 (95.1%) are enrolled in public schools. The age group of 18 to 19 year olds has the highest likelihood of being enrolled in private schools, with 10 (43.5% in the age bracket) enrolled. Conversely, the age group of 3 to 4 year olds has the lowest likelihood of being enrolled in a private school, with 12 (100.0% in the age bracket) attending a public institution.
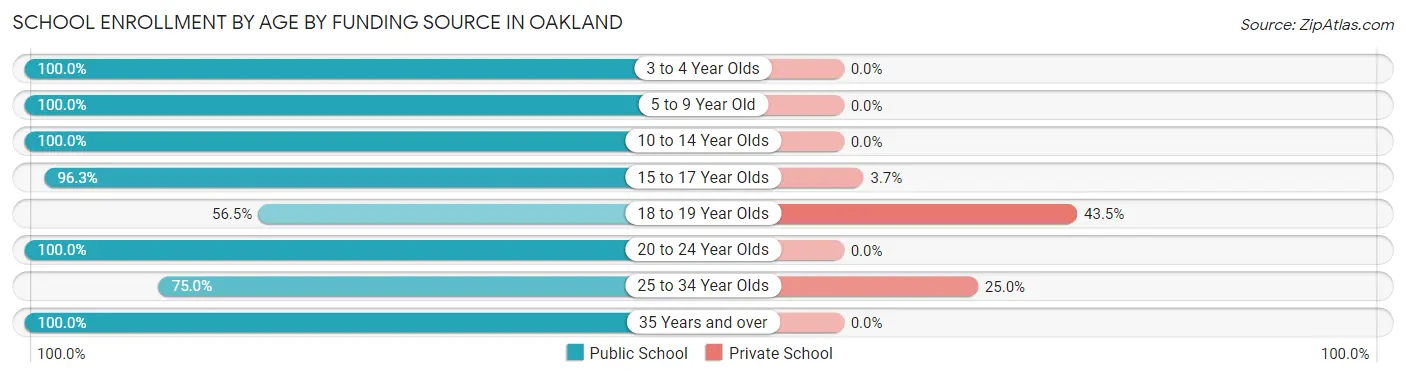
| Age Bracket | Public School | Private School |
| 3 to 4 Year Olds | 12 (100.0%) | 0 (0.0%) |
| 5 to 9 Year Old | 60 (100.0%) | 0 (0.0%) |
| 10 to 14 Year Olds | 107 (100.0%) | 0 (0.0%) |
| 15 to 17 Year Olds | 52 (96.3%) | 2 (3.7%) |
| 18 to 19 Year Olds | 13 (56.5%) | 10 (43.5%) |
| 20 to 24 Year Olds | 16 (100.0%) | 0 (0.0%) |
| 25 to 34 Year Olds | 9 (75.0%) | 3 (25.0%) |
| 35 Years and over | 21 (100.0%) | 0 (0.0%) |
| Total | 290 (95.1%) | 15 (4.9%) |
Educational Attainment by Field of Study in Oakland
Communications (18 | 19.6%), education (16 | 17.4%), business (13 | 14.1%), liberal arts & history (12 | 13.0%), and bio, nature & agricultural (10 | 10.9%) are the most common fields of study among 92 individuals in Oakland who have obtained a bachelor's degree or higher.
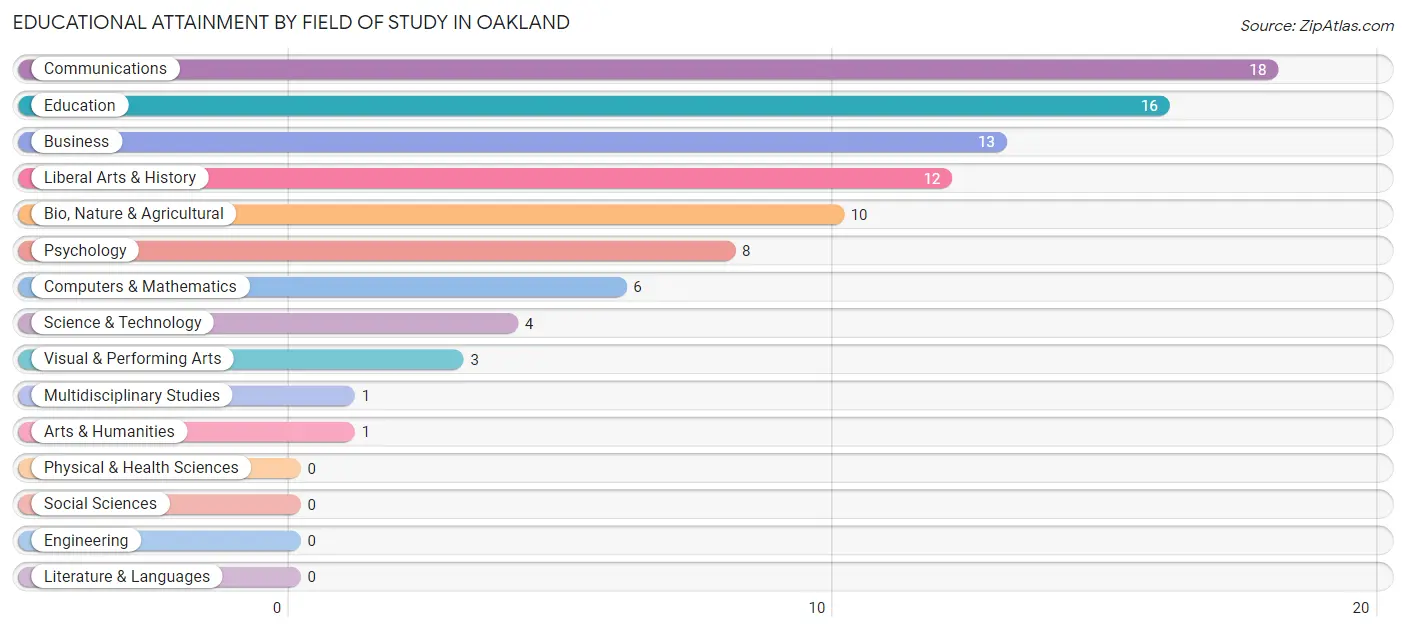
| Field of Study | # Graduates | % Graduates |
| Computers & Mathematics | 6 | 6.5% |
| Bio, Nature & Agricultural | 10 | 10.9% |
| Physical & Health Sciences | 0 | 0.0% |
| Psychology | 8 | 8.7% |
| Social Sciences | 0 | 0.0% |
| Engineering | 0 | 0.0% |
| Multidisciplinary Studies | 1 | 1.1% |
| Science & Technology | 4 | 4.3% |
| Business | 13 | 14.1% |
| Education | 16 | 17.4% |
| Literature & Languages | 0 | 0.0% |
| Liberal Arts & History | 12 | 13.0% |
| Visual & Performing Arts | 3 | 3.3% |
| Communications | 18 | 19.6% |
| Arts & Humanities | 1 | 1.1% |
| Total | 92 | 100.0% |
Transportation & Commute in Oakland
Vehicle Availability by Sex in Oakland
The most prevalent vehicle ownership categories in Oakland are males with 2 vehicles (80, accounting for 28.5%) and females with 2 vehicles (65, making up 33.5%).
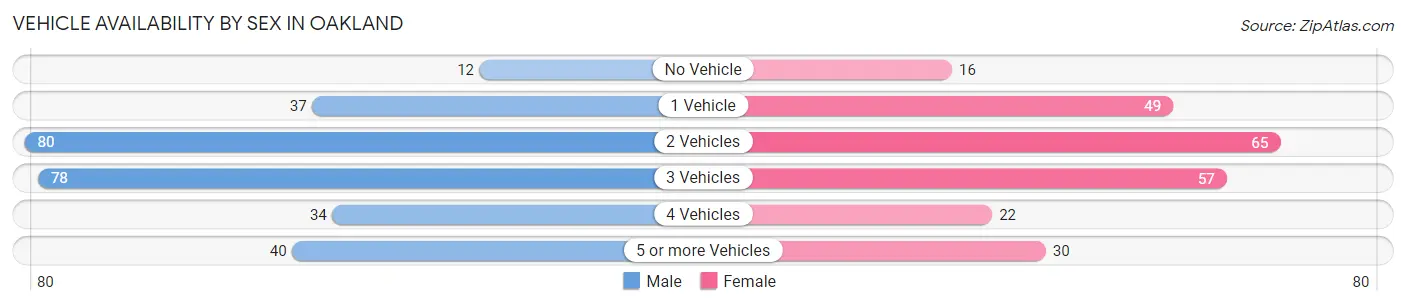
| Vehicles Available | Male | Female |
| No Vehicle | 12 (4.3%) | 16 (6.7%) |
| 1 Vehicle | 37 (13.2%) | 49 (20.5%) |
| 2 Vehicles | 80 (28.5%) | 65 (27.2%) |
| 3 Vehicles | 78 (27.8%) | 57 (23.8%) |
| 4 Vehicles | 34 (12.1%) | 22 (9.2%) |
| 5 or more Vehicles | 40 (14.2%) | 30 (12.6%) |
| Total | 281 (100.0%) | 239 (100.0%) |
Commute Time in Oakland
The most frequently occuring commute durations in Oakland are 10 to 14 minutes (119 commuters, 23.6%), 30 to 34 minutes (90 commuters, 17.8%), and 5 to 9 minutes (87 commuters, 17.2%).
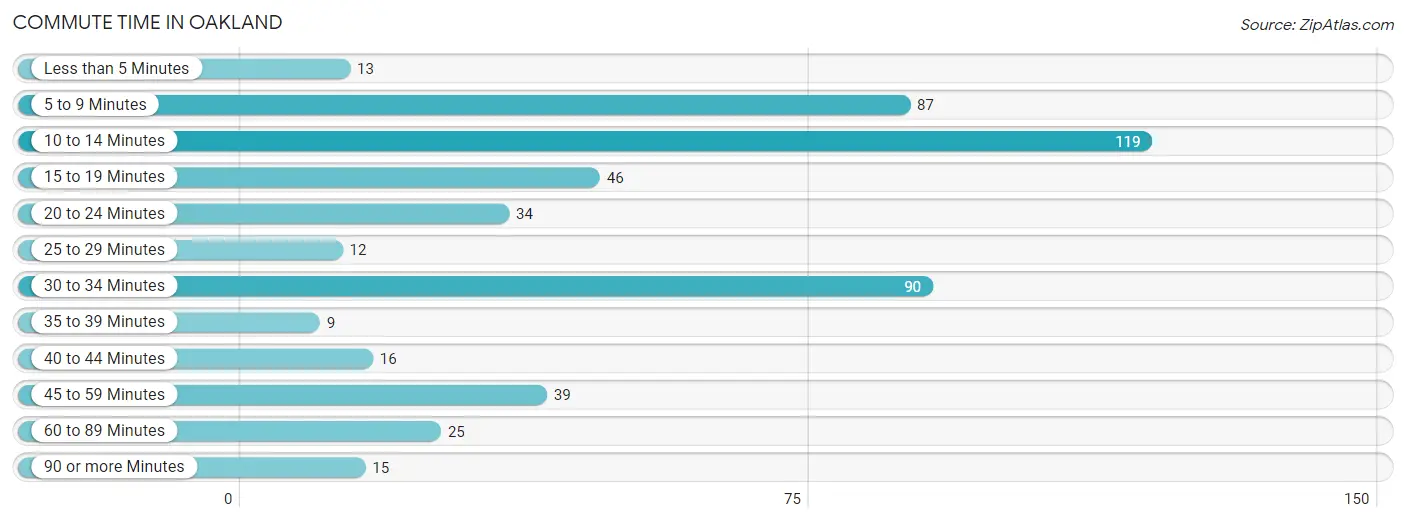
| Commute Time | # Commuters | % Commuters |
| Less than 5 Minutes | 13 | 2.6% |
| 5 to 9 Minutes | 87 | 17.2% |
| 10 to 14 Minutes | 119 | 23.6% |
| 15 to 19 Minutes | 46 | 9.1% |
| 20 to 24 Minutes | 34 | 6.7% |
| 25 to 29 Minutes | 12 | 2.4% |
| 30 to 34 Minutes | 90 | 17.8% |
| 35 to 39 Minutes | 9 | 1.8% |
| 40 to 44 Minutes | 16 | 3.2% |
| 45 to 59 Minutes | 39 | 7.7% |
| 60 to 89 Minutes | 25 | 5.0% |
| 90 or more Minutes | 15 | 3.0% |
Commute Time by Sex in Oakland
The most common commute times in Oakland are 10 to 14 minutes (70 commuters, 25.2%) for males and 30 to 34 minutes (54 commuters, 23.8%) for females.
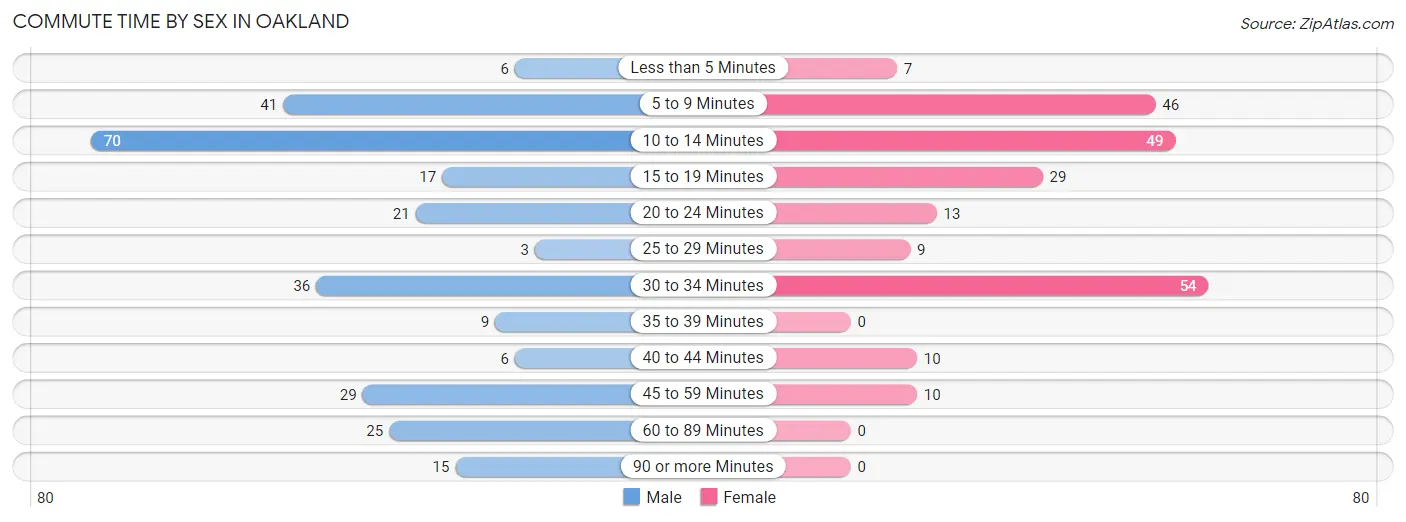
| Commute Time | Male | Female |
| Less than 5 Minutes | 6 (2.2%) | 7 (3.1%) |
| 5 to 9 Minutes | 41 (14.7%) | 46 (20.3%) |
| 10 to 14 Minutes | 70 (25.2%) | 49 (21.6%) |
| 15 to 19 Minutes | 17 (6.1%) | 29 (12.8%) |
| 20 to 24 Minutes | 21 (7.5%) | 13 (5.7%) |
| 25 to 29 Minutes | 3 (1.1%) | 9 (4.0%) |
| 30 to 34 Minutes | 36 (13.0%) | 54 (23.8%) |
| 35 to 39 Minutes | 9 (3.2%) | 0 (0.0%) |
| 40 to 44 Minutes | 6 (2.2%) | 10 (4.4%) |
| 45 to 59 Minutes | 29 (10.4%) | 10 (4.4%) |
| 60 to 89 Minutes | 25 (9.0%) | 0 (0.0%) |
| 90 or more Minutes | 15 (5.4%) | 0 (0.0%) |
Time of Departure to Work by Sex in Oakland
The most frequent times of departure to work in Oakland are 7:00 AM to 7:29 AM (54, 19.4%) for males and 6:30 AM to 6:59 AM (39, 17.2%) for females.
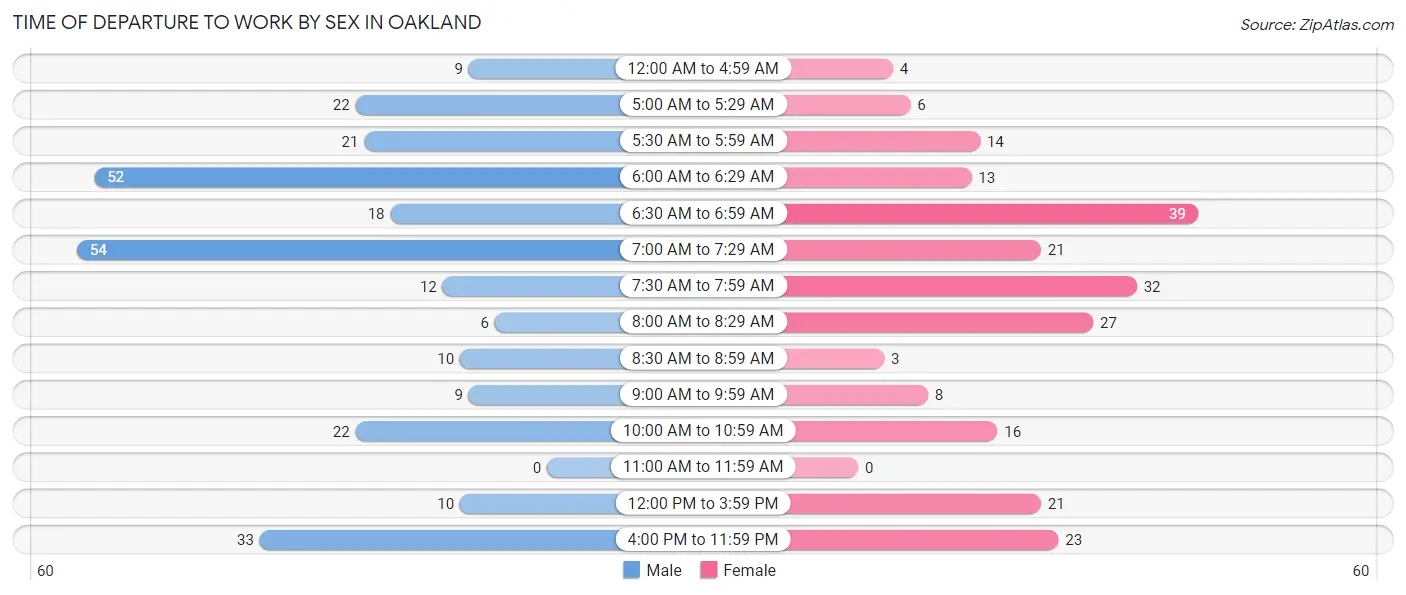
| Time of Departure | Male | Female |
| 12:00 AM to 4:59 AM | 9 (3.2%) | 4 (1.8%) |
| 5:00 AM to 5:29 AM | 22 (7.9%) | 6 (2.6%) |
| 5:30 AM to 5:59 AM | 21 (7.5%) | 14 (6.2%) |
| 6:00 AM to 6:29 AM | 52 (18.7%) | 13 (5.7%) |
| 6:30 AM to 6:59 AM | 18 (6.5%) | 39 (17.2%) |
| 7:00 AM to 7:29 AM | 54 (19.4%) | 21 (9.2%) |
| 7:30 AM to 7:59 AM | 12 (4.3%) | 32 (14.1%) |
| 8:00 AM to 8:29 AM | 6 (2.2%) | 27 (11.9%) |
| 8:30 AM to 8:59 AM | 10 (3.6%) | 3 (1.3%) |
| 9:00 AM to 9:59 AM | 9 (3.2%) | 8 (3.5%) |
| 10:00 AM to 10:59 AM | 22 (7.9%) | 16 (7.0%) |
| 11:00 AM to 11:59 AM | 0 (0.0%) | 0 (0.0%) |
| 12:00 PM to 3:59 PM | 10 (3.6%) | 21 (9.2%) |
| 4:00 PM to 11:59 PM | 33 (11.9%) | 23 (10.1%) |
| Total | 278 (100.0%) | 227 (100.0%) |
Housing Occupancy in Oakland
Occupancy by Ownership in Oakland
Of the total 319 dwellings in Oakland, owner-occupied units account for 205 (64.3%), while renter-occupied units make up 114 (35.7%).
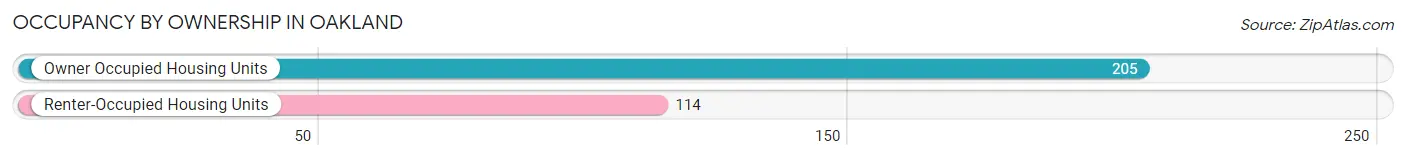
| Occupancy | # Housing Units | % Housing Units |
| Owner Occupied Housing Units | 205 | 64.3% |
| Renter-Occupied Housing Units | 114 | 35.7% |
| Total Occupied Housing Units | 319 | 100.0% |
Occupancy by Household Size in Oakland
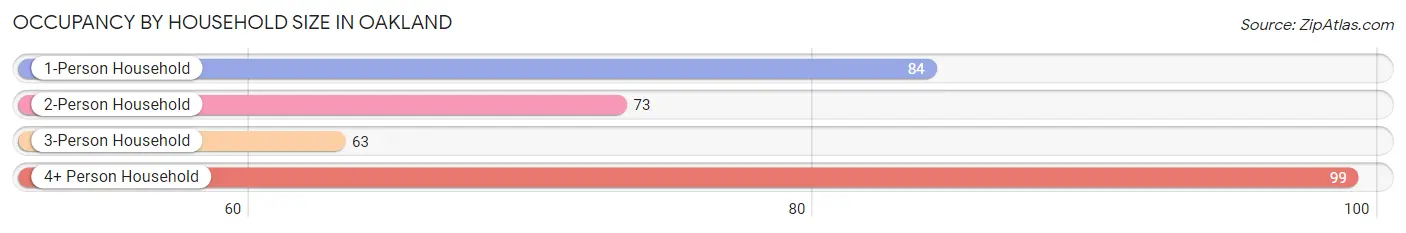
| Household Size | # Housing Units | % Housing Units |
| 1-Person Household | 84 | 26.3% |
| 2-Person Household | 73 | 22.9% |
| 3-Person Household | 63 | 19.8% |
| 4+ Person Household | 99 | 31.0% |
| Total Housing Units | 319 | 100.0% |
Occupancy by Ownership by Household Size in Oakland
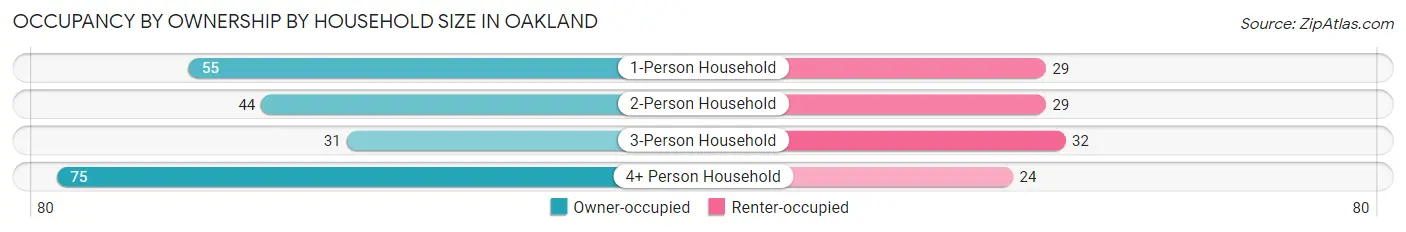
| Household Size | Owner-occupied | Renter-occupied |
| 1-Person Household | 55 (65.5%) | 29 (34.5%) |
| 2-Person Household | 44 (60.3%) | 29 (39.7%) |
| 3-Person Household | 31 (49.2%) | 32 (50.8%) |
| 4+ Person Household | 75 (75.8%) | 24 (24.2%) |
| Total Housing Units | 205 (64.3%) | 114 (35.7%) |
Occupancy by Educational Attainment in Oakland
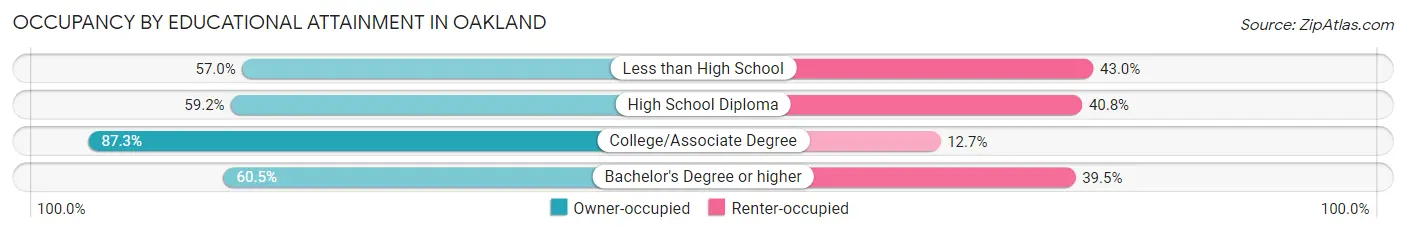
| Household Size | Owner-occupied | Renter-occupied |
| Less than High School | 53 (57.0%) | 40 (43.0%) |
| High School Diploma | 74 (59.2%) | 51 (40.8%) |
| College/Associate Degree | 55 (87.3%) | 8 (12.7%) |
| Bachelor's Degree or higher | 23 (60.5%) | 15 (39.5%) |
Occupancy by Age of Householder in Oakland
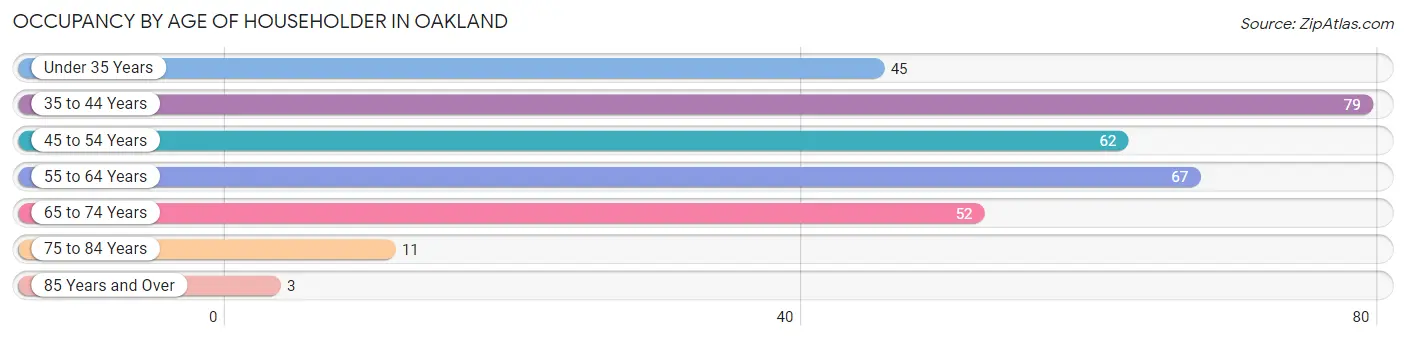
| Age Bracket | # Households | % Households |
| Under 35 Years | 45 | 14.1% |
| 35 to 44 Years | 79 | 24.8% |
| 45 to 54 Years | 62 | 19.4% |
| 55 to 64 Years | 67 | 21.0% |
| 65 to 74 Years | 52 | 16.3% |
| 75 to 84 Years | 11 | 3.5% |
| 85 Years and Over | 3 | 0.9% |
| Total | 319 | 100.0% |
Housing Finances in Oakland
Median Income by Occupancy in Oakland
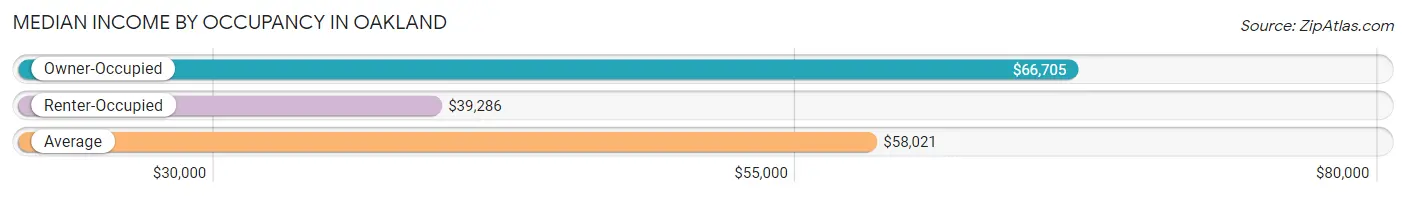
| Occupancy Type | # Households | Median Income |
| Owner-Occupied | 205 (64.3%) | $66,705 |
| Renter-Occupied | 114 (35.7%) | $39,286 |
| Average | 319 (100.0%) | $58,021 |
Occupancy by Householder Income Bracket in Oakland
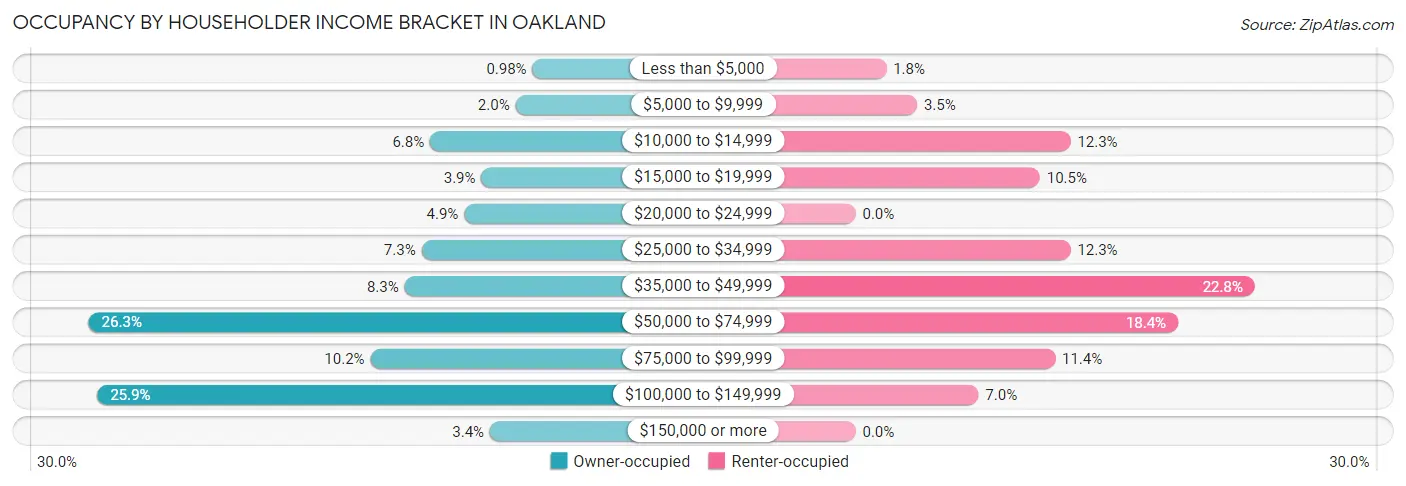
| Income Bracket | Owner-occupied | Renter-occupied |
| Less than $5,000 | 2 (1.0%) | 2 (1.8%) |
| $5,000 to $9,999 | 4 (1.9%) | 4 (3.5%) |
| $10,000 to $14,999 | 14 (6.8%) | 14 (12.3%) |
| $15,000 to $19,999 | 8 (3.9%) | 12 (10.5%) |
| $20,000 to $24,999 | 10 (4.9%) | 0 (0.0%) |
| $25,000 to $34,999 | 15 (7.3%) | 14 (12.3%) |
| $35,000 to $49,999 | 17 (8.3%) | 26 (22.8%) |
| $50,000 to $74,999 | 54 (26.3%) | 21 (18.4%) |
| $75,000 to $99,999 | 21 (10.2%) | 13 (11.4%) |
| $100,000 to $149,999 | 53 (25.9%) | 8 (7.0%) |
| $150,000 or more | 7 (3.4%) | 0 (0.0%) |
| Total | 205 (100.0%) | 114 (100.0%) |
Monthly Housing Cost Tiers in Oakland
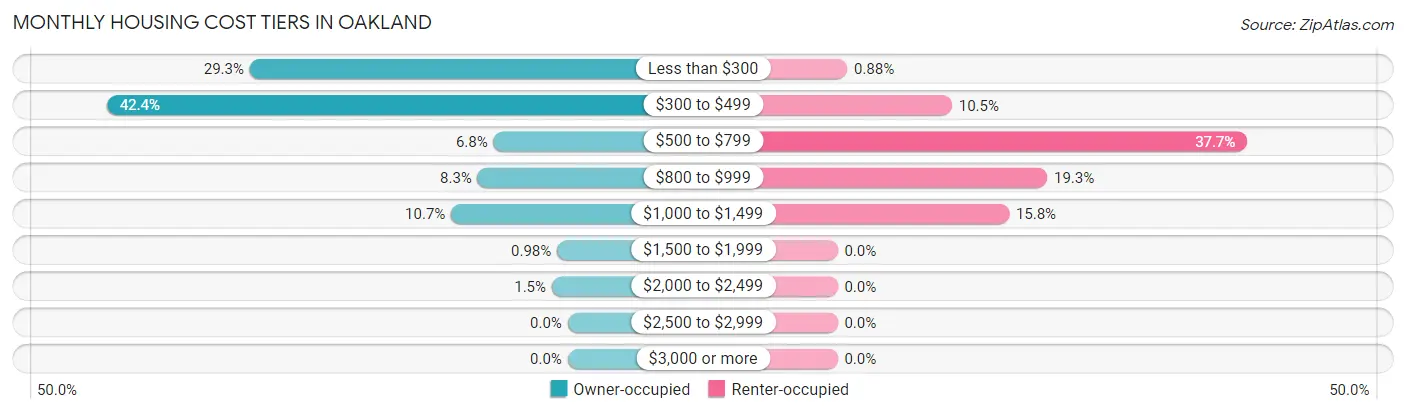
| Monthly Cost | Owner-occupied | Renter-occupied |
| Less than $300 | 60 (29.3%) | 1 (0.9%) |
| $300 to $499 | 87 (42.4%) | 12 (10.5%) |
| $500 to $799 | 14 (6.8%) | 43 (37.7%) |
| $800 to $999 | 17 (8.3%) | 22 (19.3%) |
| $1,000 to $1,499 | 22 (10.7%) | 18 (15.8%) |
| $1,500 to $1,999 | 2 (1.0%) | 0 (0.0%) |
| $2,000 to $2,499 | 3 (1.5%) | 0 (0.0%) |
| $2,500 to $2,999 | 0 (0.0%) | 0 (0.0%) |
| $3,000 or more | 0 (0.0%) | 0 (0.0%) |
| Total | 205 (100.0%) | 114 (100.0%) |
Physical Housing Characteristics in Oakland
Housing Structures in Oakland
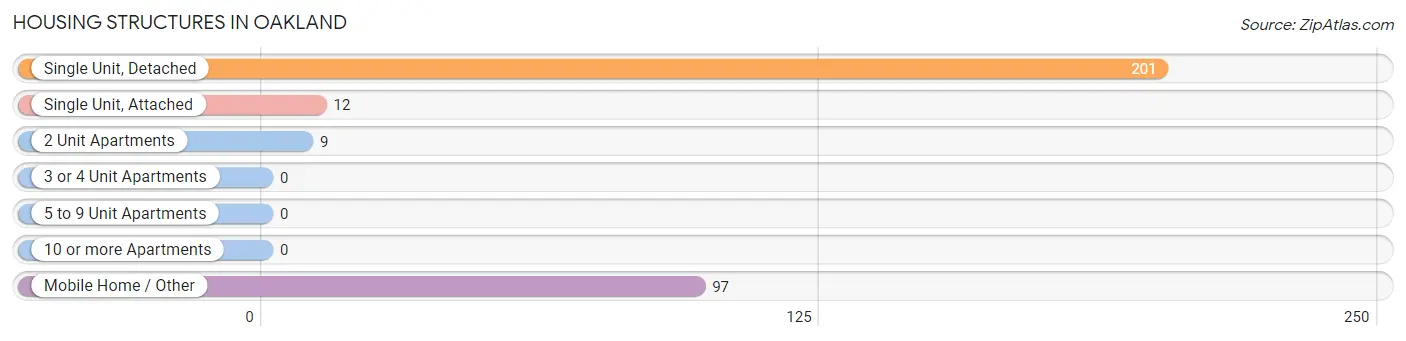
| Structure Type | # Housing Units | % Housing Units |
| Single Unit, Detached | 201 | 63.0% |
| Single Unit, Attached | 12 | 3.8% |
| 2 Unit Apartments | 9 | 2.8% |
| 3 or 4 Unit Apartments | 0 | 0.0% |
| 5 to 9 Unit Apartments | 0 | 0.0% |
| 10 or more Apartments | 0 | 0.0% |
| Mobile Home / Other | 97 | 30.4% |
| Total | 319 | 100.0% |
Housing Structures by Occupancy in Oakland
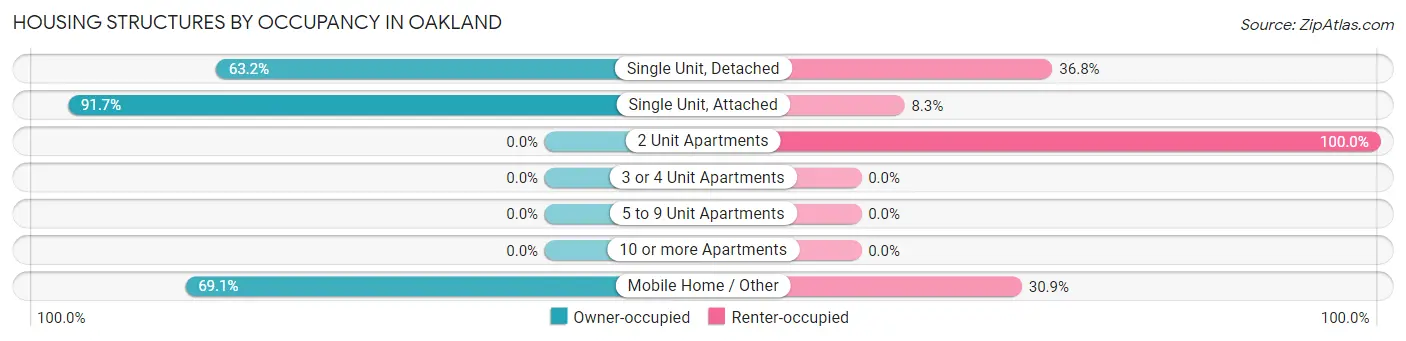
| Structure Type | Owner-occupied | Renter-occupied |
| Single Unit, Detached | 127 (63.2%) | 74 (36.8%) |
| Single Unit, Attached | 11 (91.7%) | 1 (8.3%) |
| 2 Unit Apartments | 0 (0.0%) | 9 (100.0%) |
| 3 or 4 Unit Apartments | 0 (0.0%) | 0 (0.0%) |
| 5 to 9 Unit Apartments | 0 (0.0%) | 0 (0.0%) |
| 10 or more Apartments | 0 (0.0%) | 0 (0.0%) |
| Mobile Home / Other | 67 (69.1%) | 30 (30.9%) |
| Total | 205 (64.3%) | 114 (35.7%) |
Housing Structures by Number of Rooms in Oakland
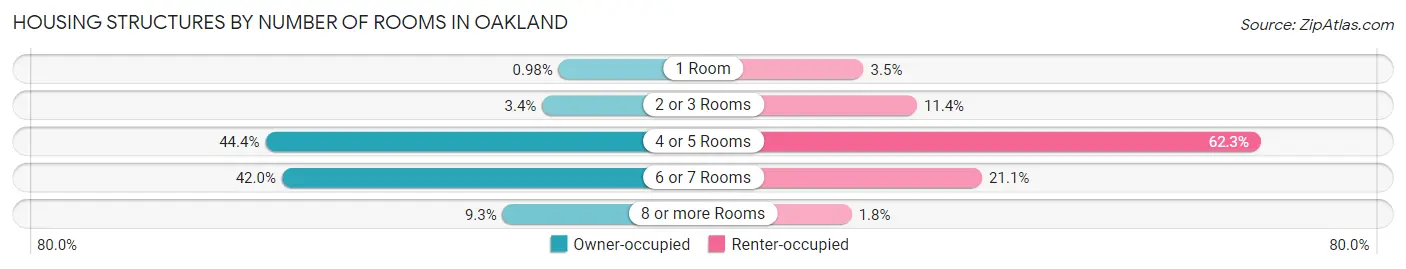
| Number of Rooms | Owner-occupied | Renter-occupied |
| 1 Room | 2 (1.0%) | 4 (3.5%) |
| 2 or 3 Rooms | 7 (3.4%) | 13 (11.4%) |
| 4 or 5 Rooms | 91 (44.4%) | 71 (62.3%) |
| 6 or 7 Rooms | 86 (41.9%) | 24 (21.0%) |
| 8 or more Rooms | 19 (9.3%) | 2 (1.8%) |
| Total | 205 (100.0%) | 114 (100.0%) |
Housing Structure by Heating Type in Oakland
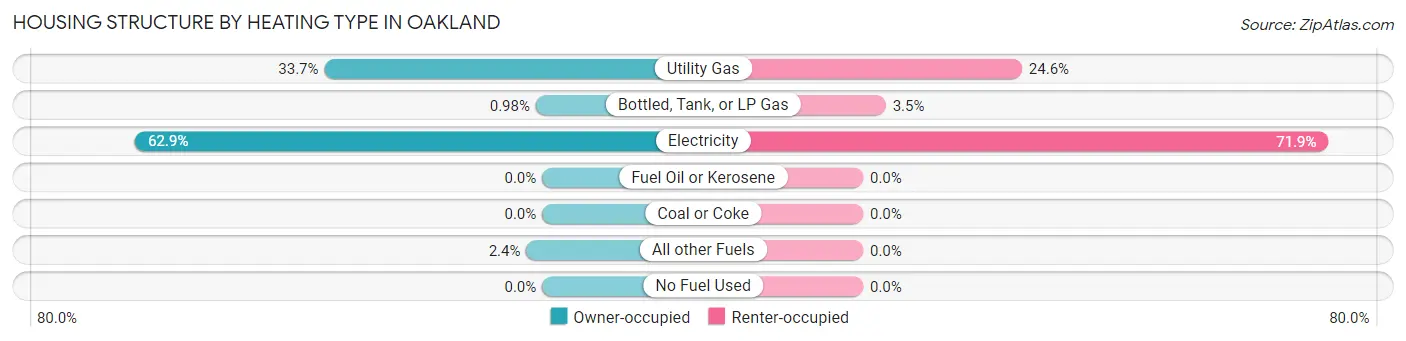
| Heating Type | Owner-occupied | Renter-occupied |
| Utility Gas | 69 (33.7%) | 28 (24.6%) |
| Bottled, Tank, or LP Gas | 2 (1.0%) | 4 (3.5%) |
| Electricity | 129 (62.9%) | 82 (71.9%) |
| Fuel Oil or Kerosene | 0 (0.0%) | 0 (0.0%) |
| Coal or Coke | 0 (0.0%) | 0 (0.0%) |
| All other Fuels | 5 (2.4%) | 0 (0.0%) |
| No Fuel Used | 0 (0.0%) | 0 (0.0%) |
| Total | 205 (100.0%) | 114 (100.0%) |
Household Vehicle Usage in Oakland
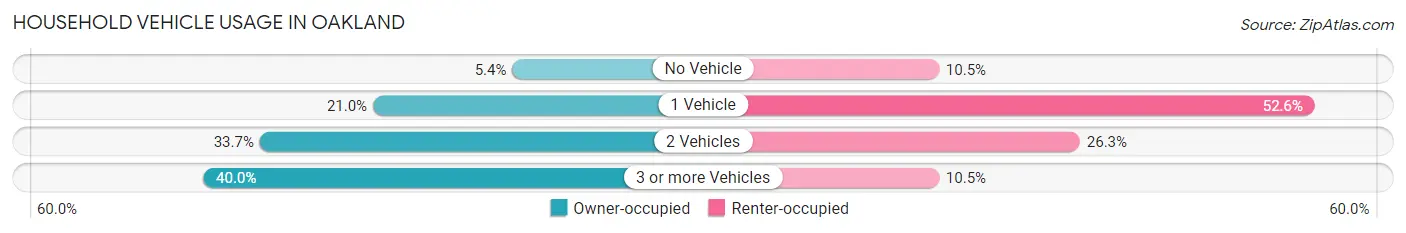
| Vehicles per Household | Owner-occupied | Renter-occupied |
| No Vehicle | 11 (5.4%) | 12 (10.5%) |
| 1 Vehicle | 43 (21.0%) | 60 (52.6%) |
| 2 Vehicles | 69 (33.7%) | 30 (26.3%) |
| 3 or more Vehicles | 82 (40.0%) | 12 (10.5%) |
| Total | 205 (100.0%) | 114 (100.0%) |
Real Estate & Mortgages in Oakland
Real Estate and Mortgage Overview in Oakland
| Characteristic | Without Mortgage | With Mortgage |
| Housing Units | 153 | 52 |
| Median Property Value | $82,800 | $89,200 |
| Median Household Income | $62,750 | $5 |
| Monthly Housing Costs | $328 | $0 |
| Real Estate Taxes | $353 | $8 |
Property Value by Mortgage Status in Oakland
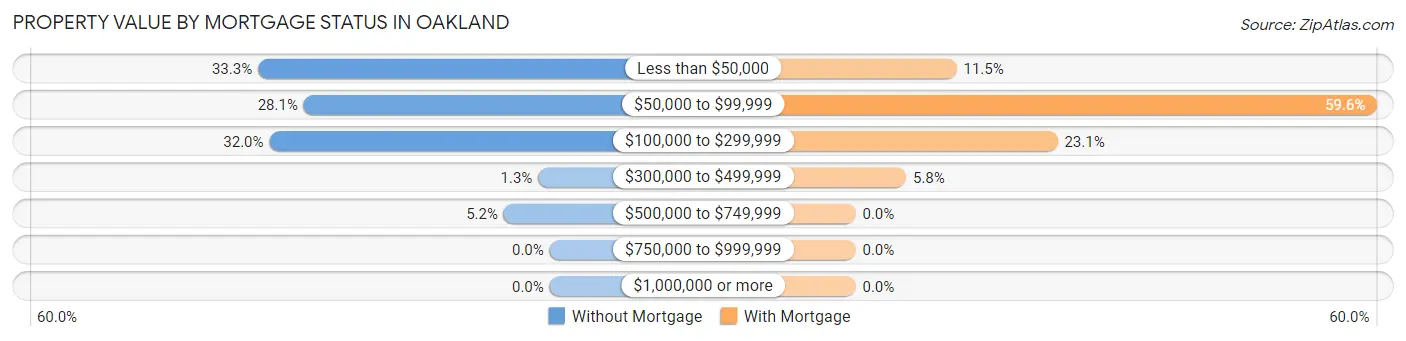
| Property Value | Without Mortgage | With Mortgage |
| Less than $50,000 | 51 (33.3%) | 6 (11.5%) |
| $50,000 to $99,999 | 43 (28.1%) | 31 (59.6%) |
| $100,000 to $299,999 | 49 (32.0%) | 12 (23.1%) |
| $300,000 to $499,999 | 2 (1.3%) | 3 (5.8%) |
| $500,000 to $749,999 | 8 (5.2%) | 0 (0.0%) |
| $750,000 to $999,999 | 0 (0.0%) | 0 (0.0%) |
| $1,000,000 or more | 0 (0.0%) | 0 (0.0%) |
| Total | 153 (100.0%) | 52 (100.0%) |
Household Income by Mortgage Status in Oakland
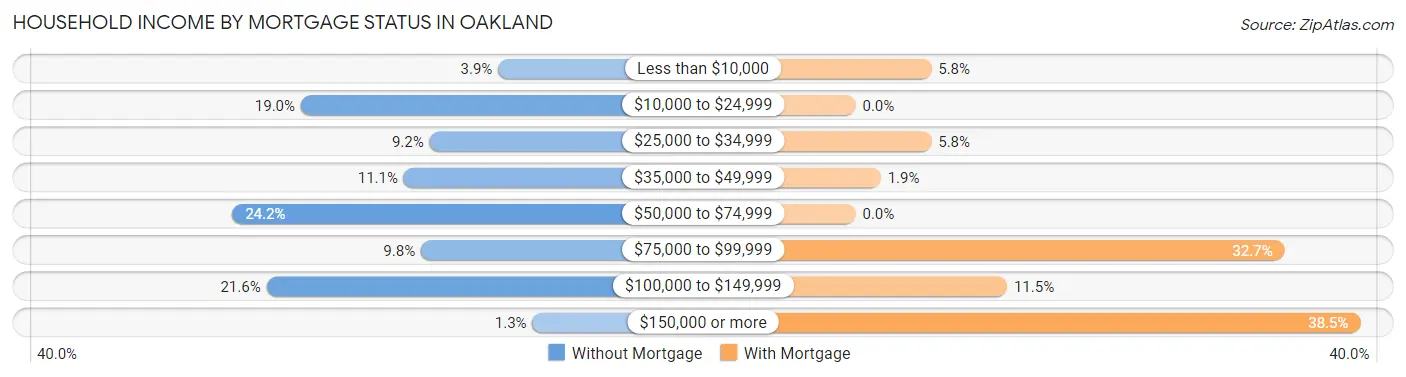
| Household Income | Without Mortgage | With Mortgage |
| Less than $10,000 | 6 (3.9%) | 3 (5.8%) |
| $10,000 to $24,999 | 29 (19.0%) | 0 (0.0%) |
| $25,000 to $34,999 | 14 (9.1%) | 3 (5.8%) |
| $35,000 to $49,999 | 17 (11.1%) | 1 (1.9%) |
| $50,000 to $74,999 | 37 (24.2%) | 0 (0.0%) |
| $75,000 to $99,999 | 15 (9.8%) | 17 (32.7%) |
| $100,000 to $149,999 | 33 (21.6%) | 6 (11.5%) |
| $150,000 or more | 2 (1.3%) | 20 (38.5%) |
| Total | 153 (100.0%) | 52 (100.0%) |
Property Value to Household Income Ratio in Oakland
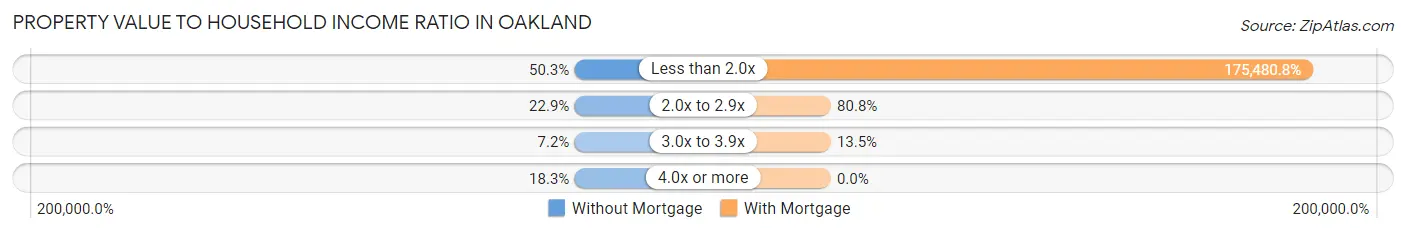
| Value-to-Income Ratio | Without Mortgage | With Mortgage |
| Less than 2.0x | 77 (50.3%) | 91,250 (175,480.8%) |
| 2.0x to 2.9x | 35 (22.9%) | 42 (80.8%) |
| 3.0x to 3.9x | 11 (7.2%) | 7 (13.5%) |
| 4.0x or more | 28 (18.3%) | 0 (0.0%) |
| Total | 153 (100.0%) | 52 (100.0%) |
Real Estate Taxes by Mortgage Status in Oakland
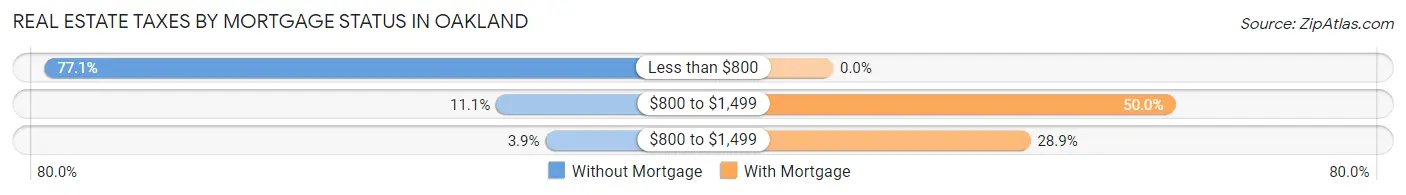
| Property Taxes | Without Mortgage | With Mortgage |
| Less than $800 | 118 (77.1%) | 0 (0.0%) |
| $800 to $1,499 | 17 (11.1%) | 26 (50.0%) |
| $800 to $1,499 | 6 (3.9%) | 15 (28.8%) |
| Total | 153 (100.0%) | 52 (100.0%) |
Health & Disability in Oakland
Health Insurance Coverage by Age in Oakland
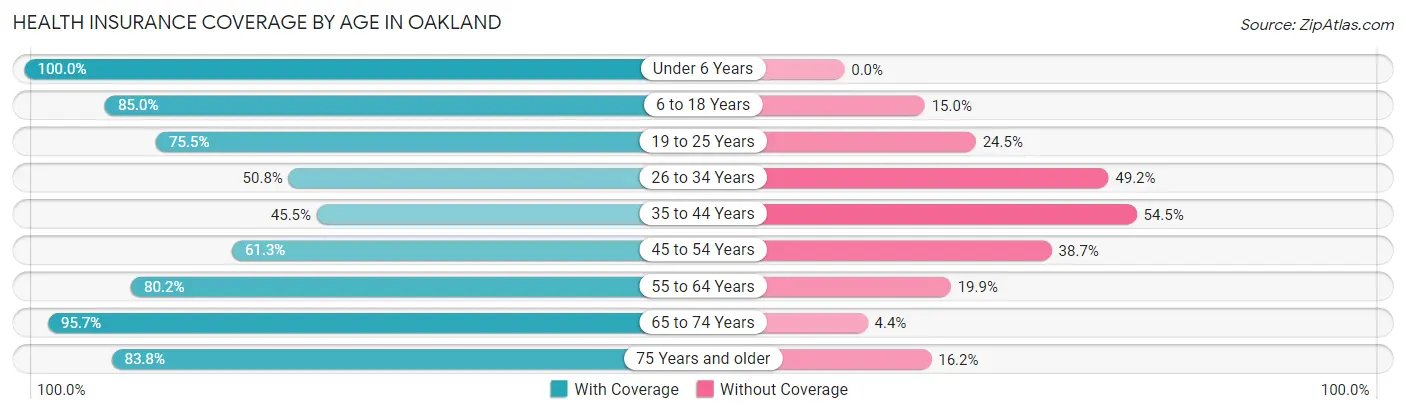
| Age Bracket | With Coverage | Without Coverage |
| Under 6 Years | 75 (100.0%) | 0 (0.0%) |
| 6 to 18 Years | 204 (85.0%) | 36 (15.0%) |
| 19 to 25 Years | 77 (75.5%) | 25 (24.5%) |
| 26 to 34 Years | 67 (50.8%) | 65 (49.2%) |
| 35 to 44 Years | 101 (45.5%) | 121 (54.5%) |
| 45 to 54 Years | 92 (61.3%) | 58 (38.7%) |
| 55 to 64 Years | 109 (80.1%) | 27 (19.9%) |
| 65 to 74 Years | 66 (95.7%) | 3 (4.3%) |
| 75 Years and older | 31 (83.8%) | 6 (16.2%) |
| Total | 822 (70.7%) | 341 (29.3%) |
Health Insurance Coverage by Citizenship Status in Oakland
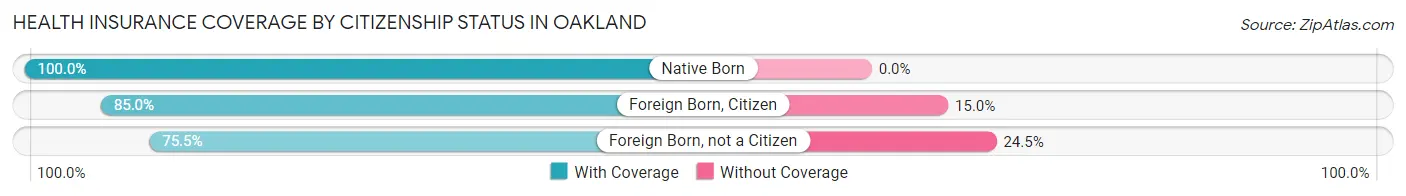
| Citizenship Status | With Coverage | Without Coverage |
| Native Born | 75 (100.0%) | 0 (0.0%) |
| Foreign Born, Citizen | 204 (85.0%) | 36 (15.0%) |
| Foreign Born, not a Citizen | 77 (75.5%) | 25 (24.5%) |
Health Insurance Coverage by Household Income in Oakland
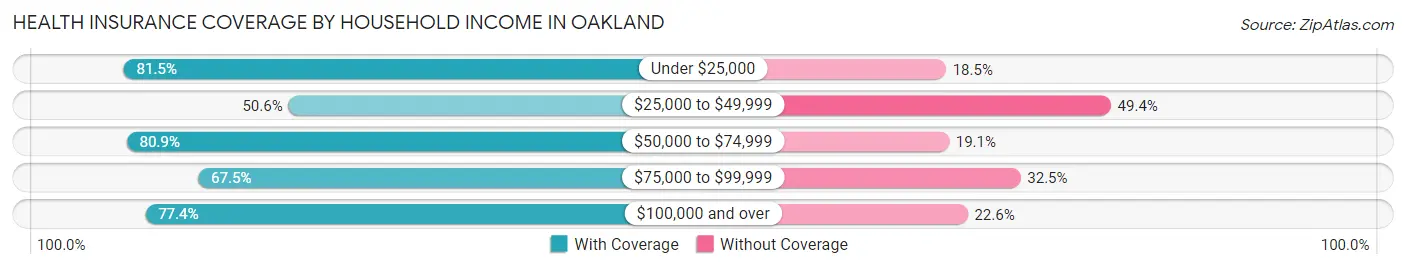
| Household Income | With Coverage | Without Coverage |
| Under $25,000 | 123 (81.5%) | 28 (18.5%) |
| $25,000 to $49,999 | 135 (50.6%) | 132 (49.4%) |
| $50,000 to $74,999 | 182 (80.9%) | 43 (19.1%) |
| $75,000 to $99,999 | 139 (67.5%) | 67 (32.5%) |
| $100,000 and over | 243 (77.4%) | 71 (22.6%) |
Public vs Private Health Insurance Coverage by Age in Oakland
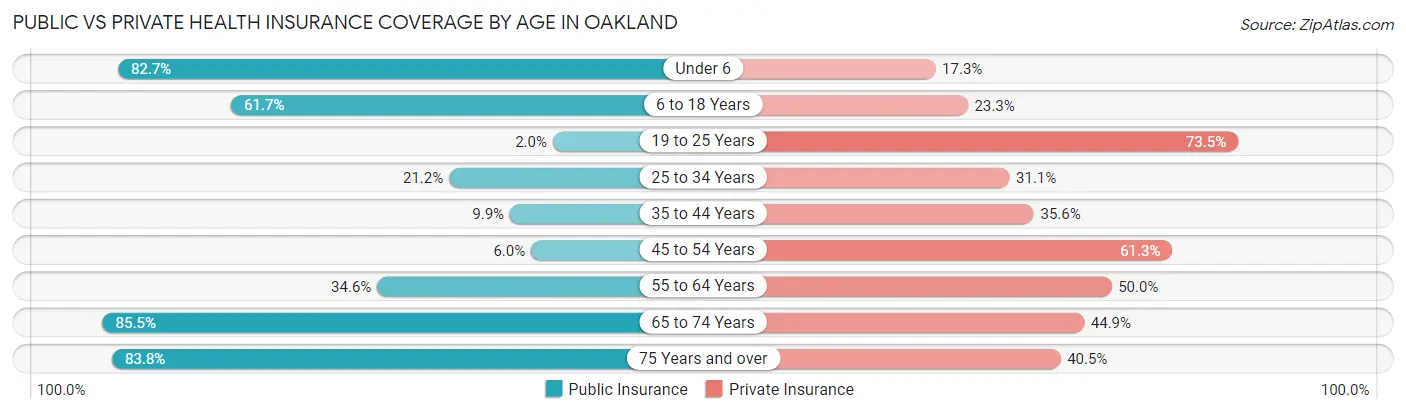
| Age Bracket | Public Insurance | Private Insurance |
| Under 6 | 62 (82.7%) | 13 (17.3%) |
| 6 to 18 Years | 148 (61.7%) | 56 (23.3%) |
| 19 to 25 Years | 2 (2.0%) | 75 (73.5%) |
| 25 to 34 Years | 28 (21.2%) | 41 (31.1%) |
| 35 to 44 Years | 22 (9.9%) | 79 (35.6%) |
| 45 to 54 Years | 9 (6.0%) | 92 (61.3%) |
| 55 to 64 Years | 47 (34.6%) | 68 (50.0%) |
| 65 to 74 Years | 59 (85.5%) | 31 (44.9%) |
| 75 Years and over | 31 (83.8%) | 15 (40.5%) |
| Total | 408 (35.1%) | 470 (40.4%) |
Disability Status by Sex by Age in Oakland
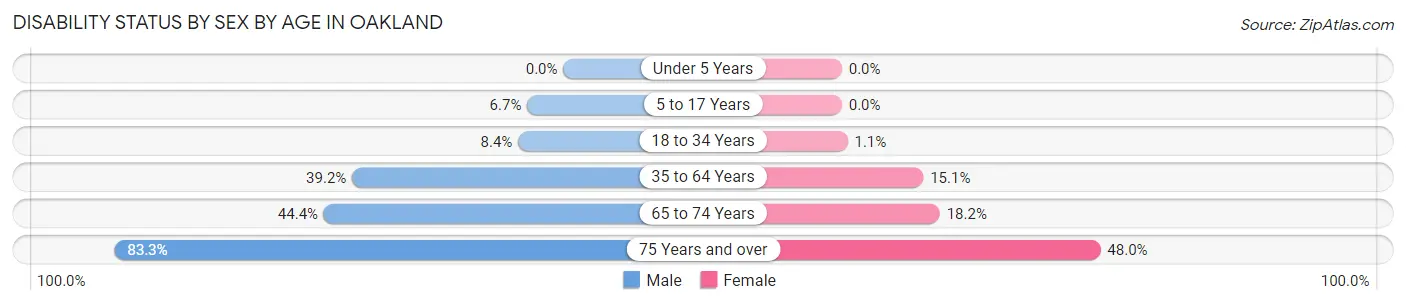
| Age Bracket | Male | Female |
| Under 5 Years | 0 (0.0%) | 0 (0.0%) |
| 5 to 17 Years | 12 (6.7%) | 0 (0.0%) |
| 18 to 34 Years | 13 (8.4%) | 1 (1.1%) |
| 35 to 64 Years | 98 (39.2%) | 39 (15.1%) |
| 65 to 74 Years | 16 (44.4%) | 6 (18.2%) |
| 75 Years and over | 10 (83.3%) | 12 (48.0%) |
Disability Class by Sex by Age in Oakland
Disability Class: Hearing Difficulty
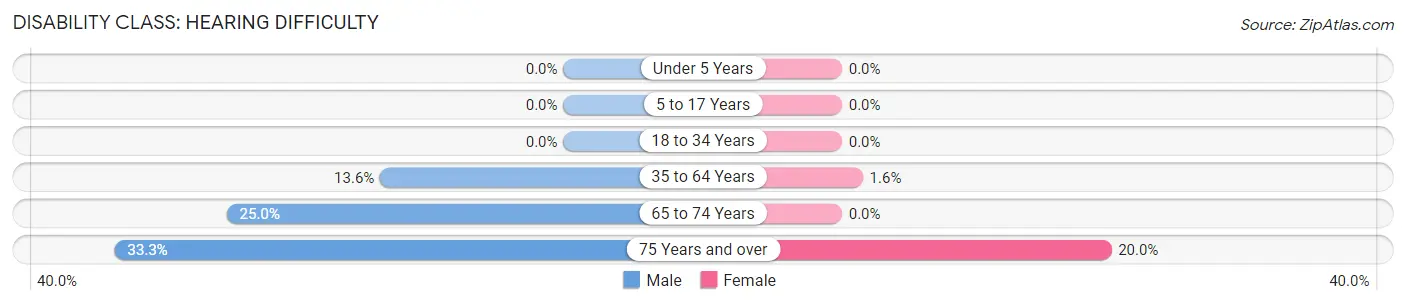
| Age Bracket | Male | Female |
| Under 5 Years | 0 (0.0%) | 0 (0.0%) |
| 5 to 17 Years | 0 (0.0%) | 0 (0.0%) |
| 18 to 34 Years | 0 (0.0%) | 0 (0.0%) |
| 35 to 64 Years | 34 (13.6%) | 4 (1.5%) |
| 65 to 74 Years | 9 (25.0%) | 0 (0.0%) |
| 75 Years and over | 4 (33.3%) | 5 (20.0%) |
Disability Class: Vision Difficulty
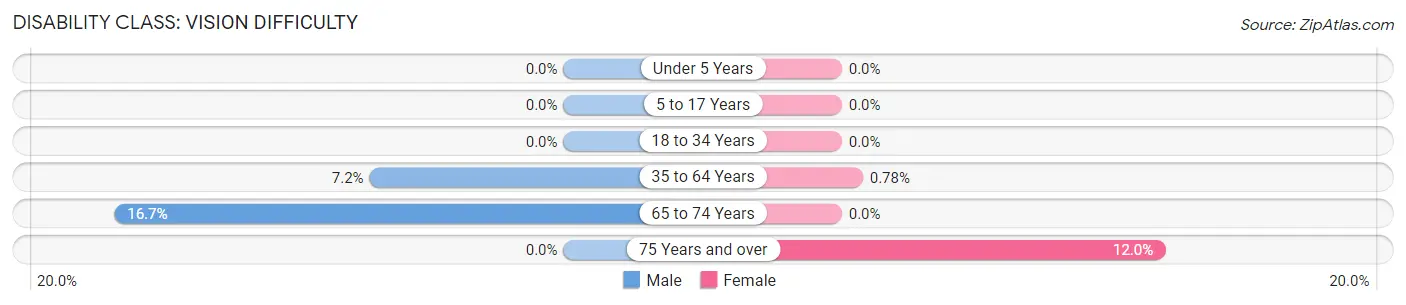
| Age Bracket | Male | Female |
| Under 5 Years | 0 (0.0%) | 0 (0.0%) |
| 5 to 17 Years | 0 (0.0%) | 0 (0.0%) |
| 18 to 34 Years | 0 (0.0%) | 0 (0.0%) |
| 35 to 64 Years | 18 (7.2%) | 2 (0.8%) |
| 65 to 74 Years | 6 (16.7%) | 0 (0.0%) |
| 75 Years and over | 0 (0.0%) | 3 (12.0%) |
Disability Class: Cognitive Difficulty
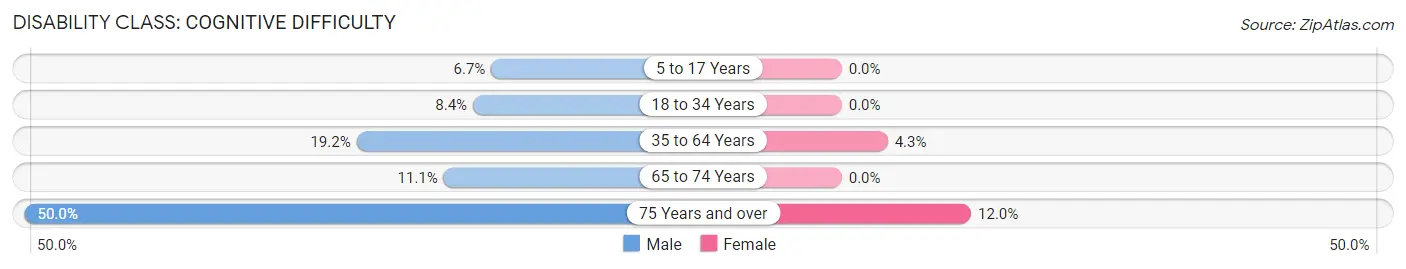
| Age Bracket | Male | Female |
| 5 to 17 Years | 12 (6.7%) | 0 (0.0%) |
| 18 to 34 Years | 13 (8.4%) | 0 (0.0%) |
| 35 to 64 Years | 48 (19.2%) | 11 (4.3%) |
| 65 to 74 Years | 4 (11.1%) | 0 (0.0%) |
| 75 Years and over | 6 (50.0%) | 3 (12.0%) |
Disability Class: Ambulatory Difficulty
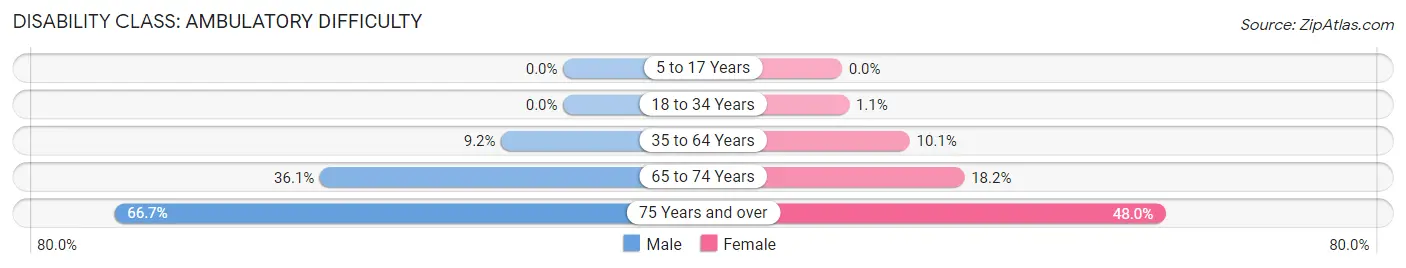
| Age Bracket | Male | Female |
| 5 to 17 Years | 0 (0.0%) | 0 (0.0%) |
| 18 to 34 Years | 0 (0.0%) | 1 (1.1%) |
| 35 to 64 Years | 23 (9.2%) | 26 (10.1%) |
| 65 to 74 Years | 13 (36.1%) | 6 (18.2%) |
| 75 Years and over | 8 (66.7%) | 12 (48.0%) |
Disability Class: Self-Care Difficulty
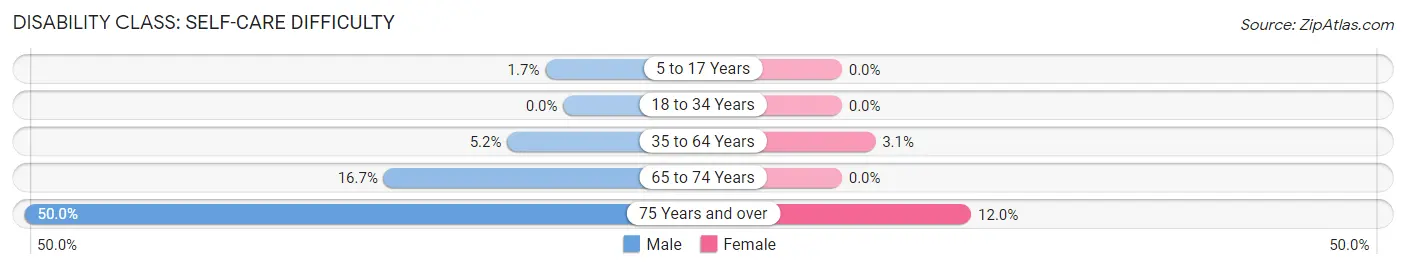
| Age Bracket | Male | Female |
| 5 to 17 Years | 3 (1.7%) | 0 (0.0%) |
| 18 to 34 Years | 0 (0.0%) | 0 (0.0%) |
| 35 to 64 Years | 13 (5.2%) | 8 (3.1%) |
| 65 to 74 Years | 6 (16.7%) | 0 (0.0%) |
| 75 Years and over | 6 (50.0%) | 3 (12.0%) |
Technology Access in Oakland
Computing Device Access in Oakland
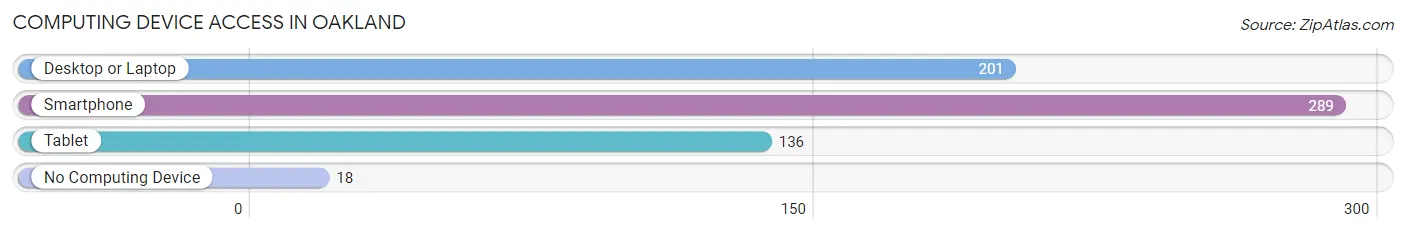
| Device Type | # Households | % Households |
| Desktop or Laptop | 201 | 63.0% |
| Smartphone | 289 | 90.6% |
| Tablet | 136 | 42.6% |
| No Computing Device | 18 | 5.6% |
| Total | 319 | 100.0% |
Internet Access in Oakland
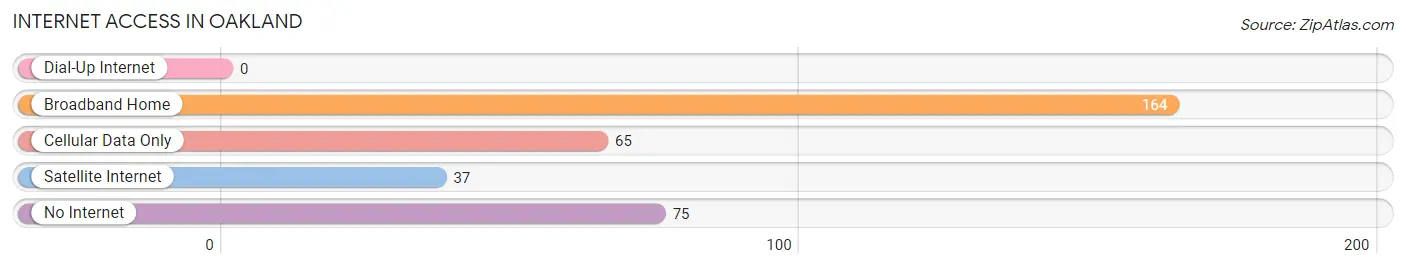
| Internet Type | # Households | % Households |
| Dial-Up Internet | 0 | 0.0% |
| Broadband Home | 164 | 51.4% |
| Cellular Data Only | 65 | 20.4% |
| Satellite Internet | 37 | 11.6% |
| No Internet | 75 | 23.5% |
| Total | 319 | 100.0% |
Oakland Summary
Oakland, Oklahoma is a small town located in Pontotoc County in the southeastern part of the state. It is situated on the banks of the North Canadian River and is part of the Ada Micropolitan Statistical Area. The town was founded in 1891 and was named after the nearby Oakland Missionary Baptist Church. As of the 2010 census, the population of Oakland was 1,093.
Geography
Oakland is located at 34°47'45"N 96°45'45"W (34.795833, -96.7625). It is situated on the banks of the North Canadian River, which is a tributary of the Arkansas River. The town is located in the rolling hills of southeastern Oklahoma, and is part of the Cross Timbers region. The climate is humid subtropical, with hot summers and mild winters. The average annual precipitation is about 40 inches.
Economy
Oakland’s economy is largely based on agriculture and related industries. The town is home to several farms and ranches, as well as a number of small businesses. The town also has a few manufacturing plants, including a furniture factory and a plastics plant. The town is also home to a number of retail stores, restaurants, and other services.
Demographics
As of the 2010 census, the population of Oakland was 1,093. The racial makeup of the town was 94.2% White, 0.7% African American, 0.7% Native American, 0.2% Asian, 0.1% Pacific Islander, 0.1% from other races, and 3.9% from two or more races. Hispanic or Latino of any race were 1.7% of the population.
The median income for a household in Oakland was $30,938, and the median income for a family was $37,500. The per capita income for the town was $15,945. About 16.2% of families and 19.2% of the population were below the poverty line, including 25.2% of those under age 18 and 11.2% of those age 65 or over.
History
Oakland was founded in 1891 by a group of settlers from Arkansas. The town was named after the nearby Oakland Missionary Baptist Church. The town grew slowly, and by the early 1900s had a population of about 500. The town was incorporated in 1909.
In the early 1900s, Oakland was a thriving agricultural center, with cotton, corn, and wheat being the main crops. The town also had a number of small businesses, including a bank, a hotel, and a newspaper.
In the 1920s, the town began to decline as the agricultural economy declined. The Great Depression further weakened the town’s economy, and by the 1940s the population had dropped to about 300.
In the 1950s, the town began to recover as the economy improved. The population increased to about 500 by the 1960s. In the 1970s, the town began to experience a resurgence as new businesses opened and the population increased to about 800.
Today, Oakland is a small but thriving town. The population has remained steady at around 1,000 since the 2000 census. The town is home to a number of small businesses, and the economy is largely based on agriculture and related industries.
Common Questions
What is Per Capita Income in Oakland?
Per Capita income in Oakland is $20,049.
What is the Median Family Income in Oakland?
Median Family Income in Oakland is $64,028.
What is the Median Household income in Oakland?
Median Household Income in Oakland is $58,021.
What is Income or Wage Gap in Oakland?
Income or Wage Gap in Oakland is 33.3%.
Women in Oakland earn 66.7 cents for every dollar earned by a man.
What is Inequality or Gini Index in Oakland?
Inequality or Gini Index in Oakland is 0.38.
What is the Total Population of Oakland?
Total Population of Oakland is 1,163.
What is the Total Male Population of Oakland?
Total Male Population of Oakland is 671.
What is the Total Female Population of Oakland?
Total Female Population of Oakland is 492.
What is the Ratio of Males per 100 Females in Oakland?
There are 136.38 Males per 100 Females in Oakland.
What is the Ratio of Females per 100 Males in Oakland?
There are 73.32 Females per 100 Males in Oakland.
What is the Median Population Age in Oakland?
Median Population Age in Oakland is 36.2 Years.
What is the Average Family Size in Oakland
Average Family Size in Oakland is 4.5 People.
What is the Average Household Size in Oakland
Average Household Size in Oakland is 3.6 People.
How Large is the Labor Force in Oakland?
There are 618 People in the Labor Forcein in Oakland.
What is the Percentage of People in the Labor Force in Oakland?
68.3% of People are in the Labor Force in Oakland.
What is the Unemployment Rate in Oakland?
Unemployment Rate in Oakland is 11.7%.