Idabel, OK Map & Demographics
Idabel Map
Idabel Overview
$19,358
PER CAPITA INCOME
$45,385
AVG FAMILY INCOME
$34,683
AVG HOUSEHOLD INCOME
25.3%
WAGE / INCOME GAP [ % ]
74.7¢/ $1
WAGE / INCOME GAP [ $ ]
0.45
INEQUALITY / GINI INDEX
6,994
TOTAL POPULATION
3,475
MALE POPULATION
3,519
FEMALE POPULATION
98.75
MALES / 100 FEMALES
101.27
FEMALES / 100 MALES
32.1
MEDIAN AGE
3.3
AVG FAMILY SIZE
2.6
AVG HOUSEHOLD SIZE
2,933
LABOR FORCE [ PEOPLE ]
55.4%
PERCENT IN LABOR FORCE
8.3%
UNEMPLOYMENT RATE
Idabel Zip Codes
Idabel Area Codes
Income in Idabel
Income Overview in Idabel
Per Capita Income in Idabel is $19,358, while median incomes of families and households are $45,385 and $34,683 respectively.
| Characteristic | Number | Measure |
| Per Capita Income | 6,994 | $19,358 |
| Median Family Income | 1,618 | $45,385 |
| Mean Family Income | 1,618 | $57,289 |
| Median Household Income | 2,566 | $34,683 |
| Mean Household Income | 2,566 | $48,368 |
| Income Deficit | 1,618 | $0 |
| Wage / Income Gap (%) | 6,994 | 25.25% |
| Wage / Income Gap ($) | 6,994 | 74.75¢ per $1 |
| Gini / Inequality Index | 6,994 | 0.45 |
Earnings by Sex in Idabel
Average Earnings in Idabel are $28,658, $32,789 for men and $24,509 for women, a difference of 25.3%.
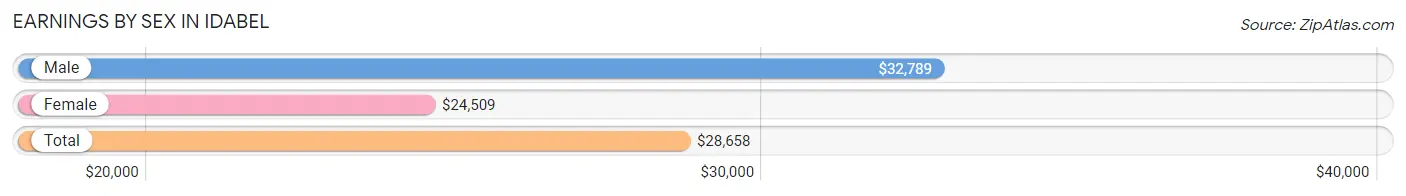
| Sex | Number | Average Earnings |
| Male | 1,536 (51.3%) | $32,789 |
| Female | 1,460 (48.7%) | $24,509 |
| Total | 2,996 (100.0%) | $28,658 |
Earnings by Sex by Income Bracket in Idabel
The most common earnings brackets in Idabel are $25,000 to $29,999 for men (238 | 15.5%) and $25,000 to $29,999 for women (167 | 11.4%).
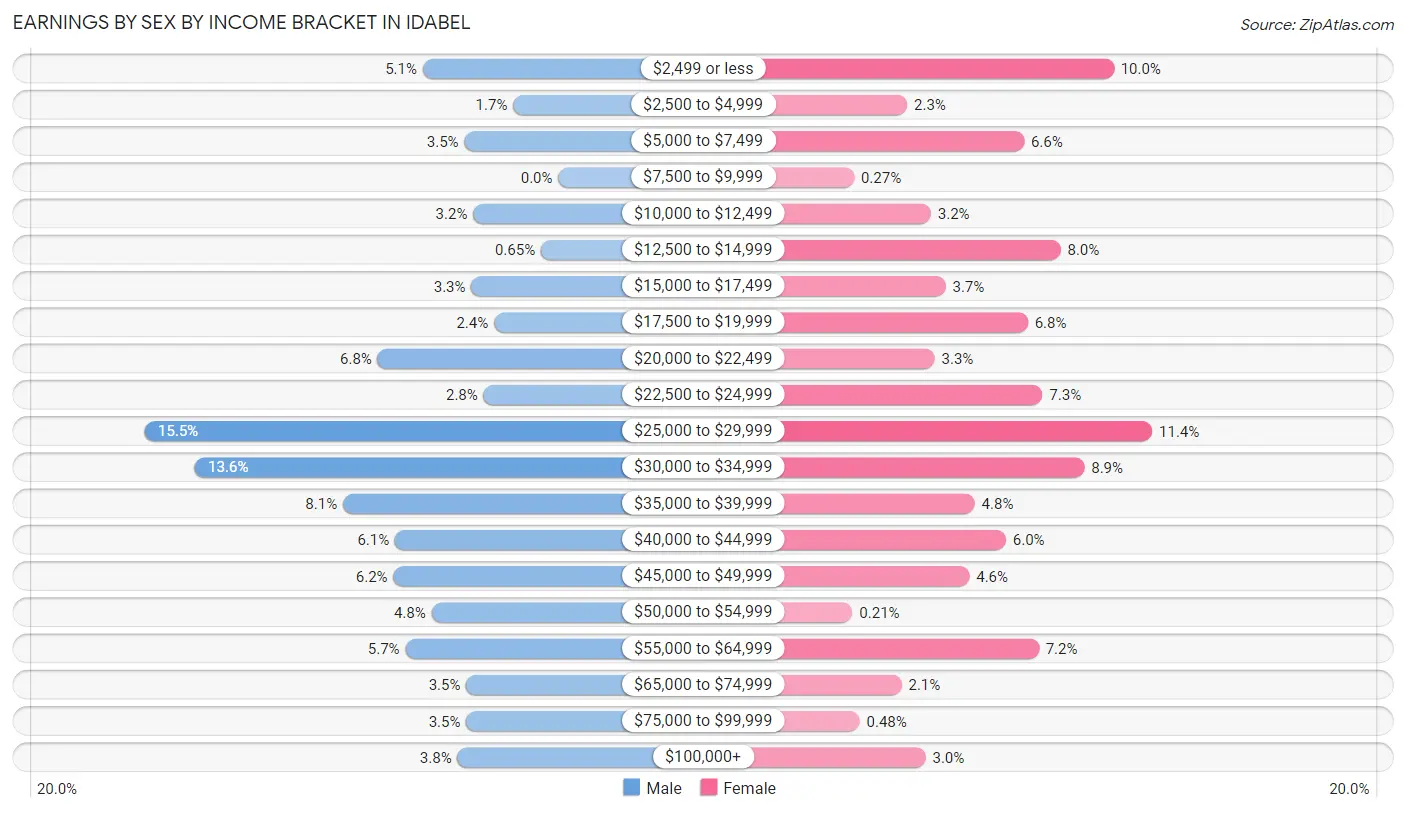
| Income | Male | Female |
| $2,499 or less | 78 (5.1%) | 146 (10.0%) |
| $2,500 to $4,999 | 26 (1.7%) | 33 (2.3%) |
| $5,000 to $7,499 | 54 (3.5%) | 97 (6.6%) |
| $7,500 to $9,999 | 0 (0.0%) | 4 (0.3%) |
| $10,000 to $12,499 | 49 (3.2%) | 46 (3.2%) |
| $12,500 to $14,999 | 10 (0.6%) | 117 (8.0%) |
| $15,000 to $17,499 | 50 (3.3%) | 54 (3.7%) |
| $17,500 to $19,999 | 37 (2.4%) | 99 (6.8%) |
| $20,000 to $22,499 | 104 (6.8%) | 48 (3.3%) |
| $22,500 to $24,999 | 43 (2.8%) | 107 (7.3%) |
| $25,000 to $29,999 | 238 (15.5%) | 167 (11.4%) |
| $30,000 to $34,999 | 209 (13.6%) | 130 (8.9%) |
| $35,000 to $39,999 | 124 (8.1%) | 70 (4.8%) |
| $40,000 to $44,999 | 94 (6.1%) | 87 (6.0%) |
| $45,000 to $49,999 | 95 (6.2%) | 67 (4.6%) |
| $50,000 to $54,999 | 73 (4.8%) | 3 (0.2%) |
| $55,000 to $64,999 | 88 (5.7%) | 105 (7.2%) |
| $65,000 to $74,999 | 53 (3.5%) | 30 (2.1%) |
| $75,000 to $99,999 | 53 (3.5%) | 7 (0.5%) |
| $100,000+ | 58 (3.8%) | 43 (2.9%) |
| Total | 1,536 (100.0%) | 1,460 (100.0%) |
Earnings by Sex by Educational Attainment in Idabel
Average earnings in Idabel are $34,959 for men and $27,079 for women, a difference of 22.5%. Men with an educational attainment of graduate degree enjoy the highest average annual earnings of $48,813, while those with less than high school education earn the least with $29,219. Women with an educational attainment of graduate degree earn the most with the average annual earnings of $59,125, while those with high school diploma education have the smallest earnings of $20,978.
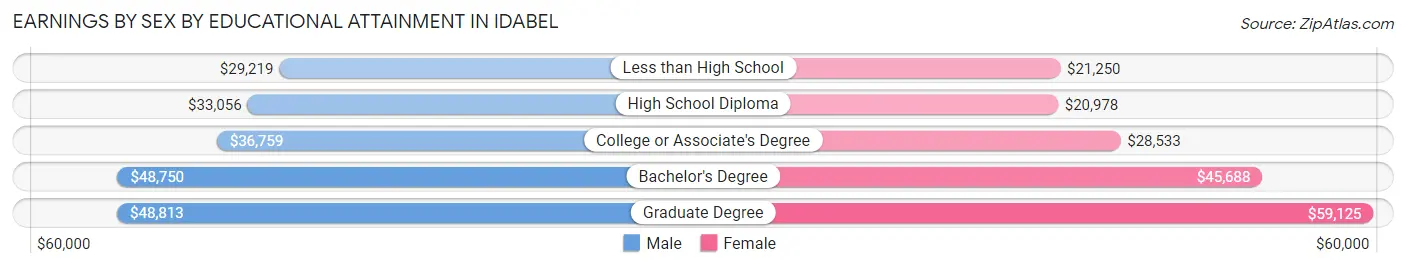
| Educational Attainment | Male Income | Female Income |
| Less than High School | $29,219 | $21,250 |
| High School Diploma | $33,056 | $20,978 |
| College or Associate's Degree | $36,759 | $28,533 |
| Bachelor's Degree | $48,750 | $45,688 |
| Graduate Degree | $48,813 | $59,125 |
| Total | $34,959 | $27,079 |
Family Income in Idabel
Family Income Brackets in Idabel
According to the Idabel family income data, there are 303 families falling into the $35,000 to $49,999 income range, which is the most common income bracket and makes up 18.7% of all families. Conversely, the $200,000+ income bracket is the least frequent group with only 31 families (1.9%) belonging to this category.
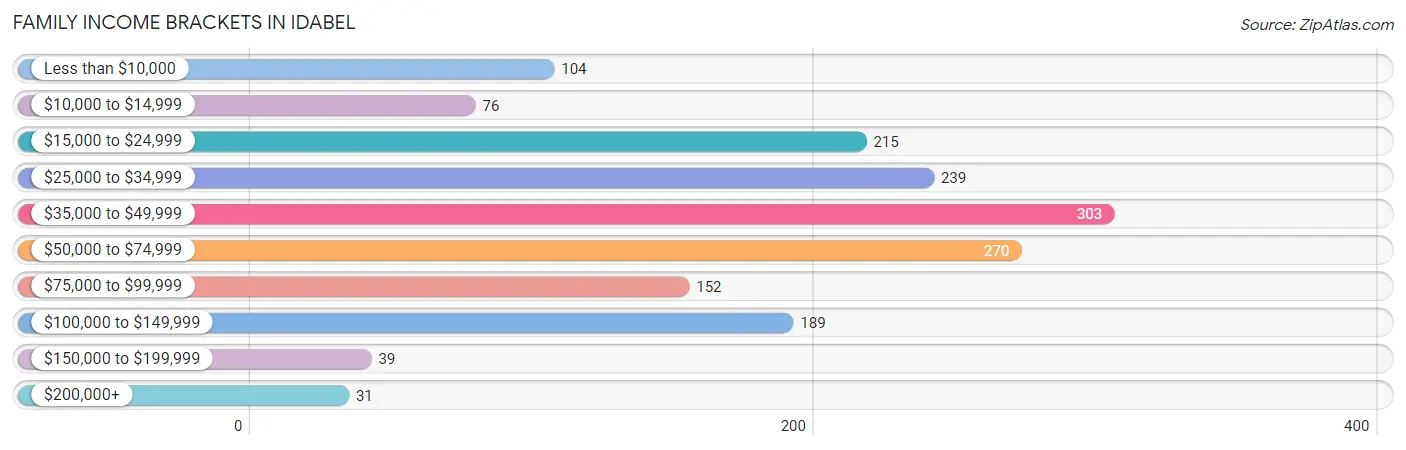
| Income Bracket | # Families | % Families |
| Less than $10,000 | 104 | 6.4% |
| $10,000 to $14,999 | 76 | 4.7% |
| $15,000 to $24,999 | 215 | 13.3% |
| $25,000 to $34,999 | 239 | 14.8% |
| $35,000 to $49,999 | 303 | 18.7% |
| $50,000 to $74,999 | 270 | 16.7% |
| $75,000 to $99,999 | 152 | 9.4% |
| $100,000 to $149,999 | 189 | 11.7% |
| $150,000 to $199,999 | 39 | 2.4% |
| $200,000+ | 31 | 1.9% |
Family Income by Famaliy Size in Idabel
6-person families (96 | 5.9%) account for the highest median family income in Idabel with $60,795 per family, while 2-person families (738 | 45.6%) have the highest median income of $22,100 per family member.
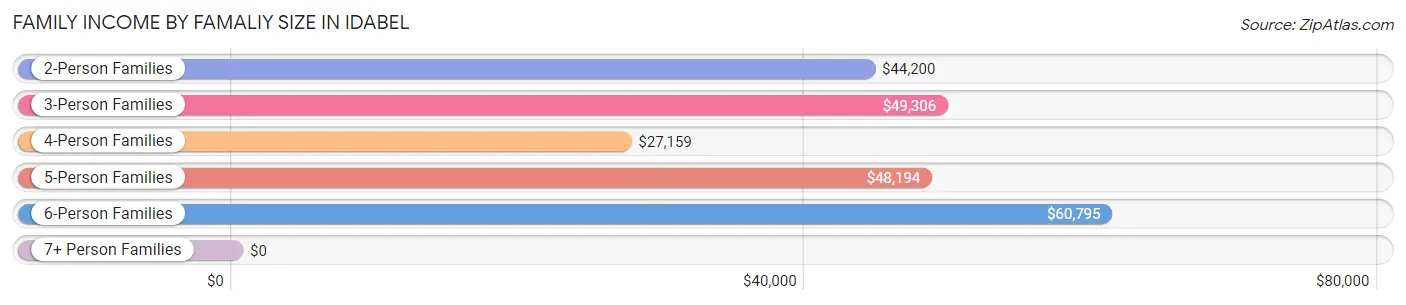
| Income Bracket | # Families | Median Income |
| 2-Person Families | 738 (45.6%) | $44,200 |
| 3-Person Families | 433 (26.8%) | $49,306 |
| 4-Person Families | 197 (12.2%) | $27,159 |
| 5-Person Families | 126 (7.8%) | $48,194 |
| 6-Person Families | 96 (5.9%) | $60,795 |
| 7+ Person Families | 28 (1.7%) | $0 |
| Total | 1,618 (100.0%) | $45,385 |
Family Income by Number of Earners in Idabel
The median family income in Idabel is $45,385, with families comprising 3+ earners (62) having the highest median family income of $115,556, while families with no earners (246) have the lowest median family income of $20,761, accounting for 3.8% and 15.2% of families, respectively.
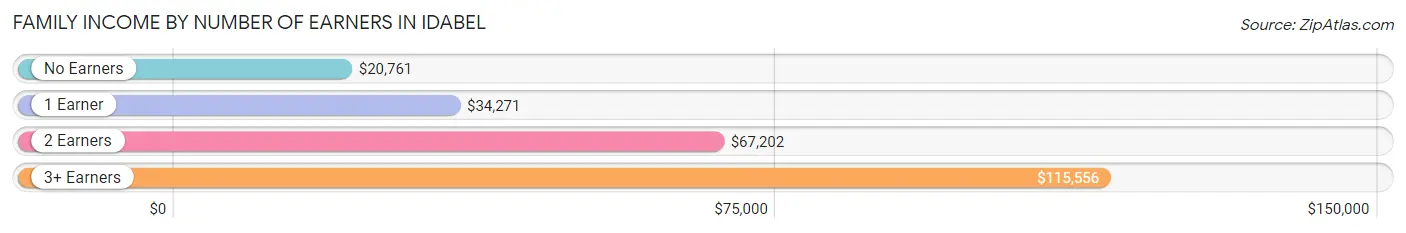
| Number of Earners | # Families | Median Income |
| No Earners | 246 (15.2%) | $20,761 |
| 1 Earner | 756 (46.7%) | $34,271 |
| 2 Earners | 554 (34.2%) | $67,202 |
| 3+ Earners | 62 (3.8%) | $115,556 |
| Total | 1,618 (100.0%) | $45,385 |
Household Income in Idabel
Household Income Brackets in Idabel
With 459 households falling in the category, the $25,000 to $34,999 income range is the most frequent in Idabel, accounting for 17.9% of all households. In contrast, only 38 households (1.5%) fall into the $150,000 to $199,999 income bracket, making it the least populous group.
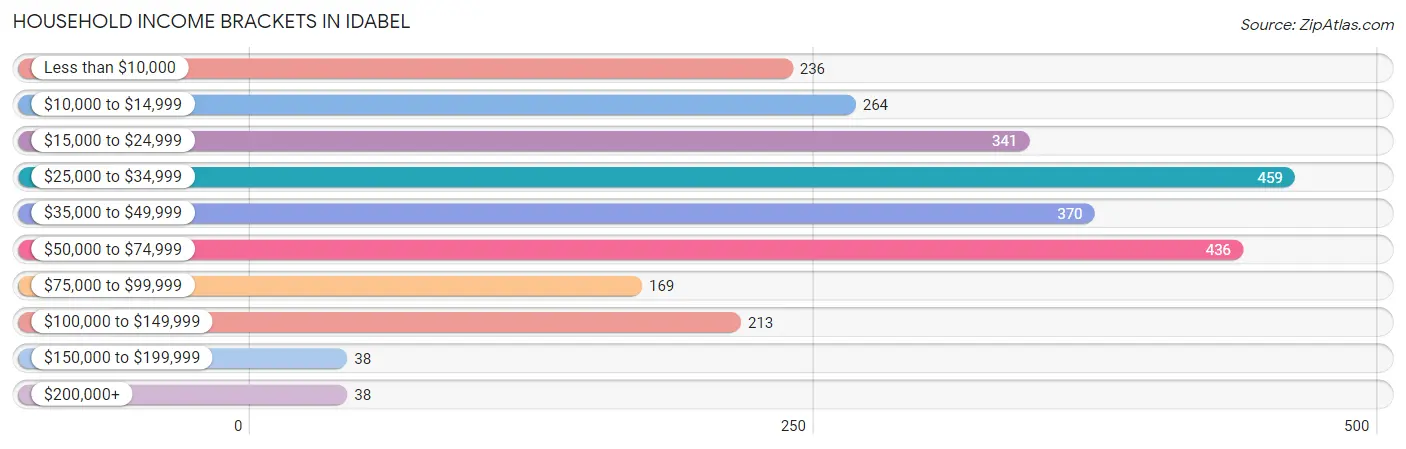
| Income Bracket | # Households | % Households |
| Less than $10,000 | 236 | 9.2% |
| $10,000 to $14,999 | 264 | 10.3% |
| $15,000 to $24,999 | 341 | 13.3% |
| $25,000 to $34,999 | 459 | 17.9% |
| $35,000 to $49,999 | 370 | 14.4% |
| $50,000 to $74,999 | 436 | 17.0% |
| $75,000 to $99,999 | 169 | 6.6% |
| $100,000 to $149,999 | 213 | 8.3% |
| $150,000 to $199,999 | 38 | 1.5% |
| $200,000+ | 38 | 1.5% |
Household Income by Householder Age in Idabel
The median household income in Idabel is $34,683, with the highest median household income of $48,482 found in the 45 to 64 years age bracket for the primary householder. A total of 787 households (30.7%) fall into this category. Meanwhile, the 65+ years age bracket for the primary householder has the lowest median household income of $27,127, with 831 households (32.4%) in this group.
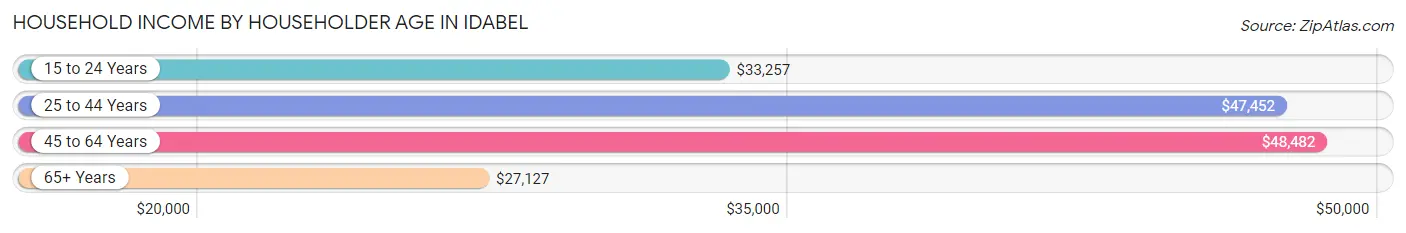
| Income Bracket | # Households | Median Income |
| 15 to 24 Years | 199 (7.8%) | $33,257 |
| 25 to 44 Years | 749 (29.2%) | $47,452 |
| 45 to 64 Years | 787 (30.7%) | $48,482 |
| 65+ Years | 831 (32.4%) | $27,127 |
| Total | 2,566 (100.0%) | $34,683 |
Poverty in Idabel
Income Below Poverty by Sex and Age in Idabel
With 30.1% poverty level for males and 28.8% for females among the residents of Idabel, 15 year old males and 6 to 11 year old females are the most vulnerable to poverty, with 37 males (66.1%) and 94 females (40.7%) in their respective age groups living below the poverty level.
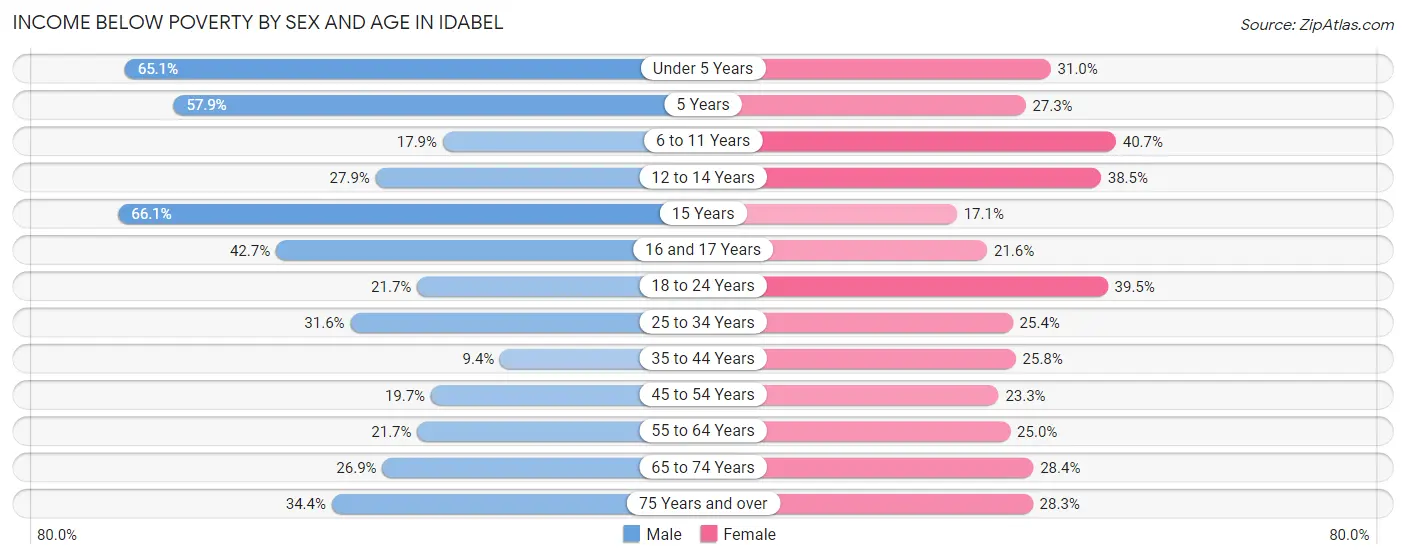
| Age Bracket | Male | Female |
| Under 5 Years | 280 (65.1%) | 98 (31.0%) |
| 5 Years | 33 (57.9%) | 18 (27.3%) |
| 6 to 11 Years | 51 (17.9%) | 94 (40.7%) |
| 12 to 14 Years | 34 (27.9%) | 30 (38.5%) |
| 15 Years | 37 (66.1%) | 7 (17.1%) |
| 16 and 17 Years | 32 (42.7%) | 22 (21.6%) |
| 18 to 24 Years | 89 (21.7%) | 150 (39.5%) |
| 25 to 34 Years | 148 (31.6%) | 136 (25.4%) |
| 35 to 44 Years | 32 (9.4%) | 103 (25.8%) |
| 45 to 54 Years | 58 (19.7%) | 87 (23.3%) |
| 55 to 64 Years | 67 (21.7%) | 96 (25.0%) |
| 65 to 74 Years | 79 (26.9%) | 87 (28.4%) |
| 75 Years and over | 54 (34.4%) | 70 (28.3%) |
| Total | 994 (30.1%) | 998 (28.8%) |
Income Above Poverty by Sex and Age in Idabel
According to the poverty statistics in Idabel, males aged 35 to 44 years and females aged 15 years are the age groups that are most secure financially, with 90.6% of males and 82.9% of females in these age groups living above the poverty line.
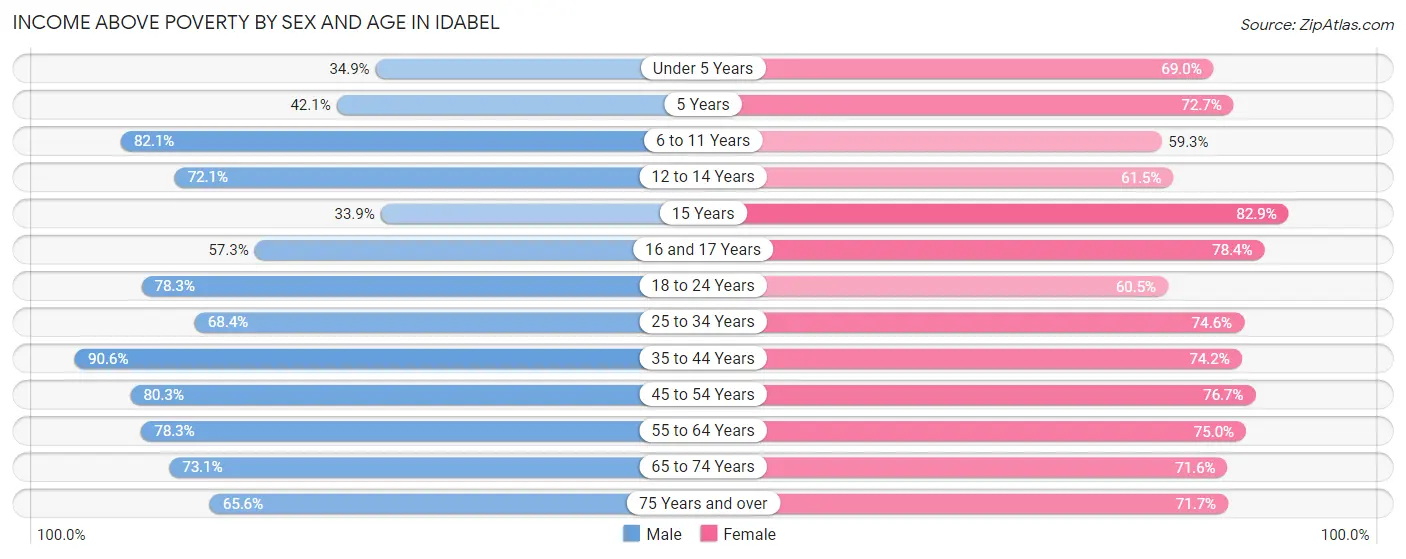
| Age Bracket | Male | Female |
| Under 5 Years | 150 (34.9%) | 218 (69.0%) |
| 5 Years | 24 (42.1%) | 48 (72.7%) |
| 6 to 11 Years | 234 (82.1%) | 137 (59.3%) |
| 12 to 14 Years | 88 (72.1%) | 48 (61.5%) |
| 15 Years | 19 (33.9%) | 34 (82.9%) |
| 16 and 17 Years | 43 (57.3%) | 80 (78.4%) |
| 18 to 24 Years | 321 (78.3%) | 230 (60.5%) |
| 25 to 34 Years | 320 (68.4%) | 400 (74.6%) |
| 35 to 44 Years | 309 (90.6%) | 296 (74.2%) |
| 45 to 54 Years | 237 (80.3%) | 287 (76.7%) |
| 55 to 64 Years | 242 (78.3%) | 288 (75.0%) |
| 65 to 74 Years | 215 (73.1%) | 219 (71.6%) |
| 75 Years and over | 103 (65.6%) | 177 (71.7%) |
| Total | 2,305 (69.9%) | 2,462 (71.2%) |
Income Below Poverty Among Married-Couple Families in Idabel
The poverty statistics for married-couple families in Idabel show that 15.2% or 137 of the total 902 families live below the poverty line. Families with 5 or more children have the highest poverty rate of 85.0%, comprising of 17 families. On the other hand, families with no children have the lowest poverty rate of 3.2%, which includes 14 families.
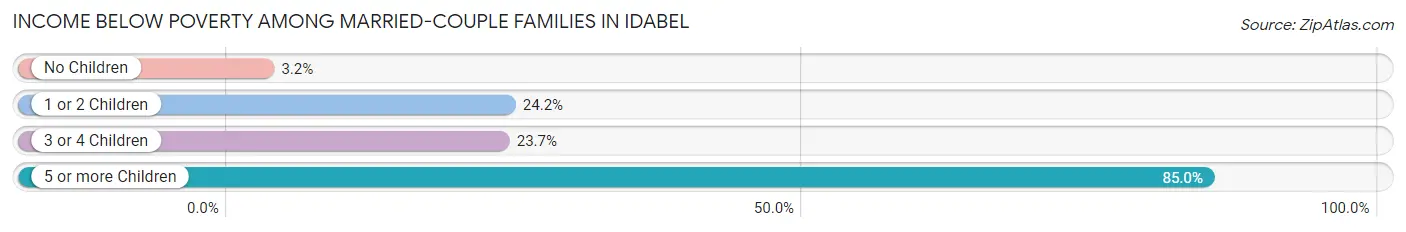
| Children | Above Poverty | Below Poverty |
| No Children | 427 (96.8%) | 14 (3.2%) |
| 1 or 2 Children | 235 (75.8%) | 75 (24.2%) |
| 3 or 4 Children | 100 (76.3%) | 31 (23.7%) |
| 5 or more Children | 3 (15.0%) | 17 (85.0%) |
| Total | 765 (84.8%) | 137 (15.2%) |
Income Below Poverty Among Single-Parent Households in Idabel
According to the poverty data in Idabel, 21.5% or 31 single-father households and 39.0% or 223 single-mother households are living below the poverty line. Among single-father households, those with 1 or 2 children have the highest poverty rate, with 25 households (29.8%) experiencing poverty. Likewise, among single-mother households, those with 3 or 4 children have the highest poverty rate, with 30 households (73.2%) falling below the poverty line.
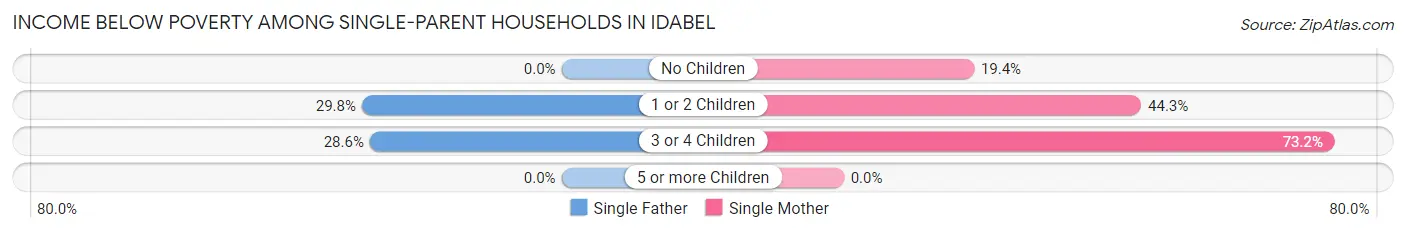
| Children | Single Father | Single Mother |
| No Children | 0 (0.0%) | 33 (19.4%) |
| 1 or 2 Children | 25 (29.8%) | 160 (44.3%) |
| 3 or 4 Children | 6 (28.6%) | 30 (73.2%) |
| 5 or more Children | 0 (0.0%) | 0 (0.0%) |
| Total | 31 (21.5%) | 223 (39.0%) |
Income Below Poverty Among Married-Couple vs Single-Parent Households in Idabel
The poverty data for Idabel shows that 137 of the married-couple family households (15.2%) and 254 of the single-parent households (35.5%) are living below the poverty level. Within the married-couple family households, those with 5 or more children have the highest poverty rate, with 17 households (85.0%) falling below the poverty line. Among the single-parent households, those with 3 or 4 children have the highest poverty rate, with 36 household (58.1%) living below poverty.
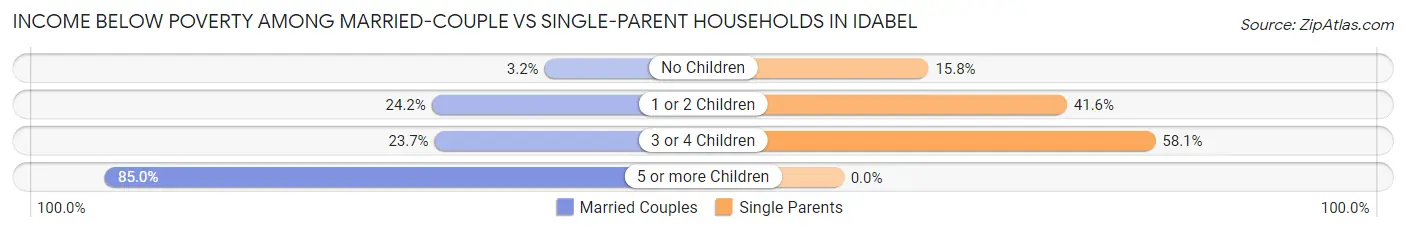
| Children | Married-Couple Families | Single-Parent Households |
| No Children | 14 (3.2%) | 33 (15.8%) |
| 1 or 2 Children | 75 (24.2%) | 185 (41.6%) |
| 3 or 4 Children | 31 (23.7%) | 36 (58.1%) |
| 5 or more Children | 17 (85.0%) | 0 (0.0%) |
| Total | 137 (15.2%) | 254 (35.5%) |
Race in Idabel
The most populous races in Idabel are White / Caucasian (3,652 | 52.2%), Black / African American (1,229 | 17.6%), and Two or more Races (946 | 13.5%).
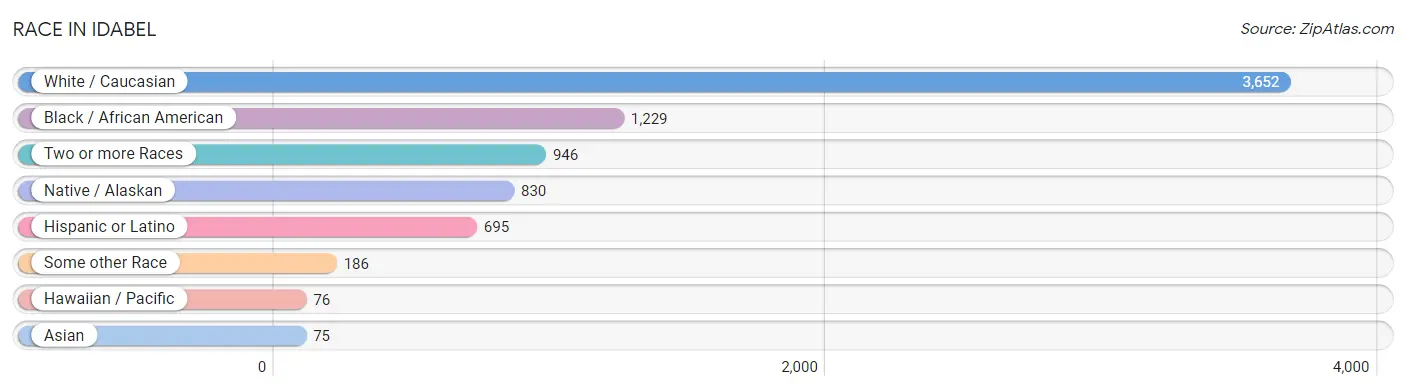
| Race | # Population | % Population |
| Asian | 75 | 1.1% |
| Black / African American | 1,229 | 17.6% |
| Hawaiian / Pacific | 76 | 1.1% |
| Hispanic or Latino | 695 | 9.9% |
| Native / Alaskan | 830 | 11.9% |
| White / Caucasian | 3,652 | 52.2% |
| Two or more Races | 946 | 13.5% |
| Some other Race | 186 | 2.7% |
| Total | 6,994 | 100.0% |
Ancestry in Idabel
The most populous ancestries reported in Idabel are Choctaw (1,171 | 16.7%), Mexican (551 | 7.9%), Irish (529 | 7.6%), English (475 | 6.8%), and German (328 | 4.7%), together accounting for 43.7% of all Idabel residents.
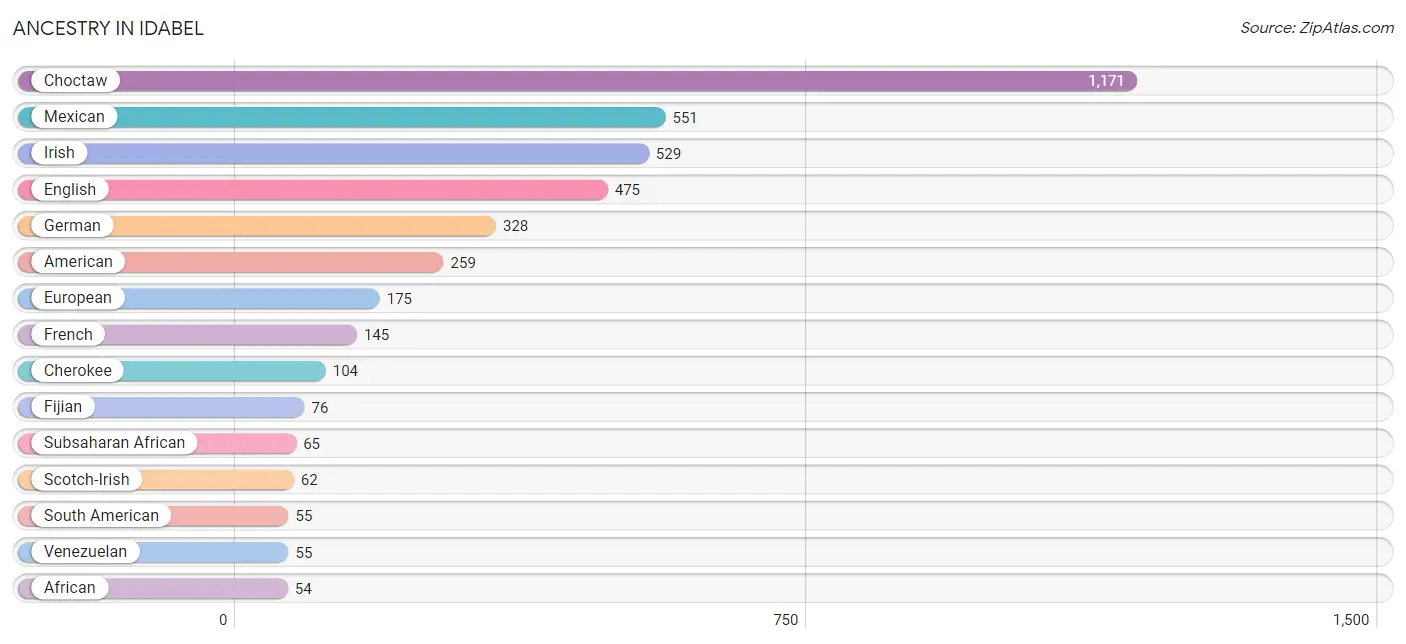
| Ancestry | # Population | % Population |
| African | 54 | 0.8% |
| American | 259 | 3.7% |
| Arapaho | 36 | 0.5% |
| Canadian | 36 | 0.5% |
| Central American | 20 | 0.3% |
| Cherokee | 104 | 1.5% |
| Choctaw | 1,171 | 16.7% |
| Creek | 15 | 0.2% |
| Cuban | 13 | 0.2% |
| Dutch West Indian | 13 | 0.2% |
| English | 475 | 6.8% |
| European | 175 | 2.5% |
| Fijian | 76 | 1.1% |
| Filipino | 5 | 0.1% |
| French | 145 | 2.1% |
| French Canadian | 32 | 0.5% |
| German | 328 | 4.7% |
| Guamanian / Chamorro | 19 | 0.3% |
| Guatemalan | 20 | 0.3% |
| Irish | 529 | 7.6% |
| Iroquois | 10 | 0.1% |
| Italian | 41 | 0.6% |
| Korean | 46 | 0.7% |
| Mexican | 551 | 7.9% |
| Navajo | 32 | 0.5% |
| Nigerian | 11 | 0.2% |
| Norwegian | 48 | 0.7% |
| Portuguese | 45 | 0.6% |
| Puerto Rican | 31 | 0.4% |
| Russian | 52 | 0.7% |
| Scandinavian | 21 | 0.3% |
| Scotch-Irish | 62 | 0.9% |
| Scottish | 29 | 0.4% |
| Seminole | 8 | 0.1% |
| Shoshone | 24 | 0.3% |
| Sioux | 18 | 0.3% |
| South American | 55 | 0.8% |
| Spaniard | 25 | 0.4% |
| Sri Lankan | 42 | 0.6% |
| Subsaharan African | 65 | 0.9% |
| Swedish | 40 | 0.6% |
| Swiss | 9 | 0.1% |
| U.S. Virgin Islander | 14 | 0.2% |
| Ukrainian | 18 | 0.3% |
| Venezuelan | 55 | 0.8% |
| Welsh | 18 | 0.3% |
| West Indian | 13 | 0.2% | View All 47 Rows |
Immigrants in Idabel
The most numerous immigrant groups reported in Idabel came from Latin America (179 | 2.6%), Central America (166 | 2.4%), Mexico (166 | 2.4%), Europe (92 | 1.3%), and Asia (57 | 0.8%), together accounting for 9.4% of all Idabel residents.
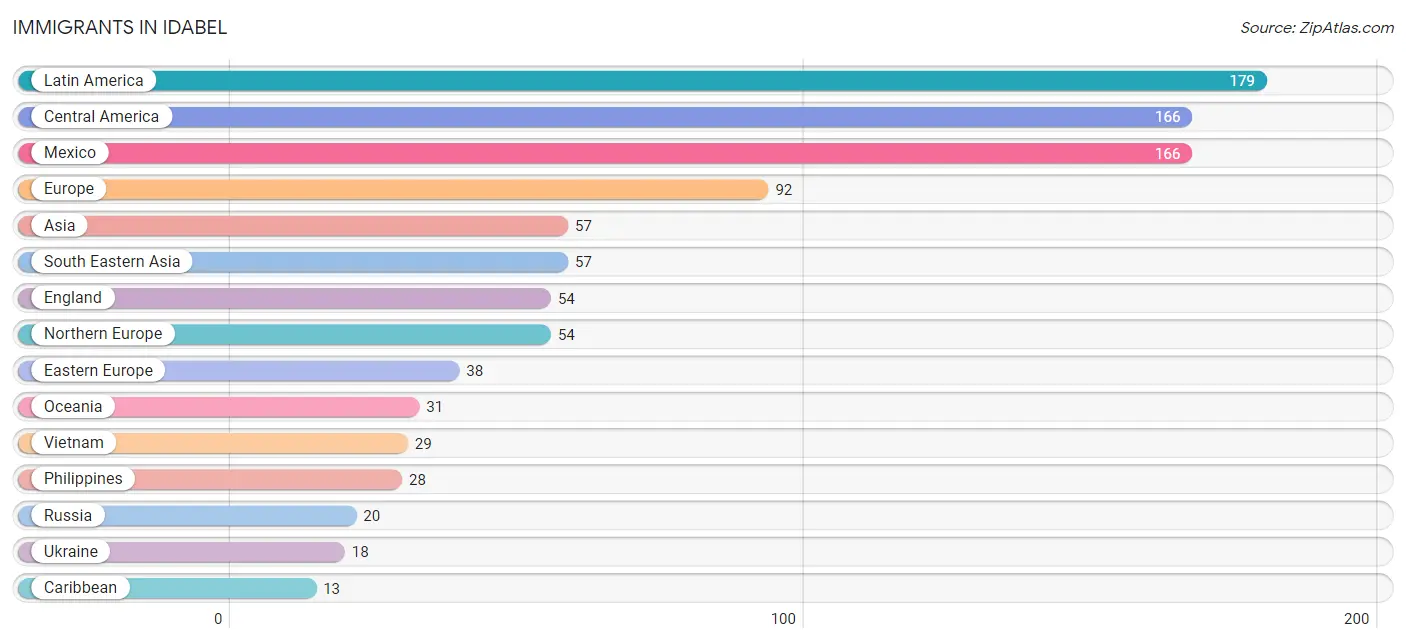
| Immigration Origin | # Population | % Population |
| Asia | 57 | 0.8% |
| Canada | 6 | 0.1% |
| Caribbean | 13 | 0.2% |
| Central America | 166 | 2.4% |
| Cuba | 13 | 0.2% |
| Eastern Europe | 38 | 0.5% |
| England | 54 | 0.8% |
| Europe | 92 | 1.3% |
| Latin America | 179 | 2.6% |
| Mexico | 166 | 2.4% |
| Northern Europe | 54 | 0.8% |
| Oceania | 31 | 0.4% |
| Philippines | 28 | 0.4% |
| Russia | 20 | 0.3% |
| South Eastern Asia | 57 | 0.8% |
| Ukraine | 18 | 0.3% |
| Vietnam | 29 | 0.4% | View All 17 Rows |
Sex and Age in Idabel
Sex and Age in Idabel
The most populous age groups in Idabel are Under 5 Years (443 | 12.8%) for men and Under 5 Years (317 | 9.0%) for women.
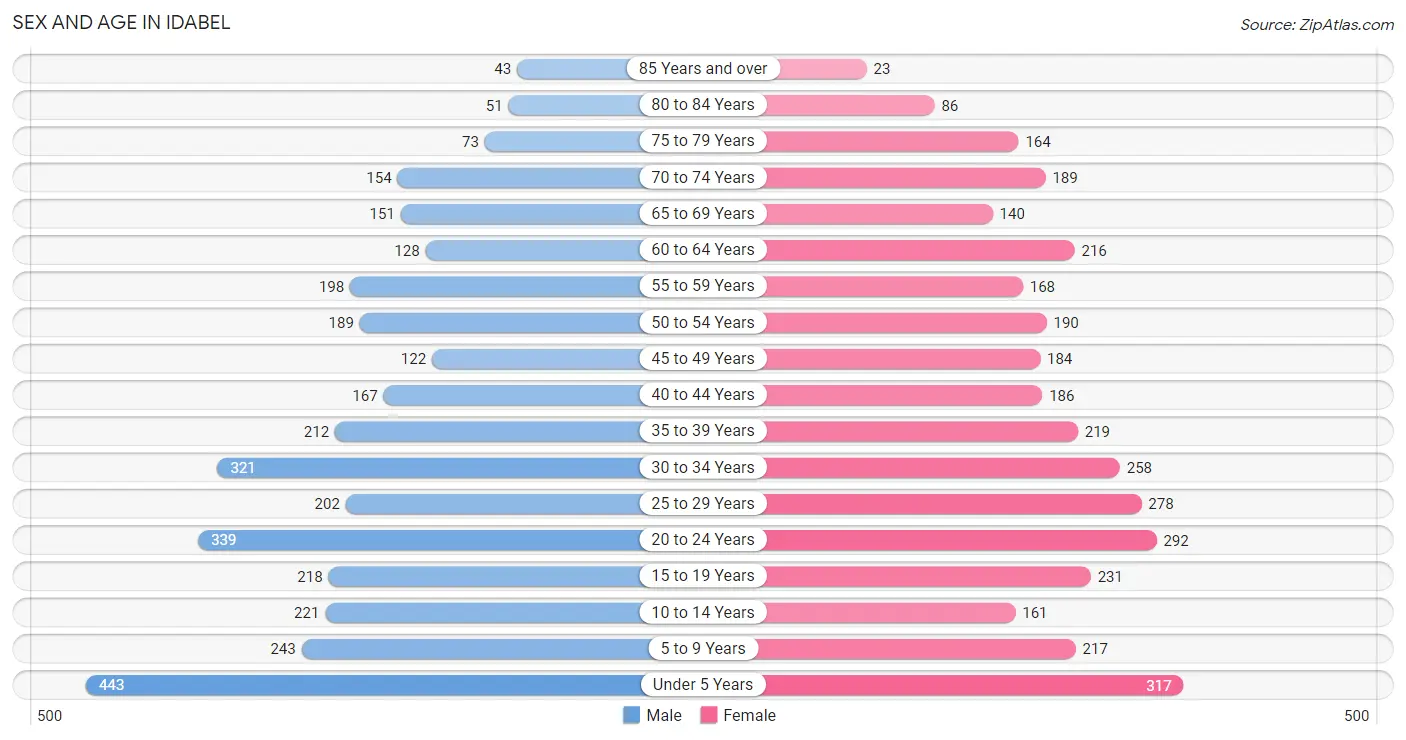
| Age Bracket | Male | Female |
| Under 5 Years | 443 (12.8%) | 317 (9.0%) |
| 5 to 9 Years | 243 (7.0%) | 217 (6.2%) |
| 10 to 14 Years | 221 (6.4%) | 161 (4.6%) |
| 15 to 19 Years | 218 (6.3%) | 231 (6.6%) |
| 20 to 24 Years | 339 (9.8%) | 292 (8.3%) |
| 25 to 29 Years | 202 (5.8%) | 278 (7.9%) |
| 30 to 34 Years | 321 (9.2%) | 258 (7.3%) |
| 35 to 39 Years | 212 (6.1%) | 219 (6.2%) |
| 40 to 44 Years | 167 (4.8%) | 186 (5.3%) |
| 45 to 49 Years | 122 (3.5%) | 184 (5.2%) |
| 50 to 54 Years | 189 (5.4%) | 190 (5.4%) |
| 55 to 59 Years | 198 (5.7%) | 168 (4.8%) |
| 60 to 64 Years | 128 (3.7%) | 216 (6.1%) |
| 65 to 69 Years | 151 (4.3%) | 140 (4.0%) |
| 70 to 74 Years | 154 (4.4%) | 189 (5.4%) |
| 75 to 79 Years | 73 (2.1%) | 164 (4.7%) |
| 80 to 84 Years | 51 (1.5%) | 86 (2.4%) |
| 85 Years and over | 43 (1.2%) | 23 (0.6%) |
| Total | 3,475 (100.0%) | 3,519 (100.0%) |
Families and Households in Idabel
Median Family Size in Idabel
The median family size in Idabel is 3.30 persons per family, with single female/mother families (572 | 35.3%) accounting for the largest median family size of 3.42 persons per family. On the other hand, single male/father families (144 | 8.9%) represent the smallest median family size with 3.23 persons per family.
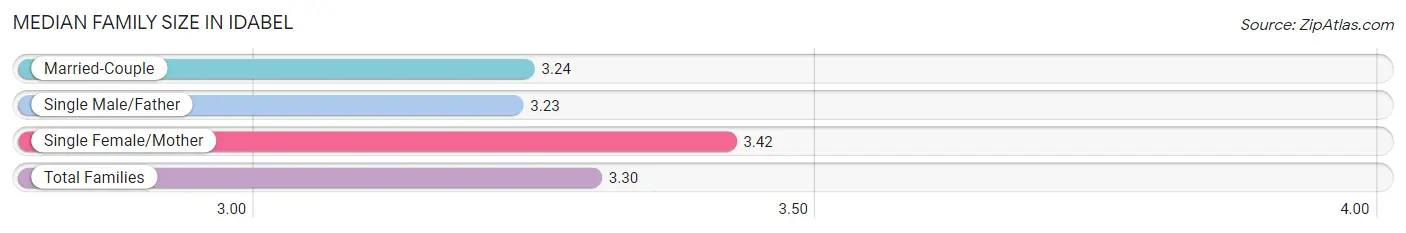
| Family Type | # Families | Family Size |
| Married-Couple | 902 (55.7%) | 3.24 |
| Single Male/Father | 144 (8.9%) | 3.23 |
| Single Female/Mother | 572 (35.3%) | 3.42 |
| Total Families | 1,618 (100.0%) | 3.30 |
Median Household Size in Idabel
The median household size in Idabel is 2.64 persons per household, with single male/father households (144 | 5.6%) accounting for the largest median household size of 4.4 persons per household. non-family households (948 | 36.9%) represent the smallest median household size with 1.09 persons per household.
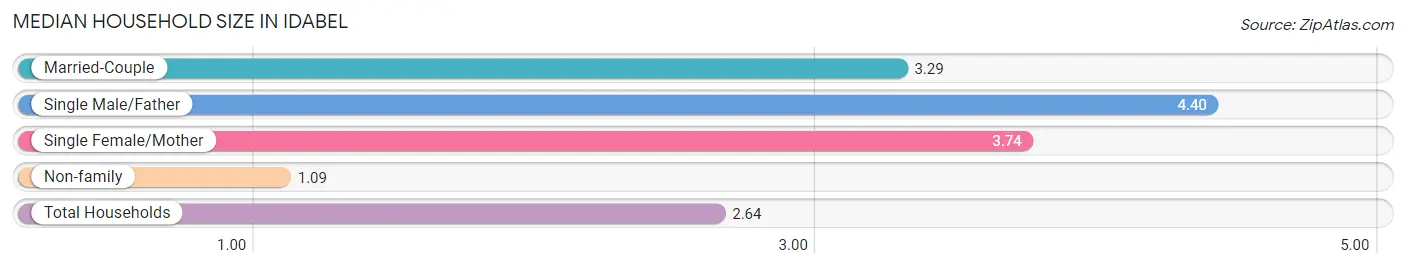
| Household Type | # Households | Household Size |
| Married-Couple | 902 (35.1%) | 3.29 |
| Single Male/Father | 144 (5.6%) | 4.40 |
| Single Female/Mother | 572 (22.3%) | 3.74 |
| Non-family | 948 (36.9%) | 1.09 |
| Total Households | 2,566 (100.0%) | 2.64 |
Household Size by Marriage Status in Idabel
Out of a total of 2,566 households in Idabel, 1,618 (63.1%) are family households, while 948 (36.9%) are nonfamily households. The most numerous type of family households are 2-person households, comprising 564, and the most common type of nonfamily households are 1-person households, comprising 903.
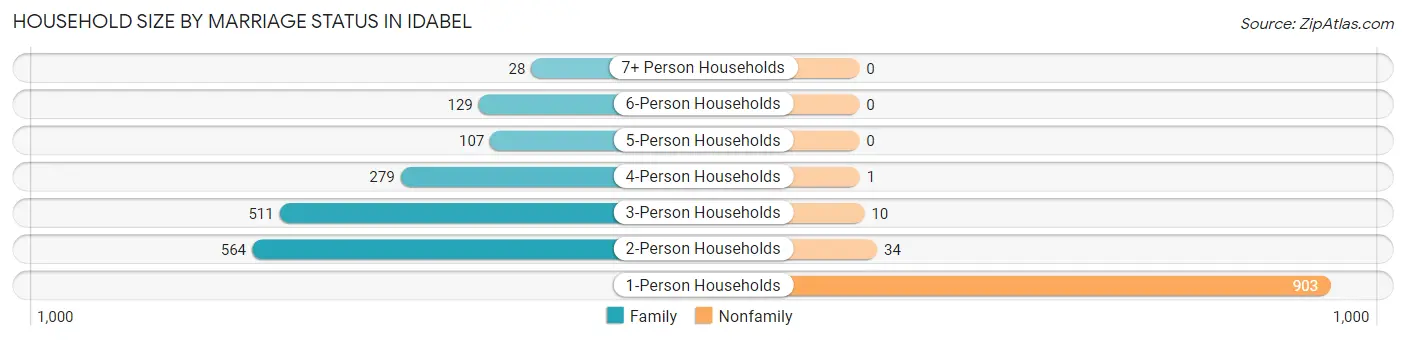
| Household Size | Family Households | Nonfamily Households |
| 1-Person Households | - | 903 (35.2%) |
| 2-Person Households | 564 (22.0%) | 34 (1.3%) |
| 3-Person Households | 511 (19.9%) | 10 (0.4%) |
| 4-Person Households | 279 (10.9%) | 1 (0.0%) |
| 5-Person Households | 107 (4.2%) | 0 (0.0%) |
| 6-Person Households | 129 (5.0%) | 0 (0.0%) |
| 7+ Person Households | 28 (1.1%) | 0 (0.0%) |
| Total | 1,618 (63.1%) | 948 (36.9%) |
Female Fertility in Idabel
Fertility by Age in Idabel
Average fertility rate in Idabel is 79.0 births per 1,000 women. Women in the age bracket of 20 to 34 years have the highest fertility rate with 104.0 births per 1,000 women. Women in the age bracket of 20 to 34 years acount for 66.1% of all women with births.
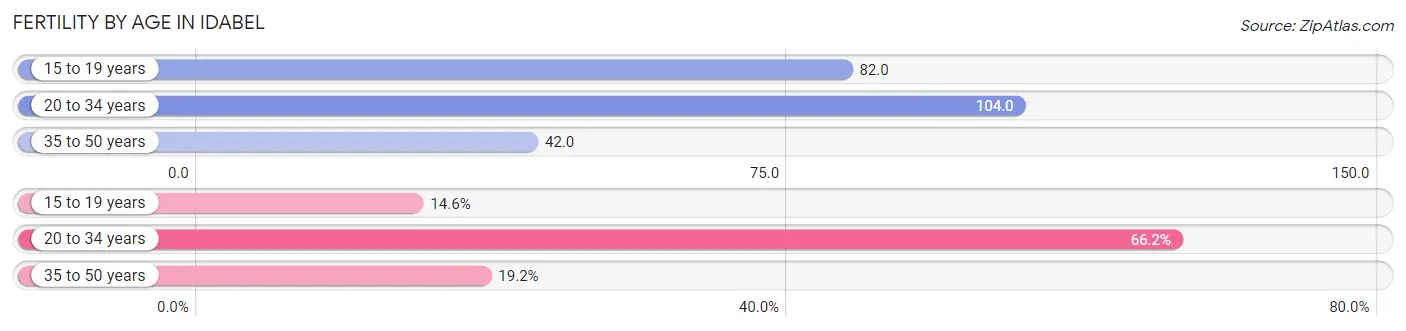
| Age Bracket | Women with Births | Births / 1,000 Women |
| 15 to 19 years | 19 (14.6%) | 82.0 |
| 20 to 34 years | 86 (66.1%) | 104.0 |
| 35 to 50 years | 25 (19.2%) | 42.0 |
| Total | 130 (100.0%) | 79.0 |
Fertility by Age by Marriage Status in Idabel
63.8% of women with births (130) in Idabel are married. The highest percentage of unmarried women with births falls into 15 to 19 years age bracket with 100.0% of them unmarried at the time of birth, while the lowest percentage of unmarried women with births belong to 20 to 34 years age bracket with 24.4% of them unmarried.
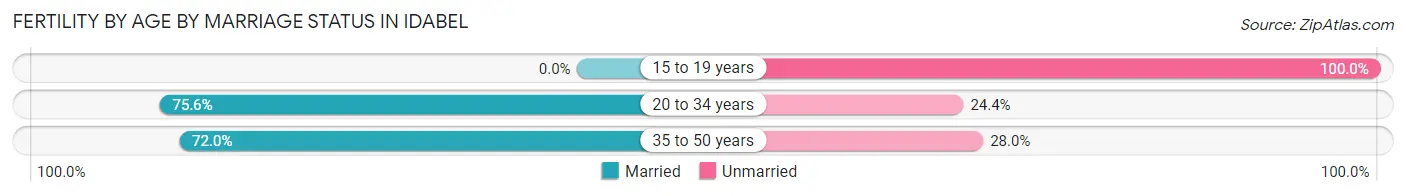
| Age Bracket | Married | Unmarried |
| 15 to 19 years | 0 (0.0%) | 19 (100.0%) |
| 20 to 34 years | 65 (75.6%) | 21 (24.4%) |
| 35 to 50 years | 18 (72.0%) | 7 (28.0%) |
| Total | 83 (63.8%) | 47 (36.1%) |
Fertility by Education in Idabel
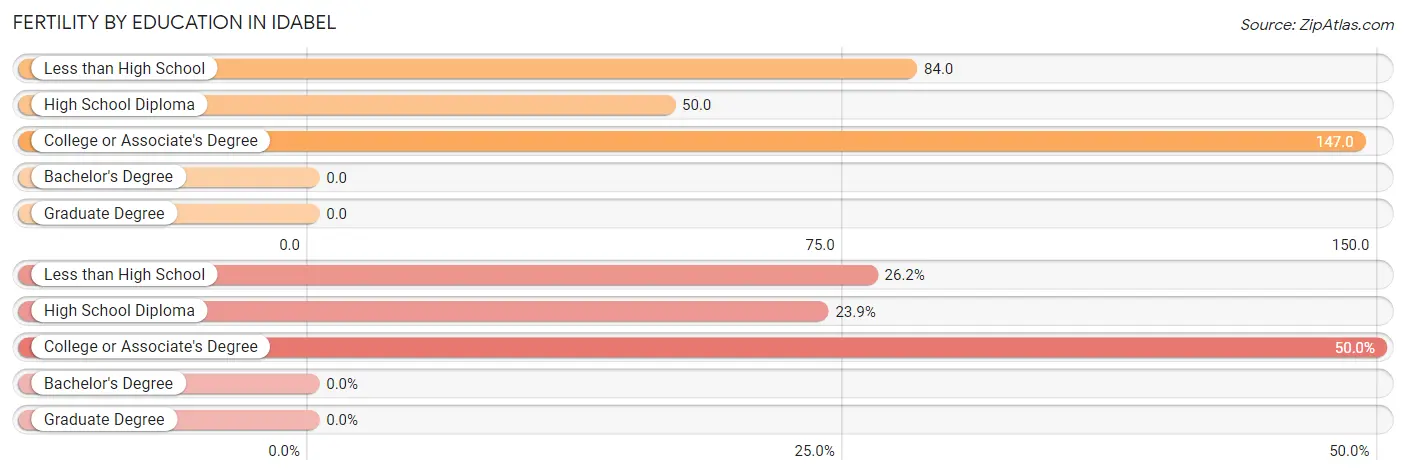
| Educational Attainment | Women with Births | Births / 1,000 Women |
| Less than High School | 34 (26.2%) | 84.0 |
| High School Diploma | 31 (23.8%) | 50.0 |
| College or Associate's Degree | 65 (50.0%) | 147.0 |
| Bachelor's Degree | 0 (0.0%) | 0.0 |
| Graduate Degree | 0 (0.0%) | 0.0 |
| Total | 130 (100.0%) | 79.0 |
Fertility by Education by Marriage Status in Idabel
36.1% of women with births in Idabel are unmarried. Women with the educational attainment of high school diploma are most likely to be married with 100.0% of them married at childbirth, while women with the educational attainment of less than high school are least likely to be married with 55.9% of them unmarried at childbirth.
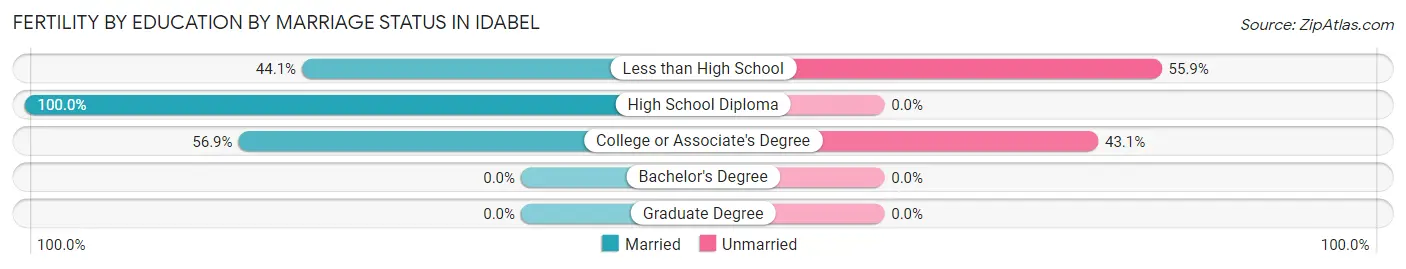
| Educational Attainment | Married | Unmarried |
| Less than High School | 15 (44.1%) | 19 (55.9%) |
| High School Diploma | 31 (100.0%) | 0 (0.0%) |
| College or Associate's Degree | 37 (56.9%) | 28 (43.1%) |
| Bachelor's Degree | 0 (0.0%) | 0 (0.0%) |
| Graduate Degree | 0 (0.0%) | 0 (0.0%) |
| Total | 83 (63.8%) | 47 (36.1%) |
Employment Characteristics in Idabel
Employment by Class of Employer in Idabel
Among the 2,676 employed individuals in Idabel, private company employees (1,785 | 66.7%), not-for-profit organizations (221 | 8.3%), and local government employees (206 | 7.7%) make up the most common classes of employment.
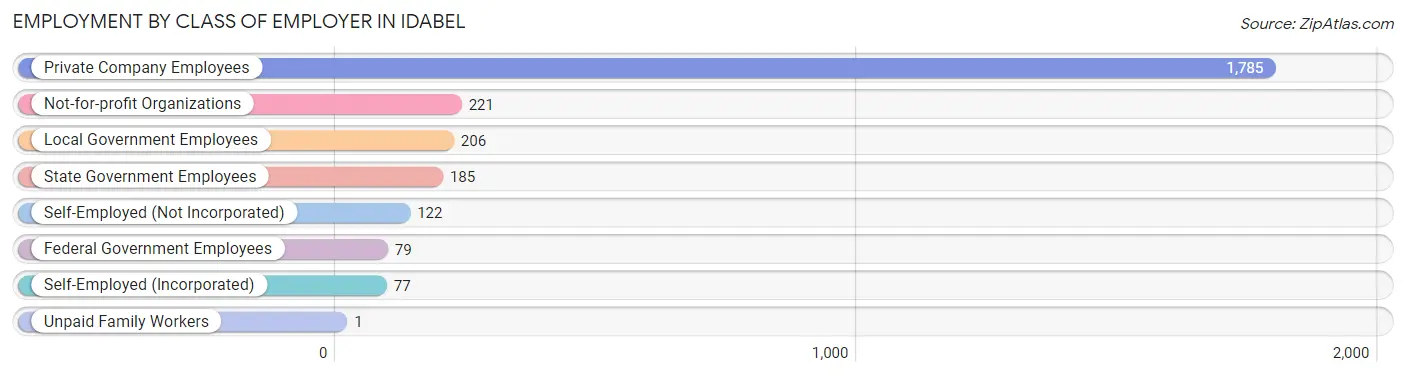
| Employer Class | # Employees | % Employees |
| Private Company Employees | 1,785 | 66.7% |
| Self-Employed (Incorporated) | 77 | 2.9% |
| Self-Employed (Not Incorporated) | 122 | 4.6% |
| Not-for-profit Organizations | 221 | 8.3% |
| Local Government Employees | 206 | 7.7% |
| State Government Employees | 185 | 6.9% |
| Federal Government Employees | 79 | 2.9% |
| Unpaid Family Workers | 1 | 0.0% |
| Total | 2,676 | 100.0% |
Employment Status by Age in Idabel
According to the labor force statistics for Idabel, out of the total population over 16 years of age (5,295), 55.4% or 2,933 individuals are in the labor force, with 8.3% or 243 of them unemployed. The age group with the highest labor force participation rate is 35 to 44 years, with 78.3% or 614 individuals in the labor force. Within the labor force, the 35 to 44 years age range has the highest percentage of unemployed individuals, with 15.1% or 93 of them being unemployed.
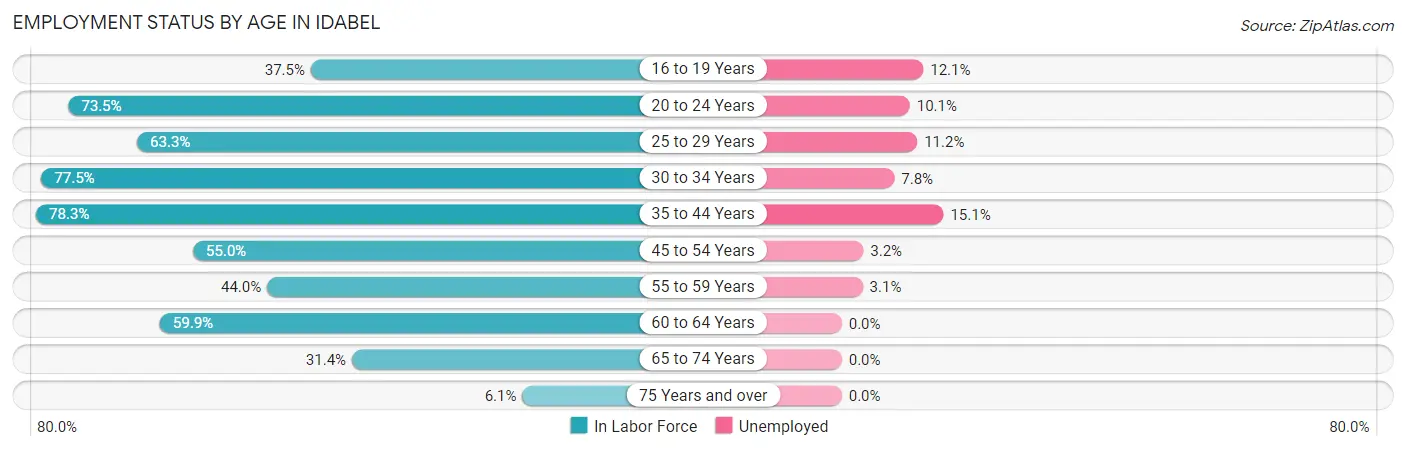
| Age Bracket | In Labor Force | Unemployed |
| 16 to 19 Years | 132 (37.5%) | 16 (12.1%) |
| 20 to 24 Years | 464 (73.5%) | 47 (10.1%) |
| 25 to 29 Years | 304 (63.3%) | 34 (11.2%) |
| 30 to 34 Years | 449 (77.5%) | 35 (7.8%) |
| 35 to 44 Years | 614 (78.3%) | 93 (15.1%) |
| 45 to 54 Years | 377 (55.0%) | 12 (3.2%) |
| 55 to 59 Years | 161 (44.0%) | 5 (3.1%) |
| 60 to 64 Years | 206 (59.9%) | 0 (0.0%) |
| 65 to 74 Years | 199 (31.4%) | 0 (0.0%) |
| 75 Years and over | 27 (6.1%) | 0 (0.0%) |
| Total | 2,933 (55.4%) | 243 (8.3%) |
Employment Status by Educational Attainment in Idabel
According to labor force statistics for Idabel, 65.2% of individuals (2,111) out of the total population between 25 and 64 years of age (3,238) are in the labor force, with 8.5% or 179 of them being unemployed. The group with the highest labor force participation rate are those with the educational attainment of bachelor's degree or higher, with 87.0% or 482 individuals in the labor force. Within the labor force, individuals with less than high school education have the highest percentage of unemployment, with 16.7% or 34 of them being unemployed.
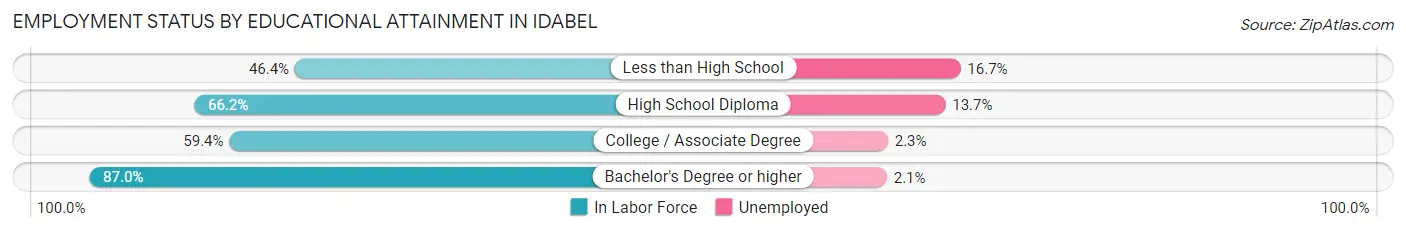
| Educational Attainment | In Labor Force | Unemployed |
| Less than High School | 204 (46.4%) | 73 (16.7%) |
| High School Diploma | 896 (66.2%) | 185 (13.7%) |
| College / Associate Degree | 529 (59.4%) | 20 (2.3%) |
| Bachelor's Degree or higher | 482 (87.0%) | 12 (2.1%) |
| Total | 2,111 (65.2%) | 275 (8.5%) |
Employment Occupations by Sex in Idabel
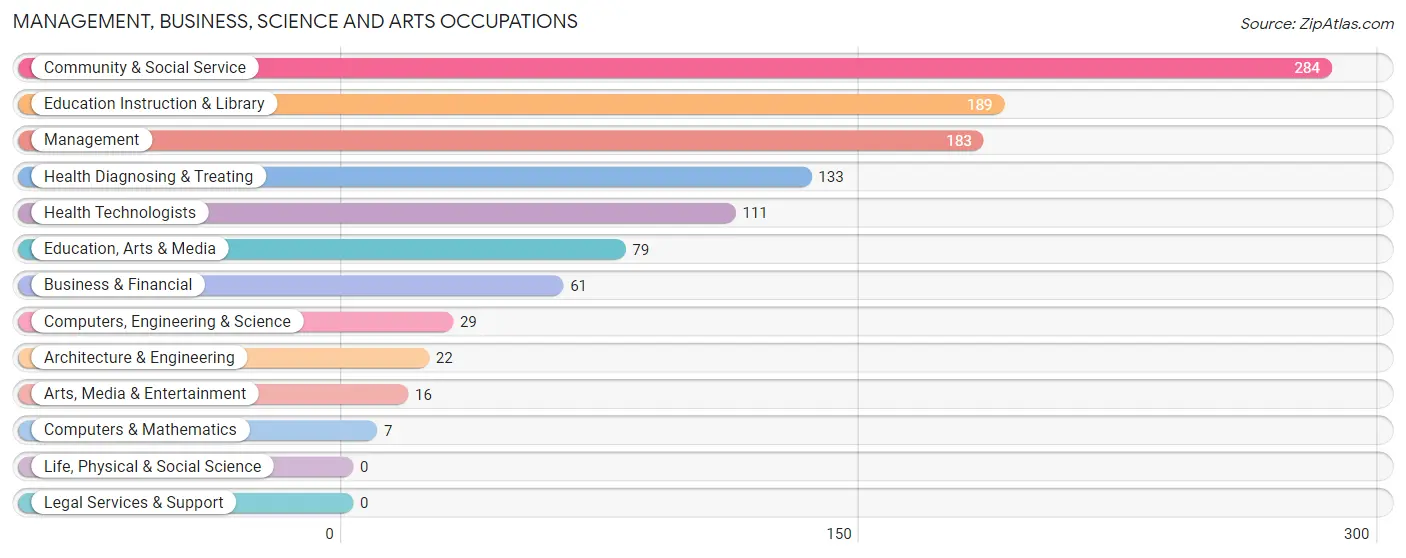
Management, Business, Science and Arts Occupations
The most common Management, Business, Science and Arts occupations in Idabel are Community & Social Service (284 | 10.5%), Education Instruction & Library (189 | 7.0%), Management (183 | 6.8%), Health Diagnosing & Treating (133 | 4.9%), and Health Technologists (111 | 4.1%).
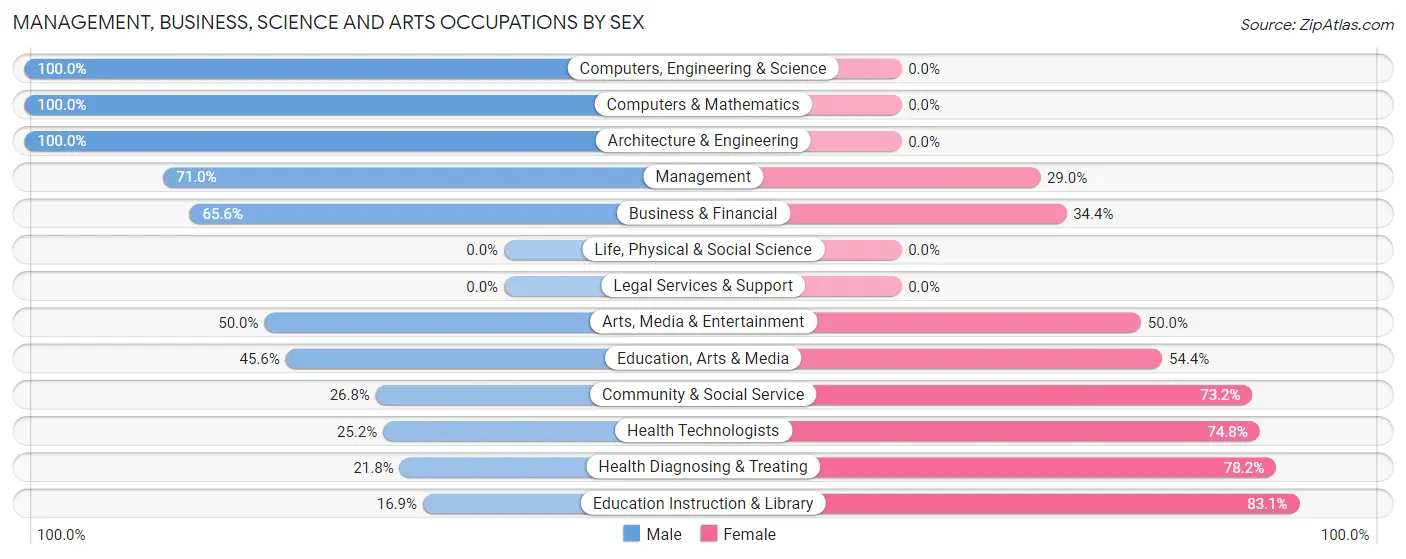
Management, Business, Science and Arts Occupations by Sex
Within the Management, Business, Science and Arts occupations in Idabel, the most male-oriented occupations are Computers, Engineering & Science (100.0%), Computers & Mathematics (100.0%), and Architecture & Engineering (100.0%), while the most female-oriented occupations are Education Instruction & Library (83.1%), Health Diagnosing & Treating (78.2%), and Health Technologists (74.8%).
| Occupation | Male | Female |
| Management | 130 (71.0%) | 53 (29.0%) |
| Business & Financial | 40 (65.6%) | 21 (34.4%) |
| Computers, Engineering & Science | 29 (100.0%) | 0 (0.0%) |
| Computers & Mathematics | 7 (100.0%) | 0 (0.0%) |
| Architecture & Engineering | 22 (100.0%) | 0 (0.0%) |
| Life, Physical & Social Science | 0 (0.0%) | 0 (0.0%) |
| Community & Social Service | 76 (26.8%) | 208 (73.2%) |
| Education, Arts & Media | 36 (45.6%) | 43 (54.4%) |
| Legal Services & Support | 0 (0.0%) | 0 (0.0%) |
| Education Instruction & Library | 32 (16.9%) | 157 (83.1%) |
| Arts, Media & Entertainment | 8 (50.0%) | 8 (50.0%) |
| Health Diagnosing & Treating | 29 (21.8%) | 104 (78.2%) |
| Health Technologists | 28 (25.2%) | 83 (74.8%) |
| Total (Category) | 304 (44.1%) | 386 (55.9%) |
| Total (Overall) | 1,402 (52.1%) | 1,289 (47.9%) |
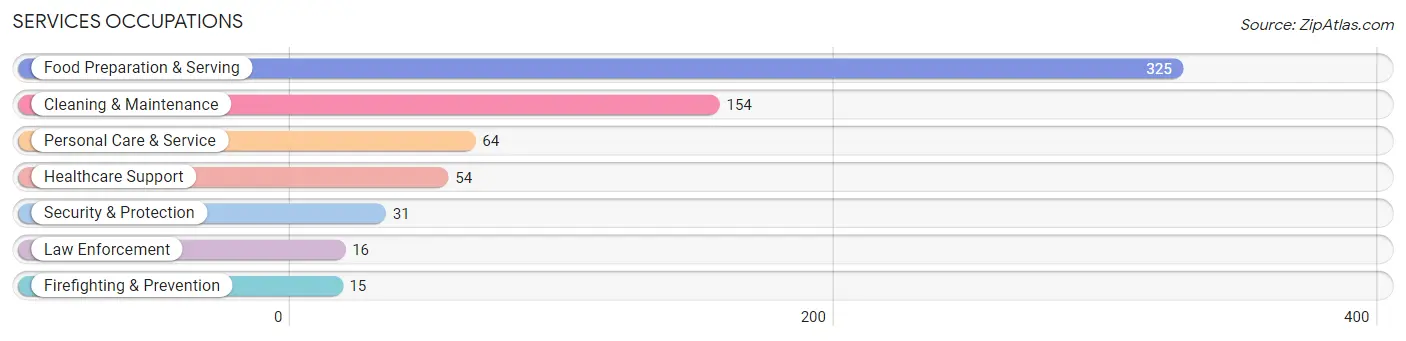
Services Occupations
The most common Services occupations in Idabel are Food Preparation & Serving (325 | 12.1%), Cleaning & Maintenance (154 | 5.7%), Personal Care & Service (64 | 2.4%), Healthcare Support (54 | 2.0%), and Security & Protection (31 | 1.1%).
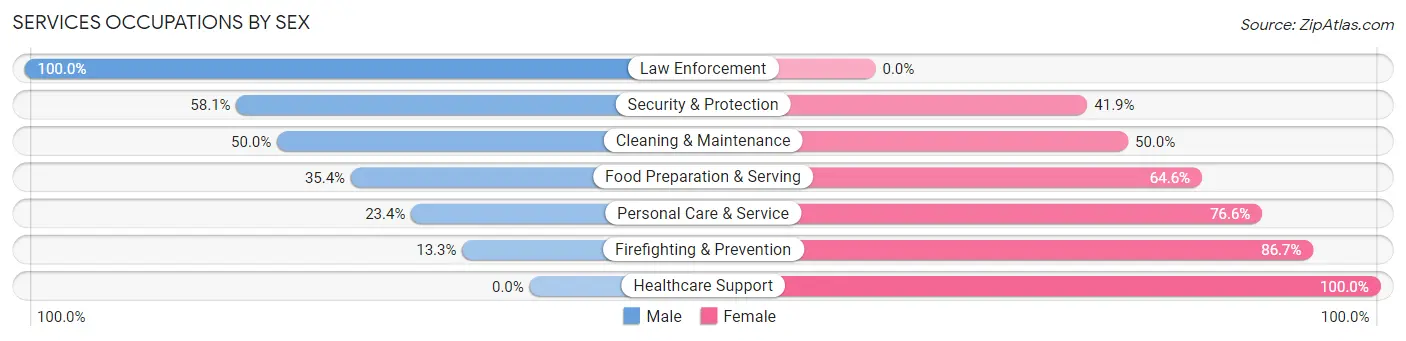
Services Occupations by Sex
Within the Services occupations in Idabel, the most male-oriented occupations are Law Enforcement (100.0%), Security & Protection (58.1%), and Cleaning & Maintenance (50.0%), while the most female-oriented occupations are Healthcare Support (100.0%), Firefighting & Prevention (86.7%), and Personal Care & Service (76.6%).
| Occupation | Male | Female |
| Healthcare Support | 0 (0.0%) | 54 (100.0%) |
| Security & Protection | 18 (58.1%) | 13 (41.9%) |
| Firefighting & Prevention | 2 (13.3%) | 13 (86.7%) |
| Law Enforcement | 16 (100.0%) | 0 (0.0%) |
| Food Preparation & Serving | 115 (35.4%) | 210 (64.6%) |
| Cleaning & Maintenance | 77 (50.0%) | 77 (50.0%) |
| Personal Care & Service | 15 (23.4%) | 49 (76.6%) |
| Total (Category) | 225 (35.8%) | 403 (64.2%) |
| Total (Overall) | 1,402 (52.1%) | 1,289 (47.9%) |
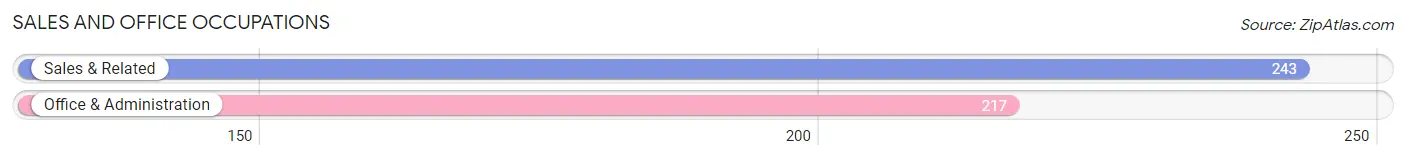
Sales and Office Occupations
The most common Sales and Office occupations in Idabel are Sales & Related (243 | 9.0%), and Office & Administration (217 | 8.1%).
Sales and Office Occupations by Sex
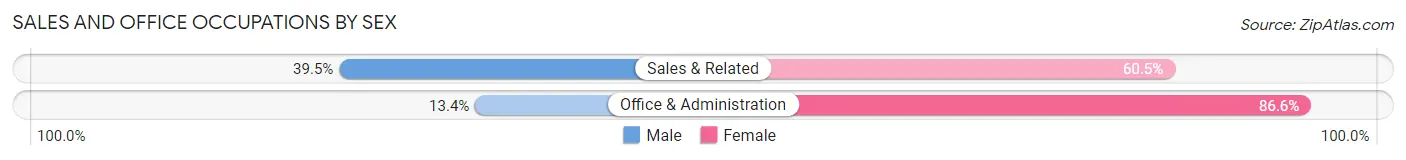
| Occupation | Male | Female |
| Sales & Related | 96 (39.5%) | 147 (60.5%) |
| Office & Administration | 29 (13.4%) | 188 (86.6%) |
| Total (Category) | 125 (27.2%) | 335 (72.8%) |
| Total (Overall) | 1,402 (52.1%) | 1,289 (47.9%) |
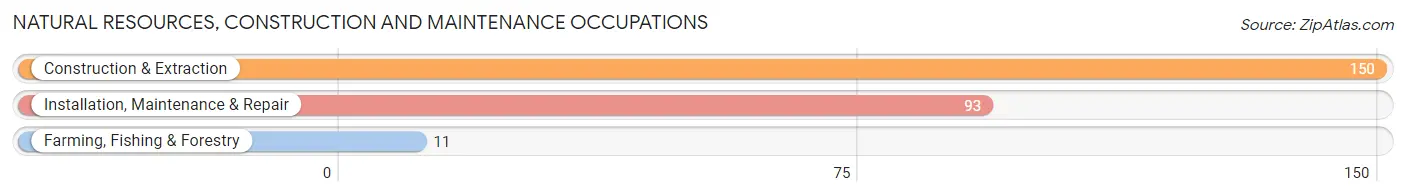
Natural Resources, Construction and Maintenance Occupations
The most common Natural Resources, Construction and Maintenance occupations in Idabel are Construction & Extraction (150 | 5.6%), Installation, Maintenance & Repair (93 | 3.5%), and Farming, Fishing & Forestry (11 | 0.4%).
Natural Resources, Construction and Maintenance Occupations by Sex
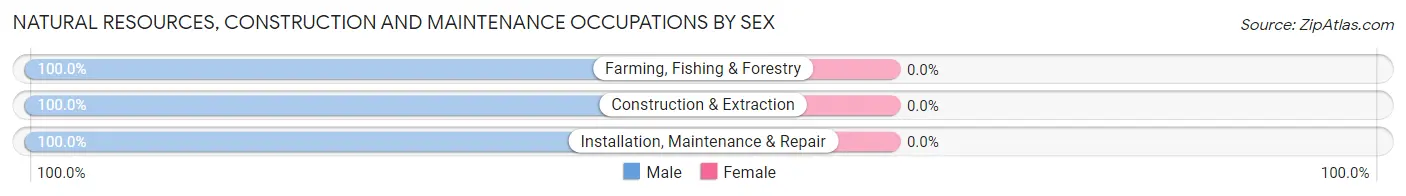
| Occupation | Male | Female |
| Farming, Fishing & Forestry | 11 (100.0%) | 0 (0.0%) |
| Construction & Extraction | 150 (100.0%) | 0 (0.0%) |
| Installation, Maintenance & Repair | 93 (100.0%) | 0 (0.0%) |
| Total (Category) | 254 (100.0%) | 0 (0.0%) |
| Total (Overall) | 1,402 (52.1%) | 1,289 (47.9%) |
Production, Transportation and Moving Occupations
The most common Production, Transportation and Moving occupations in Idabel are Production (305 | 11.3%), Material Moving (191 | 7.1%), and Transportation (163 | 6.1%).
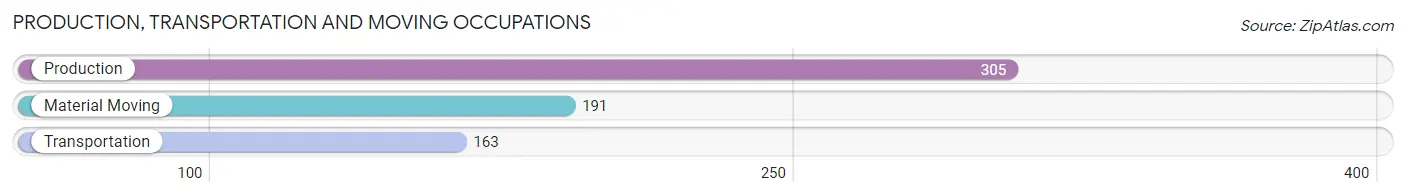
Production, Transportation and Moving Occupations by Sex
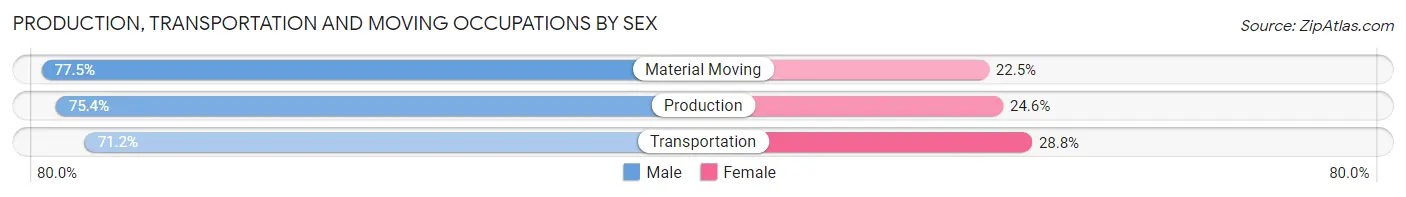
| Occupation | Male | Female |
| Production | 230 (75.4%) | 75 (24.6%) |
| Transportation | 116 (71.2%) | 47 (28.8%) |
| Material Moving | 148 (77.5%) | 43 (22.5%) |
| Total (Category) | 494 (75.0%) | 165 (25.0%) |
| Total (Overall) | 1,402 (52.1%) | 1,289 (47.9%) |
Employment Industries by Sex in Idabel
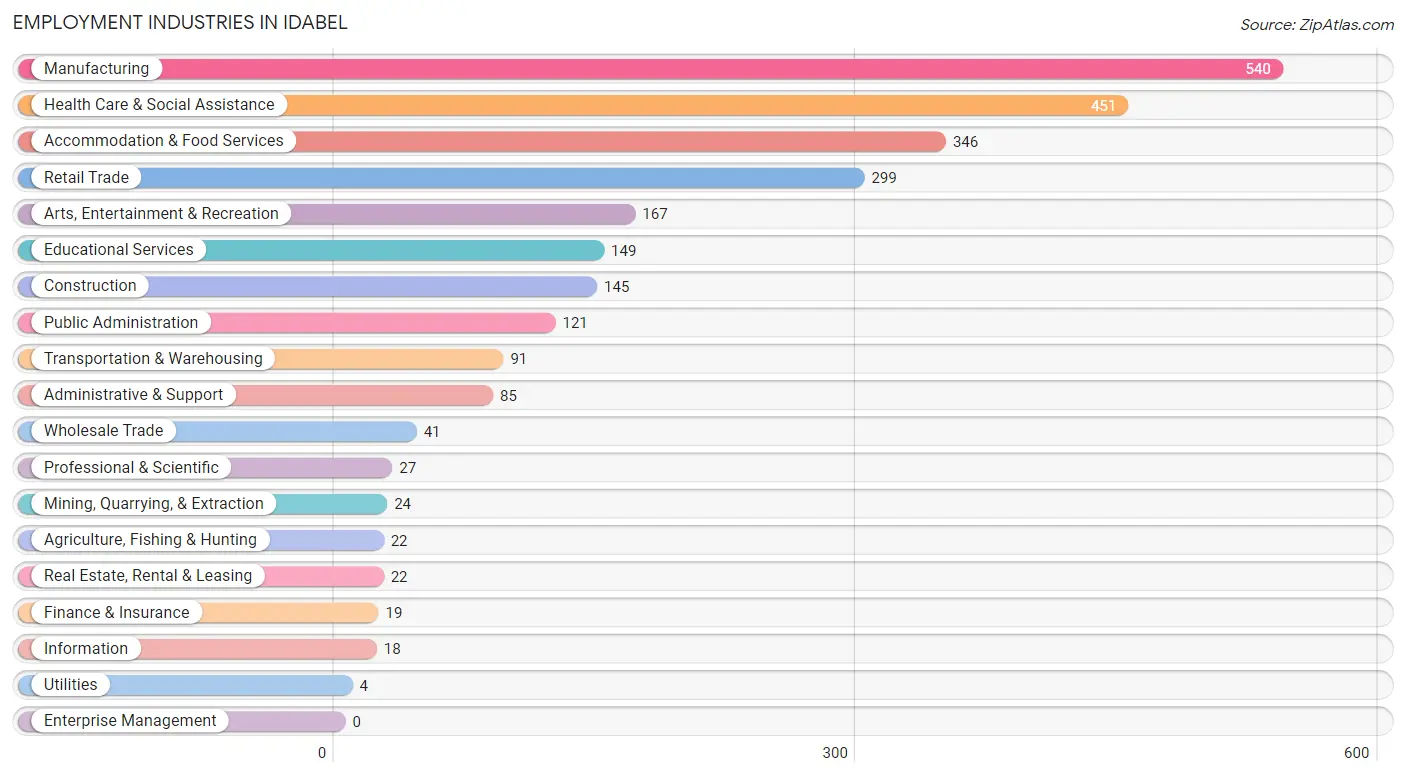
Employment Industries in Idabel
The major employment industries in Idabel include Manufacturing (540 | 20.1%), Health Care & Social Assistance (451 | 16.8%), Accommodation & Food Services (346 | 12.9%), Retail Trade (299 | 11.1%), and Arts, Entertainment & Recreation (167 | 6.2%).
Employment Industries by Sex in Idabel
The Idabel industries that see more men than women are Agriculture, Fishing & Hunting (100.0%), Mining, Quarrying, & Extraction (100.0%), and Construction (100.0%), whereas the industries that tend to have a higher number of women are Information (100.0%), Finance & Insurance (100.0%), and Health Care & Social Assistance (78.3%).
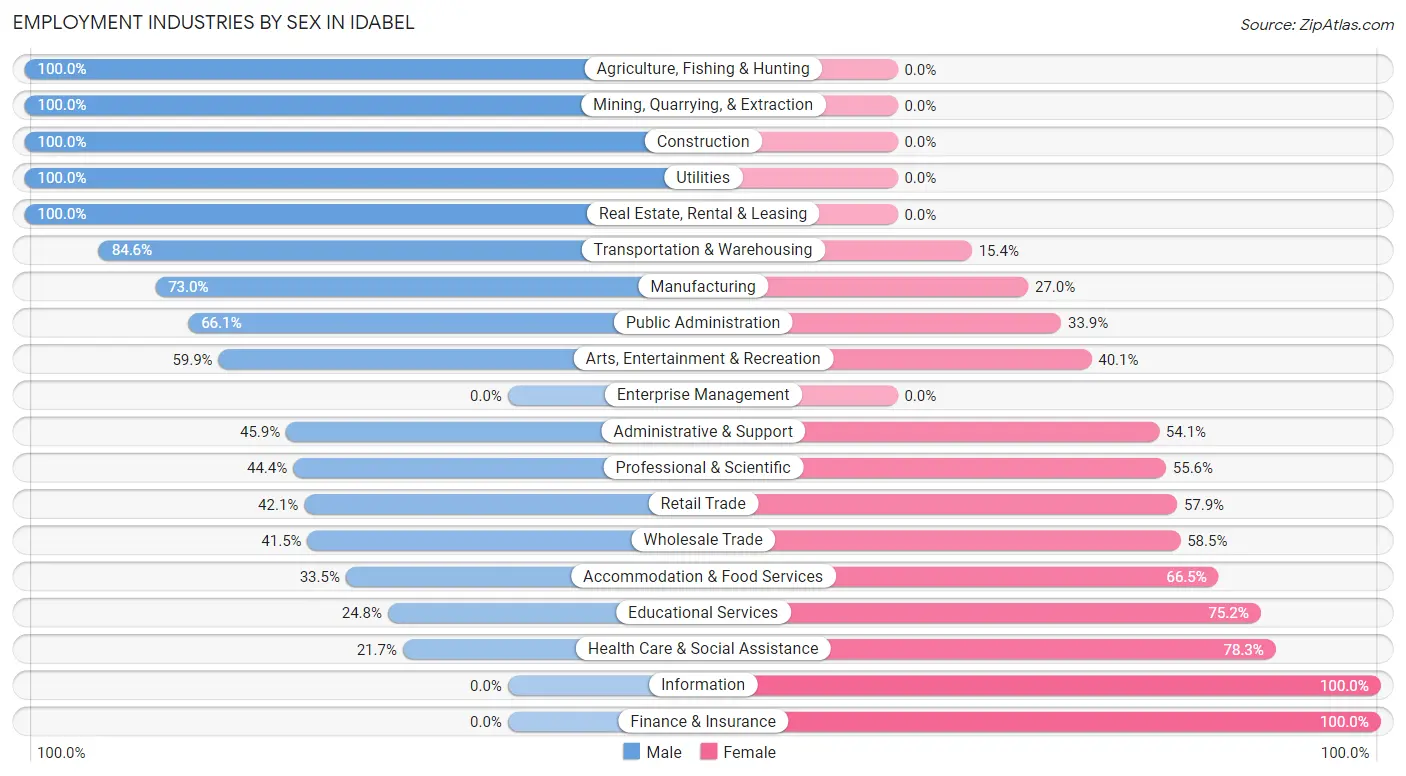
| Industry | Male | Female |
| Agriculture, Fishing & Hunting | 22 (100.0%) | 0 (0.0%) |
| Mining, Quarrying, & Extraction | 24 (100.0%) | 0 (0.0%) |
| Construction | 145 (100.0%) | 0 (0.0%) |
| Manufacturing | 394 (73.0%) | 146 (27.0%) |
| Wholesale Trade | 17 (41.5%) | 24 (58.5%) |
| Retail Trade | 126 (42.1%) | 173 (57.9%) |
| Transportation & Warehousing | 77 (84.6%) | 14 (15.4%) |
| Utilities | 4 (100.0%) | 0 (0.0%) |
| Information | 0 (0.0%) | 18 (100.0%) |
| Finance & Insurance | 0 (0.0%) | 19 (100.0%) |
| Real Estate, Rental & Leasing | 22 (100.0%) | 0 (0.0%) |
| Professional & Scientific | 12 (44.4%) | 15 (55.6%) |
| Enterprise Management | 0 (0.0%) | 0 (0.0%) |
| Administrative & Support | 39 (45.9%) | 46 (54.1%) |
| Educational Services | 37 (24.8%) | 112 (75.2%) |
| Health Care & Social Assistance | 98 (21.7%) | 353 (78.3%) |
| Arts, Entertainment & Recreation | 100 (59.9%) | 67 (40.1%) |
| Accommodation & Food Services | 116 (33.5%) | 230 (66.5%) |
| Public Administration | 80 (66.1%) | 41 (33.9%) |
| Total | 1,402 (52.1%) | 1,289 (47.9%) |
Education in Idabel
School Enrollment in Idabel
The most common levels of schooling among the 1,419 students in Idabel are high school (358 | 25.2%), elementary school (313 | 22.1%), and middle school (299 | 21.1%).
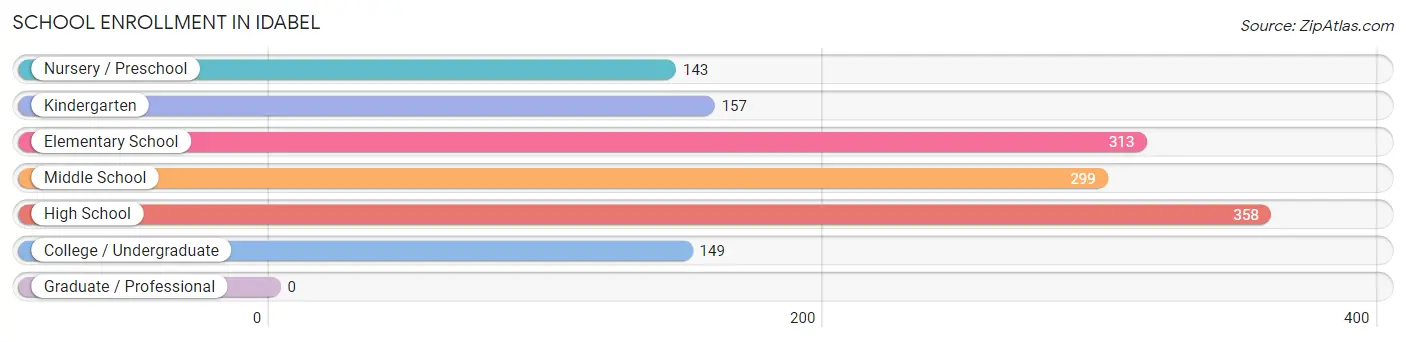
| School Level | # Students | % Students |
| Nursery / Preschool | 143 | 10.1% |
| Kindergarten | 157 | 11.1% |
| Elementary School | 313 | 22.1% |
| Middle School | 299 | 21.1% |
| High School | 358 | 25.2% |
| College / Undergraduate | 149 | 10.5% |
| Graduate / Professional | 0 | 0.0% |
| Total | 1,419 | 100.0% |
School Enrollment by Age by Funding Source in Idabel
Out of a total of 1,419 students who are enrolled in schools in Idabel, 82 (5.8%) attend a private institution, while the remaining 1,337 (94.2%) are enrolled in public schools. The age group of 20 to 24 year olds has the highest likelihood of being enrolled in private schools, with 24 (50.0% in the age bracket) enrolled. Conversely, the age group of 25 to 34 year olds has the lowest likelihood of being enrolled in a private school, with 66 (100.0% in the age bracket) attending a public institution.
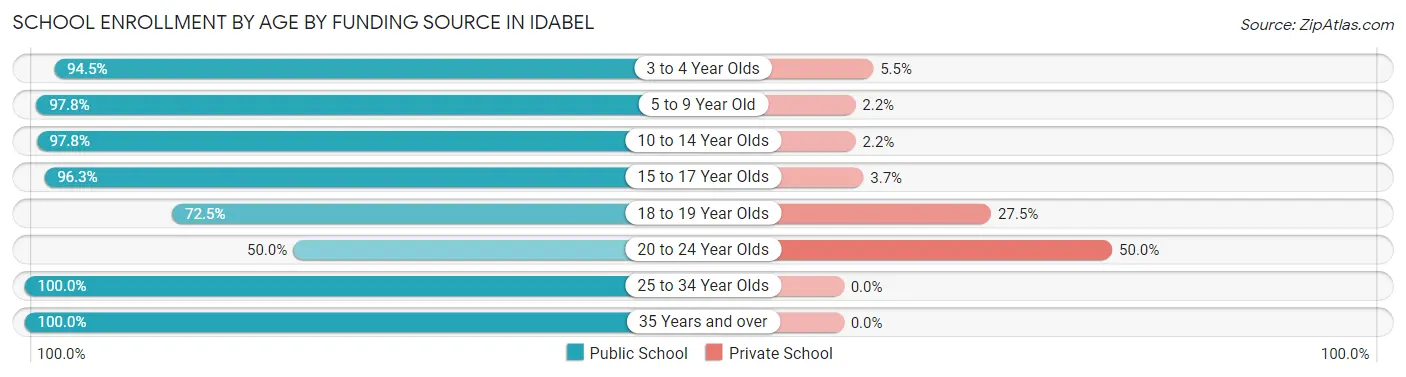
| Age Bracket | Public School | Private School |
| 3 to 4 Year Olds | 120 (94.5%) | 7 (5.5%) |
| 5 to 9 Year Old | 450 (97.8%) | 10 (2.2%) |
| 10 to 14 Year Olds | 350 (97.8%) | 8 (2.2%) |
| 15 to 17 Year Olds | 237 (96.3%) | 9 (3.7%) |
| 18 to 19 Year Olds | 66 (72.5%) | 25 (27.5%) |
| 20 to 24 Year Olds | 24 (50.0%) | 24 (50.0%) |
| 25 to 34 Year Olds | 66 (100.0%) | 0 (0.0%) |
| 35 Years and over | 23 (100.0%) | 0 (0.0%) |
| Total | 1,337 (94.2%) | 82 (5.8%) |
Educational Attainment by Field of Study in Idabel
Education (161 | 17.8%), science & technology (155 | 17.1%), business (154 | 17.0%), bio, nature & agricultural (107 | 11.8%), and psychology (96 | 10.6%) are the most common fields of study among 905 individuals in Idabel who have obtained a bachelor's degree or higher.
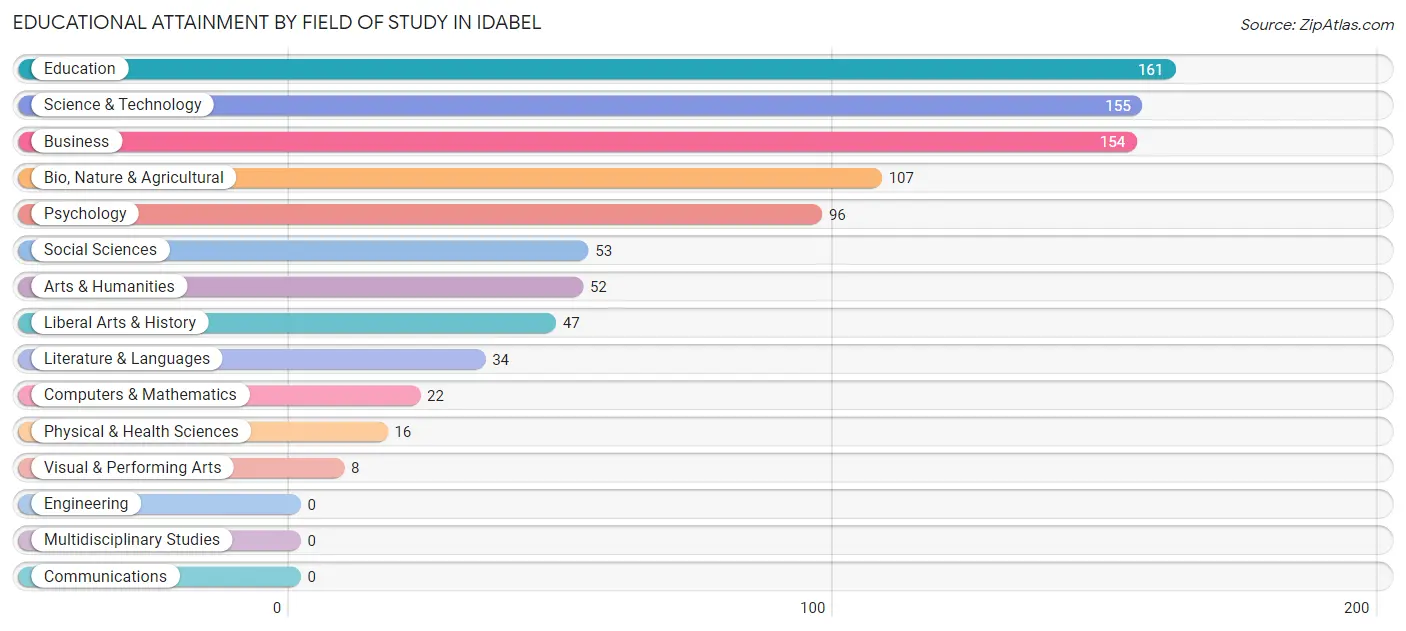
| Field of Study | # Graduates | % Graduates |
| Computers & Mathematics | 22 | 2.4% |
| Bio, Nature & Agricultural | 107 | 11.8% |
| Physical & Health Sciences | 16 | 1.8% |
| Psychology | 96 | 10.6% |
| Social Sciences | 53 | 5.9% |
| Engineering | 0 | 0.0% |
| Multidisciplinary Studies | 0 | 0.0% |
| Science & Technology | 155 | 17.1% |
| Business | 154 | 17.0% |
| Education | 161 | 17.8% |
| Literature & Languages | 34 | 3.8% |
| Liberal Arts & History | 47 | 5.2% |
| Visual & Performing Arts | 8 | 0.9% |
| Communications | 0 | 0.0% |
| Arts & Humanities | 52 | 5.8% |
| Total | 905 | 100.0% |
Transportation & Commute in Idabel
Vehicle Availability by Sex in Idabel
The most prevalent vehicle ownership categories in Idabel are males with 2 vehicles (597, accounting for 43.0%) and females with 2 vehicles (340, making up 46.3%).
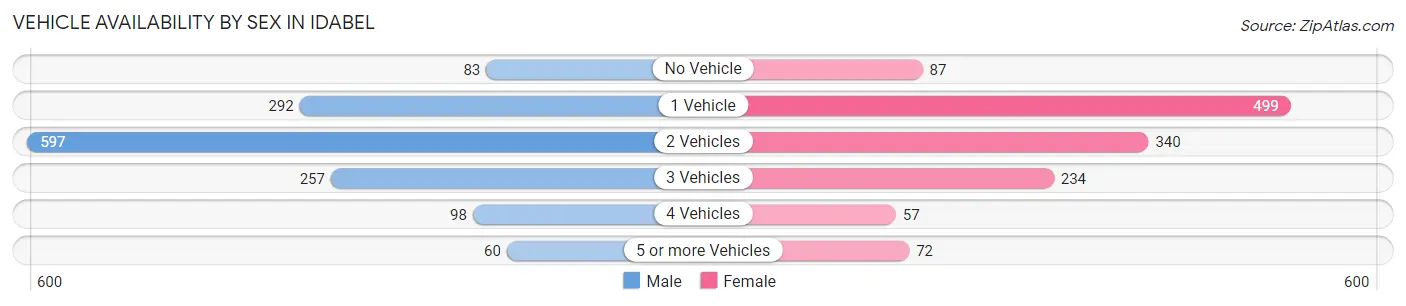
| Vehicles Available | Male | Female |
| No Vehicle | 83 (6.0%) | 87 (6.8%) |
| 1 Vehicle | 292 (21.0%) | 499 (38.7%) |
| 2 Vehicles | 597 (43.0%) | 340 (26.4%) |
| 3 Vehicles | 257 (18.5%) | 234 (18.1%) |
| 4 Vehicles | 98 (7.1%) | 57 (4.4%) |
| 5 or more Vehicles | 60 (4.3%) | 72 (5.6%) |
| Total | 1,387 (100.0%) | 1,289 (100.0%) |
Commute Time in Idabel
The most frequently occuring commute durations in Idabel are 5 to 9 minutes (756 commuters, 29.3%), 10 to 14 minutes (426 commuters, 16.5%), and 15 to 19 minutes (374 commuters, 14.5%).
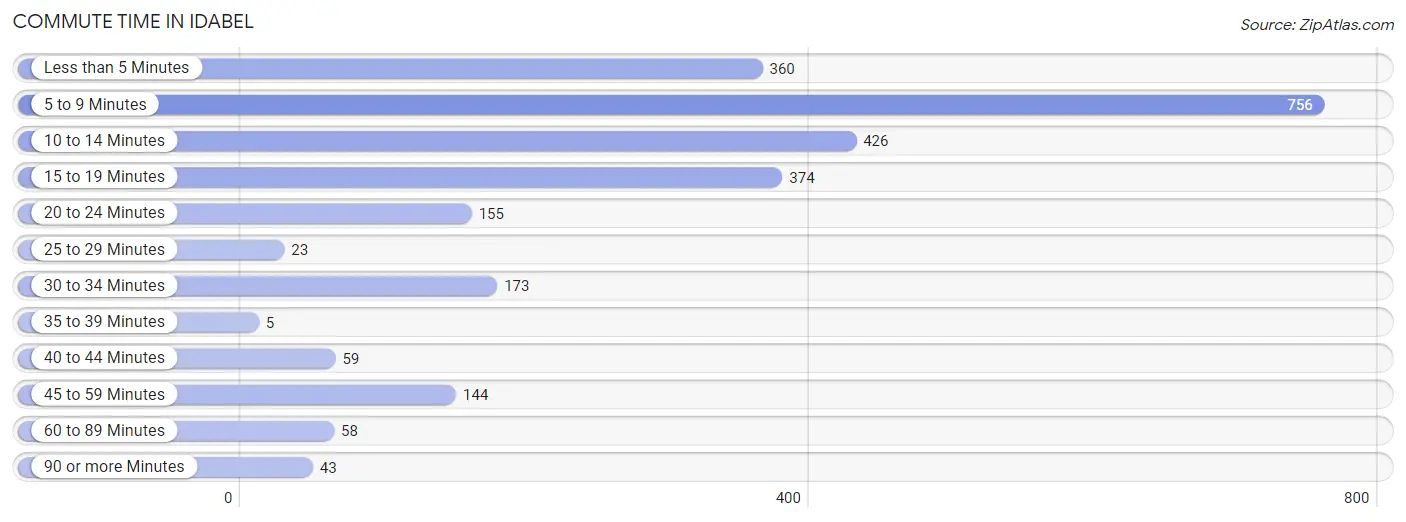
| Commute Time | # Commuters | % Commuters |
| Less than 5 Minutes | 360 | 14.0% |
| 5 to 9 Minutes | 756 | 29.3% |
| 10 to 14 Minutes | 426 | 16.5% |
| 15 to 19 Minutes | 374 | 14.5% |
| 20 to 24 Minutes | 155 | 6.0% |
| 25 to 29 Minutes | 23 | 0.9% |
| 30 to 34 Minutes | 173 | 6.7% |
| 35 to 39 Minutes | 5 | 0.2% |
| 40 to 44 Minutes | 59 | 2.3% |
| 45 to 59 Minutes | 144 | 5.6% |
| 60 to 89 Minutes | 58 | 2.2% |
| 90 or more Minutes | 43 | 1.7% |
Commute Time by Sex in Idabel
The most common commute times in Idabel are 5 to 9 minutes (251 commuters, 18.5%) for males and 5 to 9 minutes (505 commuters, 41.4%) for females.
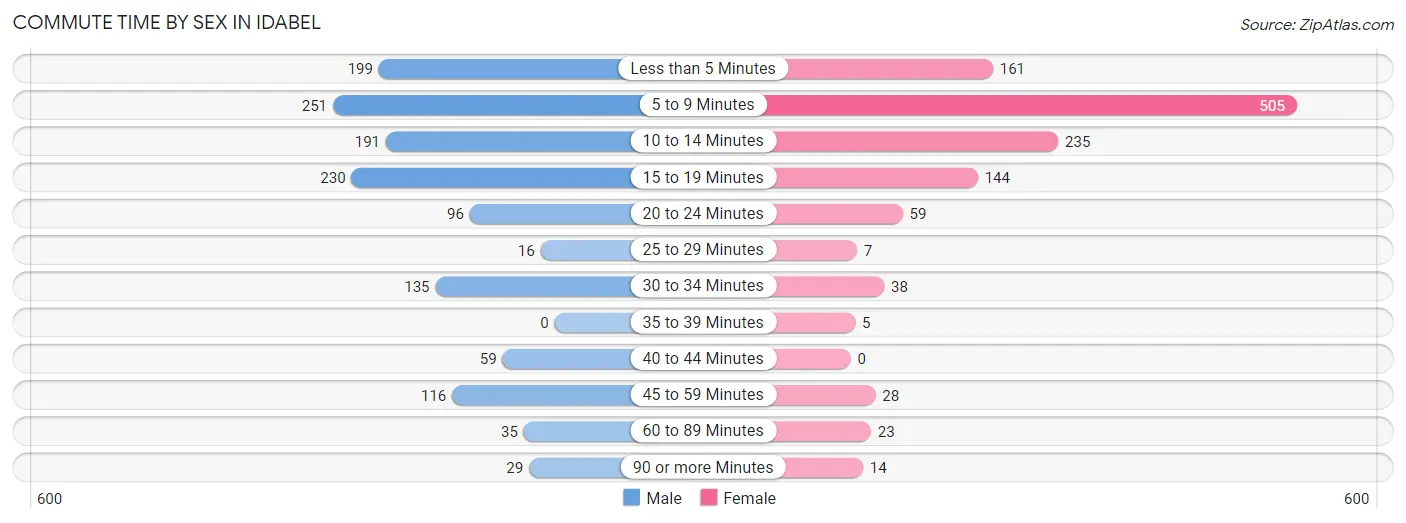
| Commute Time | Male | Female |
| Less than 5 Minutes | 199 (14.7%) | 161 (13.2%) |
| 5 to 9 Minutes | 251 (18.5%) | 505 (41.4%) |
| 10 to 14 Minutes | 191 (14.1%) | 235 (19.3%) |
| 15 to 19 Minutes | 230 (17.0%) | 144 (11.8%) |
| 20 to 24 Minutes | 96 (7.1%) | 59 (4.8%) |
| 25 to 29 Minutes | 16 (1.2%) | 7 (0.6%) |
| 30 to 34 Minutes | 135 (10.0%) | 38 (3.1%) |
| 35 to 39 Minutes | 0 (0.0%) | 5 (0.4%) |
| 40 to 44 Minutes | 59 (4.3%) | 0 (0.0%) |
| 45 to 59 Minutes | 116 (8.6%) | 28 (2.3%) |
| 60 to 89 Minutes | 35 (2.6%) | 23 (1.9%) |
| 90 or more Minutes | 29 (2.1%) | 14 (1.1%) |
Time of Departure to Work by Sex in Idabel
The most frequent times of departure to work in Idabel are 4:00 PM to 11:59 PM (208, 15.3%) for males and 7:00 AM to 7:29 AM (274, 22.5%) for females.
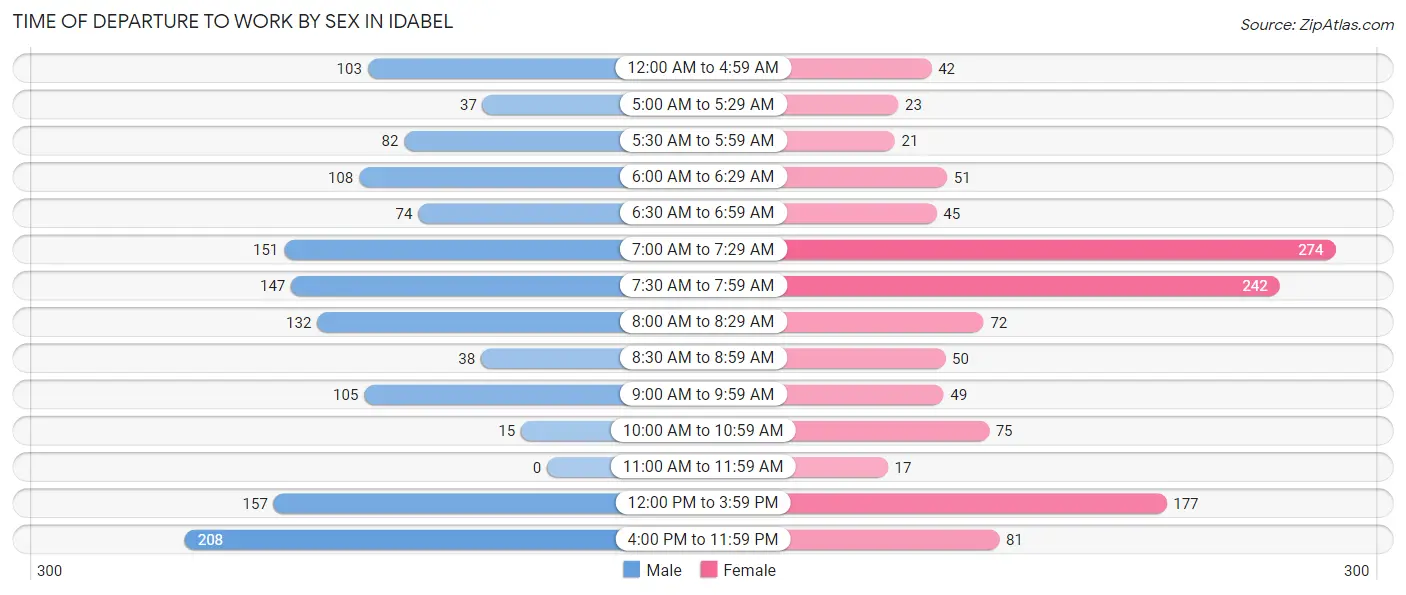
| Time of Departure | Male | Female |
| 12:00 AM to 4:59 AM | 103 (7.6%) | 42 (3.5%) |
| 5:00 AM to 5:29 AM | 37 (2.7%) | 23 (1.9%) |
| 5:30 AM to 5:59 AM | 82 (6.0%) | 21 (1.7%) |
| 6:00 AM to 6:29 AM | 108 (8.0%) | 51 (4.2%) |
| 6:30 AM to 6:59 AM | 74 (5.4%) | 45 (3.7%) |
| 7:00 AM to 7:29 AM | 151 (11.1%) | 274 (22.5%) |
| 7:30 AM to 7:59 AM | 147 (10.8%) | 242 (19.9%) |
| 8:00 AM to 8:29 AM | 132 (9.7%) | 72 (5.9%) |
| 8:30 AM to 8:59 AM | 38 (2.8%) | 50 (4.1%) |
| 9:00 AM to 9:59 AM | 105 (7.7%) | 49 (4.0%) |
| 10:00 AM to 10:59 AM | 15 (1.1%) | 75 (6.1%) |
| 11:00 AM to 11:59 AM | 0 (0.0%) | 17 (1.4%) |
| 12:00 PM to 3:59 PM | 157 (11.6%) | 177 (14.5%) |
| 4:00 PM to 11:59 PM | 208 (15.3%) | 81 (6.6%) |
| Total | 1,357 (100.0%) | 1,219 (100.0%) |
Housing Occupancy in Idabel
Occupancy by Ownership in Idabel
Of the total 2,566 dwellings in Idabel, owner-occupied units account for 1,340 (52.2%), while renter-occupied units make up 1,226 (47.8%).
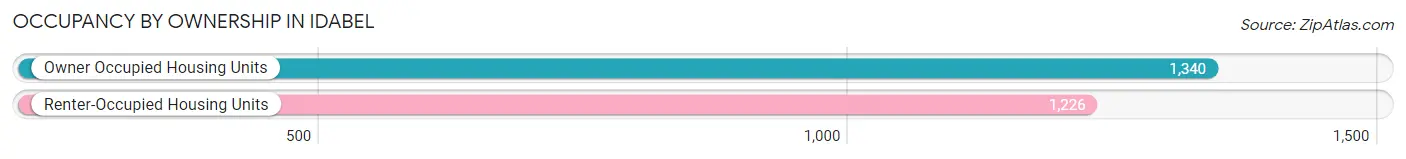
| Occupancy | # Housing Units | % Housing Units |
| Owner Occupied Housing Units | 1,340 | 52.2% |
| Renter-Occupied Housing Units | 1,226 | 47.8% |
| Total Occupied Housing Units | 2,566 | 100.0% |
Occupancy by Household Size in Idabel
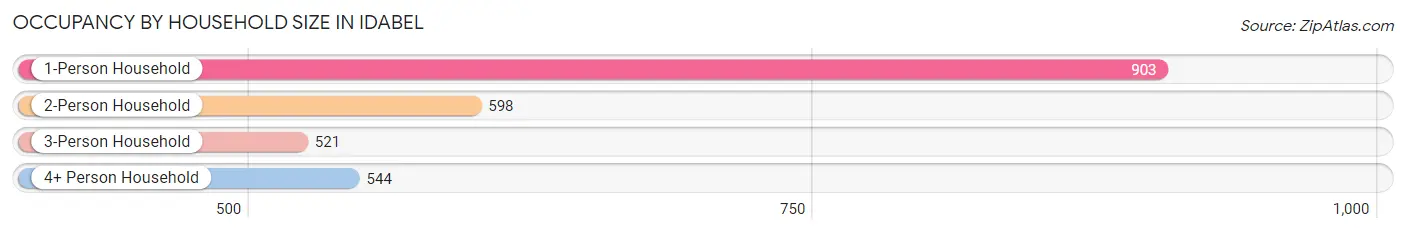
| Household Size | # Housing Units | % Housing Units |
| 1-Person Household | 903 | 35.2% |
| 2-Person Household | 598 | 23.3% |
| 3-Person Household | 521 | 20.3% |
| 4+ Person Household | 544 | 21.2% |
| Total Housing Units | 2,566 | 100.0% |
Occupancy by Ownership by Household Size in Idabel
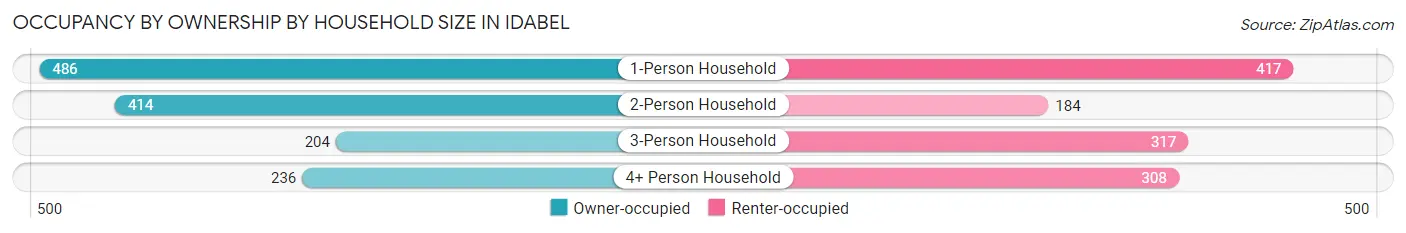
| Household Size | Owner-occupied | Renter-occupied |
| 1-Person Household | 486 (53.8%) | 417 (46.2%) |
| 2-Person Household | 414 (69.2%) | 184 (30.8%) |
| 3-Person Household | 204 (39.2%) | 317 (60.8%) |
| 4+ Person Household | 236 (43.4%) | 308 (56.6%) |
| Total Housing Units | 1,340 (52.2%) | 1,226 (47.8%) |
Occupancy by Educational Attainment in Idabel
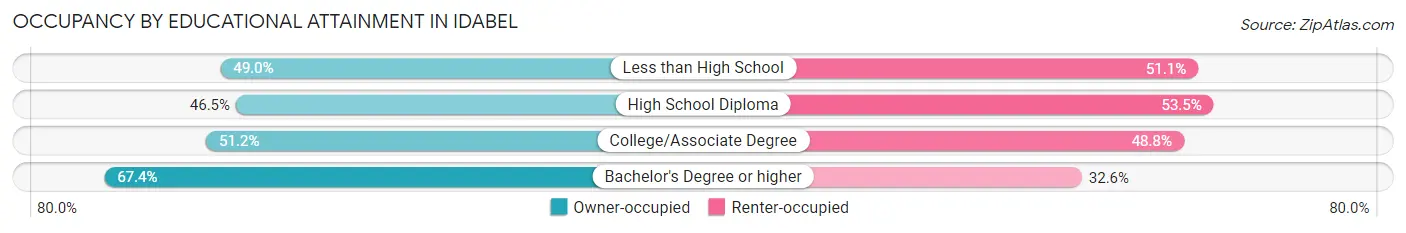
| Household Size | Owner-occupied | Renter-occupied |
| Less than High School | 234 (48.9%) | 244 (51.0%) |
| High School Diploma | 464 (46.5%) | 534 (53.5%) |
| College/Associate Degree | 293 (51.2%) | 279 (48.8%) |
| Bachelor's Degree or higher | 349 (67.4%) | 169 (32.6%) |
Occupancy by Age of Householder in Idabel
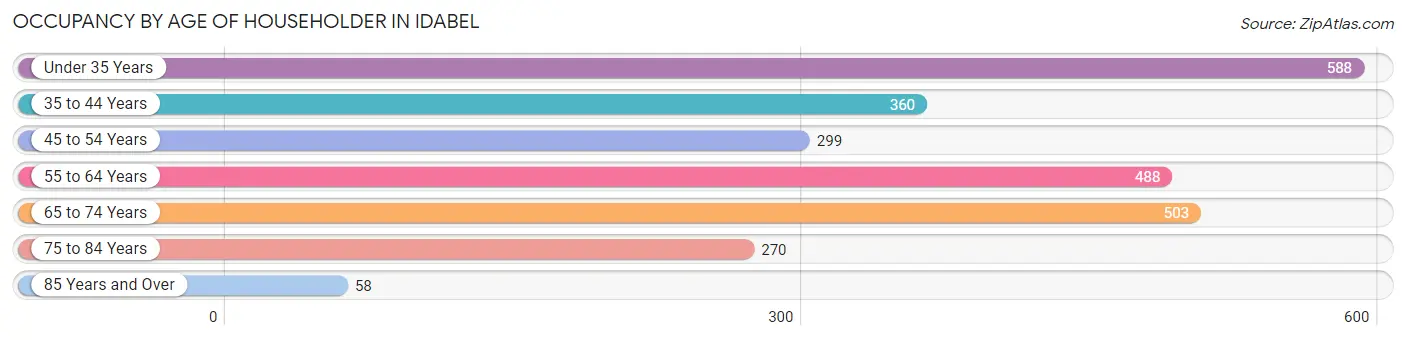
| Age Bracket | # Households | % Households |
| Under 35 Years | 588 | 22.9% |
| 35 to 44 Years | 360 | 14.0% |
| 45 to 54 Years | 299 | 11.7% |
| 55 to 64 Years | 488 | 19.0% |
| 65 to 74 Years | 503 | 19.6% |
| 75 to 84 Years | 270 | 10.5% |
| 85 Years and Over | 58 | 2.3% |
| Total | 2,566 | 100.0% |
Housing Finances in Idabel
Median Income by Occupancy in Idabel
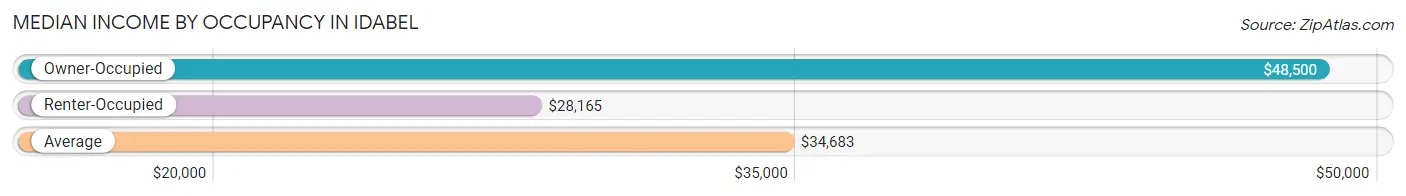
| Occupancy Type | # Households | Median Income |
| Owner-Occupied | 1,340 (52.2%) | $48,500 |
| Renter-Occupied | 1,226 (47.8%) | $28,165 |
| Average | 2,566 (100.0%) | $34,683 |
Occupancy by Householder Income Bracket in Idabel
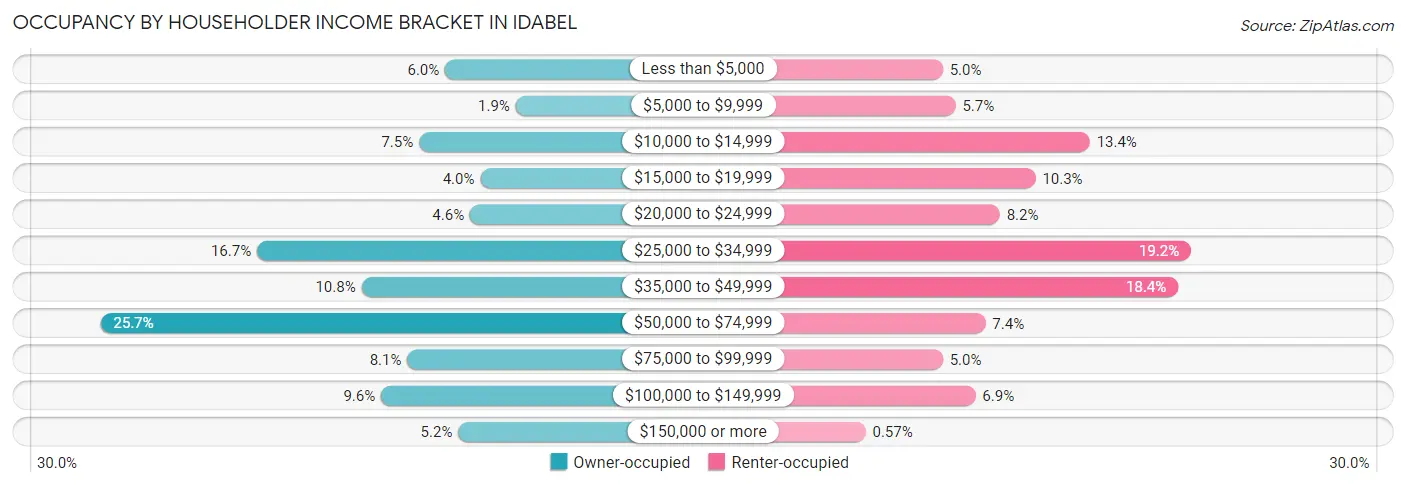
| Income Bracket | Owner-occupied | Renter-occupied |
| Less than $5,000 | 80 (6.0%) | 61 (5.0%) |
| $5,000 to $9,999 | 26 (1.9%) | 70 (5.7%) |
| $10,000 to $14,999 | 100 (7.5%) | 164 (13.4%) |
| $15,000 to $19,999 | 53 (4.0%) | 126 (10.3%) |
| $20,000 to $24,999 | 61 (4.5%) | 101 (8.2%) |
| $25,000 to $34,999 | 224 (16.7%) | 235 (19.2%) |
| $35,000 to $49,999 | 144 (10.7%) | 226 (18.4%) |
| $50,000 to $74,999 | 344 (25.7%) | 91 (7.4%) |
| $75,000 to $99,999 | 109 (8.1%) | 61 (5.0%) |
| $100,000 to $149,999 | 129 (9.6%) | 84 (6.9%) |
| $150,000 or more | 70 (5.2%) | 7 (0.6%) |
| Total | 1,340 (100.0%) | 1,226 (100.0%) |
Monthly Housing Cost Tiers in Idabel
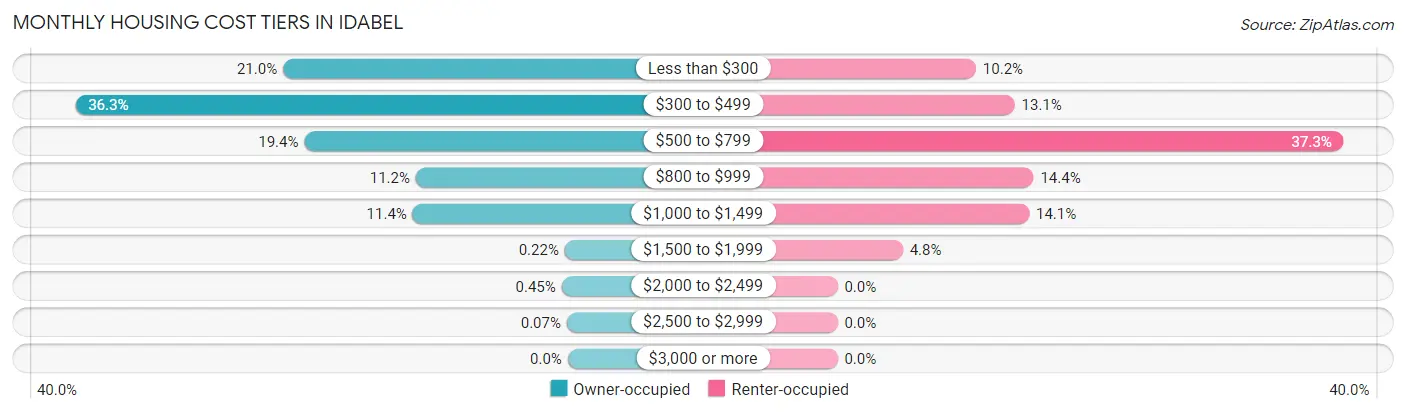
| Monthly Cost | Owner-occupied | Renter-occupied |
| Less than $300 | 281 (21.0%) | 125 (10.2%) |
| $300 to $499 | 486 (36.3%) | 160 (13.1%) |
| $500 to $799 | 260 (19.4%) | 457 (37.3%) |
| $800 to $999 | 150 (11.2%) | 177 (14.4%) |
| $1,000 to $1,499 | 153 (11.4%) | 173 (14.1%) |
| $1,500 to $1,999 | 3 (0.2%) | 59 (4.8%) |
| $2,000 to $2,499 | 6 (0.4%) | 0 (0.0%) |
| $2,500 to $2,999 | 1 (0.1%) | 0 (0.0%) |
| $3,000 or more | 0 (0.0%) | 0 (0.0%) |
| Total | 1,340 (100.0%) | 1,226 (100.0%) |
Physical Housing Characteristics in Idabel
Housing Structures in Idabel
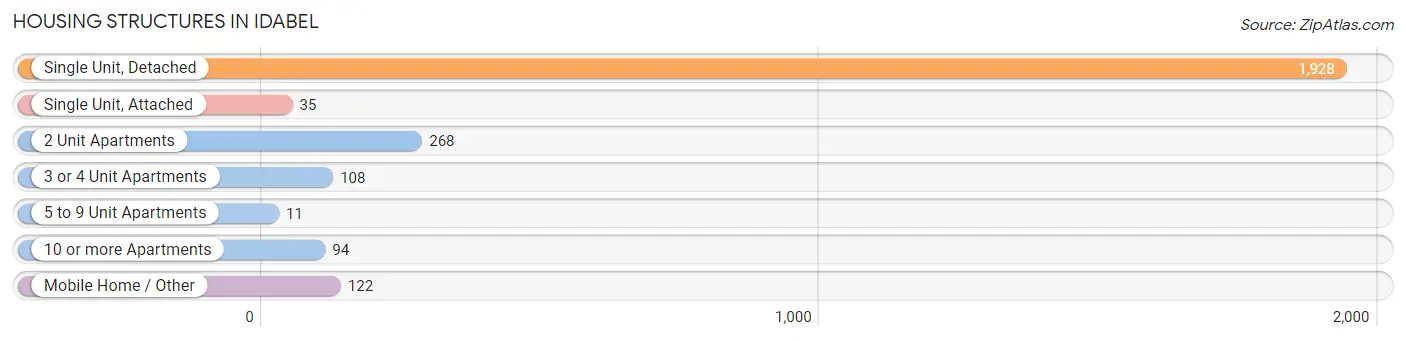
| Structure Type | # Housing Units | % Housing Units |
| Single Unit, Detached | 1,928 | 75.1% |
| Single Unit, Attached | 35 | 1.4% |
| 2 Unit Apartments | 268 | 10.4% |
| 3 or 4 Unit Apartments | 108 | 4.2% |
| 5 to 9 Unit Apartments | 11 | 0.4% |
| 10 or more Apartments | 94 | 3.7% |
| Mobile Home / Other | 122 | 4.8% |
| Total | 2,566 | 100.0% |
Housing Structures by Occupancy in Idabel
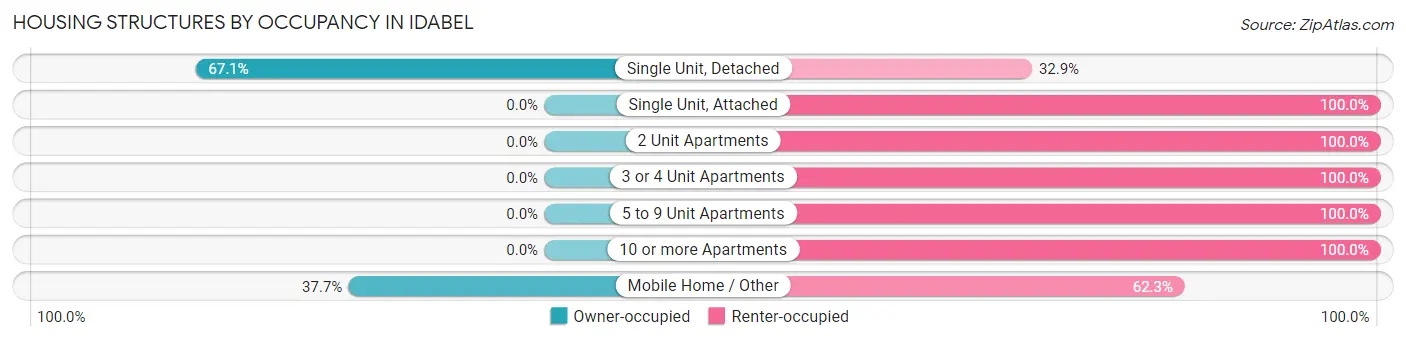
| Structure Type | Owner-occupied | Renter-occupied |
| Single Unit, Detached | 1,294 (67.1%) | 634 (32.9%) |
| Single Unit, Attached | 0 (0.0%) | 35 (100.0%) |
| 2 Unit Apartments | 0 (0.0%) | 268 (100.0%) |
| 3 or 4 Unit Apartments | 0 (0.0%) | 108 (100.0%) |
| 5 to 9 Unit Apartments | 0 (0.0%) | 11 (100.0%) |
| 10 or more Apartments | 0 (0.0%) | 94 (100.0%) |
| Mobile Home / Other | 46 (37.7%) | 76 (62.3%) |
| Total | 1,340 (52.2%) | 1,226 (47.8%) |
Housing Structures by Number of Rooms in Idabel
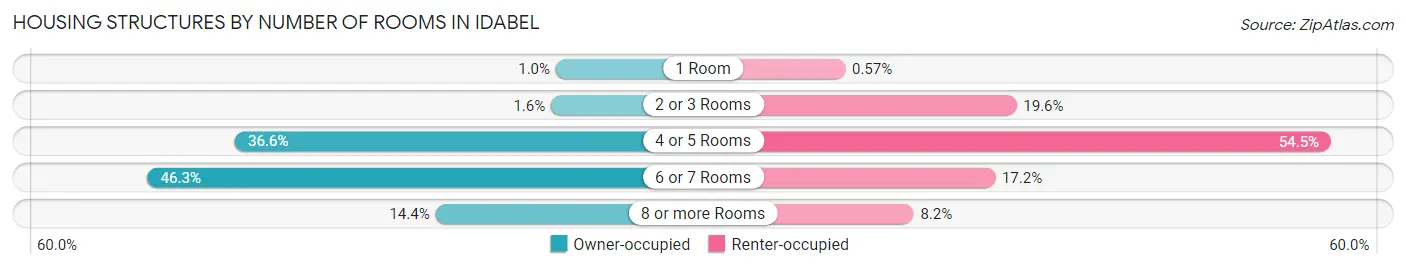
| Number of Rooms | Owner-occupied | Renter-occupied |
| 1 Room | 14 (1.0%) | 7 (0.6%) |
| 2 or 3 Rooms | 21 (1.6%) | 240 (19.6%) |
| 4 or 5 Rooms | 491 (36.6%) | 668 (54.5%) |
| 6 or 7 Rooms | 621 (46.3%) | 211 (17.2%) |
| 8 or more Rooms | 193 (14.4%) | 100 (8.2%) |
| Total | 1,340 (100.0%) | 1,226 (100.0%) |
Housing Structure by Heating Type in Idabel
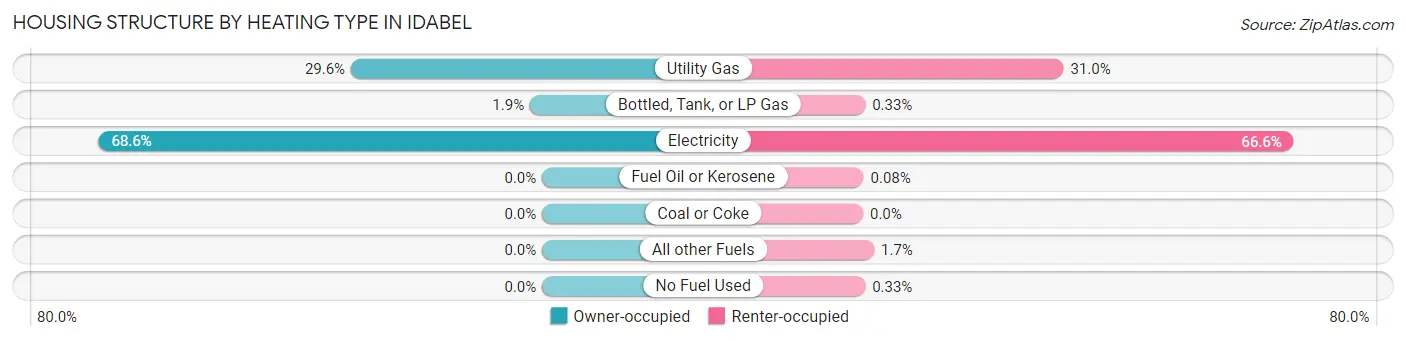
| Heating Type | Owner-occupied | Renter-occupied |
| Utility Gas | 396 (29.5%) | 380 (31.0%) |
| Bottled, Tank, or LP Gas | 25 (1.9%) | 4 (0.3%) |
| Electricity | 919 (68.6%) | 816 (66.6%) |
| Fuel Oil or Kerosene | 0 (0.0%) | 1 (0.1%) |
| Coal or Coke | 0 (0.0%) | 0 (0.0%) |
| All other Fuels | 0 (0.0%) | 21 (1.7%) |
| No Fuel Used | 0 (0.0%) | 4 (0.3%) |
| Total | 1,340 (100.0%) | 1,226 (100.0%) |
Household Vehicle Usage in Idabel
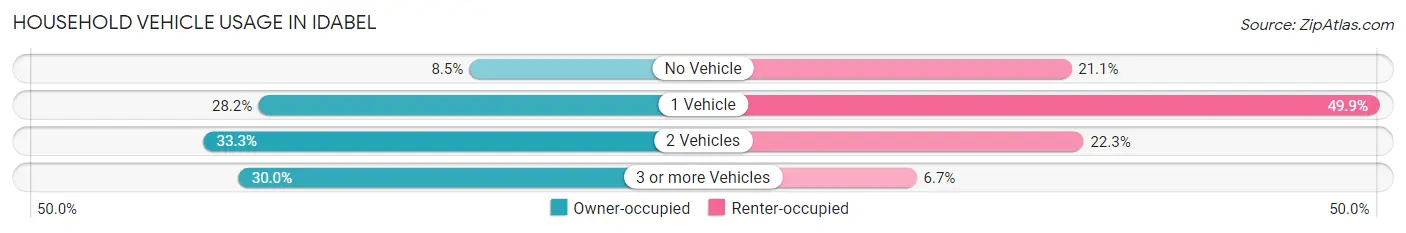
| Vehicles per Household | Owner-occupied | Renter-occupied |
| No Vehicle | 114 (8.5%) | 259 (21.1%) |
| 1 Vehicle | 378 (28.2%) | 612 (49.9%) |
| 2 Vehicles | 446 (33.3%) | 273 (22.3%) |
| 3 or more Vehicles | 402 (30.0%) | 82 (6.7%) |
| Total | 1,340 (100.0%) | 1,226 (100.0%) |
Real Estate & Mortgages in Idabel
Real Estate and Mortgage Overview in Idabel
| Characteristic | Without Mortgage | With Mortgage |
| Housing Units | 937 | 403 |
| Median Property Value | $87,400 | $87,500 |
| Median Household Income | $46,546 | $32 |
| Monthly Housing Costs | $347 | $0 |
| Real Estate Taxes | $388 | $30 |
Property Value by Mortgage Status in Idabel
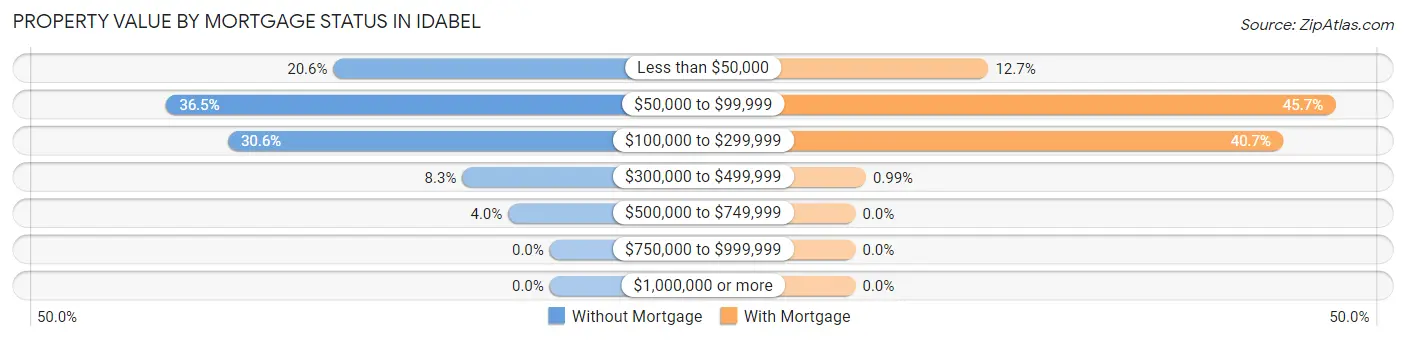
| Property Value | Without Mortgage | With Mortgage |
| Less than $50,000 | 193 (20.6%) | 51 (12.7%) |
| $50,000 to $99,999 | 342 (36.5%) | 184 (45.7%) |
| $100,000 to $299,999 | 287 (30.6%) | 164 (40.7%) |
| $300,000 to $499,999 | 78 (8.3%) | 4 (1.0%) |
| $500,000 to $749,999 | 37 (4.0%) | 0 (0.0%) |
| $750,000 to $999,999 | 0 (0.0%) | 0 (0.0%) |
| $1,000,000 or more | 0 (0.0%) | 0 (0.0%) |
| Total | 937 (100.0%) | 403 (100.0%) |
Household Income by Mortgage Status in Idabel
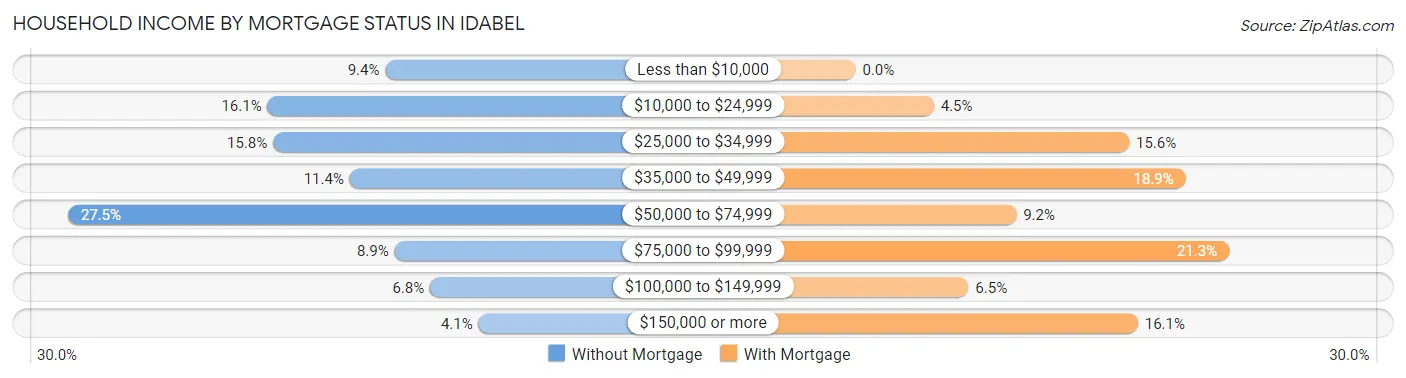
| Household Income | Without Mortgage | With Mortgage |
| Less than $10,000 | 88 (9.4%) | 0 (0.0%) |
| $10,000 to $24,999 | 151 (16.1%) | 18 (4.5%) |
| $25,000 to $34,999 | 148 (15.8%) | 63 (15.6%) |
| $35,000 to $49,999 | 107 (11.4%) | 76 (18.9%) |
| $50,000 to $74,999 | 258 (27.5%) | 37 (9.2%) |
| $75,000 to $99,999 | 83 (8.9%) | 86 (21.3%) |
| $100,000 to $149,999 | 64 (6.8%) | 26 (6.5%) |
| $150,000 or more | 38 (4.1%) | 65 (16.1%) |
| Total | 937 (100.0%) | 403 (100.0%) |
Property Value to Household Income Ratio in Idabel
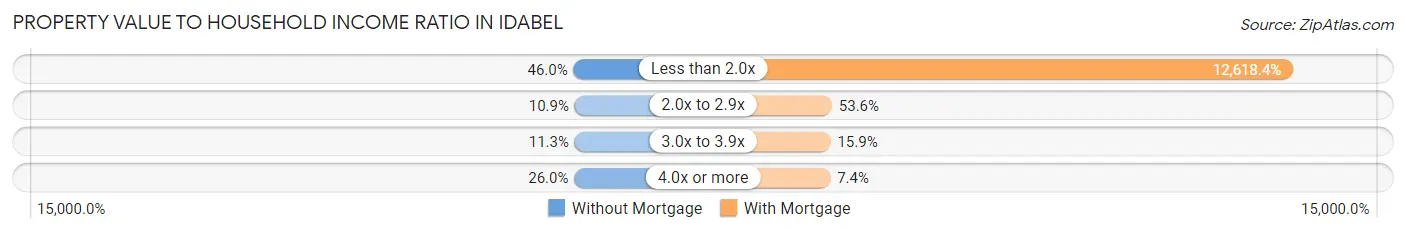
| Value-to-Income Ratio | Without Mortgage | With Mortgage |
| Less than 2.0x | 431 (46.0%) | 50,852 (12,618.4%) |
| 2.0x to 2.9x | 102 (10.9%) | 216 (53.6%) |
| 3.0x to 3.9x | 106 (11.3%) | 64 (15.9%) |
| 4.0x or more | 244 (26.0%) | 30 (7.4%) |
| Total | 937 (100.0%) | 403 (100.0%) |
Real Estate Taxes by Mortgage Status in Idabel
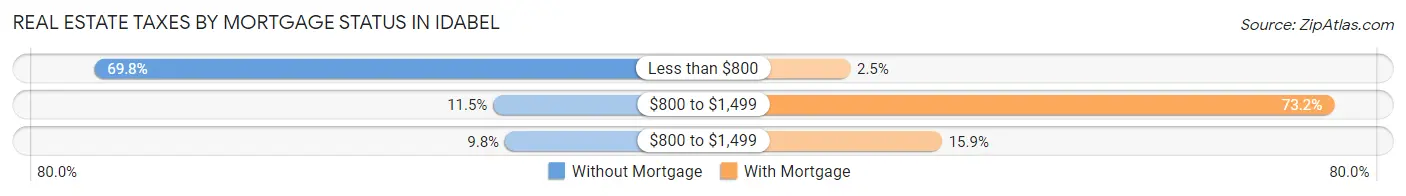
| Property Taxes | Without Mortgage | With Mortgage |
| Less than $800 | 654 (69.8%) | 10 (2.5%) |
| $800 to $1,499 | 108 (11.5%) | 295 (73.2%) |
| $800 to $1,499 | 92 (9.8%) | 64 (15.9%) |
| Total | 937 (100.0%) | 403 (100.0%) |
Health & Disability in Idabel
Health Insurance Coverage by Age in Idabel
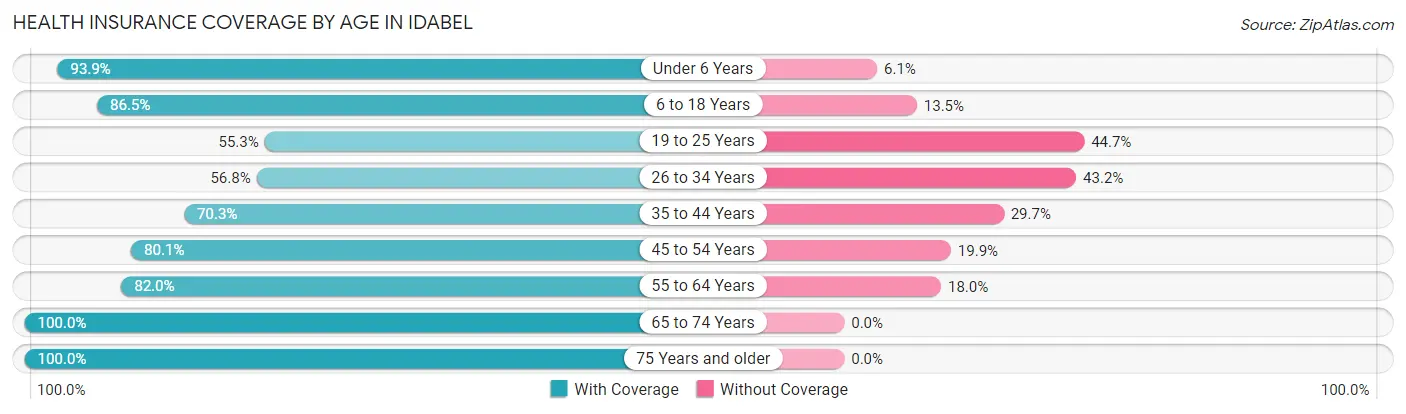
| Age Bracket | With Coverage | Without Coverage |
| Under 6 Years | 829 (93.9%) | 54 (6.1%) |
| 6 to 18 Years | 914 (86.5%) | 143 (13.5%) |
| 19 to 25 Years | 441 (55.3%) | 357 (44.7%) |
| 26 to 34 Years | 529 (56.8%) | 403 (43.2%) |
| 35 to 44 Years | 520 (70.3%) | 220 (29.7%) |
| 45 to 54 Years | 536 (80.1%) | 133 (19.9%) |
| 55 to 64 Years | 568 (82.0%) | 125 (18.0%) |
| 65 to 74 Years | 600 (100.0%) | 0 (0.0%) |
| 75 Years and older | 404 (100.0%) | 0 (0.0%) |
| Total | 5,341 (78.8%) | 1,435 (21.2%) |
Health Insurance Coverage by Citizenship Status in Idabel
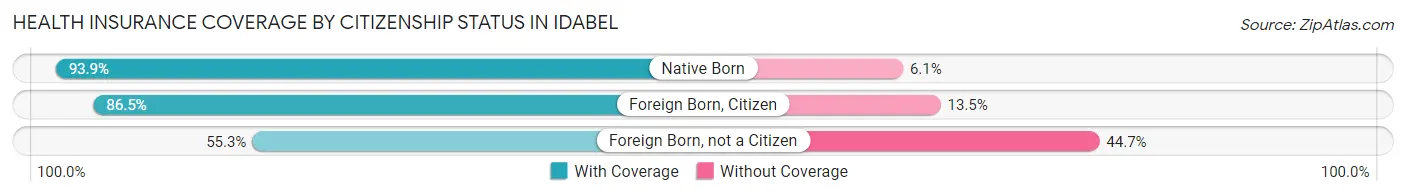
| Citizenship Status | With Coverage | Without Coverage |
| Native Born | 829 (93.9%) | 54 (6.1%) |
| Foreign Born, Citizen | 914 (86.5%) | 143 (13.5%) |
| Foreign Born, not a Citizen | 441 (55.3%) | 357 (44.7%) |
Health Insurance Coverage by Household Income in Idabel
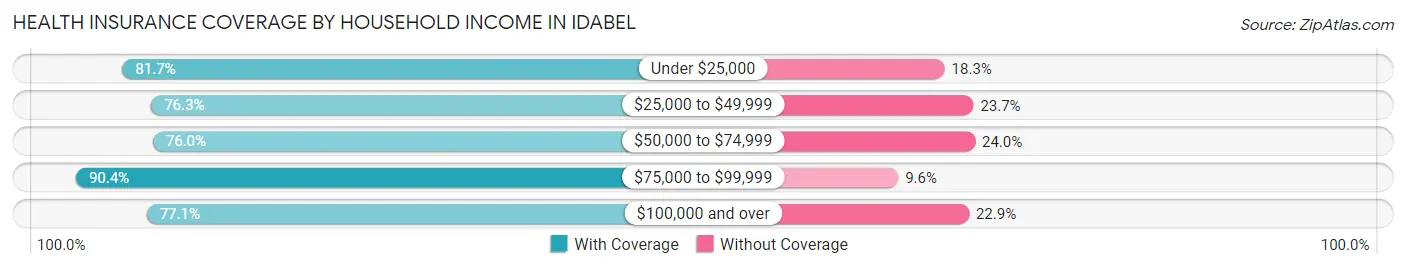
| Household Income | With Coverage | Without Coverage |
| Under $25,000 | 1,341 (81.7%) | 301 (18.3%) |
| $25,000 to $49,999 | 1,713 (76.3%) | 533 (23.7%) |
| $50,000 to $74,999 | 1,050 (76.0%) | 332 (24.0%) |
| $75,000 to $99,999 | 516 (90.4%) | 55 (9.6%) |
| $100,000 and over | 721 (77.1%) | 214 (22.9%) |
Public vs Private Health Insurance Coverage by Age in Idabel
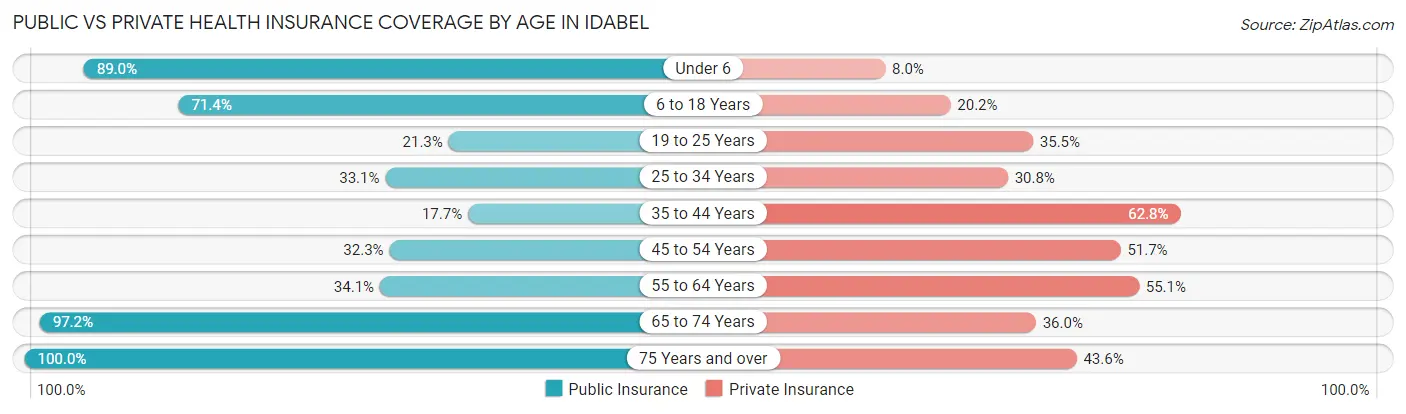
| Age Bracket | Public Insurance | Private Insurance |
| Under 6 | 786 (89.0%) | 71 (8.0%) |
| 6 to 18 Years | 755 (71.4%) | 213 (20.2%) |
| 19 to 25 Years | 170 (21.3%) | 283 (35.5%) |
| 25 to 34 Years | 308 (33.1%) | 287 (30.8%) |
| 35 to 44 Years | 131 (17.7%) | 465 (62.8%) |
| 45 to 54 Years | 216 (32.3%) | 346 (51.7%) |
| 55 to 64 Years | 236 (34.1%) | 382 (55.1%) |
| 65 to 74 Years | 583 (97.2%) | 216 (36.0%) |
| 75 Years and over | 404 (100.0%) | 176 (43.6%) |
| Total | 3,589 (53.0%) | 2,439 (36.0%) |
Disability Status by Sex by Age in Idabel
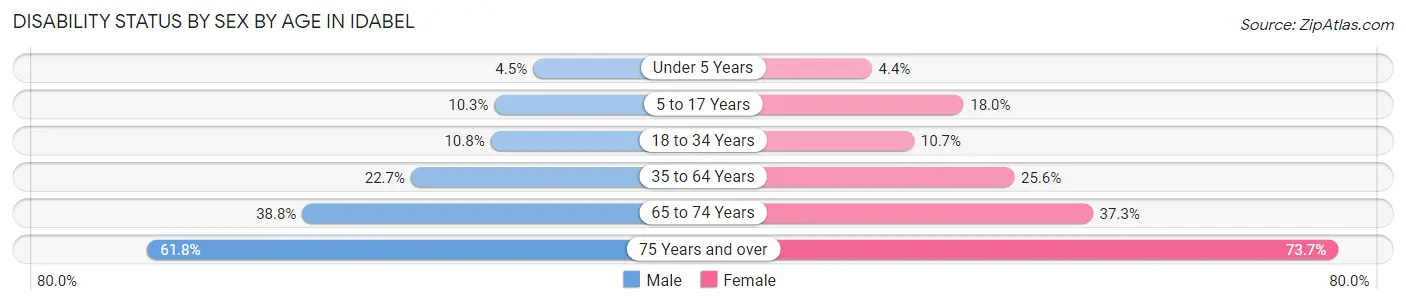
| Age Bracket | Male | Female |
| Under 5 Years | 20 (4.5%) | 14 (4.4%) |
| 5 to 17 Years | 61 (10.2%) | 94 (18.0%) |
| 18 to 34 Years | 95 (10.8%) | 98 (10.7%) |
| 35 to 64 Years | 214 (22.7%) | 296 (25.6%) |
| 65 to 74 Years | 114 (38.8%) | 114 (37.2%) |
| 75 Years and over | 97 (61.8%) | 182 (73.7%) |
Disability Class by Sex by Age in Idabel
Disability Class: Hearing Difficulty
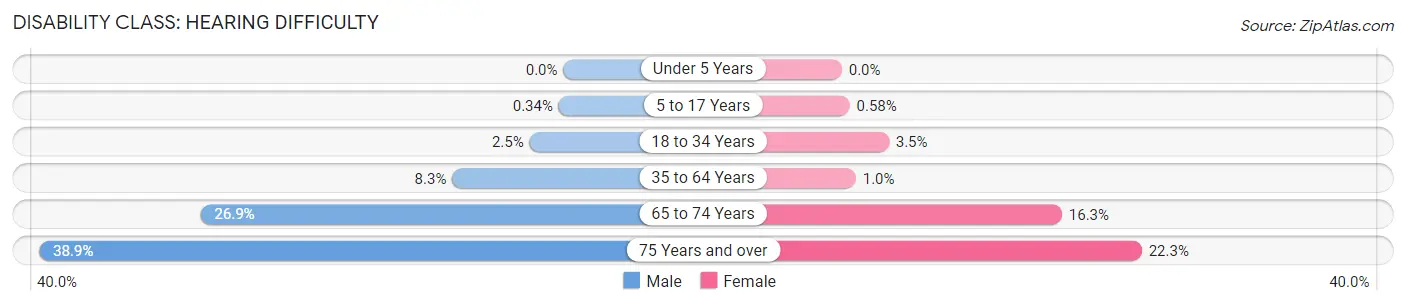
| Age Bracket | Male | Female |
| Under 5 Years | 0 (0.0%) | 0 (0.0%) |
| 5 to 17 Years | 2 (0.3%) | 3 (0.6%) |
| 18 to 34 Years | 22 (2.5%) | 32 (3.5%) |
| 35 to 64 Years | 78 (8.3%) | 12 (1.0%) |
| 65 to 74 Years | 79 (26.9%) | 50 (16.3%) |
| 75 Years and over | 61 (38.9%) | 55 (22.3%) |
Disability Class: Vision Difficulty
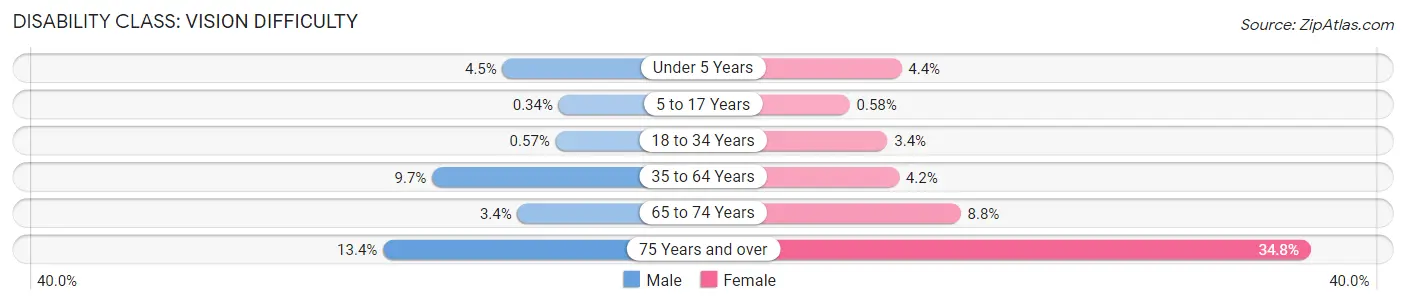
| Age Bracket | Male | Female |
| Under 5 Years | 20 (4.5%) | 14 (4.4%) |
| 5 to 17 Years | 2 (0.3%) | 3 (0.6%) |
| 18 to 34 Years | 5 (0.6%) | 31 (3.4%) |
| 35 to 64 Years | 92 (9.7%) | 49 (4.2%) |
| 65 to 74 Years | 10 (3.4%) | 27 (8.8%) |
| 75 Years and over | 21 (13.4%) | 86 (34.8%) |
Disability Class: Cognitive Difficulty
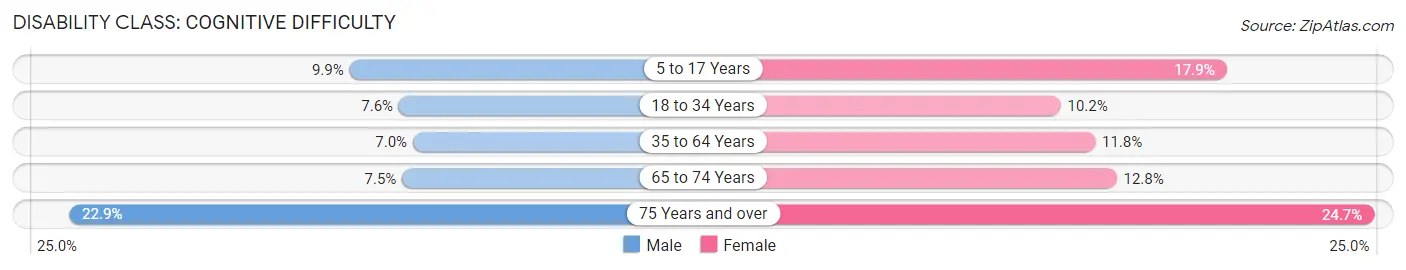
| Age Bracket | Male | Female |
| 5 to 17 Years | 59 (9.9%) | 93 (17.8%) |
| 18 to 34 Years | 67 (7.6%) | 93 (10.2%) |
| 35 to 64 Years | 66 (7.0%) | 136 (11.7%) |
| 65 to 74 Years | 22 (7.5%) | 39 (12.8%) |
| 75 Years and over | 36 (22.9%) | 61 (24.7%) |
Disability Class: Ambulatory Difficulty
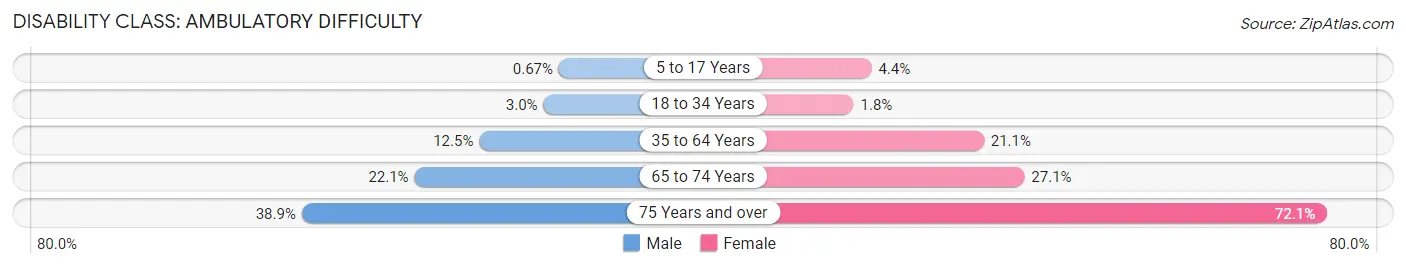
| Age Bracket | Male | Female |
| 5 to 17 Years | 4 (0.7%) | 23 (4.4%) |
| 18 to 34 Years | 26 (3.0%) | 16 (1.8%) |
| 35 to 64 Years | 118 (12.5%) | 244 (21.1%) |
| 65 to 74 Years | 65 (22.1%) | 83 (27.1%) |
| 75 Years and over | 61 (38.9%) | 178 (72.1%) |
Disability Class: Self-Care Difficulty
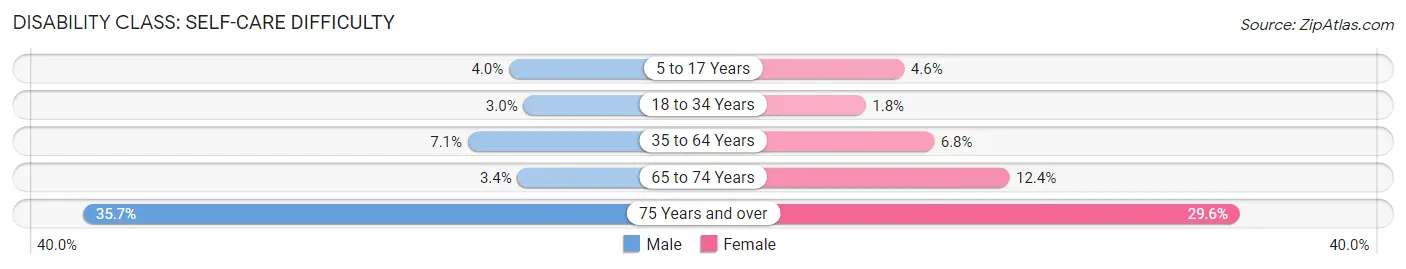
| Age Bracket | Male | Female |
| 5 to 17 Years | 24 (4.0%) | 24 (4.6%) |
| 18 to 34 Years | 26 (3.0%) | 16 (1.8%) |
| 35 to 64 Years | 67 (7.1%) | 79 (6.8%) |
| 65 to 74 Years | 10 (3.4%) | 38 (12.4%) |
| 75 Years and over | 56 (35.7%) | 73 (29.5%) |
Technology Access in Idabel
Computing Device Access in Idabel
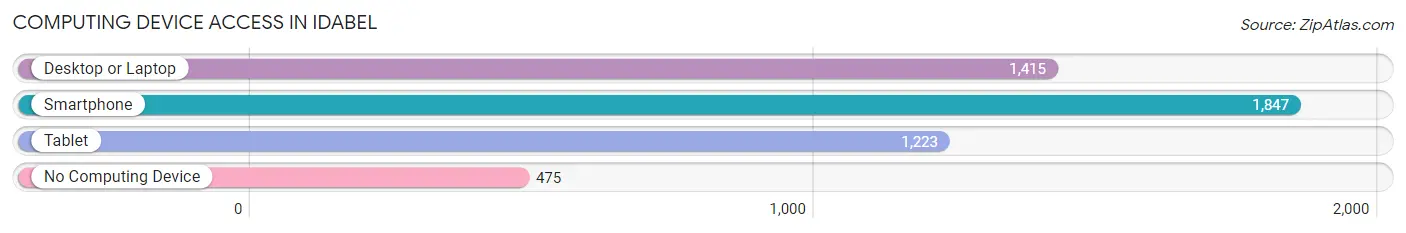
| Device Type | # Households | % Households |
| Desktop or Laptop | 1,415 | 55.1% |
| Smartphone | 1,847 | 72.0% |
| Tablet | 1,223 | 47.7% |
| No Computing Device | 475 | 18.5% |
| Total | 2,566 | 100.0% |
Internet Access in Idabel
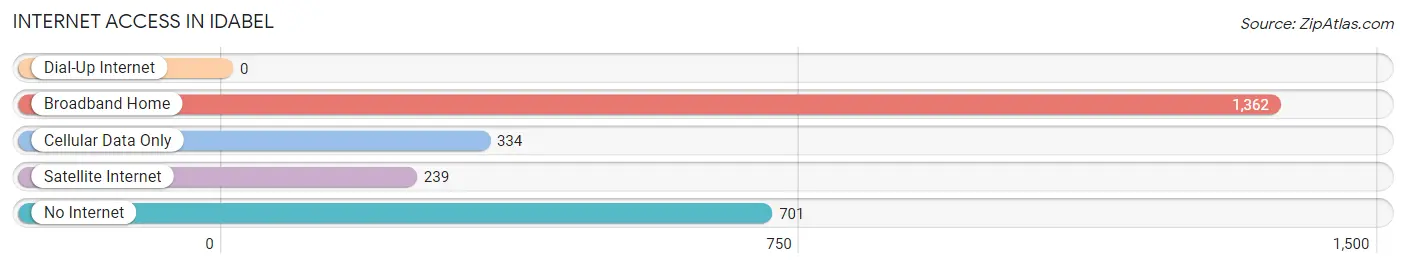
| Internet Type | # Households | % Households |
| Dial-Up Internet | 0 | 0.0% |
| Broadband Home | 1,362 | 53.1% |
| Cellular Data Only | 334 | 13.0% |
| Satellite Internet | 239 | 9.3% |
| No Internet | 701 | 27.3% |
| Total | 2,566 | 100.0% |
Idabel Summary
Idabel, Oklahoma is a small city located in McCurtain County in the southeastern corner of the state. It is situated on the banks of the Red River, near the Texas border. The city was founded in 1902 and has a population of approximately 7,000 people.
Idabel is located in the Ouachita Mountains, which are part of the larger Ozark Plateau. The area is known for its rolling hills, dense forests, and abundant wildlife. The city is home to the Idabel National Wildlife Refuge, which is a popular destination for birdwatchers and nature lovers.
The economy of Idabel is largely based on agriculture and timber. The city is home to several large timber companies, including Weyerhaeuser and International Paper. The timber industry provides jobs for many of the city’s residents. In addition, the city is home to several small businesses, including restaurants, retail stores, and service providers.
Idabel is served by the Idabel Public School District, which includes two elementary schools, a middle school, and a high school. The city is also home to a branch of the McCurtain County Library System.
The demographics of Idabel are diverse. The city is home to a large Native American population, as well as a significant Hispanic population. The median household income in Idabel is $30,000, and the median home value is $90,000.
Idabel is a small city with a rich history and a diverse population. It is home to a thriving timber industry, as well as a variety of small businesses. The city is served by a strong public school system and is home to a branch of the McCurtain County Library System. Idabel is a great place to live, work, and raise a family.
Common Questions
What is Per Capita Income in Idabel?
Per Capita income in Idabel is $19,358.
What is the Median Family Income in Idabel?
Median Family Income in Idabel is $45,385.
What is the Median Household income in Idabel?
Median Household Income in Idabel is $34,683.
What is Income or Wage Gap in Idabel?
Income or Wage Gap in Idabel is 25.3%.
Women in Idabel earn 74.7 cents for every dollar earned by a man.
What is Inequality or Gini Index in Idabel?
Inequality or Gini Index in Idabel is 0.45.
What is the Total Population of Idabel?
Total Population of Idabel is 6,994.
What is the Total Male Population of Idabel?
Total Male Population of Idabel is 3,475.
What is the Total Female Population of Idabel?
Total Female Population of Idabel is 3,519.
What is the Ratio of Males per 100 Females in Idabel?
There are 98.75 Males per 100 Females in Idabel.
What is the Ratio of Females per 100 Males in Idabel?
There are 101.27 Females per 100 Males in Idabel.
What is the Median Population Age in Idabel?
Median Population Age in Idabel is 32.1 Years.
What is the Average Family Size in Idabel
Average Family Size in Idabel is 3.3 People.
What is the Average Household Size in Idabel
Average Household Size in Idabel is 2.6 People.
How Large is the Labor Force in Idabel?
There are 2,933 People in the Labor Forcein in Idabel.
What is the Percentage of People in the Labor Force in Idabel?
55.4% of People are in the Labor Force in Idabel.
What is the Unemployment Rate in Idabel?
Unemployment Rate in Idabel is 8.3%.