Ramona, OK Map & Demographics
Ramona Map
Ramona Overview
$20,862
PER CAPITA INCOME
$60,000
AVG FAMILY INCOME
$46,648
AVG HOUSEHOLD INCOME
49.6%
WAGE / INCOME GAP [ % ]
50.4¢/ $1
WAGE / INCOME GAP [ $ ]
0.38
INEQUALITY / GINI INDEX
697
TOTAL POPULATION
338
MALE POPULATION
359
FEMALE POPULATION
94.15
MALES / 100 FEMALES
106.21
FEMALES / 100 MALES
39.4
MEDIAN AGE
3.6
AVG FAMILY SIZE
2.9
AVG HOUSEHOLD SIZE
295
LABOR FORCE [ PEOPLE ]
56.8%
PERCENT IN LABOR FORCE
4.1%
UNEMPLOYMENT RATE
Ramona Zip Codes
Ramona Area Codes
Income in Ramona
Income Overview in Ramona
Per Capita Income in Ramona is $20,862, while median incomes of families and households are $60,000 and $46,648 respectively.
| Characteristic | Number | Measure |
| Per Capita Income | 697 | $20,862 |
| Median Family Income | 154 | $60,000 |
| Mean Family Income | 154 | $72,353 |
| Median Household Income | 243 | $46,648 |
| Mean Household Income | 243 | $58,894 |
| Income Deficit | 154 | $0 |
| Wage / Income Gap (%) | 697 | 49.62% |
| Wage / Income Gap ($) | 697 | 50.38¢ per $1 |
| Gini / Inequality Index | 697 | 0.38 |
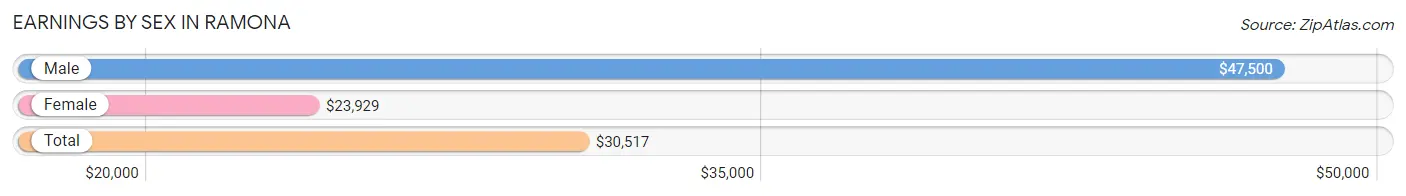
Earnings by Sex in Ramona
Average Earnings in Ramona are $30,517, $47,500 for men and $23,929 for women, a difference of 49.6%.
| Sex | Number | Average Earnings |
| Male | 136 (44.7%) | $47,500 |
| Female | 168 (55.3%) | $23,929 |
| Total | 304 (100.0%) | $30,517 |
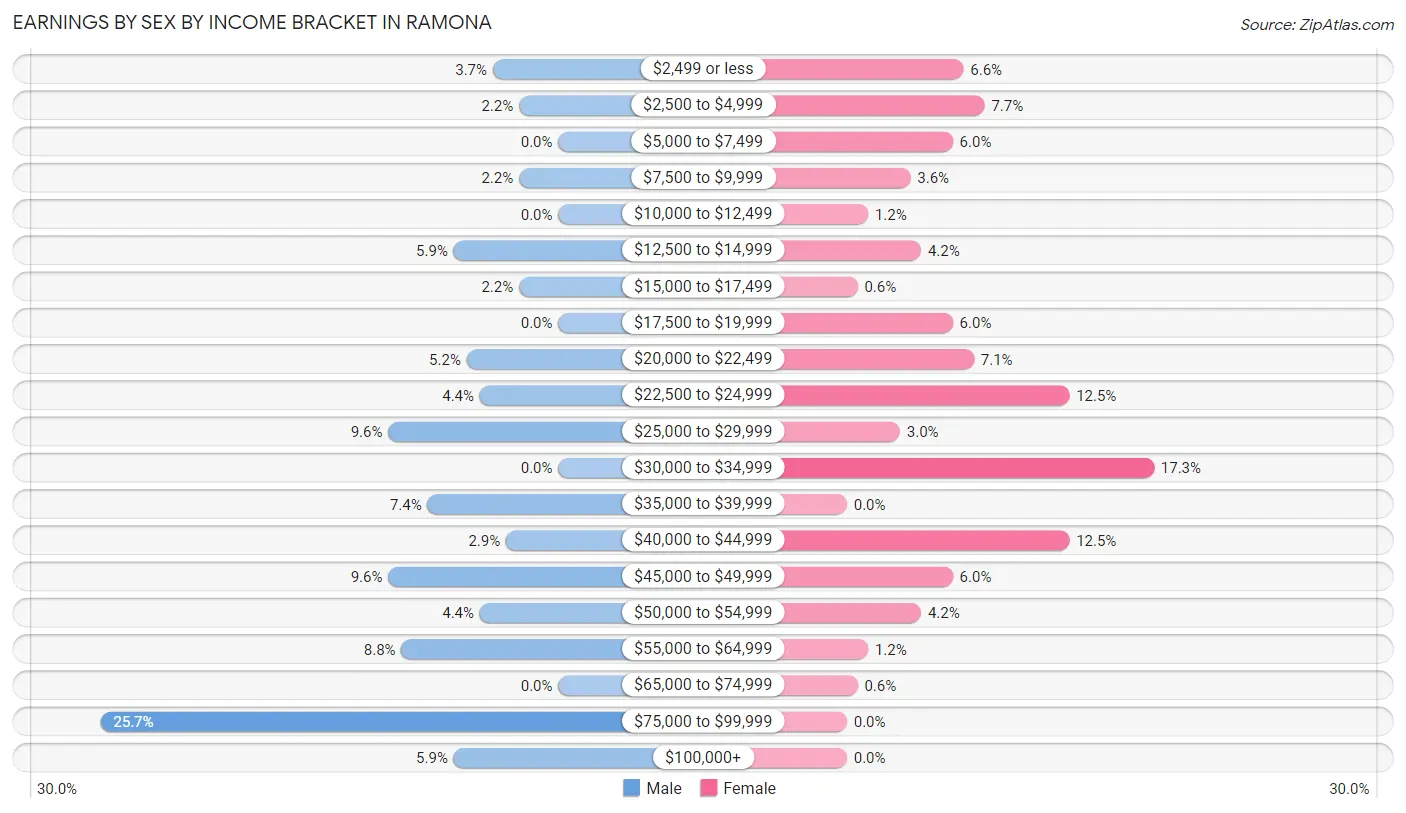
Earnings by Sex by Income Bracket in Ramona
The most common earnings brackets in Ramona are $75,000 to $99,999 for men (35 | 25.7%) and $30,000 to $34,999 for women (29 | 17.3%).
| Income | Male | Female |
| $2,499 or less | 5 (3.7%) | 11 (6.6%) |
| $2,500 to $4,999 | 3 (2.2%) | 13 (7.7%) |
| $5,000 to $7,499 | 0 (0.0%) | 10 (5.9%) |
| $7,500 to $9,999 | 3 (2.2%) | 6 (3.6%) |
| $10,000 to $12,499 | 0 (0.0%) | 2 (1.2%) |
| $12,500 to $14,999 | 8 (5.9%) | 7 (4.2%) |
| $15,000 to $17,499 | 3 (2.2%) | 1 (0.6%) |
| $17,500 to $19,999 | 0 (0.0%) | 10 (5.9%) |
| $20,000 to $22,499 | 7 (5.1%) | 12 (7.1%) |
| $22,500 to $24,999 | 6 (4.4%) | 21 (12.5%) |
| $25,000 to $29,999 | 13 (9.6%) | 5 (3.0%) |
| $30,000 to $34,999 | 0 (0.0%) | 29 (17.3%) |
| $35,000 to $39,999 | 10 (7.3%) | 0 (0.0%) |
| $40,000 to $44,999 | 4 (2.9%) | 21 (12.5%) |
| $45,000 to $49,999 | 13 (9.6%) | 10 (5.9%) |
| $50,000 to $54,999 | 6 (4.4%) | 7 (4.2%) |
| $55,000 to $64,999 | 12 (8.8%) | 2 (1.2%) |
| $65,000 to $74,999 | 0 (0.0%) | 1 (0.6%) |
| $75,000 to $99,999 | 35 (25.7%) | 0 (0.0%) |
| $100,000+ | 8 (5.9%) | 0 (0.0%) |
| Total | 136 (100.0%) | 168 (100.0%) |
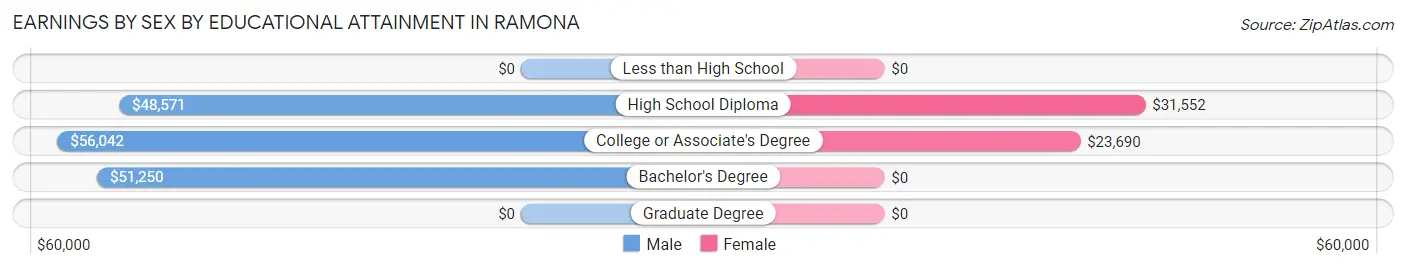
Earnings by Sex by Educational Attainment in Ramona
Average earnings in Ramona are $49,107 for men and $28,750 for women, a difference of 41.4%. Men with an educational attainment of college or associate's degree enjoy the highest average annual earnings of $56,042, while those with high school diploma education earn the least with $48,571. Women with an educational attainment of high school diploma earn the most with the average annual earnings of $31,552, while those with college or associate's degree education have the smallest earnings of $23,690.
| Educational Attainment | Male Income | Female Income |
| Less than High School | - | - |
| High School Diploma | $48,571 | $31,552 |
| College or Associate's Degree | $56,042 | $23,690 |
| Bachelor's Degree | $51,250 | $0 |
| Graduate Degree | - | - |
| Total | $49,107 | $28,750 |
Family Income in Ramona
Family Income Brackets in Ramona
According to the Ramona family income data, there are 39 families falling into the $50,000 to $74,999 income range, which is the most common income bracket and makes up 25.3% of all families. Conversely, the $200,000+ income bracket is the least frequent group with only 2 families (1.3%) belonging to this category.
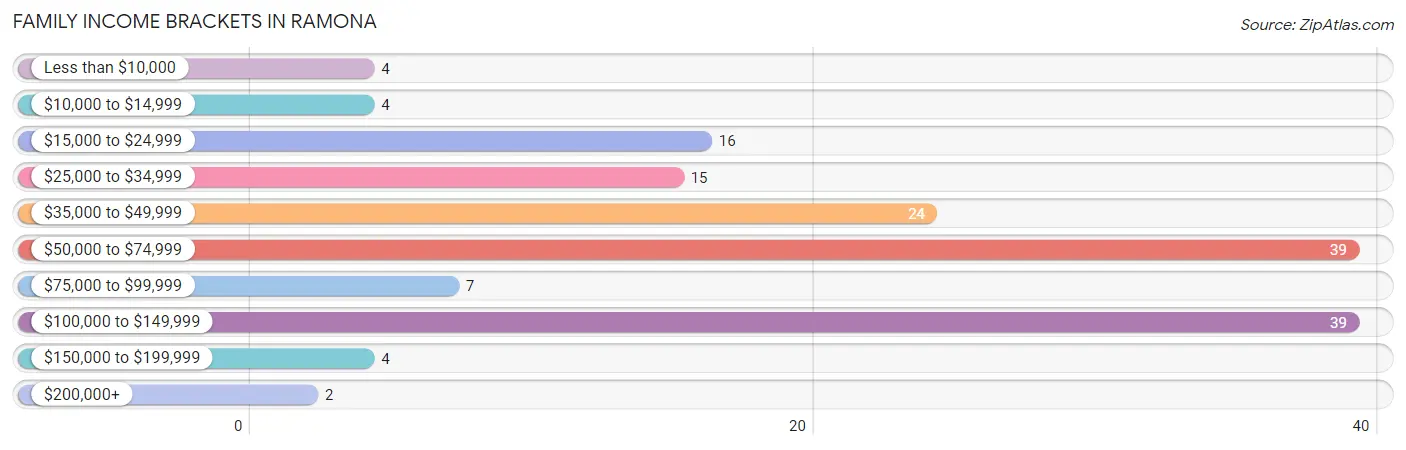
| Income Bracket | # Families | % Families |
| Less than $10,000 | 4 | 2.6% |
| $10,000 to $14,999 | 4 | 2.6% |
| $15,000 to $24,999 | 16 | 10.4% |
| $25,000 to $34,999 | 15 | 9.7% |
| $35,000 to $49,999 | 24 | 15.6% |
| $50,000 to $74,999 | 39 | 25.3% |
| $75,000 to $99,999 | 7 | 4.5% |
| $100,000 to $149,999 | 39 | 25.3% |
| $150,000 to $199,999 | 4 | 2.6% |
| $200,000+ | 2 | 1.3% |
Family Income by Famaliy Size in Ramona
4-person families (39 | 25.3%) account for the highest median family income in Ramona with $132,917 per family, while 4-person families (39 | 25.3%) have the highest median income of $33,229 per family member.
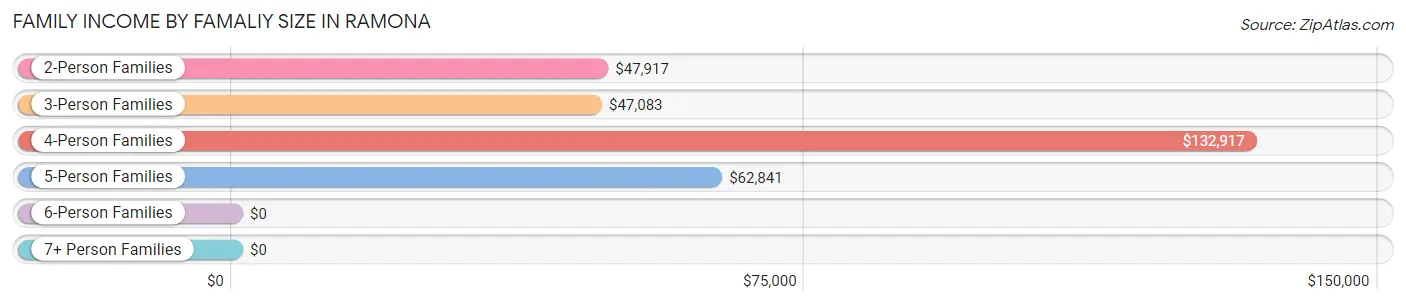
| Income Bracket | # Families | Median Income |
| 2-Person Families | 53 (34.4%) | $47,917 |
| 3-Person Families | 39 (25.3%) | $47,083 |
| 4-Person Families | 39 (25.3%) | $132,917 |
| 5-Person Families | 19 (12.3%) | $62,841 |
| 6-Person Families | 2 (1.3%) | $0 |
| 7+ Person Families | 2 (1.3%) | $0 |
| Total | 154 (100.0%) | $60,000 |
Family Income by Number of Earners in Ramona
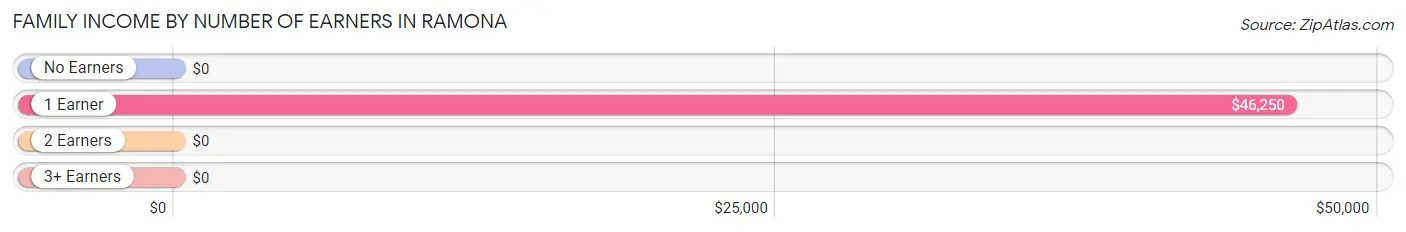
| Number of Earners | # Families | Median Income |
| No Earners | 26 (16.9%) | $0 |
| 1 Earner | 34 (22.1%) | $46,250 |
| 2 Earners | 85 (55.2%) | $0 |
| 3+ Earners | 9 (5.8%) | $0 |
| Total | 154 (100.0%) | $60,000 |
Household Income in Ramona
Household Income Brackets in Ramona
With 58 households falling in the category, the $25,000 to $34,999 income range is the most frequent in Ramona, accounting for 23.9% of all households. In contrast, only 2 households (0.8%) fall into the $200,000+ income bracket, making it the least populous group.
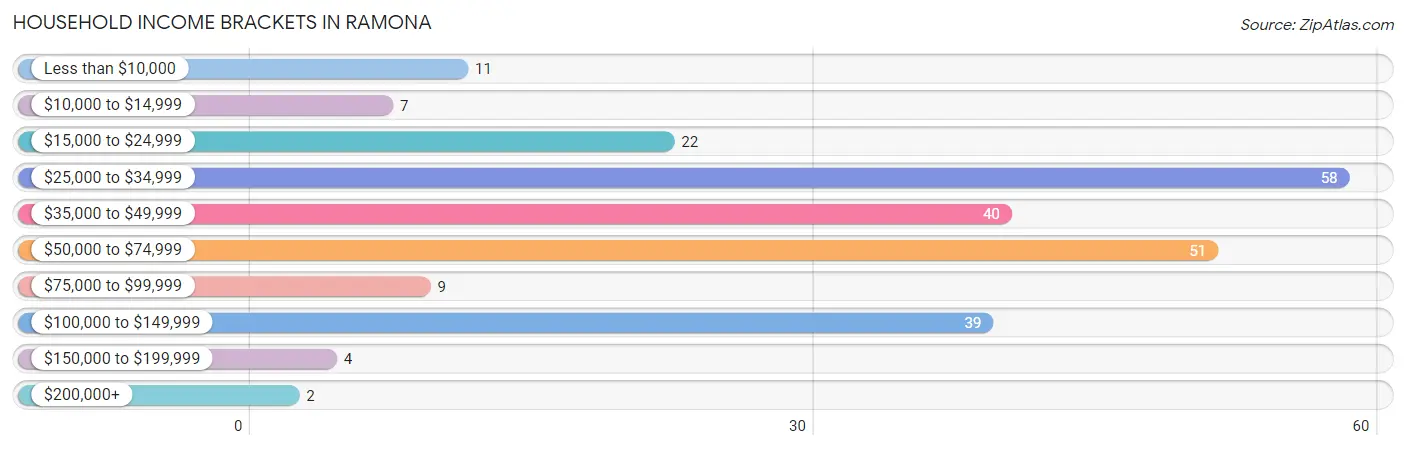
| Income Bracket | # Households | % Households |
| Less than $10,000 | 11 | 4.5% |
| $10,000 to $14,999 | 7 | 2.9% |
| $15,000 to $24,999 | 22 | 9.1% |
| $25,000 to $34,999 | 58 | 23.9% |
| $35,000 to $49,999 | 40 | 16.5% |
| $50,000 to $74,999 | 51 | 21.0% |
| $75,000 to $99,999 | 9 | 3.7% |
| $100,000 to $149,999 | 39 | 16.0% |
| $150,000 to $199,999 | 4 | 1.6% |
| $200,000+ | 2 | 0.8% |
Household Income by Householder Age in Ramona
The median household income in Ramona is $46,648, with the highest median household income of $65,250 found in the 25 to 44 years age bracket for the primary householder. A total of 81 households (33.3%) fall into this category. Meanwhile, the 15 to 24 years age bracket for the primary householder has the lowest median household income of $0, with 3 households (1.2%) in this group.
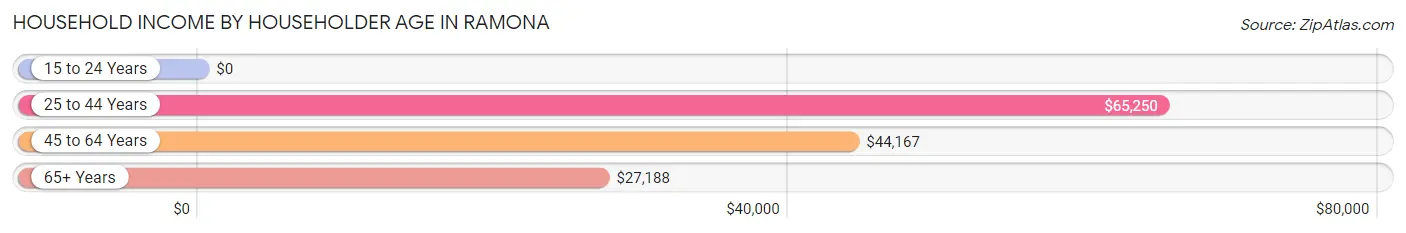
| Income Bracket | # Households | Median Income |
| 15 to 24 Years | 3 (1.2%) | $0 |
| 25 to 44 Years | 81 (33.3%) | $65,250 |
| 45 to 64 Years | 116 (47.7%) | $44,167 |
| 65+ Years | 43 (17.7%) | $27,188 |
| Total | 243 (100.0%) | $46,648 |
Poverty in Ramona
Income Below Poverty by Sex and Age in Ramona
With 16.4% poverty level for males and 18.3% for females among the residents of Ramona, 16 and 17 year old males and 25 to 34 year old females are the most vulnerable to poverty, with 6 males (50.0%) and 19 females (46.3%) in their respective age groups living below the poverty level.
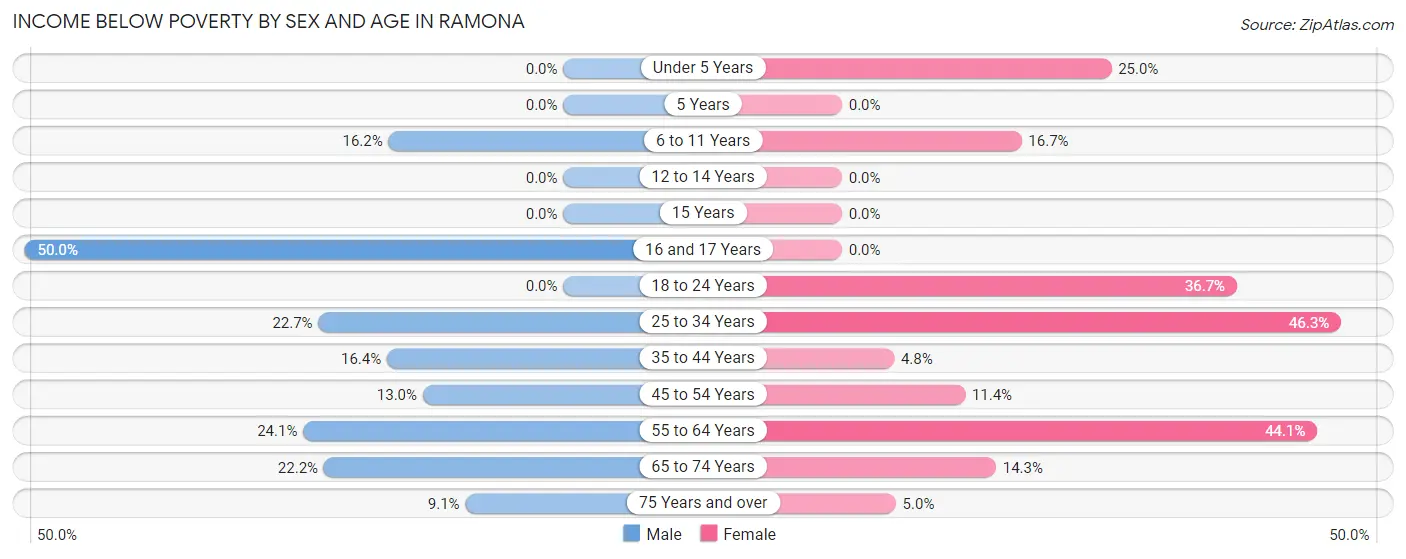
| Age Bracket | Male | Female |
| Under 5 Years | 0 (0.0%) | 2 (25.0%) |
| 5 Years | 0 (0.0%) | 0 (0.0%) |
| 6 to 11 Years | 12 (16.2%) | 3 (16.7%) |
| 12 to 14 Years | 0 (0.0%) | 0 (0.0%) |
| 15 Years | 0 (0.0%) | 0 (0.0%) |
| 16 and 17 Years | 6 (50.0%) | 0 (0.0%) |
| 18 to 24 Years | 0 (0.0%) | 11 (36.7%) |
| 25 to 34 Years | 10 (22.7%) | 19 (46.3%) |
| 35 to 44 Years | 9 (16.4%) | 3 (4.8%) |
| 45 to 54 Years | 6 (13.0%) | 8 (11.4%) |
| 55 to 64 Years | 7 (24.1%) | 15 (44.1%) |
| 65 to 74 Years | 4 (22.2%) | 3 (14.3%) |
| 75 Years and over | 1 (9.1%) | 1 (5.0%) |
| Total | 55 (16.4%) | 65 (18.3%) |
Income Above Poverty by Sex and Age in Ramona
According to the poverty statistics in Ramona, males aged 12 to 14 years and females aged 5 years are the age groups that are most secure financially, with 100.0% of males and 100.0% of females in these age groups living above the poverty line.
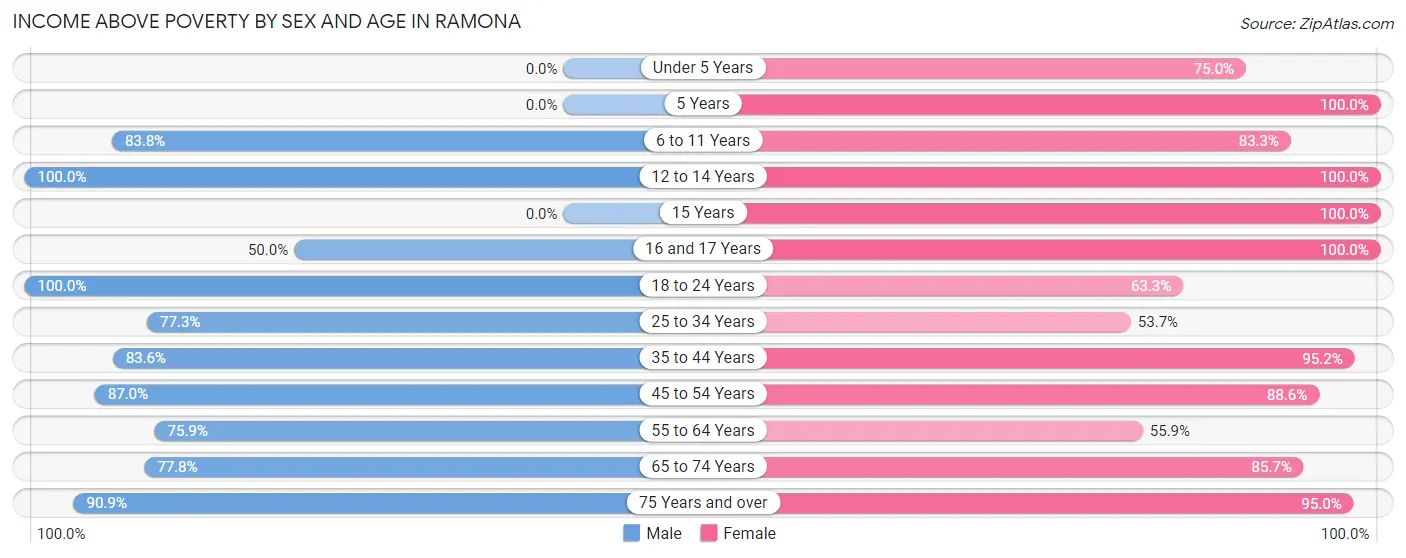
| Age Bracket | Male | Female |
| Under 5 Years | 0 (0.0%) | 6 (75.0%) |
| 5 Years | 0 (0.0%) | 1 (100.0%) |
| 6 to 11 Years | 62 (83.8%) | 15 (83.3%) |
| 12 to 14 Years | 30 (100.0%) | 17 (100.0%) |
| 15 Years | 0 (0.0%) | 25 (100.0%) |
| 16 and 17 Years | 6 (50.0%) | 9 (100.0%) |
| 18 to 24 Years | 17 (100.0%) | 19 (63.3%) |
| 25 to 34 Years | 34 (77.3%) | 22 (53.7%) |
| 35 to 44 Years | 46 (83.6%) | 59 (95.2%) |
| 45 to 54 Years | 40 (87.0%) | 62 (88.6%) |
| 55 to 64 Years | 22 (75.9%) | 19 (55.9%) |
| 65 to 74 Years | 14 (77.8%) | 18 (85.7%) |
| 75 Years and over | 10 (90.9%) | 19 (95.0%) |
| Total | 281 (83.6%) | 291 (81.7%) |
Income Below Poverty Among Married-Couple Families in Ramona
The poverty statistics for married-couple families in Ramona show that 3.5% or 4 of the total 116 families live below the poverty line. Families with 1 or 2 children have the highest poverty rate of 5.6%, comprising of 3 families. On the other hand, families with 3 or 4 children have the lowest poverty rate of 0.0%, which includes 0 families.
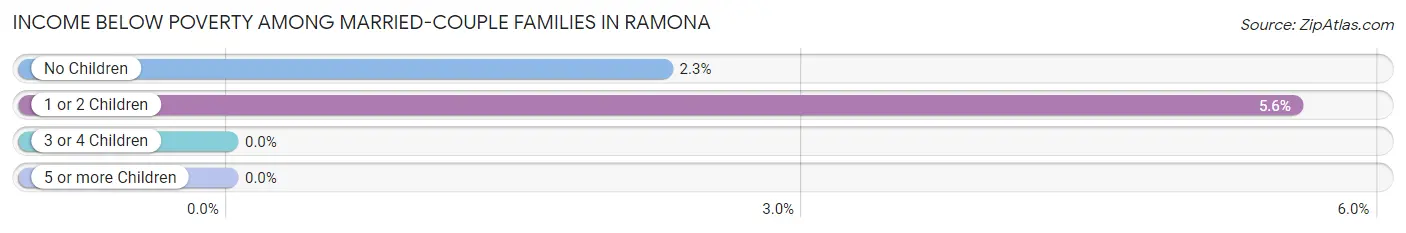
| Children | Above Poverty | Below Poverty |
| No Children | 43 (97.7%) | 1 (2.3%) |
| 1 or 2 Children | 51 (94.4%) | 3 (5.6%) |
| 3 or 4 Children | 16 (100.0%) | 0 (0.0%) |
| 5 or more Children | 2 (100.0%) | 0 (0.0%) |
| Total | 112 (96.6%) | 4 (3.5%) |
Income Below Poverty Among Single-Parent Households in Ramona
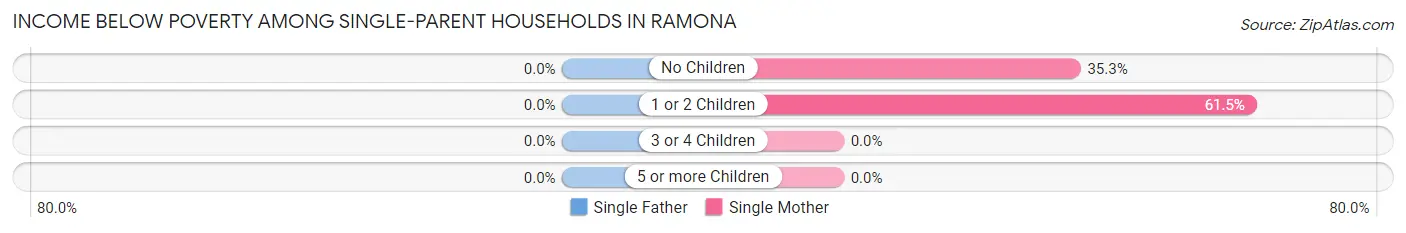
| Children | Single Father | Single Mother |
| No Children | 0 (0.0%) | 6 (35.3%) |
| 1 or 2 Children | 0 (0.0%) | 8 (61.5%) |
| 3 or 4 Children | 0 (0.0%) | 0 (0.0%) |
| 5 or more Children | 0 (0.0%) | 0 (0.0%) |
| Total | 0 (0.0%) | 14 (46.7%) |
Income Below Poverty Among Married-Couple vs Single-Parent Households in Ramona
The poverty data for Ramona shows that 4 of the married-couple family households (3.5%) and 14 of the single-parent households (36.8%) are living below the poverty level. Within the married-couple family households, those with 1 or 2 children have the highest poverty rate, with 3 households (5.6%) falling below the poverty line. Among the single-parent households, those with 1 or 2 children have the highest poverty rate, with 8 household (50.0%) living below poverty.
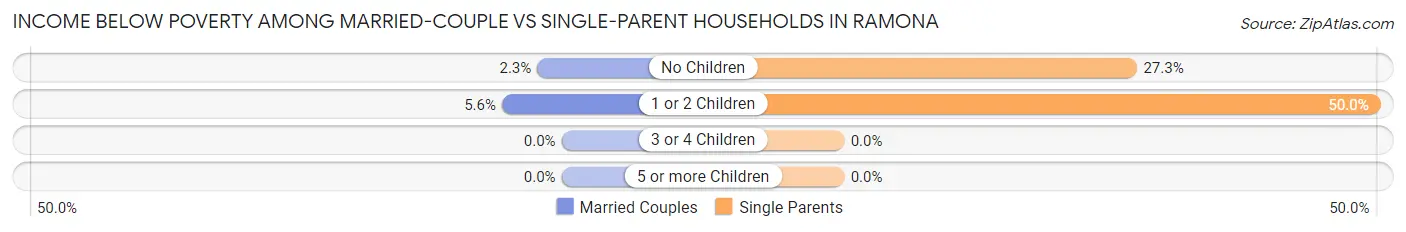
| Children | Married-Couple Families | Single-Parent Households |
| No Children | 1 (2.3%) | 6 (27.3%) |
| 1 or 2 Children | 3 (5.6%) | 8 (50.0%) |
| 3 or 4 Children | 0 (0.0%) | 0 (0.0%) |
| 5 or more Children | 0 (0.0%) | 0 (0.0%) |
| Total | 4 (3.5%) | 14 (36.8%) |
Race in Ramona
The most populous races in Ramona are White / Caucasian (406 | 58.3%), Two or more Races (155 | 22.2%), and Native / Alaskan (125 | 17.9%).
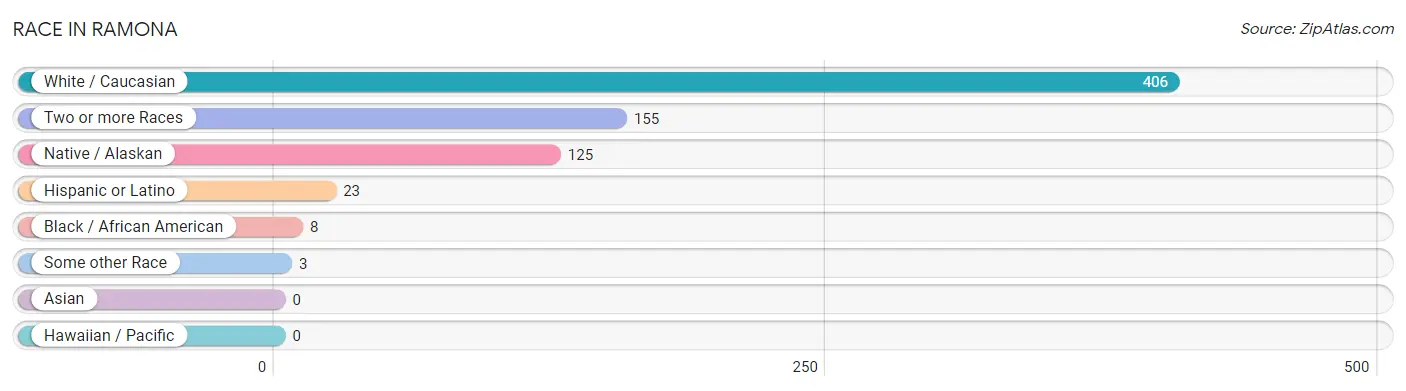
| Race | # Population | % Population |
| Asian | 0 | 0.0% |
| Black / African American | 8 | 1.1% |
| Hawaiian / Pacific | 0 | 0.0% |
| Hispanic or Latino | 23 | 3.3% |
| Native / Alaskan | 125 | 17.9% |
| White / Caucasian | 406 | 58.3% |
| Two or more Races | 155 | 22.2% |
| Some other Race | 3 | 0.4% |
| Total | 697 | 100.0% |
Ancestry in Ramona
The most populous ancestries reported in Ramona are Cherokee (156 | 22.4%), Irish (116 | 16.6%), German (82 | 11.8%), Iroquois (57 | 8.2%), and English (55 | 7.9%), together accounting for 66.8% of all Ramona residents.
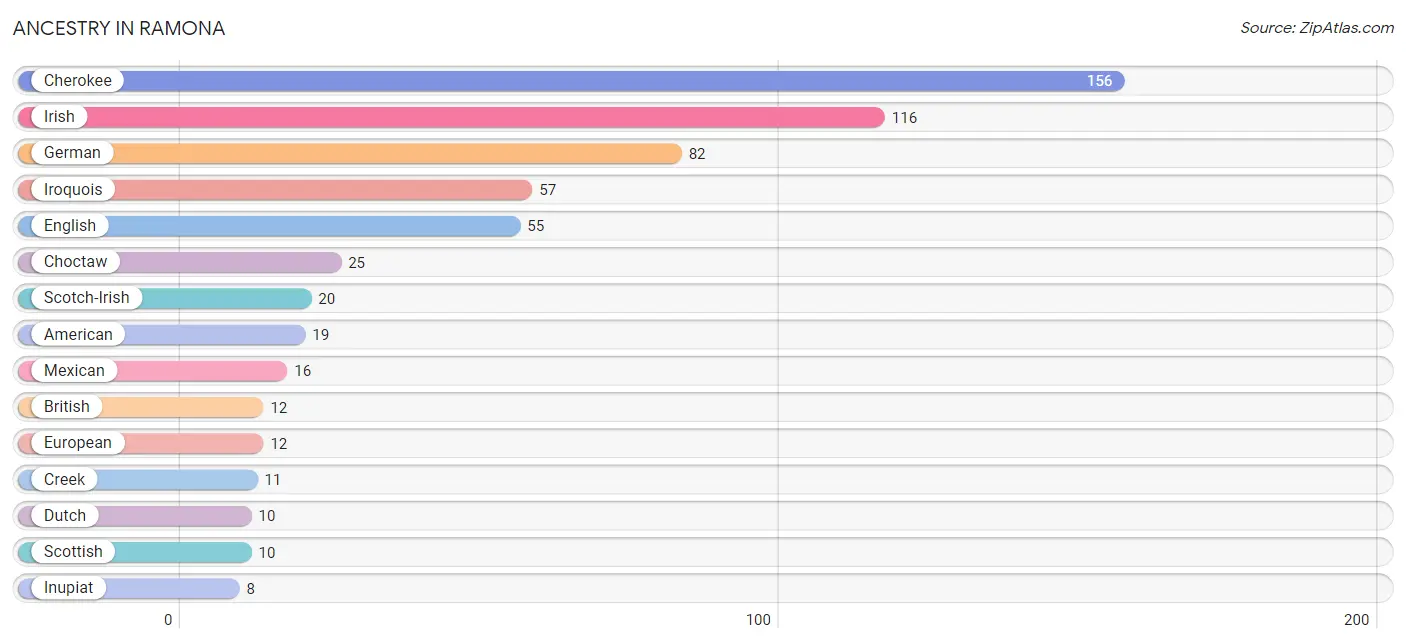
| Ancestry | # Population | % Population |
| American | 19 | 2.7% |
| Apache | 2 | 0.3% |
| Blackfeet | 2 | 0.3% |
| British | 12 | 1.7% |
| Cherokee | 156 | 22.4% |
| Choctaw | 25 | 3.6% |
| Colombian | 7 | 1.0% |
| Creek | 11 | 1.6% |
| Danish | 2 | 0.3% |
| Delaware | 3 | 0.4% |
| Dutch | 10 | 1.4% |
| Dutch West Indian | 6 | 0.9% |
| English | 55 | 7.9% |
| European | 12 | 1.7% |
| Finnish | 2 | 0.3% |
| French | 5 | 0.7% |
| German | 82 | 11.8% |
| Inupiat | 8 | 1.1% |
| Irish | 116 | 16.6% |
| Iroquois | 57 | 8.2% |
| Italian | 4 | 0.6% |
| Korean | 5 | 0.7% |
| Mexican | 16 | 2.3% |
| Norwegian | 3 | 0.4% |
| Osage | 2 | 0.3% |
| Pakistani | 5 | 0.7% |
| Polish | 1 | 0.1% |
| Scotch-Irish | 20 | 2.9% |
| Scottish | 10 | 1.4% |
| South American | 7 | 1.0% |
| Swedish | 8 | 1.1% |
| Thai | 5 | 0.7% |
| Welsh | 5 | 0.7% |
| Yugoslavian | 2 | 0.3% | View All 34 Rows |
Immigrants in Ramona

| Immigration Origin | # Population | % Population | View All 0 Rows |
Sex and Age in Ramona
Sex and Age in Ramona
The most populous age groups in Ramona are 10 to 14 Years (71 | 21.0%) for men and 50 to 54 Years (52 | 14.5%) for women.
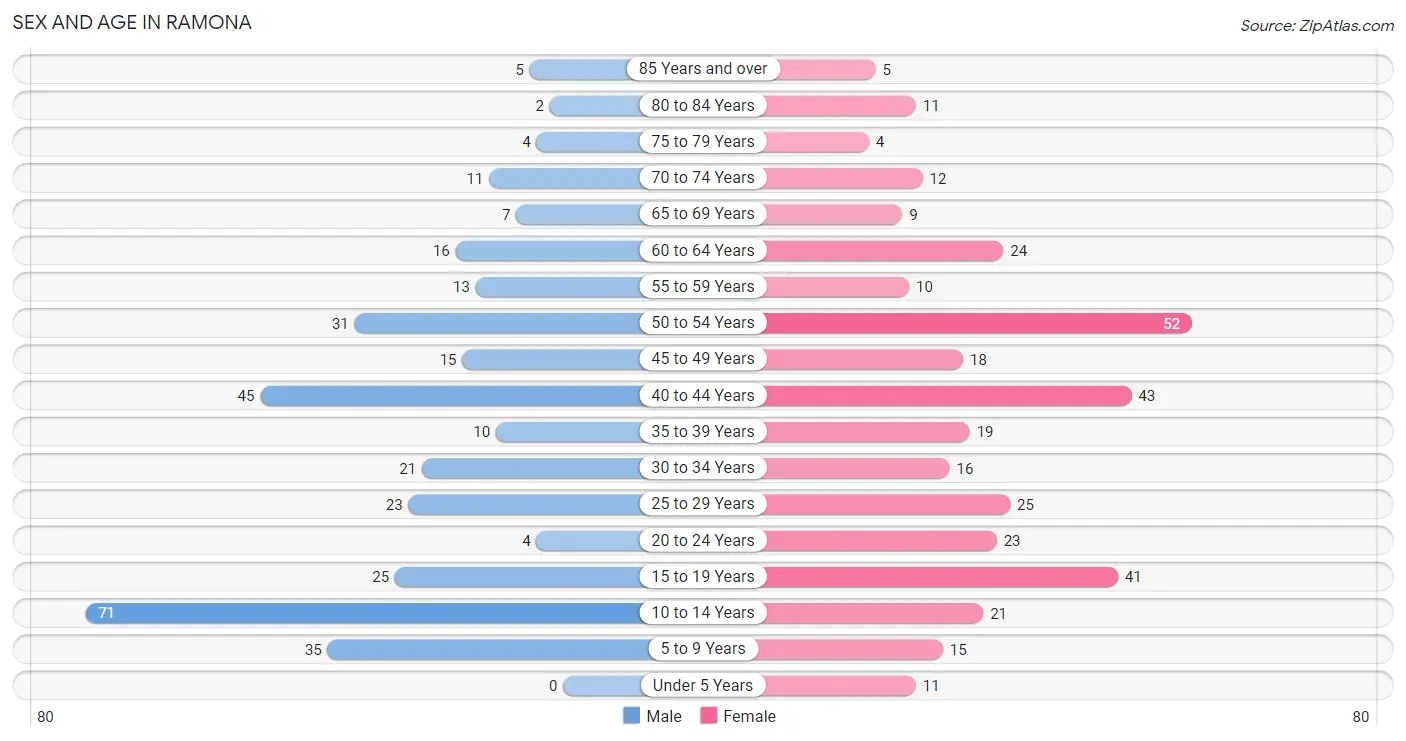
| Age Bracket | Male | Female |
| Under 5 Years | 0 (0.0%) | 11 (3.1%) |
| 5 to 9 Years | 35 (10.4%) | 15 (4.2%) |
| 10 to 14 Years | 71 (21.0%) | 21 (5.9%) |
| 15 to 19 Years | 25 (7.4%) | 41 (11.4%) |
| 20 to 24 Years | 4 (1.2%) | 23 (6.4%) |
| 25 to 29 Years | 23 (6.8%) | 25 (7.0%) |
| 30 to 34 Years | 21 (6.2%) | 16 (4.5%) |
| 35 to 39 Years | 10 (3.0%) | 19 (5.3%) |
| 40 to 44 Years | 45 (13.3%) | 43 (12.0%) |
| 45 to 49 Years | 15 (4.4%) | 18 (5.0%) |
| 50 to 54 Years | 31 (9.2%) | 52 (14.5%) |
| 55 to 59 Years | 13 (3.8%) | 10 (2.8%) |
| 60 to 64 Years | 16 (4.7%) | 24 (6.7%) |
| 65 to 69 Years | 7 (2.1%) | 9 (2.5%) |
| 70 to 74 Years | 11 (3.3%) | 12 (3.3%) |
| 75 to 79 Years | 4 (1.2%) | 4 (1.1%) |
| 80 to 84 Years | 2 (0.6%) | 11 (3.1%) |
| 85 Years and over | 5 (1.5%) | 5 (1.4%) |
| Total | 338 (100.0%) | 359 (100.0%) |
Families and Households in Ramona
Median Family Size in Ramona
The median family size in Ramona is 3.58 persons per family, with married-couple families (116 | 75.3%) accounting for the largest median family size of 3.84 persons per family. On the other hand, single male/father families (8 | 5.2%) represent the smallest median family size with 2.25 persons per family.
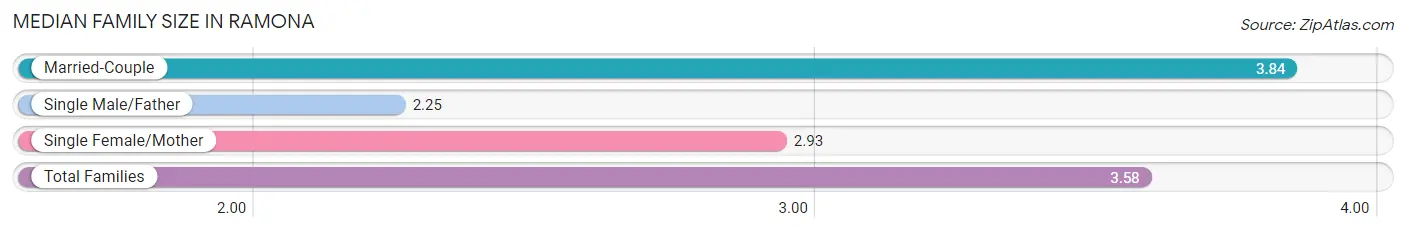
| Family Type | # Families | Family Size |
| Married-Couple | 116 (75.3%) | 3.84 |
| Single Male/Father | 8 (5.2%) | 2.25 |
| Single Female/Mother | 30 (19.5%) | 2.93 |
| Total Families | 154 (100.0%) | 3.58 |
Median Household Size in Ramona
The median household size in Ramona is 2.87 persons per household, with married-couple households (116 | 47.7%) accounting for the largest median household size of 3.91 persons per household. non-family households (89 | 36.6%) represent the smallest median household size with 1.36 persons per household.
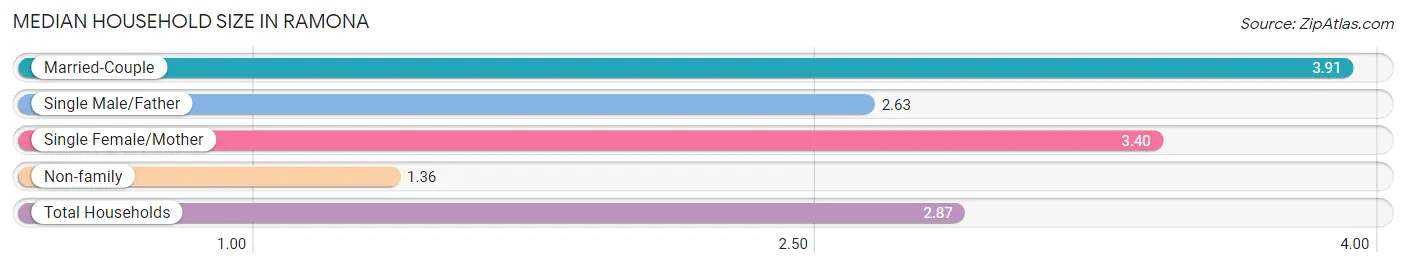
| Household Type | # Households | Household Size |
| Married-Couple | 116 (47.7%) | 3.91 |
| Single Male/Father | 8 (3.3%) | 2.63 |
| Single Female/Mother | 30 (12.3%) | 3.40 |
| Non-family | 89 (36.6%) | 1.36 |
| Total Households | 243 (100.0%) | 2.87 |
Household Size by Marriage Status in Ramona
Out of a total of 243 households in Ramona, 154 (63.4%) are family households, while 89 (36.6%) are nonfamily households. The most numerous type of family households are 3-person households, comprising 50, and the most common type of nonfamily households are 1-person households, comprising 74.
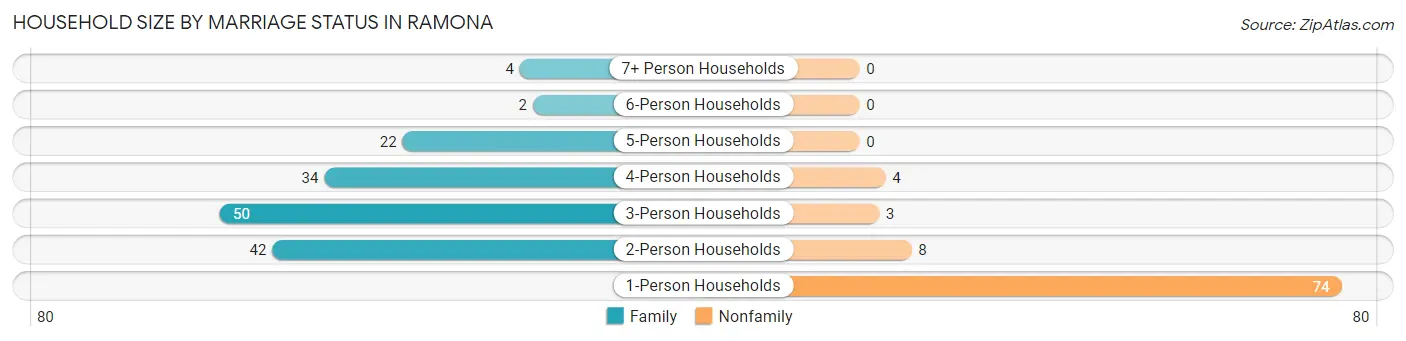
| Household Size | Family Households | Nonfamily Households |
| 1-Person Households | - | 74 (30.4%) |
| 2-Person Households | 42 (17.3%) | 8 (3.3%) |
| 3-Person Households | 50 (20.6%) | 3 (1.2%) |
| 4-Person Households | 34 (14.0%) | 4 (1.7%) |
| 5-Person Households | 22 (9.0%) | 0 (0.0%) |
| 6-Person Households | 2 (0.8%) | 0 (0.0%) |
| 7+ Person Households | 4 (1.7%) | 0 (0.0%) |
| Total | 154 (63.4%) | 89 (36.6%) |
Female Fertility in Ramona
Fertility by Age in Ramona
Average fertility rate in Ramona is 48.0 births per 1,000 women. Women in the age bracket of 35 to 50 years have the highest fertility rate with 72.0 births per 1,000 women. Women in the age bracket of 35 to 50 years acount for 66.7% of all women with births.
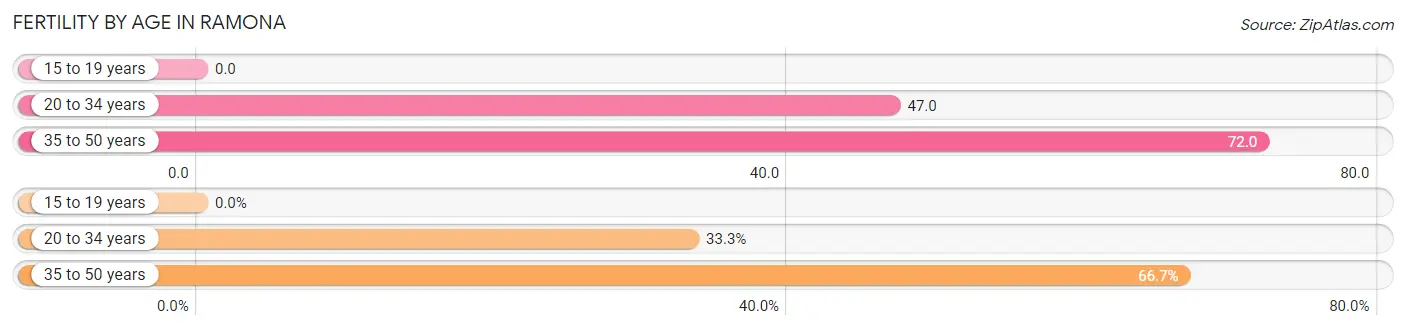
| Age Bracket | Women with Births | Births / 1,000 Women |
| 15 to 19 years | 0 (0.0%) | 0.0 |
| 20 to 34 years | 3 (33.3%) | 47.0 |
| 35 to 50 years | 6 (66.7%) | 72.0 |
| Total | 9 (100.0%) | 48.0 |
Fertility by Age by Marriage Status in Ramona
66.7% of women with births (9) in Ramona are married. The highest percentage of unmarried women with births falls into 20 to 34 years age bracket with 100.0% of them unmarried at the time of birth, while the lowest percentage of unmarried women with births belong to 35 to 50 years age bracket with 0.0% of them unmarried.
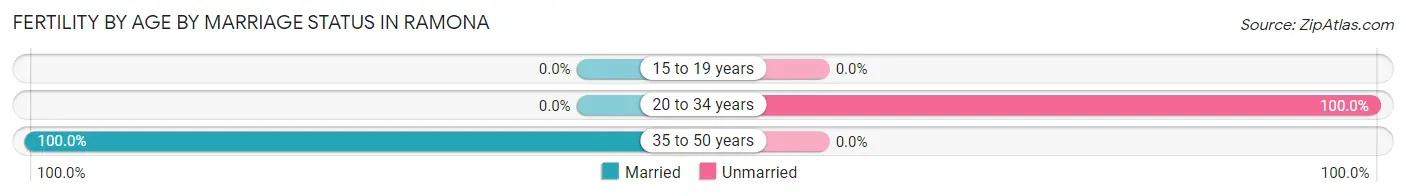
| Age Bracket | Married | Unmarried |
| 15 to 19 years | 0 (0.0%) | 0 (0.0%) |
| 20 to 34 years | 0 (0.0%) | 3 (100.0%) |
| 35 to 50 years | 6 (100.0%) | 0 (0.0%) |
| Total | 6 (66.7%) | 3 (33.3%) |
Fertility by Education in Ramona
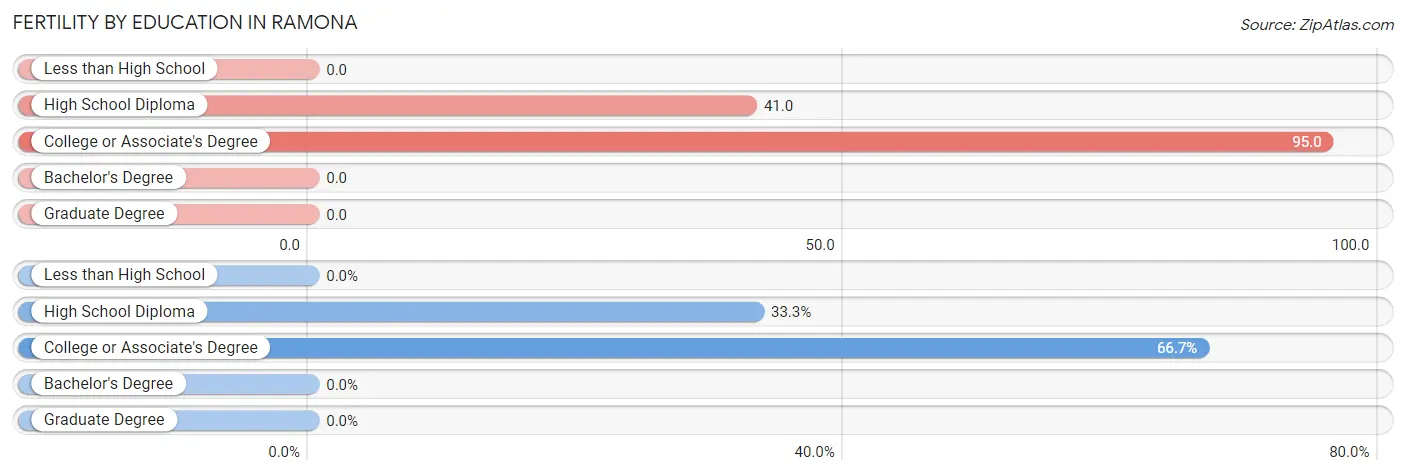
| Educational Attainment | Women with Births | Births / 1,000 Women |
| Less than High School | 0 (0.0%) | 0.0 |
| High School Diploma | 3 (33.3%) | 41.0 |
| College or Associate's Degree | 6 (66.7%) | 95.0 |
| Bachelor's Degree | 0 (0.0%) | 0.0 |
| Graduate Degree | 0 (0.0%) | 0.0 |
| Total | 9 (100.0%) | 48.0 |
Fertility by Education by Marriage Status in Ramona
33.3% of women with births in Ramona are unmarried. Women with the educational attainment of high school diploma are most likely to be married with 100.0% of them married at childbirth, while women with the educational attainment of college or associate's degree are least likely to be married with 50.0% of them unmarried at childbirth.
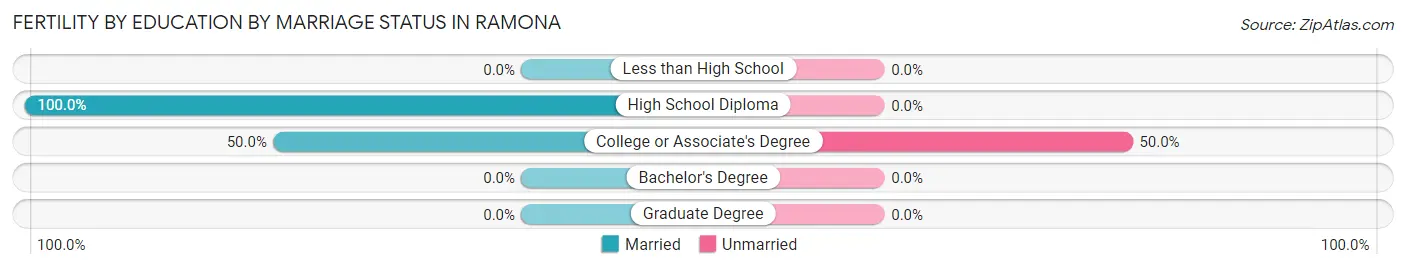
| Educational Attainment | Married | Unmarried |
| Less than High School | 0 (0.0%) | 0 (0.0%) |
| High School Diploma | 3 (100.0%) | 0 (0.0%) |
| College or Associate's Degree | 3 (50.0%) | 3 (50.0%) |
| Bachelor's Degree | 0 (0.0%) | 0 (0.0%) |
| Graduate Degree | 0 (0.0%) | 0 (0.0%) |
| Total | 6 (66.7%) | 3 (33.3%) |
Employment Characteristics in Ramona
Employment by Class of Employer in Ramona
Among the 272 employed individuals in Ramona, private company employees (191 | 70.2%), local government employees (26 | 9.6%), and state government employees (20 | 7.3%) make up the most common classes of employment.
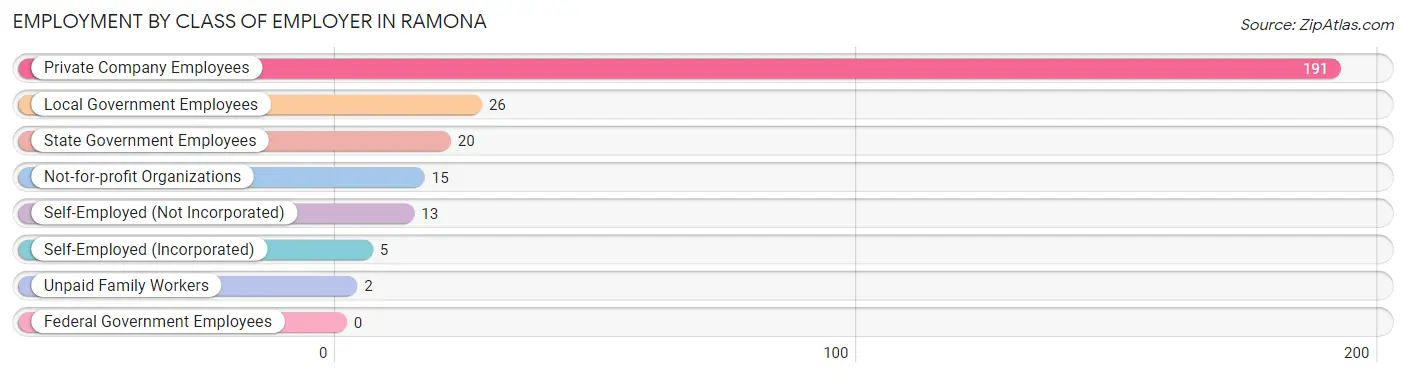
| Employer Class | # Employees | % Employees |
| Private Company Employees | 191 | 70.2% |
| Self-Employed (Incorporated) | 5 | 1.8% |
| Self-Employed (Not Incorporated) | 13 | 4.8% |
| Not-for-profit Organizations | 15 | 5.5% |
| Local Government Employees | 26 | 9.6% |
| State Government Employees | 20 | 7.3% |
| Federal Government Employees | 0 | 0.0% |
| Unpaid Family Workers | 2 | 0.7% |
| Total | 272 | 100.0% |
Employment Status by Age in Ramona
According to the labor force statistics for Ramona, out of the total population over 16 years of age (519), 56.8% or 295 individuals are in the labor force, with 4.1% or 12 of them unemployed. The age group with the highest labor force participation rate is 35 to 44 years, with 88.9% or 104 individuals in the labor force. Within the labor force, the 16 to 19 years age range has the highest percentage of unemployed individuals, with 23.1% or 3 of them being unemployed.
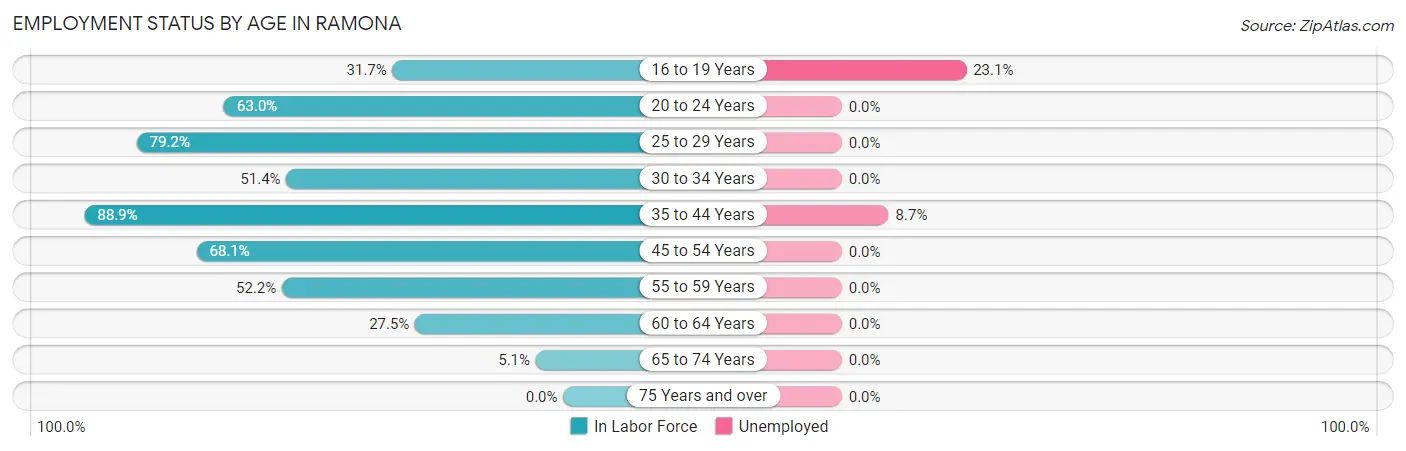
| Age Bracket | In Labor Force | Unemployed |
| 16 to 19 Years | 13 (31.7%) | 3 (23.1%) |
| 20 to 24 Years | 17 (63.0%) | 0 (0.0%) |
| 25 to 29 Years | 38 (79.2%) | 0 (0.0%) |
| 30 to 34 Years | 19 (51.4%) | 0 (0.0%) |
| 35 to 44 Years | 104 (88.9%) | 9 (8.7%) |
| 45 to 54 Years | 79 (68.1%) | 0 (0.0%) |
| 55 to 59 Years | 12 (52.2%) | 0 (0.0%) |
| 60 to 64 Years | 11 (27.5%) | 0 (0.0%) |
| 65 to 74 Years | 2 (5.1%) | 0 (0.0%) |
| 75 Years and over | 0 (0.0%) | 0 (0.0%) |
| Total | 295 (56.8%) | 12 (4.1%) |
Employment Status by Educational Attainment in Ramona
According to labor force statistics for Ramona, 69.0% of individuals (263) out of the total population between 25 and 64 years of age (381) are in the labor force, with 3.4% or 9 of them being unemployed. The group with the highest labor force participation rate are those with the educational attainment of less than high school, with 86.4% or 19 individuals in the labor force. Within the labor force, individuals with college / associate degree education have the highest percentage of unemployment, with 5.4% or 6 of them being unemployed.
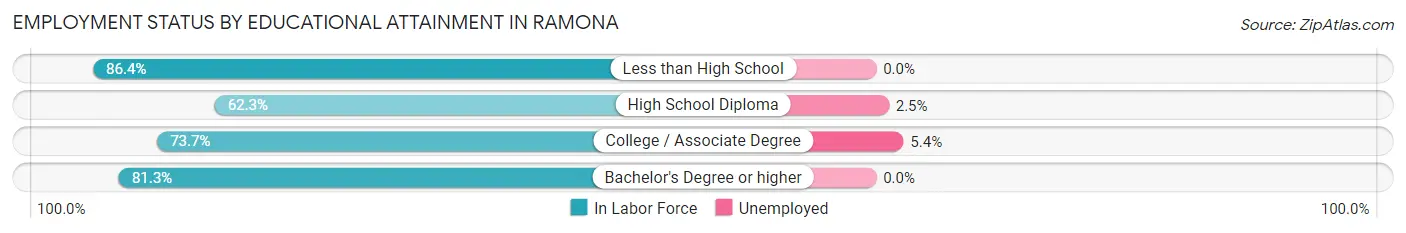
| Educational Attainment | In Labor Force | Unemployed |
| Less than High School | 19 (86.4%) | 0 (0.0%) |
| High School Diploma | 119 (62.3%) | 5 (2.5%) |
| College / Associate Degree | 112 (73.7%) | 8 (5.4%) |
| Bachelor's Degree or higher | 13 (81.3%) | 0 (0.0%) |
| Total | 263 (69.0%) | 13 (3.4%) |
Employment Occupations by Sex in Ramona
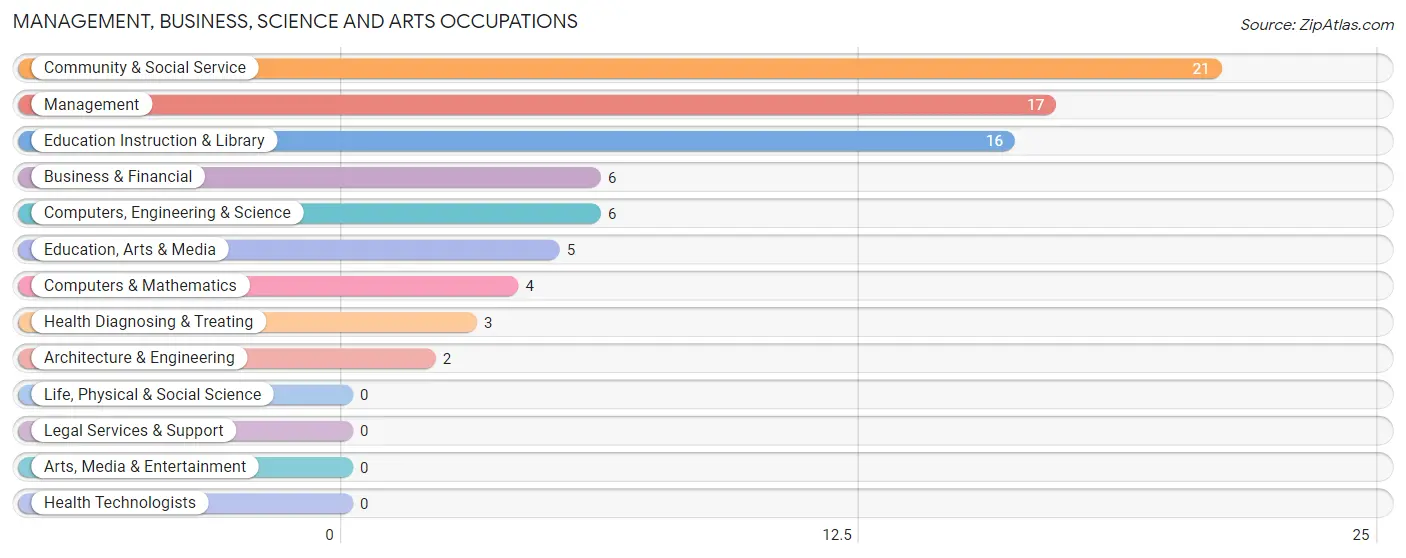
Management, Business, Science and Arts Occupations
The most common Management, Business, Science and Arts occupations in Ramona are Community & Social Service (21 | 7.4%), Management (17 | 6.0%), Education Instruction & Library (16 | 5.7%), Business & Financial (6 | 2.1%), and Computers, Engineering & Science (6 | 2.1%).
Management, Business, Science and Arts Occupations by Sex
Within the Management, Business, Science and Arts occupations in Ramona, the most male-oriented occupations are Computers, Engineering & Science (100.0%), Computers & Mathematics (100.0%), and Architecture & Engineering (100.0%), while the most female-oriented occupations are Health Diagnosing & Treating (100.0%), Business & Financial (66.7%), and Education Instruction & Library (62.5%).
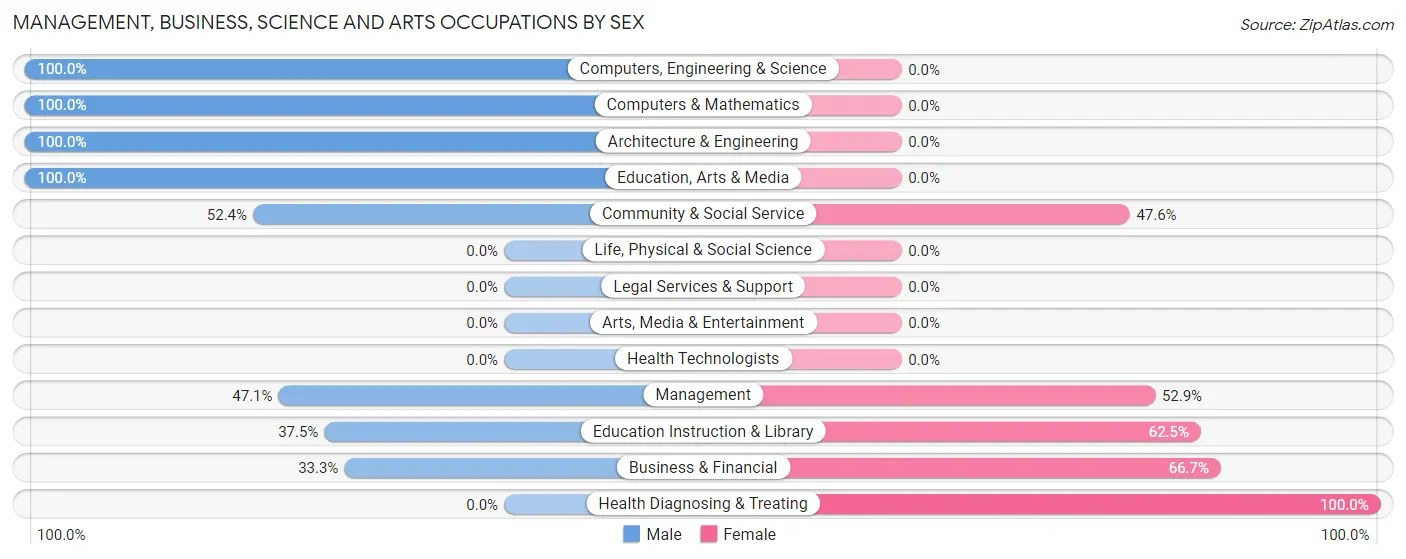
| Occupation | Male | Female |
| Management | 8 (47.1%) | 9 (52.9%) |
| Business & Financial | 2 (33.3%) | 4 (66.7%) |
| Computers, Engineering & Science | 6 (100.0%) | 0 (0.0%) |
| Computers & Mathematics | 4 (100.0%) | 0 (0.0%) |
| Architecture & Engineering | 2 (100.0%) | 0 (0.0%) |
| Life, Physical & Social Science | 0 (0.0%) | 0 (0.0%) |
| Community & Social Service | 11 (52.4%) | 10 (47.6%) |
| Education, Arts & Media | 5 (100.0%) | 0 (0.0%) |
| Legal Services & Support | 0 (0.0%) | 0 (0.0%) |
| Education Instruction & Library | 6 (37.5%) | 10 (62.5%) |
| Arts, Media & Entertainment | 0 (0.0%) | 0 (0.0%) |
| Health Diagnosing & Treating | 0 (0.0%) | 3 (100.0%) |
| Health Technologists | 0 (0.0%) | 0 (0.0%) |
| Total (Category) | 27 (50.9%) | 26 (49.1%) |
| Total (Overall) | 120 (42.4%) | 163 (57.6%) |
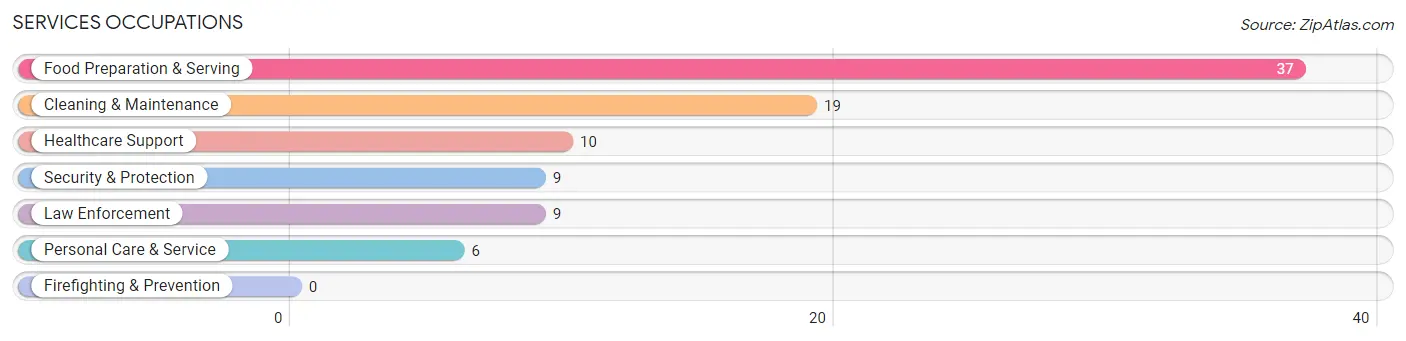
Services Occupations
The most common Services occupations in Ramona are Food Preparation & Serving (37 | 13.1%), Cleaning & Maintenance (19 | 6.7%), Healthcare Support (10 | 3.5%), Security & Protection (9 | 3.2%), and Law Enforcement (9 | 3.2%).
Services Occupations by Sex
Within the Services occupations in Ramona, the most male-oriented occupations are Security & Protection (100.0%), Law Enforcement (100.0%), and Cleaning & Maintenance (26.3%), while the most female-oriented occupations are Healthcare Support (100.0%), Personal Care & Service (100.0%), and Food Preparation & Serving (94.6%).
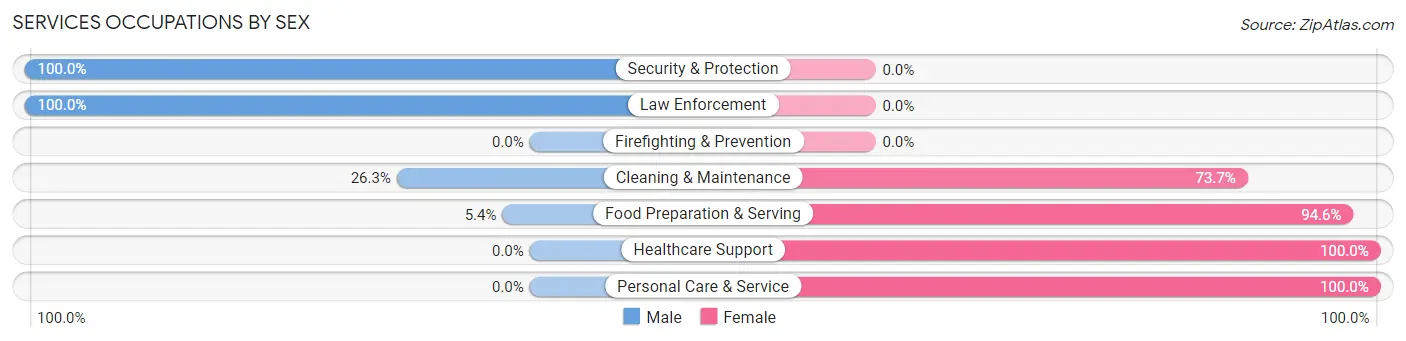
| Occupation | Male | Female |
| Healthcare Support | 0 (0.0%) | 10 (100.0%) |
| Security & Protection | 9 (100.0%) | 0 (0.0%) |
| Firefighting & Prevention | 0 (0.0%) | 0 (0.0%) |
| Law Enforcement | 9 (100.0%) | 0 (0.0%) |
| Food Preparation & Serving | 2 (5.4%) | 35 (94.6%) |
| Cleaning & Maintenance | 5 (26.3%) | 14 (73.7%) |
| Personal Care & Service | 0 (0.0%) | 6 (100.0%) |
| Total (Category) | 16 (19.8%) | 65 (80.2%) |
| Total (Overall) | 120 (42.4%) | 163 (57.6%) |
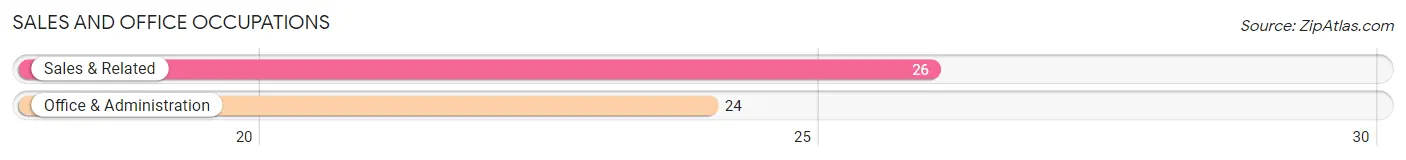
Sales and Office Occupations
The most common Sales and Office occupations in Ramona are Sales & Related (26 | 9.2%), and Office & Administration (24 | 8.5%).
Sales and Office Occupations by Sex
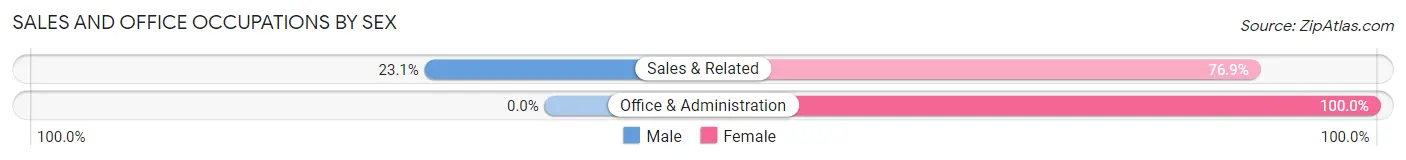
| Occupation | Male | Female |
| Sales & Related | 6 (23.1%) | 20 (76.9%) |
| Office & Administration | 0 (0.0%) | 24 (100.0%) |
| Total (Category) | 6 (12.0%) | 44 (88.0%) |
| Total (Overall) | 120 (42.4%) | 163 (57.6%) |
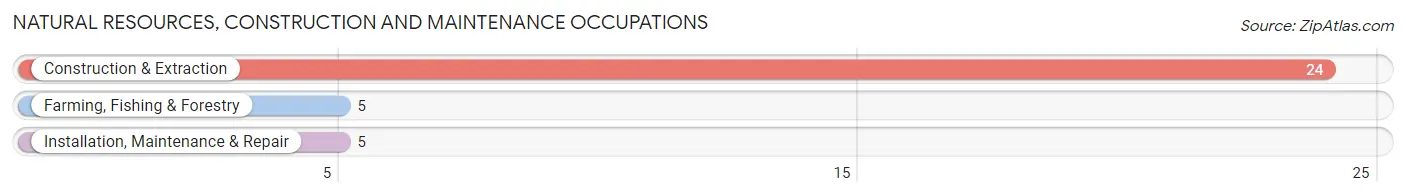
Natural Resources, Construction and Maintenance Occupations
The most common Natural Resources, Construction and Maintenance occupations in Ramona are Construction & Extraction (24 | 8.5%), Farming, Fishing & Forestry (5 | 1.8%), and Installation, Maintenance & Repair (5 | 1.8%).
Natural Resources, Construction and Maintenance Occupations by Sex
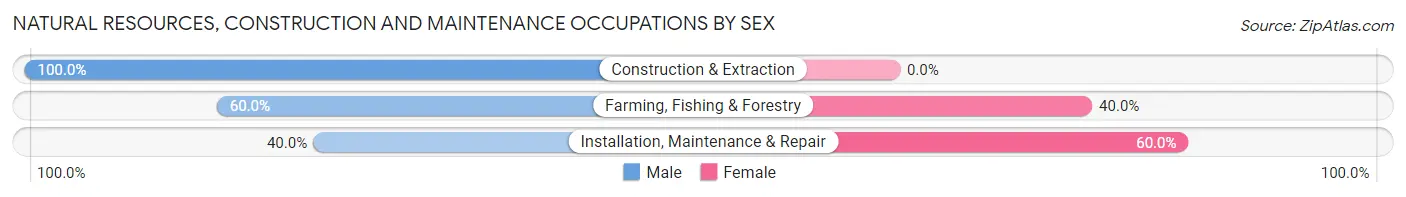
| Occupation | Male | Female |
| Farming, Fishing & Forestry | 3 (60.0%) | 2 (40.0%) |
| Construction & Extraction | 24 (100.0%) | 0 (0.0%) |
| Installation, Maintenance & Repair | 2 (40.0%) | 3 (60.0%) |
| Total (Category) | 29 (85.3%) | 5 (14.7%) |
| Total (Overall) | 120 (42.4%) | 163 (57.6%) |
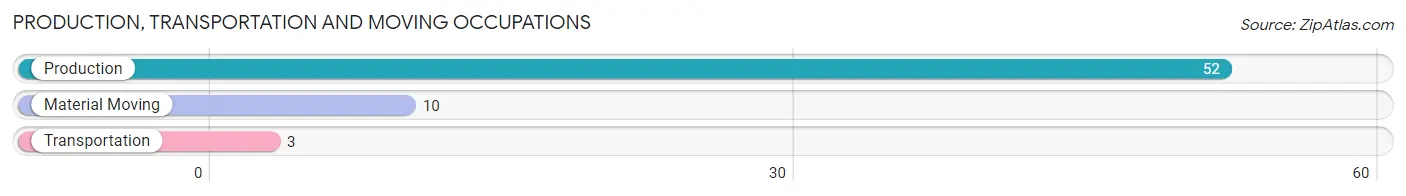
Production, Transportation and Moving Occupations
The most common Production, Transportation and Moving occupations in Ramona are Production (52 | 18.4%), Material Moving (10 | 3.5%), and Transportation (3 | 1.1%).
Production, Transportation and Moving Occupations by Sex
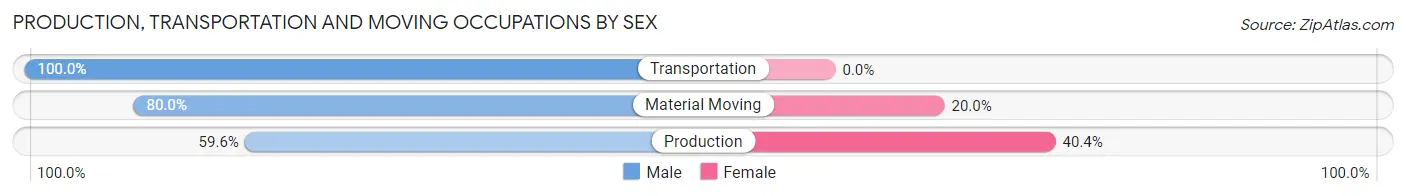
| Occupation | Male | Female |
| Production | 31 (59.6%) | 21 (40.4%) |
| Transportation | 3 (100.0%) | 0 (0.0%) |
| Material Moving | 8 (80.0%) | 2 (20.0%) |
| Total (Category) | 42 (64.6%) | 23 (35.4%) |
| Total (Overall) | 120 (42.4%) | 163 (57.6%) |
Employment Industries by Sex in Ramona
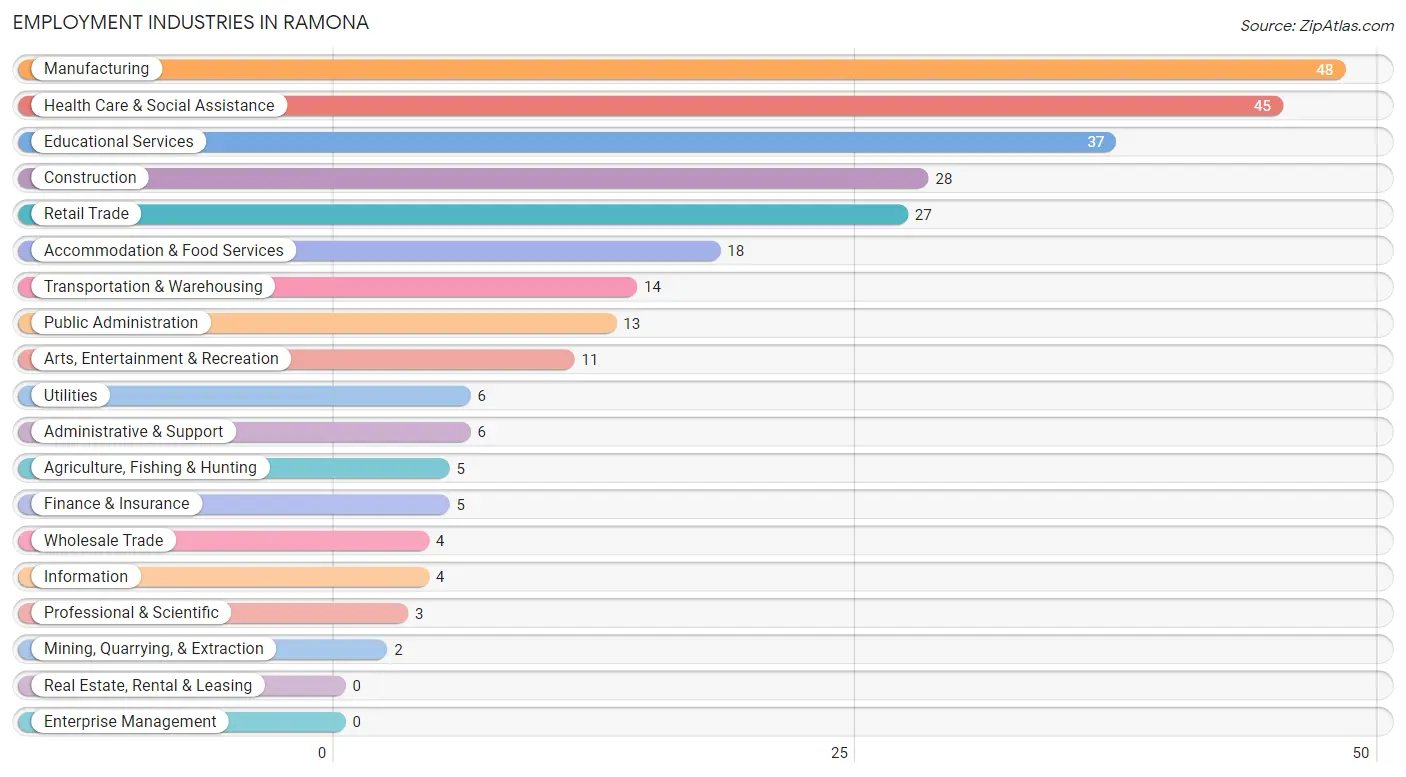
Employment Industries in Ramona
The major employment industries in Ramona include Manufacturing (48 | 17.0%), Health Care & Social Assistance (45 | 15.9%), Educational Services (37 | 13.1%), Construction (28 | 9.9%), and Retail Trade (27 | 9.5%).
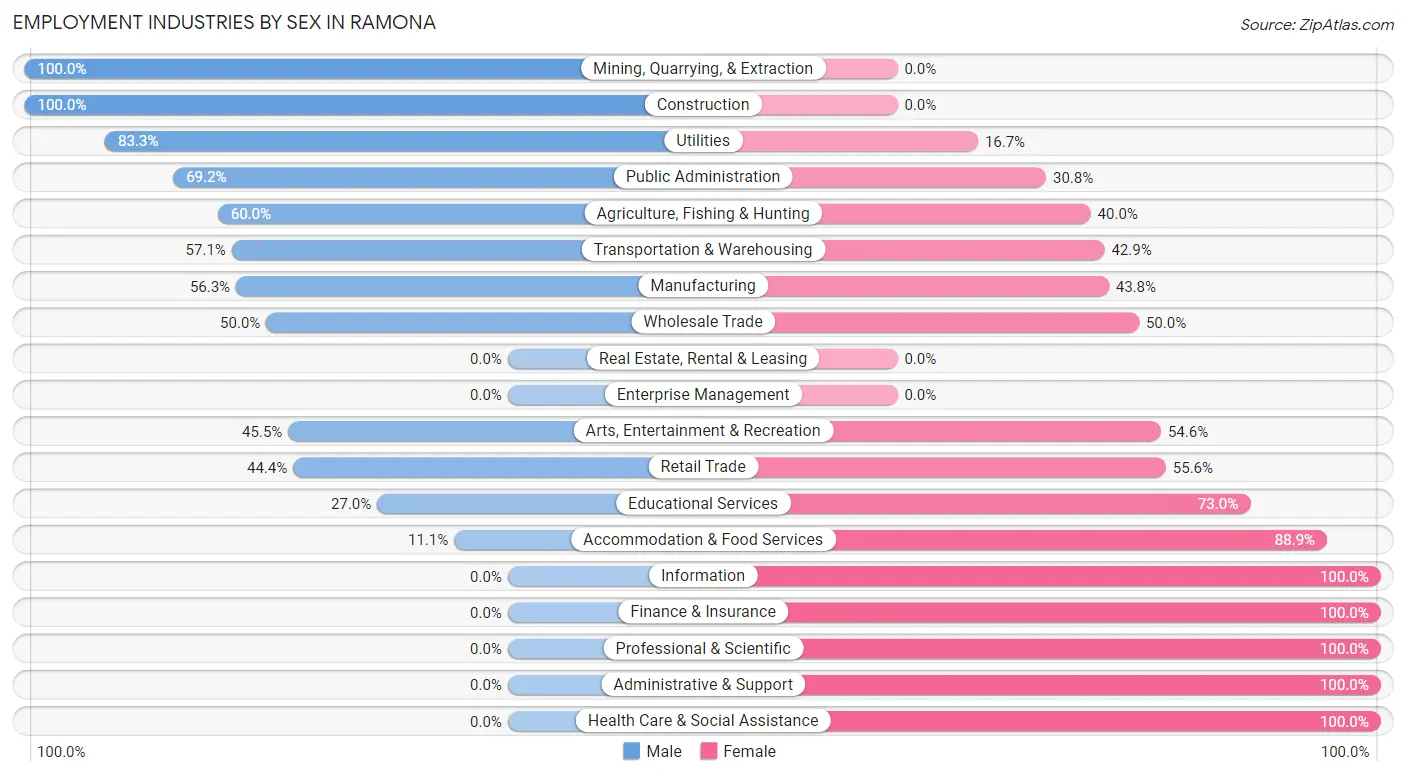
Employment Industries by Sex in Ramona
The Ramona industries that see more men than women are Mining, Quarrying, & Extraction (100.0%), Construction (100.0%), and Utilities (83.3%), whereas the industries that tend to have a higher number of women are Information (100.0%), Finance & Insurance (100.0%), and Professional & Scientific (100.0%).
| Industry | Male | Female |
| Agriculture, Fishing & Hunting | 3 (60.0%) | 2 (40.0%) |
| Mining, Quarrying, & Extraction | 2 (100.0%) | 0 (0.0%) |
| Construction | 28 (100.0%) | 0 (0.0%) |
| Manufacturing | 27 (56.2%) | 21 (43.8%) |
| Wholesale Trade | 2 (50.0%) | 2 (50.0%) |
| Retail Trade | 12 (44.4%) | 15 (55.6%) |
| Transportation & Warehousing | 8 (57.1%) | 6 (42.9%) |
| Utilities | 5 (83.3%) | 1 (16.7%) |
| Information | 0 (0.0%) | 4 (100.0%) |
| Finance & Insurance | 0 (0.0%) | 5 (100.0%) |
| Real Estate, Rental & Leasing | 0 (0.0%) | 0 (0.0%) |
| Professional & Scientific | 0 (0.0%) | 3 (100.0%) |
| Enterprise Management | 0 (0.0%) | 0 (0.0%) |
| Administrative & Support | 0 (0.0%) | 6 (100.0%) |
| Educational Services | 10 (27.0%) | 27 (73.0%) |
| Health Care & Social Assistance | 0 (0.0%) | 45 (100.0%) |
| Arts, Entertainment & Recreation | 5 (45.5%) | 6 (54.5%) |
| Accommodation & Food Services | 2 (11.1%) | 16 (88.9%) |
| Public Administration | 9 (69.2%) | 4 (30.8%) |
| Total | 120 (42.4%) | 163 (57.6%) |
Education in Ramona
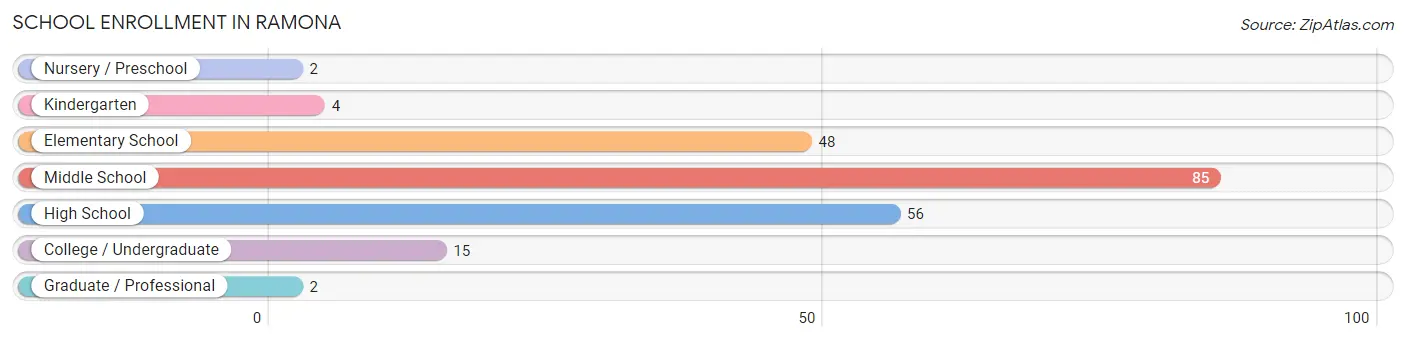
School Enrollment in Ramona
The most common levels of schooling among the 212 students in Ramona are middle school (85 | 40.1%), high school (56 | 26.4%), and elementary school (48 | 22.6%).
| School Level | # Students | % Students |
| Nursery / Preschool | 2 | 0.9% |
| Kindergarten | 4 | 1.9% |
| Elementary School | 48 | 22.6% |
| Middle School | 85 | 40.1% |
| High School | 56 | 26.4% |
| College / Undergraduate | 15 | 7.1% |
| Graduate / Professional | 2 | 0.9% |
| Total | 212 | 100.0% |
School Enrollment by Age by Funding Source in Ramona
Out of a total of 212 students who are enrolled in schools in Ramona, 11 (5.2%) attend a private institution, while the remaining 201 (94.8%) are enrolled in public schools. The age group of 35 years and over has the highest likelihood of being enrolled in private schools, with 3 (60.0% in the age bracket) enrolled. Conversely, the age group of 3 to 4 year olds has the lowest likelihood of being enrolled in a private school, with 2 (100.0% in the age bracket) attending a public institution.
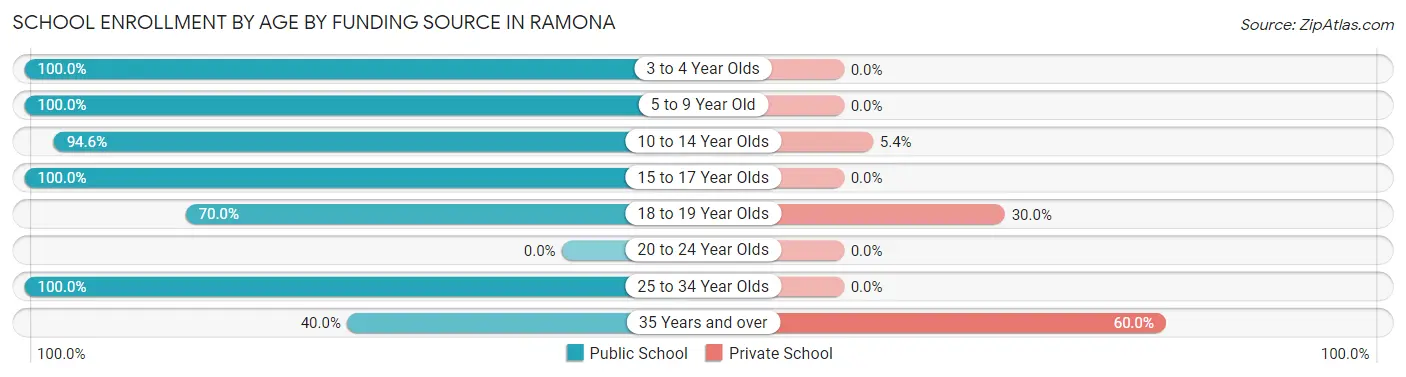
| Age Bracket | Public School | Private School |
| 3 to 4 Year Olds | 2 (100.0%) | 0 (0.0%) |
| 5 to 9 Year Old | 50 (100.0%) | 0 (0.0%) |
| 10 to 14 Year Olds | 87 (94.6%) | 5 (5.4%) |
| 15 to 17 Year Olds | 46 (100.0%) | 0 (0.0%) |
| 18 to 19 Year Olds | 7 (70.0%) | 3 (30.0%) |
| 20 to 24 Year Olds | 0 (0.0%) | 0 (0.0%) |
| 25 to 34 Year Olds | 7 (100.0%) | 0 (0.0%) |
| 35 Years and over | 2 (40.0%) | 3 (60.0%) |
| Total | 201 (94.8%) | 11 (5.2%) |
Educational Attainment by Field of Study in Ramona
Education (7 | 36.8%), liberal arts & history (5 | 26.3%), communications (3 | 15.8%), psychology (2 | 10.5%), and arts & humanities (2 | 10.5%) are the most common fields of study among 19 individuals in Ramona who have obtained a bachelor's degree or higher.
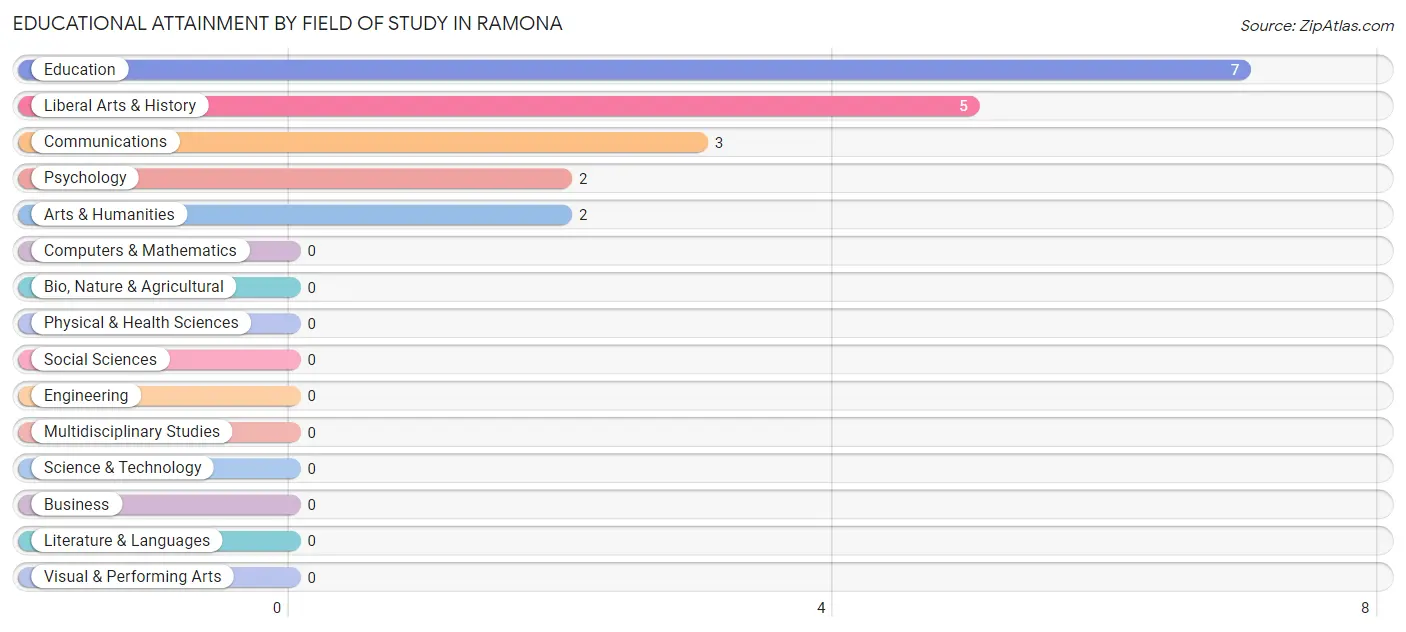
| Field of Study | # Graduates | % Graduates |
| Computers & Mathematics | 0 | 0.0% |
| Bio, Nature & Agricultural | 0 | 0.0% |
| Physical & Health Sciences | 0 | 0.0% |
| Psychology | 2 | 10.5% |
| Social Sciences | 0 | 0.0% |
| Engineering | 0 | 0.0% |
| Multidisciplinary Studies | 0 | 0.0% |
| Science & Technology | 0 | 0.0% |
| Business | 0 | 0.0% |
| Education | 7 | 36.8% |
| Literature & Languages | 0 | 0.0% |
| Liberal Arts & History | 5 | 26.3% |
| Visual & Performing Arts | 0 | 0.0% |
| Communications | 3 | 15.8% |
| Arts & Humanities | 2 | 10.5% |
| Total | 19 | 100.0% |
Transportation & Commute in Ramona
Vehicle Availability by Sex in Ramona
The most prevalent vehicle ownership categories in Ramona are males with 2 vehicles (38, accounting for 32.5%) and females with 2 vehicles (45, making up 24.5%).
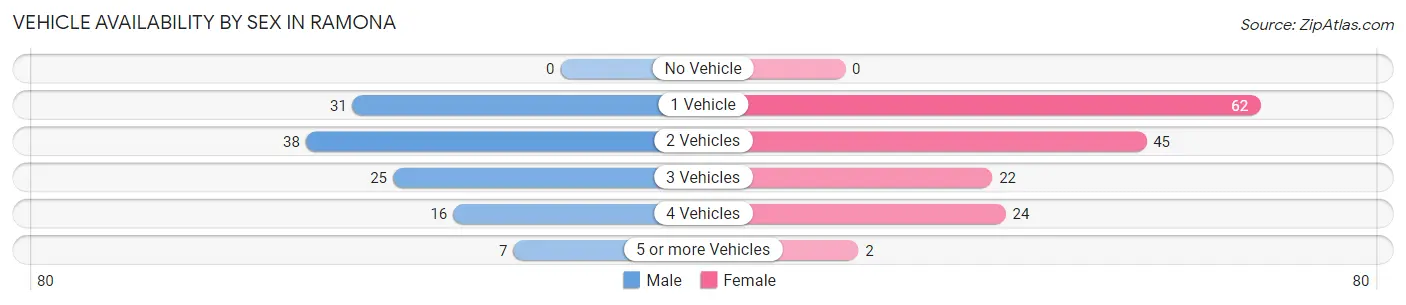
| Vehicles Available | Male | Female |
| No Vehicle | 0 (0.0%) | 0 (0.0%) |
| 1 Vehicle | 31 (26.5%) | 62 (40.0%) |
| 2 Vehicles | 38 (32.5%) | 45 (29.0%) |
| 3 Vehicles | 25 (21.4%) | 22 (14.2%) |
| 4 Vehicles | 16 (13.7%) | 24 (15.5%) |
| 5 or more Vehicles | 7 (6.0%) | 2 (1.3%) |
| Total | 117 (100.0%) | 155 (100.0%) |
Commute Time in Ramona
The most frequently occuring commute durations in Ramona are 20 to 24 minutes (58 commuters, 21.8%), 35 to 39 minutes (37 commuters, 13.9%), and 10 to 14 minutes (36 commuters, 13.5%).
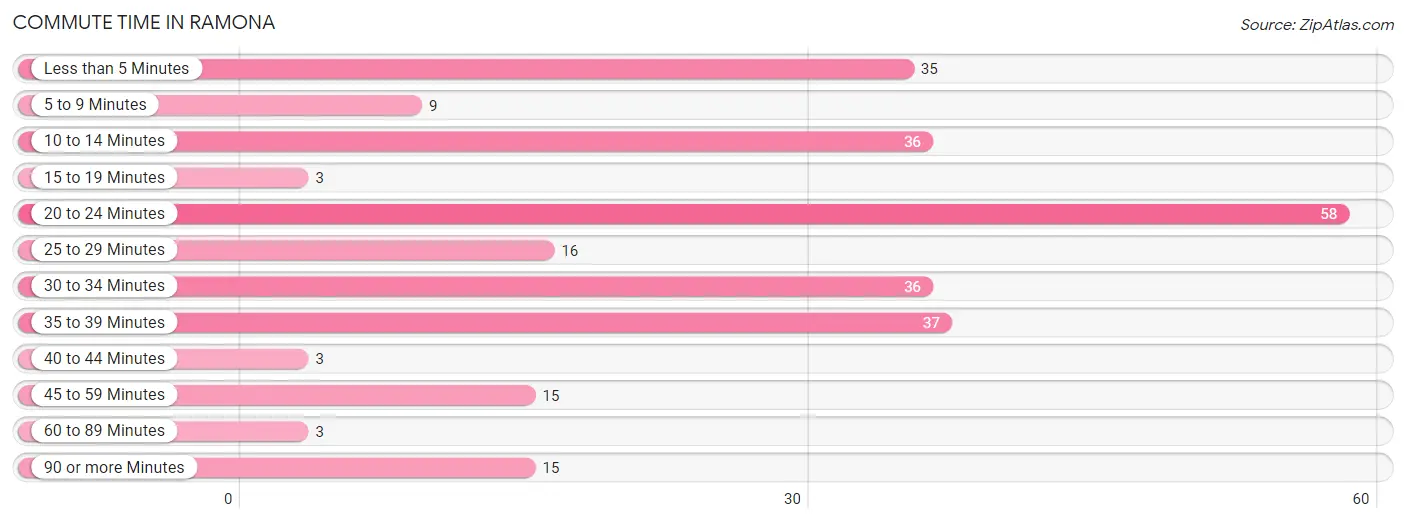
| Commute Time | # Commuters | % Commuters |
| Less than 5 Minutes | 35 | 13.2% |
| 5 to 9 Minutes | 9 | 3.4% |
| 10 to 14 Minutes | 36 | 13.5% |
| 15 to 19 Minutes | 3 | 1.1% |
| 20 to 24 Minutes | 58 | 21.8% |
| 25 to 29 Minutes | 16 | 6.0% |
| 30 to 34 Minutes | 36 | 13.5% |
| 35 to 39 Minutes | 37 | 13.9% |
| 40 to 44 Minutes | 3 | 1.1% |
| 45 to 59 Minutes | 15 | 5.6% |
| 60 to 89 Minutes | 3 | 1.1% |
| 90 or more Minutes | 15 | 5.6% |
Commute Time by Sex in Ramona
The most common commute times in Ramona are 20 to 24 minutes (47 commuters, 40.9%) for males and 35 to 39 minutes (35 commuters, 23.2%) for females.
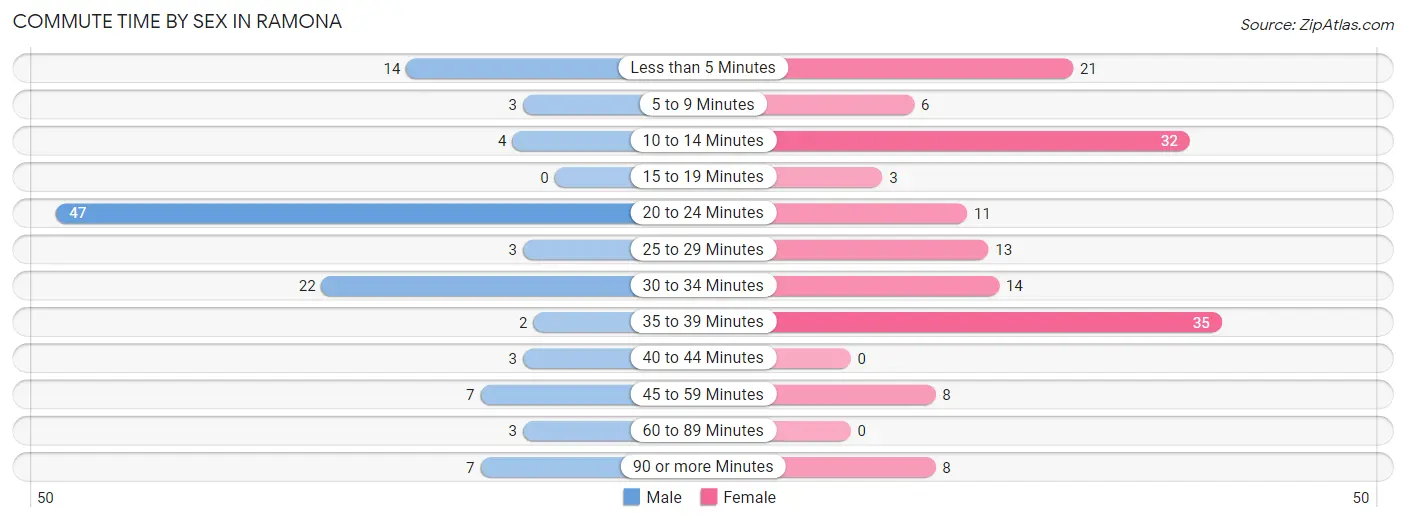
| Commute Time | Male | Female |
| Less than 5 Minutes | 14 (12.2%) | 21 (13.9%) |
| 5 to 9 Minutes | 3 (2.6%) | 6 (4.0%) |
| 10 to 14 Minutes | 4 (3.5%) | 32 (21.2%) |
| 15 to 19 Minutes | 0 (0.0%) | 3 (2.0%) |
| 20 to 24 Minutes | 47 (40.9%) | 11 (7.3%) |
| 25 to 29 Minutes | 3 (2.6%) | 13 (8.6%) |
| 30 to 34 Minutes | 22 (19.1%) | 14 (9.3%) |
| 35 to 39 Minutes | 2 (1.7%) | 35 (23.2%) |
| 40 to 44 Minutes | 3 (2.6%) | 0 (0.0%) |
| 45 to 59 Minutes | 7 (6.1%) | 8 (5.3%) |
| 60 to 89 Minutes | 3 (2.6%) | 0 (0.0%) |
| 90 or more Minutes | 7 (6.1%) | 8 (5.3%) |
Time of Departure to Work by Sex in Ramona
The most frequent times of departure to work in Ramona are 7:00 AM to 7:29 AM (41, 35.6%) for males and 6:00 AM to 6:29 AM (37, 24.5%) for females.
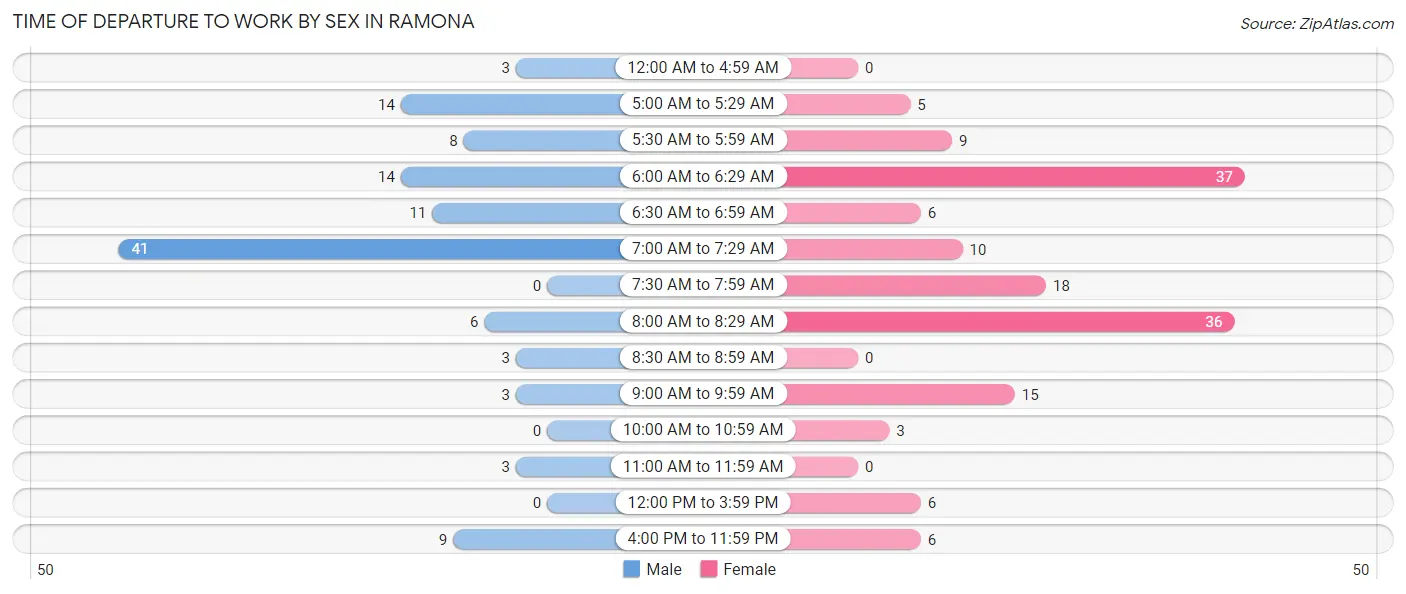
| Time of Departure | Male | Female |
| 12:00 AM to 4:59 AM | 3 (2.6%) | 0 (0.0%) |
| 5:00 AM to 5:29 AM | 14 (12.2%) | 5 (3.3%) |
| 5:30 AM to 5:59 AM | 8 (7.0%) | 9 (6.0%) |
| 6:00 AM to 6:29 AM | 14 (12.2%) | 37 (24.5%) |
| 6:30 AM to 6:59 AM | 11 (9.6%) | 6 (4.0%) |
| 7:00 AM to 7:29 AM | 41 (35.6%) | 10 (6.6%) |
| 7:30 AM to 7:59 AM | 0 (0.0%) | 18 (11.9%) |
| 8:00 AM to 8:29 AM | 6 (5.2%) | 36 (23.8%) |
| 8:30 AM to 8:59 AM | 3 (2.6%) | 0 (0.0%) |
| 9:00 AM to 9:59 AM | 3 (2.6%) | 15 (9.9%) |
| 10:00 AM to 10:59 AM | 0 (0.0%) | 3 (2.0%) |
| 11:00 AM to 11:59 AM | 3 (2.6%) | 0 (0.0%) |
| 12:00 PM to 3:59 PM | 0 (0.0%) | 6 (4.0%) |
| 4:00 PM to 11:59 PM | 9 (7.8%) | 6 (4.0%) |
| Total | 115 (100.0%) | 151 (100.0%) |
Housing Occupancy in Ramona
Occupancy by Ownership in Ramona
Of the total 243 dwellings in Ramona, owner-occupied units account for 167 (68.7%), while renter-occupied units make up 76 (31.3%).
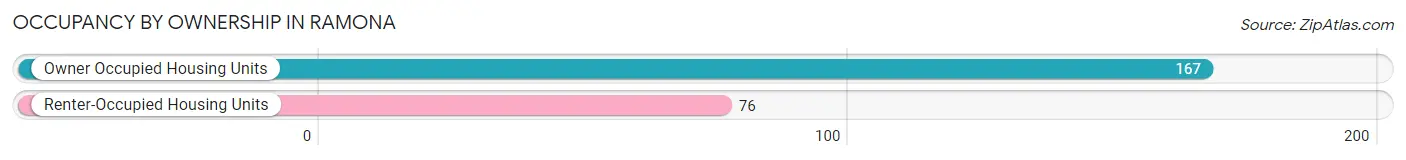
| Occupancy | # Housing Units | % Housing Units |
| Owner Occupied Housing Units | 167 | 68.7% |
| Renter-Occupied Housing Units | 76 | 31.3% |
| Total Occupied Housing Units | 243 | 100.0% |
Occupancy by Household Size in Ramona
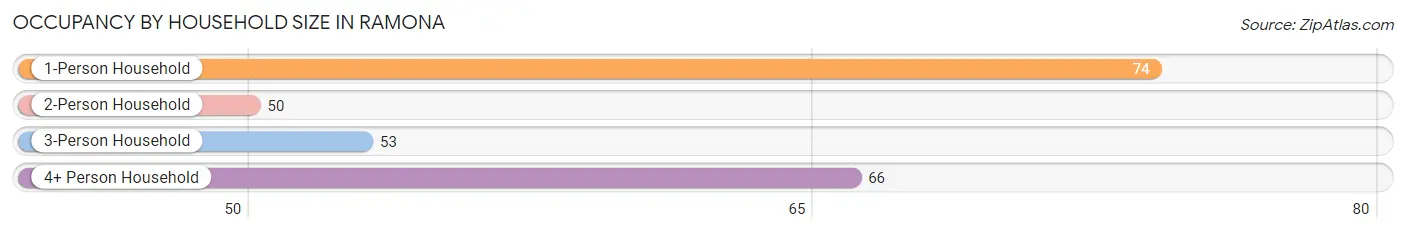
| Household Size | # Housing Units | % Housing Units |
| 1-Person Household | 74 | 30.4% |
| 2-Person Household | 50 | 20.6% |
| 3-Person Household | 53 | 21.8% |
| 4+ Person Household | 66 | 27.2% |
| Total Housing Units | 243 | 100.0% |
Occupancy by Ownership by Household Size in Ramona
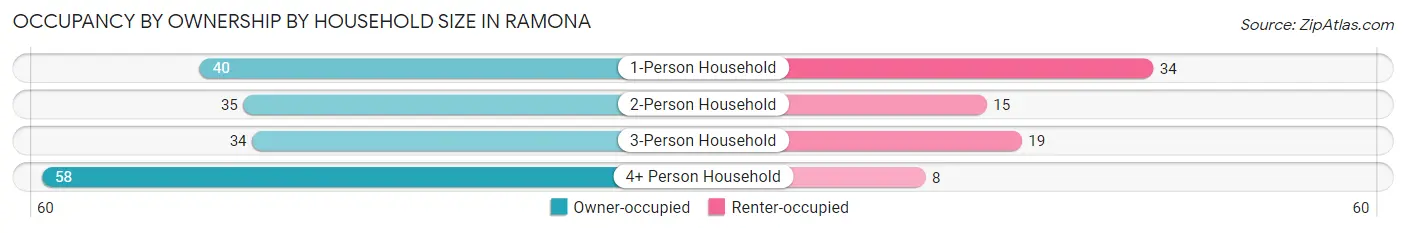
| Household Size | Owner-occupied | Renter-occupied |
| 1-Person Household | 40 (54.0%) | 34 (46.0%) |
| 2-Person Household | 35 (70.0%) | 15 (30.0%) |
| 3-Person Household | 34 (64.1%) | 19 (35.8%) |
| 4+ Person Household | 58 (87.9%) | 8 (12.1%) |
| Total Housing Units | 167 (68.7%) | 76 (31.3%) |
Occupancy by Educational Attainment in Ramona
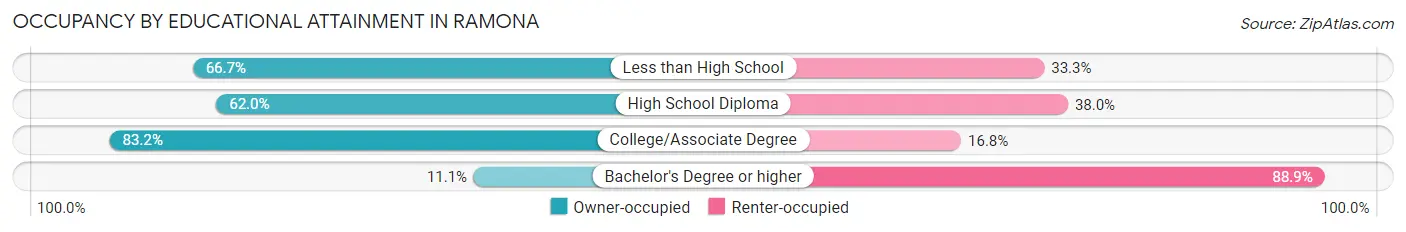
| Household Size | Owner-occupied | Renter-occupied |
| Less than High School | 12 (66.7%) | 6 (33.3%) |
| High School Diploma | 75 (62.0%) | 46 (38.0%) |
| College/Associate Degree | 79 (83.2%) | 16 (16.8%) |
| Bachelor's Degree or higher | 1 (11.1%) | 8 (88.9%) |
Occupancy by Age of Householder in Ramona
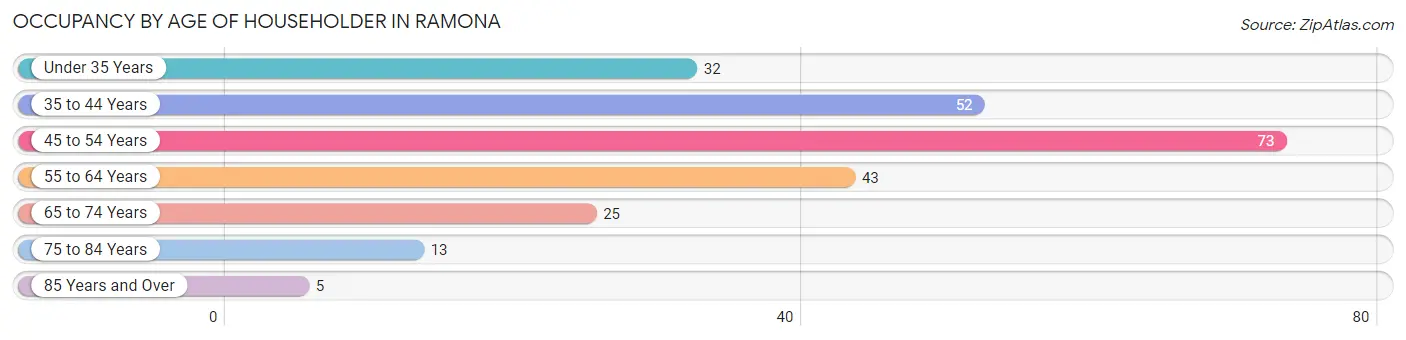
| Age Bracket | # Households | % Households |
| Under 35 Years | 32 | 13.2% |
| 35 to 44 Years | 52 | 21.4% |
| 45 to 54 Years | 73 | 30.0% |
| 55 to 64 Years | 43 | 17.7% |
| 65 to 74 Years | 25 | 10.3% |
| 75 to 84 Years | 13 | 5.3% |
| 85 Years and Over | 5 | 2.1% |
| Total | 243 | 100.0% |
Housing Finances in Ramona
Median Income by Occupancy in Ramona
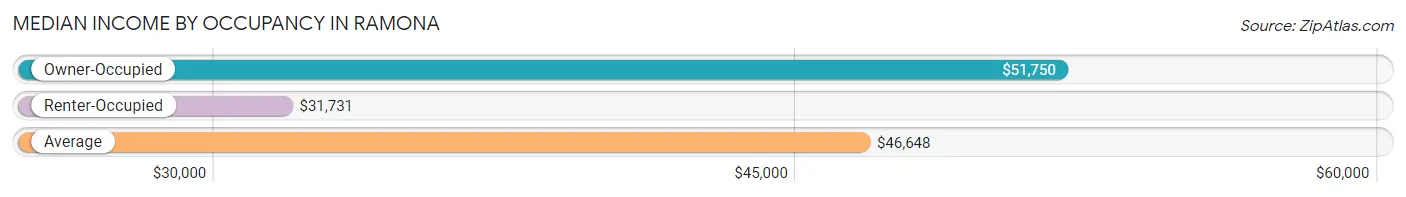
| Occupancy Type | # Households | Median Income |
| Owner-Occupied | 167 (68.7%) | $51,750 |
| Renter-Occupied | 76 (31.3%) | $31,731 |
| Average | 243 (100.0%) | $46,648 |
Occupancy by Householder Income Bracket in Ramona
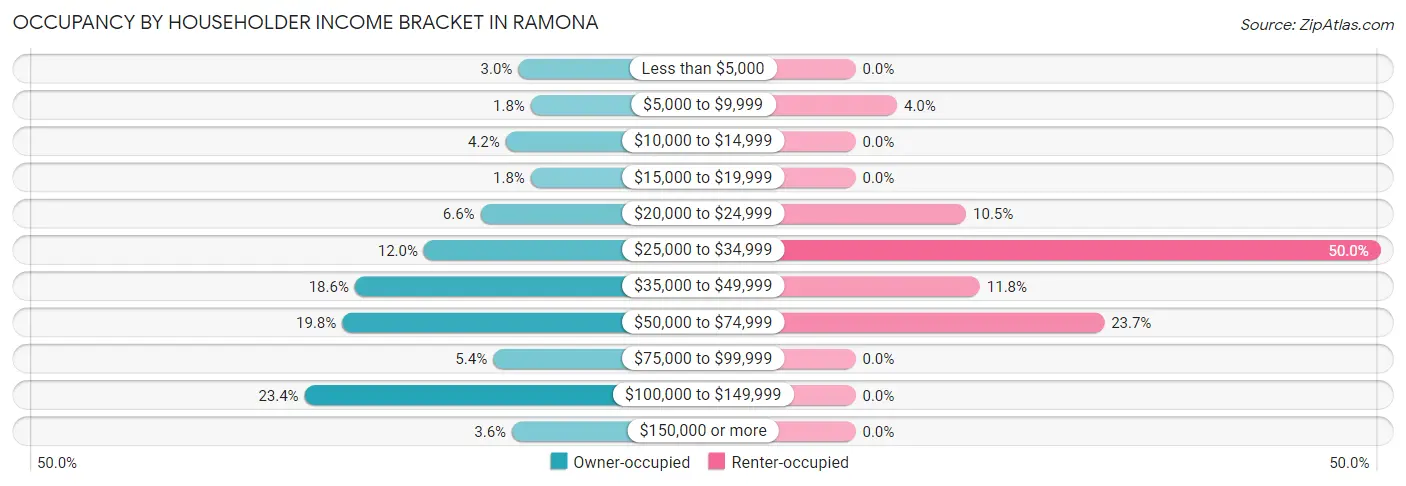
| Income Bracket | Owner-occupied | Renter-occupied |
| Less than $5,000 | 5 (3.0%) | 0 (0.0%) |
| $5,000 to $9,999 | 3 (1.8%) | 3 (4.0%) |
| $10,000 to $14,999 | 7 (4.2%) | 0 (0.0%) |
| $15,000 to $19,999 | 3 (1.8%) | 0 (0.0%) |
| $20,000 to $24,999 | 11 (6.6%) | 8 (10.5%) |
| $25,000 to $34,999 | 20 (12.0%) | 38 (50.0%) |
| $35,000 to $49,999 | 31 (18.6%) | 9 (11.8%) |
| $50,000 to $74,999 | 33 (19.8%) | 18 (23.7%) |
| $75,000 to $99,999 | 9 (5.4%) | 0 (0.0%) |
| $100,000 to $149,999 | 39 (23.4%) | 0 (0.0%) |
| $150,000 or more | 6 (3.6%) | 0 (0.0%) |
| Total | 167 (100.0%) | 76 (100.0%) |
Monthly Housing Cost Tiers in Ramona
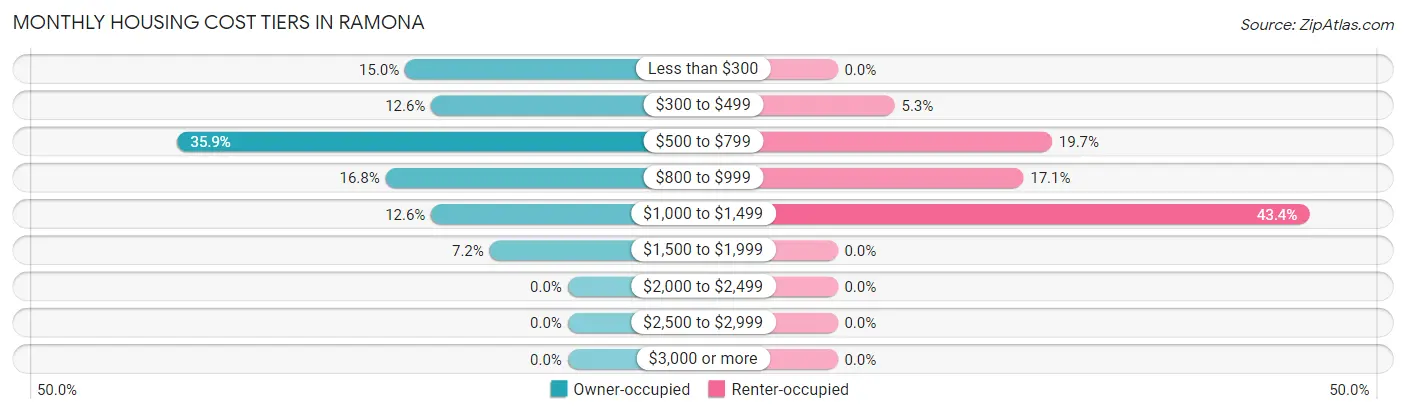
| Monthly Cost | Owner-occupied | Renter-occupied |
| Less than $300 | 25 (15.0%) | 0 (0.0%) |
| $300 to $499 | 21 (12.6%) | 4 (5.3%) |
| $500 to $799 | 60 (35.9%) | 15 (19.7%) |
| $800 to $999 | 28 (16.8%) | 13 (17.1%) |
| $1,000 to $1,499 | 21 (12.6%) | 33 (43.4%) |
| $1,500 to $1,999 | 12 (7.2%) | 0 (0.0%) |
| $2,000 to $2,499 | 0 (0.0%) | 0 (0.0%) |
| $2,500 to $2,999 | 0 (0.0%) | 0 (0.0%) |
| $3,000 or more | 0 (0.0%) | 0 (0.0%) |
| Total | 167 (100.0%) | 76 (100.0%) |
Physical Housing Characteristics in Ramona
Housing Structures in Ramona
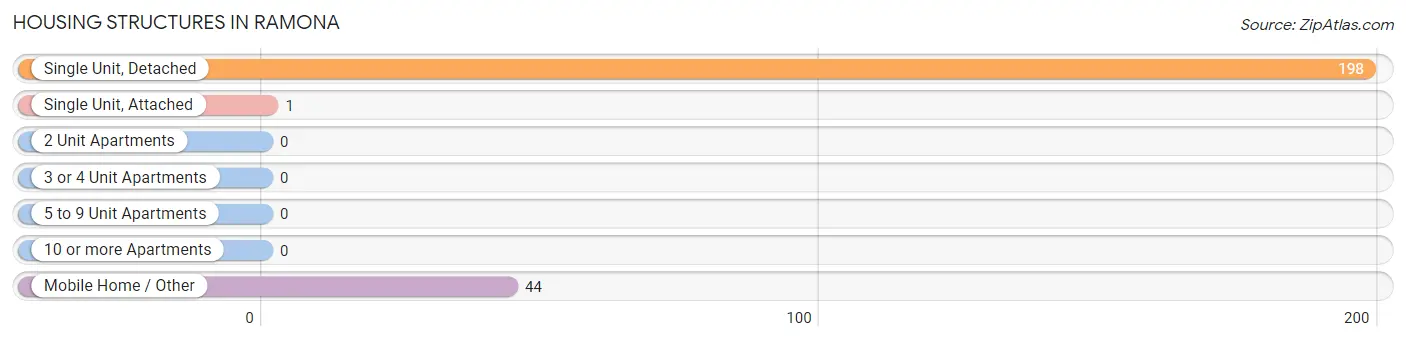
| Structure Type | # Housing Units | % Housing Units |
| Single Unit, Detached | 198 | 81.5% |
| Single Unit, Attached | 1 | 0.4% |
| 2 Unit Apartments | 0 | 0.0% |
| 3 or 4 Unit Apartments | 0 | 0.0% |
| 5 to 9 Unit Apartments | 0 | 0.0% |
| 10 or more Apartments | 0 | 0.0% |
| Mobile Home / Other | 44 | 18.1% |
| Total | 243 | 100.0% |
Housing Structures by Occupancy in Ramona
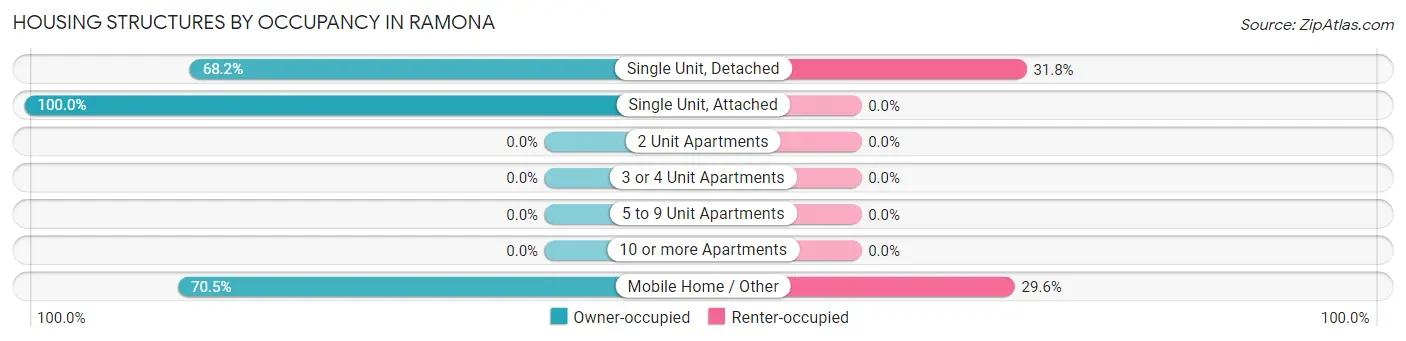
| Structure Type | Owner-occupied | Renter-occupied |
| Single Unit, Detached | 135 (68.2%) | 63 (31.8%) |
| Single Unit, Attached | 1 (100.0%) | 0 (0.0%) |
| 2 Unit Apartments | 0 (0.0%) | 0 (0.0%) |
| 3 or 4 Unit Apartments | 0 (0.0%) | 0 (0.0%) |
| 5 to 9 Unit Apartments | 0 (0.0%) | 0 (0.0%) |
| 10 or more Apartments | 0 (0.0%) | 0 (0.0%) |
| Mobile Home / Other | 31 (70.5%) | 13 (29.5%) |
| Total | 167 (68.7%) | 76 (31.3%) |
Housing Structures by Number of Rooms in Ramona
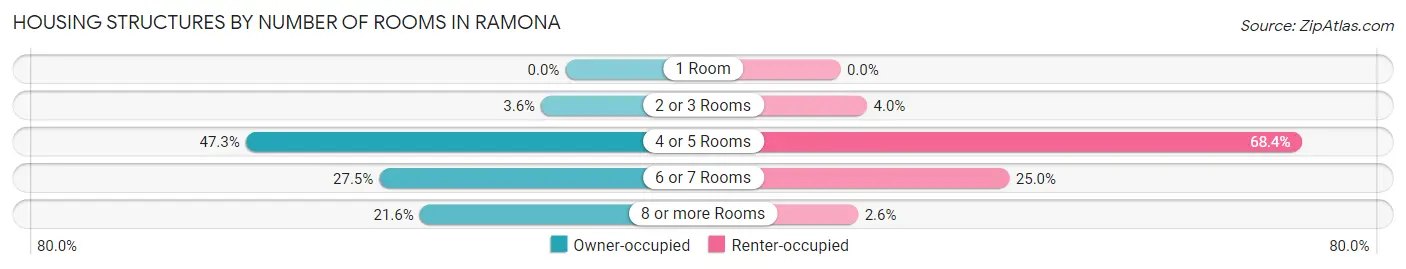
| Number of Rooms | Owner-occupied | Renter-occupied |
| 1 Room | 0 (0.0%) | 0 (0.0%) |
| 2 or 3 Rooms | 6 (3.6%) | 3 (4.0%) |
| 4 or 5 Rooms | 79 (47.3%) | 52 (68.4%) |
| 6 or 7 Rooms | 46 (27.5%) | 19 (25.0%) |
| 8 or more Rooms | 36 (21.6%) | 2 (2.6%) |
| Total | 167 (100.0%) | 76 (100.0%) |
Housing Structure by Heating Type in Ramona
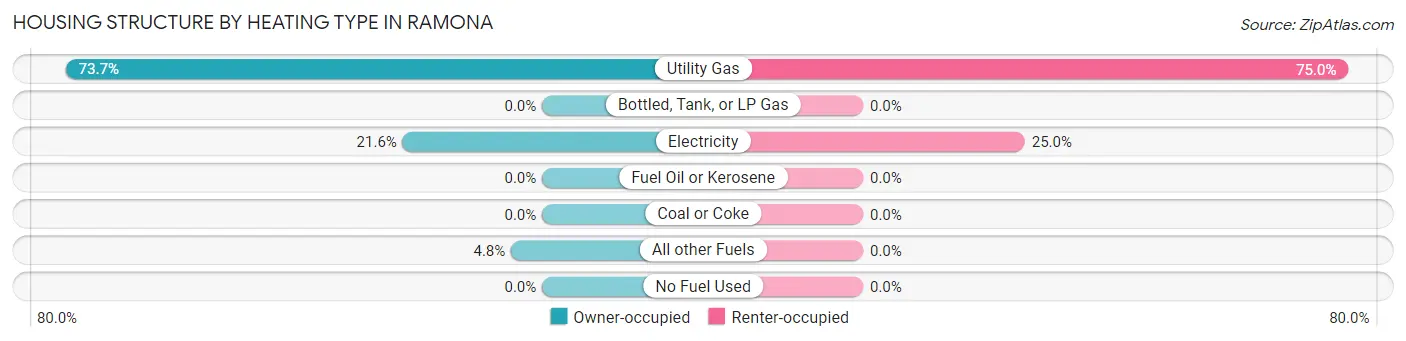
| Heating Type | Owner-occupied | Renter-occupied |
| Utility Gas | 123 (73.7%) | 57 (75.0%) |
| Bottled, Tank, or LP Gas | 0 (0.0%) | 0 (0.0%) |
| Electricity | 36 (21.6%) | 19 (25.0%) |
| Fuel Oil or Kerosene | 0 (0.0%) | 0 (0.0%) |
| Coal or Coke | 0 (0.0%) | 0 (0.0%) |
| All other Fuels | 8 (4.8%) | 0 (0.0%) |
| No Fuel Used | 0 (0.0%) | 0 (0.0%) |
| Total | 167 (100.0%) | 76 (100.0%) |
Household Vehicle Usage in Ramona
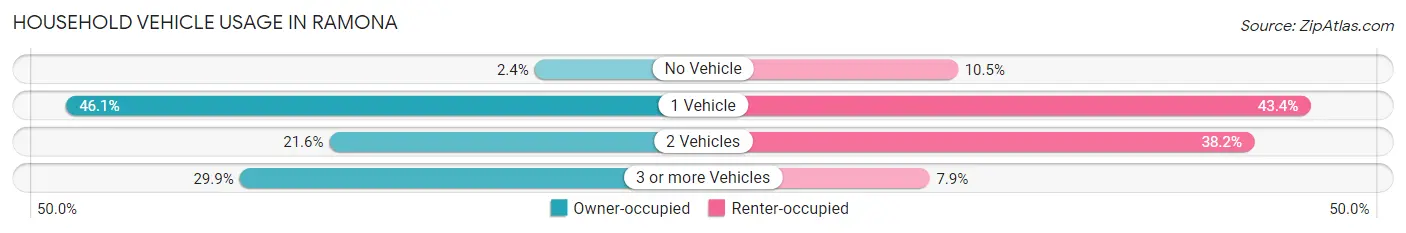
| Vehicles per Household | Owner-occupied | Renter-occupied |
| No Vehicle | 4 (2.4%) | 8 (10.5%) |
| 1 Vehicle | 77 (46.1%) | 33 (43.4%) |
| 2 Vehicles | 36 (21.6%) | 29 (38.2%) |
| 3 or more Vehicles | 50 (29.9%) | 6 (7.9%) |
| Total | 167 (100.0%) | 76 (100.0%) |
Real Estate & Mortgages in Ramona
Real Estate and Mortgage Overview in Ramona
| Characteristic | Without Mortgage | With Mortgage |
| Housing Units | 66 | 101 |
| Median Property Value | - | - |
| Median Household Income | $44,167 | $4 |
| Monthly Housing Costs | $419 | $0 |
| Real Estate Taxes | $409 | $6 |
Property Value by Mortgage Status in Ramona
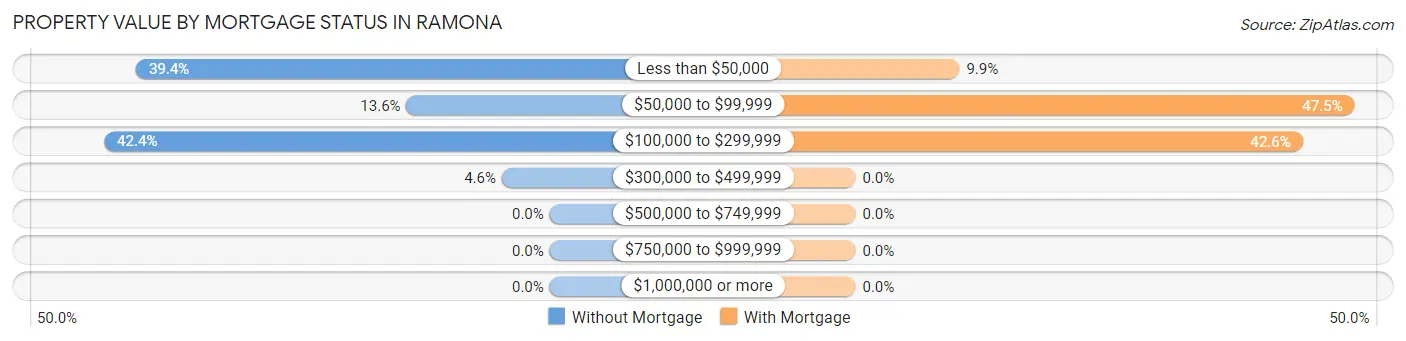
| Property Value | Without Mortgage | With Mortgage |
| Less than $50,000 | 26 (39.4%) | 10 (9.9%) |
| $50,000 to $99,999 | 9 (13.6%) | 48 (47.5%) |
| $100,000 to $299,999 | 28 (42.4%) | 43 (42.6%) |
| $300,000 to $499,999 | 3 (4.5%) | 0 (0.0%) |
| $500,000 to $749,999 | 0 (0.0%) | 0 (0.0%) |
| $750,000 to $999,999 | 0 (0.0%) | 0 (0.0%) |
| $1,000,000 or more | 0 (0.0%) | 0 (0.0%) |
| Total | 66 (100.0%) | 101 (100.0%) |
Household Income by Mortgage Status in Ramona
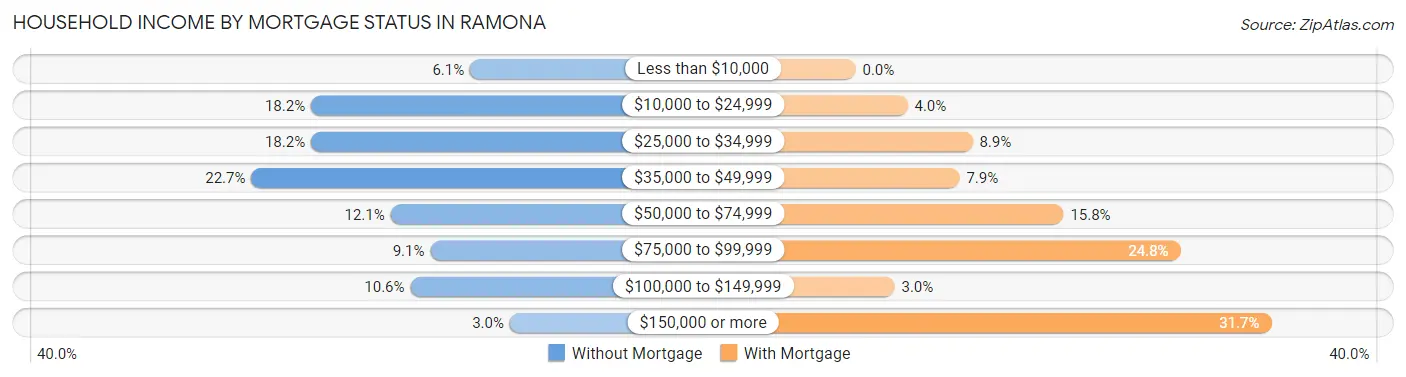
| Household Income | Without Mortgage | With Mortgage |
| Less than $10,000 | 4 (6.1%) | 0 (0.0%) |
| $10,000 to $24,999 | 12 (18.2%) | 4 (4.0%) |
| $25,000 to $34,999 | 12 (18.2%) | 9 (8.9%) |
| $35,000 to $49,999 | 15 (22.7%) | 8 (7.9%) |
| $50,000 to $74,999 | 8 (12.1%) | 16 (15.8%) |
| $75,000 to $99,999 | 6 (9.1%) | 25 (24.7%) |
| $100,000 to $149,999 | 7 (10.6%) | 3 (3.0%) |
| $150,000 or more | 2 (3.0%) | 32 (31.7%) |
| Total | 66 (100.0%) | 101 (100.0%) |
Property Value to Household Income Ratio in Ramona
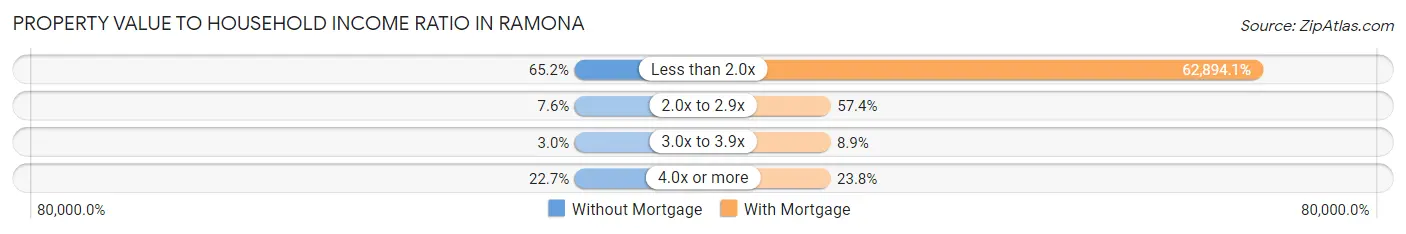
| Value-to-Income Ratio | Without Mortgage | With Mortgage |
| Less than 2.0x | 43 (65.1%) | 63,523 (62,894.1%) |
| 2.0x to 2.9x | 5 (7.6%) | 58 (57.4%) |
| 3.0x to 3.9x | 2 (3.0%) | 9 (8.9%) |
| 4.0x or more | 15 (22.7%) | 24 (23.8%) |
| Total | 66 (100.0%) | 101 (100.0%) |
Real Estate Taxes by Mortgage Status in Ramona
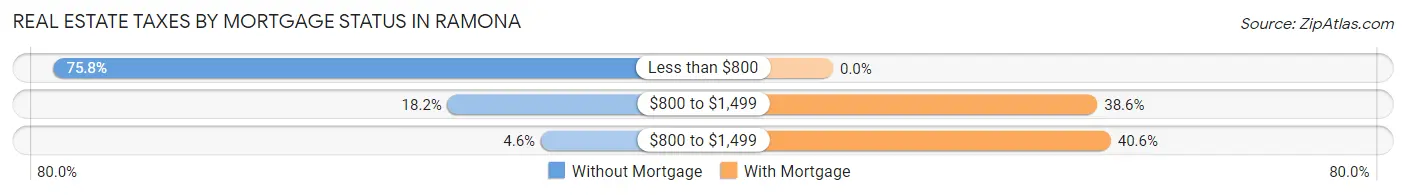
| Property Taxes | Without Mortgage | With Mortgage |
| Less than $800 | 50 (75.8%) | 0 (0.0%) |
| $800 to $1,499 | 12 (18.2%) | 39 (38.6%) |
| $800 to $1,499 | 3 (4.5%) | 41 (40.6%) |
| Total | 66 (100.0%) | 101 (100.0%) |
Health & Disability in Ramona
Health Insurance Coverage by Age in Ramona
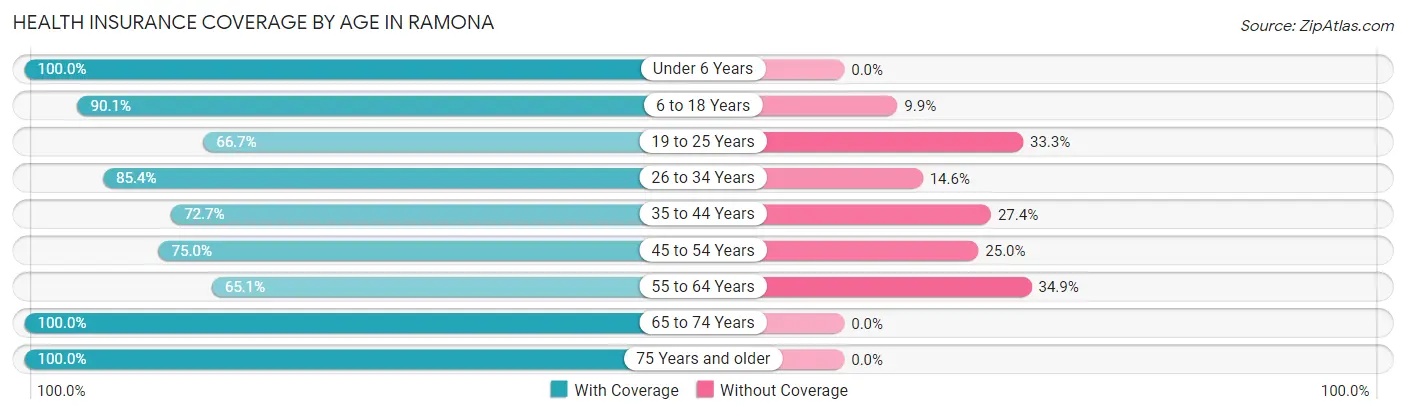
| Age Bracket | With Coverage | Without Coverage |
| Under 6 Years | 12 (100.0%) | 0 (0.0%) |
| 6 to 18 Years | 173 (90.1%) | 19 (9.9%) |
| 19 to 25 Years | 30 (66.7%) | 15 (33.3%) |
| 26 to 34 Years | 70 (85.4%) | 12 (14.6%) |
| 35 to 44 Years | 85 (72.7%) | 32 (27.4%) |
| 45 to 54 Years | 87 (75.0%) | 29 (25.0%) |
| 55 to 64 Years | 41 (65.1%) | 22 (34.9%) |
| 65 to 74 Years | 39 (100.0%) | 0 (0.0%) |
| 75 Years and older | 31 (100.0%) | 0 (0.0%) |
| Total | 568 (81.5%) | 129 (18.5%) |
Health Insurance Coverage by Citizenship Status in Ramona
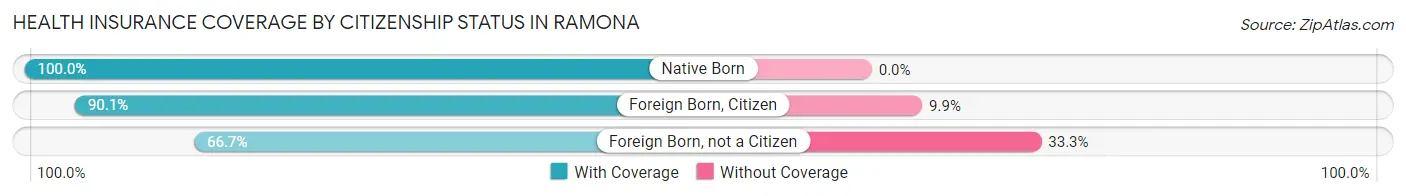
| Citizenship Status | With Coverage | Without Coverage |
| Native Born | 12 (100.0%) | 0 (0.0%) |
| Foreign Born, Citizen | 173 (90.1%) | 19 (9.9%) |
| Foreign Born, not a Citizen | 30 (66.7%) | 15 (33.3%) |
Health Insurance Coverage by Household Income in Ramona
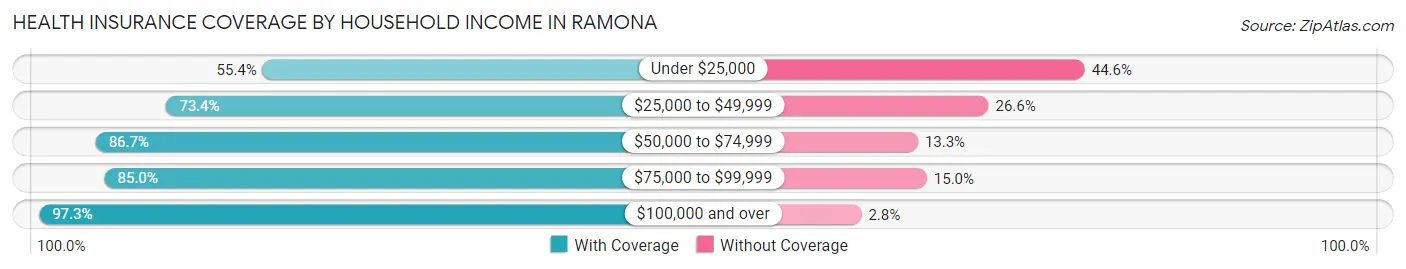
| Household Income | With Coverage | Without Coverage |
| Under $25,000 | 41 (55.4%) | 33 (44.6%) |
| $25,000 to $49,999 | 177 (73.4%) | 64 (26.6%) |
| $50,000 to $74,999 | 156 (86.7%) | 24 (13.3%) |
| $75,000 to $99,999 | 17 (85.0%) | 3 (15.0%) |
| $100,000 and over | 177 (97.3%) | 5 (2.8%) |
Public vs Private Health Insurance Coverage by Age in Ramona
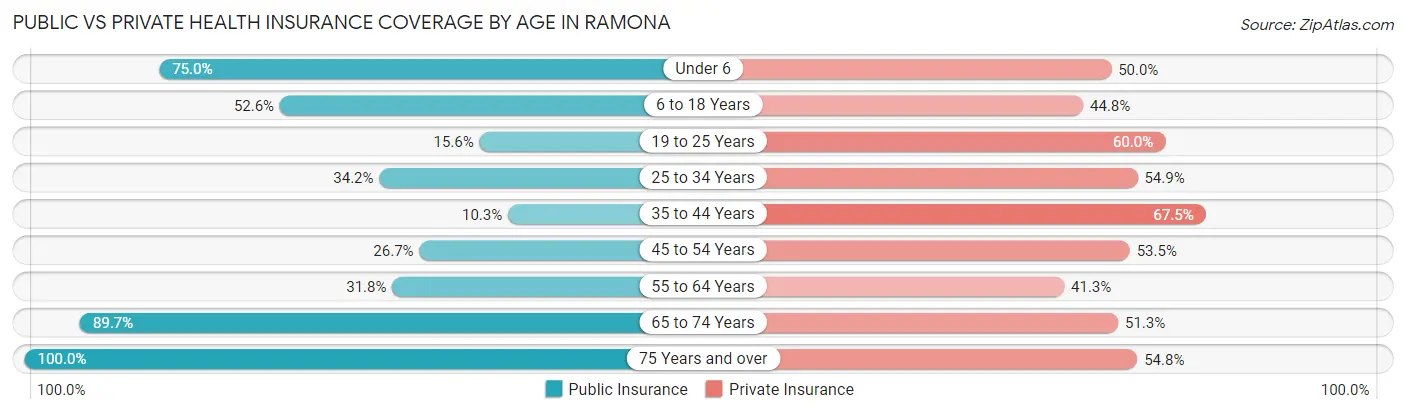
| Age Bracket | Public Insurance | Private Insurance |
| Under 6 | 9 (75.0%) | 6 (50.0%) |
| 6 to 18 Years | 101 (52.6%) | 86 (44.8%) |
| 19 to 25 Years | 7 (15.6%) | 27 (60.0%) |
| 25 to 34 Years | 28 (34.2%) | 45 (54.9%) |
| 35 to 44 Years | 12 (10.3%) | 79 (67.5%) |
| 45 to 54 Years | 31 (26.7%) | 62 (53.4%) |
| 55 to 64 Years | 20 (31.8%) | 26 (41.3%) |
| 65 to 74 Years | 35 (89.7%) | 20 (51.3%) |
| 75 Years and over | 31 (100.0%) | 17 (54.8%) |
| Total | 274 (39.3%) | 368 (52.8%) |
Disability Status by Sex by Age in Ramona
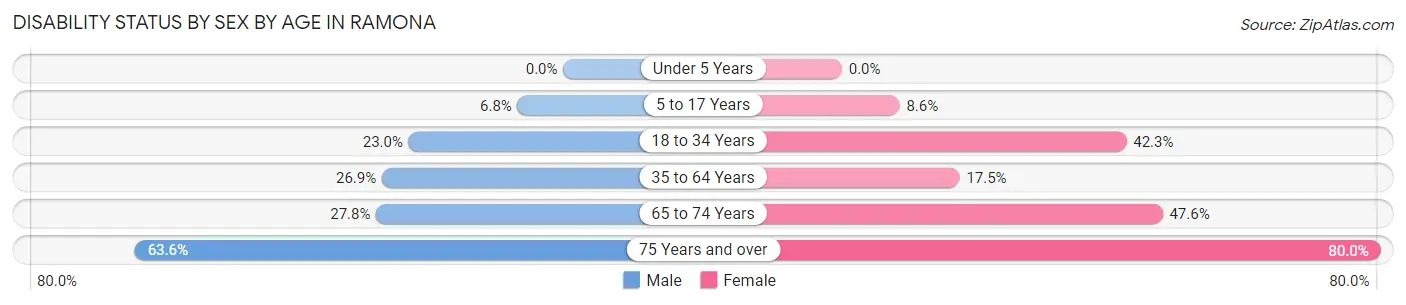
| Age Bracket | Male | Female |
| Under 5 Years | 0 (0.0%) | 0 (0.0%) |
| 5 to 17 Years | 8 (6.8%) | 6 (8.6%) |
| 18 to 34 Years | 14 (23.0%) | 30 (42.2%) |
| 35 to 64 Years | 35 (26.9%) | 29 (17.5%) |
| 65 to 74 Years | 5 (27.8%) | 10 (47.6%) |
| 75 Years and over | 7 (63.6%) | 16 (80.0%) |
Disability Class by Sex by Age in Ramona
Disability Class: Hearing Difficulty
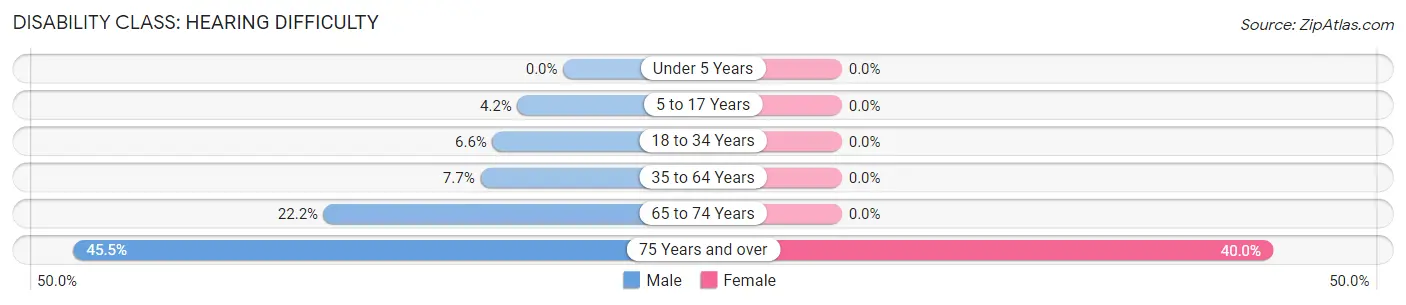
| Age Bracket | Male | Female |
| Under 5 Years | 0 (0.0%) | 0 (0.0%) |
| 5 to 17 Years | 5 (4.2%) | 0 (0.0%) |
| 18 to 34 Years | 4 (6.6%) | 0 (0.0%) |
| 35 to 64 Years | 10 (7.7%) | 0 (0.0%) |
| 65 to 74 Years | 4 (22.2%) | 0 (0.0%) |
| 75 Years and over | 5 (45.5%) | 8 (40.0%) |
Disability Class: Vision Difficulty
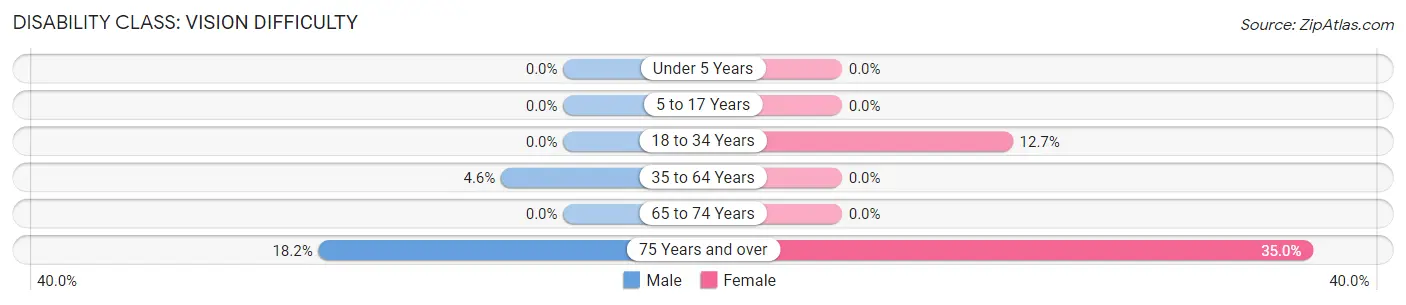
| Age Bracket | Male | Female |
| Under 5 Years | 0 (0.0%) | 0 (0.0%) |
| 5 to 17 Years | 0 (0.0%) | 0 (0.0%) |
| 18 to 34 Years | 0 (0.0%) | 9 (12.7%) |
| 35 to 64 Years | 6 (4.6%) | 0 (0.0%) |
| 65 to 74 Years | 0 (0.0%) | 0 (0.0%) |
| 75 Years and over | 2 (18.2%) | 7 (35.0%) |
Disability Class: Cognitive Difficulty
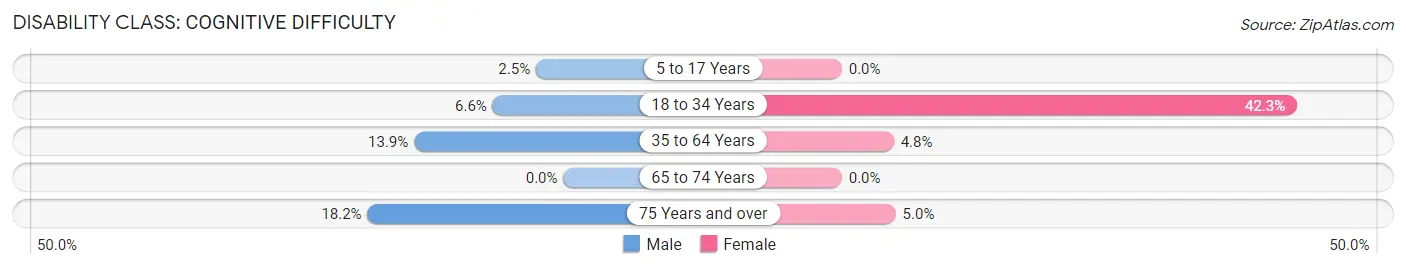
| Age Bracket | Male | Female |
| 5 to 17 Years | 3 (2.5%) | 0 (0.0%) |
| 18 to 34 Years | 4 (6.6%) | 30 (42.2%) |
| 35 to 64 Years | 18 (13.9%) | 8 (4.8%) |
| 65 to 74 Years | 0 (0.0%) | 0 (0.0%) |
| 75 Years and over | 2 (18.2%) | 1 (5.0%) |
Disability Class: Ambulatory Difficulty
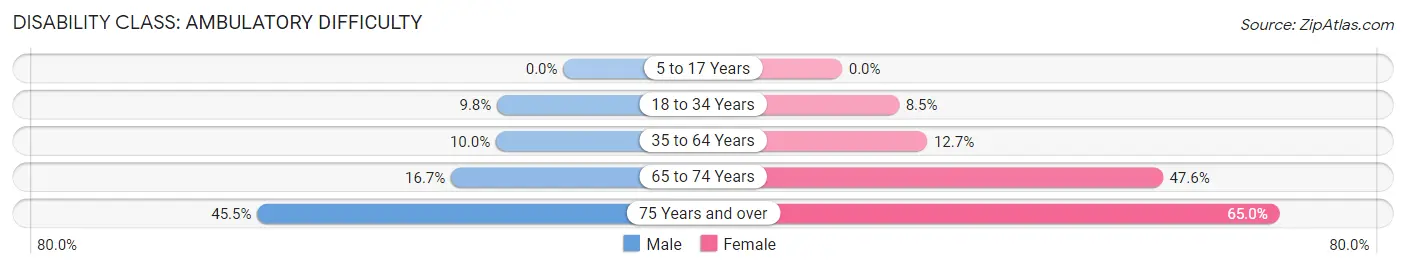
| Age Bracket | Male | Female |
| 5 to 17 Years | 0 (0.0%) | 0 (0.0%) |
| 18 to 34 Years | 6 (9.8%) | 6 (8.5%) |
| 35 to 64 Years | 13 (10.0%) | 21 (12.7%) |
| 65 to 74 Years | 3 (16.7%) | 10 (47.6%) |
| 75 Years and over | 5 (45.5%) | 13 (65.0%) |
Disability Class: Self-Care Difficulty
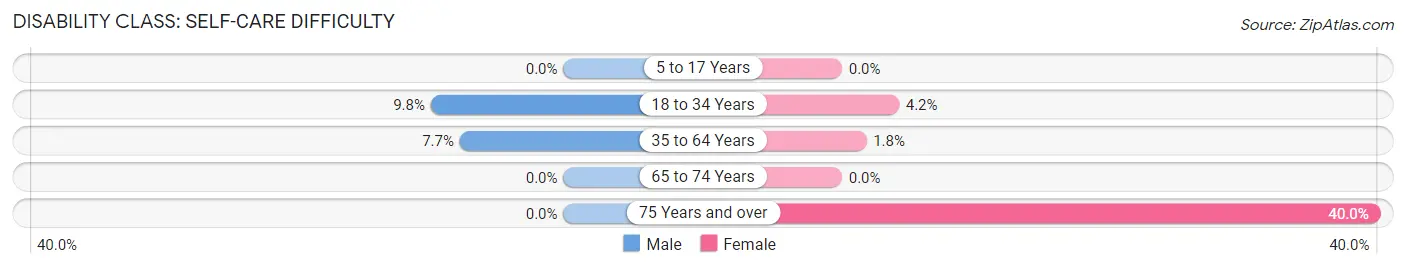
| Age Bracket | Male | Female |
| 5 to 17 Years | 0 (0.0%) | 0 (0.0%) |
| 18 to 34 Years | 6 (9.8%) | 3 (4.2%) |
| 35 to 64 Years | 10 (7.7%) | 3 (1.8%) |
| 65 to 74 Years | 0 (0.0%) | 0 (0.0%) |
| 75 Years and over | 0 (0.0%) | 8 (40.0%) |
Technology Access in Ramona
Computing Device Access in Ramona
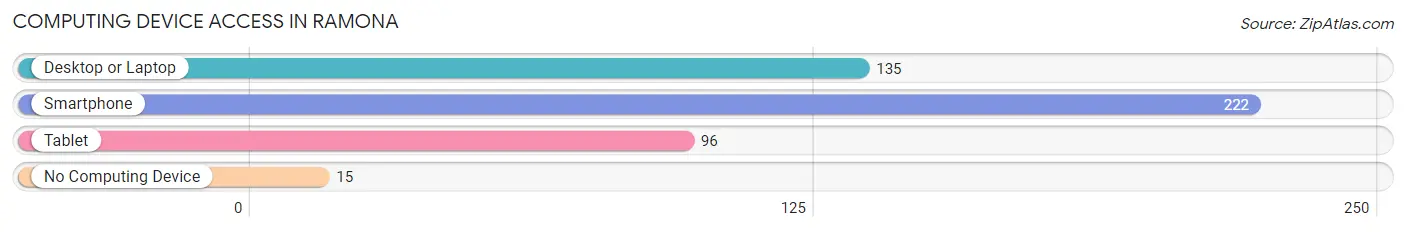
| Device Type | # Households | % Households |
| Desktop or Laptop | 135 | 55.6% |
| Smartphone | 222 | 91.4% |
| Tablet | 96 | 39.5% |
| No Computing Device | 15 | 6.2% |
| Total | 243 | 100.0% |
Internet Access in Ramona
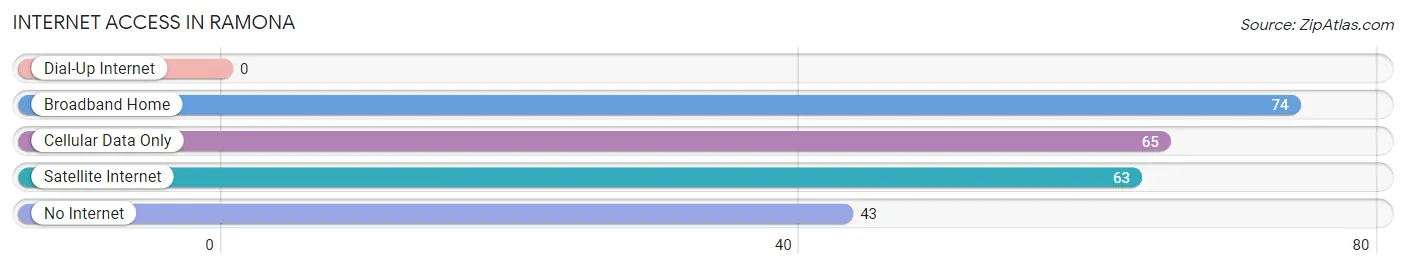
| Internet Type | # Households | % Households |
| Dial-Up Internet | 0 | 0.0% |
| Broadband Home | 74 | 30.4% |
| Cellular Data Only | 65 | 26.8% |
| Satellite Internet | 63 | 25.9% |
| No Internet | 43 | 17.7% |
| Total | 243 | 100.0% |
Ramona Summary
Ramona, Oklahoma is a small town located in the northeastern corner of Washington County, Oklahoma. It is situated on the banks of the Cimarron River, approximately 20 miles south of Bartlesville and 25 miles north of Tulsa. The town was founded in 1891 and was named after the daughter of the first postmaster, John W. Smith.
History
The area around Ramona was first settled in the late 1800s by settlers from the Cherokee Nation. The town was officially founded in 1891 and was named after the daughter of the first postmaster, John W. Smith. The town was originally located on the east side of the Cimarron River, but was moved to the west side in 1895 due to flooding.
In the early 1900s, Ramona was a thriving agricultural community. The town was home to several cotton gins, a flour mill, a cottonseed oil mill, and a lumber mill. The town also had a hotel, a bank, a newspaper, and several stores.
In the 1920s, the town began to decline due to the Great Depression and the Dust Bowl. Many of the businesses closed and the population decreased. The town was further impacted by the construction of the Keystone Dam in the 1950s, which flooded much of the surrounding area.
Geography
Ramona is located in the northeastern corner of Washington County, Oklahoma. It is situated on the banks of the Cimarron River, approximately 20 miles south of Bartlesville and 25 miles north of Tulsa. The town is located in the Osage Plains region of Oklahoma, which is characterized by rolling hills and grassy plains.
The climate in Ramona is generally mild, with hot summers and cold winters. The average annual temperature is around 60 degrees Fahrenheit. The average annual precipitation is around 40 inches.
Economy
The economy of Ramona is largely based on agriculture. The town is home to several farms and ranches, which produce a variety of crops, including wheat, corn, soybeans, and cotton. The town also has several businesses, including a grocery store, a hardware store, and a restaurant.
Demographics
As of the 2010 census, the population of Ramona was 1,093. The racial makeup of the town was 95.3% White, 0.7% African American, 0.7% Native American, 0.3% Asian, and 2.9% from other races. The median household income was $35,625.
Conclusion
Ramona, Oklahoma is a small town located in the northeastern corner of Washington County, Oklahoma. It was founded in 1891 and was named after the daughter of the first postmaster, John W. Smith. The town is situated on the banks of the Cimarron River and is home to several farms and ranches. The economy of Ramona is largely based on agriculture, and the population of the town was 1,093 as of the 2010 census.
Common Questions
What is Per Capita Income in Ramona?
Per Capita income in Ramona is $20,862.
What is the Median Family Income in Ramona?
Median Family Income in Ramona is $60,000.
What is the Median Household income in Ramona?
Median Household Income in Ramona is $46,648.
What is Income or Wage Gap in Ramona?
Income or Wage Gap in Ramona is 49.6%.
Women in Ramona earn 50.4 cents for every dollar earned by a man.
What is Inequality or Gini Index in Ramona?
Inequality or Gini Index in Ramona is 0.38.
What is the Total Population of Ramona?
Total Population of Ramona is 697.
What is the Total Male Population of Ramona?
Total Male Population of Ramona is 338.
What is the Total Female Population of Ramona?
Total Female Population of Ramona is 359.
What is the Ratio of Males per 100 Females in Ramona?
There are 94.15 Males per 100 Females in Ramona.
What is the Ratio of Females per 100 Males in Ramona?
There are 106.21 Females per 100 Males in Ramona.
What is the Median Population Age in Ramona?
Median Population Age in Ramona is 39.4 Years.
What is the Average Family Size in Ramona
Average Family Size in Ramona is 3.6 People.
What is the Average Household Size in Ramona
Average Household Size in Ramona is 2.9 People.
How Large is the Labor Force in Ramona?
There are 295 People in the Labor Forcein in Ramona.
What is the Percentage of People in the Labor Force in Ramona?
56.8% of People are in the Labor Force in Ramona.
What is the Unemployment Rate in Ramona?
Unemployment Rate in Ramona is 4.1%.