Rocky Mountain, OK Map & Demographics
Rocky Mountain Map
Rocky Mountain Overview
$21,242
PER CAPITA INCOME
$48,750
AVG FAMILY INCOME
$39,167
AVG HOUSEHOLD INCOME
62.2%
WAGE / INCOME GAP [ % ]
37.8¢/ $1
WAGE / INCOME GAP [ $ ]
0.52
INEQUALITY / GINI INDEX
598
TOTAL POPULATION
294
MALE POPULATION
304
FEMALE POPULATION
96.71
MALES / 100 FEMALES
103.40
FEMALES / 100 MALES
38.0
MEDIAN AGE
3.4
AVG FAMILY SIZE
3.1
AVG HOUSEHOLD SIZE
241
LABOR FORCE [ PEOPLE ]
54.5%
PERCENT IN LABOR FORCE
3.7%
UNEMPLOYMENT RATE
Income in Rocky Mountain
Income Overview in Rocky Mountain
Per Capita Income in Rocky Mountain is $21,242, while median incomes of families and households are $48,750 and $39,167 respectively.
| Characteristic | Number | Measure |
| Per Capita Income | 598 | $21,242 |
| Median Family Income | 141 | $48,750 |
| Mean Family Income | 141 | $70,284 |
| Median Household Income | 194 | $39,167 |
| Mean Household Income | 194 | $60,378 |
| Income Deficit | 141 | $0 |
| Wage / Income Gap (%) | 598 | 62.20% |
| Wage / Income Gap ($) | 598 | 37.80¢ per $1 |
| Gini / Inequality Index | 598 | 0.52 |
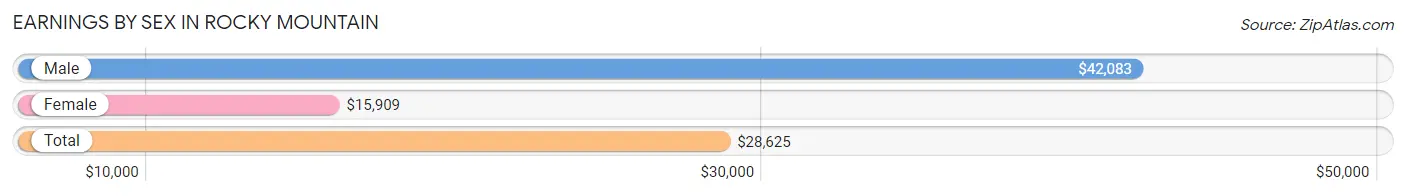
Earnings by Sex in Rocky Mountain
Average Earnings in Rocky Mountain are $28,625, $42,083 for men and $15,909 for women, a difference of 62.2%.
| Sex | Number | Average Earnings |
| Male | 125 (48.6%) | $42,083 |
| Female | 132 (51.4%) | $15,909 |
| Total | 257 (100.0%) | $28,625 |
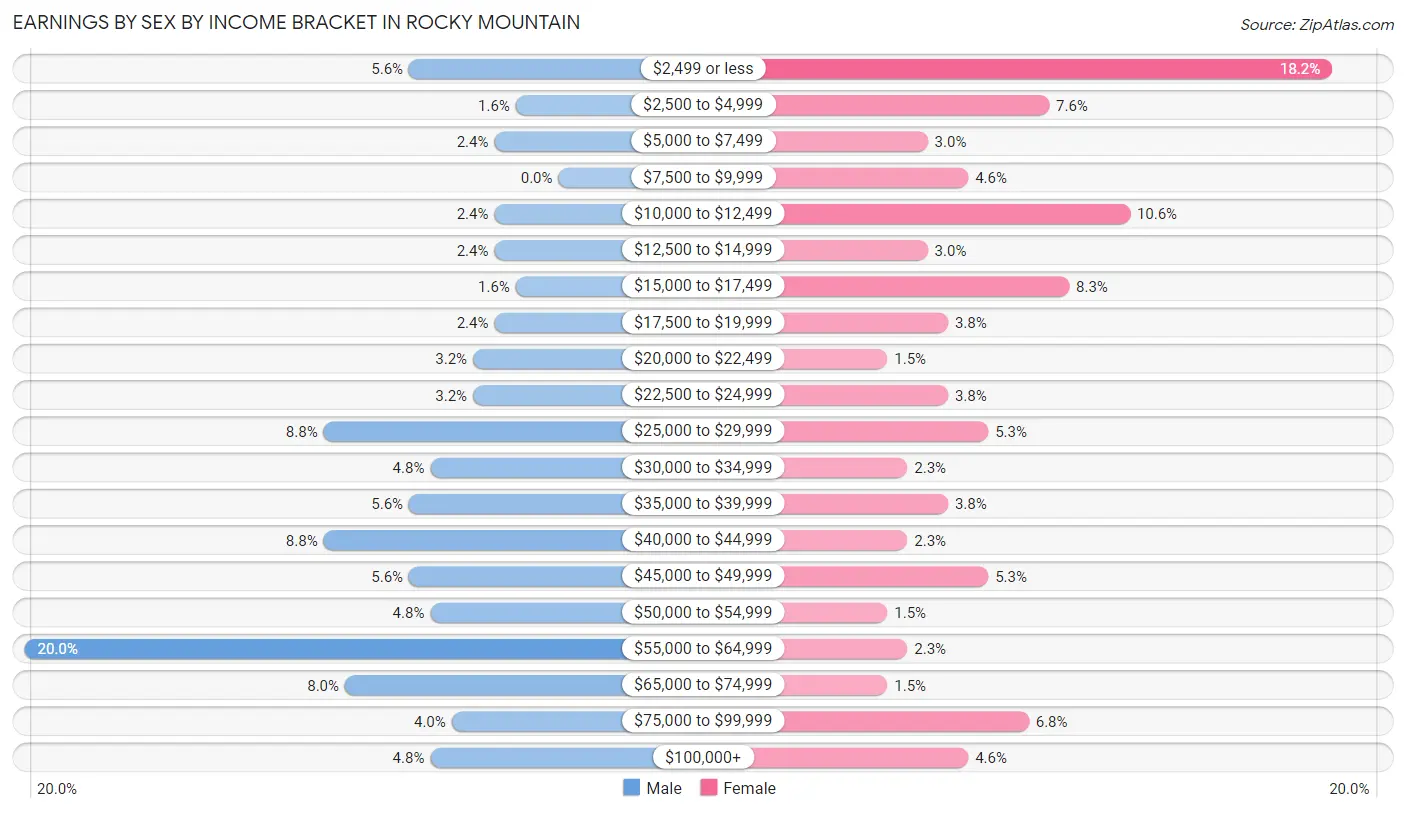
Earnings by Sex by Income Bracket in Rocky Mountain
The most common earnings brackets in Rocky Mountain are $55,000 to $64,999 for men (25 | 20.0%) and $2,499 or less for women (24 | 18.2%).
| Income | Male | Female |
| $2,499 or less | 7 (5.6%) | 24 (18.2%) |
| $2,500 to $4,999 | 2 (1.6%) | 10 (7.6%) |
| $5,000 to $7,499 | 3 (2.4%) | 4 (3.0%) |
| $7,500 to $9,999 | 0 (0.0%) | 6 (4.5%) |
| $10,000 to $12,499 | 3 (2.4%) | 14 (10.6%) |
| $12,500 to $14,999 | 3 (2.4%) | 4 (3.0%) |
| $15,000 to $17,499 | 2 (1.6%) | 11 (8.3%) |
| $17,500 to $19,999 | 3 (2.4%) | 5 (3.8%) |
| $20,000 to $22,499 | 4 (3.2%) | 2 (1.5%) |
| $22,500 to $24,999 | 4 (3.2%) | 5 (3.8%) |
| $25,000 to $29,999 | 11 (8.8%) | 7 (5.3%) |
| $30,000 to $34,999 | 6 (4.8%) | 3 (2.3%) |
| $35,000 to $39,999 | 7 (5.6%) | 5 (3.8%) |
| $40,000 to $44,999 | 11 (8.8%) | 3 (2.3%) |
| $45,000 to $49,999 | 7 (5.6%) | 7 (5.3%) |
| $50,000 to $54,999 | 6 (4.8%) | 2 (1.5%) |
| $55,000 to $64,999 | 25 (20.0%) | 3 (2.3%) |
| $65,000 to $74,999 | 10 (8.0%) | 2 (1.5%) |
| $75,000 to $99,999 | 5 (4.0%) | 9 (6.8%) |
| $100,000+ | 6 (4.8%) | 6 (4.5%) |
| Total | 125 (100.0%) | 132 (100.0%) |
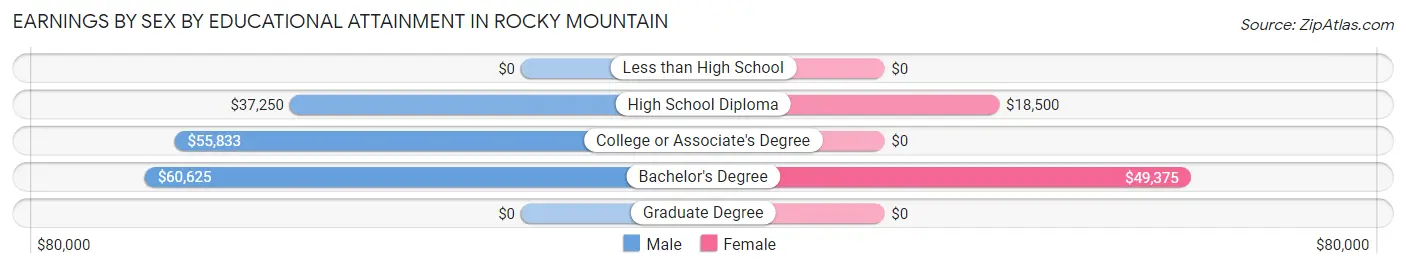
Earnings by Sex by Educational Attainment in Rocky Mountain
Average earnings in Rocky Mountain are $45,714 for men and $24,000 for women, a difference of 47.5%. Men with an educational attainment of bachelor's degree enjoy the highest average annual earnings of $60,625, while those with high school diploma education earn the least with $37,250. Women with an educational attainment of bachelor's degree earn the most with the average annual earnings of $49,375, while those with high school diploma education have the smallest earnings of $18,500.
| Educational Attainment | Male Income | Female Income |
| Less than High School | - | - |
| High School Diploma | $37,250 | $18,500 |
| College or Associate's Degree | $55,833 | $0 |
| Bachelor's Degree | $60,625 | $49,375 |
| Graduate Degree | - | - |
| Total | $45,714 | $24,000 |
Family Income in Rocky Mountain
Family Income Brackets in Rocky Mountain
According to the Rocky Mountain family income data, there are 26 families falling into the $50,000 to $74,999 income range, which is the most common income bracket and makes up 18.4% of all families. Conversely, the $200,000+ income bracket is the least frequent group with only 7 families (5.0%) belonging to this category.
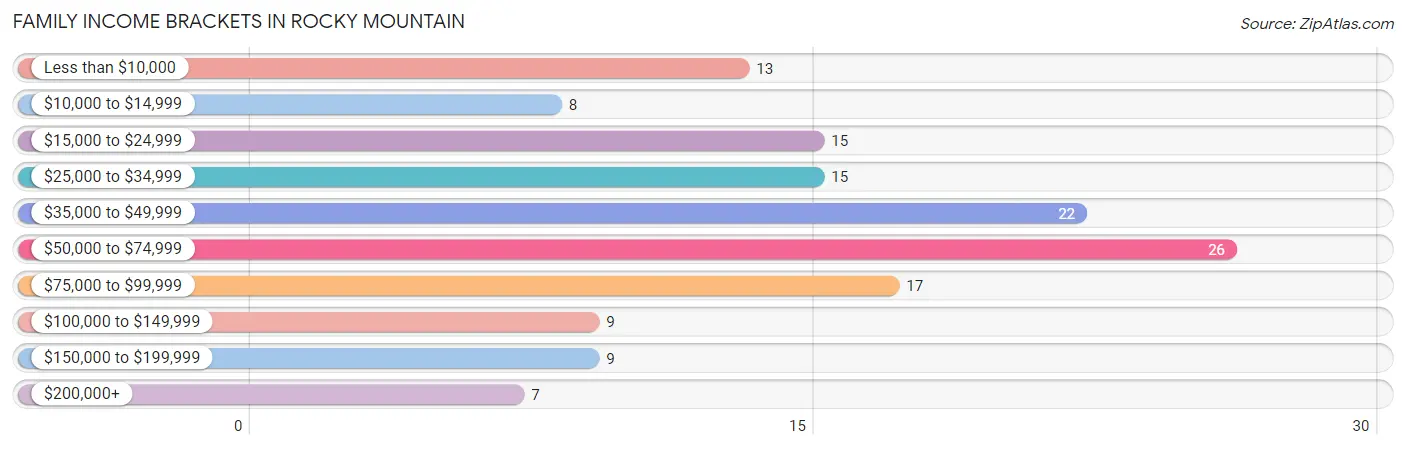
| Income Bracket | # Families | % Families |
| Less than $10,000 | 13 | 9.2% |
| $10,000 to $14,999 | 8 | 5.7% |
| $15,000 to $24,999 | 15 | 10.6% |
| $25,000 to $34,999 | 15 | 10.6% |
| $35,000 to $49,999 | 22 | 15.6% |
| $50,000 to $74,999 | 26 | 18.4% |
| $75,000 to $99,999 | 17 | 12.1% |
| $100,000 to $149,999 | 9 | 6.4% |
| $150,000 to $199,999 | 9 | 6.4% |
| $200,000+ | 7 | 5.0% |
Family Income by Famaliy Size in Rocky Mountain
5-person families (13 | 9.2%) account for the highest median family income in Rocky Mountain with $66,250 per family, while 2-person families (75 | 53.2%) have the highest median income of $22,396 per family member.
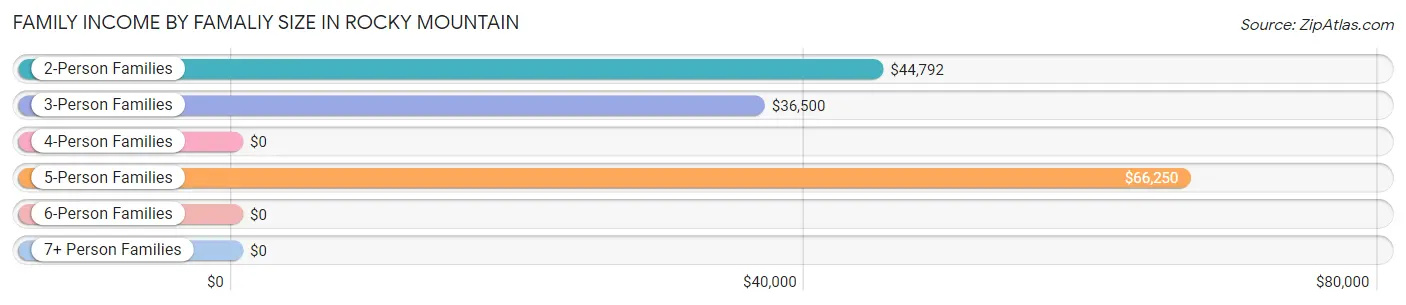
| Income Bracket | # Families | Median Income |
| 2-Person Families | 75 (53.2%) | $44,792 |
| 3-Person Families | 40 (28.4%) | $36,500 |
| 4-Person Families | 7 (5.0%) | $0 |
| 5-Person Families | 13 (9.2%) | $66,250 |
| 6-Person Families | 4 (2.8%) | $0 |
| 7+ Person Families | 2 (1.4%) | $0 |
| Total | 141 (100.0%) | $48,750 |
Family Income by Number of Earners in Rocky Mountain
The median family income in Rocky Mountain is $48,750, with families comprising 2 earners (65) having the highest median family income of $85,625, while families with no earners (40) have the lowest median family income of $20,500, accounting for 46.1% and 28.4% of families, respectively.
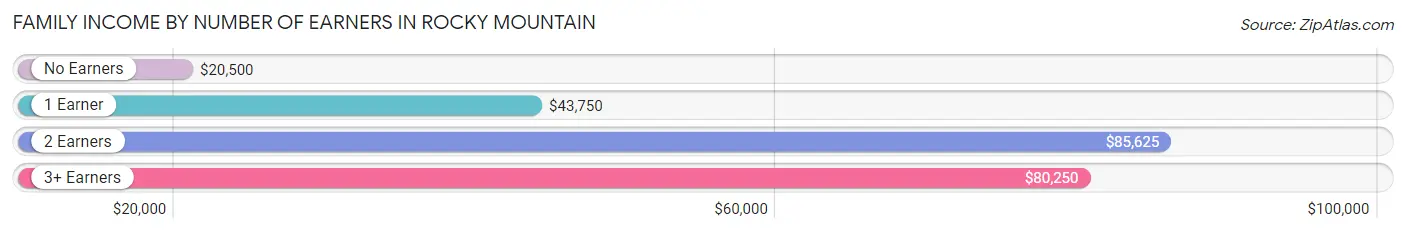
| Number of Earners | # Families | Median Income |
| No Earners | 40 (28.4%) | $20,500 |
| 1 Earner | 27 (19.2%) | $43,750 |
| 2 Earners | 65 (46.1%) | $85,625 |
| 3+ Earners | 9 (6.4%) | $80,250 |
| Total | 141 (100.0%) | $48,750 |
Household Income in Rocky Mountain
Household Income Brackets in Rocky Mountain
With 33 households falling in the category, the $50,000 to $74,999 income range is the most frequent in Rocky Mountain, accounting for 17.0% of all households. In contrast, only 7 households (3.6%) fall into the $200,000+ income bracket, making it the least populous group.
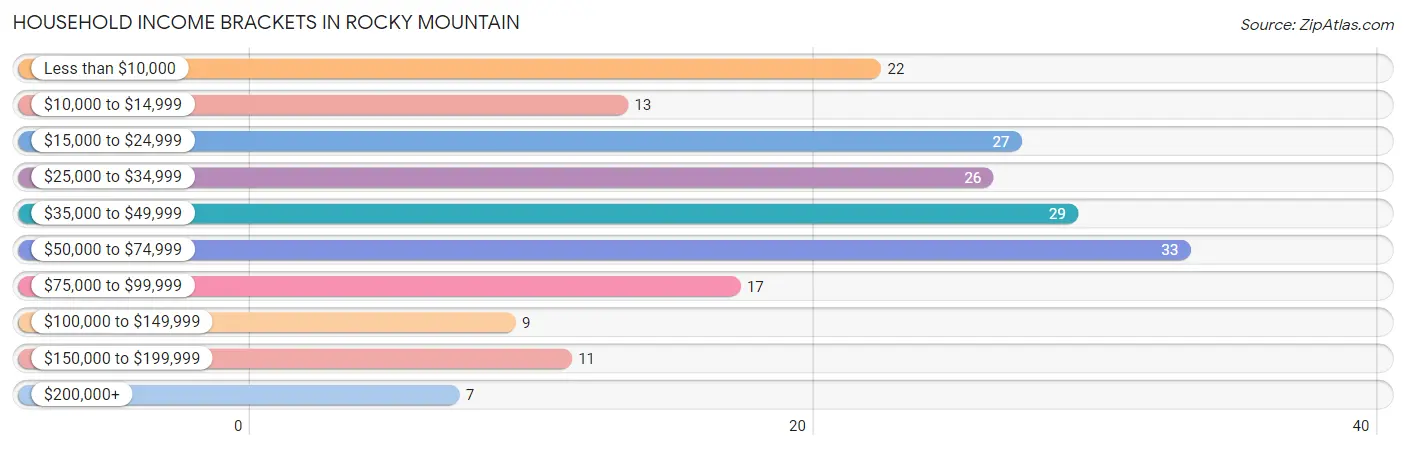
| Income Bracket | # Households | % Households |
| Less than $10,000 | 22 | 11.3% |
| $10,000 to $14,999 | 13 | 6.7% |
| $15,000 to $24,999 | 27 | 13.9% |
| $25,000 to $34,999 | 26 | 13.4% |
| $35,000 to $49,999 | 29 | 14.9% |
| $50,000 to $74,999 | 33 | 17.0% |
| $75,000 to $99,999 | 17 | 8.8% |
| $100,000 to $149,999 | 9 | 4.6% |
| $150,000 to $199,999 | 11 | 5.7% |
| $200,000+ | 7 | 3.6% |
Household Income by Householder Age in Rocky Mountain
The median household income in Rocky Mountain is $39,167, with the highest median household income of $51,250 found in the 25 to 44 years age bracket for the primary householder. A total of 37 households (19.1%) fall into this category. Meanwhile, the 65+ years age bracket for the primary householder has the lowest median household income of $29,167, with 66 households (34.0%) in this group.
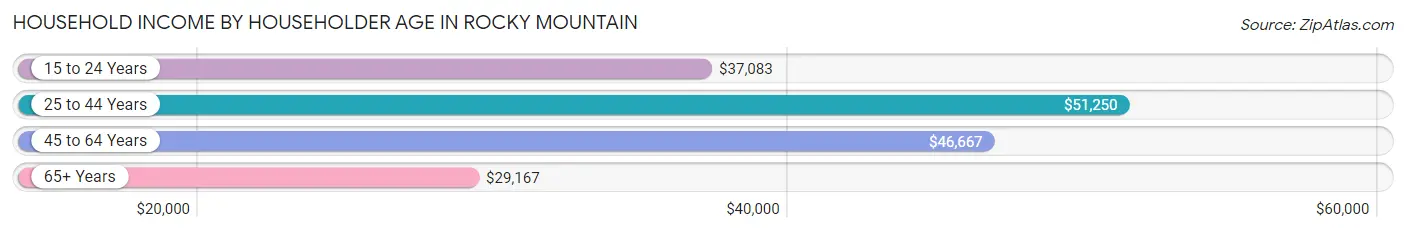
| Income Bracket | # Households | Median Income |
| 15 to 24 Years | 17 (8.8%) | $37,083 |
| 25 to 44 Years | 37 (19.1%) | $51,250 |
| 45 to 64 Years | 74 (38.1%) | $46,667 |
| 65+ Years | 66 (34.0%) | $29,167 |
| Total | 194 (100.0%) | $39,167 |
Poverty in Rocky Mountain
Income Below Poverty by Sex and Age in Rocky Mountain
With 16.3% poverty level for males and 30.7% for females among the residents of Rocky Mountain, 5 year old males and under 5 year old females are the most vulnerable to poverty, with 2 males (40.0%) and 23 females (67.6%) in their respective age groups living below the poverty level.
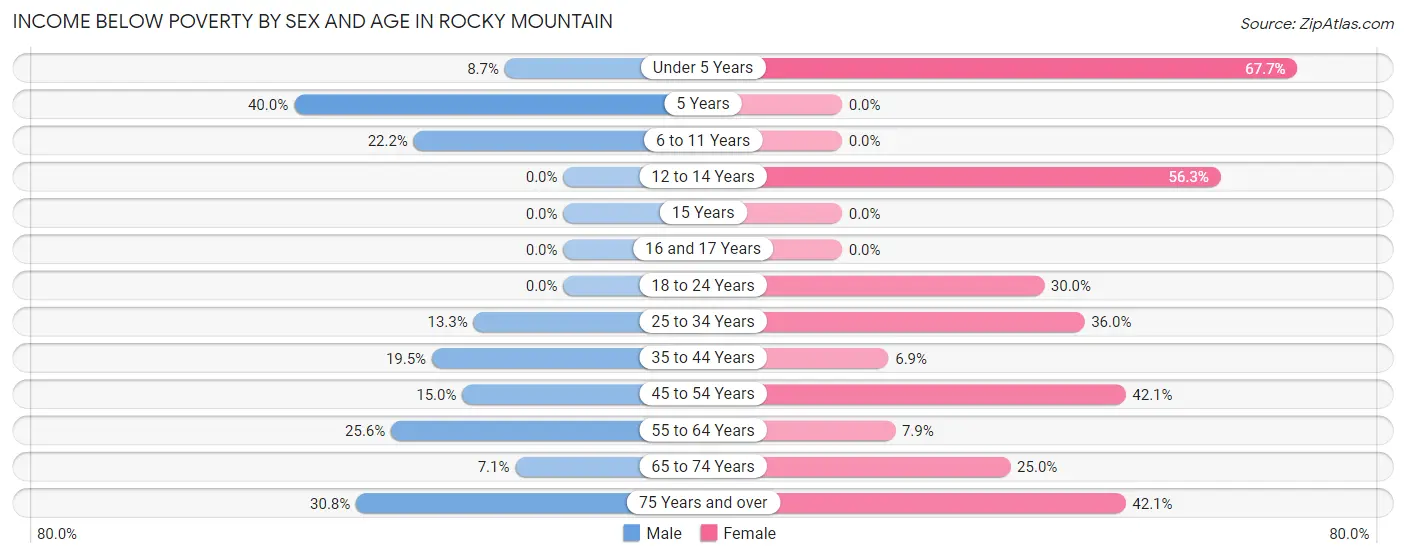
| Age Bracket | Male | Female |
| Under 5 Years | 2 (8.7%) | 23 (67.6%) |
| 5 Years | 2 (40.0%) | 0 (0.0%) |
| 6 to 11 Years | 6 (22.2%) | 0 (0.0%) |
| 12 to 14 Years | 0 (0.0%) | 9 (56.2%) |
| 15 Years | 0 (0.0%) | 0 (0.0%) |
| 16 and 17 Years | 0 (0.0%) | 0 (0.0%) |
| 18 to 24 Years | 0 (0.0%) | 12 (30.0%) |
| 25 to 34 Years | 4 (13.3%) | 9 (36.0%) |
| 35 to 44 Years | 8 (19.5%) | 2 (6.9%) |
| 45 to 54 Years | 6 (15.0%) | 16 (42.1%) |
| 55 to 64 Years | 11 (25.6%) | 3 (7.9%) |
| 65 to 74 Years | 2 (7.1%) | 8 (25.0%) |
| 75 Years and over | 4 (30.8%) | 8 (42.1%) |
| Total | 45 (16.3%) | 90 (30.7%) |
Income Above Poverty by Sex and Age in Rocky Mountain
According to the poverty statistics in Rocky Mountain, males aged 12 to 14 years and females aged 6 to 11 years are the age groups that are most secure financially, with 100.0% of males and 100.0% of females in these age groups living above the poverty line.
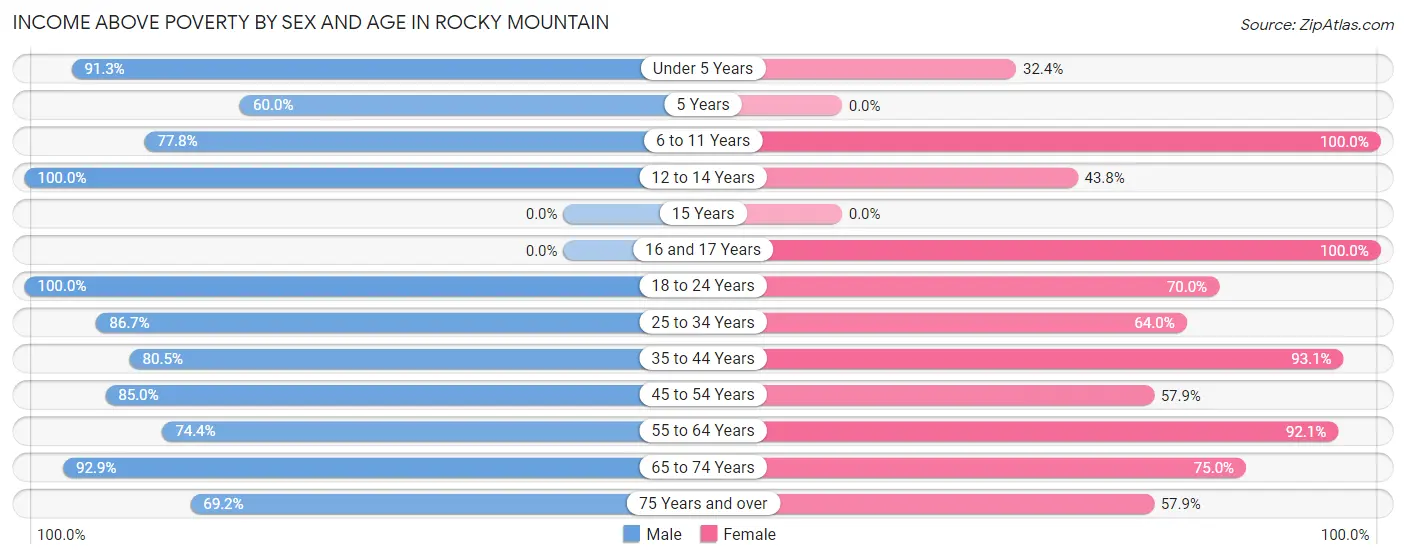
| Age Bracket | Male | Female |
| Under 5 Years | 21 (91.3%) | 11 (32.4%) |
| 5 Years | 3 (60.0%) | 0 (0.0%) |
| 6 to 11 Years | 21 (77.8%) | 11 (100.0%) |
| 12 to 14 Years | 12 (100.0%) | 7 (43.8%) |
| 15 Years | 0 (0.0%) | 0 (0.0%) |
| 16 and 17 Years | 0 (0.0%) | 11 (100.0%) |
| 18 to 24 Years | 15 (100.0%) | 28 (70.0%) |
| 25 to 34 Years | 26 (86.7%) | 16 (64.0%) |
| 35 to 44 Years | 33 (80.5%) | 27 (93.1%) |
| 45 to 54 Years | 34 (85.0%) | 22 (57.9%) |
| 55 to 64 Years | 32 (74.4%) | 35 (92.1%) |
| 65 to 74 Years | 26 (92.9%) | 24 (75.0%) |
| 75 Years and over | 9 (69.2%) | 11 (57.9%) |
| Total | 232 (83.8%) | 203 (69.3%) |
Income Below Poverty Among Married-Couple Families in Rocky Mountain
The poverty statistics for married-couple families in Rocky Mountain show that 12.0% or 12 of the total 100 families live below the poverty line. Families with 1 or 2 children have the highest poverty rate of 30.8%, comprising of 4 families. On the other hand, families with 3 or 4 children have the lowest poverty rate of 0.0%, which includes 0 families.
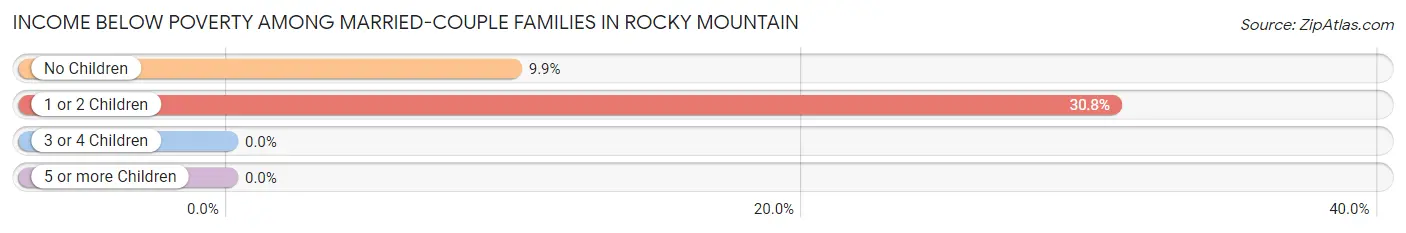
| Children | Above Poverty | Below Poverty |
| No Children | 73 (90.1%) | 8 (9.9%) |
| 1 or 2 Children | 9 (69.2%) | 4 (30.8%) |
| 3 or 4 Children | 4 (100.0%) | 0 (0.0%) |
| 5 or more Children | 2 (100.0%) | 0 (0.0%) |
| Total | 88 (88.0%) | 12 (12.0%) |
Income Below Poverty Among Single-Parent Households in Rocky Mountain
According to the poverty data in Rocky Mountain, 50.0% or 3 single-father households and 34.3% or 12 single-mother households are living below the poverty line. Among single-father households, those with 1 or 2 children have the highest poverty rate, with 3 households (60.0%) experiencing poverty. Likewise, among single-mother households, those with no children have the highest poverty rate, with 3 households (100.0%) falling below the poverty line.
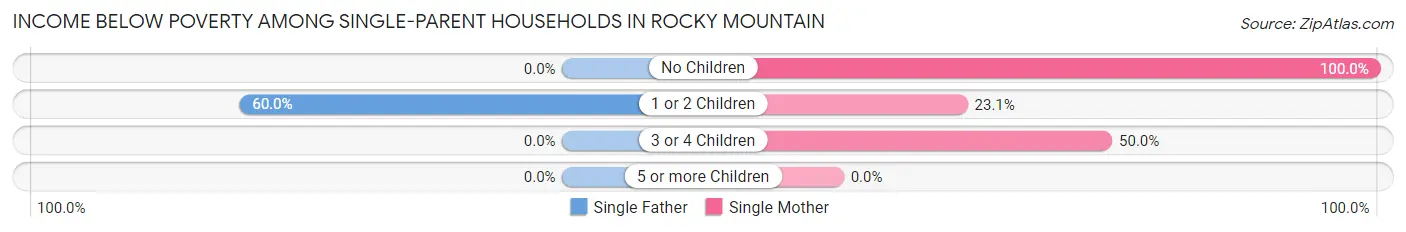
| Children | Single Father | Single Mother |
| No Children | 0 (0.0%) | 3 (100.0%) |
| 1 or 2 Children | 3 (60.0%) | 6 (23.1%) |
| 3 or 4 Children | 0 (0.0%) | 3 (50.0%) |
| 5 or more Children | 0 (0.0%) | 0 (0.0%) |
| Total | 3 (50.0%) | 12 (34.3%) |
Income Below Poverty Among Married-Couple vs Single-Parent Households in Rocky Mountain
The poverty data for Rocky Mountain shows that 12 of the married-couple family households (12.0%) and 15 of the single-parent households (36.6%) are living below the poverty level. Within the married-couple family households, those with 1 or 2 children have the highest poverty rate, with 4 households (30.8%) falling below the poverty line. Among the single-parent households, those with no children have the highest poverty rate, with 3 household (75.0%) living below poverty.
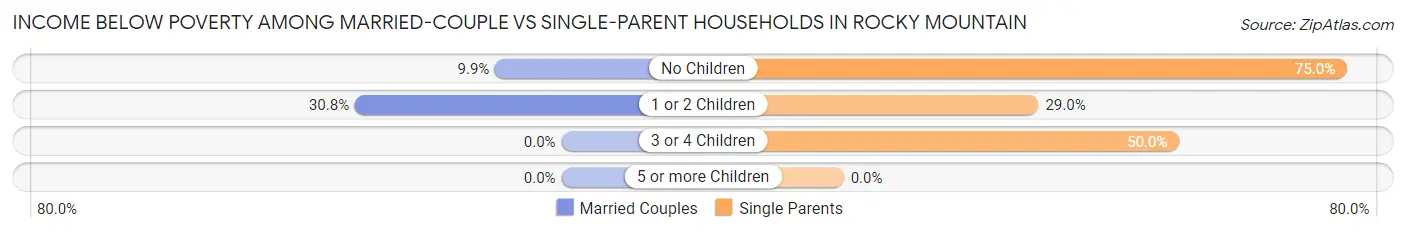
| Children | Married-Couple Families | Single-Parent Households |
| No Children | 8 (9.9%) | 3 (75.0%) |
| 1 or 2 Children | 4 (30.8%) | 9 (29.0%) |
| 3 or 4 Children | 0 (0.0%) | 3 (50.0%) |
| 5 or more Children | 0 (0.0%) | 0 (0.0%) |
| Total | 12 (12.0%) | 15 (36.6%) |
Race in Rocky Mountain
The most populous races in Rocky Mountain are Native / Alaskan (369 | 61.7%), White / Caucasian (174 | 29.1%), and Two or more Races (49 | 8.2%).
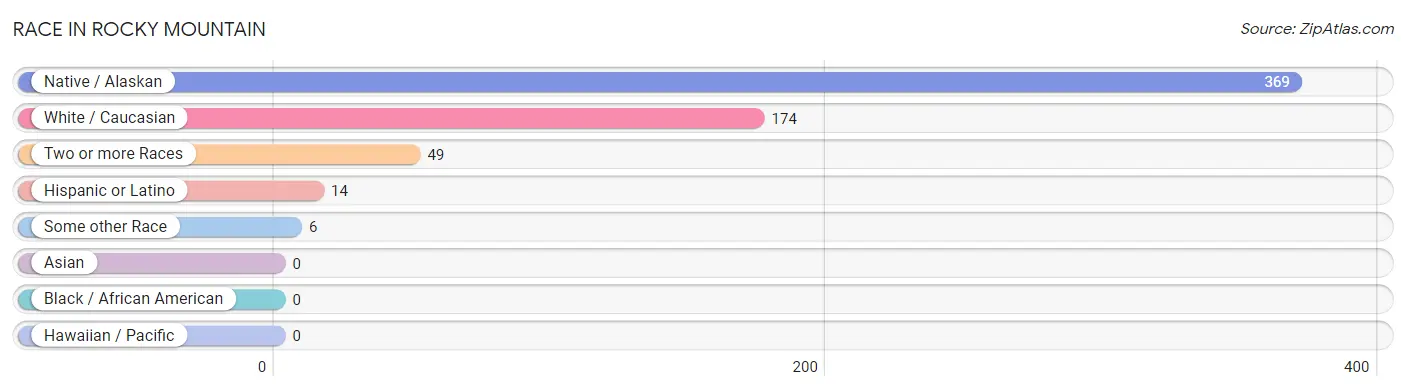
| Race | # Population | % Population |
| Asian | 0 | 0.0% |
| Black / African American | 0 | 0.0% |
| Hawaiian / Pacific | 0 | 0.0% |
| Hispanic or Latino | 14 | 2.3% |
| Native / Alaskan | 369 | 61.7% |
| White / Caucasian | 174 | 29.1% |
| Two or more Races | 49 | 8.2% |
| Some other Race | 6 | 1.0% |
| Total | 598 | 100.0% |
Ancestry in Rocky Mountain
The most populous ancestries reported in Rocky Mountain are Cherokee (391 | 65.4%), German (51 | 8.5%), Creek (15 | 2.5%), Irish (15 | 2.5%), and Mexican (11 | 1.8%), together accounting for 80.8% of all Rocky Mountain residents.
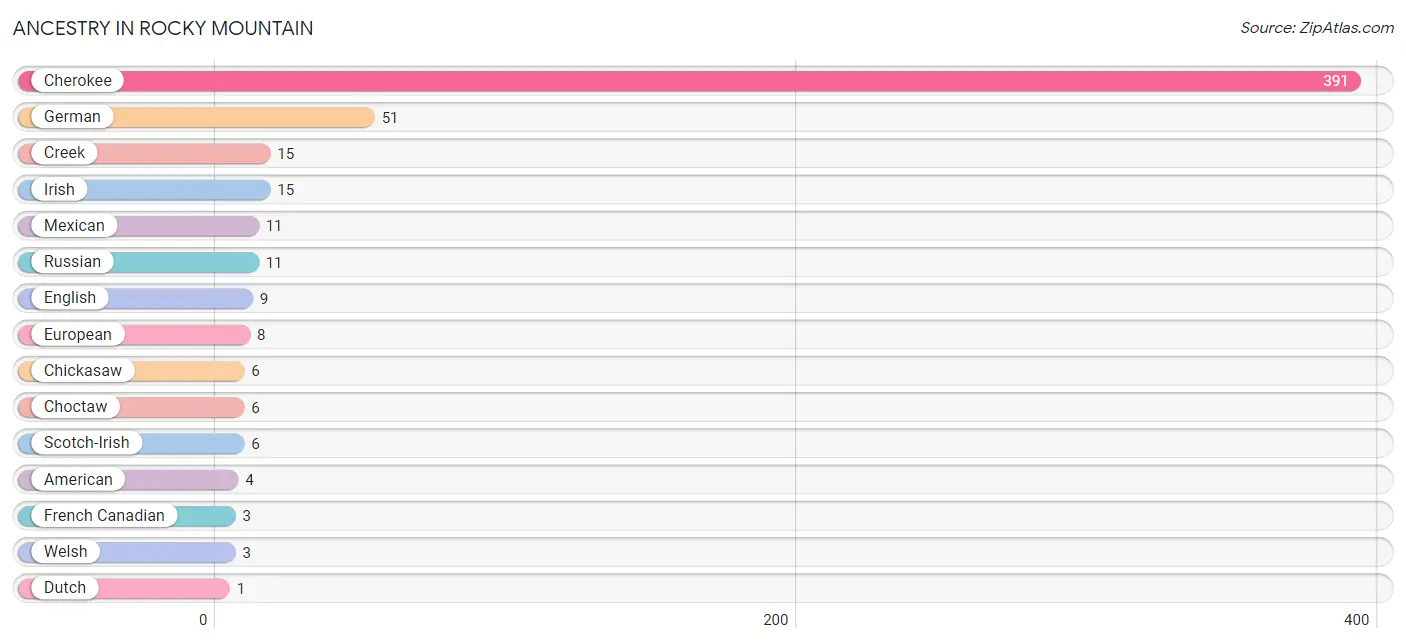
| Ancestry | # Population | % Population |
| American | 4 | 0.7% |
| Cherokee | 391 | 65.4% |
| Chickasaw | 6 | 1.0% |
| Choctaw | 6 | 1.0% |
| Creek | 15 | 2.5% |
| Dutch | 1 | 0.2% |
| English | 9 | 1.5% |
| European | 8 | 1.3% |
| French Canadian | 3 | 0.5% |
| German | 51 | 8.5% |
| Irish | 15 | 2.5% |
| Italian | 1 | 0.2% |
| Mexican | 11 | 1.8% |
| Russian | 11 | 1.8% |
| Scotch-Irish | 6 | 1.0% |
| Welsh | 3 | 0.5% | View All 16 Rows |
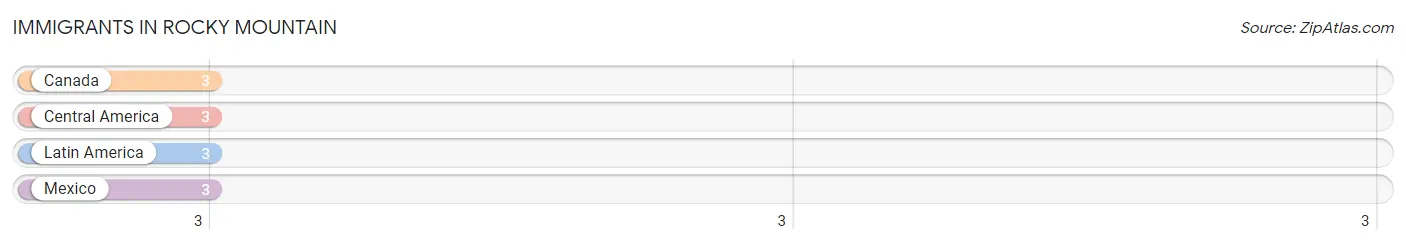
Immigrants in Rocky Mountain
The most numerous immigrant groups reported in Rocky Mountain came from Canada (3 | 0.5%), Central America (3 | 0.5%), Latin America (3 | 0.5%), and Mexico (3 | 0.5%), together accounting for 2.0% of all Rocky Mountain residents.
| Immigration Origin | # Population | % Population |
| Canada | 3 | 0.5% |
| Central America | 3 | 0.5% |
| Latin America | 3 | 0.5% |
| Mexico | 3 | 0.5% | View All 4 Rows |
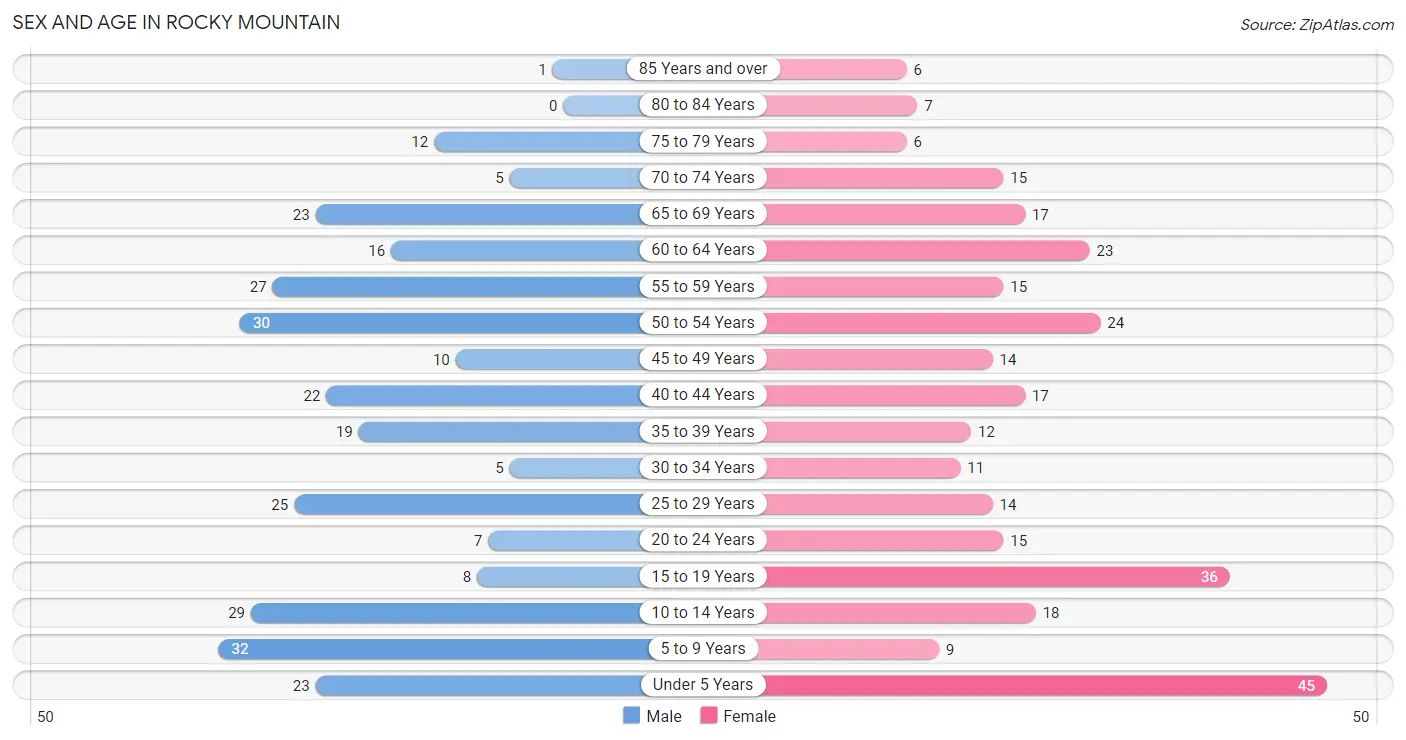
Sex and Age in Rocky Mountain
Sex and Age in Rocky Mountain
The most populous age groups in Rocky Mountain are 5 to 9 Years (32 | 10.9%) for men and Under 5 Years (45 | 14.8%) for women.
| Age Bracket | Male | Female |
| Under 5 Years | 23 (7.8%) | 45 (14.8%) |
| 5 to 9 Years | 32 (10.9%) | 9 (3.0%) |
| 10 to 14 Years | 29 (9.9%) | 18 (5.9%) |
| 15 to 19 Years | 8 (2.7%) | 36 (11.8%) |
| 20 to 24 Years | 7 (2.4%) | 15 (4.9%) |
| 25 to 29 Years | 25 (8.5%) | 14 (4.6%) |
| 30 to 34 Years | 5 (1.7%) | 11 (3.6%) |
| 35 to 39 Years | 19 (6.5%) | 12 (4.0%) |
| 40 to 44 Years | 22 (7.5%) | 17 (5.6%) |
| 45 to 49 Years | 10 (3.4%) | 14 (4.6%) |
| 50 to 54 Years | 30 (10.2%) | 24 (7.9%) |
| 55 to 59 Years | 27 (9.2%) | 15 (4.9%) |
| 60 to 64 Years | 16 (5.4%) | 23 (7.6%) |
| 65 to 69 Years | 23 (7.8%) | 17 (5.6%) |
| 70 to 74 Years | 5 (1.7%) | 15 (4.9%) |
| 75 to 79 Years | 12 (4.1%) | 6 (2.0%) |
| 80 to 84 Years | 0 (0.0%) | 7 (2.3%) |
| 85 Years and over | 1 (0.3%) | 6 (2.0%) |
| Total | 294 (100.0%) | 304 (100.0%) |
Families and Households in Rocky Mountain
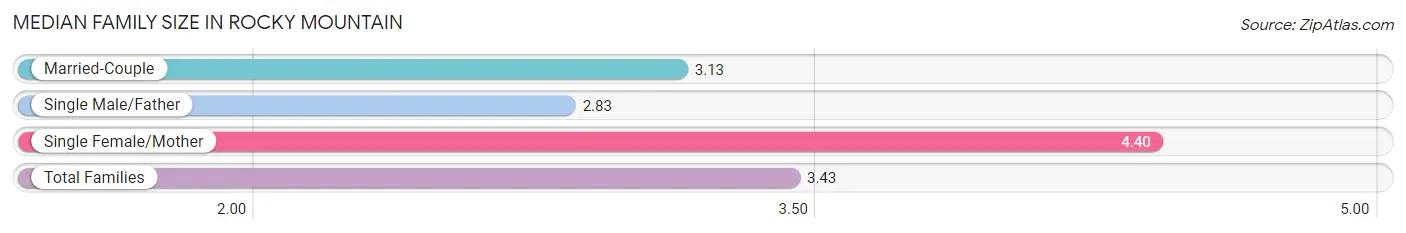
Median Family Size in Rocky Mountain
The median family size in Rocky Mountain is 3.43 persons per family, with single female/mother families (35 | 24.8%) accounting for the largest median family size of 4.4 persons per family. On the other hand, single male/father families (6 | 4.3%) represent the smallest median family size with 2.83 persons per family.
| Family Type | # Families | Family Size |
| Married-Couple | 100 (70.9%) | 3.13 |
| Single Male/Father | 6 (4.3%) | 2.83 |
| Single Female/Mother | 35 (24.8%) | 4.40 |
| Total Families | 141 (100.0%) | 3.43 |
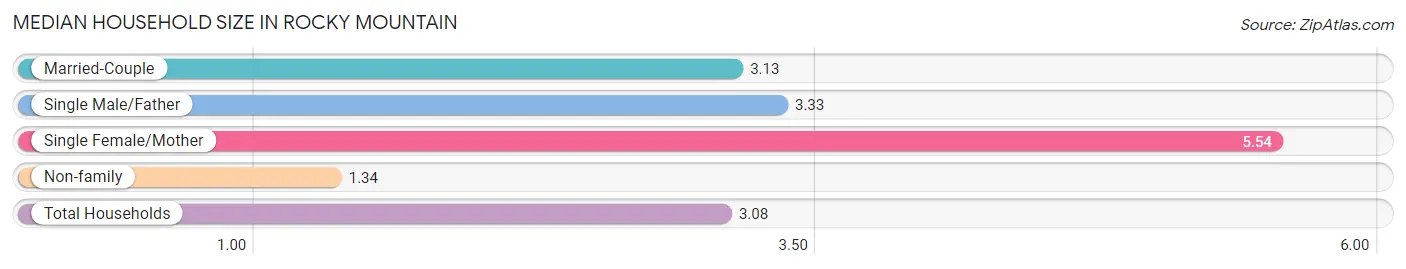
Median Household Size in Rocky Mountain
The median household size in Rocky Mountain is 3.08 persons per household, with single female/mother households (35 | 18.0%) accounting for the largest median household size of 5.54 persons per household. non-family households (53 | 27.3%) represent the smallest median household size with 1.34 persons per household.
| Household Type | # Households | Household Size |
| Married-Couple | 100 (51.5%) | 3.13 |
| Single Male/Father | 6 (3.1%) | 3.33 |
| Single Female/Mother | 35 (18.0%) | 5.54 |
| Non-family | 53 (27.3%) | 1.34 |
| Total Households | 194 (100.0%) | 3.08 |
Household Size by Marriage Status in Rocky Mountain
Out of a total of 194 households in Rocky Mountain, 141 (72.7%) are family households, while 53 (27.3%) are nonfamily households. The most numerous type of family households are 2-person households, comprising 72, and the most common type of nonfamily households are 1-person households, comprising 41.
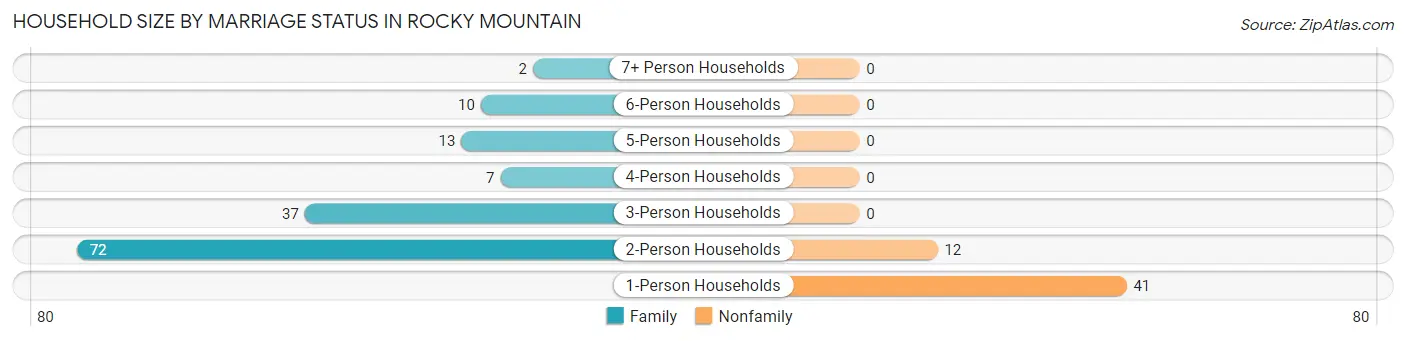
| Household Size | Family Households | Nonfamily Households |
| 1-Person Households | - | 41 (21.1%) |
| 2-Person Households | 72 (37.1%) | 12 (6.2%) |
| 3-Person Households | 37 (19.1%) | 0 (0.0%) |
| 4-Person Households | 7 (3.6%) | 0 (0.0%) |
| 5-Person Households | 13 (6.7%) | 0 (0.0%) |
| 6-Person Households | 10 (5.1%) | 0 (0.0%) |
| 7+ Person Households | 2 (1.0%) | 0 (0.0%) |
| Total | 141 (72.7%) | 53 (27.3%) |
Female Fertility in Rocky Mountain
Fertility by Age in Rocky Mountain
Average fertility rate in Rocky Mountain is 57.0 births per 1,000 women. Women in the age bracket of 20 to 34 years have the highest fertility rate with 125.0 births per 1,000 women. Women in the age bracket of 20 to 34 years acount for 71.4% of all women with births.
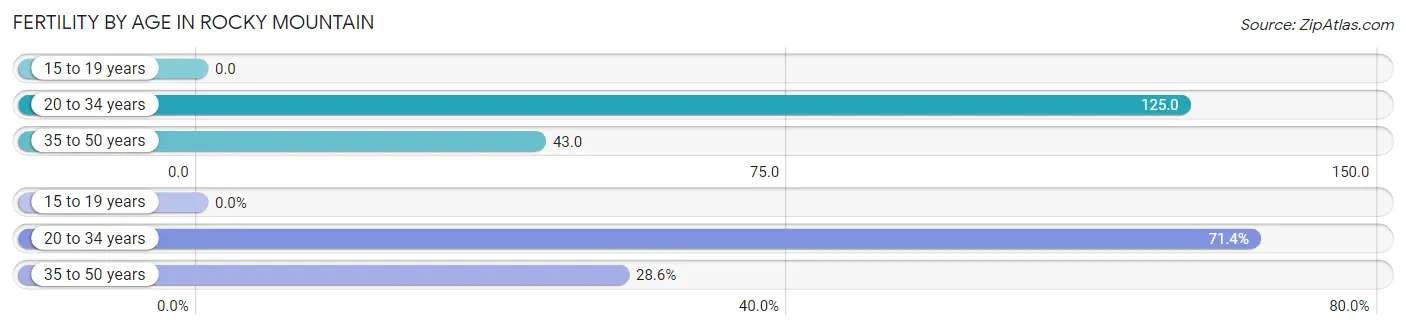
| Age Bracket | Women with Births | Births / 1,000 Women |
| 15 to 19 years | 0 (0.0%) | 0.0 |
| 20 to 34 years | 5 (71.4%) | 125.0 |
| 35 to 50 years | 2 (28.6%) | 43.0 |
| Total | 7 (100.0%) | 57.0 |
Fertility by Age by Marriage Status in Rocky Mountain
57.1% of women with births (7) in Rocky Mountain are married. The highest percentage of unmarried women with births falls into 20 to 34 years age bracket with 60.0% of them unmarried at the time of birth, while the lowest percentage of unmarried women with births belong to 35 to 50 years age bracket with 0.0% of them unmarried.
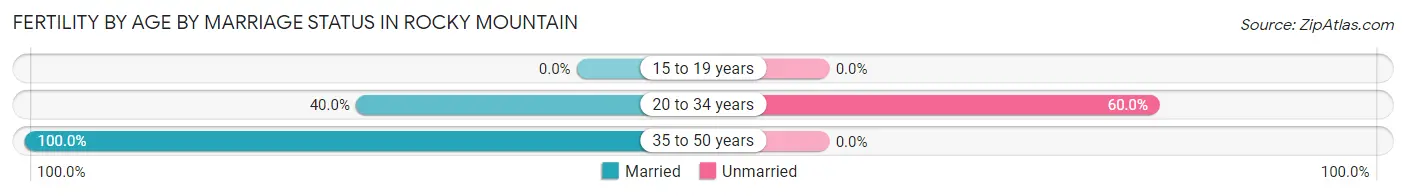
| Age Bracket | Married | Unmarried |
| 15 to 19 years | 0 (0.0%) | 0 (0.0%) |
| 20 to 34 years | 2 (40.0%) | 3 (60.0%) |
| 35 to 50 years | 2 (100.0%) | 0 (0.0%) |
| Total | 4 (57.1%) | 3 (42.9%) |
Fertility by Education in Rocky Mountain
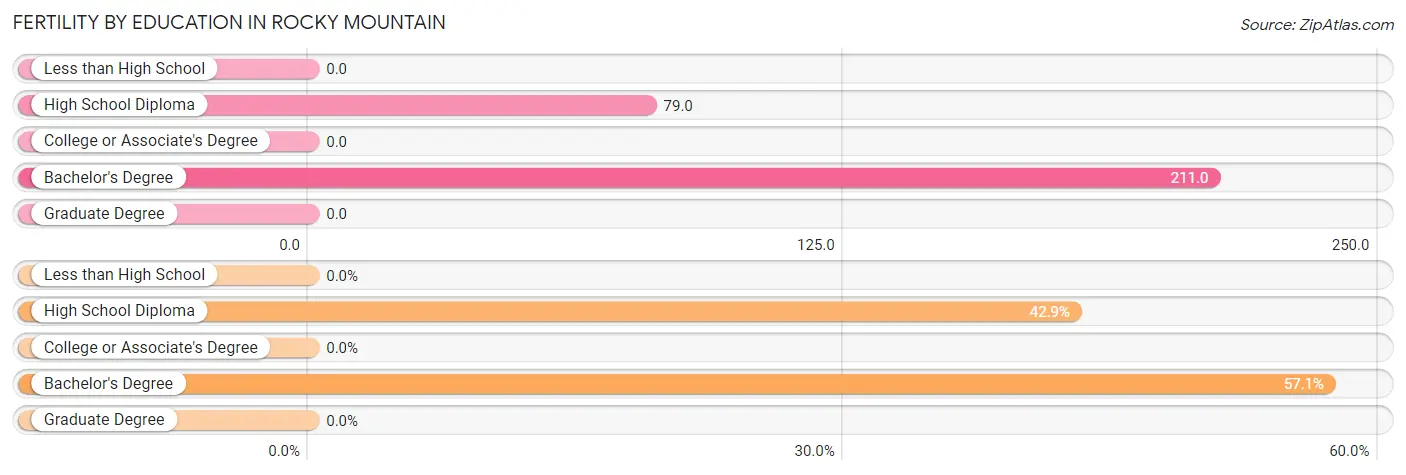
| Educational Attainment | Women with Births | Births / 1,000 Women |
| Less than High School | 0 (0.0%) | 0.0 |
| High School Diploma | 3 (42.9%) | 79.0 |
| College or Associate's Degree | 0 (0.0%) | 0.0 |
| Bachelor's Degree | 4 (57.1%) | 211.0 |
| Graduate Degree | 0 (0.0%) | 0.0 |
| Total | 7 (100.0%) | 57.0 |
Fertility by Education by Marriage Status in Rocky Mountain
42.9% of women with births in Rocky Mountain are unmarried. Women with the educational attainment of bachelor's degree are most likely to be married with 100.0% of them married at childbirth, while women with the educational attainment of high school diploma are least likely to be married with 100.0% of them unmarried at childbirth.
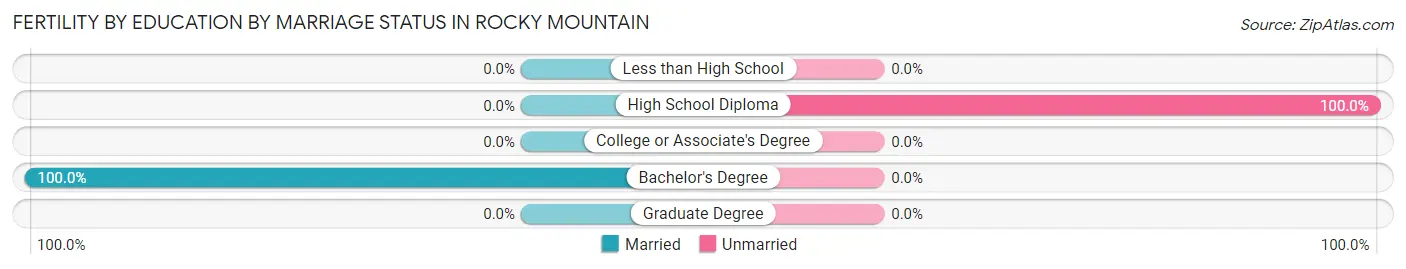
| Educational Attainment | Married | Unmarried |
| Less than High School | 0 (0.0%) | 0 (0.0%) |
| High School Diploma | 0 (0.0%) | 3 (100.0%) |
| College or Associate's Degree | 0 (0.0%) | 0 (0.0%) |
| Bachelor's Degree | 4 (100.0%) | 0 (0.0%) |
| Graduate Degree | 0 (0.0%) | 0 (0.0%) |
| Total | 4 (57.1%) | 3 (42.9%) |
Employment Characteristics in Rocky Mountain
Employment by Class of Employer in Rocky Mountain
Among the 230 employed individuals in Rocky Mountain, private company employees (135 | 58.7%), local government employees (36 | 15.7%), and state government employees (26 | 11.3%) make up the most common classes of employment.
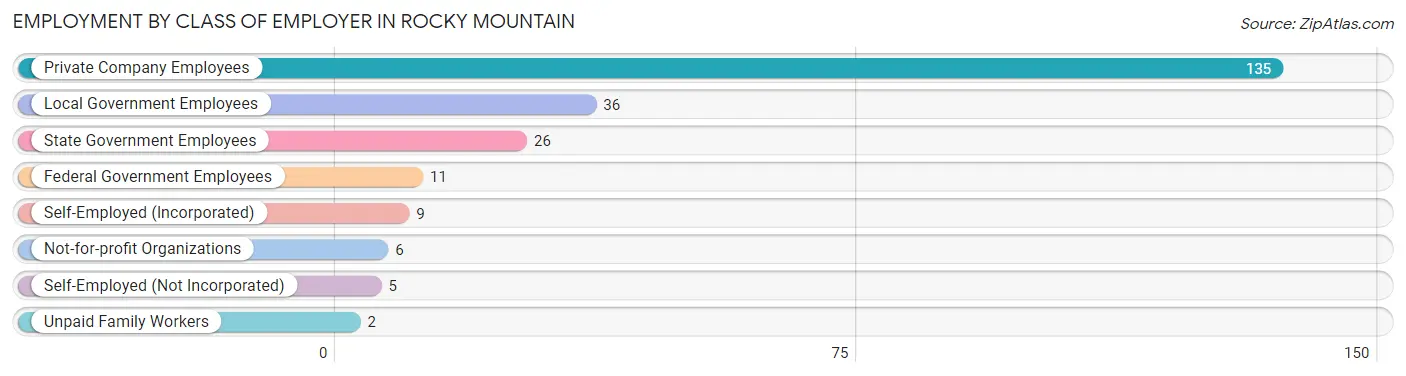
| Employer Class | # Employees | % Employees |
| Private Company Employees | 135 | 58.7% |
| Self-Employed (Incorporated) | 9 | 3.9% |
| Self-Employed (Not Incorporated) | 5 | 2.2% |
| Not-for-profit Organizations | 6 | 2.6% |
| Local Government Employees | 36 | 15.7% |
| State Government Employees | 26 | 11.3% |
| Federal Government Employees | 11 | 4.8% |
| Unpaid Family Workers | 2 | 0.9% |
| Total | 230 | 100.0% |
Employment Status by Age in Rocky Mountain
According to the labor force statistics for Rocky Mountain, out of the total population over 16 years of age (442), 54.5% or 241 individuals are in the labor force, with 3.7% or 9 of them unemployed. The age group with the highest labor force participation rate is 30 to 34 years, with 75.0% or 12 individuals in the labor force. Within the labor force, the 16 to 19 years age range has the highest percentage of unemployed individuals, with 20.7% or 6 of them being unemployed.
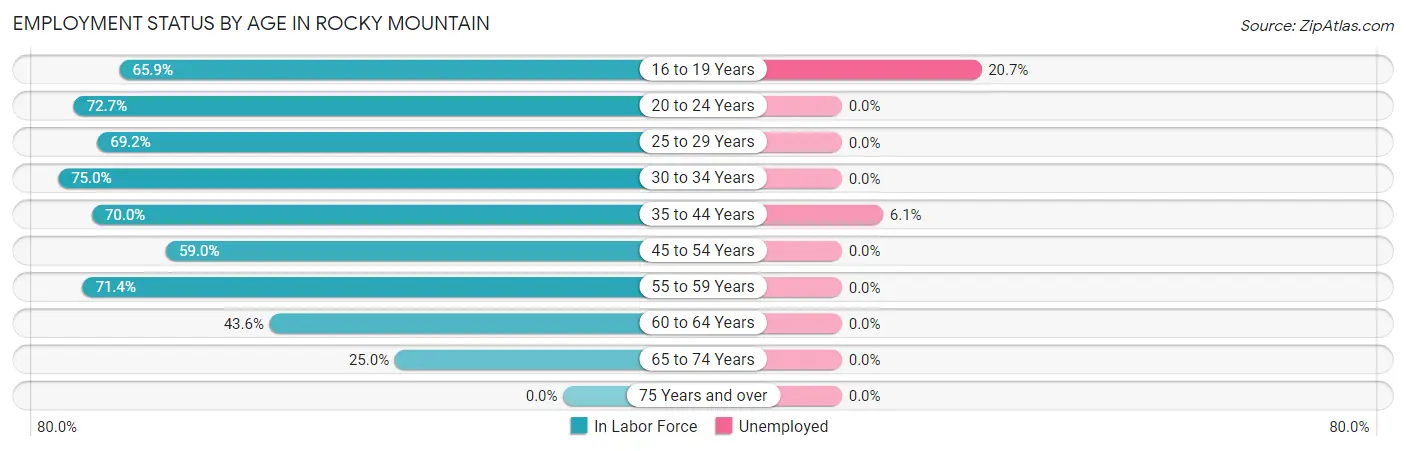
| Age Bracket | In Labor Force | Unemployed |
| 16 to 19 Years | 29 (65.9%) | 6 (20.7%) |
| 20 to 24 Years | 16 (72.7%) | 0 (0.0%) |
| 25 to 29 Years | 27 (69.2%) | 0 (0.0%) |
| 30 to 34 Years | 12 (75.0%) | 0 (0.0%) |
| 35 to 44 Years | 49 (70.0%) | 3 (6.1%) |
| 45 to 54 Years | 46 (59.0%) | 0 (0.0%) |
| 55 to 59 Years | 30 (71.4%) | 0 (0.0%) |
| 60 to 64 Years | 17 (43.6%) | 0 (0.0%) |
| 65 to 74 Years | 15 (25.0%) | 0 (0.0%) |
| 75 Years and over | 0 (0.0%) | 0 (0.0%) |
| Total | 241 (54.5%) | 9 (3.7%) |
Employment Status by Educational Attainment in Rocky Mountain
According to labor force statistics for Rocky Mountain, 63.7% of individuals (181) out of the total population between 25 and 64 years of age (284) are in the labor force, with 1.7% or 3 of them being unemployed. The group with the highest labor force participation rate are those with the educational attainment of bachelor's degree or higher, with 80.0% or 44 individuals in the labor force. Within the labor force, individuals with less than high school education have the highest percentage of unemployment, with 16.7% or 3 of them being unemployed.
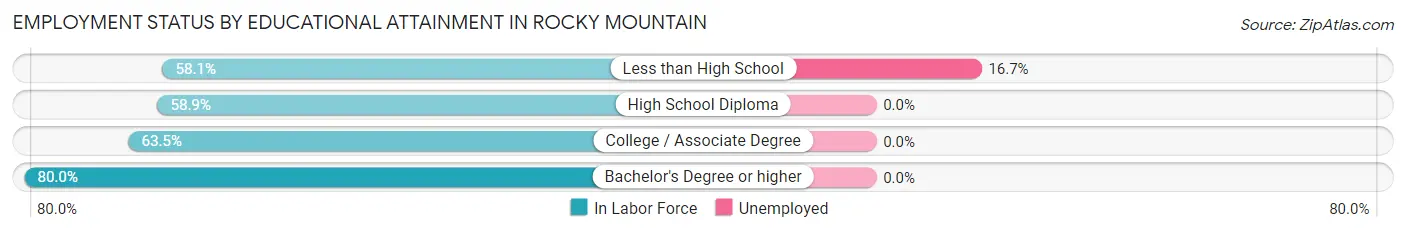
| Educational Attainment | In Labor Force | Unemployed |
| Less than High School | 18 (58.1%) | 5 (16.7%) |
| High School Diploma | 86 (58.9%) | 0 (0.0%) |
| College / Associate Degree | 33 (63.5%) | 0 (0.0%) |
| Bachelor's Degree or higher | 44 (80.0%) | 0 (0.0%) |
| Total | 181 (63.7%) | 5 (1.7%) |
Employment Occupations by Sex in Rocky Mountain
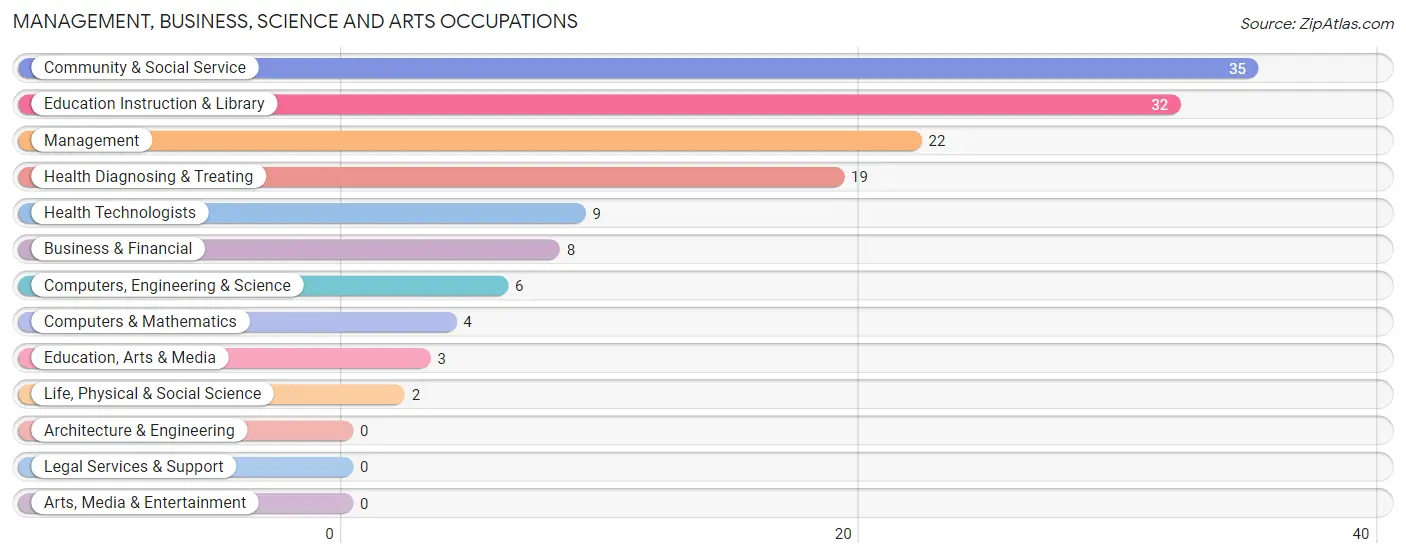
Management, Business, Science and Arts Occupations
The most common Management, Business, Science and Arts occupations in Rocky Mountain are Community & Social Service (35 | 15.1%), Education Instruction & Library (32 | 13.8%), Management (22 | 9.5%), Health Diagnosing & Treating (19 | 8.2%), and Health Technologists (9 | 3.9%).
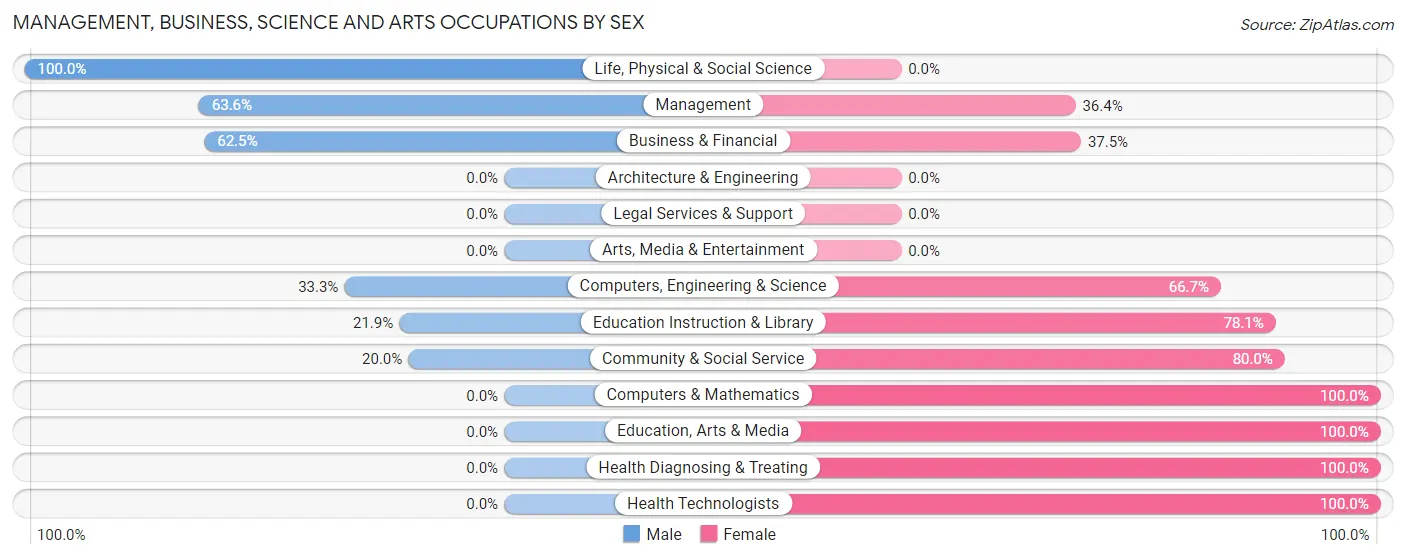
Management, Business, Science and Arts Occupations by Sex
Within the Management, Business, Science and Arts occupations in Rocky Mountain, the most male-oriented occupations are Life, Physical & Social Science (100.0%), Management (63.6%), and Business & Financial (62.5%), while the most female-oriented occupations are Computers & Mathematics (100.0%), Education, Arts & Media (100.0%), and Health Diagnosing & Treating (100.0%).
| Occupation | Male | Female |
| Management | 14 (63.6%) | 8 (36.4%) |
| Business & Financial | 5 (62.5%) | 3 (37.5%) |
| Computers, Engineering & Science | 2 (33.3%) | 4 (66.7%) |
| Computers & Mathematics | 0 (0.0%) | 4 (100.0%) |
| Architecture & Engineering | 0 (0.0%) | 0 (0.0%) |
| Life, Physical & Social Science | 2 (100.0%) | 0 (0.0%) |
| Community & Social Service | 7 (20.0%) | 28 (80.0%) |
| Education, Arts & Media | 0 (0.0%) | 3 (100.0%) |
| Legal Services & Support | 0 (0.0%) | 0 (0.0%) |
| Education Instruction & Library | 7 (21.9%) | 25 (78.1%) |
| Arts, Media & Entertainment | 0 (0.0%) | 0 (0.0%) |
| Health Diagnosing & Treating | 0 (0.0%) | 19 (100.0%) |
| Health Technologists | 0 (0.0%) | 9 (100.0%) |
| Total (Category) | 28 (31.1%) | 62 (68.9%) |
| Total (Overall) | 113 (48.7%) | 119 (51.3%) |
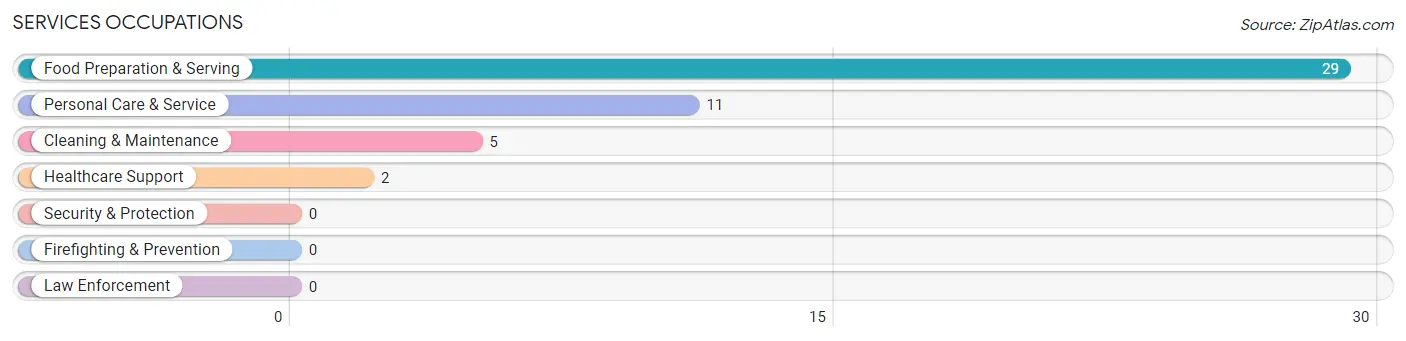
Services Occupations
The most common Services occupations in Rocky Mountain are Food Preparation & Serving (29 | 12.5%), Personal Care & Service (11 | 4.7%), Cleaning & Maintenance (5 | 2.2%), and Healthcare Support (2 | 0.9%).
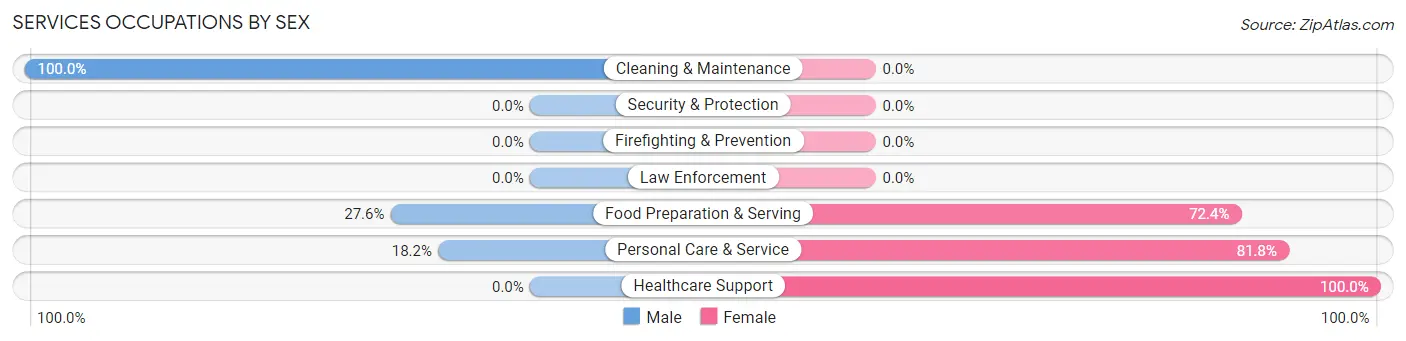
Services Occupations by Sex
Within the Services occupations in Rocky Mountain, the most male-oriented occupations are Cleaning & Maintenance (100.0%), Food Preparation & Serving (27.6%), and Personal Care & Service (18.2%), while the most female-oriented occupations are Healthcare Support (100.0%), Personal Care & Service (81.8%), and Food Preparation & Serving (72.4%).
| Occupation | Male | Female |
| Healthcare Support | 0 (0.0%) | 2 (100.0%) |
| Security & Protection | 0 (0.0%) | 0 (0.0%) |
| Firefighting & Prevention | 0 (0.0%) | 0 (0.0%) |
| Law Enforcement | 0 (0.0%) | 0 (0.0%) |
| Food Preparation & Serving | 8 (27.6%) | 21 (72.4%) |
| Cleaning & Maintenance | 5 (100.0%) | 0 (0.0%) |
| Personal Care & Service | 2 (18.2%) | 9 (81.8%) |
| Total (Category) | 15 (31.9%) | 32 (68.1%) |
| Total (Overall) | 113 (48.7%) | 119 (51.3%) |
Sales and Office Occupations
The most common Sales and Office occupations in Rocky Mountain are Sales & Related (15 | 6.5%), and Office & Administration (12 | 5.2%).
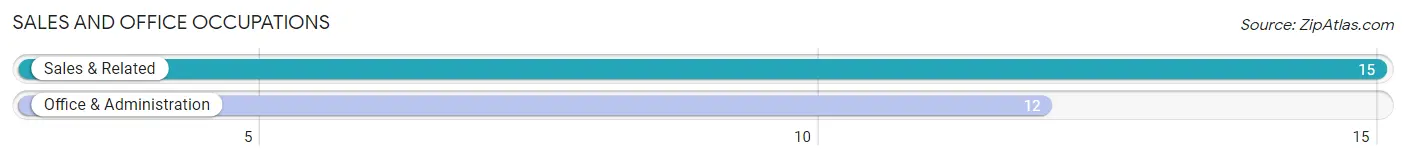
Sales and Office Occupations by Sex
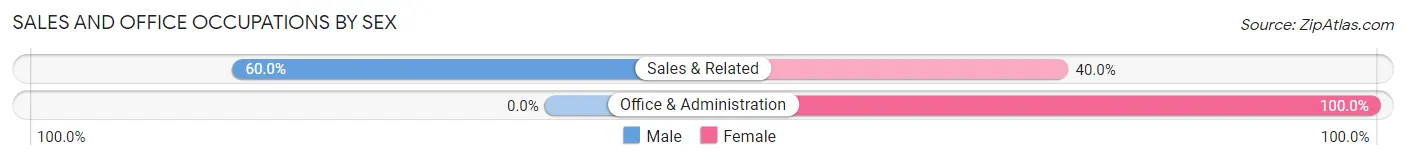
| Occupation | Male | Female |
| Sales & Related | 9 (60.0%) | 6 (40.0%) |
| Office & Administration | 0 (0.0%) | 12 (100.0%) |
| Total (Category) | 9 (33.3%) | 18 (66.7%) |
| Total (Overall) | 113 (48.7%) | 119 (51.3%) |
Natural Resources, Construction and Maintenance Occupations
The most common Natural Resources, Construction and Maintenance occupations in Rocky Mountain are Construction & Extraction (16 | 6.9%), Installation, Maintenance & Repair (13 | 5.6%), and Farming, Fishing & Forestry (8 | 3.5%).
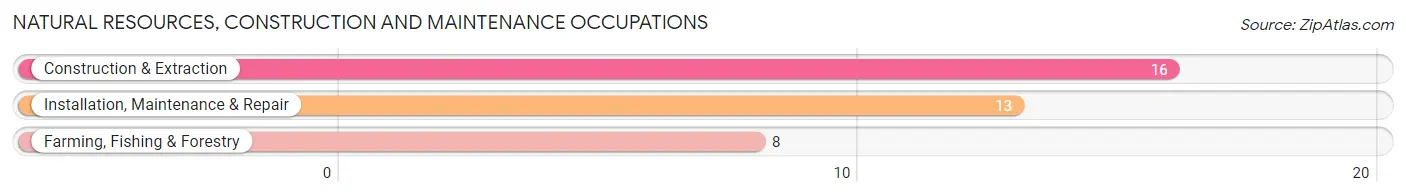
Natural Resources, Construction and Maintenance Occupations by Sex
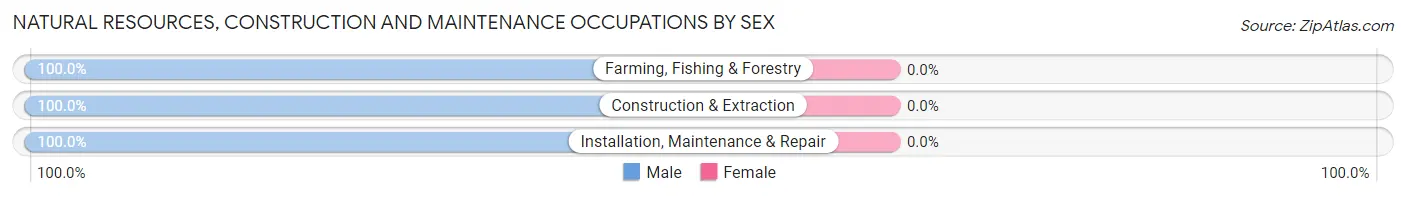
| Occupation | Male | Female |
| Farming, Fishing & Forestry | 8 (100.0%) | 0 (0.0%) |
| Construction & Extraction | 16 (100.0%) | 0 (0.0%) |
| Installation, Maintenance & Repair | 13 (100.0%) | 0 (0.0%) |
| Total (Category) | 37 (100.0%) | 0 (0.0%) |
| Total (Overall) | 113 (48.7%) | 119 (51.3%) |
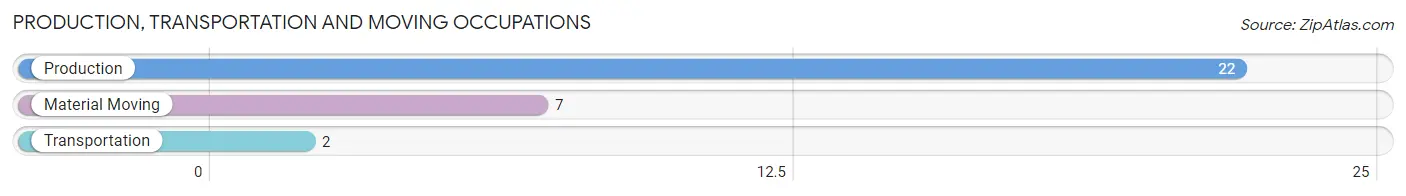
Production, Transportation and Moving Occupations
The most common Production, Transportation and Moving occupations in Rocky Mountain are Production (22 | 9.5%), Material Moving (7 | 3.0%), and Transportation (2 | 0.9%).
Production, Transportation and Moving Occupations by Sex
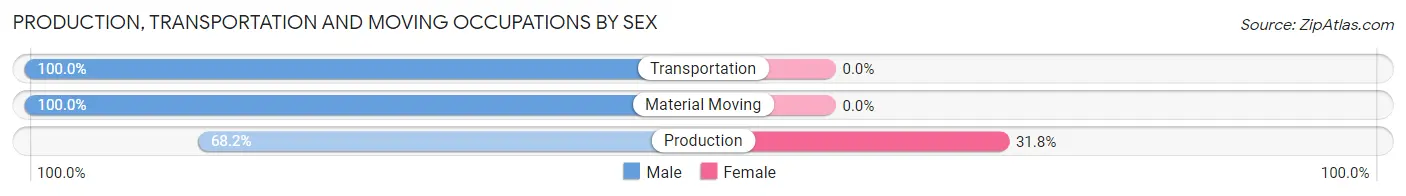
| Occupation | Male | Female |
| Production | 15 (68.2%) | 7 (31.8%) |
| Transportation | 2 (100.0%) | 0 (0.0%) |
| Material Moving | 7 (100.0%) | 0 (0.0%) |
| Total (Category) | 24 (77.4%) | 7 (22.6%) |
| Total (Overall) | 113 (48.7%) | 119 (51.3%) |
Employment Industries by Sex in Rocky Mountain
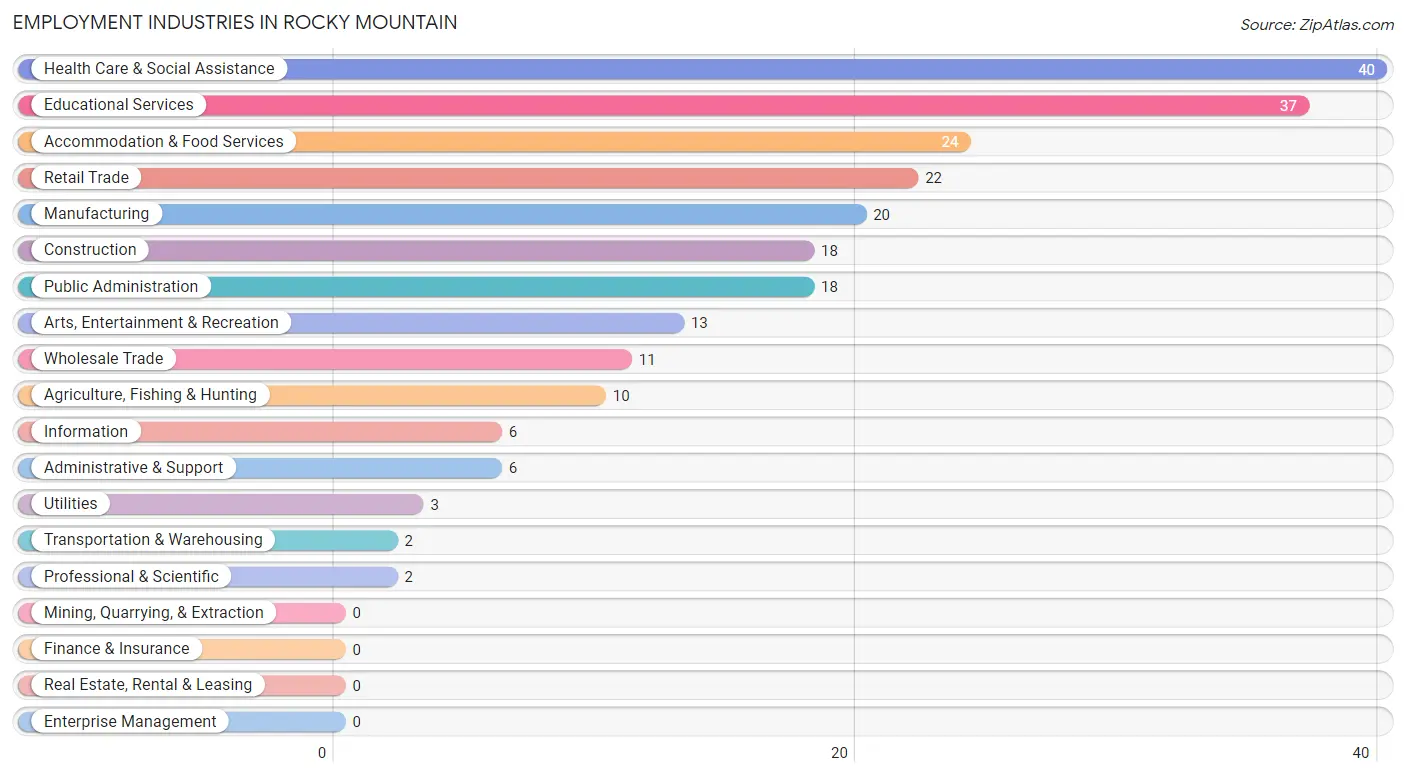
Employment Industries in Rocky Mountain
The major employment industries in Rocky Mountain include Health Care & Social Assistance (40 | 17.2%), Educational Services (37 | 16.0%), Accommodation & Food Services (24 | 10.3%), Retail Trade (22 | 9.5%), and Manufacturing (20 | 8.6%).
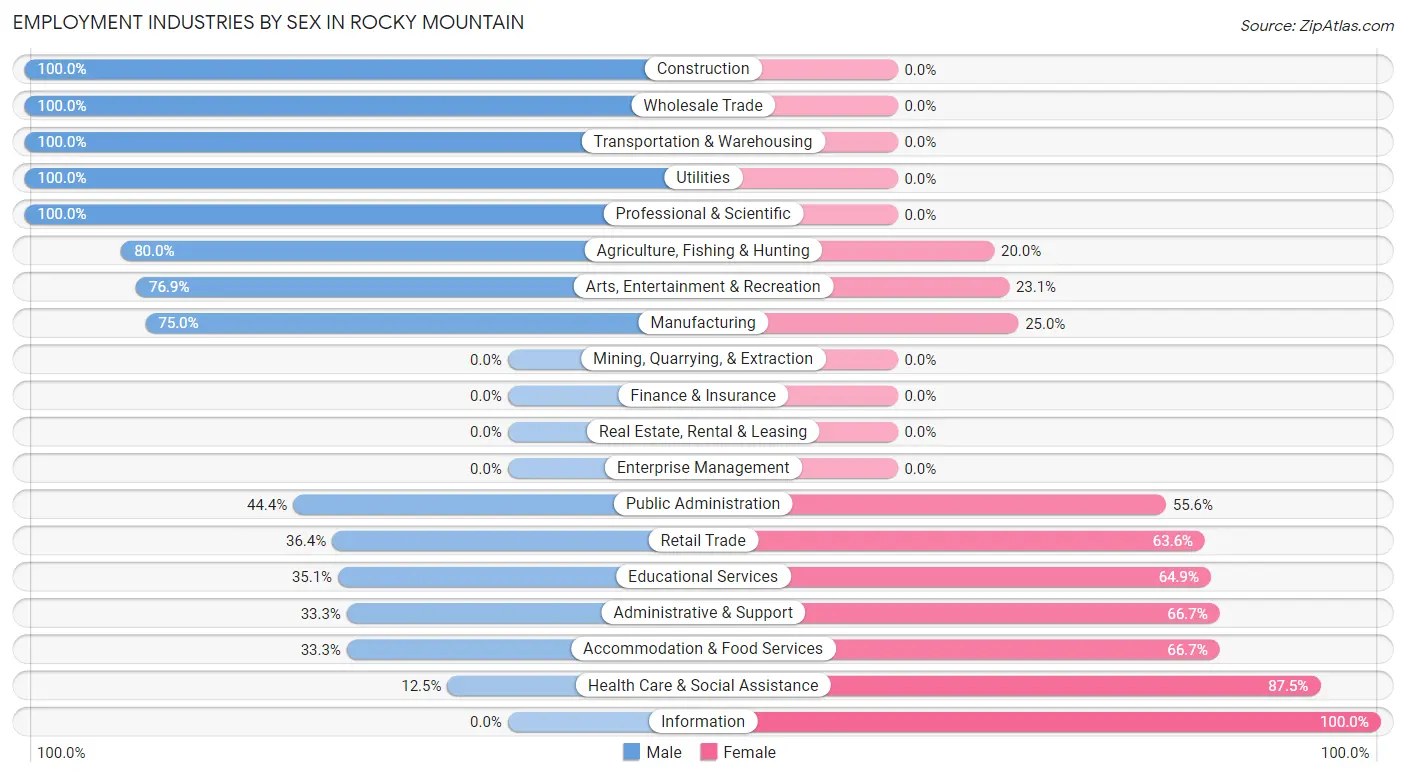
Employment Industries by Sex in Rocky Mountain
The Rocky Mountain industries that see more men than women are Construction (100.0%), Wholesale Trade (100.0%), and Transportation & Warehousing (100.0%), whereas the industries that tend to have a higher number of women are Information (100.0%), Health Care & Social Assistance (87.5%), and Administrative & Support (66.7%).
| Industry | Male | Female |
| Agriculture, Fishing & Hunting | 8 (80.0%) | 2 (20.0%) |
| Mining, Quarrying, & Extraction | 0 (0.0%) | 0 (0.0%) |
| Construction | 18 (100.0%) | 0 (0.0%) |
| Manufacturing | 15 (75.0%) | 5 (25.0%) |
| Wholesale Trade | 11 (100.0%) | 0 (0.0%) |
| Retail Trade | 8 (36.4%) | 14 (63.6%) |
| Transportation & Warehousing | 2 (100.0%) | 0 (0.0%) |
| Utilities | 3 (100.0%) | 0 (0.0%) |
| Information | 0 (0.0%) | 6 (100.0%) |
| Finance & Insurance | 0 (0.0%) | 0 (0.0%) |
| Real Estate, Rental & Leasing | 0 (0.0%) | 0 (0.0%) |
| Professional & Scientific | 2 (100.0%) | 0 (0.0%) |
| Enterprise Management | 0 (0.0%) | 0 (0.0%) |
| Administrative & Support | 2 (33.3%) | 4 (66.7%) |
| Educational Services | 13 (35.1%) | 24 (64.9%) |
| Health Care & Social Assistance | 5 (12.5%) | 35 (87.5%) |
| Arts, Entertainment & Recreation | 10 (76.9%) | 3 (23.1%) |
| Accommodation & Food Services | 8 (33.3%) | 16 (66.7%) |
| Public Administration | 8 (44.4%) | 10 (55.6%) |
| Total | 113 (48.7%) | 119 (51.3%) |
Education in Rocky Mountain
School Enrollment in Rocky Mountain
The most common levels of schooling among the 139 students in Rocky Mountain are high school (39 | 28.1%), elementary school (29 | 20.9%), and middle school (26 | 18.7%).
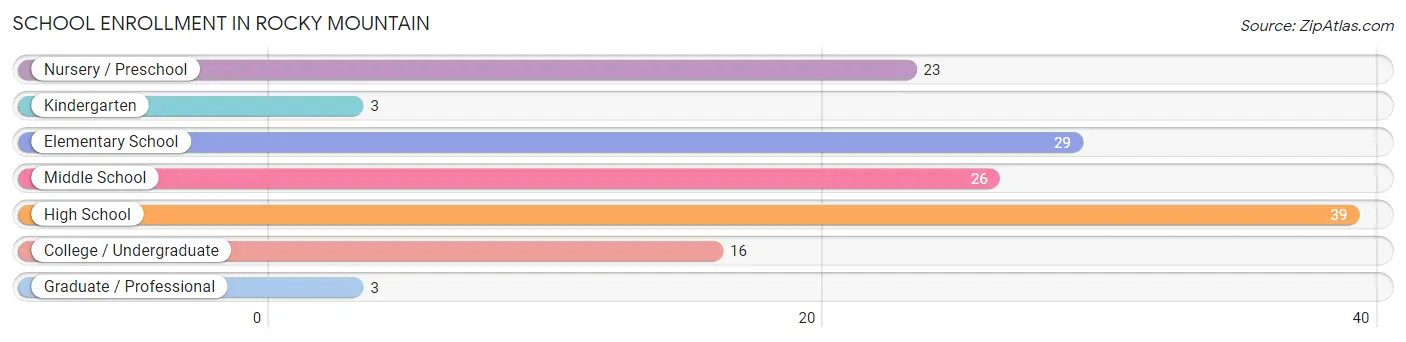
| School Level | # Students | % Students |
| Nursery / Preschool | 23 | 16.6% |
| Kindergarten | 3 | 2.2% |
| Elementary School | 29 | 20.9% |
| Middle School | 26 | 18.7% |
| High School | 39 | 28.1% |
| College / Undergraduate | 16 | 11.5% |
| Graduate / Professional | 3 | 2.2% |
| Total | 139 | 100.0% |
School Enrollment by Age by Funding Source in Rocky Mountain
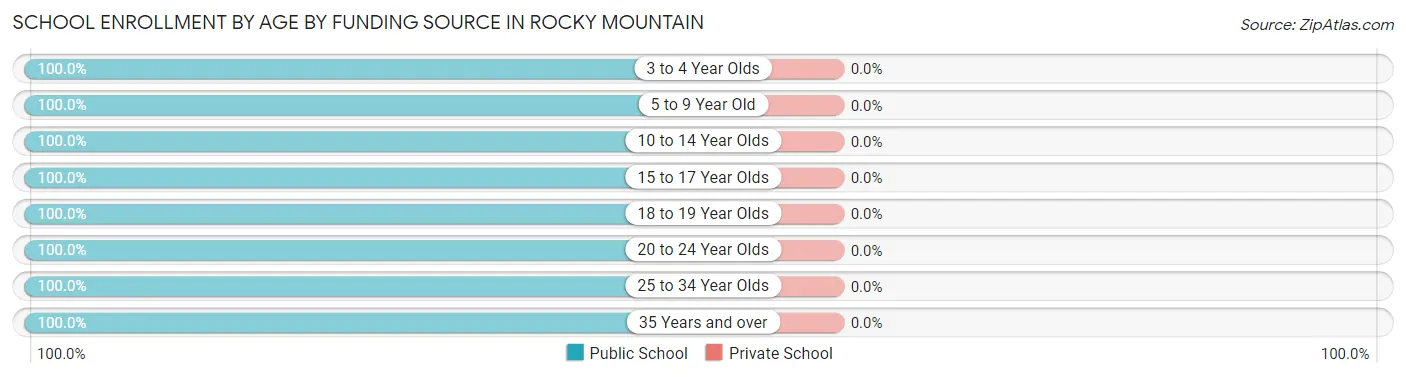
| Age Bracket | Public School | Private School |
| 3 to 4 Year Olds | 18 (100.0%) | 0 (0.0%) |
| 5 to 9 Year Old | 24 (100.0%) | 0 (0.0%) |
| 10 to 14 Year Olds | 47 (100.0%) | 0 (0.0%) |
| 15 to 17 Year Olds | 11 (100.0%) | 0 (0.0%) |
| 18 to 19 Year Olds | 17 (100.0%) | 0 (0.0%) |
| 20 to 24 Year Olds | 9 (100.0%) | 0 (0.0%) |
| 25 to 34 Year Olds | 6 (100.0%) | 0 (0.0%) |
| 35 Years and over | 7 (100.0%) | 0 (0.0%) |
| Total | 139 (100.0%) | 0 (0.0%) |
Educational Attainment by Field of Study in Rocky Mountain
Education (29 | 42.0%), science & technology (10 | 14.5%), psychology (8 | 11.6%), arts & humanities (7 | 10.1%), and business (6 | 8.7%) are the most common fields of study among 69 individuals in Rocky Mountain who have obtained a bachelor's degree or higher.
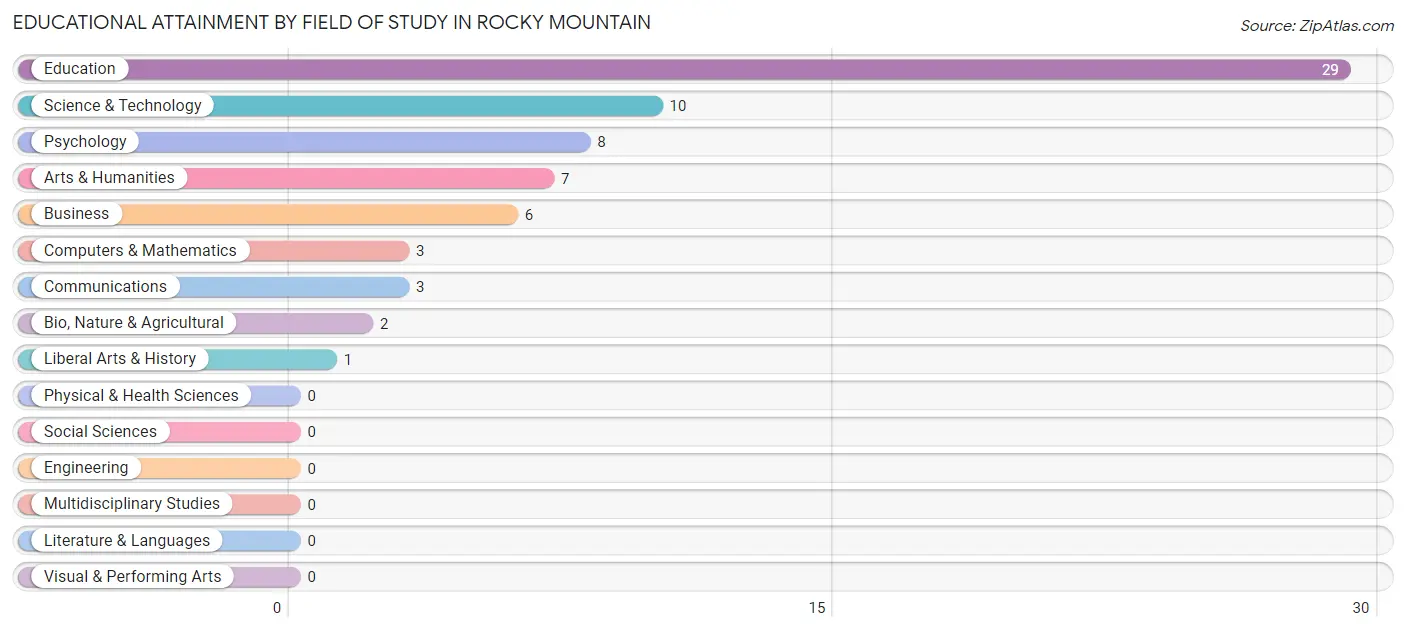
| Field of Study | # Graduates | % Graduates |
| Computers & Mathematics | 3 | 4.3% |
| Bio, Nature & Agricultural | 2 | 2.9% |
| Physical & Health Sciences | 0 | 0.0% |
| Psychology | 8 | 11.6% |
| Social Sciences | 0 | 0.0% |
| Engineering | 0 | 0.0% |
| Multidisciplinary Studies | 0 | 0.0% |
| Science & Technology | 10 | 14.5% |
| Business | 6 | 8.7% |
| Education | 29 | 42.0% |
| Literature & Languages | 0 | 0.0% |
| Liberal Arts & History | 1 | 1.5% |
| Visual & Performing Arts | 0 | 0.0% |
| Communications | 3 | 4.3% |
| Arts & Humanities | 7 | 10.1% |
| Total | 69 | 100.0% |
Transportation & Commute in Rocky Mountain
Vehicle Availability by Sex in Rocky Mountain
The most prevalent vehicle ownership categories in Rocky Mountain are males with 2 vehicles (47, accounting for 42.3%) and females with 2 vehicles (46, making up 39.5%).
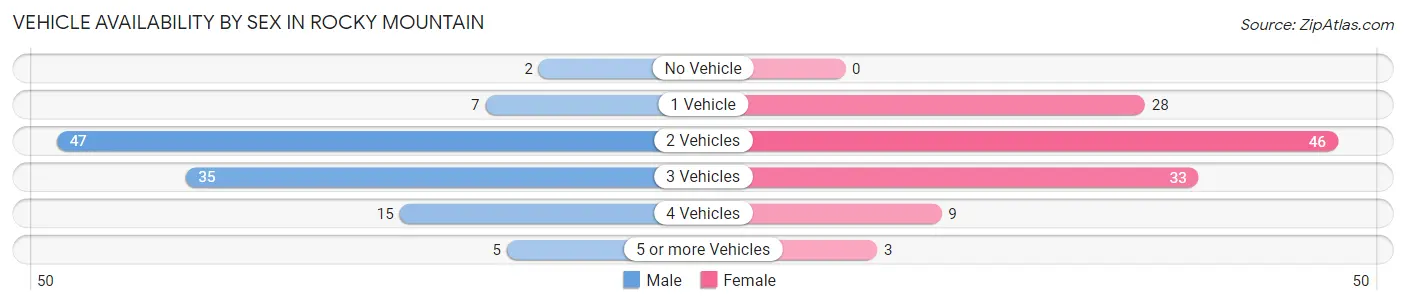
| Vehicles Available | Male | Female |
| No Vehicle | 2 (1.8%) | 0 (0.0%) |
| 1 Vehicle | 7 (6.3%) | 28 (23.5%) |
| 2 Vehicles | 47 (42.3%) | 46 (38.7%) |
| 3 Vehicles | 35 (31.5%) | 33 (27.7%) |
| 4 Vehicles | 15 (13.5%) | 9 (7.6%) |
| 5 or more Vehicles | 5 (4.5%) | 3 (2.5%) |
| Total | 111 (100.0%) | 119 (100.0%) |
Commute Time in Rocky Mountain
The most frequently occuring commute durations in Rocky Mountain are 20 to 24 minutes (48 commuters, 22.0%), 15 to 19 minutes (43 commuters, 19.7%), and 10 to 14 minutes (36 commuters, 16.5%).
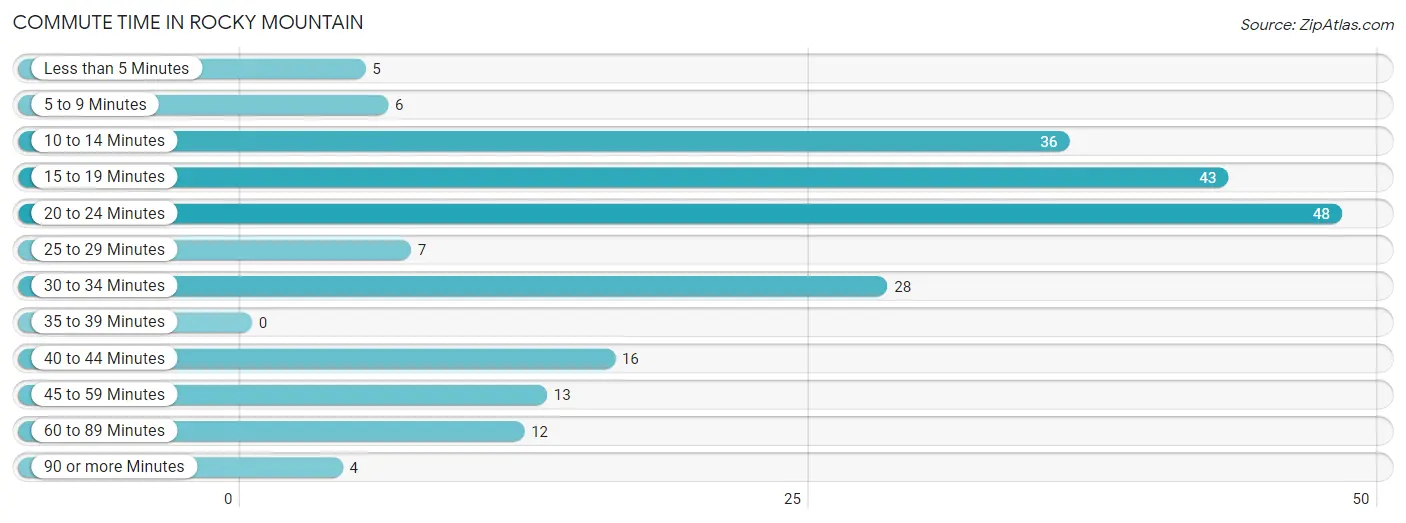
| Commute Time | # Commuters | % Commuters |
| Less than 5 Minutes | 5 | 2.3% |
| 5 to 9 Minutes | 6 | 2.8% |
| 10 to 14 Minutes | 36 | 16.5% |
| 15 to 19 Minutes | 43 | 19.7% |
| 20 to 24 Minutes | 48 | 22.0% |
| 25 to 29 Minutes | 7 | 3.2% |
| 30 to 34 Minutes | 28 | 12.8% |
| 35 to 39 Minutes | 0 | 0.0% |
| 40 to 44 Minutes | 16 | 7.3% |
| 45 to 59 Minutes | 13 | 6.0% |
| 60 to 89 Minutes | 12 | 5.5% |
| 90 or more Minutes | 4 | 1.8% |
Commute Time by Sex in Rocky Mountain
The most common commute times in Rocky Mountain are 20 to 24 minutes (31 commuters, 29.5%) for males and 15 to 19 minutes (31 commuters, 27.4%) for females.
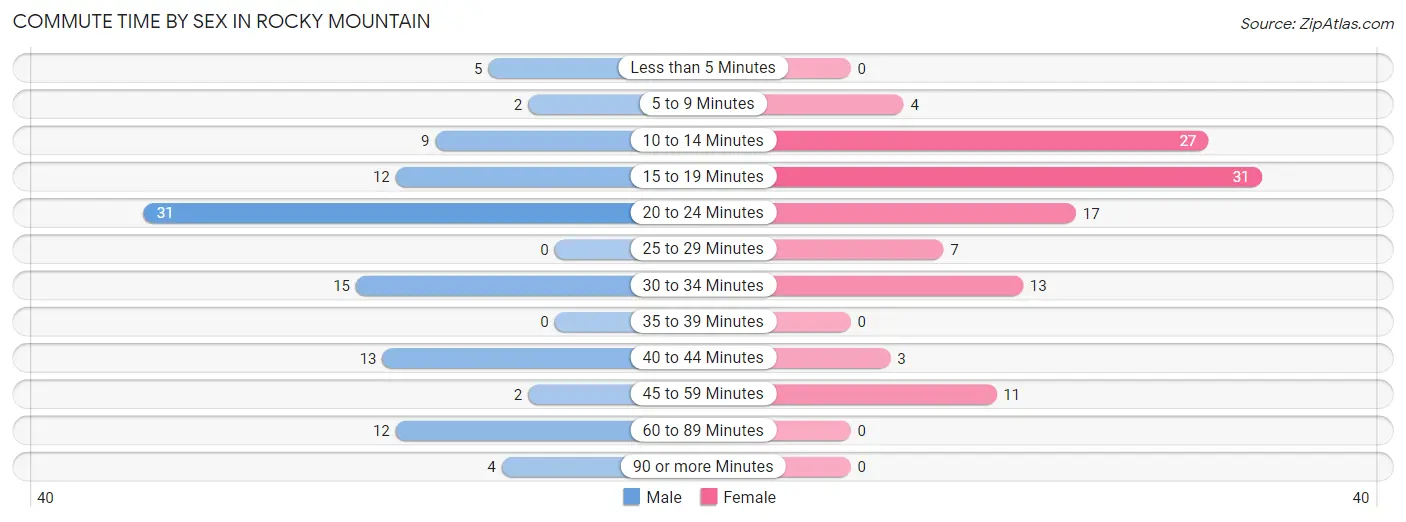
| Commute Time | Male | Female |
| Less than 5 Minutes | 5 (4.8%) | 0 (0.0%) |
| 5 to 9 Minutes | 2 (1.9%) | 4 (3.5%) |
| 10 to 14 Minutes | 9 (8.6%) | 27 (23.9%) |
| 15 to 19 Minutes | 12 (11.4%) | 31 (27.4%) |
| 20 to 24 Minutes | 31 (29.5%) | 17 (15.0%) |
| 25 to 29 Minutes | 0 (0.0%) | 7 (6.2%) |
| 30 to 34 Minutes | 15 (14.3%) | 13 (11.5%) |
| 35 to 39 Minutes | 0 (0.0%) | 0 (0.0%) |
| 40 to 44 Minutes | 13 (12.4%) | 3 (2.6%) |
| 45 to 59 Minutes | 2 (1.9%) | 11 (9.7%) |
| 60 to 89 Minutes | 12 (11.4%) | 0 (0.0%) |
| 90 or more Minutes | 4 (3.8%) | 0 (0.0%) |
Time of Departure to Work by Sex in Rocky Mountain
The most frequent times of departure to work in Rocky Mountain are 12:00 AM to 4:59 AM (23, 21.9%) for males and 7:00 AM to 7:29 AM (31, 27.4%) for females.
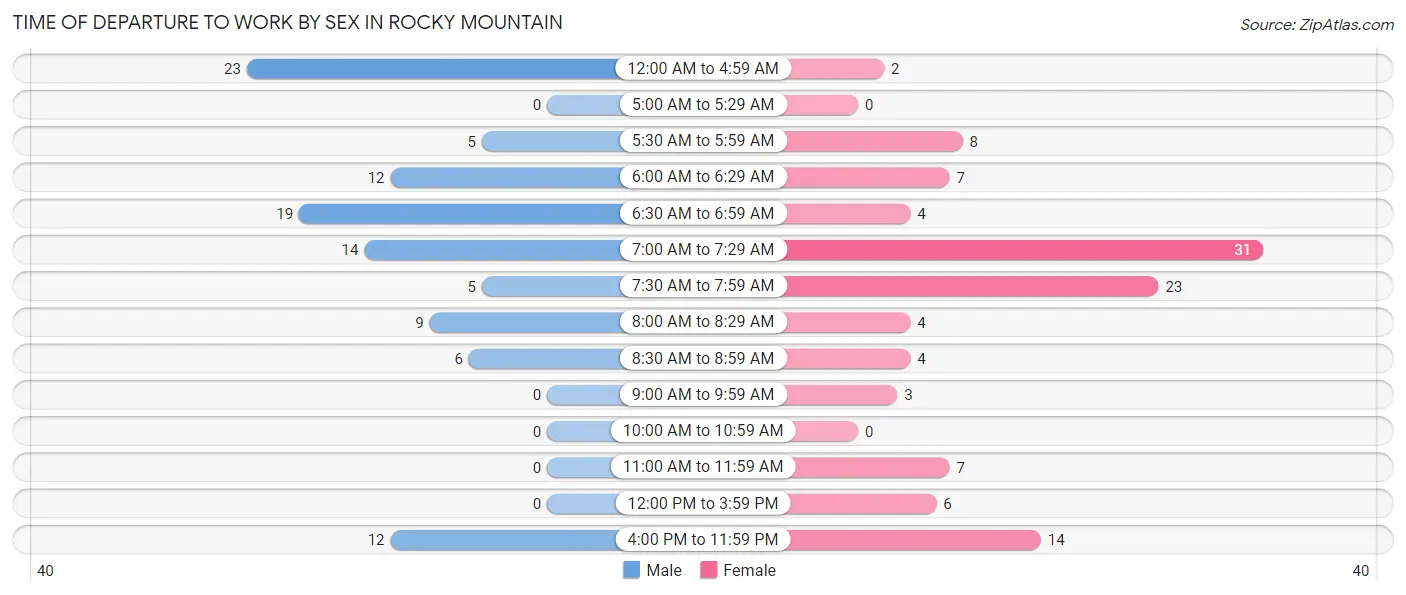
| Time of Departure | Male | Female |
| 12:00 AM to 4:59 AM | 23 (21.9%) | 2 (1.8%) |
| 5:00 AM to 5:29 AM | 0 (0.0%) | 0 (0.0%) |
| 5:30 AM to 5:59 AM | 5 (4.8%) | 8 (7.1%) |
| 6:00 AM to 6:29 AM | 12 (11.4%) | 7 (6.2%) |
| 6:30 AM to 6:59 AM | 19 (18.1%) | 4 (3.5%) |
| 7:00 AM to 7:29 AM | 14 (13.3%) | 31 (27.4%) |
| 7:30 AM to 7:59 AM | 5 (4.8%) | 23 (20.3%) |
| 8:00 AM to 8:29 AM | 9 (8.6%) | 4 (3.5%) |
| 8:30 AM to 8:59 AM | 6 (5.7%) | 4 (3.5%) |
| 9:00 AM to 9:59 AM | 0 (0.0%) | 3 (2.6%) |
| 10:00 AM to 10:59 AM | 0 (0.0%) | 0 (0.0%) |
| 11:00 AM to 11:59 AM | 0 (0.0%) | 7 (6.2%) |
| 12:00 PM to 3:59 PM | 0 (0.0%) | 6 (5.3%) |
| 4:00 PM to 11:59 PM | 12 (11.4%) | 14 (12.4%) |
| Total | 105 (100.0%) | 113 (100.0%) |
Housing Occupancy in Rocky Mountain
Occupancy by Ownership in Rocky Mountain
Of the total 194 dwellings in Rocky Mountain, owner-occupied units account for 161 (83.0%), while renter-occupied units make up 33 (17.0%).
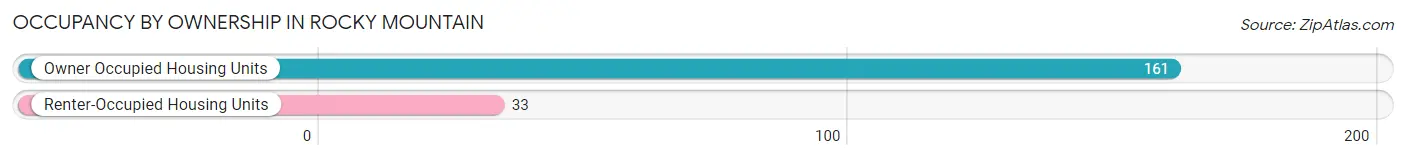
| Occupancy | # Housing Units | % Housing Units |
| Owner Occupied Housing Units | 161 | 83.0% |
| Renter-Occupied Housing Units | 33 | 17.0% |
| Total Occupied Housing Units | 194 | 100.0% |
Occupancy by Household Size in Rocky Mountain
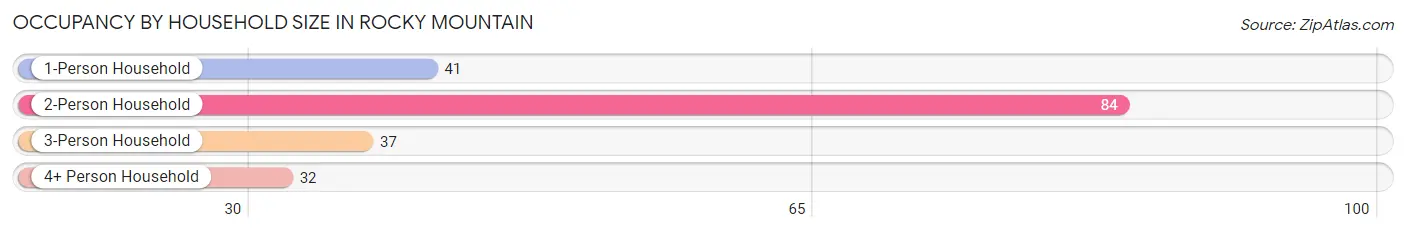
| Household Size | # Housing Units | % Housing Units |
| 1-Person Household | 41 | 21.1% |
| 2-Person Household | 84 | 43.3% |
| 3-Person Household | 37 | 19.1% |
| 4+ Person Household | 32 | 16.5% |
| Total Housing Units | 194 | 100.0% |
Occupancy by Ownership by Household Size in Rocky Mountain
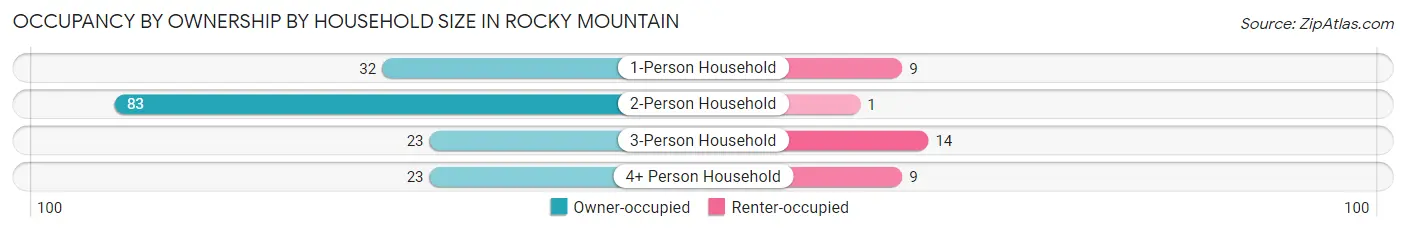
| Household Size | Owner-occupied | Renter-occupied |
| 1-Person Household | 32 (78.0%) | 9 (22.0%) |
| 2-Person Household | 83 (98.8%) | 1 (1.2%) |
| 3-Person Household | 23 (62.2%) | 14 (37.8%) |
| 4+ Person Household | 23 (71.9%) | 9 (28.1%) |
| Total Housing Units | 161 (83.0%) | 33 (17.0%) |
Occupancy by Educational Attainment in Rocky Mountain
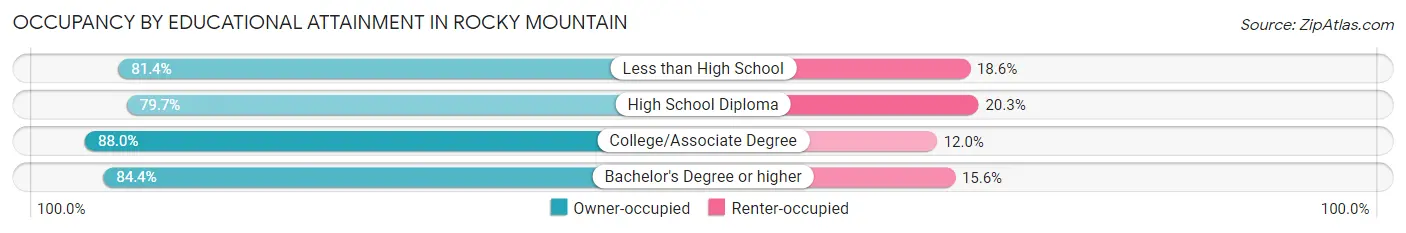
| Household Size | Owner-occupied | Renter-occupied |
| Less than High School | 35 (81.4%) | 8 (18.6%) |
| High School Diploma | 55 (79.7%) | 14 (20.3%) |
| College/Associate Degree | 44 (88.0%) | 6 (12.0%) |
| Bachelor's Degree or higher | 27 (84.4%) | 5 (15.6%) |
Occupancy by Age of Householder in Rocky Mountain
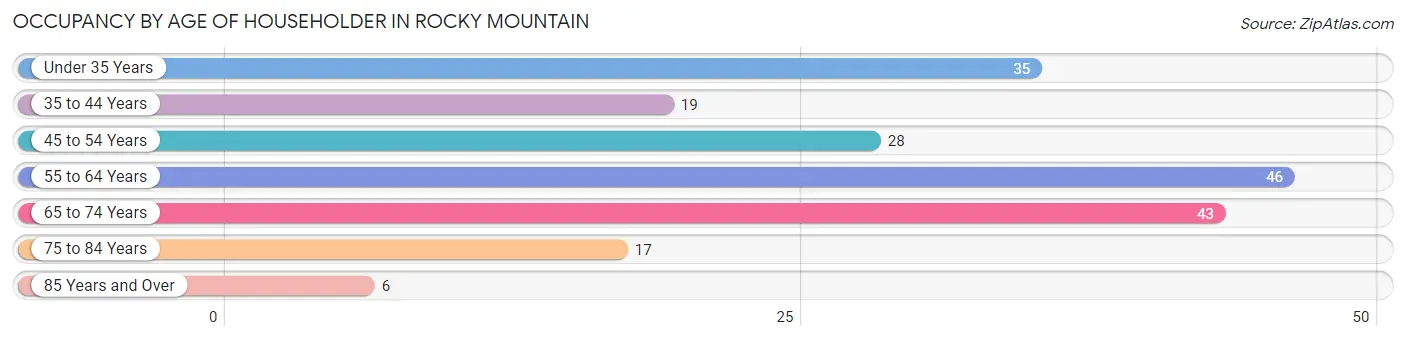
| Age Bracket | # Households | % Households |
| Under 35 Years | 35 | 18.0% |
| 35 to 44 Years | 19 | 9.8% |
| 45 to 54 Years | 28 | 14.4% |
| 55 to 64 Years | 46 | 23.7% |
| 65 to 74 Years | 43 | 22.2% |
| 75 to 84 Years | 17 | 8.8% |
| 85 Years and Over | 6 | 3.1% |
| Total | 194 | 100.0% |
Housing Finances in Rocky Mountain
Median Income by Occupancy in Rocky Mountain
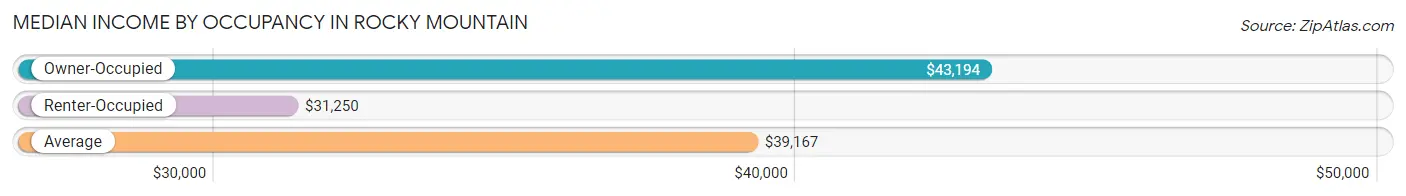
| Occupancy Type | # Households | Median Income |
| Owner-Occupied | 161 (83.0%) | $43,194 |
| Renter-Occupied | 33 (17.0%) | $31,250 |
| Average | 194 (100.0%) | $39,167 |
Occupancy by Householder Income Bracket in Rocky Mountain
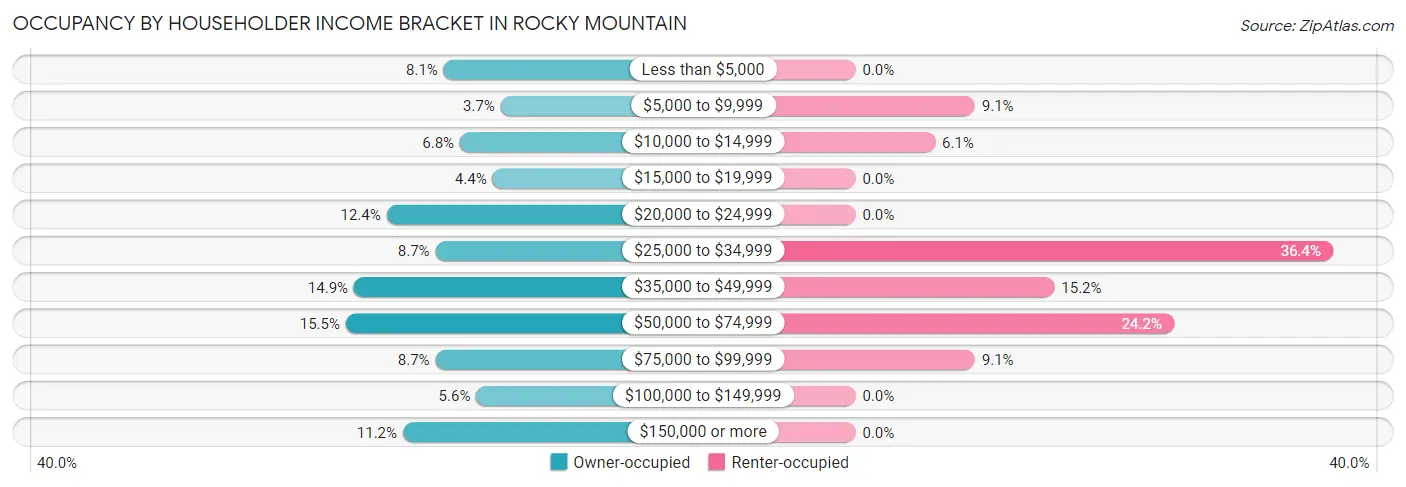
| Income Bracket | Owner-occupied | Renter-occupied |
| Less than $5,000 | 13 (8.1%) | 0 (0.0%) |
| $5,000 to $9,999 | 6 (3.7%) | 3 (9.1%) |
| $10,000 to $14,999 | 11 (6.8%) | 2 (6.1%) |
| $15,000 to $19,999 | 7 (4.3%) | 0 (0.0%) |
| $20,000 to $24,999 | 20 (12.4%) | 0 (0.0%) |
| $25,000 to $34,999 | 14 (8.7%) | 12 (36.4%) |
| $35,000 to $49,999 | 24 (14.9%) | 5 (15.1%) |
| $50,000 to $74,999 | 25 (15.5%) | 8 (24.2%) |
| $75,000 to $99,999 | 14 (8.7%) | 3 (9.1%) |
| $100,000 to $149,999 | 9 (5.6%) | 0 (0.0%) |
| $150,000 or more | 18 (11.2%) | 0 (0.0%) |
| Total | 161 (100.0%) | 33 (100.0%) |
Monthly Housing Cost Tiers in Rocky Mountain
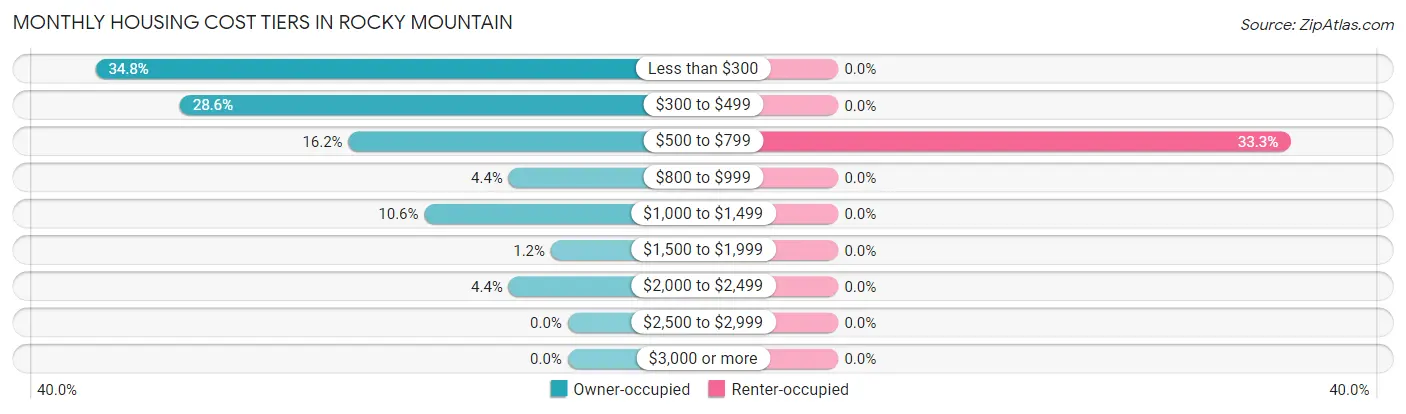
| Monthly Cost | Owner-occupied | Renter-occupied |
| Less than $300 | 56 (34.8%) | 0 (0.0%) |
| $300 to $499 | 46 (28.6%) | 0 (0.0%) |
| $500 to $799 | 26 (16.2%) | 11 (33.3%) |
| $800 to $999 | 7 (4.3%) | 0 (0.0%) |
| $1,000 to $1,499 | 17 (10.6%) | 0 (0.0%) |
| $1,500 to $1,999 | 2 (1.2%) | 0 (0.0%) |
| $2,000 to $2,499 | 7 (4.3%) | 0 (0.0%) |
| $2,500 to $2,999 | 0 (0.0%) | 0 (0.0%) |
| $3,000 or more | 0 (0.0%) | 0 (0.0%) |
| Total | 161 (100.0%) | 33 (100.0%) |
Physical Housing Characteristics in Rocky Mountain
Housing Structures in Rocky Mountain
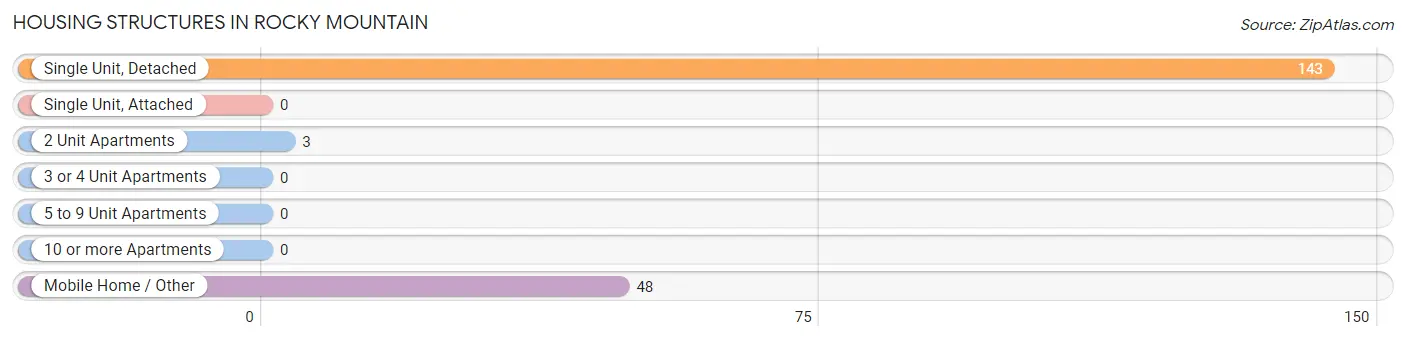
| Structure Type | # Housing Units | % Housing Units |
| Single Unit, Detached | 143 | 73.7% |
| Single Unit, Attached | 0 | 0.0% |
| 2 Unit Apartments | 3 | 1.5% |
| 3 or 4 Unit Apartments | 0 | 0.0% |
| 5 to 9 Unit Apartments | 0 | 0.0% |
| 10 or more Apartments | 0 | 0.0% |
| Mobile Home / Other | 48 | 24.7% |
| Total | 194 | 100.0% |
Housing Structures by Occupancy in Rocky Mountain
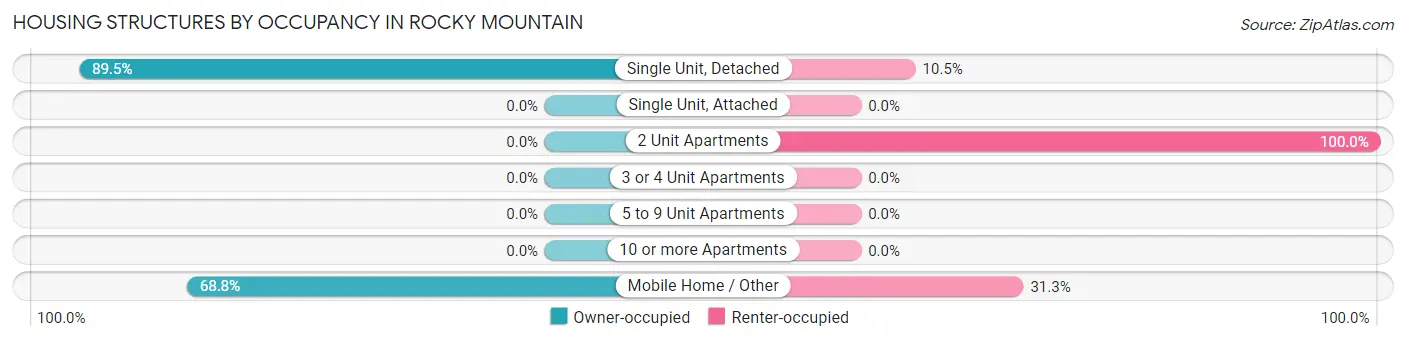
| Structure Type | Owner-occupied | Renter-occupied |
| Single Unit, Detached | 128 (89.5%) | 15 (10.5%) |
| Single Unit, Attached | 0 (0.0%) | 0 (0.0%) |
| 2 Unit Apartments | 0 (0.0%) | 3 (100.0%) |
| 3 or 4 Unit Apartments | 0 (0.0%) | 0 (0.0%) |
| 5 to 9 Unit Apartments | 0 (0.0%) | 0 (0.0%) |
| 10 or more Apartments | 0 (0.0%) | 0 (0.0%) |
| Mobile Home / Other | 33 (68.8%) | 15 (31.2%) |
| Total | 161 (83.0%) | 33 (17.0%) |
Housing Structures by Number of Rooms in Rocky Mountain
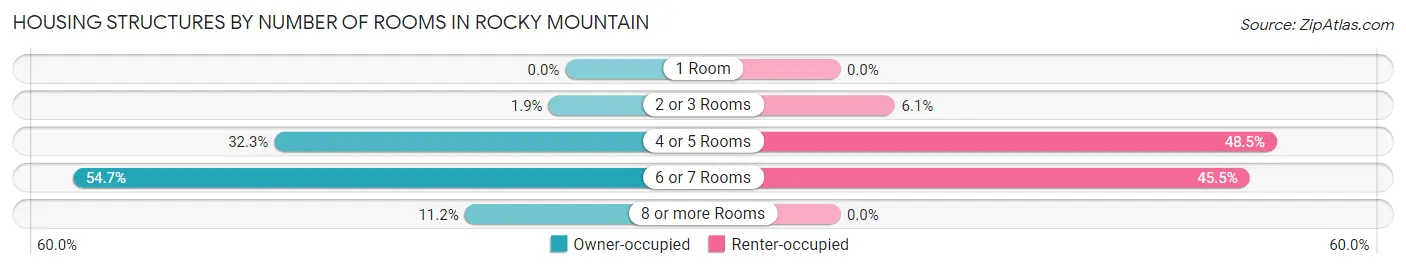
| Number of Rooms | Owner-occupied | Renter-occupied |
| 1 Room | 0 (0.0%) | 0 (0.0%) |
| 2 or 3 Rooms | 3 (1.9%) | 2 (6.1%) |
| 4 or 5 Rooms | 52 (32.3%) | 16 (48.5%) |
| 6 or 7 Rooms | 88 (54.7%) | 15 (45.5%) |
| 8 or more Rooms | 18 (11.2%) | 0 (0.0%) |
| Total | 161 (100.0%) | 33 (100.0%) |
Housing Structure by Heating Type in Rocky Mountain
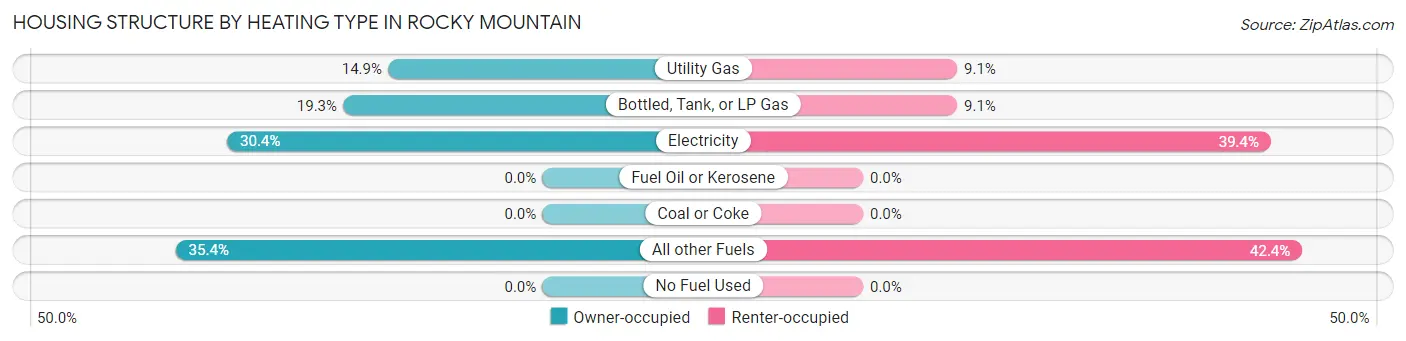
| Heating Type | Owner-occupied | Renter-occupied |
| Utility Gas | 24 (14.9%) | 3 (9.1%) |
| Bottled, Tank, or LP Gas | 31 (19.3%) | 3 (9.1%) |
| Electricity | 49 (30.4%) | 13 (39.4%) |
| Fuel Oil or Kerosene | 0 (0.0%) | 0 (0.0%) |
| Coal or Coke | 0 (0.0%) | 0 (0.0%) |
| All other Fuels | 57 (35.4%) | 14 (42.4%) |
| No Fuel Used | 0 (0.0%) | 0 (0.0%) |
| Total | 161 (100.0%) | 33 (100.0%) |
Household Vehicle Usage in Rocky Mountain
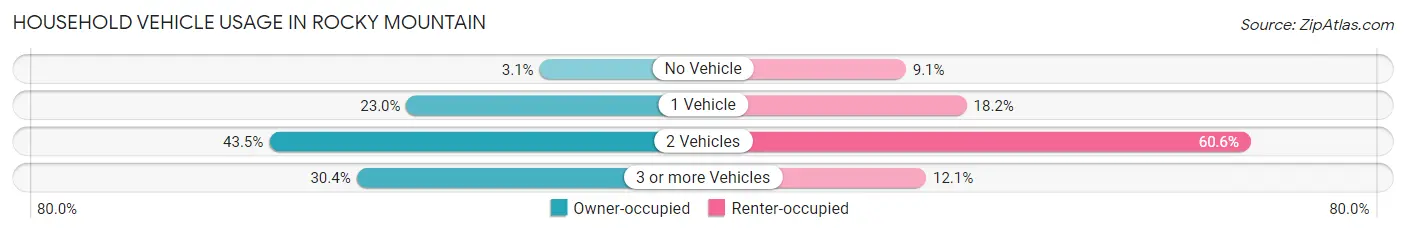
| Vehicles per Household | Owner-occupied | Renter-occupied |
| No Vehicle | 5 (3.1%) | 3 (9.1%) |
| 1 Vehicle | 37 (23.0%) | 6 (18.2%) |
| 2 Vehicles | 70 (43.5%) | 20 (60.6%) |
| 3 or more Vehicles | 49 (30.4%) | 4 (12.1%) |
| Total | 161 (100.0%) | 33 (100.0%) |
Real Estate & Mortgages in Rocky Mountain
Real Estate and Mortgage Overview in Rocky Mountain
| Characteristic | Without Mortgage | With Mortgage |
| Housing Units | 123 | 38 |
| Median Property Value | $113,500 | $168,200 |
| Median Household Income | $33,750 | $9 |
| Monthly Housing Costs | $318 | $0 |
| Real Estate Taxes | $521 | $3 |
Property Value by Mortgage Status in Rocky Mountain
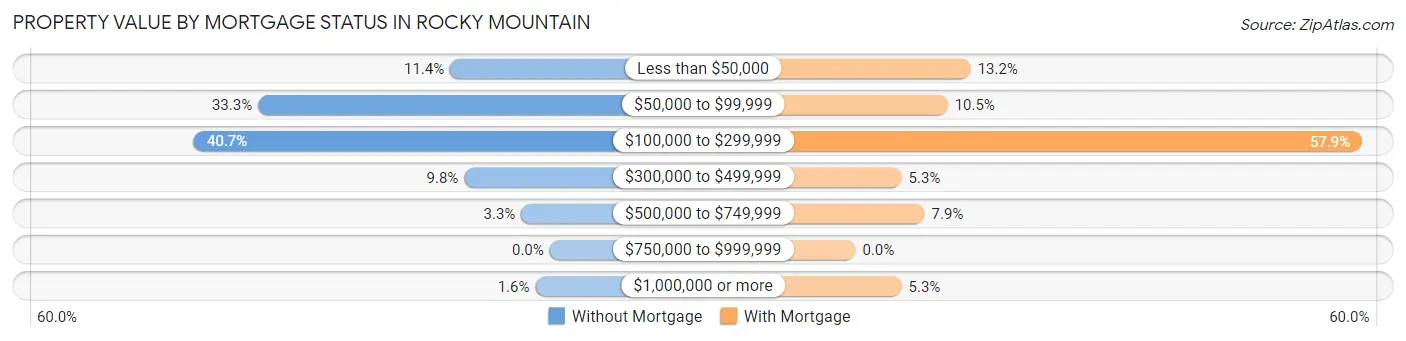
| Property Value | Without Mortgage | With Mortgage |
| Less than $50,000 | 14 (11.4%) | 5 (13.2%) |
| $50,000 to $99,999 | 41 (33.3%) | 4 (10.5%) |
| $100,000 to $299,999 | 50 (40.6%) | 22 (57.9%) |
| $300,000 to $499,999 | 12 (9.8%) | 2 (5.3%) |
| $500,000 to $749,999 | 4 (3.3%) | 3 (7.9%) |
| $750,000 to $999,999 | 0 (0.0%) | 0 (0.0%) |
| $1,000,000 or more | 2 (1.6%) | 2 (5.3%) |
| Total | 123 (100.0%) | 38 (100.0%) |
Household Income by Mortgage Status in Rocky Mountain
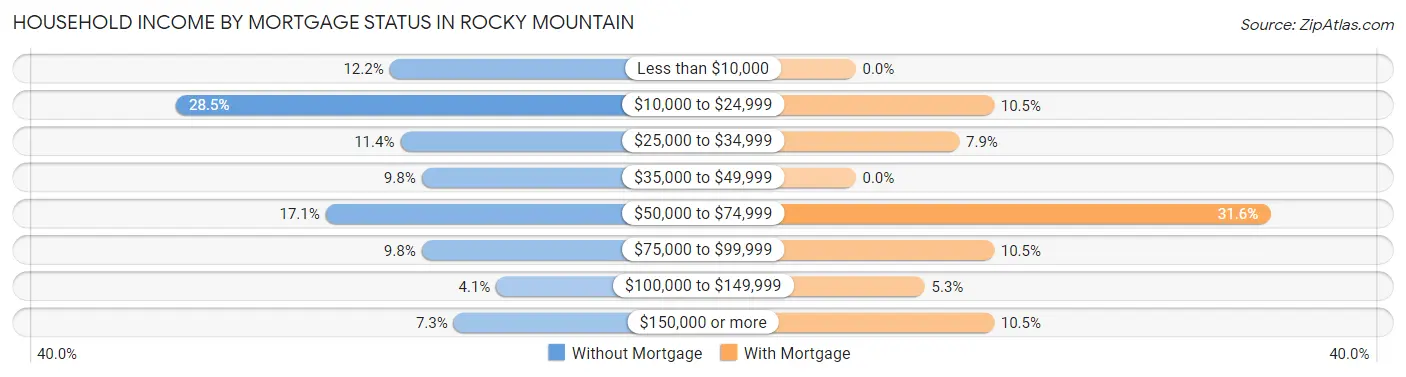
| Household Income | Without Mortgage | With Mortgage |
| Less than $10,000 | 15 (12.2%) | 0 (0.0%) |
| $10,000 to $24,999 | 35 (28.5%) | 4 (10.5%) |
| $25,000 to $34,999 | 14 (11.4%) | 3 (7.9%) |
| $35,000 to $49,999 | 12 (9.8%) | 0 (0.0%) |
| $50,000 to $74,999 | 21 (17.1%) | 12 (31.6%) |
| $75,000 to $99,999 | 12 (9.8%) | 4 (10.5%) |
| $100,000 to $149,999 | 5 (4.1%) | 2 (5.3%) |
| $150,000 or more | 9 (7.3%) | 4 (10.5%) |
| Total | 123 (100.0%) | 38 (100.0%) |
Property Value to Household Income Ratio in Rocky Mountain
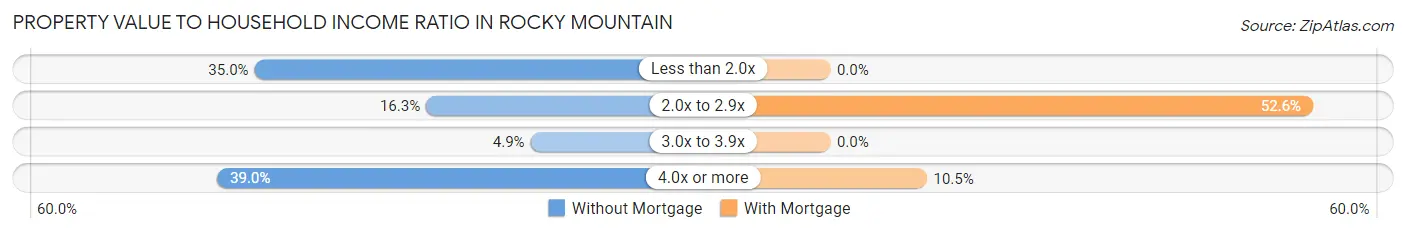
| Value-to-Income Ratio | Without Mortgage | With Mortgage |
| Less than 2.0x | 43 (35.0%) | 0 (0.0%) |
| 2.0x to 2.9x | 20 (16.3%) | 20 (52.6%) |
| 3.0x to 3.9x | 6 (4.9%) | 0 (0.0%) |
| 4.0x or more | 48 (39.0%) | 4 (10.5%) |
| Total | 123 (100.0%) | 38 (100.0%) |
Real Estate Taxes by Mortgage Status in Rocky Mountain
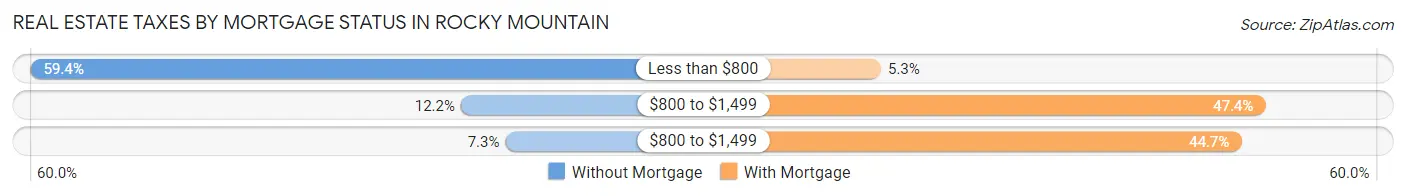
| Property Taxes | Without Mortgage | With Mortgage |
| Less than $800 | 73 (59.4%) | 2 (5.3%) |
| $800 to $1,499 | 15 (12.2%) | 18 (47.4%) |
| $800 to $1,499 | 9 (7.3%) | 17 (44.7%) |
| Total | 123 (100.0%) | 38 (100.0%) |
Health & Disability in Rocky Mountain
Health Insurance Coverage by Age in Rocky Mountain
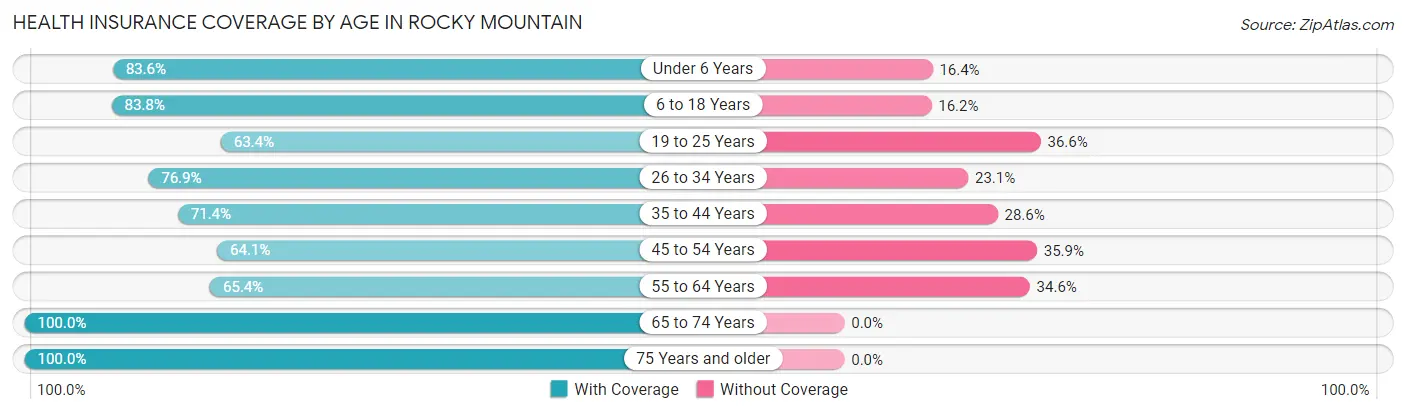
| Age Bracket | With Coverage | Without Coverage |
| Under 6 Years | 61 (83.6%) | 12 (16.4%) |
| 6 to 18 Years | 93 (83.8%) | 18 (16.2%) |
| 19 to 25 Years | 26 (63.4%) | 15 (36.6%) |
| 26 to 34 Years | 40 (76.9%) | 12 (23.1%) |
| 35 to 44 Years | 50 (71.4%) | 20 (28.6%) |
| 45 to 54 Years | 50 (64.1%) | 28 (35.9%) |
| 55 to 64 Years | 53 (65.4%) | 28 (34.6%) |
| 65 to 74 Years | 60 (100.0%) | 0 (0.0%) |
| 75 Years and older | 32 (100.0%) | 0 (0.0%) |
| Total | 465 (77.8%) | 133 (22.2%) |
Health Insurance Coverage by Citizenship Status in Rocky Mountain
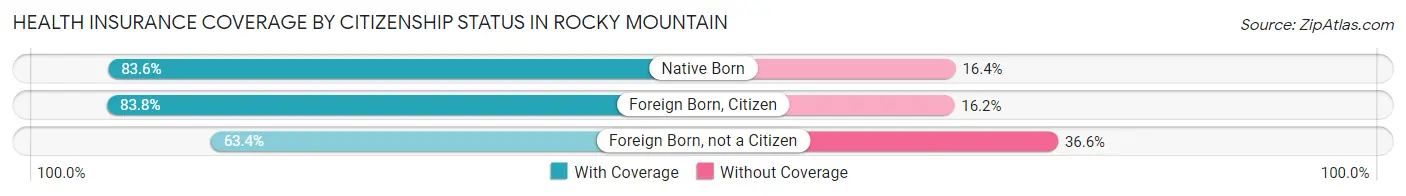
| Citizenship Status | With Coverage | Without Coverage |
| Native Born | 61 (83.6%) | 12 (16.4%) |
| Foreign Born, Citizen | 93 (83.8%) | 18 (16.2%) |
| Foreign Born, not a Citizen | 26 (63.4%) | 15 (36.6%) |
Health Insurance Coverage by Household Income in Rocky Mountain
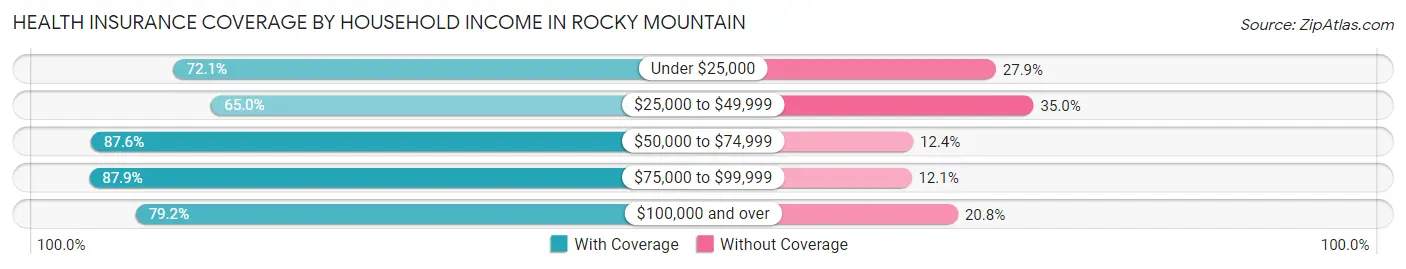
| Household Income | With Coverage | Without Coverage |
| Under $25,000 | 80 (72.1%) | 31 (27.9%) |
| $25,000 to $49,999 | 91 (65.0%) | 49 (35.0%) |
| $50,000 to $74,999 | 141 (87.6%) | 20 (12.4%) |
| $75,000 to $99,999 | 58 (87.9%) | 8 (12.1%) |
| $100,000 and over | 95 (79.2%) | 25 (20.8%) |
Public vs Private Health Insurance Coverage by Age in Rocky Mountain
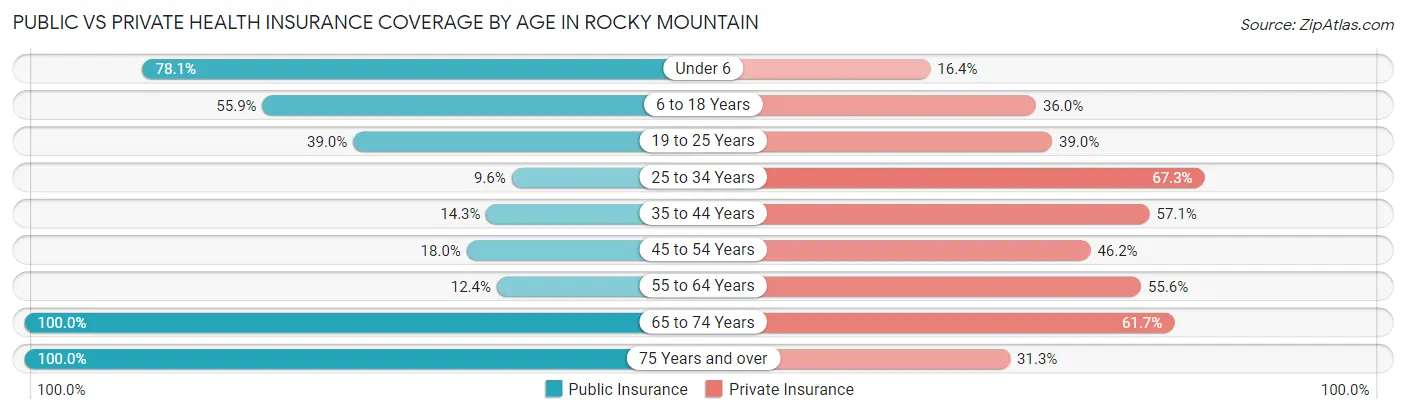
| Age Bracket | Public Insurance | Private Insurance |
| Under 6 | 57 (78.1%) | 12 (16.4%) |
| 6 to 18 Years | 62 (55.9%) | 40 (36.0%) |
| 19 to 25 Years | 16 (39.0%) | 16 (39.0%) |
| 25 to 34 Years | 5 (9.6%) | 35 (67.3%) |
| 35 to 44 Years | 10 (14.3%) | 40 (57.1%) |
| 45 to 54 Years | 14 (17.9%) | 36 (46.2%) |
| 55 to 64 Years | 10 (12.3%) | 45 (55.6%) |
| 65 to 74 Years | 60 (100.0%) | 37 (61.7%) |
| 75 Years and over | 32 (100.0%) | 10 (31.2%) |
| Total | 266 (44.5%) | 271 (45.3%) |
Disability Status by Sex by Age in Rocky Mountain
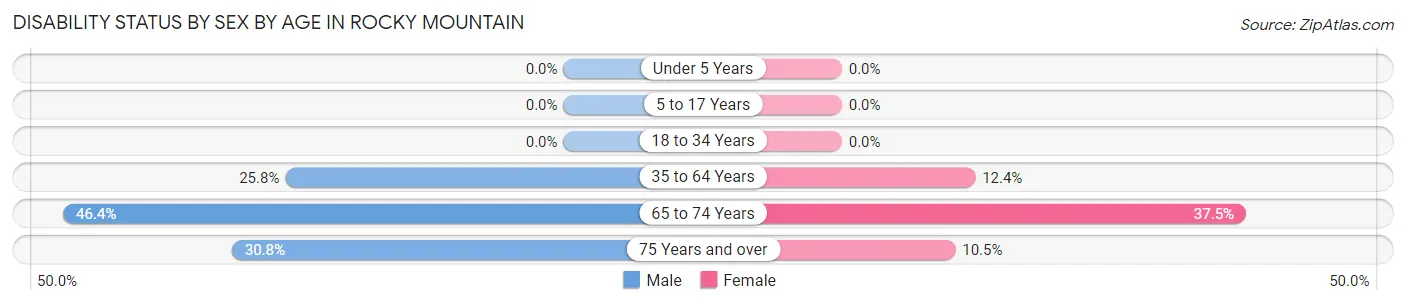
| Age Bracket | Male | Female |
| Under 5 Years | 0 (0.0%) | 0 (0.0%) |
| 5 to 17 Years | 0 (0.0%) | 0 (0.0%) |
| 18 to 34 Years | 0 (0.0%) | 0 (0.0%) |
| 35 to 64 Years | 32 (25.8%) | 13 (12.4%) |
| 65 to 74 Years | 13 (46.4%) | 12 (37.5%) |
| 75 Years and over | 4 (30.8%) | 2 (10.5%) |
Disability Class by Sex by Age in Rocky Mountain
Disability Class: Hearing Difficulty
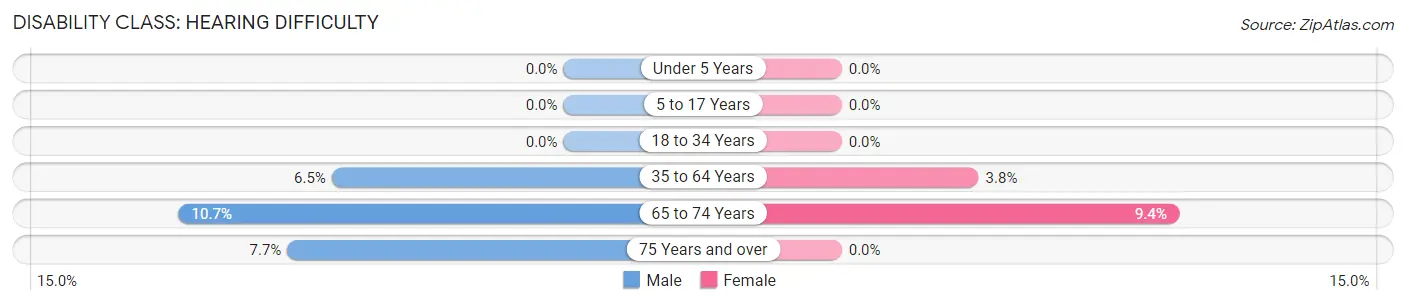
| Age Bracket | Male | Female |
| Under 5 Years | 0 (0.0%) | 0 (0.0%) |
| 5 to 17 Years | 0 (0.0%) | 0 (0.0%) |
| 18 to 34 Years | 0 (0.0%) | 0 (0.0%) |
| 35 to 64 Years | 8 (6.5%) | 4 (3.8%) |
| 65 to 74 Years | 3 (10.7%) | 3 (9.4%) |
| 75 Years and over | 1 (7.7%) | 0 (0.0%) |
Disability Class: Vision Difficulty
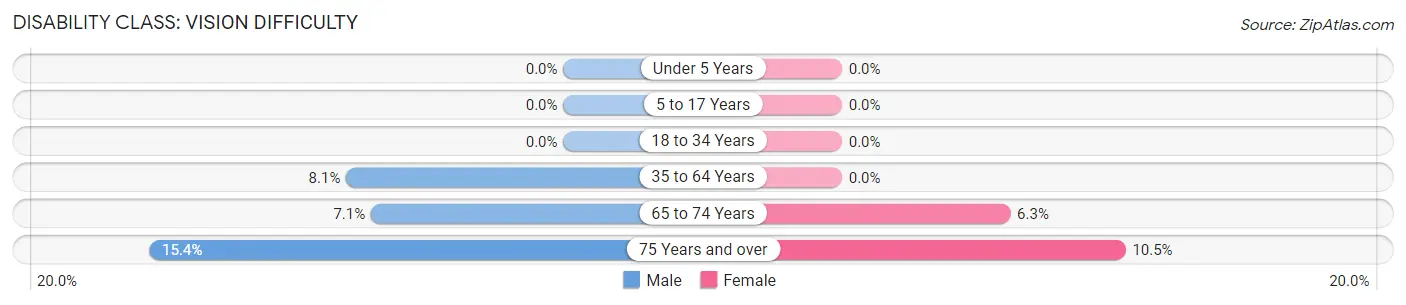
| Age Bracket | Male | Female |
| Under 5 Years | 0 (0.0%) | 0 (0.0%) |
| 5 to 17 Years | 0 (0.0%) | 0 (0.0%) |
| 18 to 34 Years | 0 (0.0%) | 0 (0.0%) |
| 35 to 64 Years | 10 (8.1%) | 0 (0.0%) |
| 65 to 74 Years | 2 (7.1%) | 2 (6.2%) |
| 75 Years and over | 2 (15.4%) | 2 (10.5%) |
Disability Class: Cognitive Difficulty
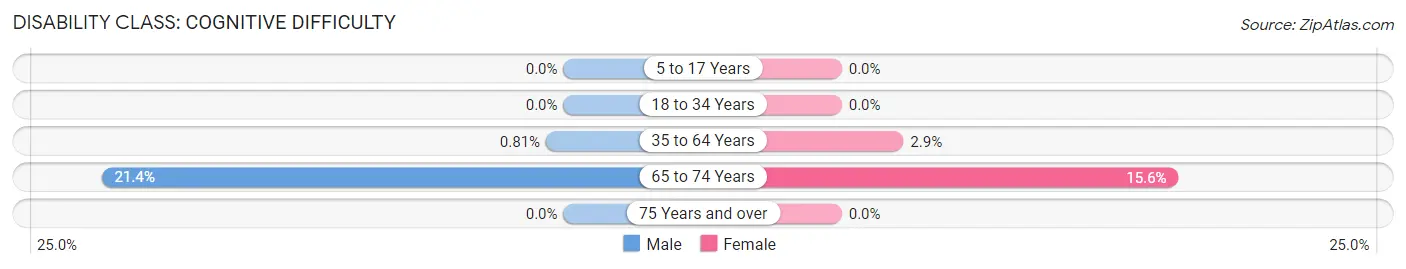
| Age Bracket | Male | Female |
| 5 to 17 Years | 0 (0.0%) | 0 (0.0%) |
| 18 to 34 Years | 0 (0.0%) | 0 (0.0%) |
| 35 to 64 Years | 1 (0.8%) | 3 (2.9%) |
| 65 to 74 Years | 6 (21.4%) | 5 (15.6%) |
| 75 Years and over | 0 (0.0%) | 0 (0.0%) |
Disability Class: Ambulatory Difficulty
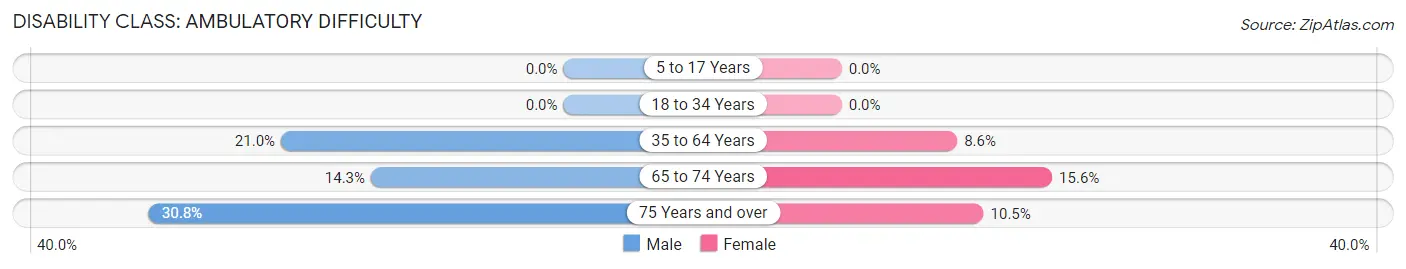
| Age Bracket | Male | Female |
| 5 to 17 Years | 0 (0.0%) | 0 (0.0%) |
| 18 to 34 Years | 0 (0.0%) | 0 (0.0%) |
| 35 to 64 Years | 26 (21.0%) | 9 (8.6%) |
| 65 to 74 Years | 4 (14.3%) | 5 (15.6%) |
| 75 Years and over | 4 (30.8%) | 2 (10.5%) |
Disability Class: Self-Care Difficulty
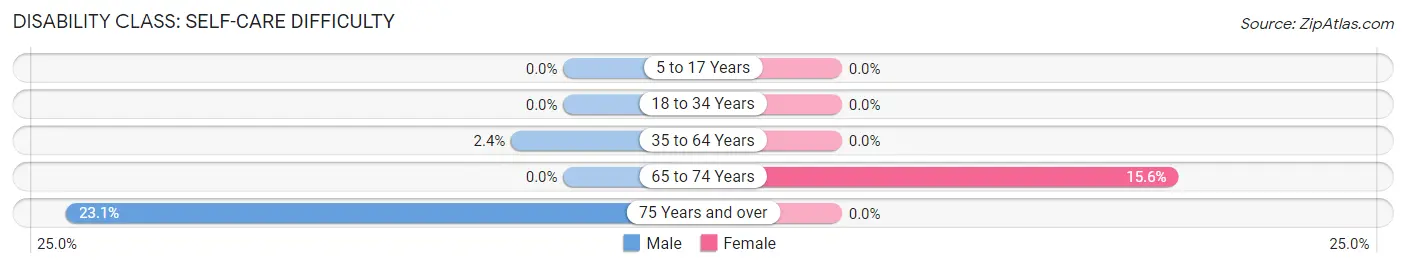
| Age Bracket | Male | Female |
| 5 to 17 Years | 0 (0.0%) | 0 (0.0%) |
| 18 to 34 Years | 0 (0.0%) | 0 (0.0%) |
| 35 to 64 Years | 3 (2.4%) | 0 (0.0%) |
| 65 to 74 Years | 0 (0.0%) | 5 (15.6%) |
| 75 Years and over | 3 (23.1%) | 0 (0.0%) |
Technology Access in Rocky Mountain
Computing Device Access in Rocky Mountain
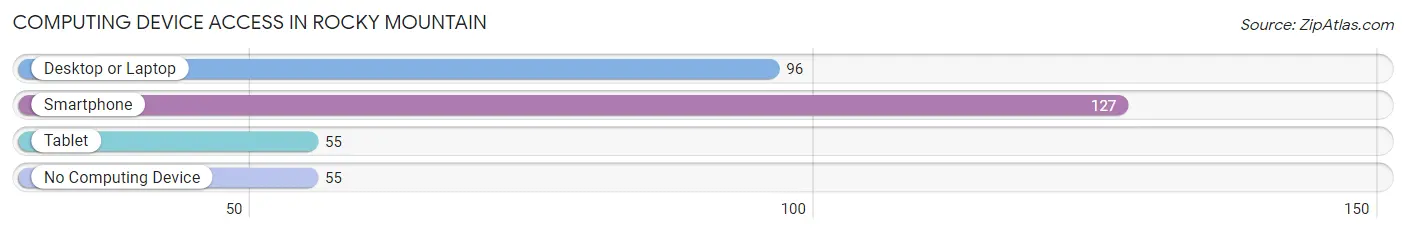
| Device Type | # Households | % Households |
| Desktop or Laptop | 96 | 49.5% |
| Smartphone | 127 | 65.5% |
| Tablet | 55 | 28.3% |
| No Computing Device | 55 | 28.3% |
| Total | 194 | 100.0% |
Internet Access in Rocky Mountain
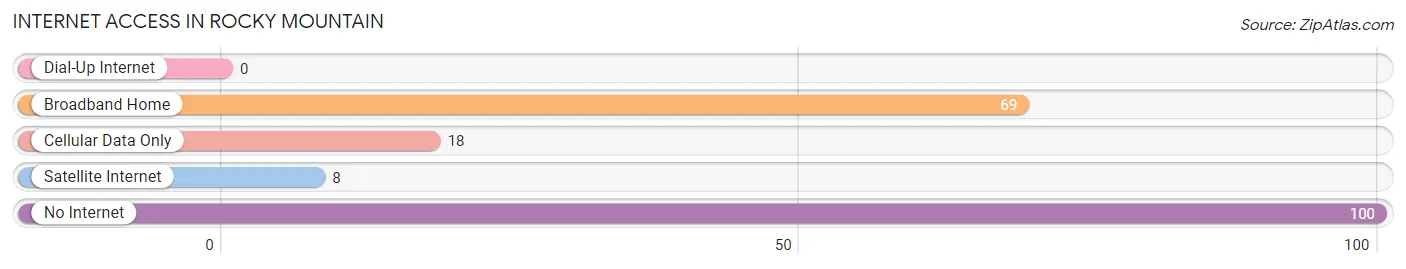
| Internet Type | # Households | % Households |
| Dial-Up Internet | 0 | 0.0% |
| Broadband Home | 69 | 35.6% |
| Cellular Data Only | 18 | 9.3% |
| Satellite Internet | 8 | 4.1% |
| No Internet | 100 | 51.5% |
| Total | 194 | 100.0% |
Rocky Mountain Summary
Rocky Mountain, Oklahoma is a small town located in the southwestern part of the state. It is situated in the foothills of the Ouachita Mountains, and is part of the Ouachita National Forest. The town is located in Le Flore County, and is approximately 20 miles from the Arkansas border. The population of Rocky Mountain was estimated to be around 500 people in 2020.
History
Rocky Mountain was founded in the late 1800s by settlers from Arkansas. The town was originally known as Rocky Mountain Springs, and was named after the nearby springs that provided water to the area. The town was incorporated in 1901, and the first post office was established in 1902.
The town was a popular destination for tourists in the early 1900s, and was known for its mineral springs and hot springs. The town was also home to a number of resorts, including the Rocky Mountain Hotel, which was built in 1906.
Geography
Rocky Mountain is located in the foothills of the Ouachita Mountains, and is part of the Ouachita National Forest. The town is situated in Le Flore County, and is approximately 20 miles from the Arkansas border. The town is located at an elevation of 1,000 feet above sea level.
The town is located in a rural area, and is surrounded by forests and rolling hills. The town is located near the Poteau River, which is a tributary of the Arkansas River.
Economy
The economy of Rocky Mountain is largely based on agriculture and tourism. The town is home to a number of farms, and the surrounding area is known for its production of cattle, poultry, and timber.
The town is also home to a number of tourist attractions, including the Rocky Mountain Hotel, which is a historic hotel that was built in 1906. The hotel is a popular destination for tourists, and is known for its mineral springs and hot springs.
Demographics
The population of Rocky Mountain was estimated to be around 500 people in 2020. The town is predominantly white, with a small percentage of African Americans and Native Americans. The median household income in the town is around $30,000, and the median home value is around $90,000.
The town is served by the Le Flore County School District, and is home to a number of churches, including the Rocky Mountain Baptist Church. The town is also home to a number of businesses, including a grocery store, a hardware store, and a gas station.
Conclusion
Rocky Mountain, Oklahoma is a small town located in the southwestern part of the state. It is situated in the foothills of the Ouachita Mountains, and is part of the Ouachita National Forest. The town is home to a number of farms, and the surrounding area is known for its production of cattle, poultry, and timber. The town is also home to a number of tourist attractions, including the Rocky Mountain Hotel, which is a historic hotel that was built in 1906. The population of Rocky Mountain was estimated to be around 500 people in 2020. The town is predominantly white, with a small percentage of African Americans and Native Americans. The economy of Rocky Mountain is largely based on agriculture and tourism.
Common Questions
What is Per Capita Income in Rocky Mountain?
Per Capita income in Rocky Mountain is $21,242.
What is the Median Family Income in Rocky Mountain?
Median Family Income in Rocky Mountain is $48,750.
What is the Median Household income in Rocky Mountain?
Median Household Income in Rocky Mountain is $39,167.
What is Income or Wage Gap in Rocky Mountain?
Income or Wage Gap in Rocky Mountain is 62.2%.
Women in Rocky Mountain earn 37.8 cents for every dollar earned by a man.
What is Inequality or Gini Index in Rocky Mountain?
Inequality or Gini Index in Rocky Mountain is 0.52.
What is the Total Population of Rocky Mountain?
Total Population of Rocky Mountain is 598.
What is the Total Male Population of Rocky Mountain?
Total Male Population of Rocky Mountain is 294.
What is the Total Female Population of Rocky Mountain?
Total Female Population of Rocky Mountain is 304.
What is the Ratio of Males per 100 Females in Rocky Mountain?
There are 96.71 Males per 100 Females in Rocky Mountain.
What is the Ratio of Females per 100 Males in Rocky Mountain?
There are 103.40 Females per 100 Males in Rocky Mountain.
What is the Median Population Age in Rocky Mountain?
Median Population Age in Rocky Mountain is 38.0 Years.
What is the Average Family Size in Rocky Mountain
Average Family Size in Rocky Mountain is 3.4 People.
What is the Average Household Size in Rocky Mountain
Average Household Size in Rocky Mountain is 3.1 People.
How Large is the Labor Force in Rocky Mountain?
There are 241 People in the Labor Forcein in Rocky Mountain.
What is the Percentage of People in the Labor Force in Rocky Mountain?
54.5% of People are in the Labor Force in Rocky Mountain.
What is the Unemployment Rate in Rocky Mountain?
Unemployment Rate in Rocky Mountain is 3.7%.