Deer Creek, OK Map & Demographics
Deer Creek Map
Deer Creek Overview
$40,627
PER CAPITA INCOME
$89,167
AVG FAMILY INCOME
$100,417
AVG HOUSEHOLD INCOME
71.6%
WAGE / INCOME GAP [ % ]
28.4¢/ $1
WAGE / INCOME GAP [ $ ]
0.27
INEQUALITY / GINI INDEX
83
TOTAL POPULATION
29
MALE POPULATION
54
FEMALE POPULATION
53.70
MALES / 100 FEMALES
186.21
FEMALES / 100 MALES
33.5
MEDIAN AGE
2.9
AVG FAMILY SIZE
2.9
AVG HOUSEHOLD SIZE
37
LABOR FORCE [ PEOPLE ]
57.8%
PERCENT IN LABOR FORCE
Deer Creek Zip Codes
Deer Creek Area Codes
Income in Deer Creek
Income Overview in Deer Creek
Per Capita Income in Deer Creek is $40,627, while median incomes of families and households are $89,167 and $100,417 respectively.
| Characteristic | Number | Measure |
| Per Capita Income | 83 | $40,627 |
| Median Family Income | 22 | $89,167 |
| Mean Family Income | 22 | $82,505 |
| Median Household Income | 29 | $100,417 |
| Mean Household Income | 29 | $94,969 |
| Income Deficit | 22 | $0 |
| Wage / Income Gap (%) | 83 | 71.64% |
| Wage / Income Gap ($) | 83 | 28.36¢ per $1 |
| Gini / Inequality Index | 83 | 0.27 |
Earnings by Sex in Deer Creek
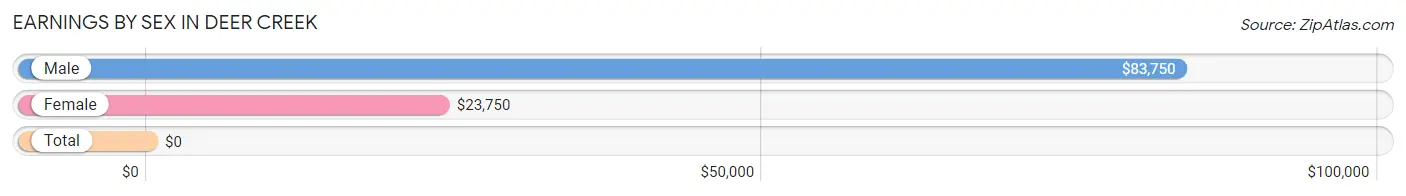
| Sex | Number | Average Earnings |
| Male | 10 (26.3%) | $83,750 |
| Female | 28 (73.7%) | $23,750 |
| Total | 38 (100.0%) | $0 |
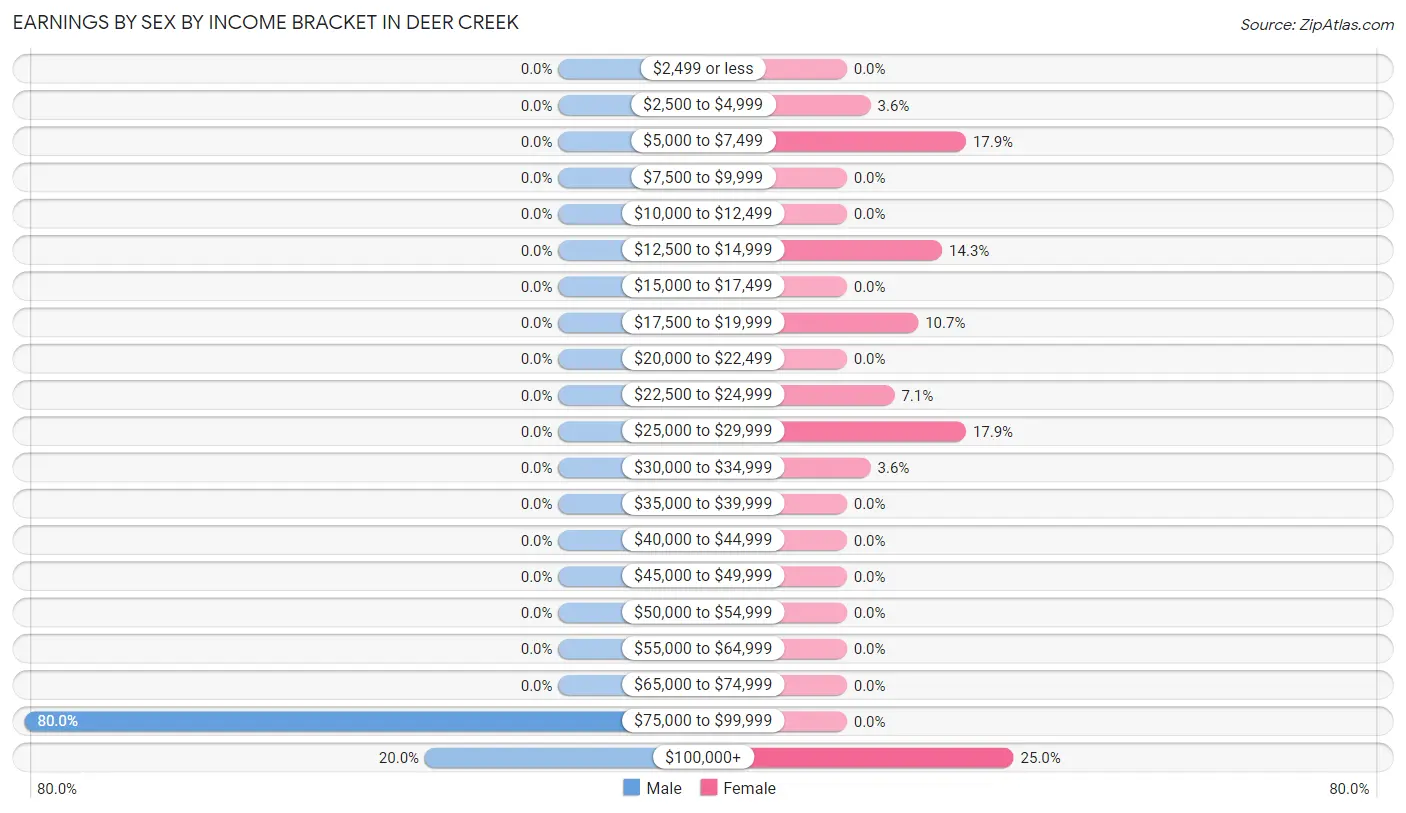
Earnings by Sex by Income Bracket in Deer Creek
The most common earnings brackets in Deer Creek are $75,000 to $99,999 for men (8 | 80.0%) and $100,000+ for women (7 | 25.0%).
| Income | Male | Female |
| $2,499 or less | 0 (0.0%) | 0 (0.0%) |
| $2,500 to $4,999 | 0 (0.0%) | 1 (3.6%) |
| $5,000 to $7,499 | 0 (0.0%) | 5 (17.9%) |
| $7,500 to $9,999 | 0 (0.0%) | 0 (0.0%) |
| $10,000 to $12,499 | 0 (0.0%) | 0 (0.0%) |
| $12,500 to $14,999 | 0 (0.0%) | 4 (14.3%) |
| $15,000 to $17,499 | 0 (0.0%) | 0 (0.0%) |
| $17,500 to $19,999 | 0 (0.0%) | 3 (10.7%) |
| $20,000 to $22,499 | 0 (0.0%) | 0 (0.0%) |
| $22,500 to $24,999 | 0 (0.0%) | 2 (7.1%) |
| $25,000 to $29,999 | 0 (0.0%) | 5 (17.9%) |
| $30,000 to $34,999 | 0 (0.0%) | 1 (3.6%) |
| $35,000 to $39,999 | 0 (0.0%) | 0 (0.0%) |
| $40,000 to $44,999 | 0 (0.0%) | 0 (0.0%) |
| $45,000 to $49,999 | 0 (0.0%) | 0 (0.0%) |
| $50,000 to $54,999 | 0 (0.0%) | 0 (0.0%) |
| $55,000 to $64,999 | 0 (0.0%) | 0 (0.0%) |
| $65,000 to $74,999 | 0 (0.0%) | 0 (0.0%) |
| $75,000 to $99,999 | 8 (80.0%) | 0 (0.0%) |
| $100,000+ | 2 (20.0%) | 7 (25.0%) |
| Total | 10 (100.0%) | 28 (100.0%) |
Earnings by Sex by Educational Attainment in Deer Creek
| Educational Attainment | Male Income | Female Income |
| Less than High School | - | - |
| High School Diploma | - | - |
| College or Associate's Degree | - | - |
| Bachelor's Degree | - | - |
| Graduate Degree | - | - |
| Total | $83,750 | $0 |
Family Income in Deer Creek
Family Income Brackets in Deer Creek
According to the Deer Creek family income data, there are 10 families falling into the $100,000 to $149,999 income range, which is the most common income bracket and makes up 45.5% of all families.
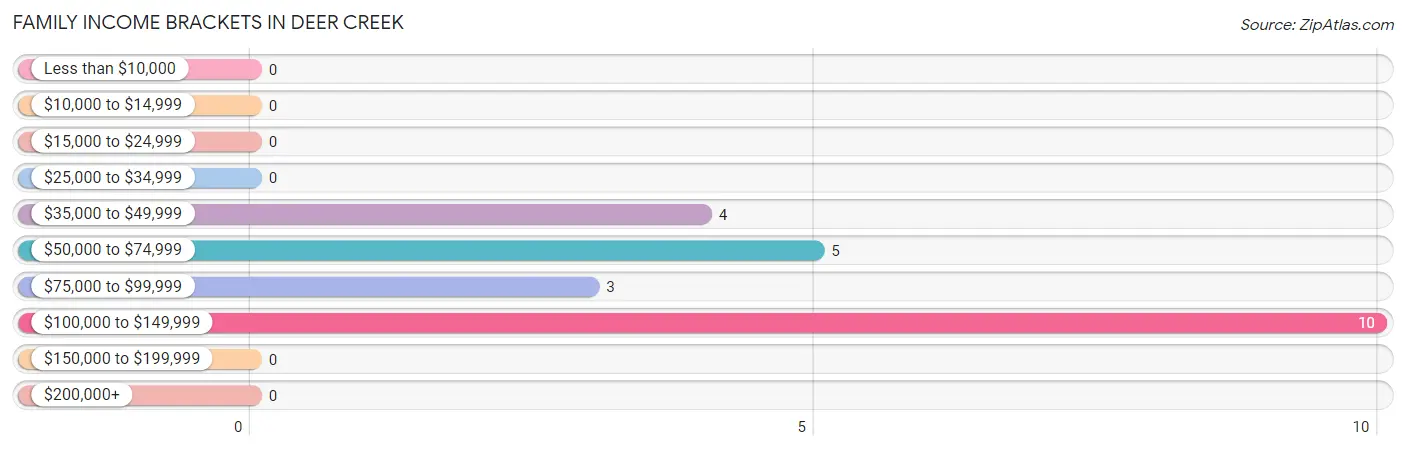
| Income Bracket | # Families | % Families |
| Less than $10,000 | 0 | 0.0% |
| $10,000 to $14,999 | 0 | 0.0% |
| $15,000 to $24,999 | 0 | 0.0% |
| $25,000 to $34,999 | 0 | 0.0% |
| $35,000 to $49,999 | 4 | 18.2% |
| $50,000 to $74,999 | 5 | 22.7% |
| $75,000 to $99,999 | 3 | 13.6% |
| $100,000 to $149,999 | 10 | 45.5% |
| $150,000 to $199,999 | 0 | 0.0% |
| $200,000+ | 0 | 0.0% |
Family Income by Famaliy Size in Deer Creek
2-person families (13 | 59.1%) account for the highest median family income in Deer Creek with $52,250 per family, while 2-person families (13 | 59.1%) have the highest median income of $26,125 per family member.
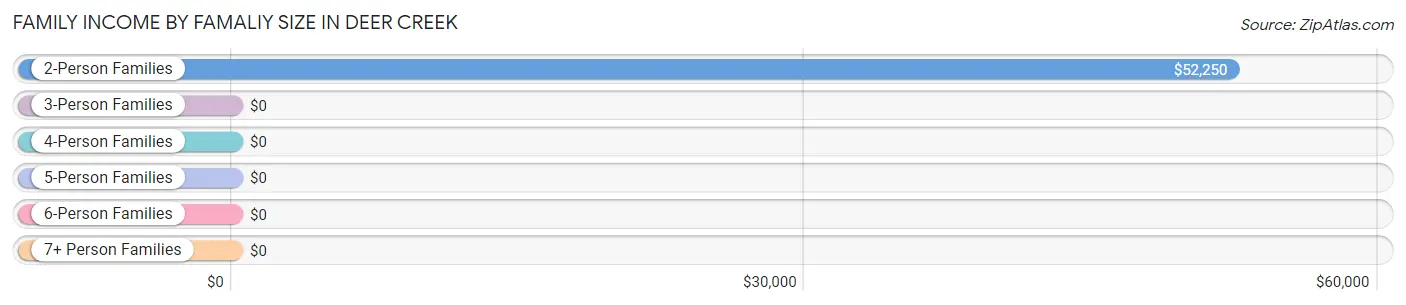
| Income Bracket | # Families | Median Income |
| 2-Person Families | 13 (59.1%) | $52,250 |
| 3-Person Families | 4 (18.2%) | $0 |
| 4-Person Families | 5 (22.7%) | $0 |
| 5-Person Families | 0 (0.0%) | $0 |
| 6-Person Families | 0 (0.0%) | $0 |
| 7+ Person Families | 0 (0.0%) | $0 |
| Total | 22 (100.0%) | $89,167 |
Family Income by Number of Earners in Deer Creek
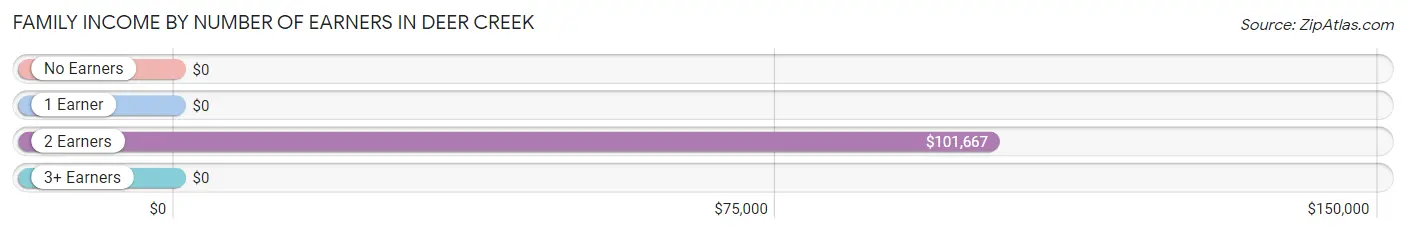
| Number of Earners | # Families | Median Income |
| No Earners | 8 (36.4%) | $0 |
| 1 Earner | 2 (9.1%) | $0 |
| 2 Earners | 12 (54.5%) | $101,667 |
| 3+ Earners | 0 (0.0%) | $0 |
| Total | 22 (100.0%) | $89,167 |
Household Income in Deer Creek
Household Income Brackets in Deer Creek
With 13 households falling in the category, the $100,000 to $149,999 income range is the most frequent in Deer Creek, accounting for 44.8% of all households.
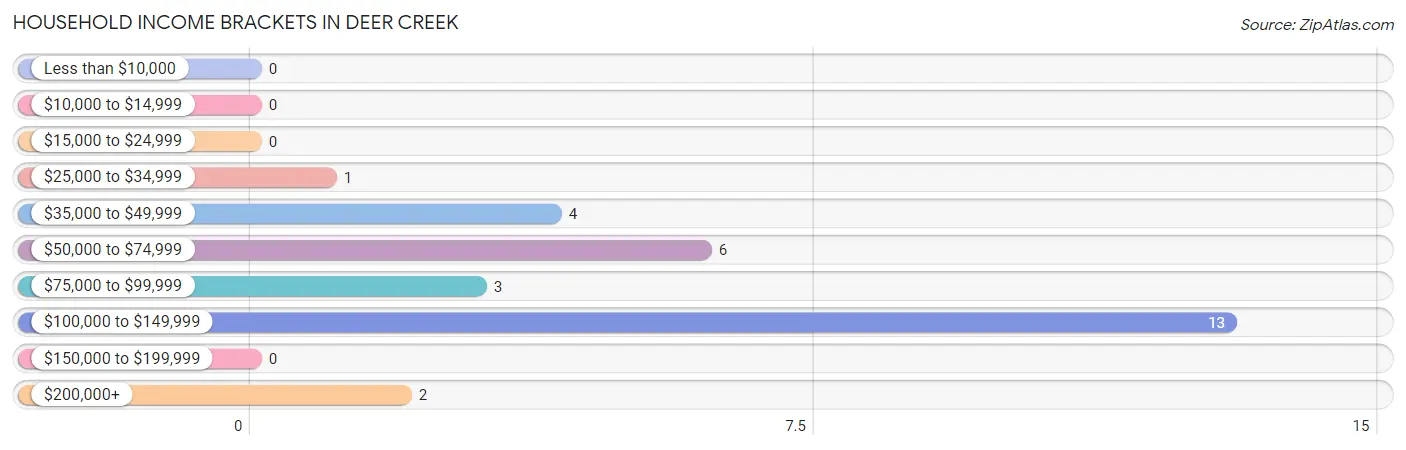
| Income Bracket | # Households | % Households |
| Less than $10,000 | 0 | 0.0% |
| $10,000 to $14,999 | 0 | 0.0% |
| $15,000 to $24,999 | 0 | 0.0% |
| $25,000 to $34,999 | 1 | 3.4% |
| $35,000 to $49,999 | 4 | 13.8% |
| $50,000 to $74,999 | 6 | 20.7% |
| $75,000 to $99,999 | 3 | 10.3% |
| $100,000 to $149,999 | 13 | 44.8% |
| $150,000 to $199,999 | 0 | 0.0% |
| $200,000+ | 2 | 6.9% |
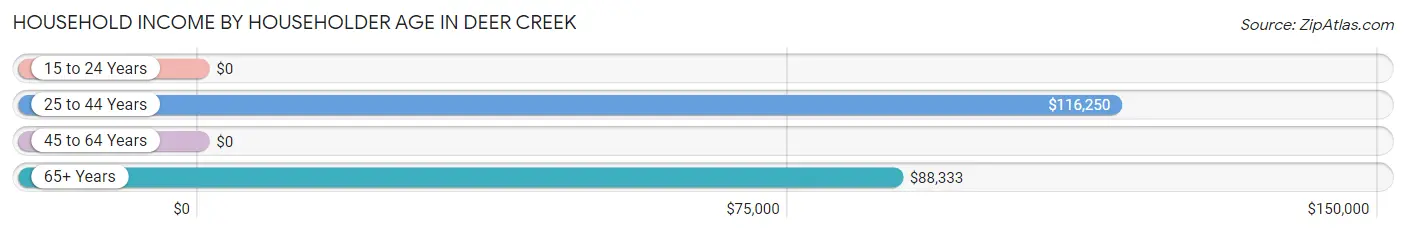
Household Income by Householder Age in Deer Creek
The median household income in Deer Creek is $100,417, with the highest median household income of $116,250 found in the 25 to 44 years age bracket for the primary householder. A total of 9 households (31.0%) fall into this category. Meanwhile, the 15 to 24 years age bracket for the primary householder has the lowest median household income of $0, with 1 households (3.5%) in this group.
| Income Bracket | # Households | Median Income |
| 15 to 24 Years | 1 (3.5%) | $0 |
| 25 to 44 Years | 9 (31.0%) | $116,250 |
| 45 to 64 Years | 5 (17.2%) | $0 |
| 65+ Years | 14 (48.3%) | $88,333 |
| Total | 29 (100.0%) | $100,417 |
Poverty in Deer Creek
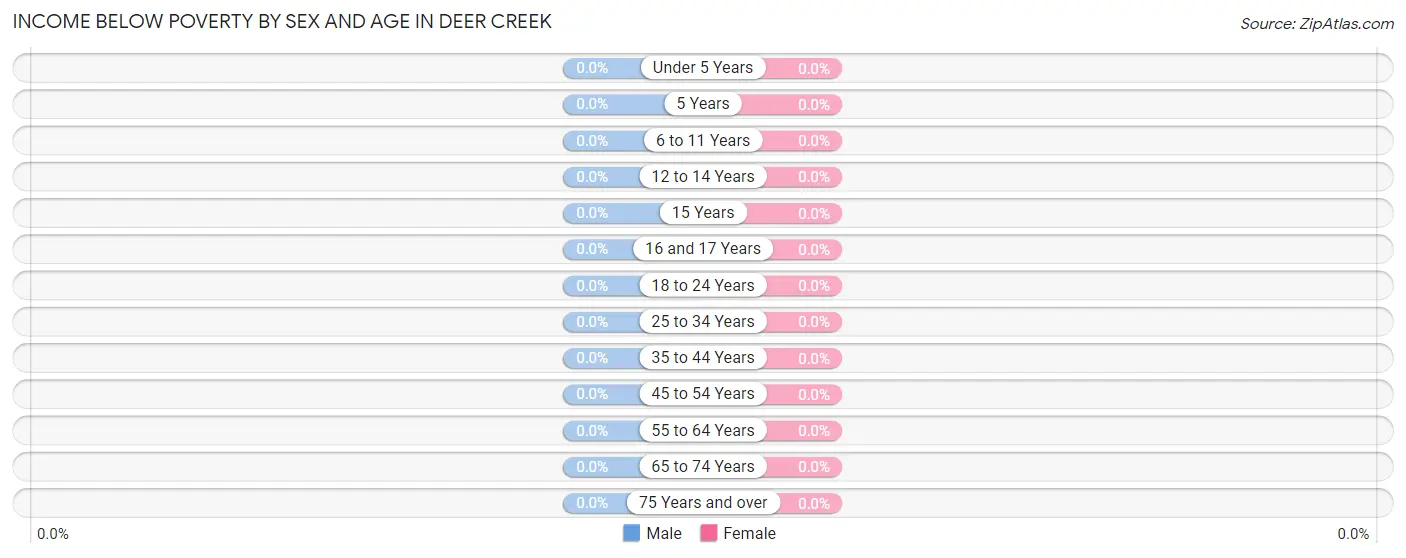
Income Below Poverty by Sex and Age in Deer Creek
| Age Bracket | Male | Female |
| Under 5 Years | 0 (0.0%) | 0 (0.0%) |
| 5 Years | 0 (0.0%) | 0 (0.0%) |
| 6 to 11 Years | 0 (0.0%) | 0 (0.0%) |
| 12 to 14 Years | 0 (0.0%) | 0 (0.0%) |
| 15 Years | 0 (0.0%) | 0 (0.0%) |
| 16 and 17 Years | 0 (0.0%) | 0 (0.0%) |
| 18 to 24 Years | 0 (0.0%) | 0 (0.0%) |
| 25 to 34 Years | 0 (0.0%) | 0 (0.0%) |
| 35 to 44 Years | 0 (0.0%) | 0 (0.0%) |
| 45 to 54 Years | 0 (0.0%) | 0 (0.0%) |
| 55 to 64 Years | 0 (0.0%) | 0 (0.0%) |
| 65 to 74 Years | 0 (0.0%) | 0 (0.0%) |
| 75 Years and over | 0 (0.0%) | 0 (0.0%) |
| Total | 0 (0.0%) | 0 (0.0%) |
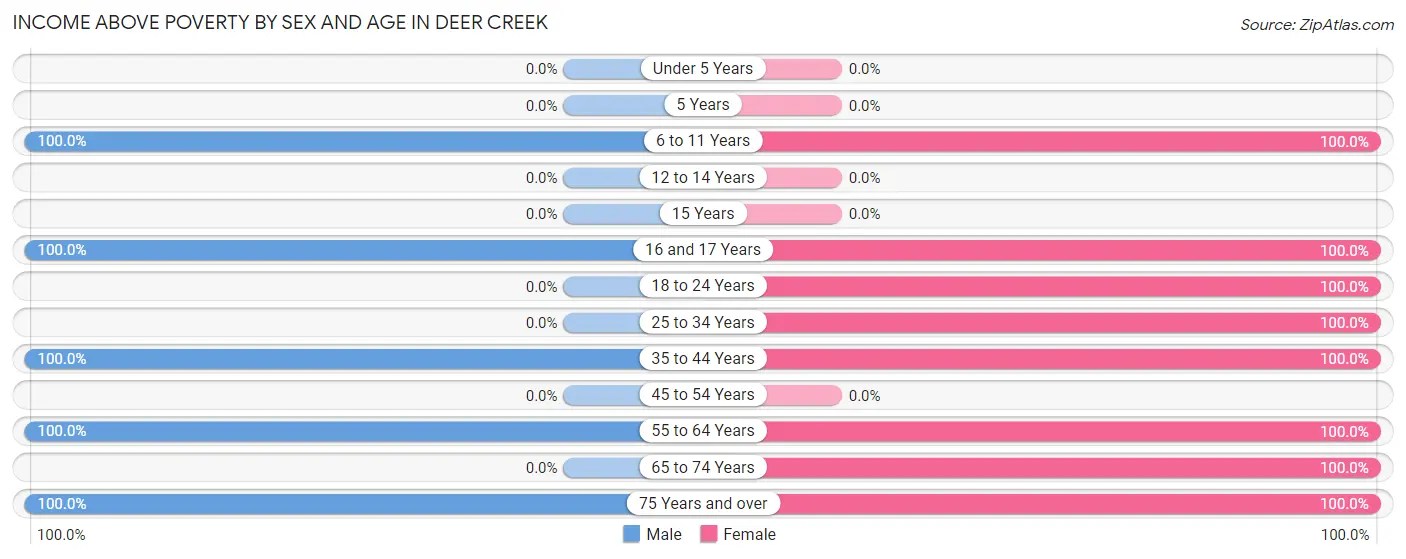
Income Above Poverty by Sex and Age in Deer Creek
According to the poverty statistics in Deer Creek, males aged 6 to 11 years and females aged 6 to 11 years are the age groups that are most secure financially, with 100.0% of males and 100.0% of females in these age groups living above the poverty line.
| Age Bracket | Male | Female |
| Under 5 Years | 0 (0.0%) | 0 (0.0%) |
| 5 Years | 0 (0.0%) | 0 (0.0%) |
| 6 to 11 Years | 5 (100.0%) | 8 (100.0%) |
| 12 to 14 Years | 0 (0.0%) | 0 (0.0%) |
| 15 Years | 0 (0.0%) | 0 (0.0%) |
| 16 and 17 Years | 6 (100.0%) | 2 (100.0%) |
| 18 to 24 Years | 0 (0.0%) | 12 (100.0%) |
| 25 to 34 Years | 0 (0.0%) | 5 (100.0%) |
| 35 to 44 Years | 7 (100.0%) | 9 (100.0%) |
| 45 to 54 Years | 0 (0.0%) | 0 (0.0%) |
| 55 to 64 Years | 3 (100.0%) | 4 (100.0%) |
| 65 to 74 Years | 0 (0.0%) | 5 (100.0%) |
| 75 Years and over | 8 (100.0%) | 3 (100.0%) |
| Total | 29 (100.0%) | 48 (100.0%) |
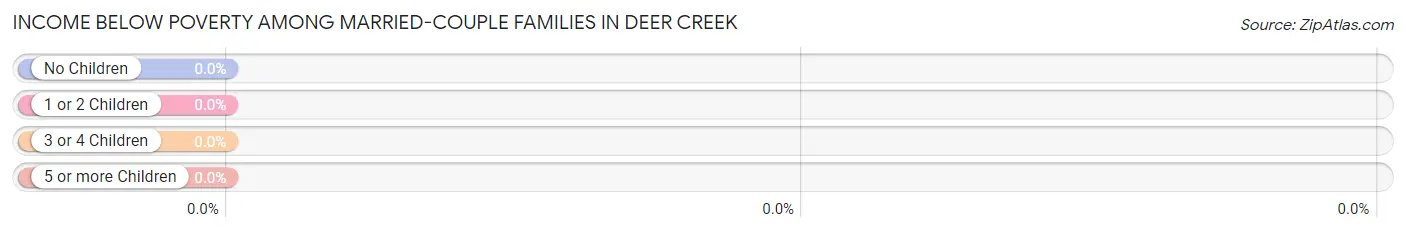
Income Below Poverty Among Married-Couple Families in Deer Creek
| Children | Above Poverty | Below Poverty |
| No Children | 11 (100.0%) | 0 (0.0%) |
| 1 or 2 Children | 5 (100.0%) | 0 (0.0%) |
| 3 or 4 Children | 0 (0.0%) | 0 (0.0%) |
| 5 or more Children | 0 (0.0%) | 0 (0.0%) |
| Total | 16 (100.0%) | 0 (0.0%) |
Income Below Poverty Among Single-Parent Households in Deer Creek
| Children | Single Father | Single Mother |
| No Children | 0 (0.0%) | 0 (0.0%) |
| 1 or 2 Children | 0 (0.0%) | 0 (0.0%) |
| 3 or 4 Children | 0 (0.0%) | 0 (0.0%) |
| 5 or more Children | 0 (0.0%) | 0 (0.0%) |
| Total | 0 (0.0%) | 0 (0.0%) |
Income Below Poverty Among Married-Couple vs Single-Parent Households in Deer Creek
| Children | Married-Couple Families | Single-Parent Households |
| No Children | 0 (0.0%) | 0 (0.0%) |
| 1 or 2 Children | 0 (0.0%) | 0 (0.0%) |
| 3 or 4 Children | 0 (0.0%) | 0 (0.0%) |
| 5 or more Children | 0 (0.0%) | 0 (0.0%) |
| Total | 0 (0.0%) | 0 (0.0%) |
Race in Deer Creek
The most populous races in Deer Creek are White / Caucasian (60 | 72.3%), and Black / African American (23 | 27.7%).
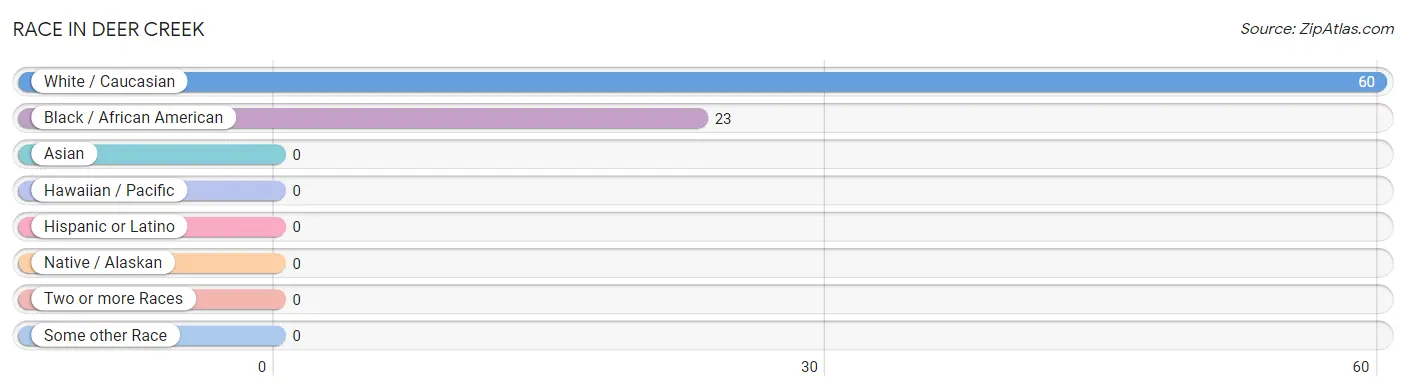
| Race | # Population | % Population |
| Asian | 0 | 0.0% |
| Black / African American | 23 | 27.7% |
| Hawaiian / Pacific | 0 | 0.0% |
| Hispanic or Latino | 0 | 0.0% |
| Native / Alaskan | 0 | 0.0% |
| White / Caucasian | 60 | 72.3% |
| Two or more Races | 0 | 0.0% |
| Some other Race | 0 | 0.0% |
| Total | 83 | 100.0% |
Ancestry in Deer Creek
The most populous ancestries reported in Deer Creek are English (28 | 33.7%), American (6 | 7.2%), Irish (5 | 6.0%), Scottish (5 | 6.0%), and French (3 | 3.6%), together accounting for 56.6% of all Deer Creek residents.
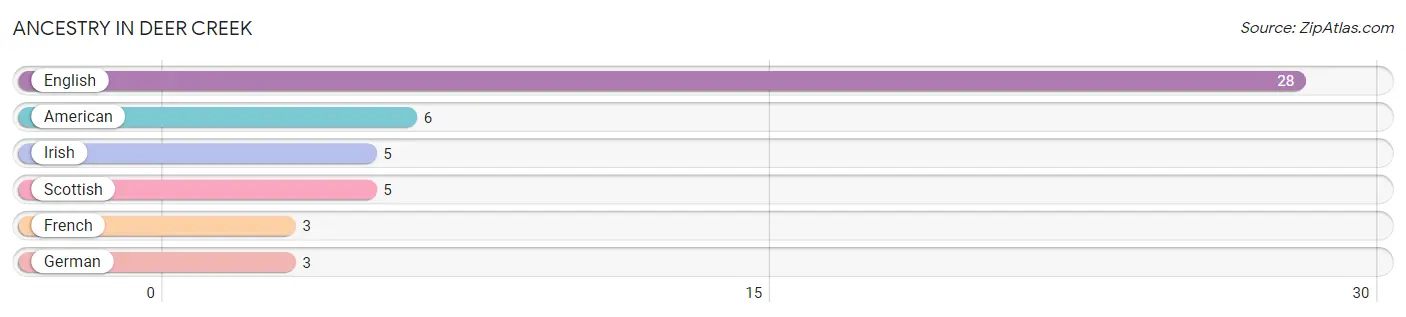
| Ancestry | # Population | % Population |
| American | 6 | 7.2% |
| English | 28 | 33.7% |
| French | 3 | 3.6% |
| German | 3 | 3.6% |
| Irish | 5 | 6.0% |
| Scottish | 5 | 6.0% | View All 6 Rows |
Immigrants in Deer Creek

| Immigration Origin | # Population | % Population | View All 0 Rows |
Sex and Age in Deer Creek
Sex and Age in Deer Creek
The most populous age groups in Deer Creek are 75 to 79 Years (8 | 27.6%) for men and 15 to 19 Years (10 | 18.5%) for women.
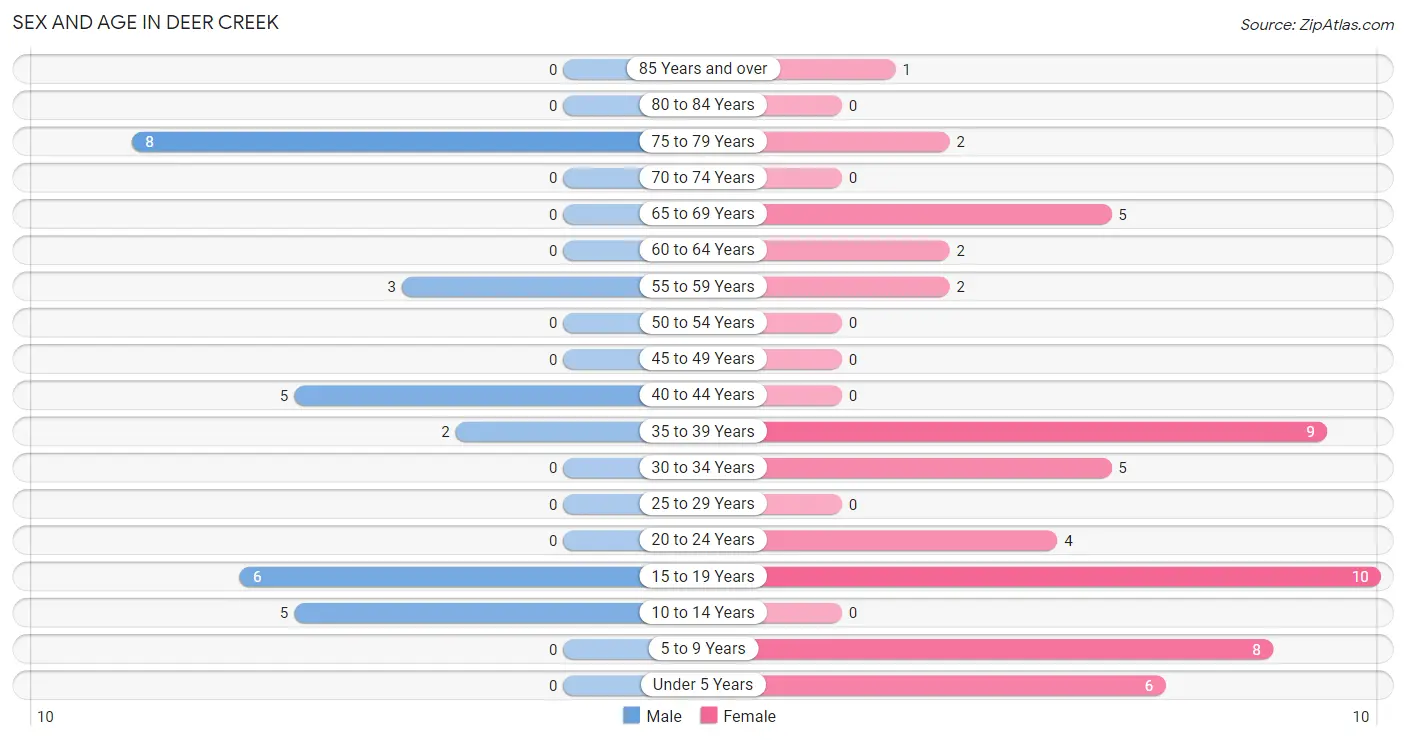
| Age Bracket | Male | Female |
| Under 5 Years | 0 (0.0%) | 6 (11.1%) |
| 5 to 9 Years | 0 (0.0%) | 8 (14.8%) |
| 10 to 14 Years | 5 (17.2%) | 0 (0.0%) |
| 15 to 19 Years | 6 (20.7%) | 10 (18.5%) |
| 20 to 24 Years | 0 (0.0%) | 4 (7.4%) |
| 25 to 29 Years | 0 (0.0%) | 0 (0.0%) |
| 30 to 34 Years | 0 (0.0%) | 5 (9.3%) |
| 35 to 39 Years | 2 (6.9%) | 9 (16.7%) |
| 40 to 44 Years | 5 (17.2%) | 0 (0.0%) |
| 45 to 49 Years | 0 (0.0%) | 0 (0.0%) |
| 50 to 54 Years | 0 (0.0%) | 0 (0.0%) |
| 55 to 59 Years | 3 (10.3%) | 2 (3.7%) |
| 60 to 64 Years | 0 (0.0%) | 2 (3.7%) |
| 65 to 69 Years | 0 (0.0%) | 5 (9.3%) |
| 70 to 74 Years | 0 (0.0%) | 0 (0.0%) |
| 75 to 79 Years | 8 (27.6%) | 2 (3.7%) |
| 80 to 84 Years | 0 (0.0%) | 0 (0.0%) |
| 85 Years and over | 0 (0.0%) | 1 (1.8%) |
| Total | 29 (100.0%) | 54 (100.0%) |
Families and Households in Deer Creek
Median Family Size in Deer Creek
The median family size in Deer Creek is 2.86 persons per family, with single male/father families (2 | 9.1%) accounting for the largest median family size of 8 persons per family. On the other hand, single female/mother families (4 | 18.2%) represent the smallest median family size with 2.25 persons per family.
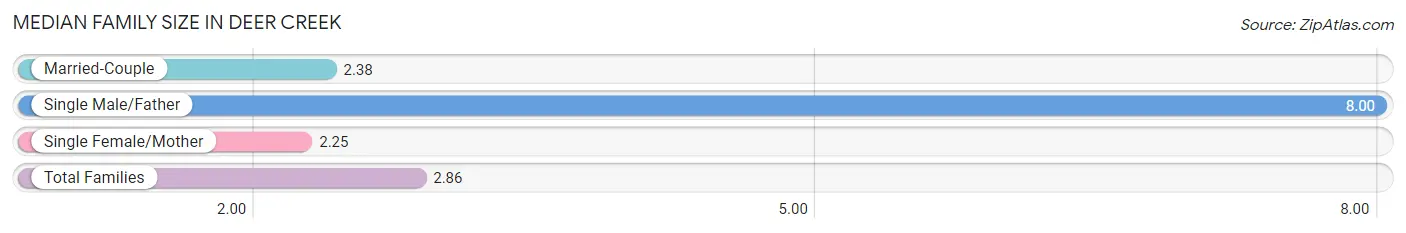
| Family Type | # Families | Family Size |
| Married-Couple | 16 (72.7%) | 2.38 |
| Single Male/Father | 2 (9.1%) | 8.00 |
| Single Female/Mother | 4 (18.2%) | 2.25 |
| Total Families | 22 (100.0%) | 2.86 |
Median Household Size in Deer Creek
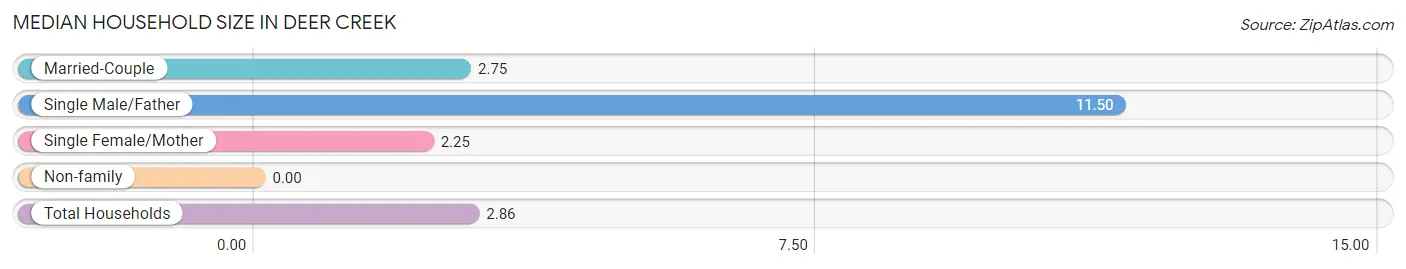
| Household Type | # Households | Household Size |
| Married-Couple | 16 (55.2%) | 2.75 |
| Single Male/Father | 2 (6.9%) | 11.50 |
| Single Female/Mother | 4 (13.8%) | 2.25 |
| Non-family | 7 (24.1%) | - |
| Total Households | 29 (100.0%) | 2.86 |
Household Size by Marriage Status in Deer Creek
Out of a total of 29 households in Deer Creek, 22 (75.9%) are family households, while 7 (24.1%) are nonfamily households. The most numerous type of family households are 2-person households, comprising 13, and the most common type of nonfamily households are 1-person households, comprising 7.
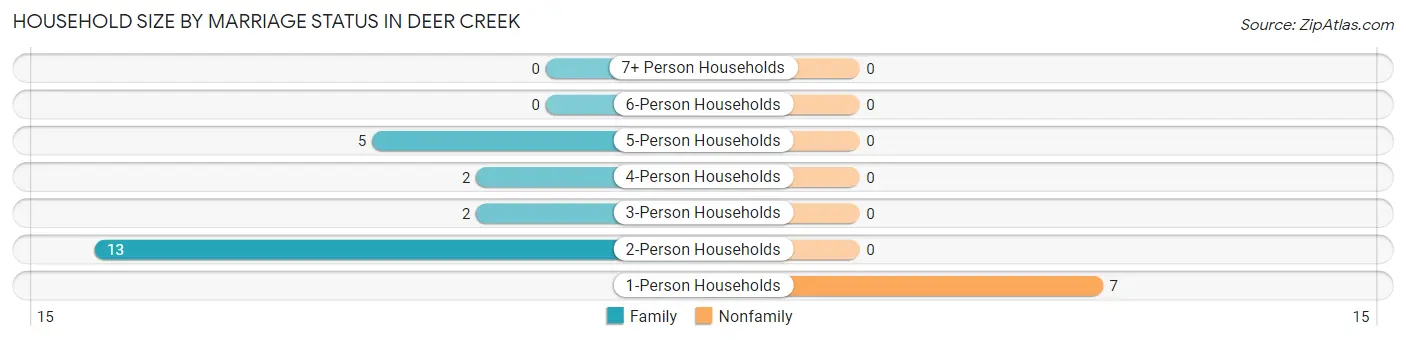
| Household Size | Family Households | Nonfamily Households |
| 1-Person Households | - | 7 (24.1%) |
| 2-Person Households | 13 (44.8%) | 0 (0.0%) |
| 3-Person Households | 2 (6.9%) | 0 (0.0%) |
| 4-Person Households | 2 (6.9%) | 0 (0.0%) |
| 5-Person Households | 5 (17.2%) | 0 (0.0%) |
| 6-Person Households | 0 (0.0%) | 0 (0.0%) |
| 7+ Person Households | 0 (0.0%) | 0 (0.0%) |
| Total | 22 (75.9%) | 7 (24.1%) |
Female Fertility in Deer Creek
Fertility by Age in Deer Creek
| Age Bracket | Women with Births | Births / 1,000 Women |
| 15 to 19 years | 0 (0.0%) | 0.0 |
| 20 to 34 years | 0 (0.0%) | 0.0 |
| 35 to 50 years | 0 (0.0%) | 0.0 |
| Total | 0 (0.0%) | 0.0 |
Fertility by Age by Marriage Status in Deer Creek
| Age Bracket | Married | Unmarried |
| 15 to 19 years | 0 (0.0%) | 0 (0.0%) |
| 20 to 34 years | 0 (0.0%) | 0 (0.0%) |
| 35 to 50 years | 0 (0.0%) | 0 (0.0%) |
| Total | 0 (0.0%) | 0 (0.0%) |
Fertility by Education in Deer Creek
| Educational Attainment | Women with Births | Births / 1,000 Women |
| Less than High School | 0 (0.0%) | 0.0 |
| High School Diploma | 0 (0.0%) | 0.0 |
| College or Associate's Degree | 0 (0.0%) | 0.0 |
| Bachelor's Degree | 0 (0.0%) | 0.0 |
| Graduate Degree | 0 (0.0%) | 0.0 |
| Total | 0 (0.0%) | 0.0 |
Fertility by Education by Marriage Status in Deer Creek
| Educational Attainment | Married | Unmarried |
| Less than High School | 0 (0.0%) | 0 (0.0%) |
| High School Diploma | 0 (0.0%) | 0 (0.0%) |
| College or Associate's Degree | 0 (0.0%) | 0 (0.0%) |
| Bachelor's Degree | 0 (0.0%) | 0 (0.0%) |
| Graduate Degree | 0 (0.0%) | 0 (0.0%) |
| Total | 0 (0.0%) | 0 (0.0%) |
Employment Characteristics in Deer Creek
Employment by Class of Employer in Deer Creek
Among the 28 employed individuals in Deer Creek, private company employees (20 | 71.4%), not-for-profit organizations (5 | 17.9%), and local government employees (2 | 7.1%) make up the most common classes of employment.
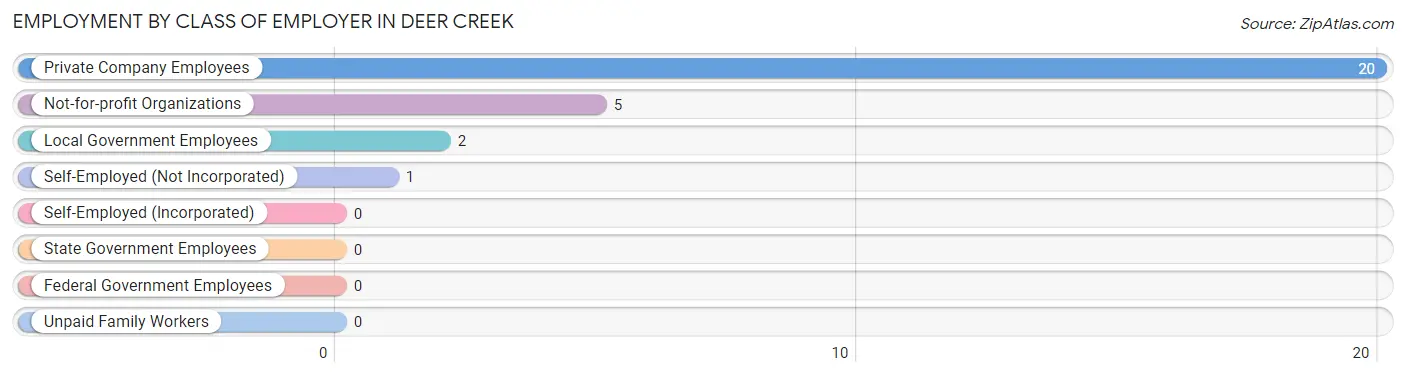
| Employer Class | # Employees | % Employees |
| Private Company Employees | 20 | 71.4% |
| Self-Employed (Incorporated) | 0 | 0.0% |
| Self-Employed (Not Incorporated) | 1 | 3.6% |
| Not-for-profit Organizations | 5 | 17.9% |
| Local Government Employees | 2 | 7.1% |
| State Government Employees | 0 | 0.0% |
| Federal Government Employees | 0 | 0.0% |
| Unpaid Family Workers | 0 | 0.0% |
| Total | 28 | 100.0% |
Employment Status by Age in Deer Creek
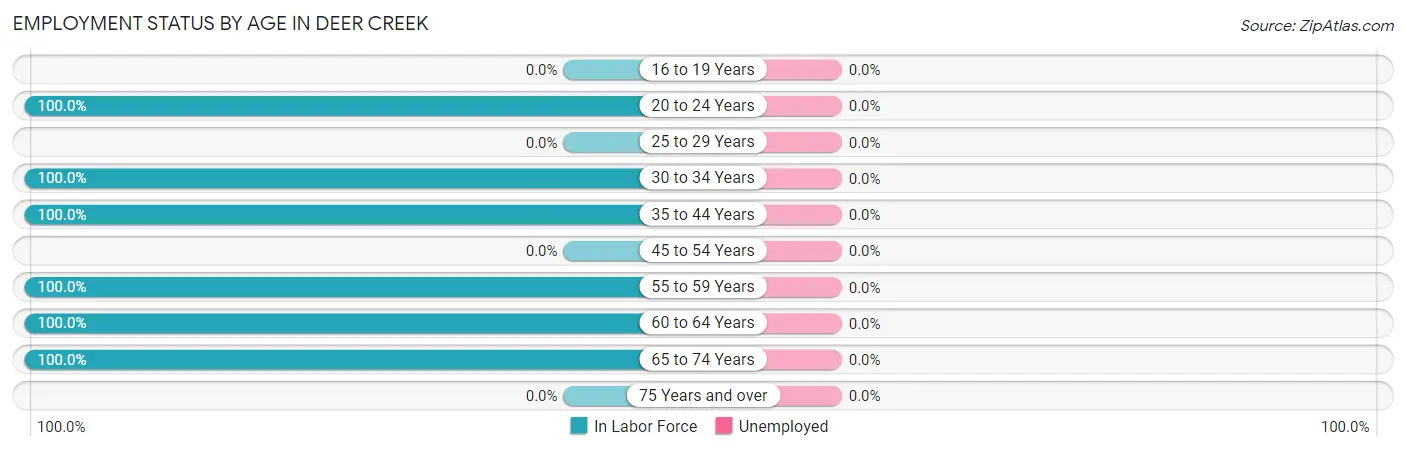
| Age Bracket | In Labor Force | Unemployed |
| 16 to 19 Years | 0 (0.0%) | 0 (0.0%) |
| 20 to 24 Years | 4 (100.0%) | 0 (0.0%) |
| 25 to 29 Years | 0 (0.0%) | 0 (0.0%) |
| 30 to 34 Years | 5 (100.0%) | 0 (0.0%) |
| 35 to 44 Years | 16 (100.0%) | 0 (0.0%) |
| 45 to 54 Years | 0 (0.0%) | 0 (0.0%) |
| 55 to 59 Years | 5 (100.0%) | 0 (0.0%) |
| 60 to 64 Years | 2 (100.0%) | 0 (0.0%) |
| 65 to 74 Years | 5 (100.0%) | 0 (0.0%) |
| 75 Years and over | 0 (0.0%) | 0 (0.0%) |
| Total | 37 (57.8%) | 0 (0.0%) |
Employment Status by Educational Attainment in Deer Creek
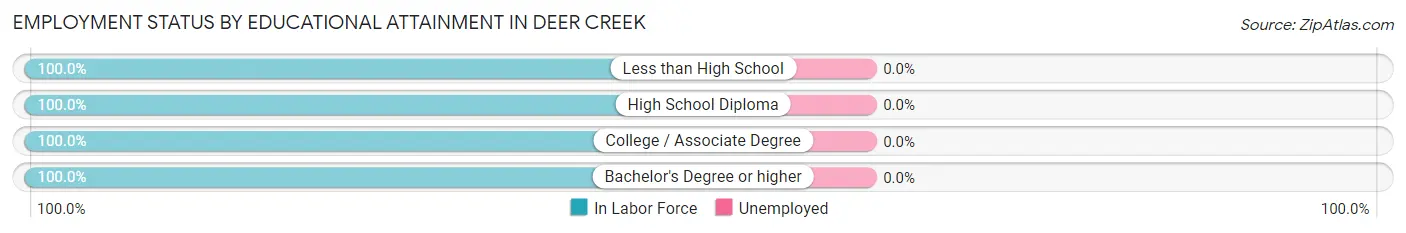
| Educational Attainment | In Labor Force | Unemployed |
| Less than High School | 2 (100.0%) | 0 (0.0%) |
| High School Diploma | 9 (100.0%) | 0 (0.0%) |
| College / Associate Degree | 14 (100.0%) | 0 (0.0%) |
| Bachelor's Degree or higher | 3 (100.0%) | 0 (0.0%) |
| Total | 28 (100.0%) | 0 (0.0%) |
Employment Occupations by Sex in Deer Creek
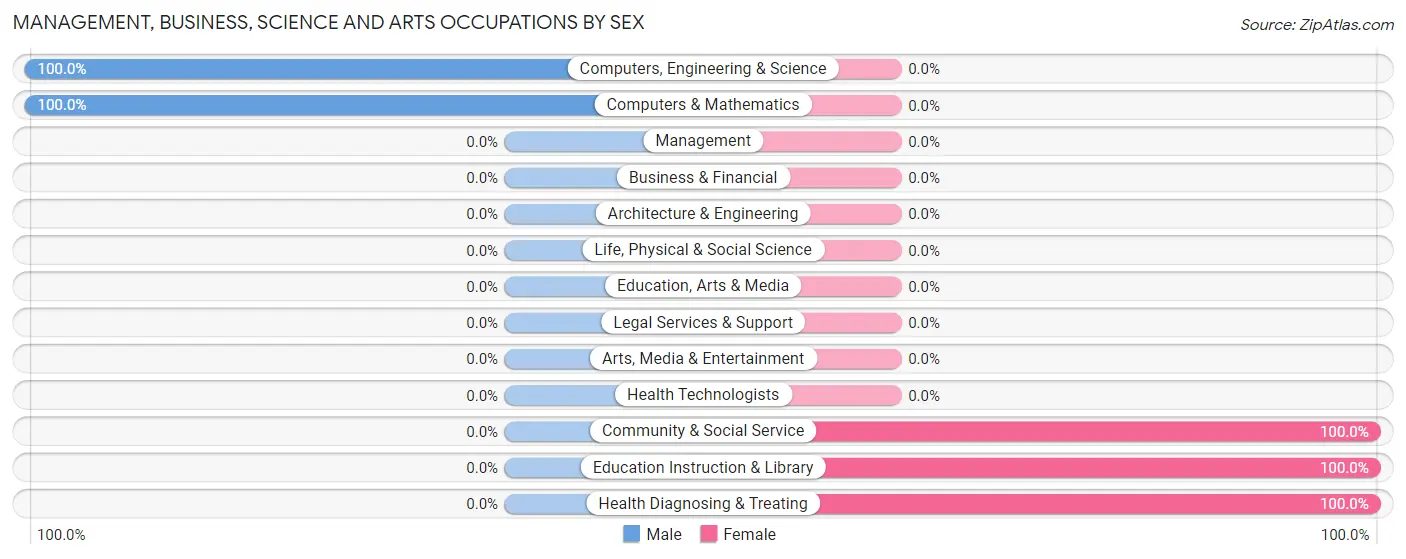
Management, Business, Science and Arts Occupations
The most common Management, Business, Science and Arts occupations in Deer Creek are Community & Social Service (7 | 18.9%), Education Instruction & Library (7 | 18.9%), Health Diagnosing & Treating (5 | 13.5%), Computers, Engineering & Science (3 | 8.1%), and Computers & Mathematics (3 | 8.1%).
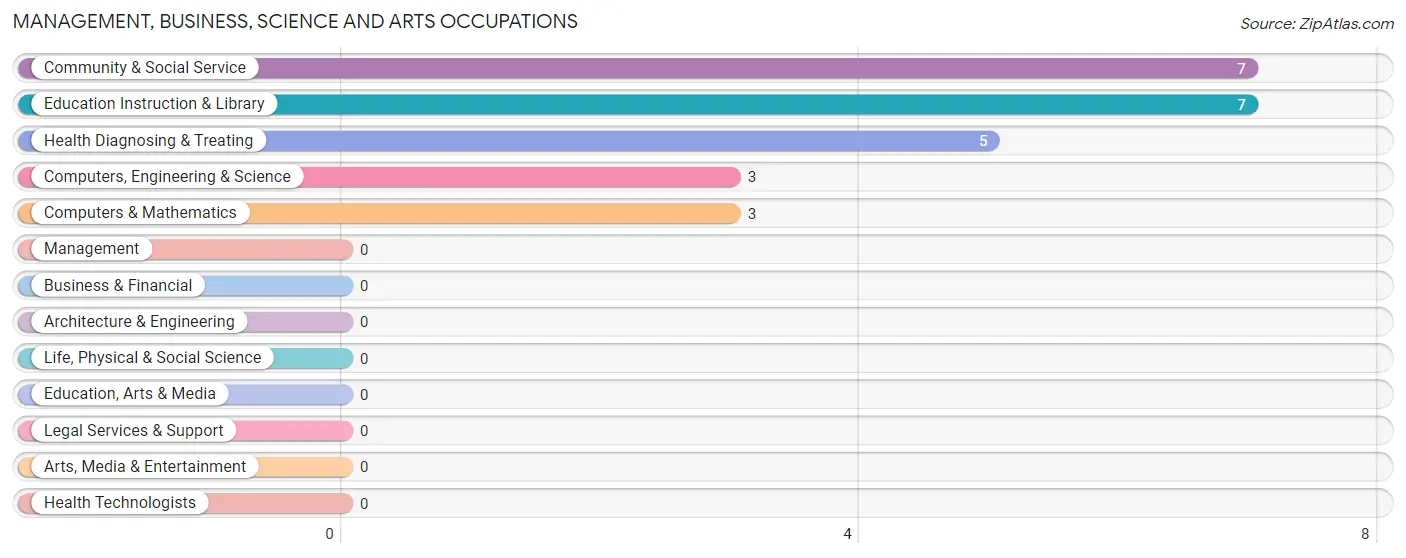
Management, Business, Science and Arts Occupations by Sex
Within the Management, Business, Science and Arts occupations in Deer Creek, the most male-oriented occupations are Computers, Engineering & Science (100.0%), and Computers & Mathematics (100.0%), while the most female-oriented occupations are Community & Social Service (100.0%), Education Instruction & Library (100.0%), and Health Diagnosing & Treating (100.0%).
| Occupation | Male | Female |
| Management | 0 (0.0%) | 0 (0.0%) |
| Business & Financial | 0 (0.0%) | 0 (0.0%) |
| Computers, Engineering & Science | 3 (100.0%) | 0 (0.0%) |
| Computers & Mathematics | 3 (100.0%) | 0 (0.0%) |
| Architecture & Engineering | 0 (0.0%) | 0 (0.0%) |
| Life, Physical & Social Science | 0 (0.0%) | 0 (0.0%) |
| Community & Social Service | 0 (0.0%) | 7 (100.0%) |
| Education, Arts & Media | 0 (0.0%) | 0 (0.0%) |
| Legal Services & Support | 0 (0.0%) | 0 (0.0%) |
| Education Instruction & Library | 0 (0.0%) | 7 (100.0%) |
| Arts, Media & Entertainment | 0 (0.0%) | 0 (0.0%) |
| Health Diagnosing & Treating | 0 (0.0%) | 5 (100.0%) |
| Health Technologists | 0 (0.0%) | 0 (0.0%) |
| Total (Category) | 3 (20.0%) | 12 (80.0%) |
| Total (Overall) | 10 (27.0%) | 27 (73.0%) |
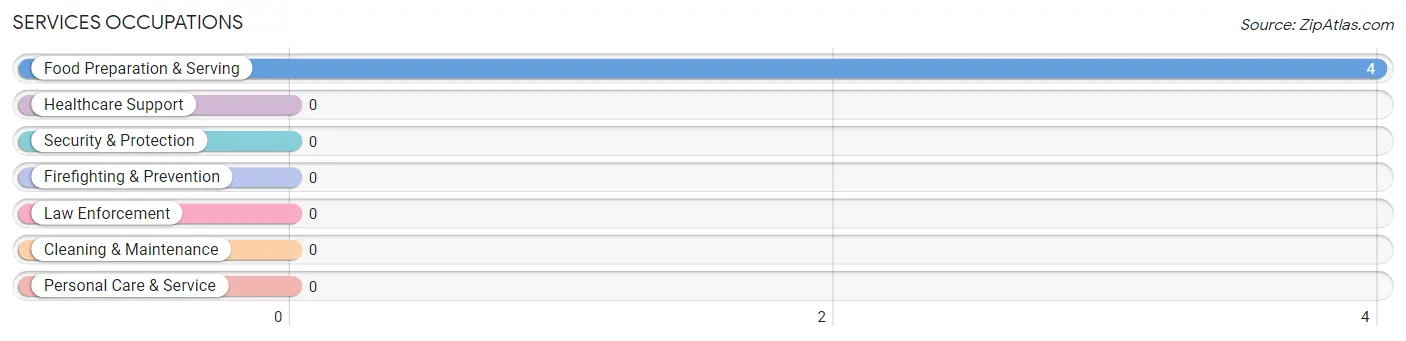
Services Occupations
The most common Services occupations in Deer Creek are , and Food Preparation & Serving (4 | 10.8%).
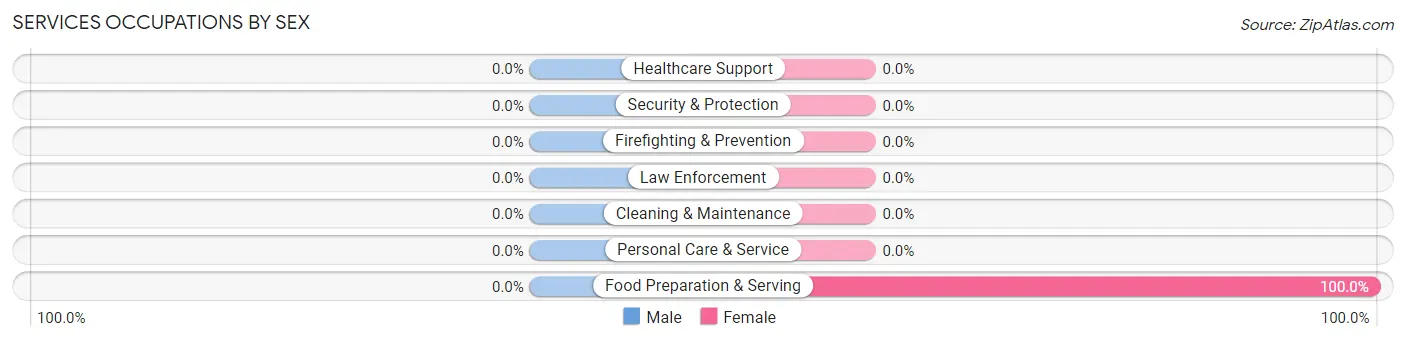
Services Occupations by Sex
| Occupation | Male | Female |
| Healthcare Support | 0 (0.0%) | 0 (0.0%) |
| Security & Protection | 0 (0.0%) | 0 (0.0%) |
| Firefighting & Prevention | 0 (0.0%) | 0 (0.0%) |
| Law Enforcement | 0 (0.0%) | 0 (0.0%) |
| Food Preparation & Serving | 0 (0.0%) | 4 (100.0%) |
| Cleaning & Maintenance | 0 (0.0%) | 0 (0.0%) |
| Personal Care & Service | 0 (0.0%) | 0 (0.0%) |
| Total (Category) | 0 (0.0%) | 4 (100.0%) |
| Total (Overall) | 10 (27.0%) | 27 (73.0%) |
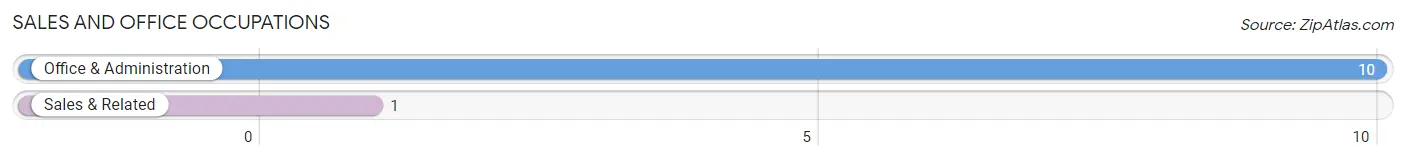
Sales and Office Occupations
The most common Sales and Office occupations in Deer Creek are Office & Administration (10 | 27.0%), and Sales & Related (1 | 2.7%).
Sales and Office Occupations by Sex
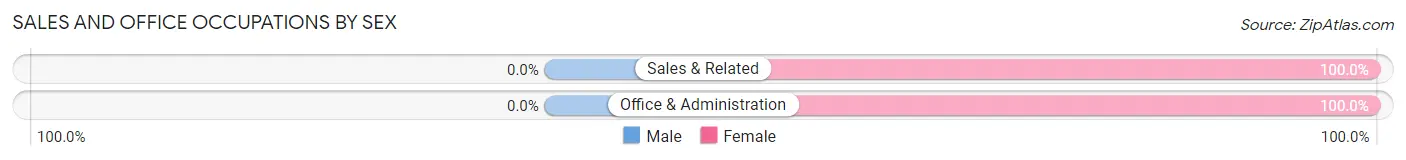
| Occupation | Male | Female |
| Sales & Related | 0 (0.0%) | 1 (100.0%) |
| Office & Administration | 0 (0.0%) | 10 (100.0%) |
| Total (Category) | 0 (0.0%) | 11 (100.0%) |
| Total (Overall) | 10 (27.0%) | 27 (73.0%) |
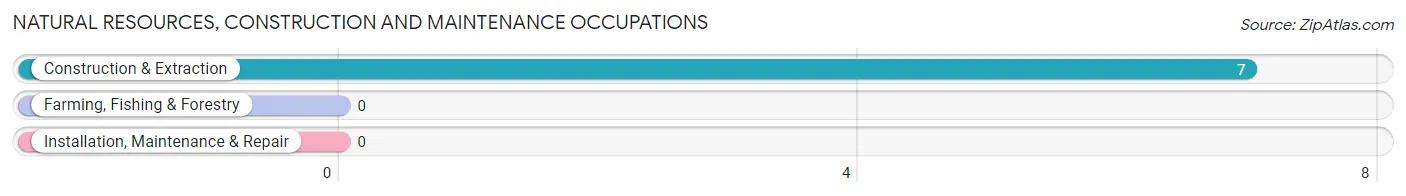
Natural Resources, Construction and Maintenance Occupations
The most common Natural Resources, Construction and Maintenance occupations in Deer Creek are , and Construction & Extraction (7 | 18.9%).
Natural Resources, Construction and Maintenance Occupations by Sex
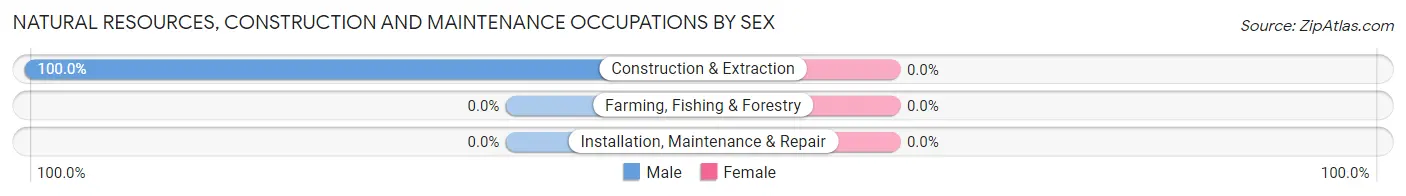
| Occupation | Male | Female |
| Farming, Fishing & Forestry | 0 (0.0%) | 0 (0.0%) |
| Construction & Extraction | 7 (100.0%) | 0 (0.0%) |
| Installation, Maintenance & Repair | 0 (0.0%) | 0 (0.0%) |
| Total (Category) | 7 (100.0%) | 0 (0.0%) |
| Total (Overall) | 10 (27.0%) | 27 (73.0%) |
Production, Transportation and Moving Occupations
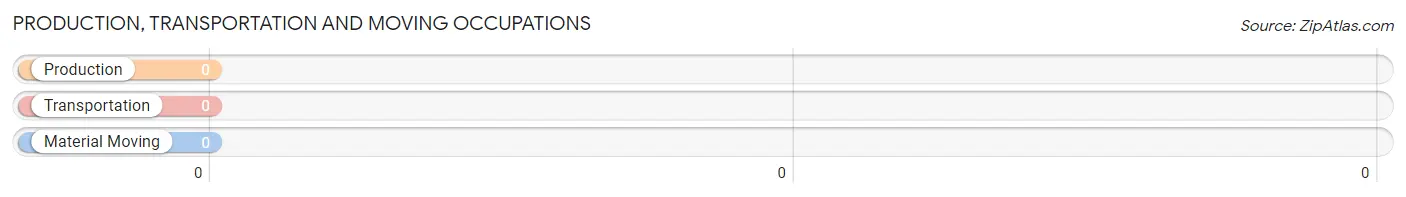
Production, Transportation and Moving Occupations by Sex
| Occupation | Male | Female |
| Production | 0 (0.0%) | 0 (0.0%) |
| Transportation | 0 (0.0%) | 0 (0.0%) |
| Material Moving | 0 (0.0%) | 0 (0.0%) |
| Total (Category) | 0 (0.0%) | 0 (0.0%) |
| Total (Overall) | 10 (27.0%) | 27 (73.0%) |
Employment Industries by Sex in Deer Creek
Employment Industries in Deer Creek
The major employment industries in Deer Creek include Educational Services (9 | 24.3%), Construction (5 | 13.5%), Health Care & Social Assistance (5 | 13.5%), Professional & Scientific (3 | 8.1%), and Arts, Entertainment & Recreation (3 | 8.1%).
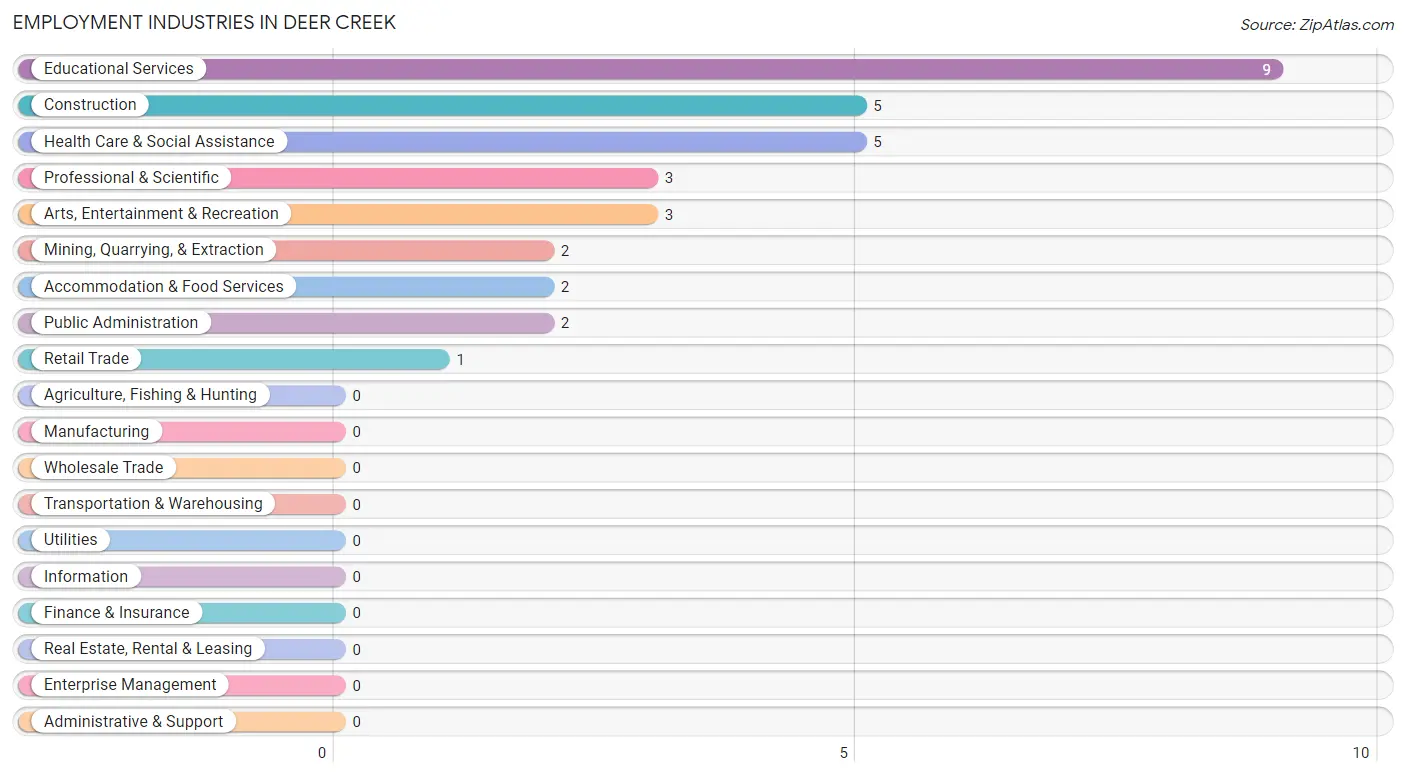
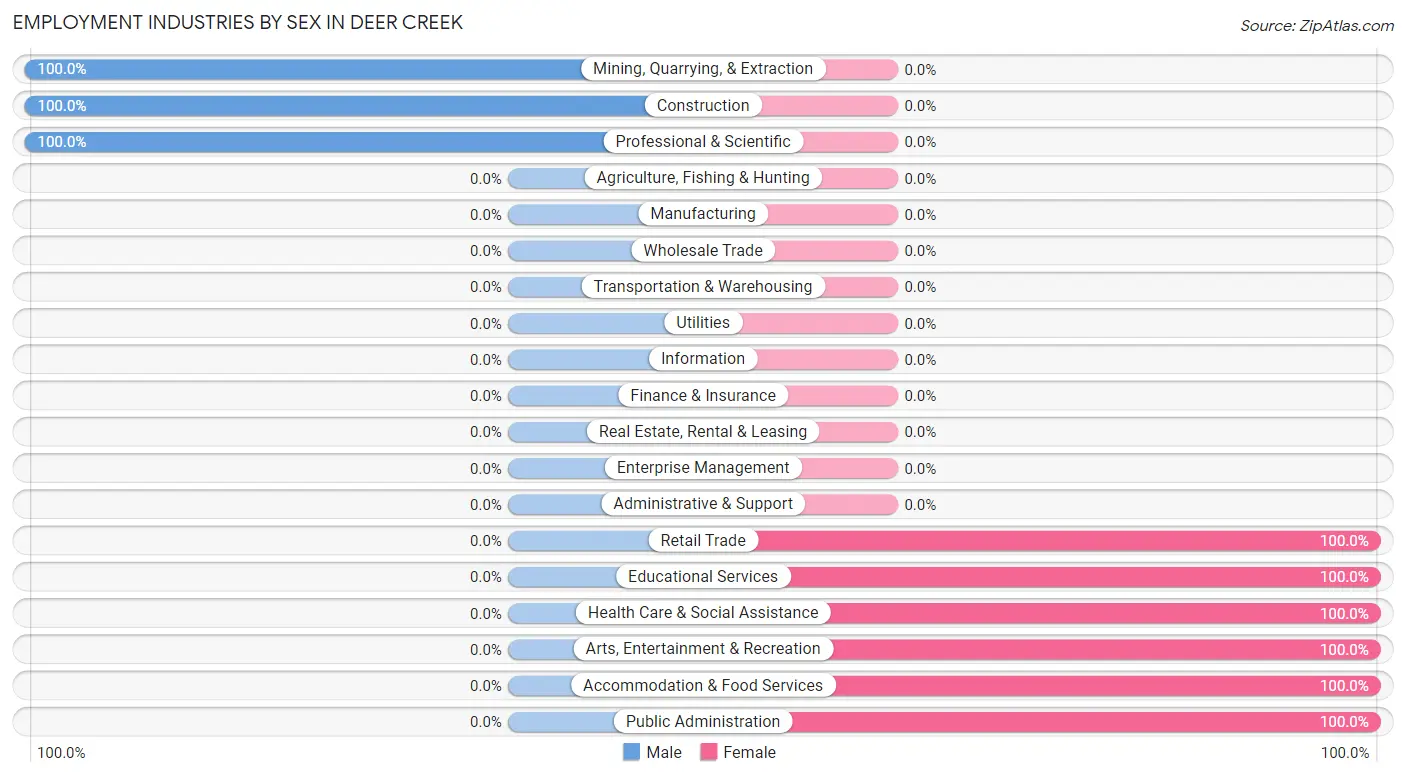
Employment Industries by Sex in Deer Creek
The Deer Creek industries that see more men than women are Mining, Quarrying, & Extraction (100.0%), Construction (100.0%), and Professional & Scientific (100.0%), whereas the industries that tend to have a higher number of women are Retail Trade (100.0%), Educational Services (100.0%), and Health Care & Social Assistance (100.0%).
| Industry | Male | Female |
| Agriculture, Fishing & Hunting | 0 (0.0%) | 0 (0.0%) |
| Mining, Quarrying, & Extraction | 2 (100.0%) | 0 (0.0%) |
| Construction | 5 (100.0%) | 0 (0.0%) |
| Manufacturing | 0 (0.0%) | 0 (0.0%) |
| Wholesale Trade | 0 (0.0%) | 0 (0.0%) |
| Retail Trade | 0 (0.0%) | 1 (100.0%) |
| Transportation & Warehousing | 0 (0.0%) | 0 (0.0%) |
| Utilities | 0 (0.0%) | 0 (0.0%) |
| Information | 0 (0.0%) | 0 (0.0%) |
| Finance & Insurance | 0 (0.0%) | 0 (0.0%) |
| Real Estate, Rental & Leasing | 0 (0.0%) | 0 (0.0%) |
| Professional & Scientific | 3 (100.0%) | 0 (0.0%) |
| Enterprise Management | 0 (0.0%) | 0 (0.0%) |
| Administrative & Support | 0 (0.0%) | 0 (0.0%) |
| Educational Services | 0 (0.0%) | 9 (100.0%) |
| Health Care & Social Assistance | 0 (0.0%) | 5 (100.0%) |
| Arts, Entertainment & Recreation | 0 (0.0%) | 3 (100.0%) |
| Accommodation & Food Services | 0 (0.0%) | 2 (100.0%) |
| Public Administration | 0 (0.0%) | 2 (100.0%) |
| Total | 10 (27.0%) | 27 (73.0%) |
Education in Deer Creek
School Enrollment in Deer Creek
The most common levels of schooling among the 29 students in Deer Creek are high school (16 | 55.2%), kindergarten (8 | 27.6%), and elementary school (5 | 17.2%).
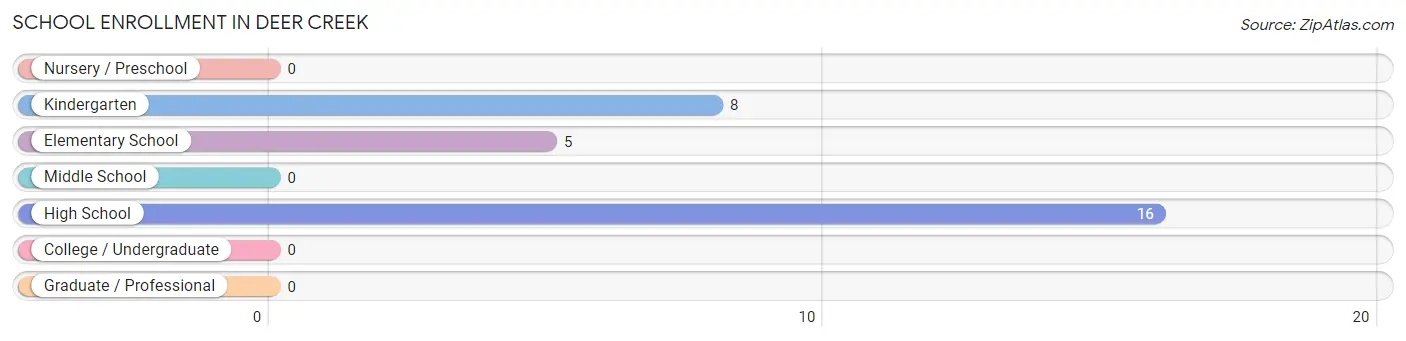
| School Level | # Students | % Students |
| Nursery / Preschool | 0 | 0.0% |
| Kindergarten | 8 | 27.6% |
| Elementary School | 5 | 17.2% |
| Middle School | 0 | 0.0% |
| High School | 16 | 55.2% |
| College / Undergraduate | 0 | 0.0% |
| Graduate / Professional | 0 | 0.0% |
| Total | 29 | 100.0% |
School Enrollment by Age by Funding Source in Deer Creek
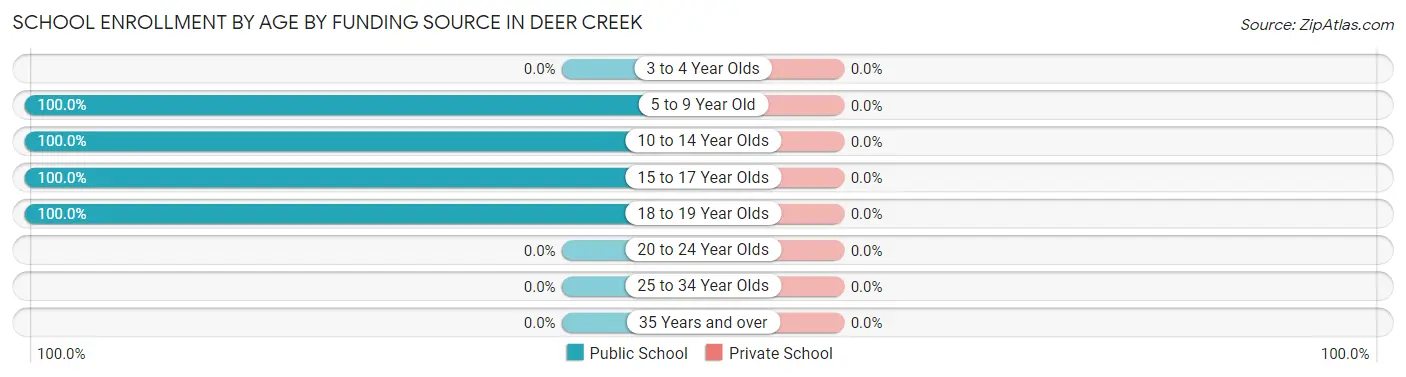
| Age Bracket | Public School | Private School |
| 3 to 4 Year Olds | 0 (0.0%) | 0 (0.0%) |
| 5 to 9 Year Old | 8 (100.0%) | 0 (0.0%) |
| 10 to 14 Year Olds | 5 (100.0%) | 0 (0.0%) |
| 15 to 17 Year Olds | 8 (100.0%) | 0 (0.0%) |
| 18 to 19 Year Olds | 8 (100.0%) | 0 (0.0%) |
| 20 to 24 Year Olds | 0 (0.0%) | 0 (0.0%) |
| 25 to 34 Year Olds | 0 (0.0%) | 0 (0.0%) |
| 35 Years and over | 0 (0.0%) | 0 (0.0%) |
| Total | 29 (100.0%) | 0 (0.0%) |
Educational Attainment by Field of Study in Deer Creek
, and education (4 | 100.0%) are the most common fields of study among 4 individuals in Deer Creek who have obtained a bachelor's degree or higher.
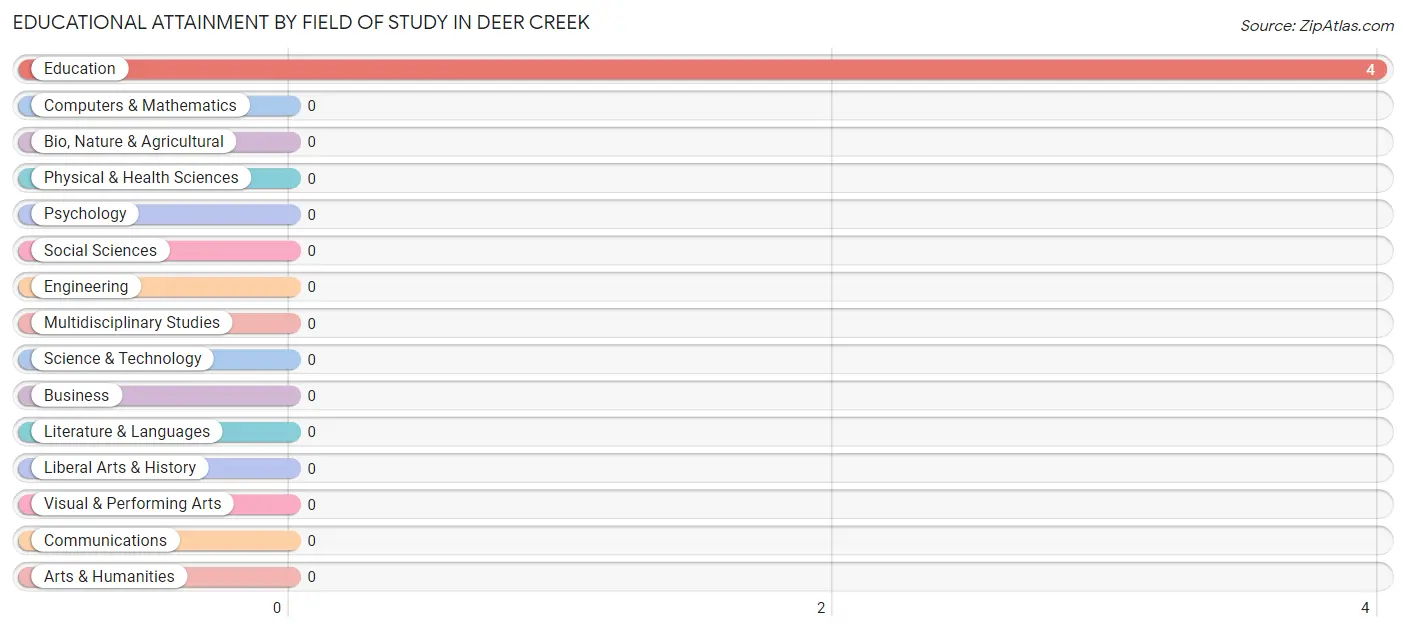
| Field of Study | # Graduates | % Graduates |
| Computers & Mathematics | 0 | 0.0% |
| Bio, Nature & Agricultural | 0 | 0.0% |
| Physical & Health Sciences | 0 | 0.0% |
| Psychology | 0 | 0.0% |
| Social Sciences | 0 | 0.0% |
| Engineering | 0 | 0.0% |
| Multidisciplinary Studies | 0 | 0.0% |
| Science & Technology | 0 | 0.0% |
| Business | 0 | 0.0% |
| Education | 4 | 100.0% |
| Literature & Languages | 0 | 0.0% |
| Liberal Arts & History | 0 | 0.0% |
| Visual & Performing Arts | 0 | 0.0% |
| Communications | 0 | 0.0% |
| Arts & Humanities | 0 | 0.0% |
| Total | 4 | 100.0% |
Transportation & Commute in Deer Creek
Vehicle Availability by Sex in Deer Creek
The most prevalent vehicle ownership categories in Deer Creek are males with 3 vehicles (7, accounting for 70.0%) and females with 3 vehicles (5, making up 38.9%).
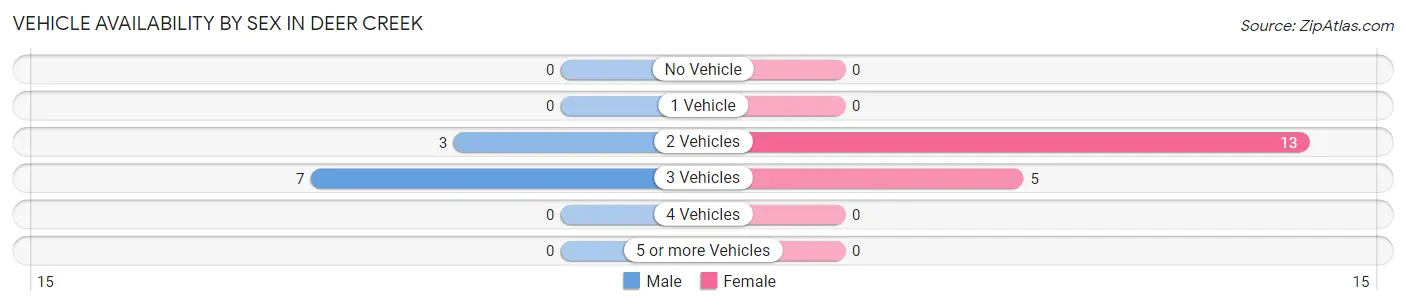
| Vehicles Available | Male | Female |
| No Vehicle | 0 (0.0%) | 0 (0.0%) |
| 1 Vehicle | 0 (0.0%) | 0 (0.0%) |
| 2 Vehicles | 3 (30.0%) | 13 (72.2%) |
| 3 Vehicles | 7 (70.0%) | 5 (27.8%) |
| 4 Vehicles | 0 (0.0%) | 0 (0.0%) |
| 5 or more Vehicles | 0 (0.0%) | 0 (0.0%) |
| Total | 10 (100.0%) | 18 (100.0%) |
Commute Time in Deer Creek
The most frequently occuring commute durations in Deer Creek are 15 to 19 minutes (14 commuters, 56.0%), 30 to 34 minutes (5 commuters, 20.0%), and 35 to 39 minutes (5 commuters, 20.0%).
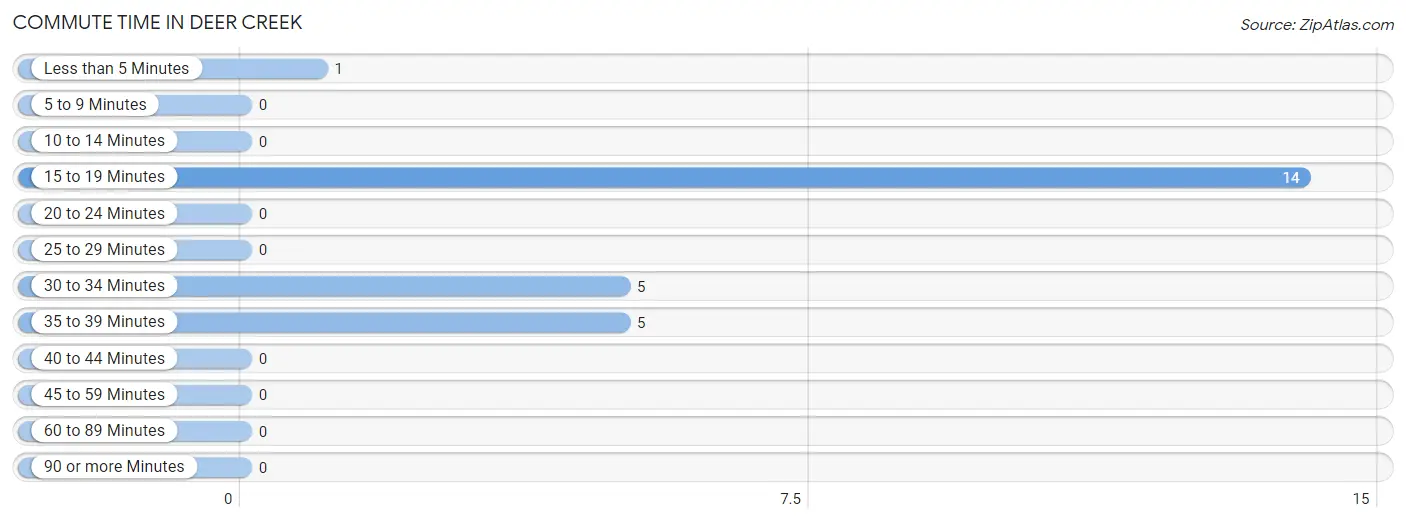
| Commute Time | # Commuters | % Commuters |
| Less than 5 Minutes | 1 | 4.0% |
| 5 to 9 Minutes | 0 | 0.0% |
| 10 to 14 Minutes | 0 | 0.0% |
| 15 to 19 Minutes | 14 | 56.0% |
| 20 to 24 Minutes | 0 | 0.0% |
| 25 to 29 Minutes | 0 | 0.0% |
| 30 to 34 Minutes | 5 | 20.0% |
| 35 to 39 Minutes | 5 | 20.0% |
| 40 to 44 Minutes | 0 | 0.0% |
| 45 to 59 Minutes | 0 | 0.0% |
| 60 to 89 Minutes | 0 | 0.0% |
| 90 or more Minutes | 0 | 0.0% |
Commute Time by Sex in Deer Creek
The most common commute times in Deer Creek are 15 to 19 minutes (7 commuters, 100.0%) for males and 15 to 19 minutes (7 commuters, 38.9%) for females.
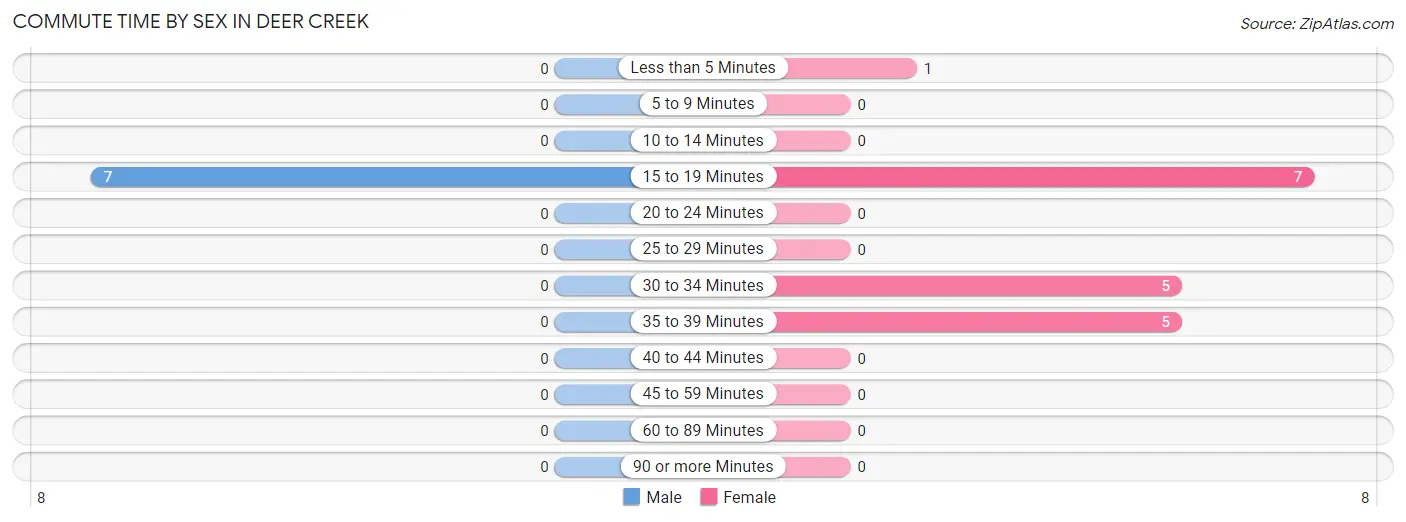
| Commute Time | Male | Female |
| Less than 5 Minutes | 0 (0.0%) | 1 (5.6%) |
| 5 to 9 Minutes | 0 (0.0%) | 0 (0.0%) |
| 10 to 14 Minutes | 0 (0.0%) | 0 (0.0%) |
| 15 to 19 Minutes | 7 (100.0%) | 7 (38.9%) |
| 20 to 24 Minutes | 0 (0.0%) | 0 (0.0%) |
| 25 to 29 Minutes | 0 (0.0%) | 0 (0.0%) |
| 30 to 34 Minutes | 0 (0.0%) | 5 (27.8%) |
| 35 to 39 Minutes | 0 (0.0%) | 5 (27.8%) |
| 40 to 44 Minutes | 0 (0.0%) | 0 (0.0%) |
| 45 to 59 Minutes | 0 (0.0%) | 0 (0.0%) |
| 60 to 89 Minutes | 0 (0.0%) | 0 (0.0%) |
| 90 or more Minutes | 0 (0.0%) | 0 (0.0%) |
Time of Departure to Work by Sex in Deer Creek
The most frequent times of departure to work in Deer Creek are 6:30 AM to 6:59 AM (5, 71.4%) for males and 7:30 AM to 7:59 AM (7, 38.9%) for females.
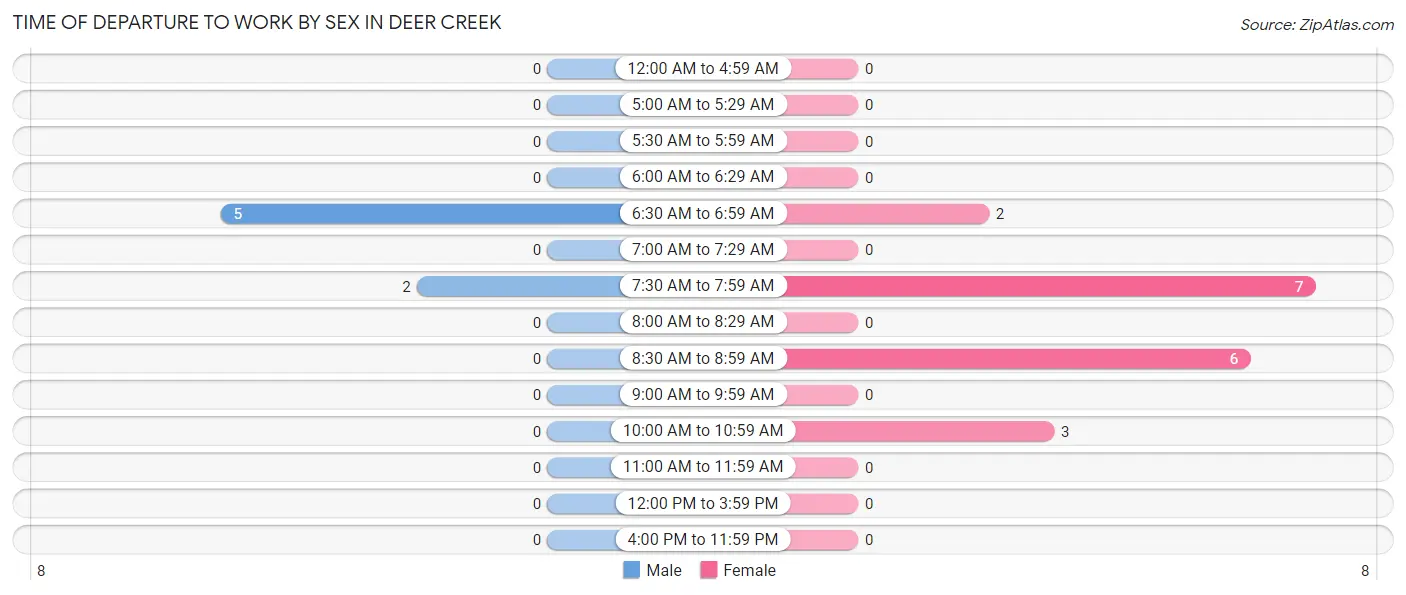
| Time of Departure | Male | Female |
| 12:00 AM to 4:59 AM | 0 (0.0%) | 0 (0.0%) |
| 5:00 AM to 5:29 AM | 0 (0.0%) | 0 (0.0%) |
| 5:30 AM to 5:59 AM | 0 (0.0%) | 0 (0.0%) |
| 6:00 AM to 6:29 AM | 0 (0.0%) | 0 (0.0%) |
| 6:30 AM to 6:59 AM | 5 (71.4%) | 2 (11.1%) |
| 7:00 AM to 7:29 AM | 0 (0.0%) | 0 (0.0%) |
| 7:30 AM to 7:59 AM | 2 (28.6%) | 7 (38.9%) |
| 8:00 AM to 8:29 AM | 0 (0.0%) | 0 (0.0%) |
| 8:30 AM to 8:59 AM | 0 (0.0%) | 6 (33.3%) |
| 9:00 AM to 9:59 AM | 0 (0.0%) | 0 (0.0%) |
| 10:00 AM to 10:59 AM | 0 (0.0%) | 3 (16.7%) |
| 11:00 AM to 11:59 AM | 0 (0.0%) | 0 (0.0%) |
| 12:00 PM to 3:59 PM | 0 (0.0%) | 0 (0.0%) |
| 4:00 PM to 11:59 PM | 0 (0.0%) | 0 (0.0%) |
| Total | 7 (100.0%) | 18 (100.0%) |
Housing Occupancy in Deer Creek
Occupancy by Ownership in Deer Creek
Of the total 29 dwellings in Deer Creek, owner-occupied units account for 28 (96.6%), while renter-occupied units make up 1 (3.5%).
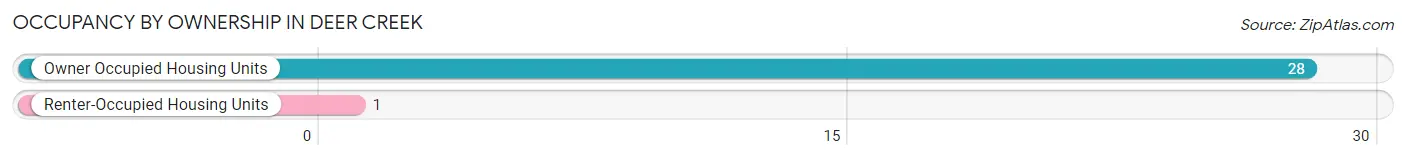
| Occupancy | # Housing Units | % Housing Units |
| Owner Occupied Housing Units | 28 | 96.6% |
| Renter-Occupied Housing Units | 1 | 3.5% |
| Total Occupied Housing Units | 29 | 100.0% |
Occupancy by Household Size in Deer Creek
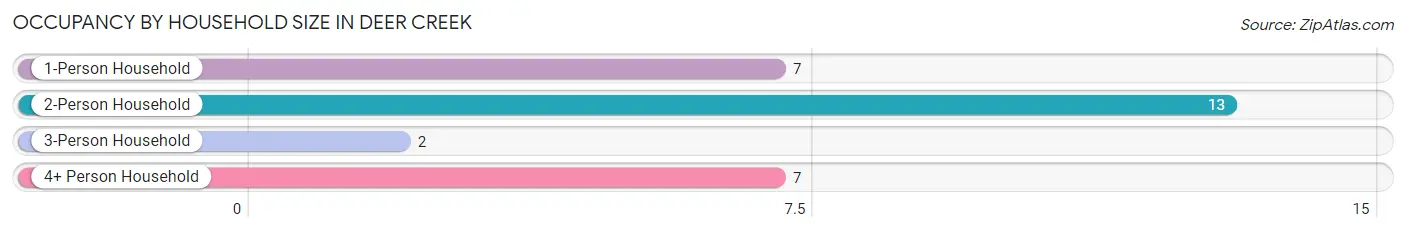
| Household Size | # Housing Units | % Housing Units |
| 1-Person Household | 7 | 24.1% |
| 2-Person Household | 13 | 44.8% |
| 3-Person Household | 2 | 6.9% |
| 4+ Person Household | 7 | 24.1% |
| Total Housing Units | 29 | 100.0% |
Occupancy by Ownership by Household Size in Deer Creek
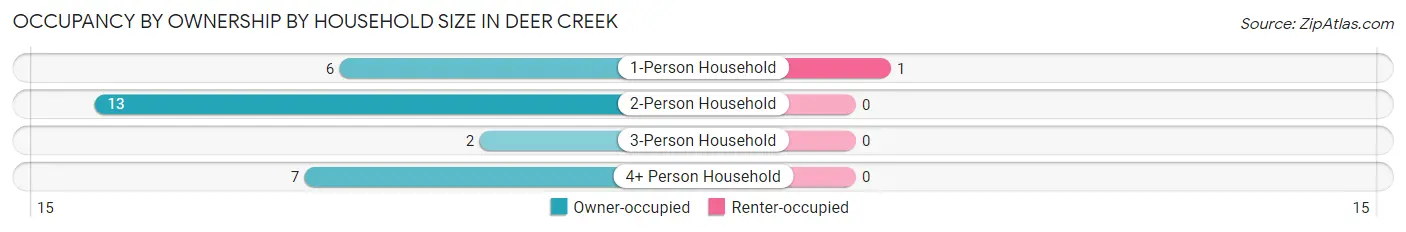
| Household Size | Owner-occupied | Renter-occupied |
| 1-Person Household | 6 (85.7%) | 1 (14.3%) |
| 2-Person Household | 13 (100.0%) | 0 (0.0%) |
| 3-Person Household | 2 (100.0%) | 0 (0.0%) |
| 4+ Person Household | 7 (100.0%) | 0 (0.0%) |
| Total Housing Units | 28 (96.6%) | 1 (3.5%) |
Occupancy by Educational Attainment in Deer Creek
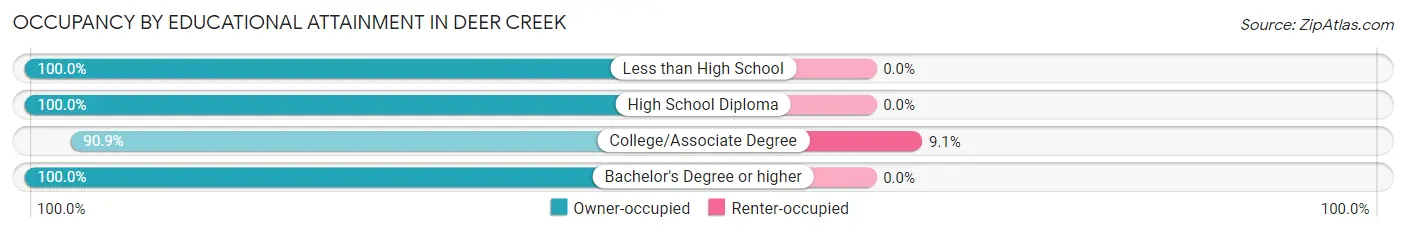
| Household Size | Owner-occupied | Renter-occupied |
| Less than High School | 2 (100.0%) | 0 (0.0%) |
| High School Diploma | 12 (100.0%) | 0 (0.0%) |
| College/Associate Degree | 10 (90.9%) | 1 (9.1%) |
| Bachelor's Degree or higher | 4 (100.0%) | 0 (0.0%) |
Occupancy by Age of Householder in Deer Creek
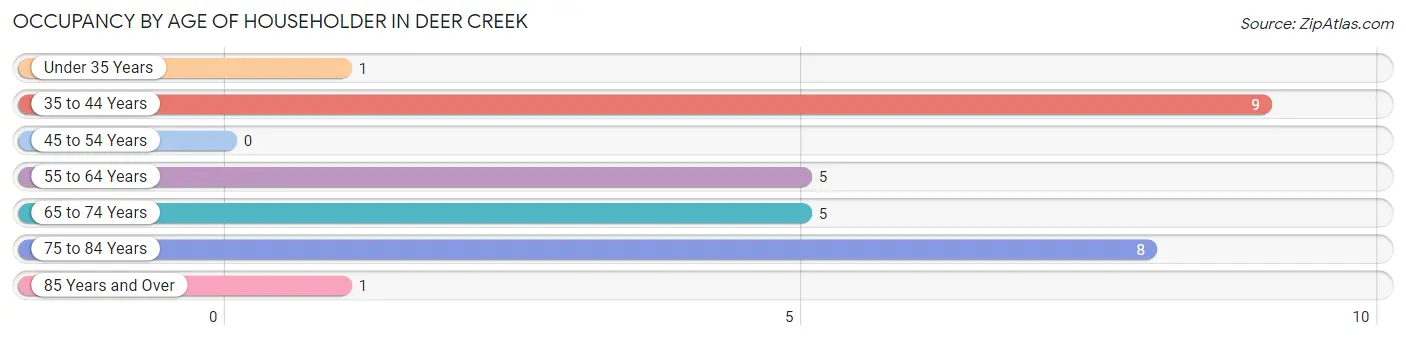
| Age Bracket | # Households | % Households |
| Under 35 Years | 1 | 3.5% |
| 35 to 44 Years | 9 | 31.0% |
| 45 to 54 Years | 0 | 0.0% |
| 55 to 64 Years | 5 | 17.2% |
| 65 to 74 Years | 5 | 17.2% |
| 75 to 84 Years | 8 | 27.6% |
| 85 Years and Over | 1 | 3.5% |
| Total | 29 | 100.0% |
Housing Finances in Deer Creek
Median Income by Occupancy in Deer Creek
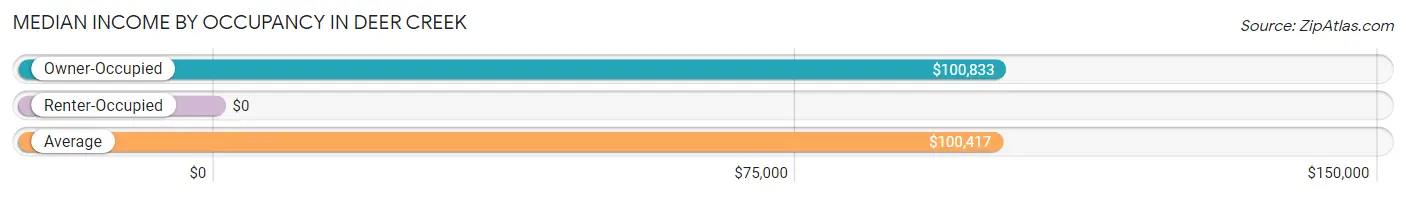
| Occupancy Type | # Households | Median Income |
| Owner-Occupied | 28 (96.6%) | $100,833 |
| Renter-Occupied | 1 (3.5%) | $0 |
| Average | 29 (100.0%) | $100,417 |
Occupancy by Householder Income Bracket in Deer Creek
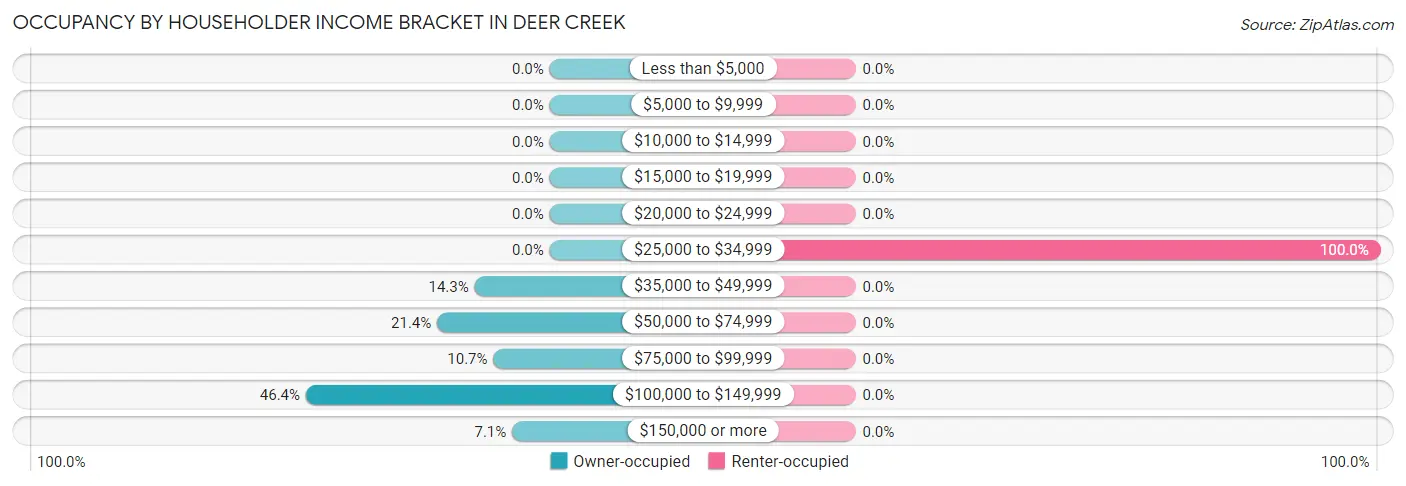
| Income Bracket | Owner-occupied | Renter-occupied |
| Less than $5,000 | 0 (0.0%) | 0 (0.0%) |
| $5,000 to $9,999 | 0 (0.0%) | 0 (0.0%) |
| $10,000 to $14,999 | 0 (0.0%) | 0 (0.0%) |
| $15,000 to $19,999 | 0 (0.0%) | 0 (0.0%) |
| $20,000 to $24,999 | 0 (0.0%) | 0 (0.0%) |
| $25,000 to $34,999 | 0 (0.0%) | 1 (100.0%) |
| $35,000 to $49,999 | 4 (14.3%) | 0 (0.0%) |
| $50,000 to $74,999 | 6 (21.4%) | 0 (0.0%) |
| $75,000 to $99,999 | 3 (10.7%) | 0 (0.0%) |
| $100,000 to $149,999 | 13 (46.4%) | 0 (0.0%) |
| $150,000 or more | 2 (7.1%) | 0 (0.0%) |
| Total | 28 (100.0%) | 1 (100.0%) |
Monthly Housing Cost Tiers in Deer Creek
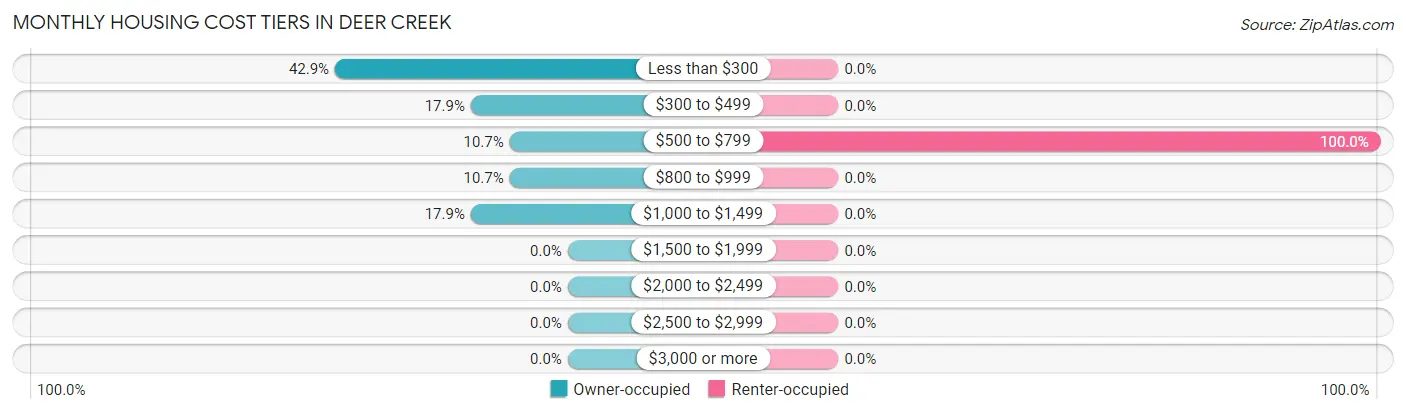
| Monthly Cost | Owner-occupied | Renter-occupied |
| Less than $300 | 12 (42.9%) | 0 (0.0%) |
| $300 to $499 | 5 (17.9%) | 0 (0.0%) |
| $500 to $799 | 3 (10.7%) | 1 (100.0%) |
| $800 to $999 | 3 (10.7%) | 0 (0.0%) |
| $1,000 to $1,499 | 5 (17.9%) | 0 (0.0%) |
| $1,500 to $1,999 | 0 (0.0%) | 0 (0.0%) |
| $2,000 to $2,499 | 0 (0.0%) | 0 (0.0%) |
| $2,500 to $2,999 | 0 (0.0%) | 0 (0.0%) |
| $3,000 or more | 0 (0.0%) | 0 (0.0%) |
| Total | 28 (100.0%) | 1 (100.0%) |
Physical Housing Characteristics in Deer Creek
Housing Structures in Deer Creek
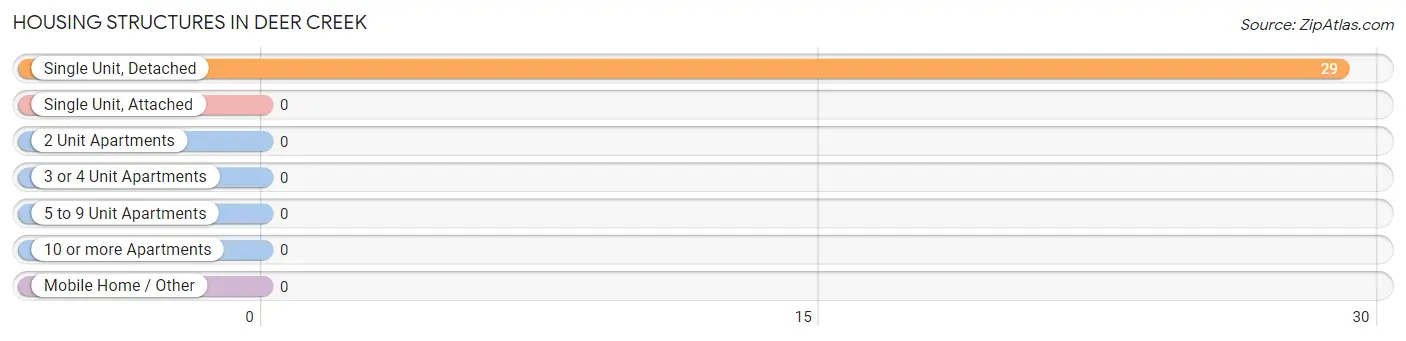
| Structure Type | # Housing Units | % Housing Units |
| Single Unit, Detached | 29 | 100.0% |
| Single Unit, Attached | 0 | 0.0% |
| 2 Unit Apartments | 0 | 0.0% |
| 3 or 4 Unit Apartments | 0 | 0.0% |
| 5 to 9 Unit Apartments | 0 | 0.0% |
| 10 or more Apartments | 0 | 0.0% |
| Mobile Home / Other | 0 | 0.0% |
| Total | 29 | 100.0% |
Housing Structures by Occupancy in Deer Creek
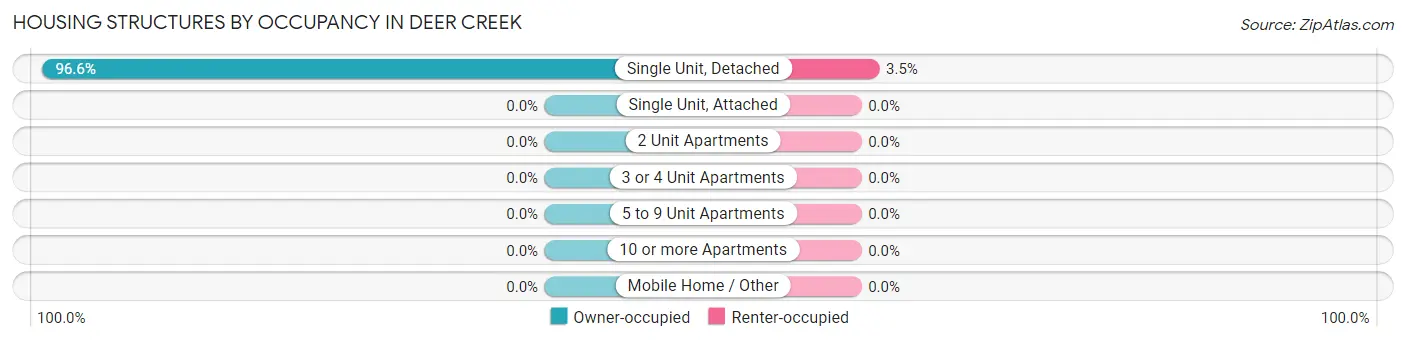
| Structure Type | Owner-occupied | Renter-occupied |
| Single Unit, Detached | 28 (96.6%) | 1 (3.5%) |
| Single Unit, Attached | 0 (0.0%) | 0 (0.0%) |
| 2 Unit Apartments | 0 (0.0%) | 0 (0.0%) |
| 3 or 4 Unit Apartments | 0 (0.0%) | 0 (0.0%) |
| 5 to 9 Unit Apartments | 0 (0.0%) | 0 (0.0%) |
| 10 or more Apartments | 0 (0.0%) | 0 (0.0%) |
| Mobile Home / Other | 0 (0.0%) | 0 (0.0%) |
| Total | 28 (96.6%) | 1 (3.5%) |
Housing Structures by Number of Rooms in Deer Creek
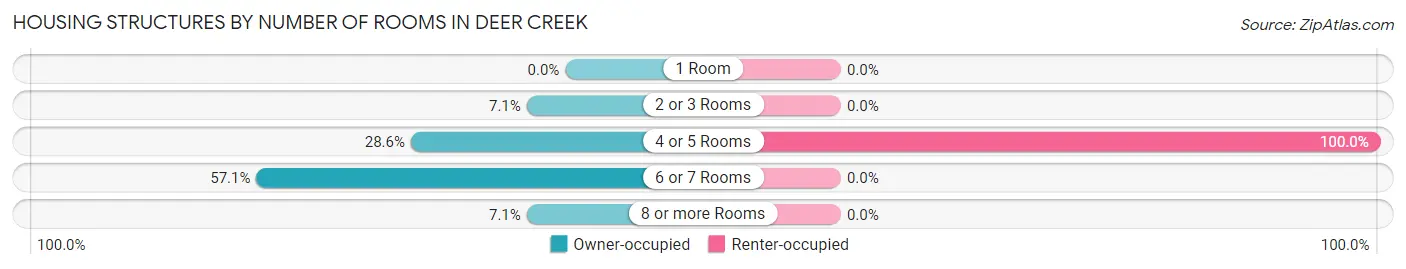
| Number of Rooms | Owner-occupied | Renter-occupied |
| 1 Room | 0 (0.0%) | 0 (0.0%) |
| 2 or 3 Rooms | 2 (7.1%) | 0 (0.0%) |
| 4 or 5 Rooms | 8 (28.6%) | 1 (100.0%) |
| 6 or 7 Rooms | 16 (57.1%) | 0 (0.0%) |
| 8 or more Rooms | 2 (7.1%) | 0 (0.0%) |
| Total | 28 (100.0%) | 1 (100.0%) |
Housing Structure by Heating Type in Deer Creek
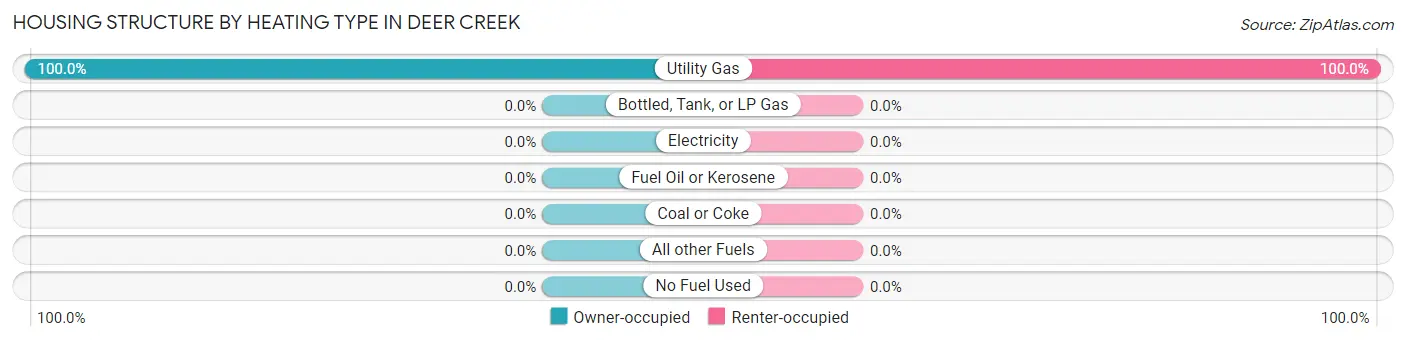
| Heating Type | Owner-occupied | Renter-occupied |
| Utility Gas | 28 (100.0%) | 1 (100.0%) |
| Bottled, Tank, or LP Gas | 0 (0.0%) | 0 (0.0%) |
| Electricity | 0 (0.0%) | 0 (0.0%) |
| Fuel Oil or Kerosene | 0 (0.0%) | 0 (0.0%) |
| Coal or Coke | 0 (0.0%) | 0 (0.0%) |
| All other Fuels | 0 (0.0%) | 0 (0.0%) |
| No Fuel Used | 0 (0.0%) | 0 (0.0%) |
| Total | 28 (100.0%) | 1 (100.0%) |
Household Vehicle Usage in Deer Creek
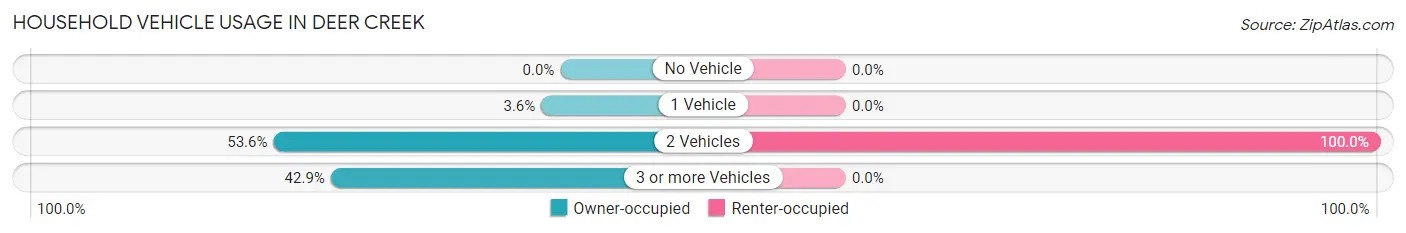
| Vehicles per Household | Owner-occupied | Renter-occupied |
| No Vehicle | 0 (0.0%) | 0 (0.0%) |
| 1 Vehicle | 1 (3.6%) | 0 (0.0%) |
| 2 Vehicles | 15 (53.6%) | 1 (100.0%) |
| 3 or more Vehicles | 12 (42.9%) | 0 (0.0%) |
| Total | 28 (100.0%) | 1 (100.0%) |
Real Estate & Mortgages in Deer Creek
Real Estate and Mortgage Overview in Deer Creek
| Characteristic | Without Mortgage | With Mortgage |
| Housing Units | 20 | 8 |
| Median Property Value | - | - |
| Median Household Income | $108,500 | $0 |
| Monthly Housing Costs | $289 | $0 |
| Real Estate Taxes | $199 | $0 |
Property Value by Mortgage Status in Deer Creek
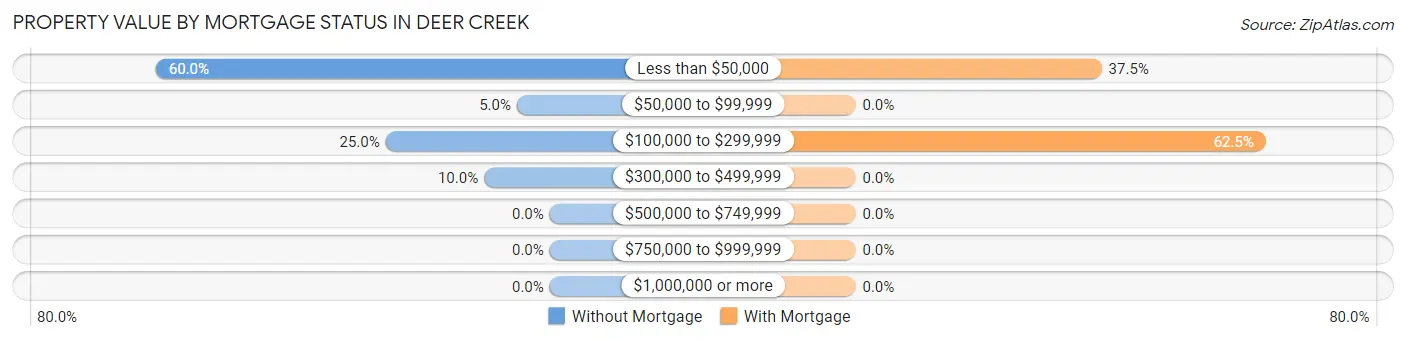
| Property Value | Without Mortgage | With Mortgage |
| Less than $50,000 | 12 (60.0%) | 3 (37.5%) |
| $50,000 to $99,999 | 1 (5.0%) | 0 (0.0%) |
| $100,000 to $299,999 | 5 (25.0%) | 5 (62.5%) |
| $300,000 to $499,999 | 2 (10.0%) | 0 (0.0%) |
| $500,000 to $749,999 | 0 (0.0%) | 0 (0.0%) |
| $750,000 to $999,999 | 0 (0.0%) | 0 (0.0%) |
| $1,000,000 or more | 0 (0.0%) | 0 (0.0%) |
| Total | 20 (100.0%) | 8 (100.0%) |
Household Income by Mortgage Status in Deer Creek
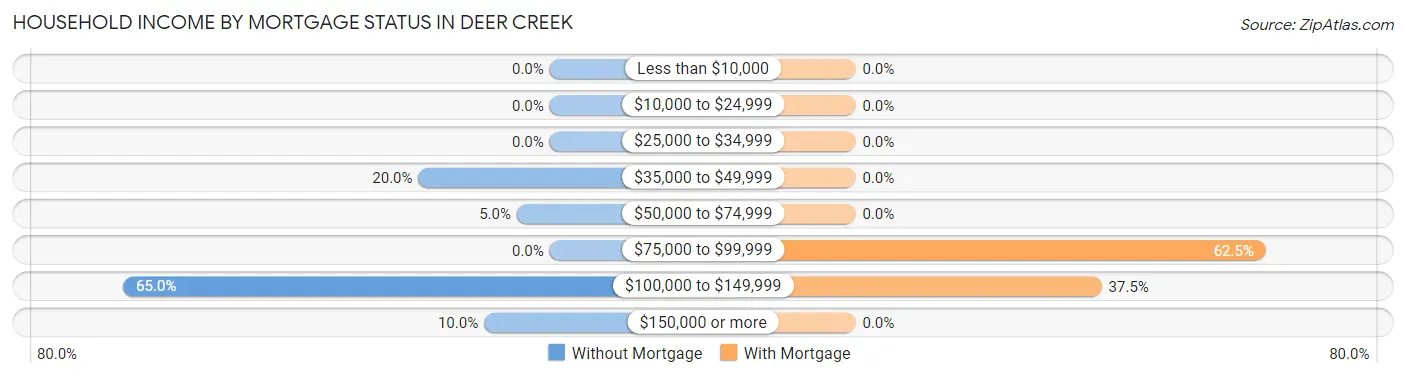
| Household Income | Without Mortgage | With Mortgage |
| Less than $10,000 | 0 (0.0%) | 0 (0.0%) |
| $10,000 to $24,999 | 0 (0.0%) | 0 (0.0%) |
| $25,000 to $34,999 | 0 (0.0%) | 0 (0.0%) |
| $35,000 to $49,999 | 4 (20.0%) | 0 (0.0%) |
| $50,000 to $74,999 | 1 (5.0%) | 0 (0.0%) |
| $75,000 to $99,999 | 0 (0.0%) | 5 (62.5%) |
| $100,000 to $149,999 | 13 (65.0%) | 3 (37.5%) |
| $150,000 or more | 2 (10.0%) | 0 (0.0%) |
| Total | 20 (100.0%) | 8 (100.0%) |
Property Value to Household Income Ratio in Deer Creek
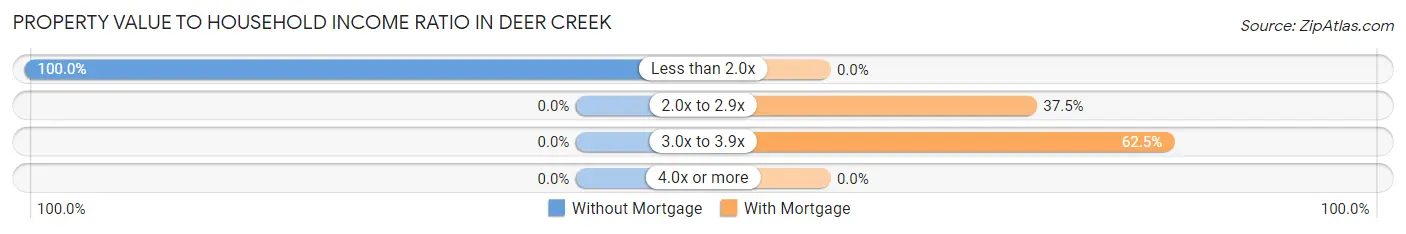
| Value-to-Income Ratio | Without Mortgage | With Mortgage |
| Less than 2.0x | 20 (100.0%) | 0 (0.0%) |
| 2.0x to 2.9x | 0 (0.0%) | 3 (37.5%) |
| 3.0x to 3.9x | 0 (0.0%) | 5 (62.5%) |
| 4.0x or more | 0 (0.0%) | 0 (0.0%) |
| Total | 20 (100.0%) | 8 (100.0%) |
Real Estate Taxes by Mortgage Status in Deer Creek
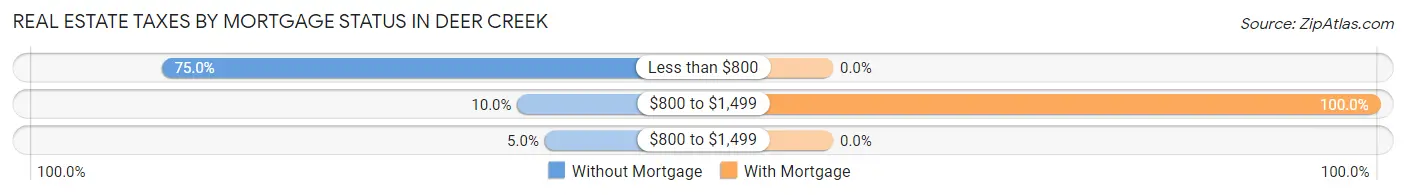
| Property Taxes | Without Mortgage | With Mortgage |
| Less than $800 | 15 (75.0%) | 0 (0.0%) |
| $800 to $1,499 | 2 (10.0%) | 8 (100.0%) |
| $800 to $1,499 | 1 (5.0%) | 0 (0.0%) |
| Total | 20 (100.0%) | 8 (100.0%) |
Health & Disability in Deer Creek
Health Insurance Coverage by Age in Deer Creek
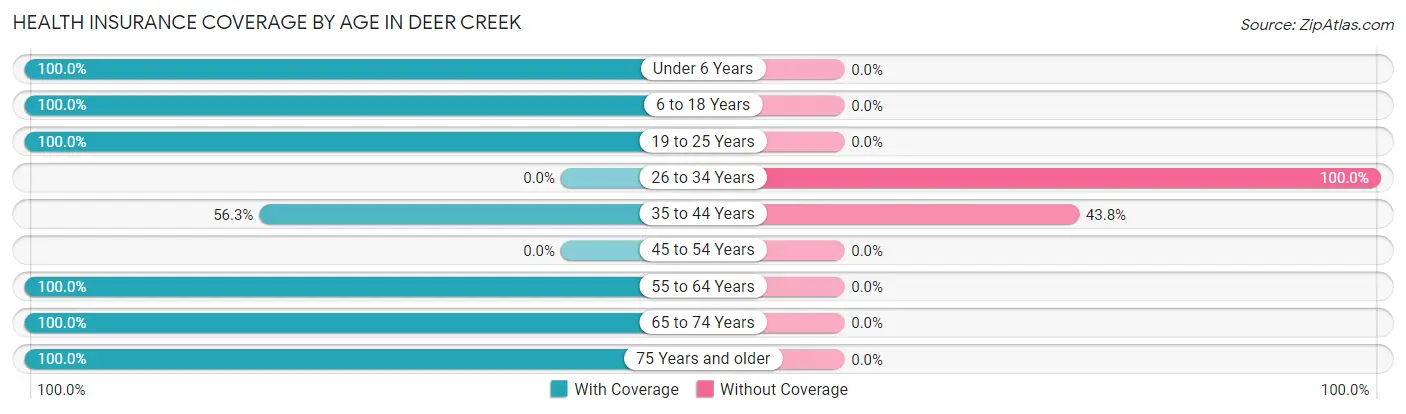
| Age Bracket | With Coverage | Without Coverage |
| Under 6 Years | 6 (100.0%) | 0 (0.0%) |
| 6 to 18 Years | 29 (100.0%) | 0 (0.0%) |
| 19 to 25 Years | 4 (100.0%) | 0 (0.0%) |
| 26 to 34 Years | 0 (0.0%) | 5 (100.0%) |
| 35 to 44 Years | 9 (56.2%) | 7 (43.8%) |
| 45 to 54 Years | 0 (0.0%) | 0 (0.0%) |
| 55 to 64 Years | 7 (100.0%) | 0 (0.0%) |
| 65 to 74 Years | 5 (100.0%) | 0 (0.0%) |
| 75 Years and older | 11 (100.0%) | 0 (0.0%) |
| Total | 71 (85.5%) | 12 (14.5%) |
Health Insurance Coverage by Citizenship Status in Deer Creek
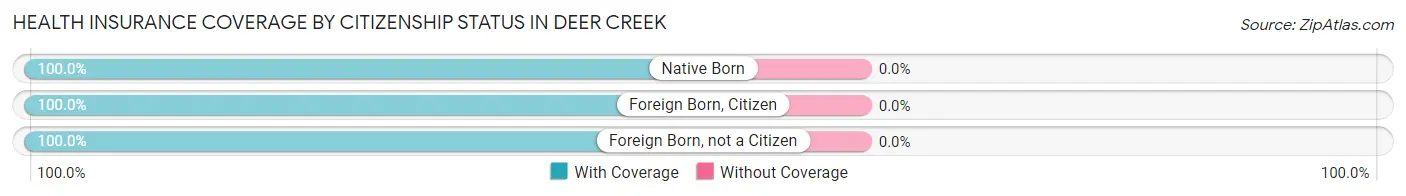
| Citizenship Status | With Coverage | Without Coverage |
| Native Born | 6 (100.0%) | 0 (0.0%) |
| Foreign Born, Citizen | 29 (100.0%) | 0 (0.0%) |
| Foreign Born, not a Citizen | 4 (100.0%) | 0 (0.0%) |
Health Insurance Coverage by Household Income in Deer Creek
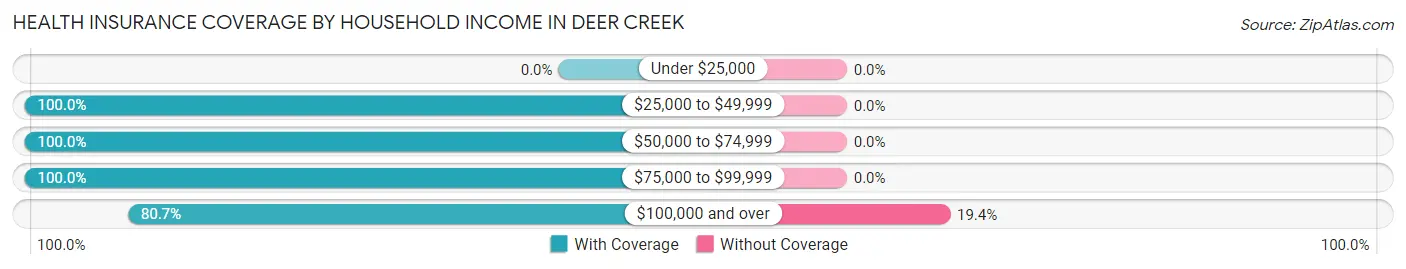
| Household Income | With Coverage | Without Coverage |
| Under $25,000 | 0 (0.0%) | 0 (0.0%) |
| $25,000 to $49,999 | 10 (100.0%) | 0 (0.0%) |
| $50,000 to $74,999 | 7 (100.0%) | 0 (0.0%) |
| $75,000 to $99,999 | 4 (100.0%) | 0 (0.0%) |
| $100,000 and over | 50 (80.6%) | 12 (19.4%) |
Public vs Private Health Insurance Coverage by Age in Deer Creek
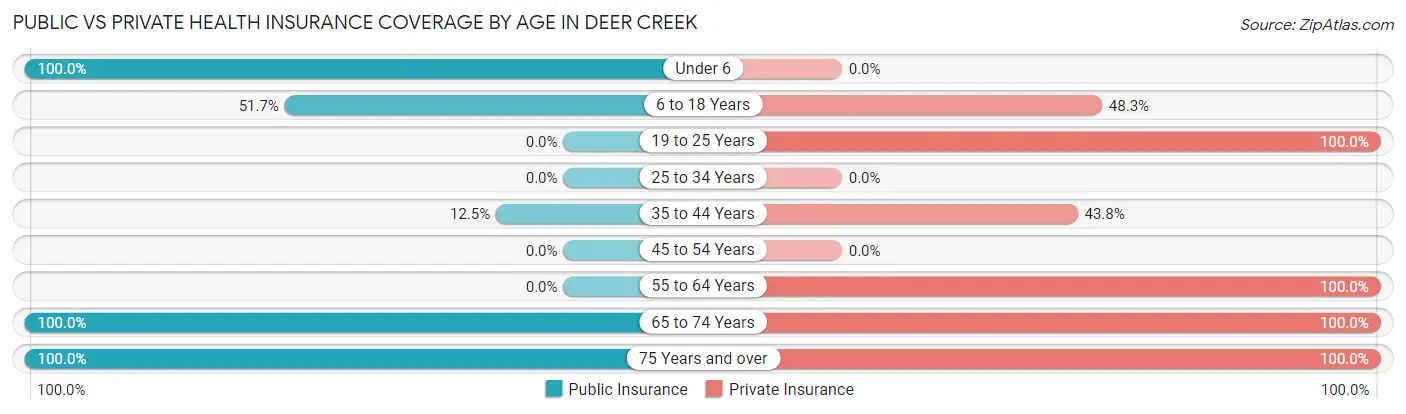
| Age Bracket | Public Insurance | Private Insurance |
| Under 6 | 6 (100.0%) | 0 (0.0%) |
| 6 to 18 Years | 15 (51.7%) | 14 (48.3%) |
| 19 to 25 Years | 0 (0.0%) | 4 (100.0%) |
| 25 to 34 Years | 0 (0.0%) | 0 (0.0%) |
| 35 to 44 Years | 2 (12.5%) | 7 (43.8%) |
| 45 to 54 Years | 0 (0.0%) | 0 (0.0%) |
| 55 to 64 Years | 0 (0.0%) | 7 (100.0%) |
| 65 to 74 Years | 5 (100.0%) | 5 (100.0%) |
| 75 Years and over | 11 (100.0%) | 11 (100.0%) |
| Total | 39 (47.0%) | 48 (57.8%) |
Disability Status by Sex by Age in Deer Creek
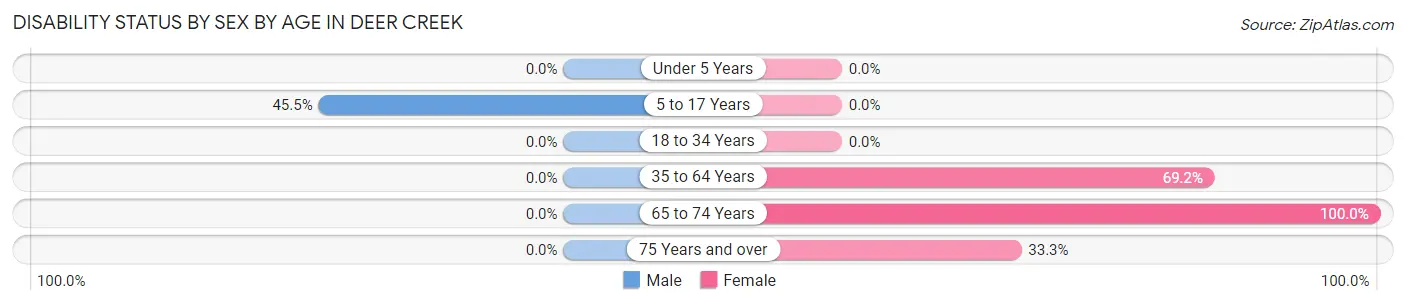
| Age Bracket | Male | Female |
| Under 5 Years | 0 (0.0%) | 0 (0.0%) |
| 5 to 17 Years | 5 (45.5%) | 0 (0.0%) |
| 18 to 34 Years | 0 (0.0%) | 0 (0.0%) |
| 35 to 64 Years | 0 (0.0%) | 9 (69.2%) |
| 65 to 74 Years | 0 (0.0%) | 5 (100.0%) |
| 75 Years and over | 0 (0.0%) | 1 (33.3%) |
Disability Class by Sex by Age in Deer Creek
Disability Class: Hearing Difficulty
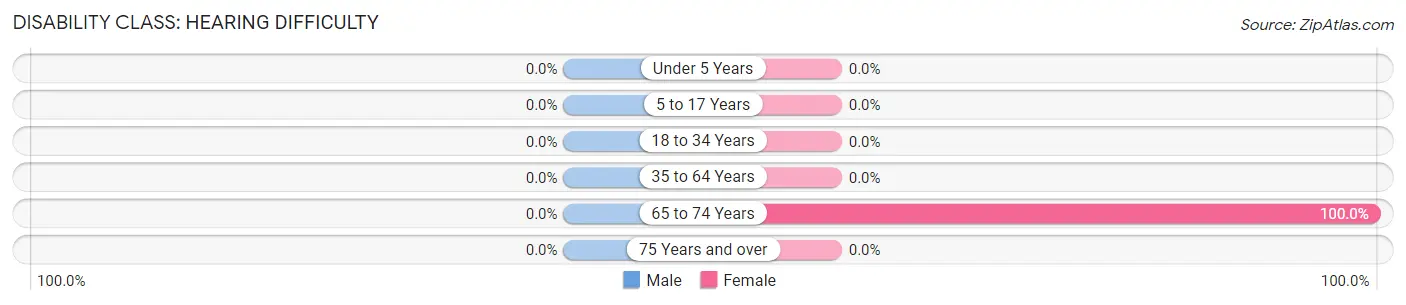
| Age Bracket | Male | Female |
| Under 5 Years | 0 (0.0%) | 0 (0.0%) |
| 5 to 17 Years | 0 (0.0%) | 0 (0.0%) |
| 18 to 34 Years | 0 (0.0%) | 0 (0.0%) |
| 35 to 64 Years | 0 (0.0%) | 0 (0.0%) |
| 65 to 74 Years | 0 (0.0%) | 5 (100.0%) |
| 75 Years and over | 0 (0.0%) | 0 (0.0%) |
Disability Class: Vision Difficulty
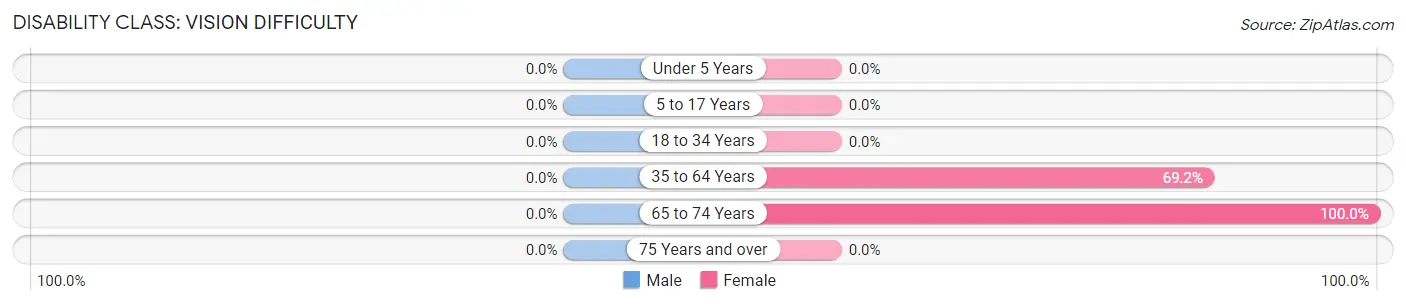
| Age Bracket | Male | Female |
| Under 5 Years | 0 (0.0%) | 0 (0.0%) |
| 5 to 17 Years | 0 (0.0%) | 0 (0.0%) |
| 18 to 34 Years | 0 (0.0%) | 0 (0.0%) |
| 35 to 64 Years | 0 (0.0%) | 9 (69.2%) |
| 65 to 74 Years | 0 (0.0%) | 5 (100.0%) |
| 75 Years and over | 0 (0.0%) | 0 (0.0%) |
Disability Class: Cognitive Difficulty
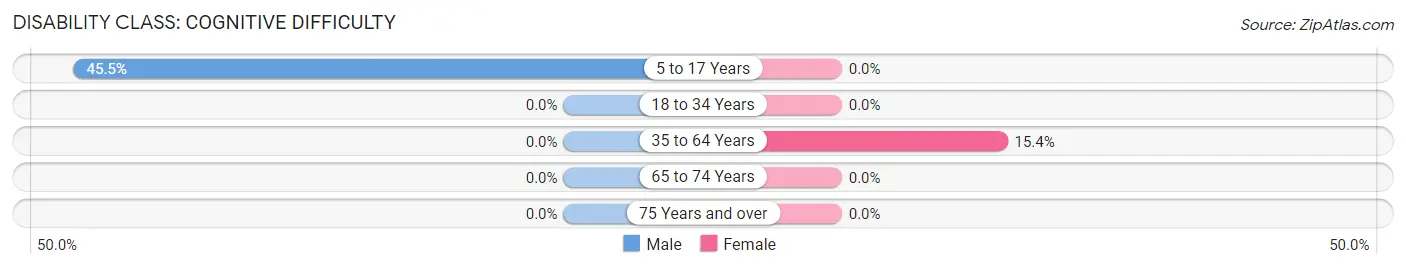
| Age Bracket | Male | Female |
| 5 to 17 Years | 5 (45.5%) | 0 (0.0%) |
| 18 to 34 Years | 0 (0.0%) | 0 (0.0%) |
| 35 to 64 Years | 0 (0.0%) | 2 (15.4%) |
| 65 to 74 Years | 0 (0.0%) | 0 (0.0%) |
| 75 Years and over | 0 (0.0%) | 0 (0.0%) |
Disability Class: Ambulatory Difficulty
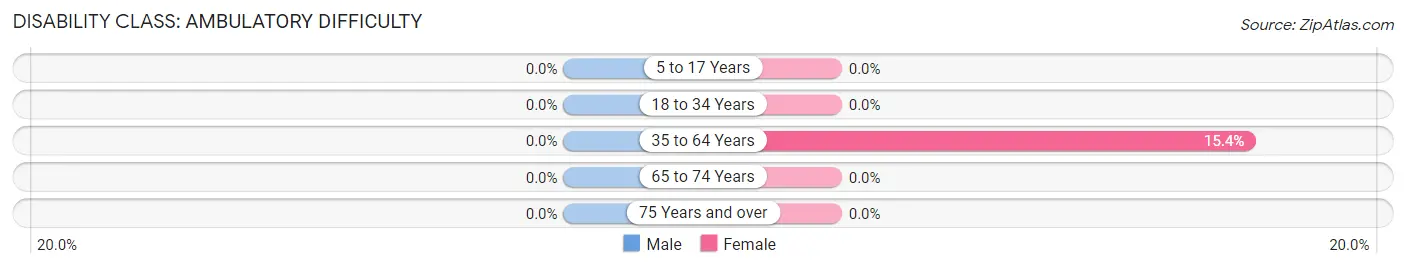
| Age Bracket | Male | Female |
| 5 to 17 Years | 0 (0.0%) | 0 (0.0%) |
| 18 to 34 Years | 0 (0.0%) | 0 (0.0%) |
| 35 to 64 Years | 0 (0.0%) | 2 (15.4%) |
| 65 to 74 Years | 0 (0.0%) | 0 (0.0%) |
| 75 Years and over | 0 (0.0%) | 0 (0.0%) |
Disability Class: Self-Care Difficulty
| Age Bracket | Male | Female |
| 5 to 17 Years | 0 (0.0%) | 0 (0.0%) |
| 18 to 34 Years | 0 (0.0%) | 0 (0.0%) |
| 35 to 64 Years | 0 (0.0%) | 0 (0.0%) |
| 65 to 74 Years | 0 (0.0%) | 0 (0.0%) |
| 75 Years and over | 0 (0.0%) | 0 (0.0%) |
Technology Access in Deer Creek
Computing Device Access in Deer Creek
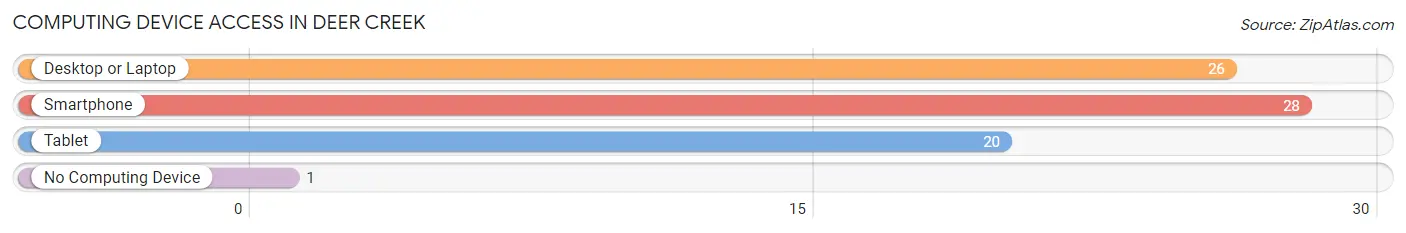
| Device Type | # Households | % Households |
| Desktop or Laptop | 26 | 89.7% |
| Smartphone | 28 | 96.6% |
| Tablet | 20 | 69.0% |
| No Computing Device | 1 | 3.5% |
| Total | 29 | 100.0% |
Internet Access in Deer Creek
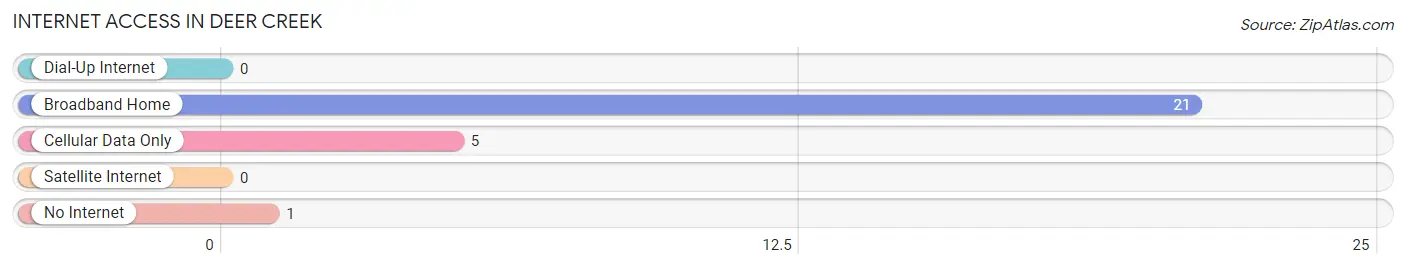
| Internet Type | # Households | % Households |
| Dial-Up Internet | 0 | 0.0% |
| Broadband Home | 21 | 72.4% |
| Cellular Data Only | 5 | 17.2% |
| Satellite Internet | 0 | 0.0% |
| No Internet | 1 | 3.5% |
| Total | 29 | 100.0% |
Deer Creek Summary
Deer Creek is a small town located in Oklahoma, United States. It is situated in the northeastern part of the state, in the county of Creek. The town has a population of around 1,000 people and is part of the Tulsa Metropolitan Statistical Area.
History
Deer Creek was founded in 1891 by a group of settlers from the Creek Nation. The town was named after the nearby Deer Creek, which was a popular hunting ground for the local Native Americans. The town was incorporated in 1895 and was initially a farming community. The town grew slowly over the years and by the early 1900s, it had a population of around 500 people.
In the 1920s, the town began to experience a period of growth due to the oil boom in the area. This led to the construction of several oil wells and refineries in the area, which provided employment for many of the town’s residents. The town also experienced a period of growth during the 1950s and 1960s due to the construction of several new highways in the area.
Geography
Deer Creek is located in the northeastern part of Oklahoma, in Creek County. The town is situated at an elevation of around 800 feet above sea level and is located near the confluence of the Arkansas and Verdigris Rivers. The town is surrounded by rolling hills and is located in a region of the state known as the “Green Country”.
The climate in Deer Creek is classified as humid subtropical, with hot summers and mild winters. The average annual temperature is around 65 degrees Fahrenheit, with an average high of around 90 degrees in the summer and an average low of around 40 degrees in the winter. The town receives an average of around 40 inches of precipitation per year, with most of it falling in the spring and summer months.
Economy
The economy of Deer Creek is largely based on agriculture and oil production. The town is home to several large farms that produce a variety of crops, including corn, soybeans, wheat, and hay. The town is also home to several oil refineries and wells, which provide employment for many of the town’s residents.
In addition to agriculture and oil production, Deer Creek is also home to several small businesses, including restaurants, retail stores, and service providers. The town is also home to a small airport, which provides transportation services to the surrounding area.
Demographics
As of the 2010 census, the population of Deer Creek was 1,000 people. The racial makeup of the town was 95.2% White, 0.7% African American, 0.7% Native American, 0.7% Asian, 0.7% from other races, and 2.1% from two or more races. The median household income in the town was $37,500, and the median family income was $45,000.
The town is served by the Deer Creek Public School District, which consists of one elementary school, one middle school, and one high school. The town is also home to several churches, including the First Baptist Church, the First United Methodist Church, and the Church of Christ.
Conclusion
Deer Creek is a small town located in northeastern Oklahoma. The town has a population of around 1,000 people and is part of the Tulsa Metropolitan Statistical Area. The town’s economy is largely based on agriculture and oil production, and the town is served by the Deer Creek Public School District. The town is also home to several churches and small businesses.
Common Questions
What is Per Capita Income in Deer Creek?
Per Capita income in Deer Creek is $40,627.
What is the Median Family Income in Deer Creek?
Median Family Income in Deer Creek is $89,167.
What is the Median Household income in Deer Creek?
Median Household Income in Deer Creek is $100,417.
What is Income or Wage Gap in Deer Creek?
Income or Wage Gap in Deer Creek is 71.6%.
Women in Deer Creek earn 28.4 cents for every dollar earned by a man.
What is Inequality or Gini Index in Deer Creek?
Inequality or Gini Index in Deer Creek is 0.27.
What is the Total Population of Deer Creek?
Total Population of Deer Creek is 83.
What is the Total Male Population of Deer Creek?
Total Male Population of Deer Creek is 29.
What is the Total Female Population of Deer Creek?
Total Female Population of Deer Creek is 54.
What is the Ratio of Males per 100 Females in Deer Creek?
There are 53.70 Males per 100 Females in Deer Creek.
What is the Ratio of Females per 100 Males in Deer Creek?
There are 186.21 Females per 100 Males in Deer Creek.
What is the Median Population Age in Deer Creek?
Median Population Age in Deer Creek is 33.5 Years.
What is the Average Family Size in Deer Creek
Average Family Size in Deer Creek is 2.9 People.
What is the Average Household Size in Deer Creek
Average Household Size in Deer Creek is 2.9 People.
How Large is the Labor Force in Deer Creek?
There are 37 People in the Labor Forcein in Deer Creek.
What is the Percentage of People in the Labor Force in Deer Creek?
57.8% of People are in the Labor Force in Deer Creek.