Zip Codes with the Highest Percentage of Population Employed in Food Preparation & Serving in Muskogee, OK
RELATED REPORTS & OPTIONS
Food Preparation & Serving
Muskogee
Compare Zip Codes
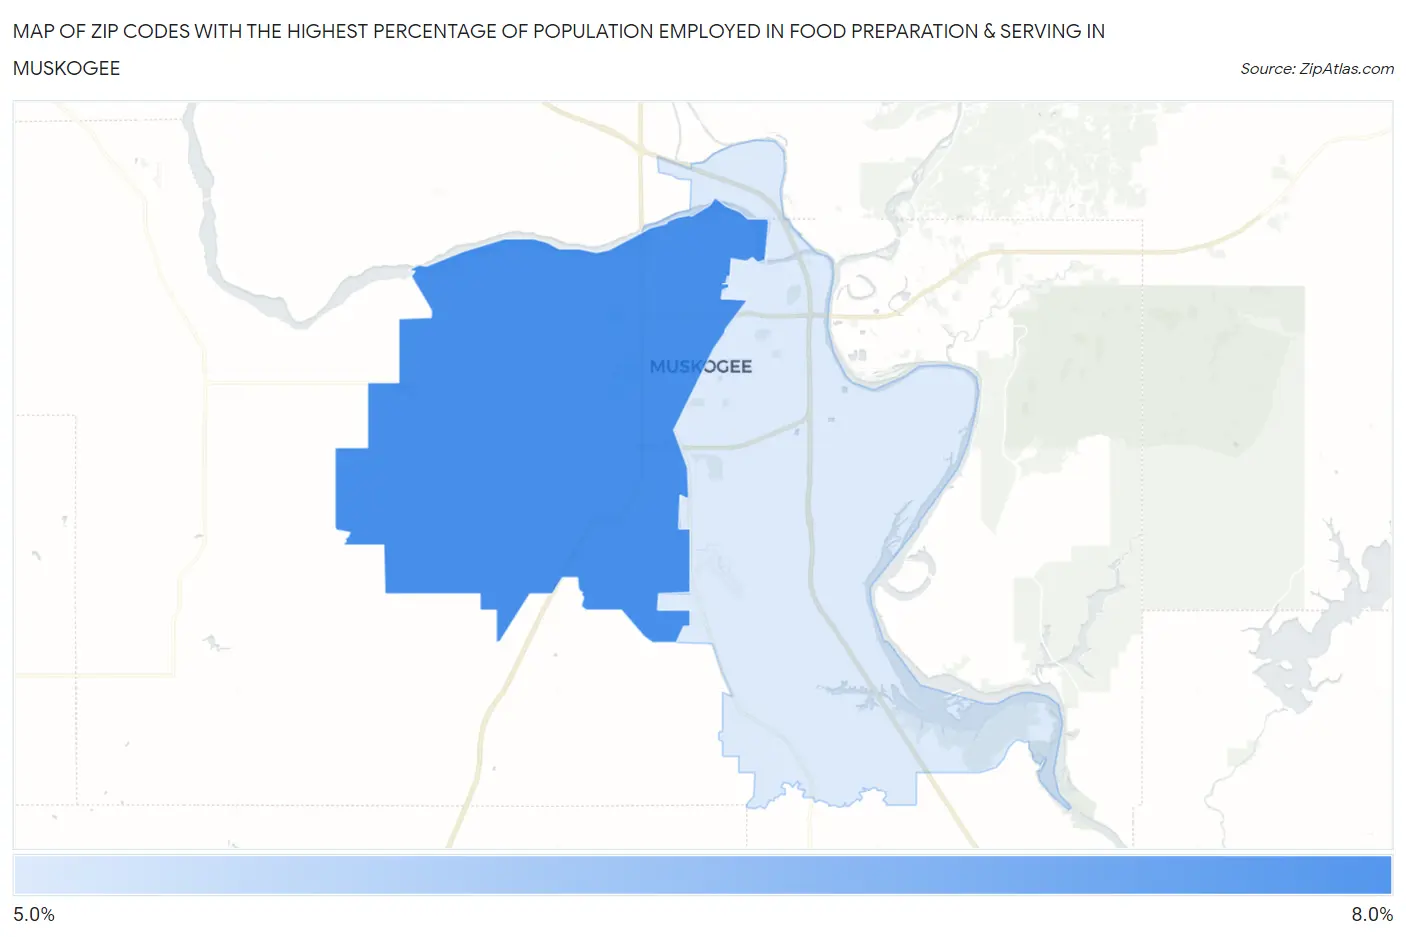
Map of Zip Codes with the Highest Percentage of Population Employed in Food Preparation & Serving in Muskogee
5.3%
6.1%
Zip Codes with the Highest Percentage of Population Employed in Food Preparation & Serving in Muskogee, OK
| Zip Code | % Employed | vs State | vs National | |
| 1. | 74401 | 6.1% | 5.6%(+0.521)#202 | 5.3%(+0.830)#8,970 |
| 2. | 74403 | 5.3% | 5.6%(-0.302)#256 | 5.3%(+0.008)#11,789 |
1
Common Questions
What are the Top Zip Codes with the Highest Percentage of Population Employed in Food Preparation & Serving in Muskogee, OK?
Top Zip Codes with the Highest Percentage of Population Employed in Food Preparation & Serving in Muskogee, OK are:
What zip code has the Highest Percentage of Population Employed in Food Preparation & Serving in Muskogee, OK?
74401 has the Highest Percentage of Population Employed in Food Preparation & Serving in Muskogee, OK with 6.1%.
What is the Percentage of Population Employed in Food Preparation & Serving in Muskogee, OK?
Percentage of Population Employed in Food Preparation & Serving in Muskogee is 5.6%.
What is the Percentage of Population Employed in Food Preparation & Serving in Oklahoma?
Percentage of Population Employed in Food Preparation & Serving in Oklahoma is 5.6%.
What is the Percentage of Population Employed in Food Preparation & Serving in the United States?
Percentage of Population Employed in Food Preparation & Serving in the United States is 5.3%.