Zip Codes with the Highest Percentage of Population Employed in Food Preparation & Serving in Norman, OK
RELATED REPORTS & OPTIONS
Food Preparation & Serving
Norman
Compare Zip Codes
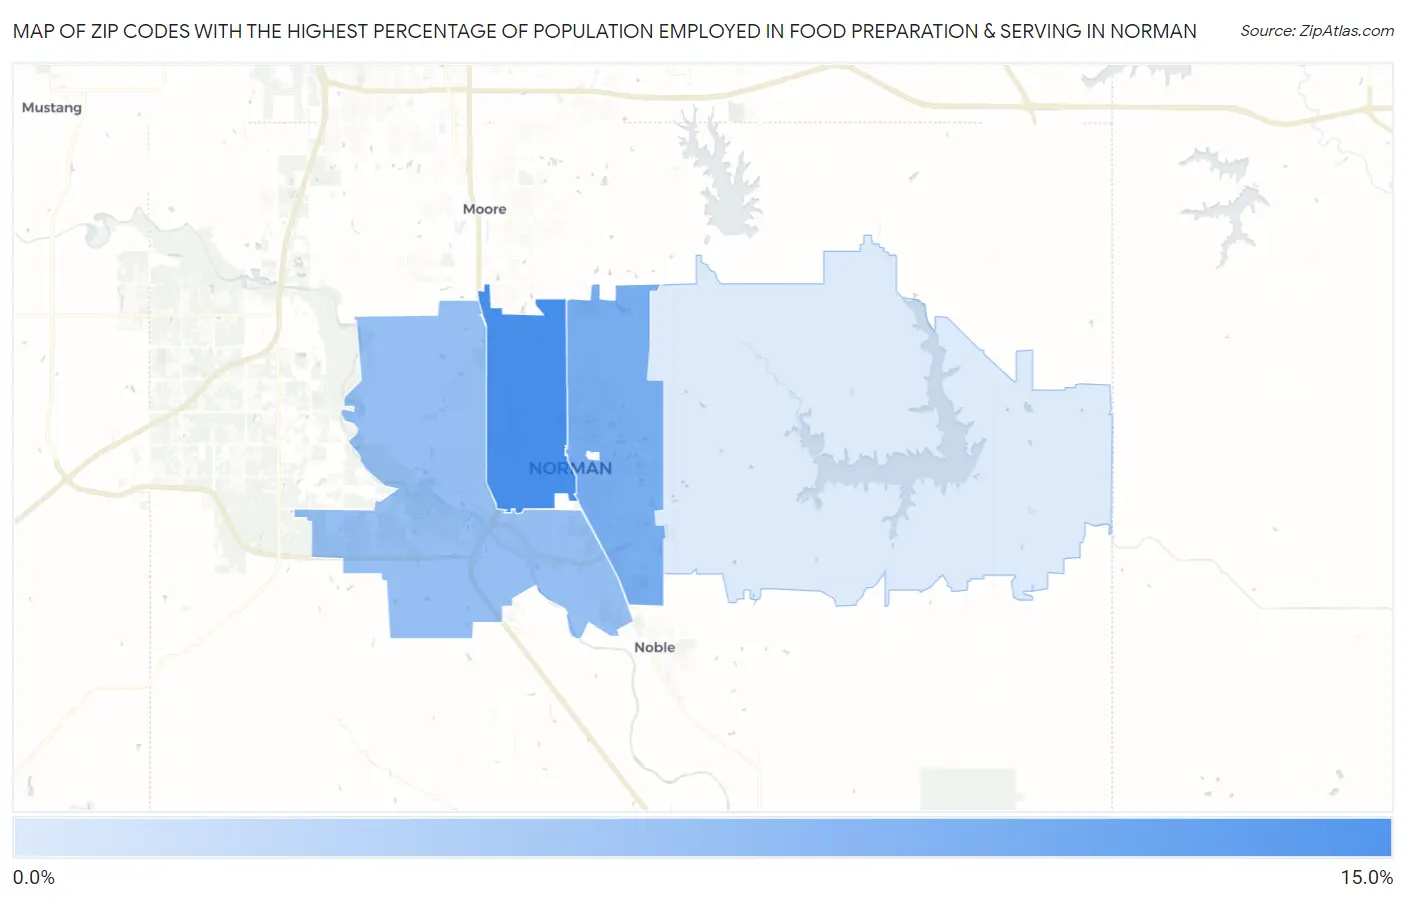
Map of Zip Codes with the Highest Percentage of Population Employed in Food Preparation & Serving in Norman
2.8%
10.3%
Zip Codes with the Highest Percentage of Population Employed in Food Preparation & Serving in Norman, OK
| Zip Code | % Employed | vs State | vs National | |
| 1. | 73069 | 10.3% | 5.6%(+4.74)#43 | 5.3%(+5.05)#2,404 |
| 2. | 73071 | 7.8% | 5.6%(+2.22)#106 | 5.3%(+2.53)#5,018 |
| 3. | 73072 | 6.3% | 5.6%(+0.734)#185 | 5.3%(+1.04)#8,337 |
| 4. | 73026 | 2.8% | 5.6%(-2.78)#460 | 5.3%(-2.47)#21,998 |
1
Common Questions
What are the Top 3 Zip Codes with the Highest Percentage of Population Employed in Food Preparation & Serving in Norman, OK?
Top 3 Zip Codes with the Highest Percentage of Population Employed in Food Preparation & Serving in Norman, OK are:
What zip code has the Highest Percentage of Population Employed in Food Preparation & Serving in Norman, OK?
73069 has the Highest Percentage of Population Employed in Food Preparation & Serving in Norman, OK with 10.3%.
What is the Percentage of Population Employed in Food Preparation & Serving in Norman, OK?
Percentage of Population Employed in Food Preparation & Serving in Norman is 7.7%.
What is the Percentage of Population Employed in Food Preparation & Serving in Oklahoma?
Percentage of Population Employed in Food Preparation & Serving in Oklahoma is 5.6%.
What is the Percentage of Population Employed in Food Preparation & Serving in the United States?
Percentage of Population Employed in Food Preparation & Serving in the United States is 5.3%.