Zip Codes with the Highest Percentage of Population Employed in Food Preparation & Serving in Oklahoma
RELATED REPORTS & OPTIONS
Food Preparation & Serving
Oklahoma
Compare Zip Codes
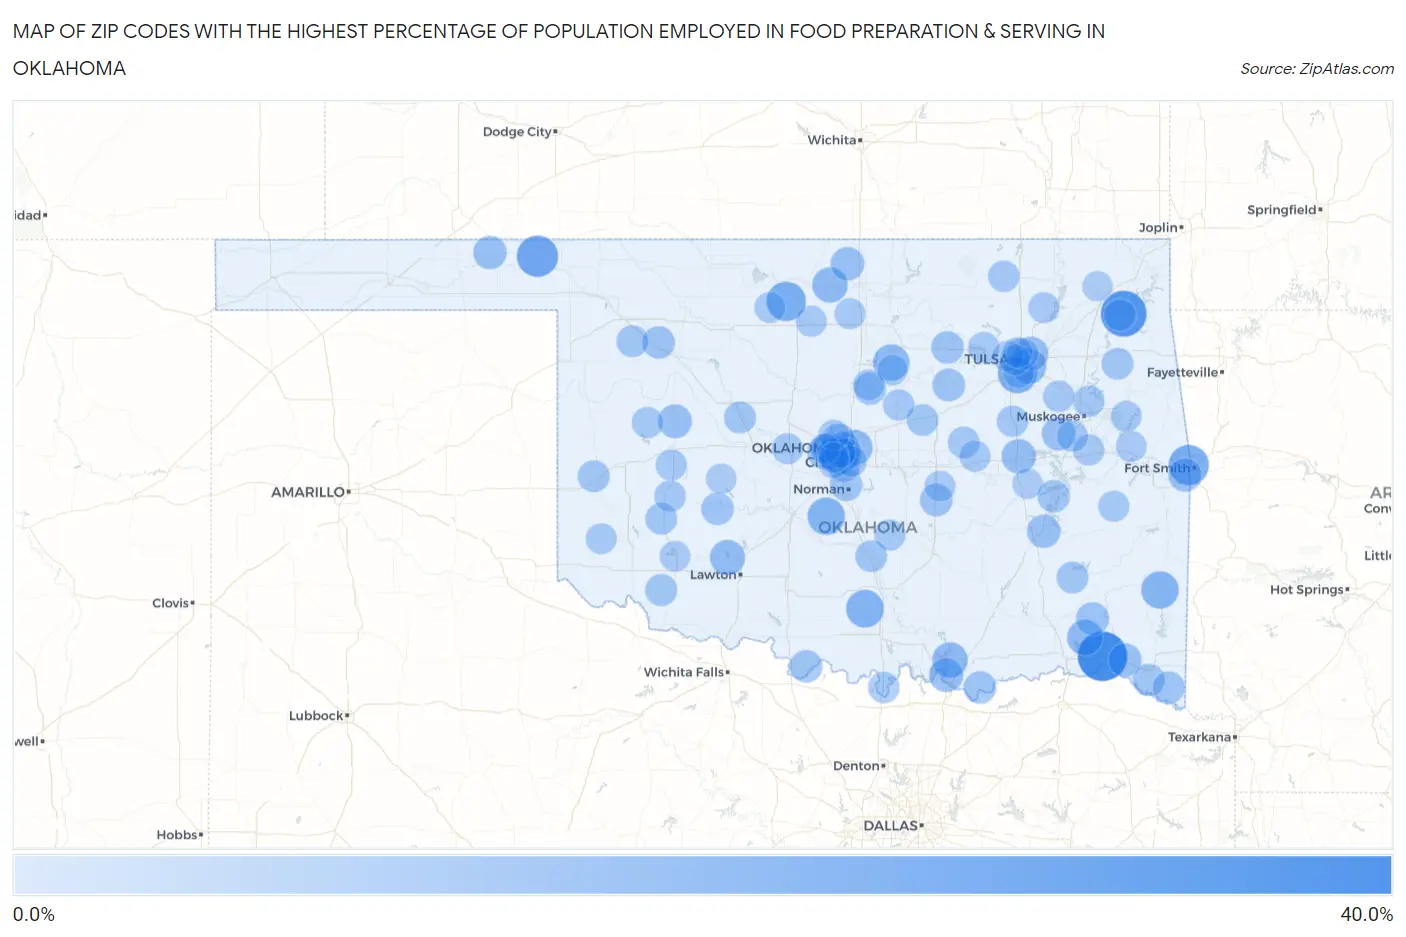
Map of Zip Codes with the Highest Percentage of Population Employed in Food Preparation & Serving in Oklahoma
0.0%
40.0%
Zip Codes with the Highest Percentage of Population Employed in Food Preparation & Serving in Oklahoma
| Zip Code | % Employed | vs State | vs National | |
| 1. | 74761 | 31.6% | 5.6%(+26.0)#1 | 5.3%(+26.3)#189 |
| 2. | 74340 | 26.9% | 5.6%(+21.3)#2 | 5.3%(+21.6)#267 |
| 3. | 73844 | 21.4% | 5.6%(+15.8)#3 | 5.3%(+16.1)#441 |
| 4. | 74946 | 20.0% | 5.6%(+14.4)#4 | 5.3%(+14.7)#505 |
| 5. | 73743 | 18.9% | 5.6%(+13.3)#5 | 5.3%(+13.6)#574 |
| 6. | 74171 | 18.4% | 5.6%(+12.8)#6 | 5.3%(+13.1)#620 |
| 7. | 73102 | 18.3% | 5.6%(+12.7)#7 | 5.3%(+13.0)#622 |
| 8. | 73458 | 17.0% | 5.6%(+11.4)#8 | 5.3%(+11.7)#754 |
| 9. | 73031 | 16.7% | 5.6%(+11.1)#9 | 5.3%(+11.4)#785 |
| 10. | 74957 | 16.6% | 5.6%(+11.0)#10 | 5.3%(+11.3)#790 |
| 11. | 74077 | 15.3% | 5.6%(+9.70)#11 | 5.3%(+10.0)#945 |
| 12. | 73106 | 14.6% | 5.6%(+9.00)#12 | 5.3%(+9.31)#1,041 |
| 13. | 74760 | 14.5% | 5.6%(+8.95)#13 | 5.3%(+9.26)#1,050 |
| 14. | 73449 | 14.3% | 5.6%(+8.69)#14 | 5.3%(+9.00)#1,093 |
| 15. | 74643 | 14.2% | 5.6%(+8.65)#15 | 5.3%(+8.96)#1,112 |
| 16. | 73141 | 13.9% | 5.6%(+8.35)#16 | 5.3%(+8.66)#1,173 |
| 17. | 74146 | 13.9% | 5.6%(+8.33)#17 | 5.3%(+8.64)#1,180 |
| 18. | 73557 | 13.9% | 5.6%(+8.32)#18 | 5.3%(+8.63)#1,183 |
| 19. | 74431 | 12.9% | 5.6%(+7.32)#19 | 5.3%(+7.63)#1,413 |
| 20. | 74731 | 12.6% | 5.6%(+7.00)#20 | 5.3%(+7.31)#1,495 |
| 21. | 74116 | 12.6% | 5.6%(+6.98)#21 | 5.3%(+7.29)#1,500 |
| 22. | 73639 | 12.4% | 5.6%(+6.80)#22 | 5.3%(+7.11)#1,541 |
| 23. | 74468 | 12.1% | 5.6%(+6.55)#23 | 5.3%(+6.86)#1,613 |
| 24. | 74646 | 12.1% | 5.6%(+6.50)#24 | 5.3%(+6.81)#1,629 |
| 25. | 74554 | 11.8% | 5.6%(+6.18)#25 | 5.3%(+6.49)#1,744 |
| 26. | 73938 | 11.8% | 5.6%(+6.17)#26 | 5.3%(+6.48)#1,748 |
| 27. | 73111 | 11.7% | 5.6%(+6.10)#27 | 5.3%(+6.41)#1,778 |
| 28. | 74901 | 11.7% | 5.6%(+6.09)#28 | 5.3%(+6.40)#1,779 |
| 29. | 74750 | 11.7% | 5.6%(+6.09)#29 | 5.3%(+6.40)#1,781 |
| 30. | 74562 | 11.4% | 5.6%(+5.76)#30 | 5.3%(+6.07)#1,897 |
| 31. | 73114 | 11.2% | 5.6%(+5.62)#31 | 5.3%(+5.93)#1,949 |
| 32. | 73127 | 11.2% | 5.6%(+5.57)#32 | 5.3%(+5.87)#1,980 |
| 33. | 74030 | 10.9% | 5.6%(+5.32)#33 | 5.3%(+5.63)#2,094 |
| 34. | 74830 | 10.9% | 5.6%(+5.31)#34 | 5.3%(+5.62)#2,098 |
| 35. | 73122 | 10.9% | 5.6%(+5.29)#35 | 5.3%(+5.60)#2,111 |
| 36. | 73853 | 10.8% | 5.6%(+5.16)#36 | 5.3%(+5.47)#2,175 |
| 37. | 73569 | 10.8% | 5.6%(+5.16)#37 | 5.3%(+5.47)#2,176 |
| 38. | 74034 | 10.7% | 5.6%(+5.12)#38 | 5.3%(+5.43)#2,202 |
| 39. | 74741 | 10.7% | 5.6%(+5.09)#39 | 5.3%(+5.40)#2,212 |
| 40. | 74425 | 10.6% | 5.6%(+4.99)#40 | 5.3%(+5.30)#2,273 |
| 41. | 73015 | 10.6% | 5.6%(+4.99)#41 | 5.3%(+5.30)#2,276 |
| 42. | 74745 | 10.4% | 5.6%(+4.84)#42 | 5.3%(+5.14)#2,358 |
| 43. | 73069 | 10.3% | 5.6%(+4.74)#43 | 5.3%(+5.05)#2,404 |
| 44. | 74740 | 10.3% | 5.6%(+4.69)#44 | 5.3%(+5.00)#2,431 |
| 45. | 73149 | 10.3% | 5.6%(+4.66)#45 | 5.3%(+4.97)#2,448 |
| 46. | 73050 | 10.2% | 5.6%(+4.61)#46 | 5.3%(+4.92)#2,480 |
| 47. | 73662 | 10.1% | 5.6%(+4.54)#47 | 5.3%(+4.85)#2,532 |
| 48. | 73570 | 10.1% | 5.6%(+4.50)#48 | 5.3%(+4.81)#2,562 |
| 49. | 73857 | 10.1% | 5.6%(+4.48)#49 | 5.3%(+4.79)#2,576 |
| 50. | 73043 | 10.0% | 5.6%(+4.40)#50 | 5.3%(+4.71)#2,641 |
| 51. | 74536 | 9.9% | 5.6%(+4.28)#51 | 5.3%(+4.59)#2,734 |
| 52. | 73075 | 9.9% | 5.6%(+4.26)#52 | 5.3%(+4.57)#2,747 |
| 53. | 74452 | 9.8% | 5.6%(+4.24)#53 | 5.3%(+4.55)#2,766 |
| 54. | 73651 | 9.8% | 5.6%(+4.18)#54 | 5.3%(+4.49)#2,812 |
| 55. | 74026 | 9.8% | 5.6%(+4.18)#55 | 5.3%(+4.49)#2,815 |
| 56. | 74833 | 9.7% | 5.6%(+4.14)#56 | 5.3%(+4.45)#2,852 |
| 57. | 74350 | 9.6% | 5.6%(+4.03)#57 | 5.3%(+4.34)#2,944 |
| 58. | 73661 | 9.6% | 5.6%(+3.97)#58 | 5.3%(+4.28)#3,001 |
| 59. | 74115 | 9.5% | 5.6%(+3.95)#59 | 5.3%(+4.26)#3,016 |
| 60. | 74003 | 9.5% | 5.6%(+3.88)#60 | 5.3%(+4.19)#3,079 |
| 61. | 74446 | 9.4% | 5.6%(+3.83)#61 | 5.3%(+4.14)#3,115 |
| 62. | 73117 | 9.3% | 5.6%(+3.75)#62 | 5.3%(+4.06)#3,189 |
| 63. | 73459 | 9.3% | 5.6%(+3.74)#63 | 5.3%(+4.05)#3,206 |
| 64. | 74832 | 9.3% | 5.6%(+3.72)#64 | 5.3%(+4.03)#3,221 |
| 65. | 73107 | 9.3% | 5.6%(+3.71)#65 | 5.3%(+4.02)#3,231 |
| 66. | 74456 | 9.3% | 5.6%(+3.71)#66 | 5.3%(+4.02)#3,237 |
| 67. | 73625 | 9.3% | 5.6%(+3.68)#67 | 5.3%(+3.99)#3,251 |
| 68. | 74458 | 9.2% | 5.6%(+3.64)#68 | 5.3%(+3.94)#3,291 |
| 69. | 74060 | 9.2% | 5.6%(+3.55)#69 | 5.3%(+3.86)#3,370 |
| 70. | 74859 | 9.1% | 5.6%(+3.54)#70 | 5.3%(+3.85)#3,381 |
| 71. | 73119 | 9.1% | 5.6%(+3.52)#71 | 5.3%(+3.83)#3,403 |
| 72. | 74469 | 9.1% | 5.6%(+3.52)#72 | 5.3%(+3.83)#3,405 |
| 73. | 73145 | 9.0% | 5.6%(+3.45)#73 | 5.3%(+3.76)#3,477 |
| 74. | 74450 | 9.0% | 5.6%(+3.44)#74 | 5.3%(+3.75)#3,495 |
| 75. | 73036 | 9.0% | 5.6%(+3.42)#75 | 5.3%(+3.73)#3,513 |
| 76. | 74831 | 9.0% | 5.6%(+3.42)#76 | 5.3%(+3.73)#3,514 |
| 77. | 73622 | 9.0% | 5.6%(+3.41)#77 | 5.3%(+3.72)#3,522 |
| 78. | 73701 | 9.0% | 5.6%(+3.40)#78 | 5.3%(+3.71)#3,531 |
| 79. | 74136 | 8.9% | 5.6%(+3.32)#79 | 5.3%(+3.63)#3,603 |
| 80. | 74451 | 8.9% | 5.6%(+3.32)#80 | 5.3%(+3.63)#3,606 |
| 81. | 74943 | 8.9% | 5.6%(+3.29)#81 | 5.3%(+3.60)#3,632 |
| 82. | 74630 | 8.9% | 5.6%(+3.28)#82 | 5.3%(+3.59)#3,636 |
| 83. | 73554 | 8.9% | 5.6%(+3.27)#83 | 5.3%(+3.57)#3,653 |
| 84. | 73027 | 8.8% | 5.6%(+3.24)#84 | 5.3%(+3.55)#3,676 |
| 85. | 73739 | 8.8% | 5.6%(+3.23)#85 | 5.3%(+3.54)#3,701 |
| 86. | 73103 | 8.8% | 5.6%(+3.23)#86 | 5.3%(+3.54)#3,707 |
| 87. | 74080 | 8.8% | 5.6%(+3.17)#87 | 5.3%(+3.48)#3,766 |
| 88. | 74868 | 8.7% | 5.6%(+3.15)#88 | 5.3%(+3.46)#3,783 |
| 89. | 74127 | 8.7% | 5.6%(+3.09)#89 | 5.3%(+3.39)#3,875 |
| 90. | 74962 | 8.7% | 5.6%(+3.07)#90 | 5.3%(+3.37)#3,904 |
| 91. | 73559 | 8.6% | 5.6%(+3.04)#91 | 5.3%(+3.35)#3,922 |
| 92. | 73134 | 8.4% | 5.6%(+2.83)#92 | 5.3%(+3.14)#4,137 |
| 93. | 74120 | 8.4% | 5.6%(+2.77)#93 | 5.3%(+3.08)#4,212 |
| 94. | 73008 | 8.3% | 5.6%(+2.73)#94 | 5.3%(+3.03)#4,292 |
| 95. | 73108 | 8.3% | 5.6%(+2.66)#95 | 5.3%(+2.97)#4,364 |
| 96. | 74845 | 8.2% | 5.6%(+2.61)#96 | 5.3%(+2.92)#4,425 |
| 97. | 74074 | 8.2% | 5.6%(+2.58)#97 | 5.3%(+2.89)#4,471 |
| 98. | 73033 | 8.2% | 5.6%(+2.58)#98 | 5.3%(+2.89)#4,478 |
| 99. | 74110 | 8.2% | 5.6%(+2.57)#99 | 5.3%(+2.88)#4,481 |
| 100. | 74301 | 8.1% | 5.6%(+2.51)#100 | 5.3%(+2.82)#4,556 |
Common Questions
What are the Top 10 Zip Codes with the Highest Percentage of Population Employed in Food Preparation & Serving in Oklahoma?
Top 10 Zip Codes with the Highest Percentage of Population Employed in Food Preparation & Serving in Oklahoma are:
What zip code has the Highest Percentage of Population Employed in Food Preparation & Serving in Oklahoma?
74761 has the Highest Percentage of Population Employed in Food Preparation & Serving in Oklahoma with 31.6%.
What is the Percentage of Population Employed in Food Preparation & Serving in the State of Oklahoma?
Percentage of Population Employed in Food Preparation & Serving in Oklahoma is 5.6%.
What is the Percentage of Population Employed in Food Preparation & Serving in the United States?
Percentage of Population Employed in Food Preparation & Serving in the United States is 5.3%.