Eufaula, OK Map & Demographics
Eufaula Map
Eufaula Overview
$21,048
PER CAPITA INCOME
$54,712
AVG FAMILY INCOME
$38,774
AVG HOUSEHOLD INCOME
53.9%
WAGE / INCOME GAP [ % ]
46.1¢/ $1
WAGE / INCOME GAP [ $ ]
0.44
INEQUALITY / GINI INDEX
2,776
TOTAL POPULATION
1,199
MALE POPULATION
1,577
FEMALE POPULATION
76.03
MALES / 100 FEMALES
131.53
FEMALES / 100 MALES
47.7
MEDIAN AGE
3.1
AVG FAMILY SIZE
2.2
AVG HOUSEHOLD SIZE
746
LABOR FORCE [ PEOPLE ]
33.5%
PERCENT IN LABOR FORCE
2.5%
UNEMPLOYMENT RATE
Eufaula Zip Codes
Eufaula Area Codes
Income in Eufaula
Income Overview in Eufaula
Per Capita Income in Eufaula is $21,048, while median incomes of families and households are $54,712 and $38,774 respectively.
| Characteristic | Number | Measure |
| Per Capita Income | 2,776 | $21,048 |
| Median Family Income | 603 | $54,712 |
| Mean Family Income | 603 | $55,648 |
| Median Household Income | 1,171 | $38,774 |
| Mean Household Income | 1,171 | $45,596 |
| Income Deficit | 603 | $0 |
| Wage / Income Gap (%) | 2,776 | 53.95% |
| Wage / Income Gap ($) | 2,776 | 46.05¢ per $1 |
| Gini / Inequality Index | 2,776 | 0.44 |
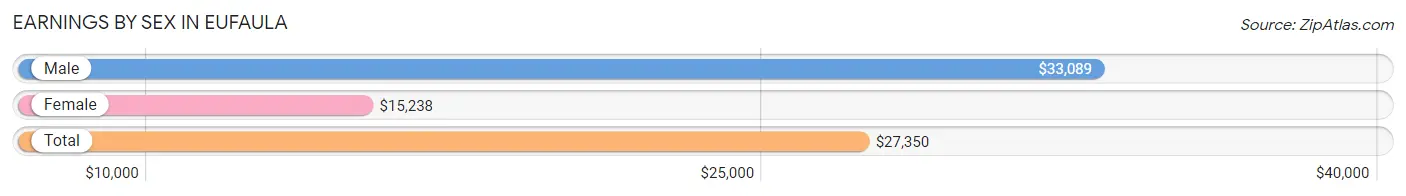
Earnings by Sex in Eufaula
Average Earnings in Eufaula are $27,350, $33,089 for men and $15,238 for women, a difference of 53.9%.
| Sex | Number | Average Earnings |
| Male | 535 (55.4%) | $33,089 |
| Female | 430 (44.6%) | $15,238 |
| Total | 965 (100.0%) | $27,350 |
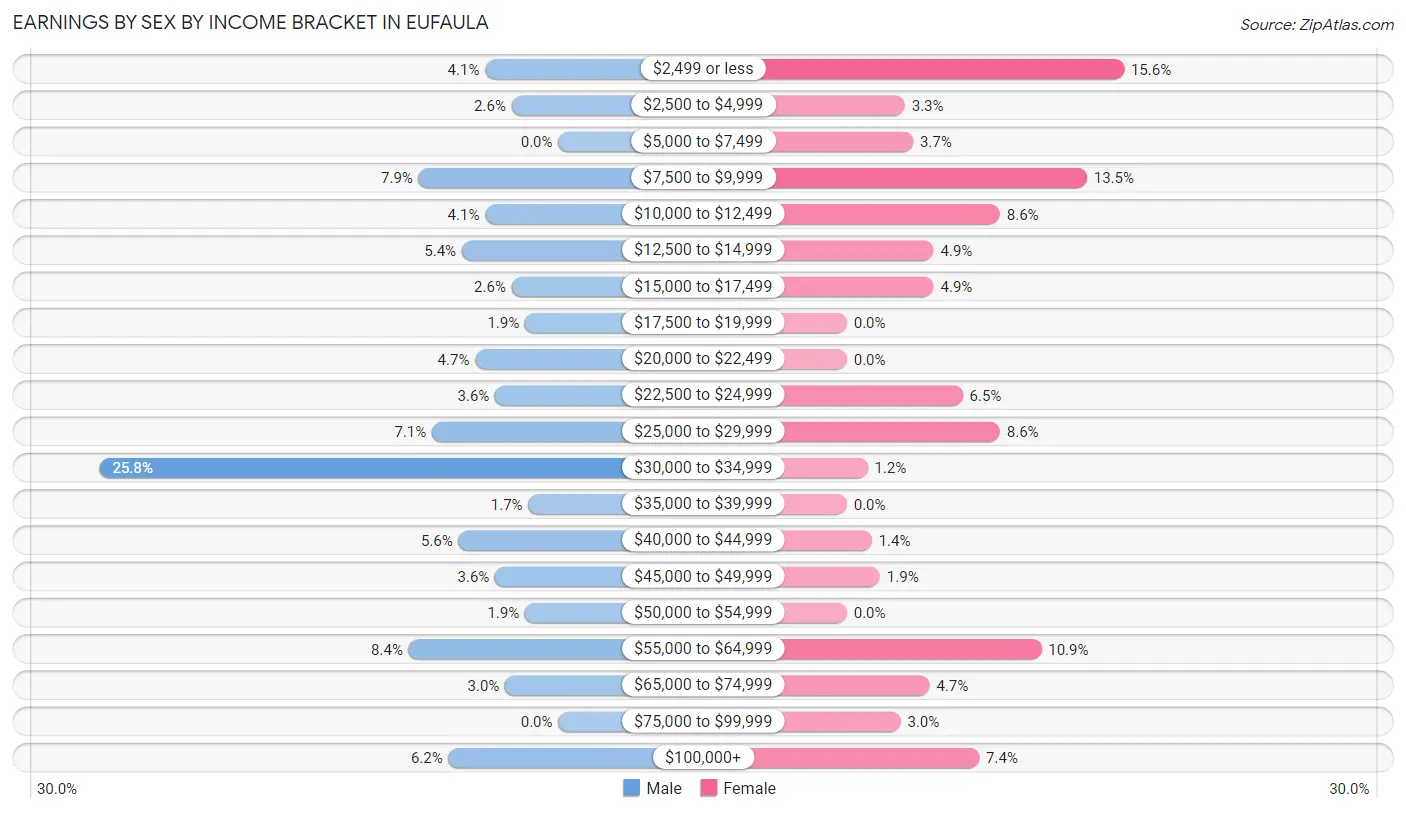
Earnings by Sex by Income Bracket in Eufaula
The most common earnings brackets in Eufaula are $30,000 to $34,999 for men (138 | 25.8%) and $2,499 or less for women (67 | 15.6%).
| Income | Male | Female |
| $2,499 or less | 22 (4.1%) | 67 (15.6%) |
| $2,500 to $4,999 | 14 (2.6%) | 14 (3.3%) |
| $5,000 to $7,499 | 0 (0.0%) | 16 (3.7%) |
| $7,500 to $9,999 | 42 (7.9%) | 58 (13.5%) |
| $10,000 to $12,499 | 22 (4.1%) | 37 (8.6%) |
| $12,500 to $14,999 | 29 (5.4%) | 21 (4.9%) |
| $15,000 to $17,499 | 14 (2.6%) | 21 (4.9%) |
| $17,500 to $19,999 | 10 (1.9%) | 0 (0.0%) |
| $20,000 to $22,499 | 25 (4.7%) | 0 (0.0%) |
| $22,500 to $24,999 | 19 (3.5%) | 28 (6.5%) |
| $25,000 to $29,999 | 38 (7.1%) | 37 (8.6%) |
| $30,000 to $34,999 | 138 (25.8%) | 5 (1.2%) |
| $35,000 to $39,999 | 9 (1.7%) | 0 (0.0%) |
| $40,000 to $44,999 | 30 (5.6%) | 6 (1.4%) |
| $45,000 to $49,999 | 19 (3.5%) | 8 (1.9%) |
| $50,000 to $54,999 | 10 (1.9%) | 0 (0.0%) |
| $55,000 to $64,999 | 45 (8.4%) | 47 (10.9%) |
| $65,000 to $74,999 | 16 (3.0%) | 20 (4.6%) |
| $75,000 to $99,999 | 0 (0.0%) | 13 (3.0%) |
| $100,000+ | 33 (6.2%) | 32 (7.4%) |
| Total | 535 (100.0%) | 430 (100.0%) |
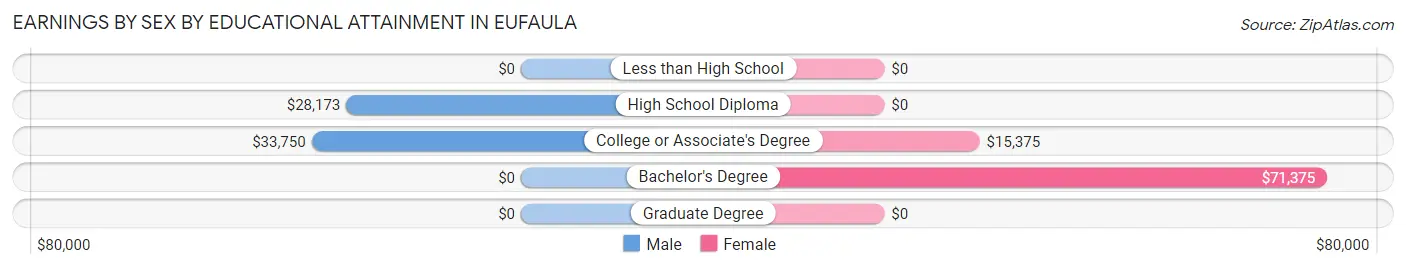
Earnings by Sex by Educational Attainment in Eufaula
Average earnings in Eufaula are $33,850 for men and $23,527 for women, a difference of 30.5%. Men with an educational attainment of college or associate's degree enjoy the highest average annual earnings of $33,750, while those with high school diploma education earn the least with $28,173. Women with an educational attainment of bachelor's degree earn the most with the average annual earnings of $71,375, while those with college or associate's degree education have the smallest earnings of $15,375.
| Educational Attainment | Male Income | Female Income |
| Less than High School | - | - |
| High School Diploma | $28,173 | $0 |
| College or Associate's Degree | $33,750 | $15,375 |
| Bachelor's Degree | - | - |
| Graduate Degree | - | - |
| Total | $33,850 | $23,527 |
Family Income in Eufaula
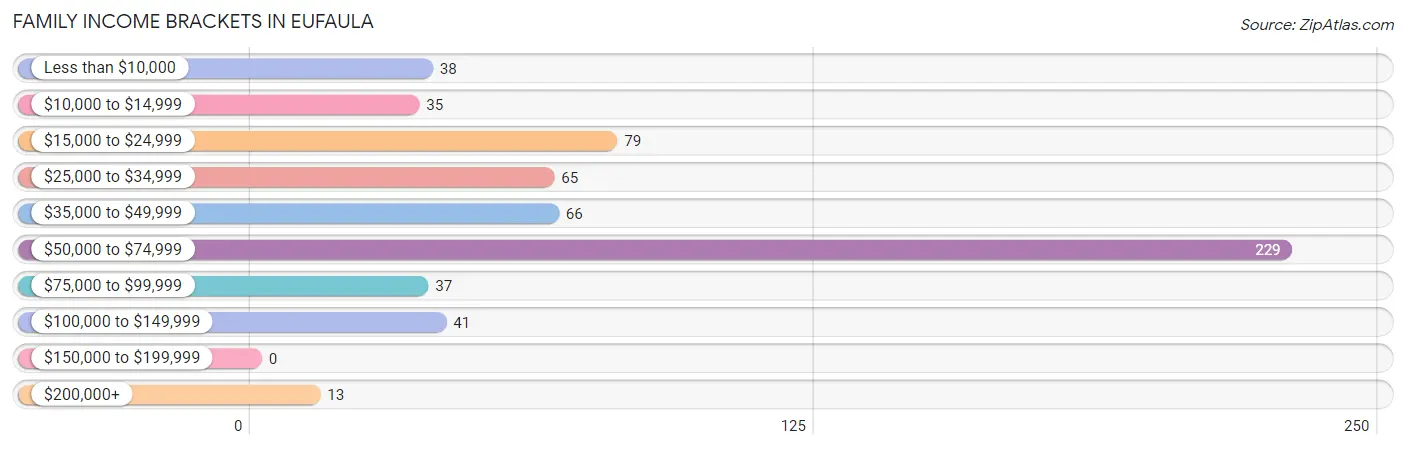
Family Income Brackets in Eufaula
According to the Eufaula family income data, there are 229 families falling into the $50,000 to $74,999 income range, which is the most common income bracket and makes up 38.0% of all families.
| Income Bracket | # Families | % Families |
| Less than $10,000 | 38 | 6.3% |
| $10,000 to $14,999 | 35 | 5.8% |
| $15,000 to $24,999 | 79 | 13.1% |
| $25,000 to $34,999 | 65 | 10.8% |
| $35,000 to $49,999 | 66 | 10.9% |
| $50,000 to $74,999 | 229 | 38.0% |
| $75,000 to $99,999 | 37 | 6.1% |
| $100,000 to $149,999 | 41 | 6.8% |
| $150,000 to $199,999 | 0 | 0.0% |
| $200,000+ | 13 | 2.2% |
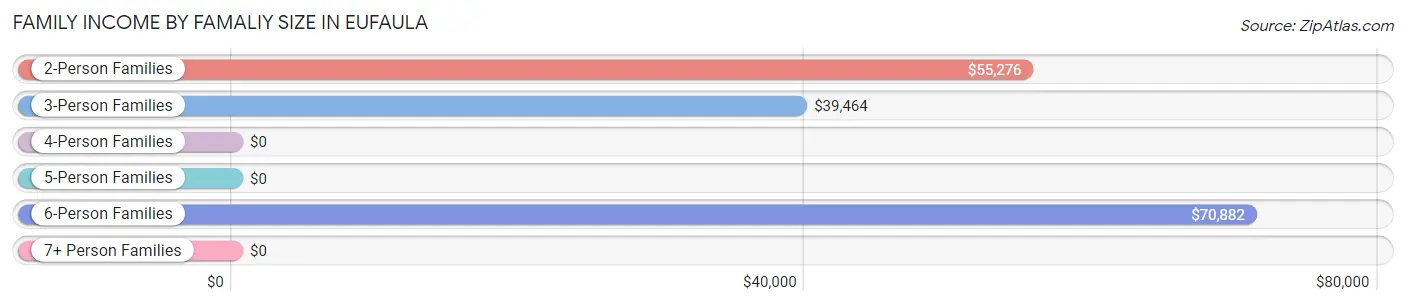
Family Income by Famaliy Size in Eufaula
6-person families (40 | 6.6%) account for the highest median family income in Eufaula with $70,882 per family, while 2-person families (384 | 63.7%) have the highest median income of $27,638 per family member.
| Income Bracket | # Families | Median Income |
| 2-Person Families | 384 (63.7%) | $55,276 |
| 3-Person Families | 88 (14.6%) | $39,464 |
| 4-Person Families | 75 (12.4%) | $0 |
| 5-Person Families | 16 (2.6%) | $0 |
| 6-Person Families | 40 (6.6%) | $70,882 |
| 7+ Person Families | 0 (0.0%) | $0 |
| Total | 603 (100.0%) | $54,712 |
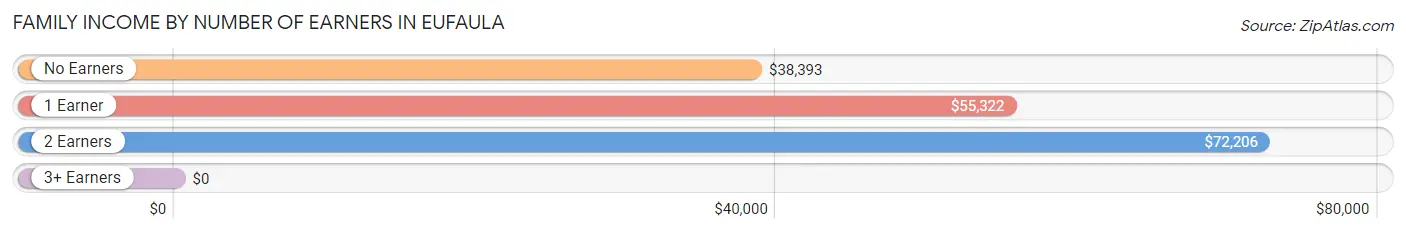
Family Income by Number of Earners in Eufaula
| Number of Earners | # Families | Median Income |
| No Earners | 182 (30.2%) | $38,393 |
| 1 Earner | 286 (47.4%) | $55,322 |
| 2 Earners | 114 (18.9%) | $72,206 |
| 3+ Earners | 21 (3.5%) | $0 |
| Total | 603 (100.0%) | $54,712 |
Household Income in Eufaula
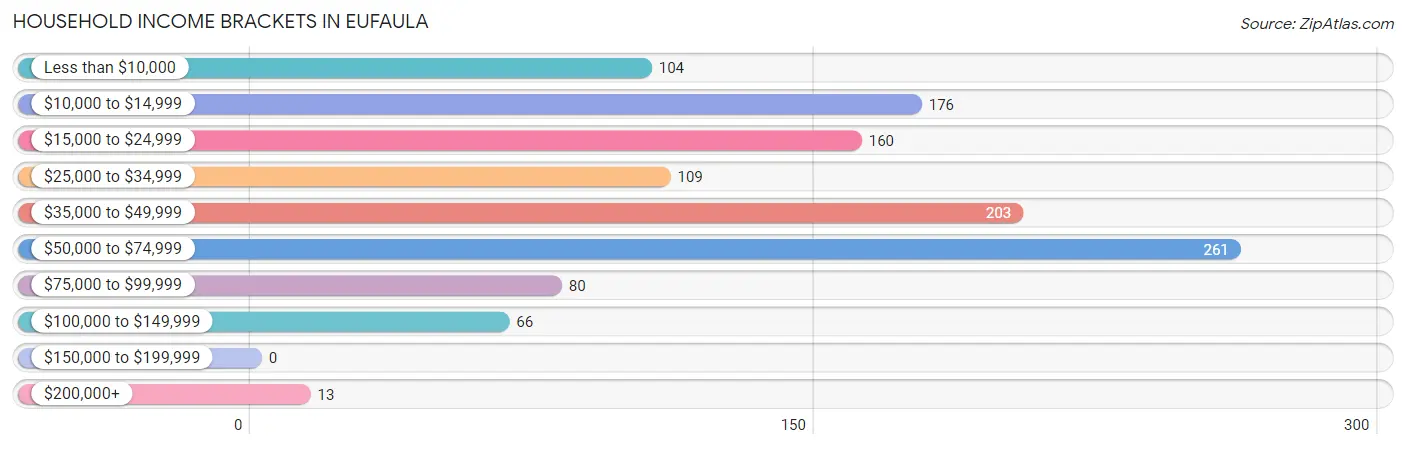
Household Income Brackets in Eufaula
With 261 households falling in the category, the $50,000 to $74,999 income range is the most frequent in Eufaula, accounting for 22.3% of all households.
| Income Bracket | # Households | % Households |
| Less than $10,000 | 104 | 8.9% |
| $10,000 to $14,999 | 176 | 15.0% |
| $15,000 to $24,999 | 160 | 13.7% |
| $25,000 to $34,999 | 109 | 9.3% |
| $35,000 to $49,999 | 203 | 17.3% |
| $50,000 to $74,999 | 261 | 22.3% |
| $75,000 to $99,999 | 80 | 6.8% |
| $100,000 to $149,999 | 66 | 5.6% |
| $150,000 to $199,999 | 0 | 0.0% |
| $200,000+ | 13 | 1.1% |
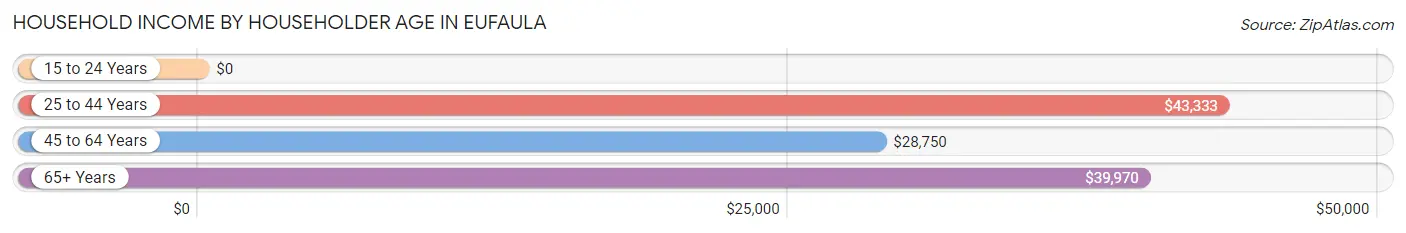
Household Income by Householder Age in Eufaula
The median household income in Eufaula is $38,774, with the highest median household income of $43,333 found in the 25 to 44 years age bracket for the primary householder. A total of 256 households (21.9%) fall into this category. Meanwhile, the 15 to 24 years age bracket for the primary householder has the lowest median household income of $0, with 34 households (2.9%) in this group.
| Income Bracket | # Households | Median Income |
| 15 to 24 Years | 34 (2.9%) | $0 |
| 25 to 44 Years | 256 (21.9%) | $43,333 |
| 45 to 64 Years | 296 (25.3%) | $28,750 |
| 65+ Years | 585 (50.0%) | $39,970 |
| Total | 1,171 (100.0%) | $38,774 |
Poverty in Eufaula
Income Below Poverty by Sex and Age in Eufaula
With 21.8% poverty level for males and 36.0% for females among the residents of Eufaula, under 5 year old males and 18 to 24 year old females are the most vulnerable to poverty, with 14 males (100.0%) and 36 females (66.7%) in their respective age groups living below the poverty level.
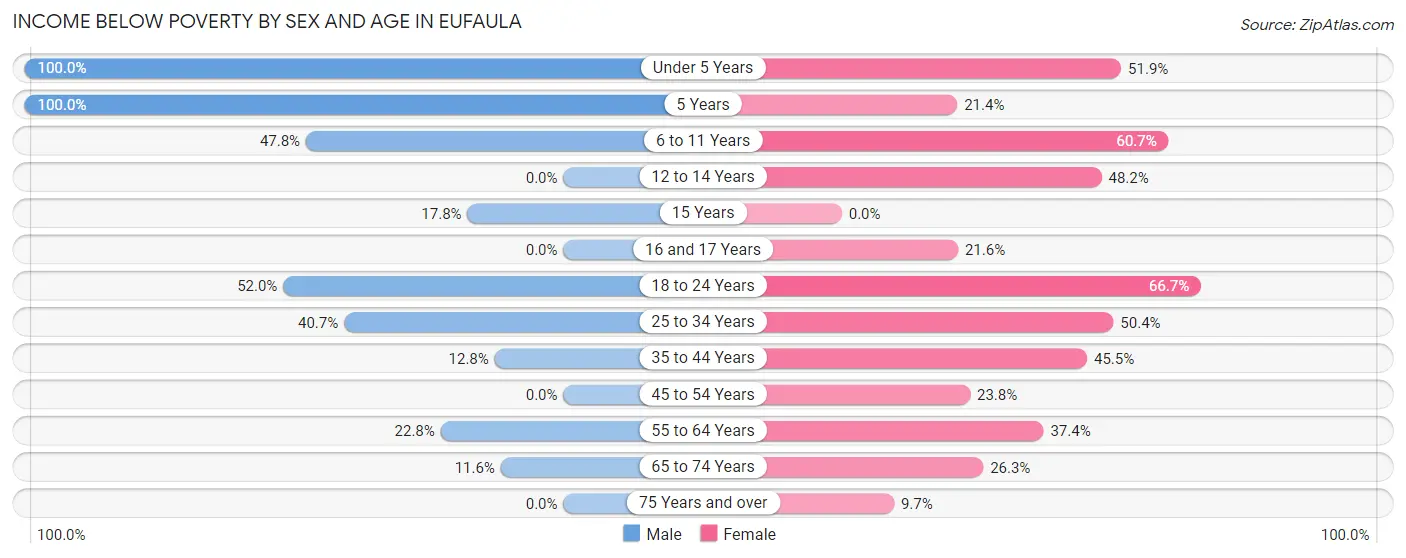
| Age Bracket | Male | Female |
| Under 5 Years | 14 (100.0%) | 14 (51.8%) |
| 5 Years | 9 (100.0%) | 12 (21.4%) |
| 6 to 11 Years | 43 (47.8%) | 94 (60.7%) |
| 12 to 14 Years | 0 (0.0%) | 27 (48.2%) |
| 15 Years | 13 (17.8%) | 0 (0.0%) |
| 16 and 17 Years | 0 (0.0%) | 11 (21.6%) |
| 18 to 24 Years | 39 (52.0%) | 36 (66.7%) |
| 25 to 34 Years | 46 (40.7%) | 61 (50.4%) |
| 35 to 44 Years | 25 (12.8%) | 56 (45.5%) |
| 45 to 54 Years | 0 (0.0%) | 25 (23.8%) |
| 55 to 64 Years | 36 (22.8%) | 73 (37.4%) |
| 65 to 74 Years | 10 (11.6%) | 100 (26.3%) |
| 75 Years and over | 0 (0.0%) | 12 (9.7%) |
| Total | 235 (21.8%) | 521 (36.0%) |
Income Above Poverty by Sex and Age in Eufaula
According to the poverty statistics in Eufaula, males aged 12 to 14 years and females aged 75 years and over are the age groups that are most secure financially, with 100.0% of males and 90.3% of females in these age groups living above the poverty line.

| Age Bracket | Male | Female |
| Under 5 Years | 0 (0.0%) | 13 (48.1%) |
| 5 Years | 0 (0.0%) | 44 (78.6%) |
| 6 to 11 Years | 47 (52.2%) | 61 (39.4%) |
| 12 to 14 Years | 41 (100.0%) | 29 (51.8%) |
| 15 Years | 60 (82.2%) | 0 (0.0%) |
| 16 and 17 Years | 0 (0.0%) | 40 (78.4%) |
| 18 to 24 Years | 36 (48.0%) | 18 (33.3%) |
| 25 to 34 Years | 67 (59.3%) | 60 (49.6%) |
| 35 to 44 Years | 171 (87.2%) | 67 (54.5%) |
| 45 to 54 Years | 104 (100.0%) | 80 (76.2%) |
| 55 to 64 Years | 122 (77.2%) | 122 (62.6%) |
| 65 to 74 Years | 76 (88.4%) | 281 (73.8%) |
| 75 Years and over | 118 (100.0%) | 112 (90.3%) |
| Total | 842 (78.2%) | 927 (64.0%) |
Income Below Poverty Among Married-Couple Families in Eufaula
The poverty statistics for married-couple families in Eufaula show that 7.3% or 21 of the total 289 families live below the poverty line. Families with 3 or 4 children have the highest poverty rate of 47.1%, comprising of 8 families. On the other hand, families with 1 or 2 children have the lowest poverty rate of 0.0%, which includes 0 families.
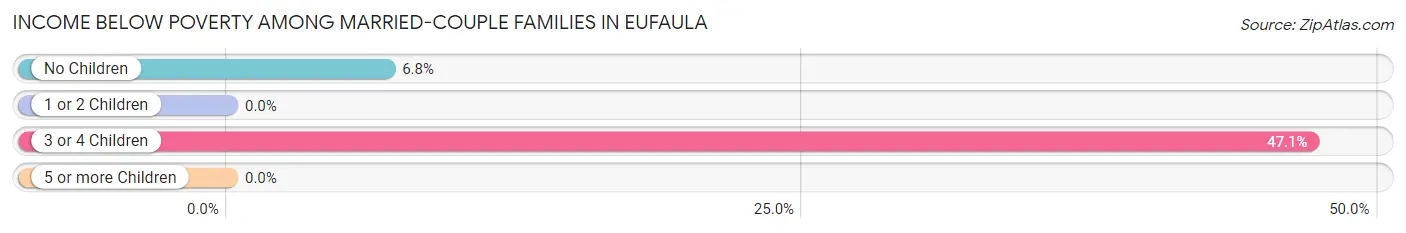
| Children | Above Poverty | Below Poverty |
| No Children | 177 (93.2%) | 13 (6.8%) |
| 1 or 2 Children | 82 (100.0%) | 0 (0.0%) |
| 3 or 4 Children | 9 (52.9%) | 8 (47.1%) |
| 5 or more Children | 0 (0.0%) | 0 (0.0%) |
| Total | 268 (92.7%) | 21 (7.3%) |
Income Below Poverty Among Single-Parent Households in Eufaula
According to the poverty data in Eufaula, 20.0% or 10 single-father households and 38.6% or 102 single-mother households are living below the poverty line. Among single-father households, those with 1 or 2 children have the highest poverty rate, with 10 households (100.0%) experiencing poverty. Likewise, among single-mother households, those with 3 or 4 children have the highest poverty rate, with 28 households (100.0%) falling below the poverty line.
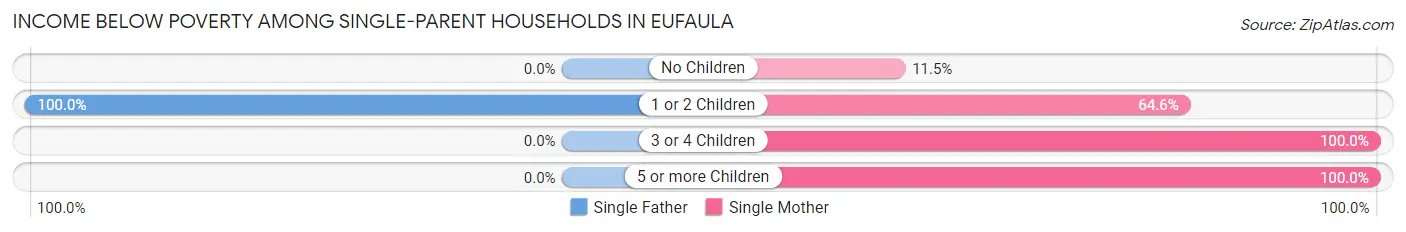
| Children | Single Father | Single Mother |
| No Children | 0 (0.0%) | 18 (11.5%) |
| 1 or 2 Children | 10 (100.0%) | 42 (64.6%) |
| 3 or 4 Children | 0 (0.0%) | 28 (100.0%) |
| 5 or more Children | 0 (0.0%) | 14 (100.0%) |
| Total | 10 (20.0%) | 102 (38.6%) |
Income Below Poverty Among Married-Couple vs Single-Parent Households in Eufaula
The poverty data for Eufaula shows that 21 of the married-couple family households (7.3%) and 112 of the single-parent households (35.7%) are living below the poverty level. Within the married-couple family households, those with 3 or 4 children have the highest poverty rate, with 8 households (47.1%) falling below the poverty line. Among the single-parent households, those with 3 or 4 children have the highest poverty rate, with 28 household (100.0%) living below poverty.
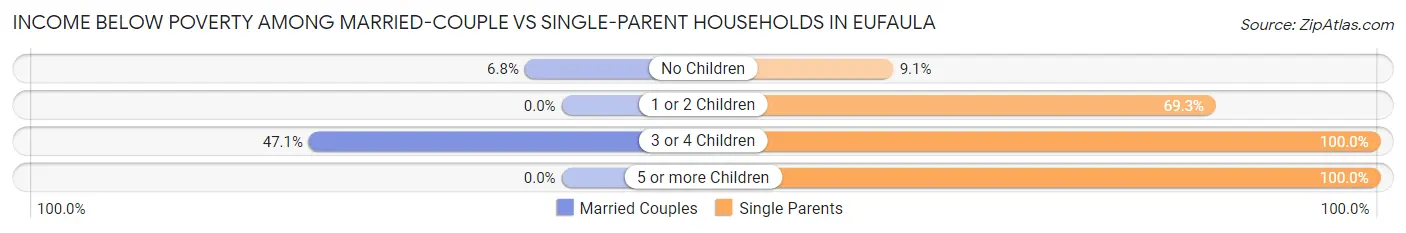
| Children | Married-Couple Families | Single-Parent Households |
| No Children | 13 (6.8%) | 18 (9.1%) |
| 1 or 2 Children | 0 (0.0%) | 52 (69.3%) |
| 3 or 4 Children | 8 (47.1%) | 28 (100.0%) |
| 5 or more Children | 0 (0.0%) | 14 (100.0%) |
| Total | 21 (7.3%) | 112 (35.7%) |
Race in Eufaula
The most populous races in Eufaula are White / Caucasian (1,963 | 70.7%), Native / Alaskan (359 | 12.9%), and Two or more Races (308 | 11.1%).
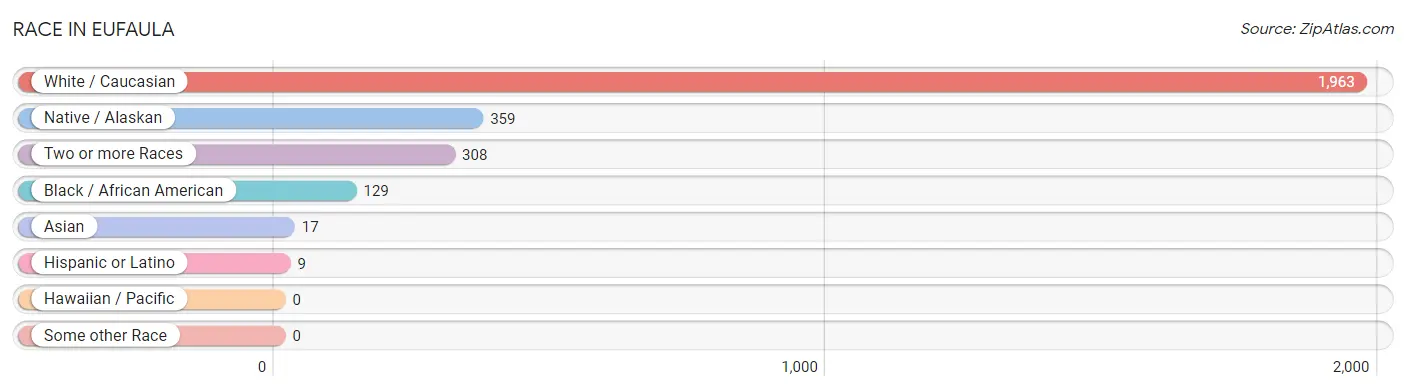
| Race | # Population | % Population |
| Asian | 17 | 0.6% |
| Black / African American | 129 | 4.6% |
| Hawaiian / Pacific | 0 | 0.0% |
| Hispanic or Latino | 9 | 0.3% |
| Native / Alaskan | 359 | 12.9% |
| White / Caucasian | 1,963 | 70.7% |
| Two or more Races | 308 | 11.1% |
| Some other Race | 0 | 0.0% |
| Total | 2,776 | 100.0% |
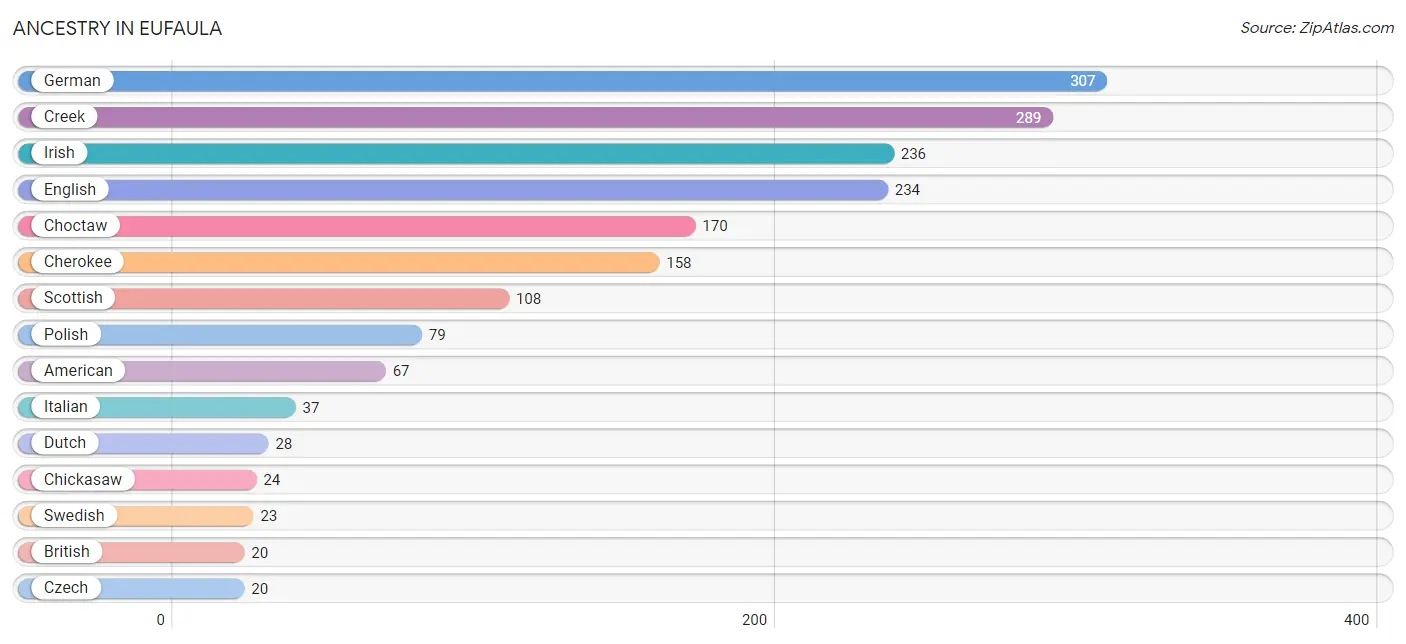
Ancestry in Eufaula
The most populous ancestries reported in Eufaula are German (307 | 11.1%), Creek (289 | 10.4%), Irish (236 | 8.5%), English (234 | 8.4%), and Choctaw (170 | 6.1%), together accounting for 44.5% of all Eufaula residents.
| Ancestry | # Population | % Population |
| American | 67 | 2.4% |
| British | 20 | 0.7% |
| Burmese | 17 | 0.6% |
| Cherokee | 158 | 5.7% |
| Chickasaw | 24 | 0.9% |
| Choctaw | 170 | 6.1% |
| Creek | 289 | 10.4% |
| Czech | 20 | 0.7% |
| Dutch | 28 | 1.0% |
| Dutch West Indian | 18 | 0.6% |
| English | 234 | 8.4% |
| German | 307 | 11.1% |
| Irish | 236 | 8.5% |
| Italian | 37 | 1.3% |
| Jamaican | 8 | 0.3% |
| Mexican | 9 | 0.3% |
| Northern European | 1 | 0.0% |
| Norwegian | 10 | 0.4% |
| Polish | 79 | 2.9% |
| Scotch-Irish | 10 | 0.4% |
| Scottish | 108 | 3.9% |
| Swedish | 23 | 0.8% |
| Welsh | 9 | 0.3% | View All 23 Rows |
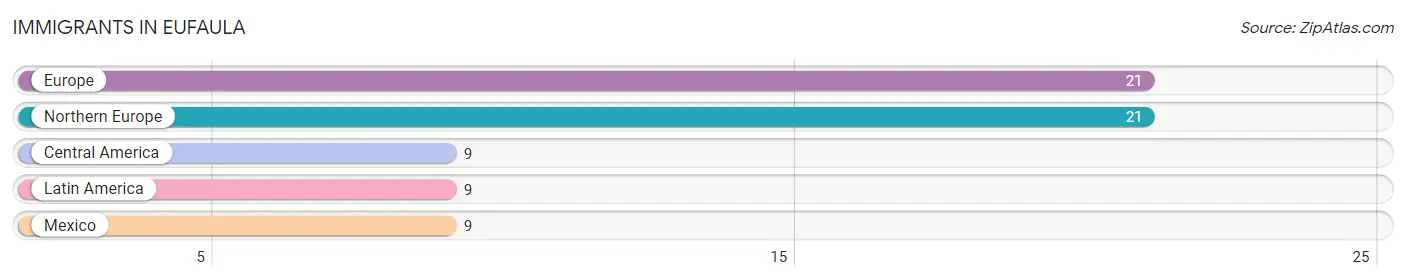
Immigrants in Eufaula
The most numerous immigrant groups reported in Eufaula came from Europe (21 | 0.8%), Northern Europe (21 | 0.8%), Central America (9 | 0.3%), Latin America (9 | 0.3%), and Mexico (9 | 0.3%), together accounting for 2.5% of all Eufaula residents.
| Immigration Origin | # Population | % Population |
| Central America | 9 | 0.3% |
| Europe | 21 | 0.8% |
| Latin America | 9 | 0.3% |
| Mexico | 9 | 0.3% |
| Northern Europe | 21 | 0.8% | View All 5 Rows |
Sex and Age in Eufaula
Sex and Age in Eufaula
The most populous age groups in Eufaula are 40 to 44 Years (132 | 11.0%) for men and 70 to 74 Years (240 | 15.2%) for women.
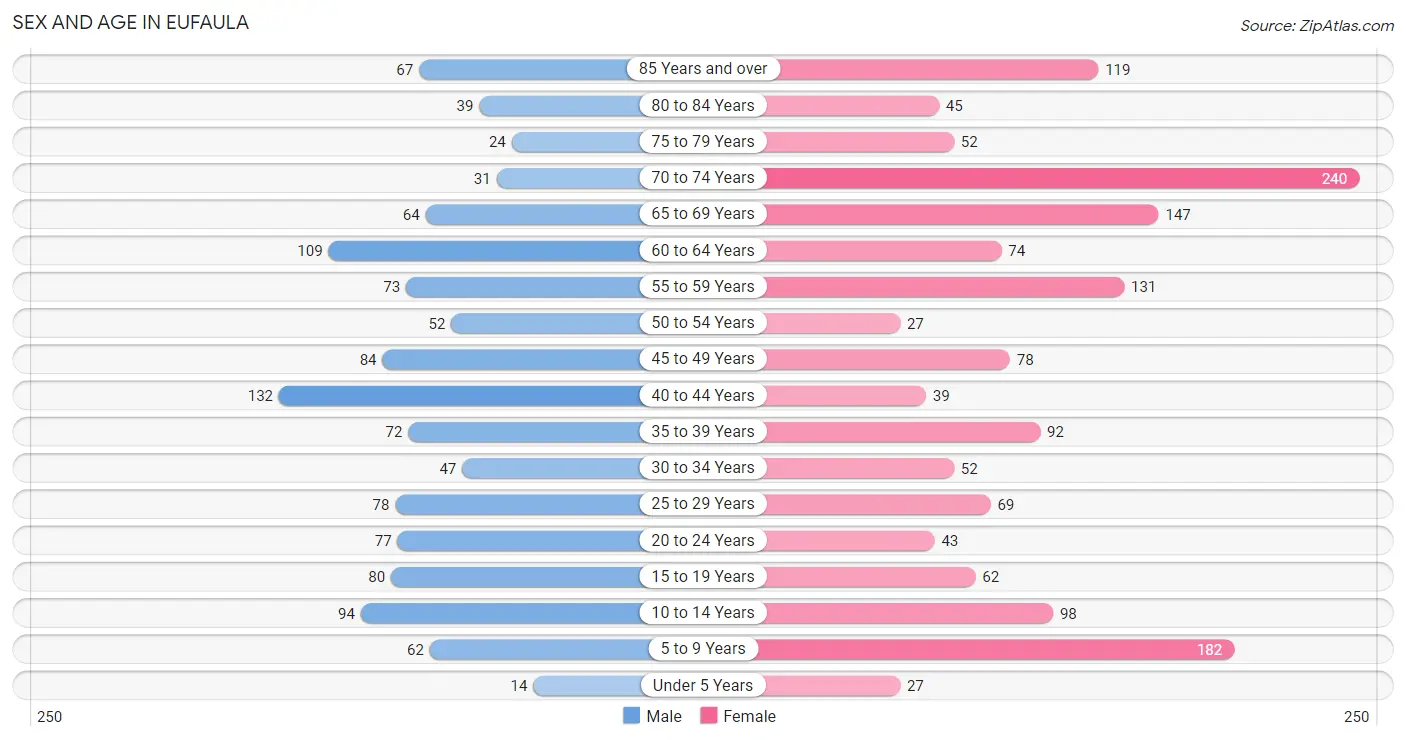
| Age Bracket | Male | Female |
| Under 5 Years | 14 (1.2%) | 27 (1.7%) |
| 5 to 9 Years | 62 (5.2%) | 182 (11.5%) |
| 10 to 14 Years | 94 (7.8%) | 98 (6.2%) |
| 15 to 19 Years | 80 (6.7%) | 62 (3.9%) |
| 20 to 24 Years | 77 (6.4%) | 43 (2.7%) |
| 25 to 29 Years | 78 (6.5%) | 69 (4.4%) |
| 30 to 34 Years | 47 (3.9%) | 52 (3.3%) |
| 35 to 39 Years | 72 (6.0%) | 92 (5.8%) |
| 40 to 44 Years | 132 (11.0%) | 39 (2.5%) |
| 45 to 49 Years | 84 (7.0%) | 78 (5.0%) |
| 50 to 54 Years | 52 (4.3%) | 27 (1.7%) |
| 55 to 59 Years | 73 (6.1%) | 131 (8.3%) |
| 60 to 64 Years | 109 (9.1%) | 74 (4.7%) |
| 65 to 69 Years | 64 (5.3%) | 147 (9.3%) |
| 70 to 74 Years | 31 (2.6%) | 240 (15.2%) |
| 75 to 79 Years | 24 (2.0%) | 52 (3.3%) |
| 80 to 84 Years | 39 (3.3%) | 45 (2.9%) |
| 85 Years and over | 67 (5.6%) | 119 (7.5%) |
| Total | 1,199 (100.0%) | 1,577 (100.0%) |
Families and Households in Eufaula
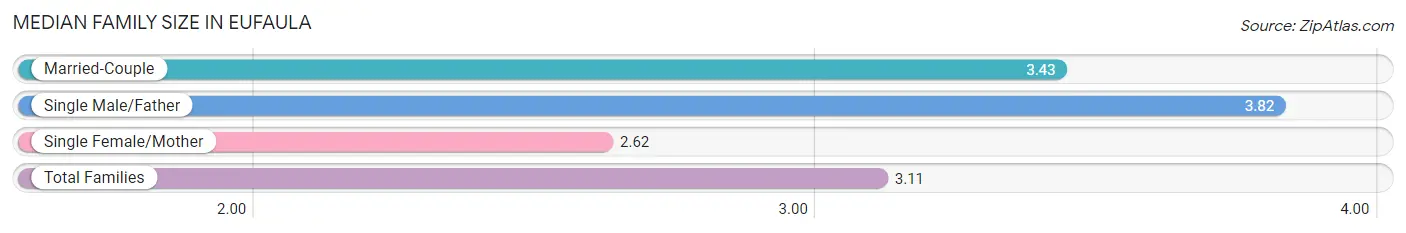
Median Family Size in Eufaula
The median family size in Eufaula is 3.11 persons per family, with single male/father families (50 | 8.3%) accounting for the largest median family size of 3.82 persons per family. On the other hand, single female/mother families (264 | 43.8%) represent the smallest median family size with 2.62 persons per family.
| Family Type | # Families | Family Size |
| Married-Couple | 289 (47.9%) | 3.43 |
| Single Male/Father | 50 (8.3%) | 3.82 |
| Single Female/Mother | 264 (43.8%) | 2.62 |
| Total Families | 603 (100.0%) | 3.11 |
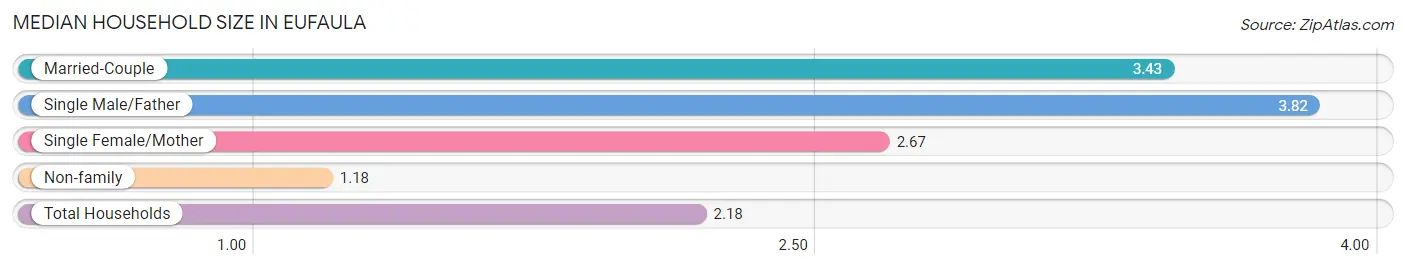
Median Household Size in Eufaula
The median household size in Eufaula is 2.18 persons per household, with single male/father households (50 | 4.3%) accounting for the largest median household size of 3.82 persons per household. non-family households (568 | 48.5%) represent the smallest median household size with 1.18 persons per household.
| Household Type | # Households | Household Size |
| Married-Couple | 289 (24.7%) | 3.43 |
| Single Male/Father | 50 (4.3%) | 3.82 |
| Single Female/Mother | 264 (22.5%) | 2.67 |
| Non-family | 568 (48.5%) | 1.18 |
| Total Households | 1,171 (100.0%) | 2.18 |
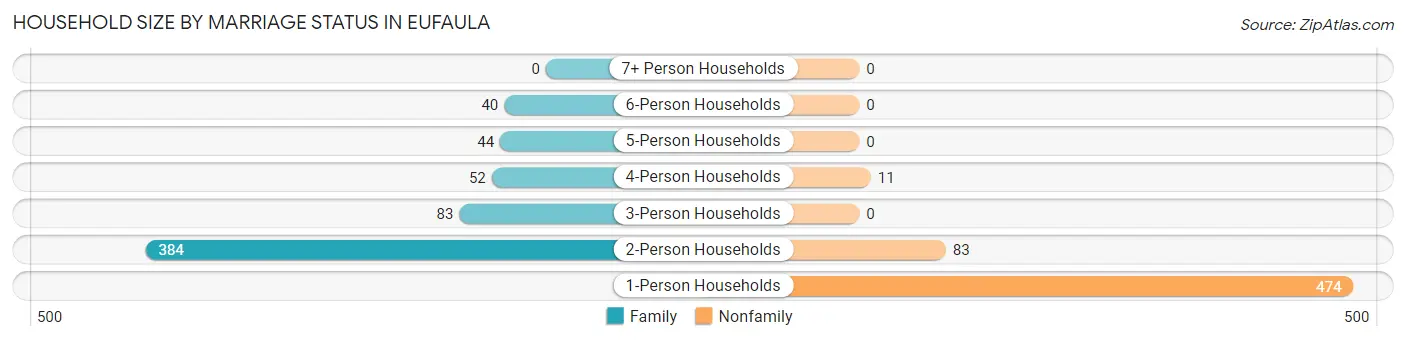
Household Size by Marriage Status in Eufaula
Out of a total of 1,171 households in Eufaula, 603 (51.5%) are family households, while 568 (48.5%) are nonfamily households. The most numerous type of family households are 2-person households, comprising 384, and the most common type of nonfamily households are 1-person households, comprising 474.
| Household Size | Family Households | Nonfamily Households |
| 1-Person Households | - | 474 (40.5%) |
| 2-Person Households | 384 (32.8%) | 83 (7.1%) |
| 3-Person Households | 83 (7.1%) | 0 (0.0%) |
| 4-Person Households | 52 (4.4%) | 11 (0.9%) |
| 5-Person Households | 44 (3.8%) | 0 (0.0%) |
| 6-Person Households | 40 (3.4%) | 0 (0.0%) |
| 7+ Person Households | 0 (0.0%) | 0 (0.0%) |
| Total | 603 (51.5%) | 568 (48.5%) |
Female Fertility in Eufaula
Fertility by Age in Eufaula
| Age Bracket | Women with Births | Births / 1,000 Women |
| 15 to 19 years | 0 (0.0%) | 0.0 |
| 20 to 34 years | 0 (0.0%) | 0.0 |
| 35 to 50 years | 0 (0.0%) | 0.0 |
| Total | 0 (0.0%) | 0.0 |
Fertility by Age by Marriage Status in Eufaula
| Age Bracket | Married | Unmarried |
| 15 to 19 years | 0 (0.0%) | 0 (0.0%) |
| 20 to 34 years | 0 (0.0%) | 0 (0.0%) |
| 35 to 50 years | 0 (0.0%) | 0 (0.0%) |
| Total | 0 (0.0%) | 0 (0.0%) |
Fertility by Education in Eufaula
| Educational Attainment | Women with Births | Births / 1,000 Women |
| Less than High School | 0 (0.0%) | 0.0 |
| High School Diploma | 0 (0.0%) | 0.0 |
| College or Associate's Degree | 0 (0.0%) | 0.0 |
| Bachelor's Degree | 0 (0.0%) | 0.0 |
| Graduate Degree | 0 (0.0%) | 0.0 |
| Total | 0 (0.0%) | 0.0 |
Fertility by Education by Marriage Status in Eufaula
| Educational Attainment | Married | Unmarried |
| Less than High School | 0 (0.0%) | 0 (0.0%) |
| High School Diploma | 0 (0.0%) | 0 (0.0%) |
| College or Associate's Degree | 0 (0.0%) | 0 (0.0%) |
| Bachelor's Degree | 0 (0.0%) | 0 (0.0%) |
| Graduate Degree | 0 (0.0%) | 0 (0.0%) |
| Total | 0 (0.0%) | 0 (0.0%) |
Employment Characteristics in Eufaula
Employment by Class of Employer in Eufaula
Among the 710 employed individuals in Eufaula, private company employees (510 | 71.8%), self-employed (not incorporated) (49 | 6.9%), and self-employed (incorporated) (47 | 6.6%) make up the most common classes of employment.
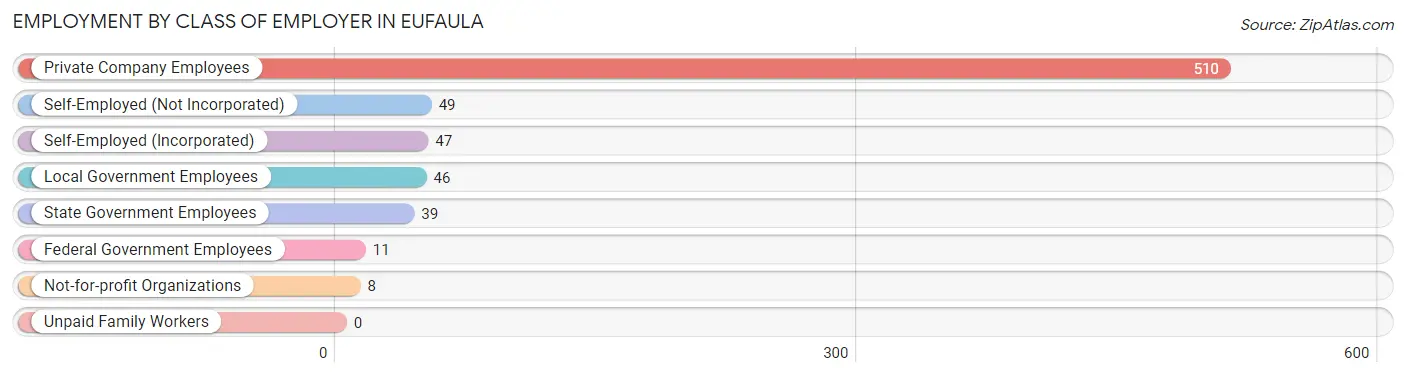
| Employer Class | # Employees | % Employees |
| Private Company Employees | 510 | 71.8% |
| Self-Employed (Incorporated) | 47 | 6.6% |
| Self-Employed (Not Incorporated) | 49 | 6.9% |
| Not-for-profit Organizations | 8 | 1.1% |
| Local Government Employees | 46 | 6.5% |
| State Government Employees | 39 | 5.5% |
| Federal Government Employees | 11 | 1.5% |
| Unpaid Family Workers | 0 | 0.0% |
| Total | 710 | 100.0% |
Employment Status by Age in Eufaula
According to the labor force statistics for Eufaula, out of the total population over 16 years of age (2,226), 33.5% or 746 individuals are in the labor force, with 2.5% or 19 of them unemployed. The age group with the highest labor force participation rate is 20 to 24 years, with 83.3% or 100 individuals in the labor force. Within the labor force, the 45 to 54 years age range has the highest percentage of unemployed individuals, with 9.5% or 19 of them being unemployed.
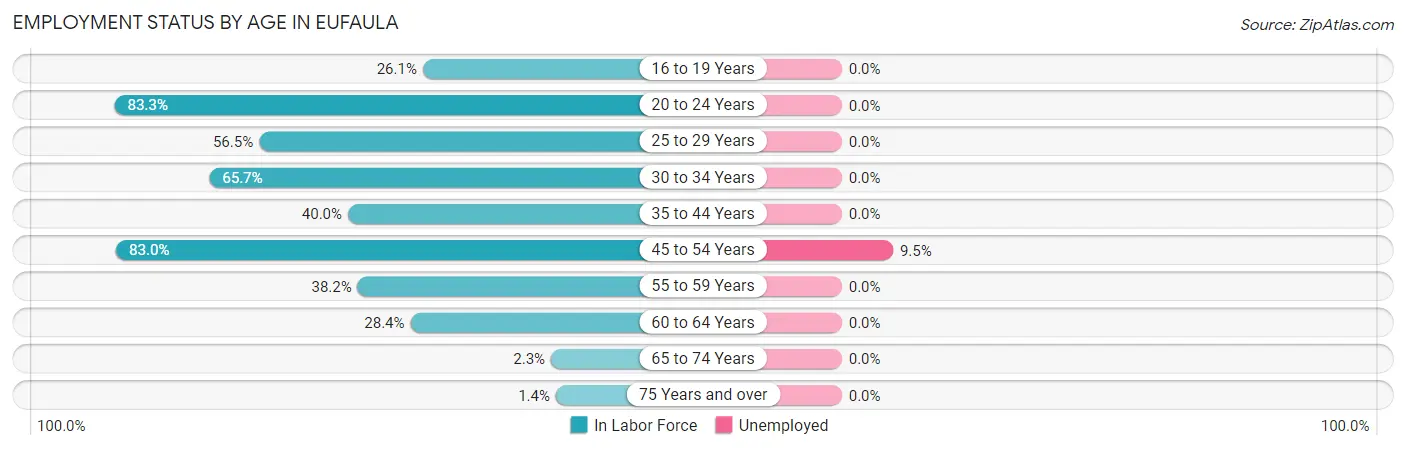
| Age Bracket | In Labor Force | Unemployed |
| 16 to 19 Years | 18 (26.1%) | 0 (0.0%) |
| 20 to 24 Years | 100 (83.3%) | 0 (0.0%) |
| 25 to 29 Years | 83 (56.5%) | 0 (0.0%) |
| 30 to 34 Years | 65 (65.7%) | 0 (0.0%) |
| 35 to 44 Years | 134 (40.0%) | 0 (0.0%) |
| 45 to 54 Years | 200 (83.0%) | 19 (9.5%) |
| 55 to 59 Years | 78 (38.2%) | 0 (0.0%) |
| 60 to 64 Years | 52 (28.4%) | 0 (0.0%) |
| 65 to 74 Years | 11 (2.3%) | 0 (0.0%) |
| 75 Years and over | 5 (1.4%) | 0 (0.0%) |
| Total | 746 (33.5%) | 19 (2.5%) |
Employment Status by Educational Attainment in Eufaula
According to labor force statistics for Eufaula, 50.6% of individuals (612) out of the total population between 25 and 64 years of age (1,209) are in the labor force, with 3.1% or 19 of them being unemployed. The group with the highest labor force participation rate are those with the educational attainment of bachelor's degree or higher, with 100.0% or 73 individuals in the labor force. Within the labor force, individuals with high school diploma education have the highest percentage of unemployment, with 4.6% or 9 of them being unemployed.
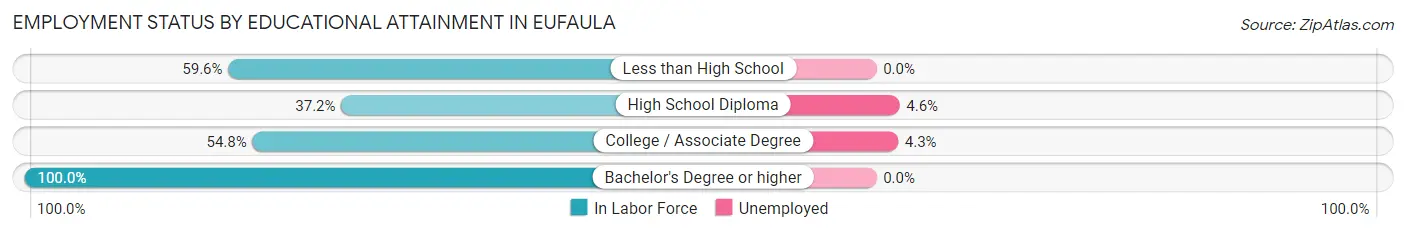
| Educational Attainment | In Labor Force | Unemployed |
| Less than High School | 109 (59.6%) | 0 (0.0%) |
| High School Diploma | 195 (37.2%) | 24 (4.6%) |
| College / Associate Degree | 235 (54.8%) | 18 (4.3%) |
| Bachelor's Degree or higher | 73 (100.0%) | 0 (0.0%) |
| Total | 612 (50.6%) | 37 (3.1%) |
Employment Occupations by Sex in Eufaula
Management, Business, Science and Arts Occupations
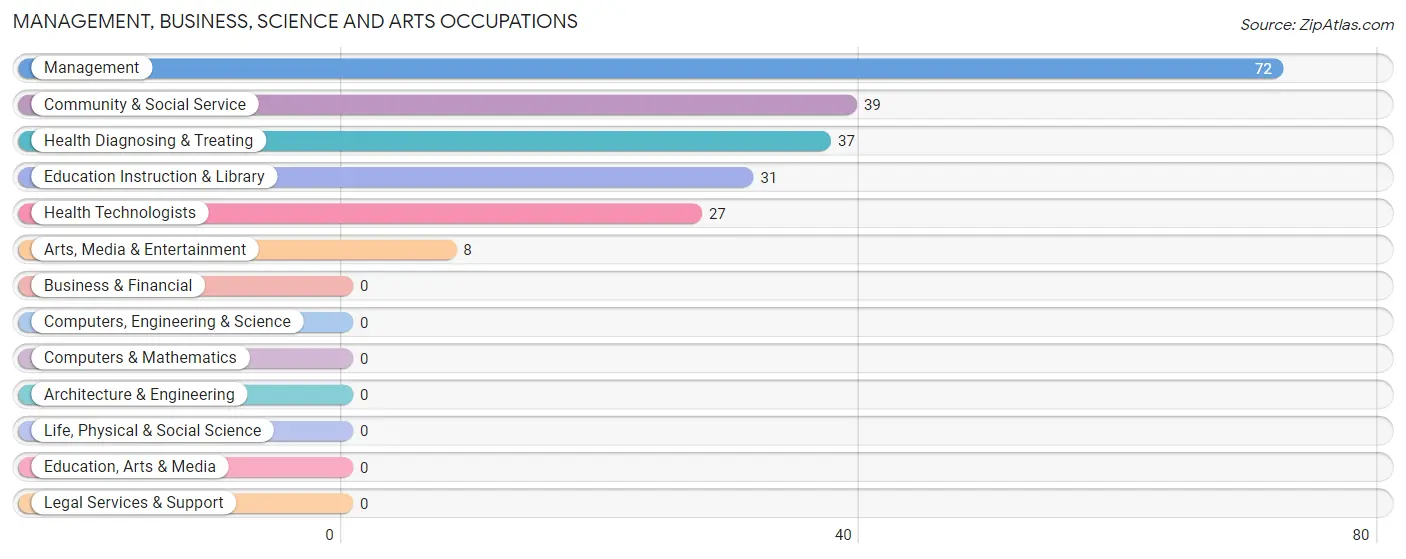
The most common Management, Business, Science and Arts occupations in Eufaula are Management (72 | 9.9%), Community & Social Service (39 | 5.4%), Health Diagnosing & Treating (37 | 5.1%), Education Instruction & Library (31 | 4.3%), and Health Technologists (27 | 3.7%).
Management, Business, Science and Arts Occupations by Sex
Within the Management, Business, Science and Arts occupations in Eufaula, the most male-oriented occupations are Health Technologists (51.8%), Health Diagnosing & Treating (37.8%), and Management (27.8%), while the most female-oriented occupations are Community & Social Service (100.0%), Education Instruction & Library (100.0%), and Arts, Media & Entertainment (100.0%).
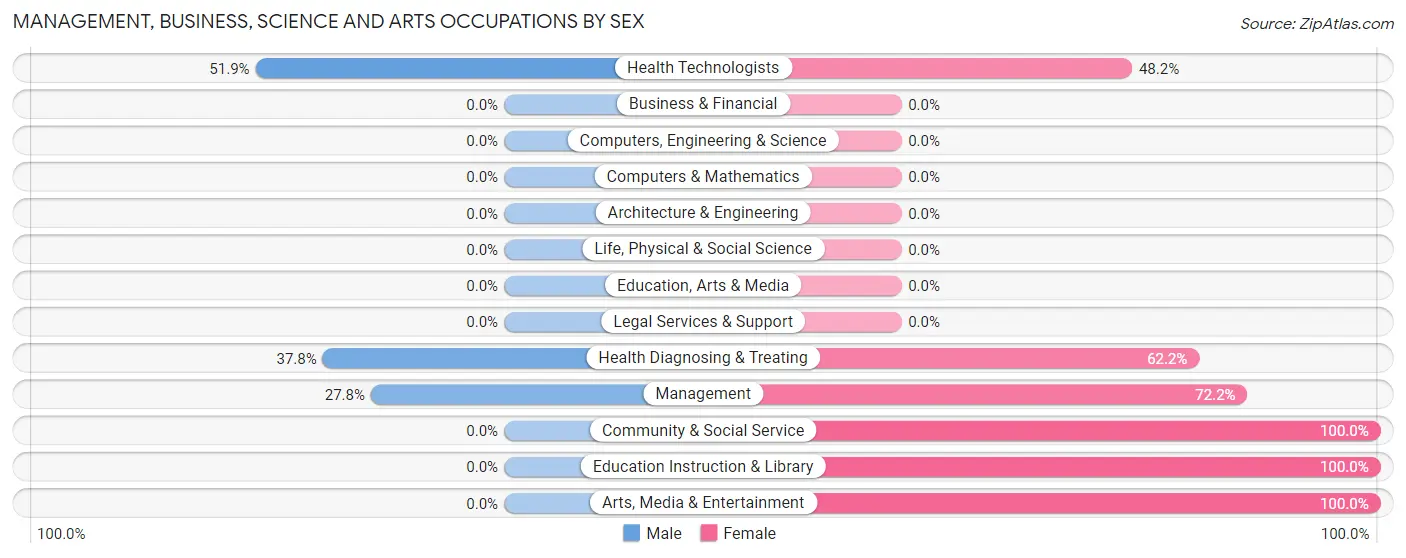
| Occupation | Male | Female |
| Management | 20 (27.8%) | 52 (72.2%) |
| Business & Financial | 0 (0.0%) | 0 (0.0%) |
| Computers, Engineering & Science | 0 (0.0%) | 0 (0.0%) |
| Computers & Mathematics | 0 (0.0%) | 0 (0.0%) |
| Architecture & Engineering | 0 (0.0%) | 0 (0.0%) |
| Life, Physical & Social Science | 0 (0.0%) | 0 (0.0%) |
| Community & Social Service | 0 (0.0%) | 39 (100.0%) |
| Education, Arts & Media | 0 (0.0%) | 0 (0.0%) |
| Legal Services & Support | 0 (0.0%) | 0 (0.0%) |
| Education Instruction & Library | 0 (0.0%) | 31 (100.0%) |
| Arts, Media & Entertainment | 0 (0.0%) | 8 (100.0%) |
| Health Diagnosing & Treating | 14 (37.8%) | 23 (62.2%) |
| Health Technologists | 14 (51.8%) | 13 (48.1%) |
| Total (Category) | 34 (23.0%) | 114 (77.0%) |
| Total (Overall) | 364 (50.1%) | 363 (49.9%) |
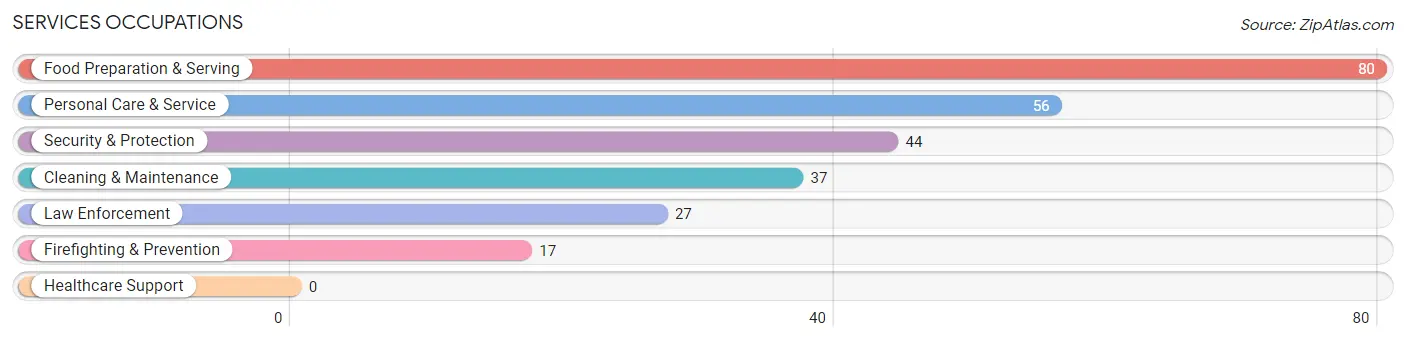
Services Occupations
The most common Services occupations in Eufaula are Food Preparation & Serving (80 | 11.0%), Personal Care & Service (56 | 7.7%), Security & Protection (44 | 6.0%), Cleaning & Maintenance (37 | 5.1%), and Law Enforcement (27 | 3.7%).
Services Occupations by Sex
Within the Services occupations in Eufaula, the most male-oriented occupations are Security & Protection (100.0%), Firefighting & Prevention (100.0%), and Law Enforcement (100.0%), while the most female-oriented occupations are Food Preparation & Serving (100.0%), and Personal Care & Service (51.8%).
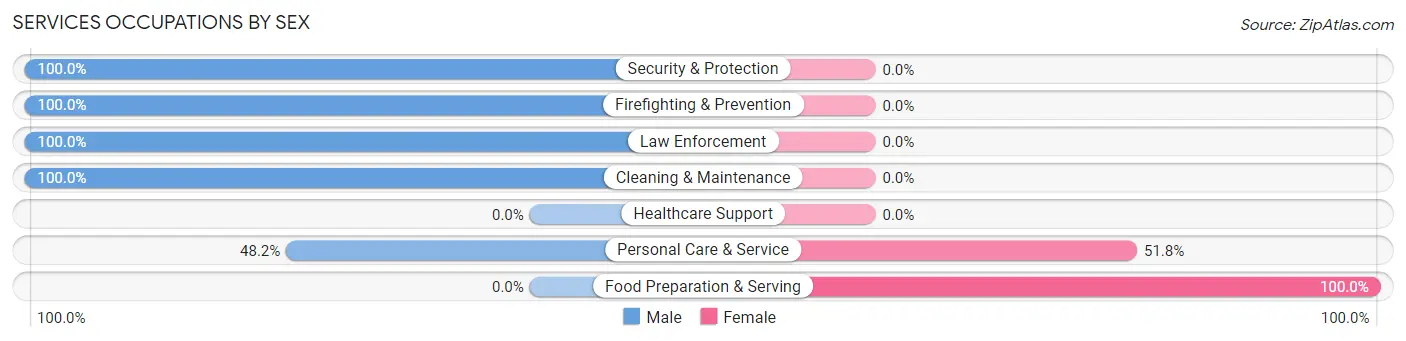
| Occupation | Male | Female |
| Healthcare Support | 0 (0.0%) | 0 (0.0%) |
| Security & Protection | 44 (100.0%) | 0 (0.0%) |
| Firefighting & Prevention | 17 (100.0%) | 0 (0.0%) |
| Law Enforcement | 27 (100.0%) | 0 (0.0%) |
| Food Preparation & Serving | 0 (0.0%) | 80 (100.0%) |
| Cleaning & Maintenance | 37 (100.0%) | 0 (0.0%) |
| Personal Care & Service | 27 (48.2%) | 29 (51.8%) |
| Total (Category) | 108 (49.8%) | 109 (50.2%) |
| Total (Overall) | 364 (50.1%) | 363 (49.9%) |
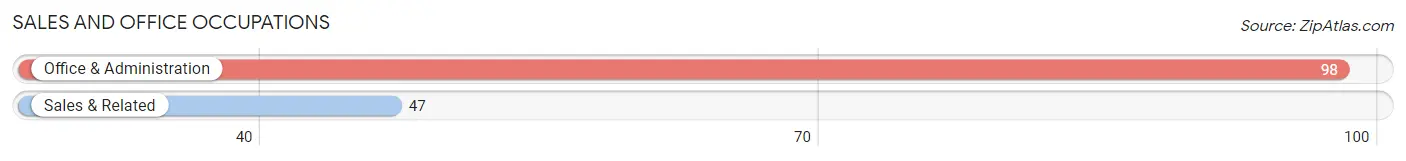
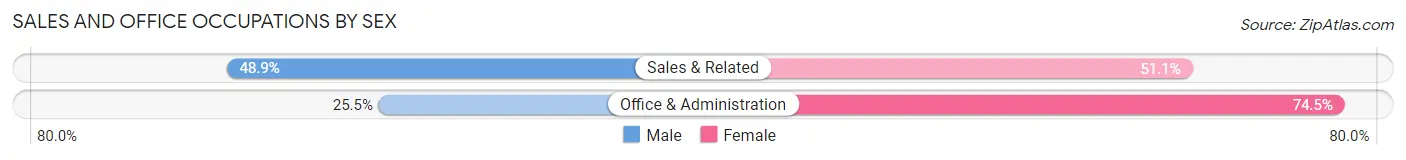
Sales and Office Occupations
The most common Sales and Office occupations in Eufaula are Office & Administration (98 | 13.5%), and Sales & Related (47 | 6.5%).
Sales and Office Occupations by Sex
| Occupation | Male | Female |
| Sales & Related | 23 (48.9%) | 24 (51.1%) |
| Office & Administration | 25 (25.5%) | 73 (74.5%) |
| Total (Category) | 48 (33.1%) | 97 (66.9%) |
| Total (Overall) | 364 (50.1%) | 363 (49.9%) |
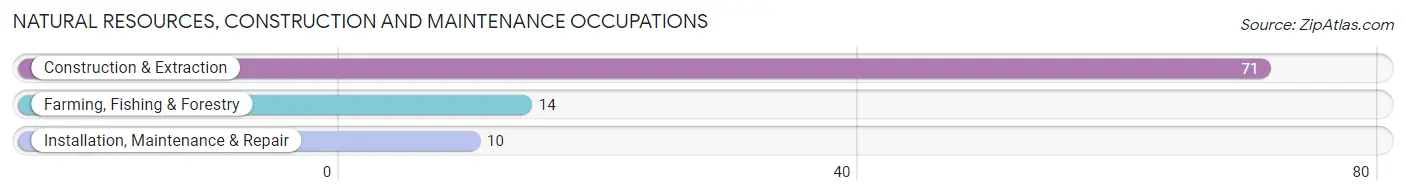
Natural Resources, Construction and Maintenance Occupations
The most common Natural Resources, Construction and Maintenance occupations in Eufaula are Construction & Extraction (71 | 9.8%), Farming, Fishing & Forestry (14 | 1.9%), and Installation, Maintenance & Repair (10 | 1.4%).
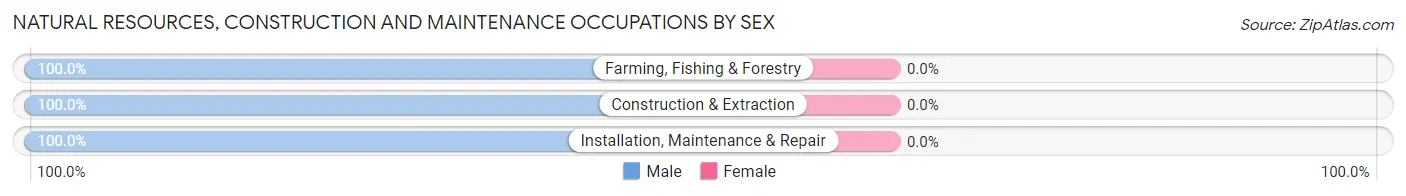
Natural Resources, Construction and Maintenance Occupations by Sex
| Occupation | Male | Female |
| Farming, Fishing & Forestry | 14 (100.0%) | 0 (0.0%) |
| Construction & Extraction | 71 (100.0%) | 0 (0.0%) |
| Installation, Maintenance & Repair | 10 (100.0%) | 0 (0.0%) |
| Total (Category) | 95 (100.0%) | 0 (0.0%) |
| Total (Overall) | 364 (50.1%) | 363 (49.9%) |
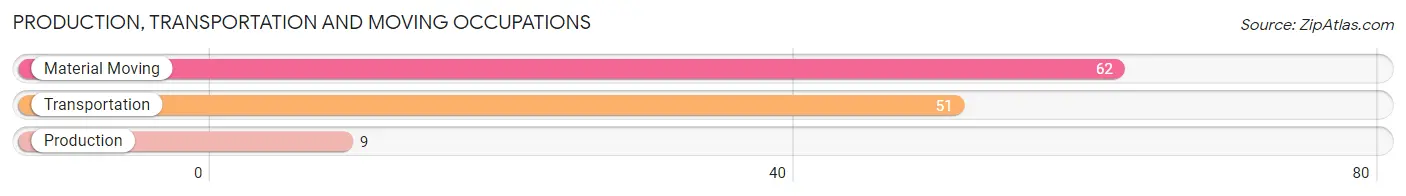
Production, Transportation and Moving Occupations
The most common Production, Transportation and Moving occupations in Eufaula are Material Moving (62 | 8.5%), Transportation (51 | 7.0%), and Production (9 | 1.2%).
Production, Transportation and Moving Occupations by Sex
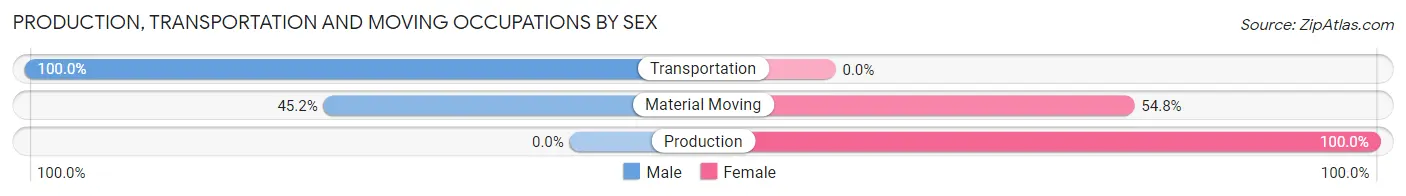
| Occupation | Male | Female |
| Production | 0 (0.0%) | 9 (100.0%) |
| Transportation | 51 (100.0%) | 0 (0.0%) |
| Material Moving | 28 (45.2%) | 34 (54.8%) |
| Total (Category) | 79 (64.7%) | 43 (35.2%) |
| Total (Overall) | 364 (50.1%) | 363 (49.9%) |
Employment Industries by Sex in Eufaula
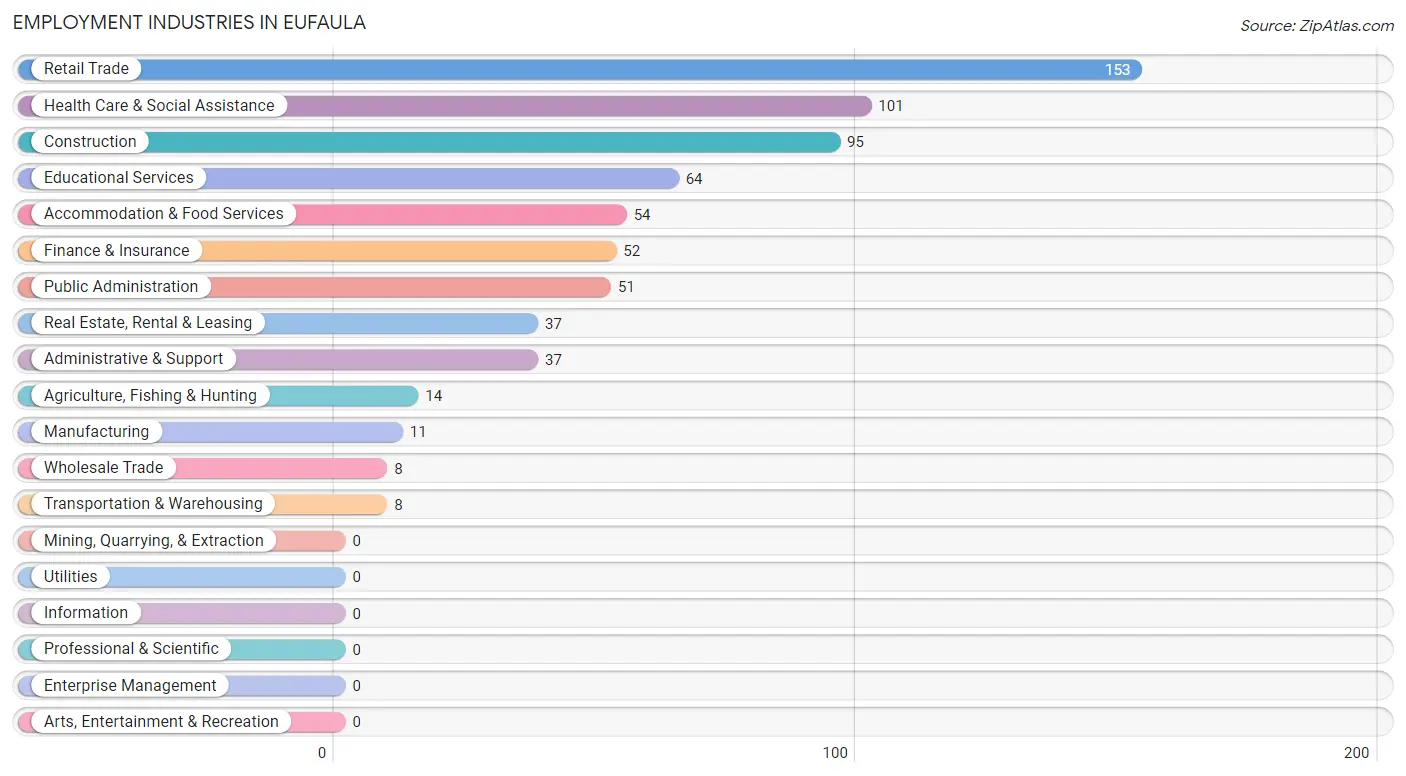
Employment Industries in Eufaula
The major employment industries in Eufaula include Retail Trade (153 | 21.0%), Health Care & Social Assistance (101 | 13.9%), Construction (95 | 13.1%), Educational Services (64 | 8.8%), and Accommodation & Food Services (54 | 7.4%).
Employment Industries by Sex in Eufaula
The Eufaula industries that see more men than women are Agriculture, Fishing & Hunting (100.0%), Manufacturing (100.0%), and Wholesale Trade (100.0%), whereas the industries that tend to have a higher number of women are Educational Services (100.0%), Health Care & Social Assistance (100.0%), and Accommodation & Food Services (100.0%).
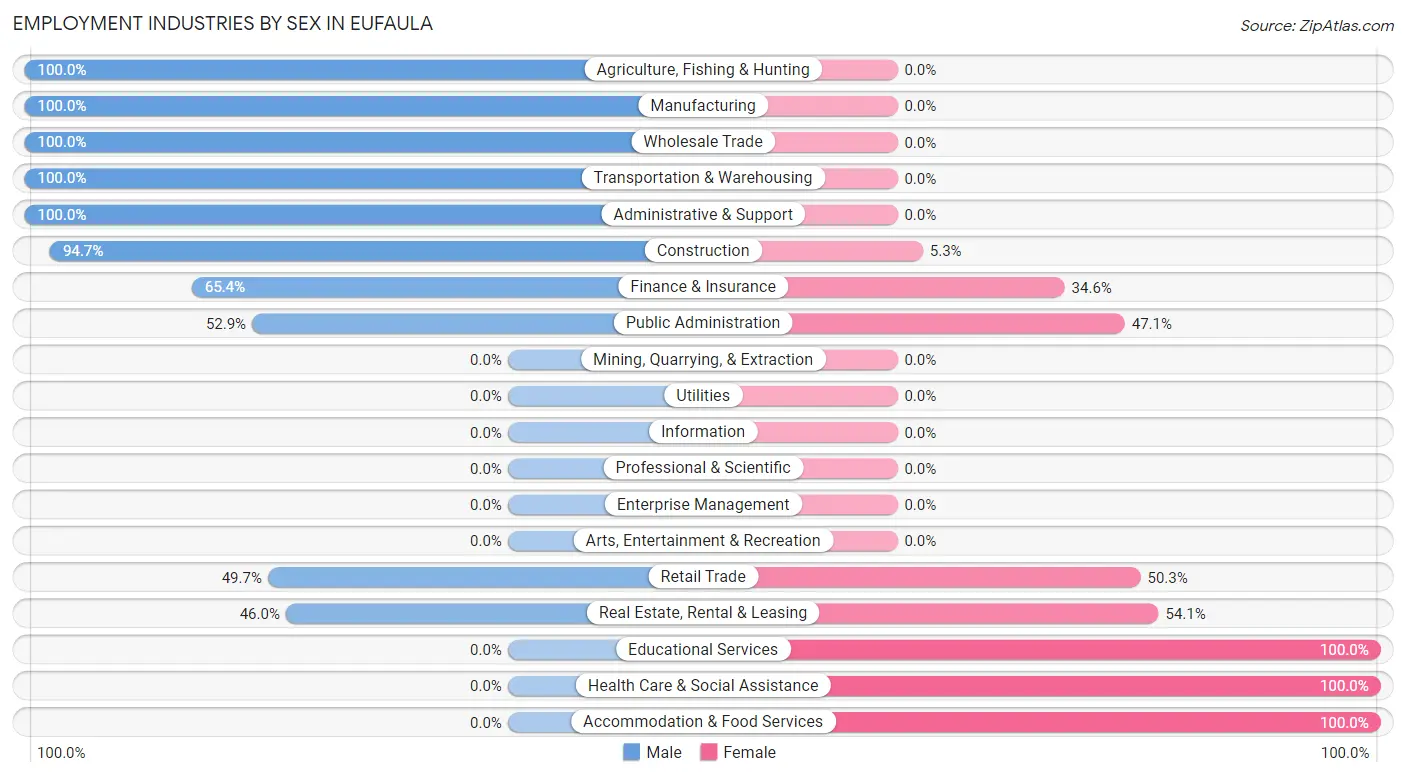
| Industry | Male | Female |
| Agriculture, Fishing & Hunting | 14 (100.0%) | 0 (0.0%) |
| Mining, Quarrying, & Extraction | 0 (0.0%) | 0 (0.0%) |
| Construction | 90 (94.7%) | 5 (5.3%) |
| Manufacturing | 11 (100.0%) | 0 (0.0%) |
| Wholesale Trade | 8 (100.0%) | 0 (0.0%) |
| Retail Trade | 76 (49.7%) | 77 (50.3%) |
| Transportation & Warehousing | 8 (100.0%) | 0 (0.0%) |
| Utilities | 0 (0.0%) | 0 (0.0%) |
| Information | 0 (0.0%) | 0 (0.0%) |
| Finance & Insurance | 34 (65.4%) | 18 (34.6%) |
| Real Estate, Rental & Leasing | 17 (46.0%) | 20 (54.0%) |
| Professional & Scientific | 0 (0.0%) | 0 (0.0%) |
| Enterprise Management | 0 (0.0%) | 0 (0.0%) |
| Administrative & Support | 37 (100.0%) | 0 (0.0%) |
| Educational Services | 0 (0.0%) | 64 (100.0%) |
| Health Care & Social Assistance | 0 (0.0%) | 101 (100.0%) |
| Arts, Entertainment & Recreation | 0 (0.0%) | 0 (0.0%) |
| Accommodation & Food Services | 0 (0.0%) | 54 (100.0%) |
| Public Administration | 27 (52.9%) | 24 (47.1%) |
| Total | 364 (50.1%) | 363 (49.9%) |
Education in Eufaula
School Enrollment in Eufaula
The most common levels of schooling among the 623 students in Eufaula are elementary school (215 | 34.5%), middle school (161 | 25.8%), and high school (135 | 21.7%).
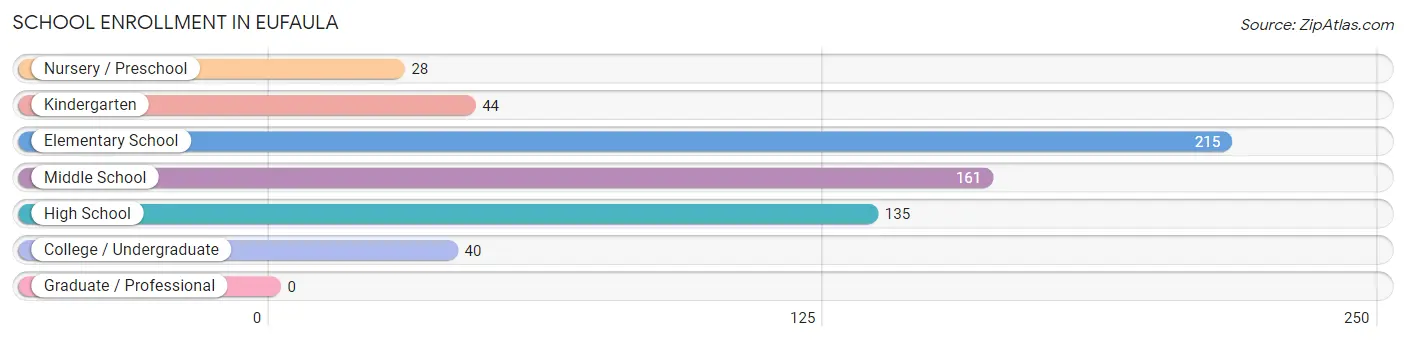
| School Level | # Students | % Students |
| Nursery / Preschool | 28 | 4.5% |
| Kindergarten | 44 | 7.1% |
| Elementary School | 215 | 34.5% |
| Middle School | 161 | 25.8% |
| High School | 135 | 21.7% |
| College / Undergraduate | 40 | 6.4% |
| Graduate / Professional | 0 | 0.0% |
| Total | 623 | 100.0% |
School Enrollment by Age by Funding Source in Eufaula
Out of a total of 623 students who are enrolled in schools in Eufaula, 34 (5.5%) attend a private institution, while the remaining 589 (94.5%) are enrolled in public schools. The age group of 18 to 19 year olds has the highest likelihood of being enrolled in private schools, with 7 (63.6% in the age bracket) enrolled. Conversely, the age group of 3 to 4 year olds has the lowest likelihood of being enrolled in a private school, with 7 (100.0% in the age bracket) attending a public institution.
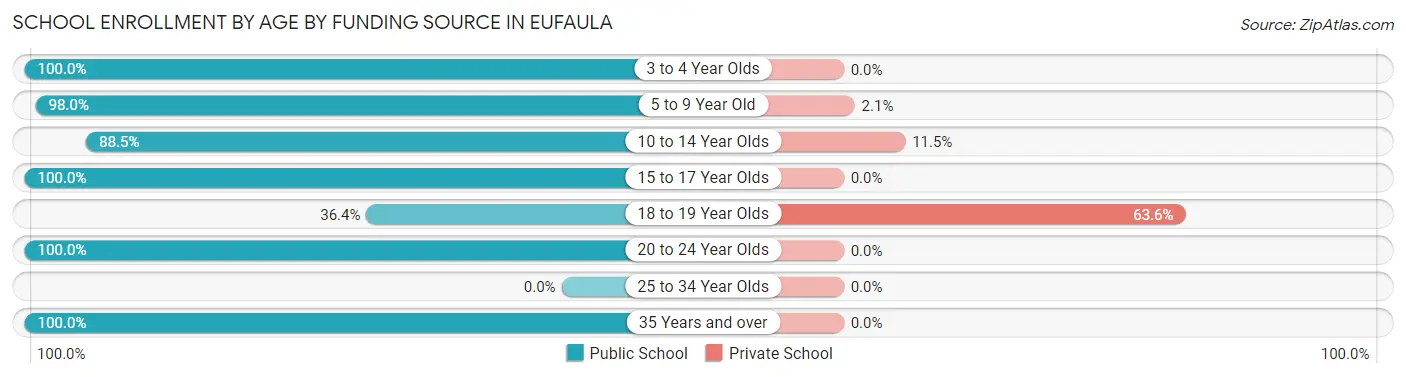
| Age Bracket | Public School | Private School |
| 3 to 4 Year Olds | 7 (100.0%) | 0 (0.0%) |
| 5 to 9 Year Old | 239 (98.0%) | 5 (2.1%) |
| 10 to 14 Year Olds | 170 (88.5%) | 22 (11.5%) |
| 15 to 17 Year Olds | 124 (100.0%) | 0 (0.0%) |
| 18 to 19 Year Olds | 4 (36.4%) | 7 (63.6%) |
| 20 to 24 Year Olds | 29 (100.0%) | 0 (0.0%) |
| 25 to 34 Year Olds | 0 (0.0%) | 0 (0.0%) |
| 35 Years and over | 16 (100.0%) | 0 (0.0%) |
| Total | 589 (94.5%) | 34 (5.5%) |
Educational Attainment by Field of Study in Eufaula
Education (61 | 26.9%), business (51 | 22.5%), physical & health sciences (31 | 13.7%), social sciences (26 | 11.5%), and science & technology (24 | 10.6%) are the most common fields of study among 227 individuals in Eufaula who have obtained a bachelor's degree or higher.
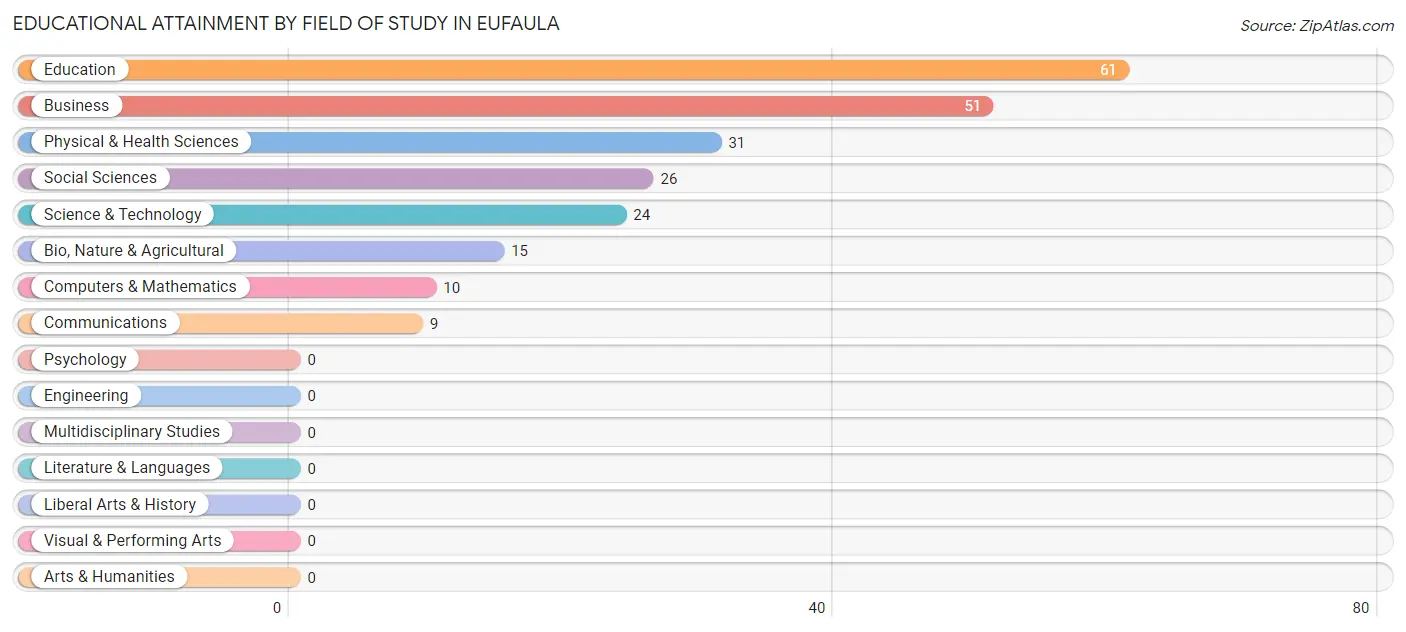
| Field of Study | # Graduates | % Graduates |
| Computers & Mathematics | 10 | 4.4% |
| Bio, Nature & Agricultural | 15 | 6.6% |
| Physical & Health Sciences | 31 | 13.7% |
| Psychology | 0 | 0.0% |
| Social Sciences | 26 | 11.5% |
| Engineering | 0 | 0.0% |
| Multidisciplinary Studies | 0 | 0.0% |
| Science & Technology | 24 | 10.6% |
| Business | 51 | 22.5% |
| Education | 61 | 26.9% |
| Literature & Languages | 0 | 0.0% |
| Liberal Arts & History | 0 | 0.0% |
| Visual & Performing Arts | 0 | 0.0% |
| Communications | 9 | 4.0% |
| Arts & Humanities | 0 | 0.0% |
| Total | 227 | 100.0% |
Transportation & Commute in Eufaula
Vehicle Availability by Sex in Eufaula
The most prevalent vehicle ownership categories in Eufaula are males with 3 vehicles (155, accounting for 44.7%) and females with 3 vehicles (82, making up 42.7%).
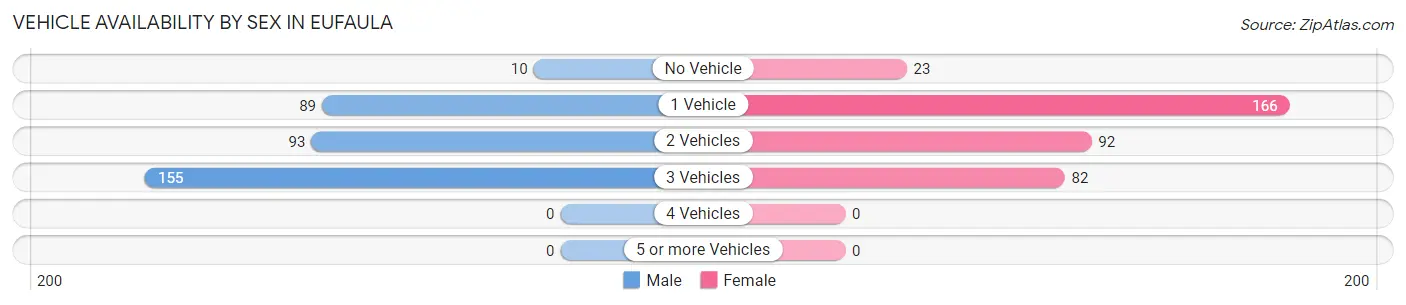
| Vehicles Available | Male | Female |
| No Vehicle | 10 (2.9%) | 23 (6.3%) |
| 1 Vehicle | 89 (25.7%) | 166 (45.7%) |
| 2 Vehicles | 93 (26.8%) | 92 (25.3%) |
| 3 Vehicles | 155 (44.7%) | 82 (22.6%) |
| 4 Vehicles | 0 (0.0%) | 0 (0.0%) |
| 5 or more Vehicles | 0 (0.0%) | 0 (0.0%) |
| Total | 347 (100.0%) | 363 (100.0%) |
Commute Time in Eufaula
The most frequently occuring commute durations in Eufaula are 5 to 9 minutes (141 commuters, 23.1%), 20 to 24 minutes (125 commuters, 20.5%), and 10 to 14 minutes (91 commuters, 14.9%).
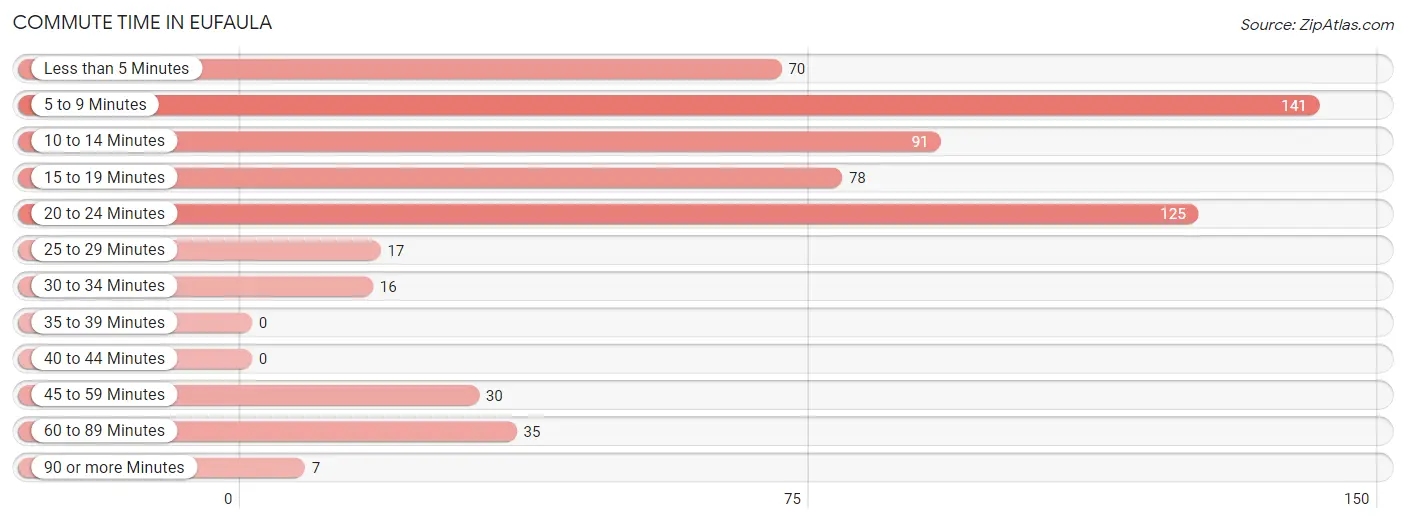
| Commute Time | # Commuters | % Commuters |
| Less than 5 Minutes | 70 | 11.5% |
| 5 to 9 Minutes | 141 | 23.1% |
| 10 to 14 Minutes | 91 | 14.9% |
| 15 to 19 Minutes | 78 | 12.8% |
| 20 to 24 Minutes | 125 | 20.5% |
| 25 to 29 Minutes | 17 | 2.8% |
| 30 to 34 Minutes | 16 | 2.6% |
| 35 to 39 Minutes | 0 | 0.0% |
| 40 to 44 Minutes | 0 | 0.0% |
| 45 to 59 Minutes | 30 | 4.9% |
| 60 to 89 Minutes | 35 | 5.7% |
| 90 or more Minutes | 7 | 1.1% |
Commute Time by Sex in Eufaula
The most common commute times in Eufaula are 5 to 9 minutes (77 commuters, 26.1%) for males and 20 to 24 minutes (102 commuters, 32.4%) for females.
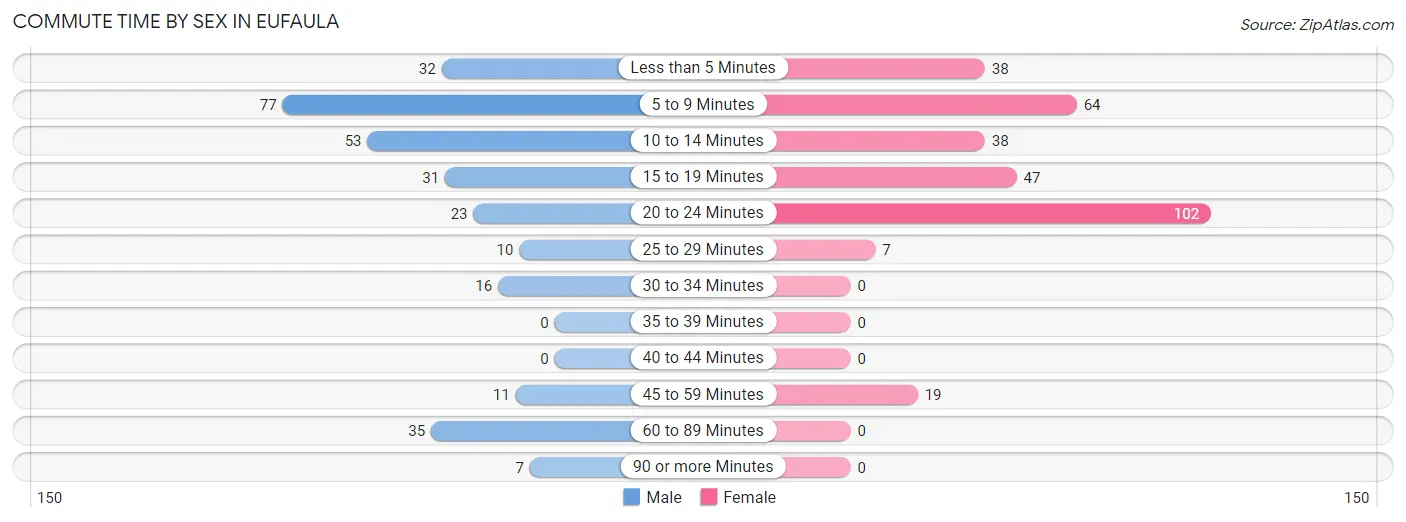
| Commute Time | Male | Female |
| Less than 5 Minutes | 32 (10.8%) | 38 (12.1%) |
| 5 to 9 Minutes | 77 (26.1%) | 64 (20.3%) |
| 10 to 14 Minutes | 53 (18.0%) | 38 (12.1%) |
| 15 to 19 Minutes | 31 (10.5%) | 47 (14.9%) |
| 20 to 24 Minutes | 23 (7.8%) | 102 (32.4%) |
| 25 to 29 Minutes | 10 (3.4%) | 7 (2.2%) |
| 30 to 34 Minutes | 16 (5.4%) | 0 (0.0%) |
| 35 to 39 Minutes | 0 (0.0%) | 0 (0.0%) |
| 40 to 44 Minutes | 0 (0.0%) | 0 (0.0%) |
| 45 to 59 Minutes | 11 (3.7%) | 19 (6.0%) |
| 60 to 89 Minutes | 35 (11.9%) | 0 (0.0%) |
| 90 or more Minutes | 7 (2.4%) | 0 (0.0%) |
Time of Departure to Work by Sex in Eufaula
The most frequent times of departure to work in Eufaula are 12:00 PM to 3:59 PM (66, 22.4%) for males and 7:30 AM to 7:59 AM (81, 25.7%) for females.
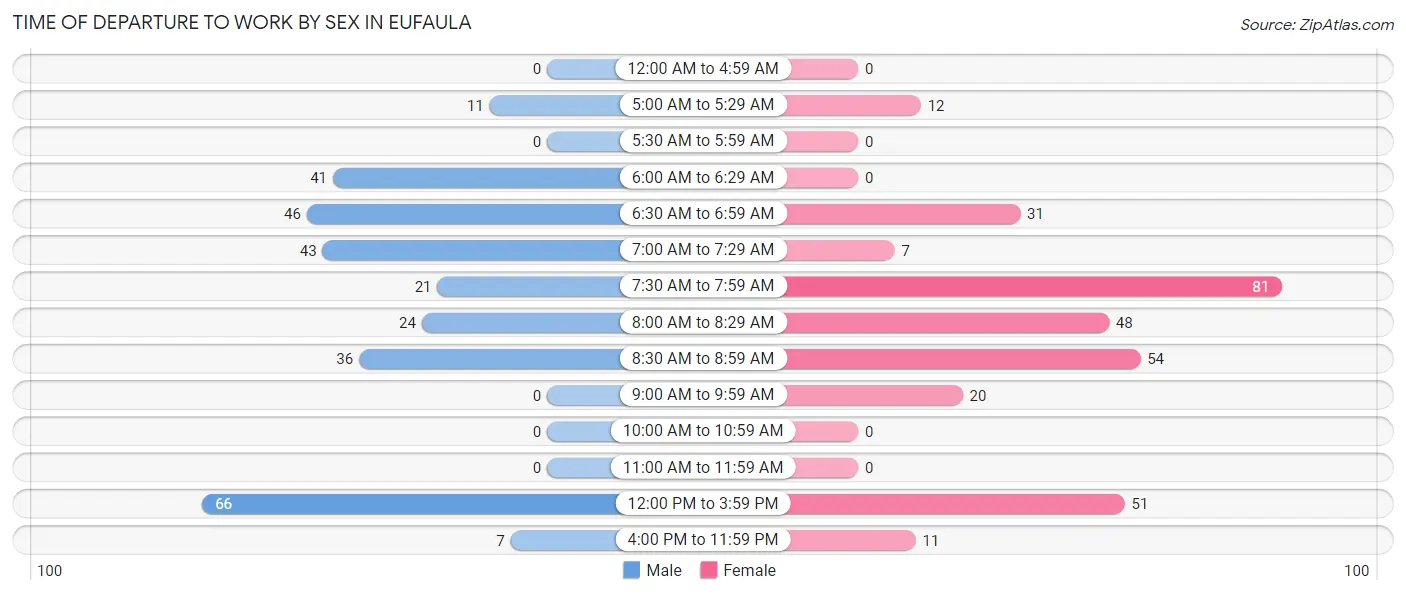
| Time of Departure | Male | Female |
| 12:00 AM to 4:59 AM | 0 (0.0%) | 0 (0.0%) |
| 5:00 AM to 5:29 AM | 11 (3.7%) | 12 (3.8%) |
| 5:30 AM to 5:59 AM | 0 (0.0%) | 0 (0.0%) |
| 6:00 AM to 6:29 AM | 41 (13.9%) | 0 (0.0%) |
| 6:30 AM to 6:59 AM | 46 (15.6%) | 31 (9.8%) |
| 7:00 AM to 7:29 AM | 43 (14.6%) | 7 (2.2%) |
| 7:30 AM to 7:59 AM | 21 (7.1%) | 81 (25.7%) |
| 8:00 AM to 8:29 AM | 24 (8.1%) | 48 (15.2%) |
| 8:30 AM to 8:59 AM | 36 (12.2%) | 54 (17.1%) |
| 9:00 AM to 9:59 AM | 0 (0.0%) | 20 (6.4%) |
| 10:00 AM to 10:59 AM | 0 (0.0%) | 0 (0.0%) |
| 11:00 AM to 11:59 AM | 0 (0.0%) | 0 (0.0%) |
| 12:00 PM to 3:59 PM | 66 (22.4%) | 51 (16.2%) |
| 4:00 PM to 11:59 PM | 7 (2.4%) | 11 (3.5%) |
| Total | 295 (100.0%) | 315 (100.0%) |
Housing Occupancy in Eufaula
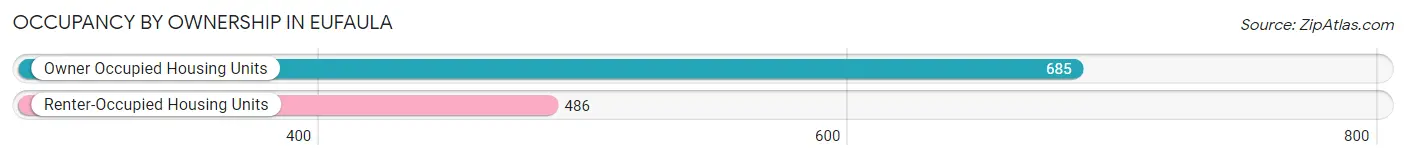
Occupancy by Ownership in Eufaula
Of the total 1,171 dwellings in Eufaula, owner-occupied units account for 685 (58.5%), while renter-occupied units make up 486 (41.5%).
| Occupancy | # Housing Units | % Housing Units |
| Owner Occupied Housing Units | 685 | 58.5% |
| Renter-Occupied Housing Units | 486 | 41.5% |
| Total Occupied Housing Units | 1,171 | 100.0% |
Occupancy by Household Size in Eufaula
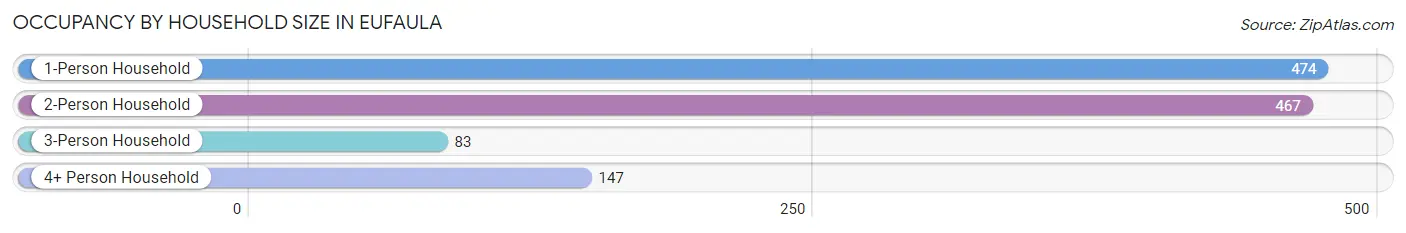
| Household Size | # Housing Units | % Housing Units |
| 1-Person Household | 474 | 40.5% |
| 2-Person Household | 467 | 39.9% |
| 3-Person Household | 83 | 7.1% |
| 4+ Person Household | 147 | 12.6% |
| Total Housing Units | 1,171 | 100.0% |
Occupancy by Ownership by Household Size in Eufaula
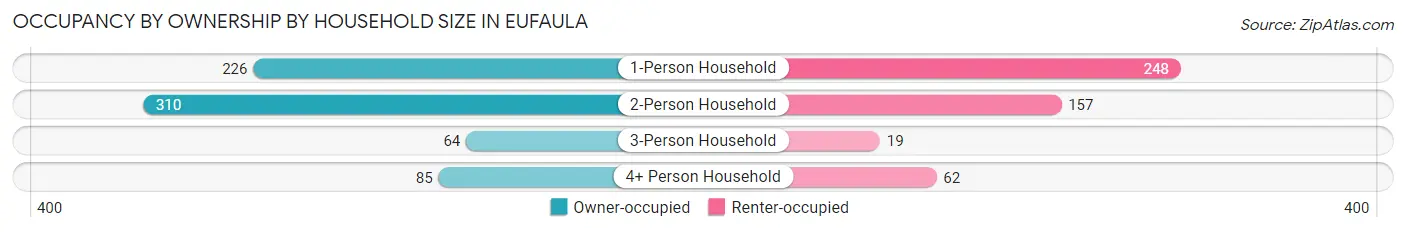
| Household Size | Owner-occupied | Renter-occupied |
| 1-Person Household | 226 (47.7%) | 248 (52.3%) |
| 2-Person Household | 310 (66.4%) | 157 (33.6%) |
| 3-Person Household | 64 (77.1%) | 19 (22.9%) |
| 4+ Person Household | 85 (57.8%) | 62 (42.2%) |
| Total Housing Units | 685 (58.5%) | 486 (41.5%) |
Occupancy by Educational Attainment in Eufaula
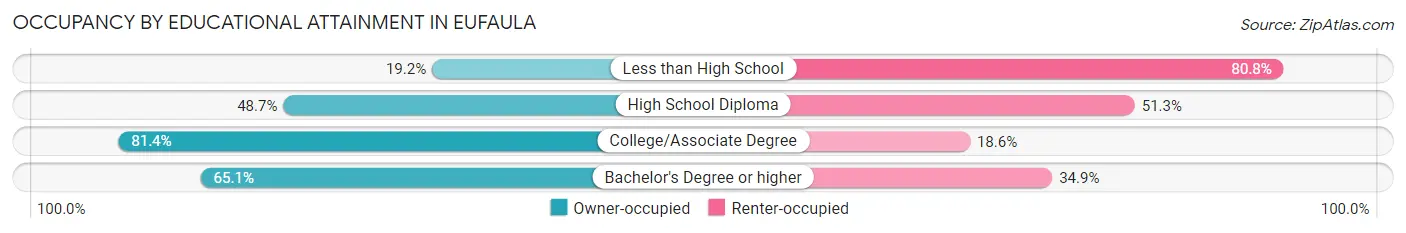
| Household Size | Owner-occupied | Renter-occupied |
| Less than High School | 35 (19.2%) | 147 (80.8%) |
| High School Diploma | 190 (48.7%) | 200 (51.3%) |
| College/Associate Degree | 350 (81.4%) | 80 (18.6%) |
| Bachelor's Degree or higher | 110 (65.1%) | 59 (34.9%) |
Occupancy by Age of Householder in Eufaula
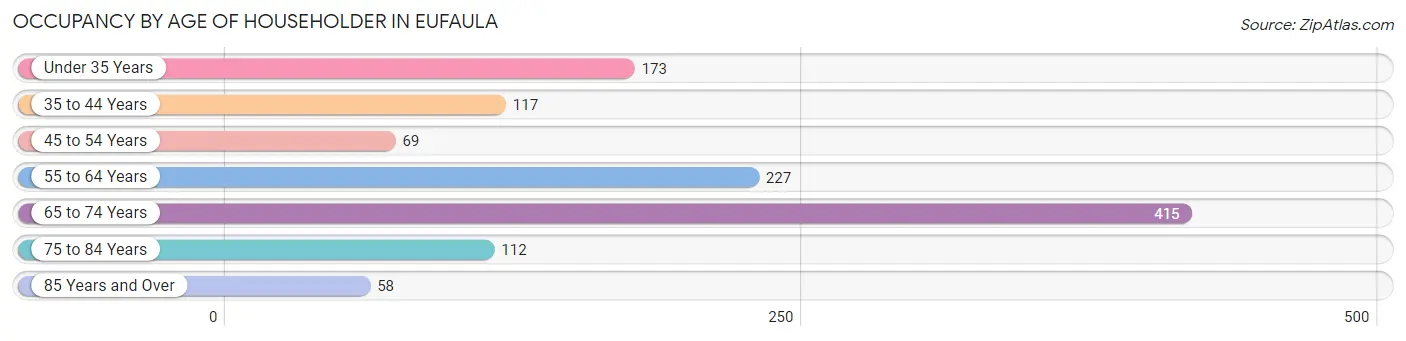
| Age Bracket | # Households | % Households |
| Under 35 Years | 173 | 14.8% |
| 35 to 44 Years | 117 | 10.0% |
| 45 to 54 Years | 69 | 5.9% |
| 55 to 64 Years | 227 | 19.4% |
| 65 to 74 Years | 415 | 35.4% |
| 75 to 84 Years | 112 | 9.6% |
| 85 Years and Over | 58 | 5.0% |
| Total | 1,171 | 100.0% |
Housing Finances in Eufaula
Median Income by Occupancy in Eufaula
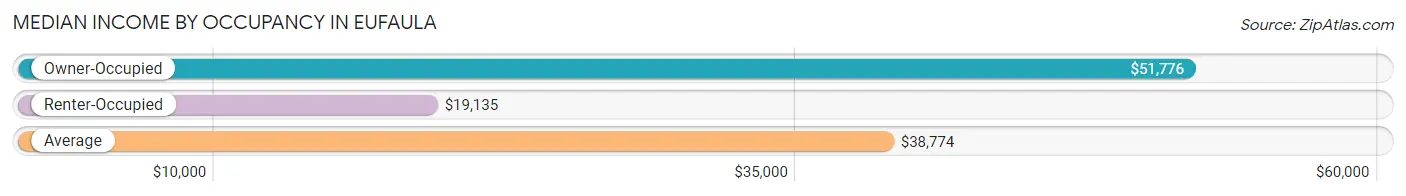
| Occupancy Type | # Households | Median Income |
| Owner-Occupied | 685 (58.5%) | $51,776 |
| Renter-Occupied | 486 (41.5%) | $19,135 |
| Average | 1,171 (100.0%) | $38,774 |
Occupancy by Householder Income Bracket in Eufaula
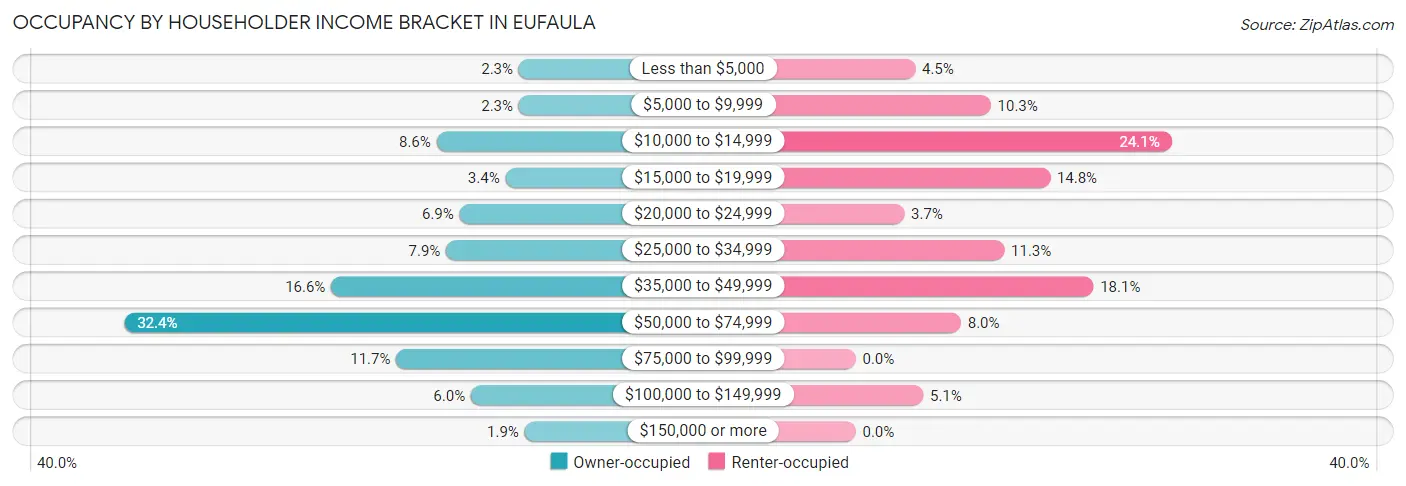
| Income Bracket | Owner-occupied | Renter-occupied |
| Less than $5,000 | 16 (2.3%) | 22 (4.5%) |
| $5,000 to $9,999 | 16 (2.3%) | 50 (10.3%) |
| $10,000 to $14,999 | 59 (8.6%) | 117 (24.1%) |
| $15,000 to $19,999 | 23 (3.4%) | 72 (14.8%) |
| $20,000 to $24,999 | 47 (6.9%) | 18 (3.7%) |
| $25,000 to $34,999 | 54 (7.9%) | 55 (11.3%) |
| $35,000 to $49,999 | 114 (16.6%) | 88 (18.1%) |
| $50,000 to $74,999 | 222 (32.4%) | 39 (8.0%) |
| $75,000 to $99,999 | 80 (11.7%) | 0 (0.0%) |
| $100,000 to $149,999 | 41 (6.0%) | 25 (5.1%) |
| $150,000 or more | 13 (1.9%) | 0 (0.0%) |
| Total | 685 (100.0%) | 486 (100.0%) |
Monthly Housing Cost Tiers in Eufaula
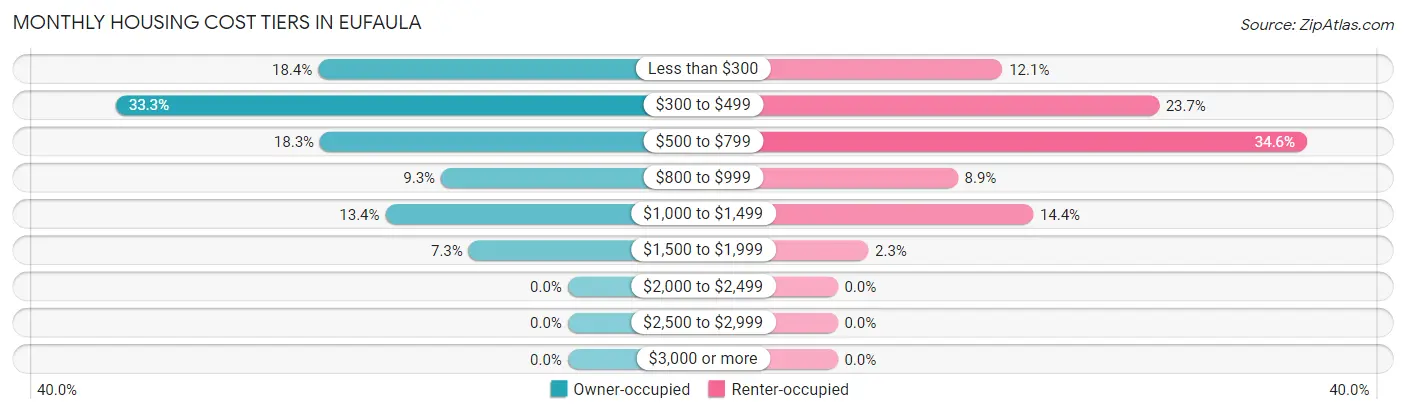
| Monthly Cost | Owner-occupied | Renter-occupied |
| Less than $300 | 126 (18.4%) | 59 (12.1%) |
| $300 to $499 | 228 (33.3%) | 115 (23.7%) |
| $500 to $799 | 125 (18.2%) | 168 (34.6%) |
| $800 to $999 | 64 (9.3%) | 43 (8.8%) |
| $1,000 to $1,499 | 92 (13.4%) | 70 (14.4%) |
| $1,500 to $1,999 | 50 (7.3%) | 11 (2.3%) |
| $2,000 to $2,499 | 0 (0.0%) | 0 (0.0%) |
| $2,500 to $2,999 | 0 (0.0%) | 0 (0.0%) |
| $3,000 or more | 0 (0.0%) | 0 (0.0%) |
| Total | 685 (100.0%) | 486 (100.0%) |
Physical Housing Characteristics in Eufaula
Housing Structures in Eufaula
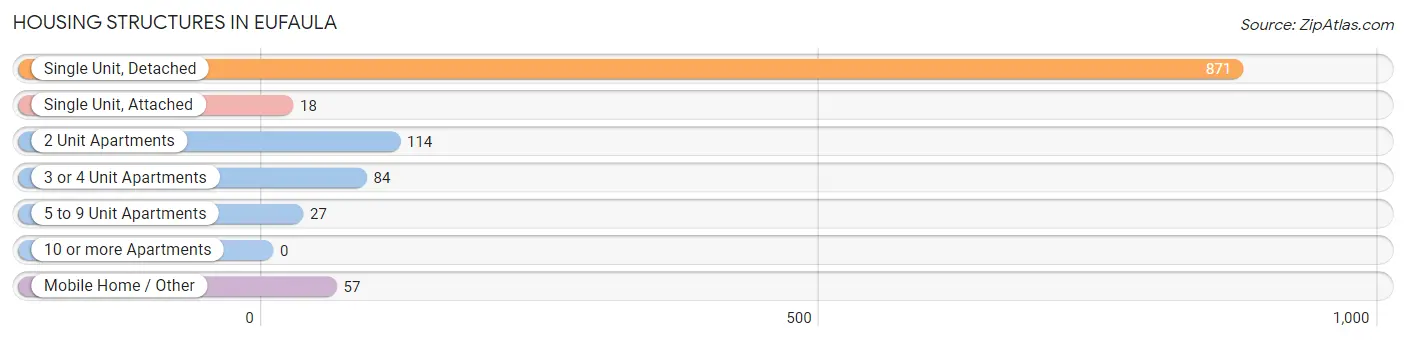
| Structure Type | # Housing Units | % Housing Units |
| Single Unit, Detached | 871 | 74.4% |
| Single Unit, Attached | 18 | 1.5% |
| 2 Unit Apartments | 114 | 9.7% |
| 3 or 4 Unit Apartments | 84 | 7.2% |
| 5 to 9 Unit Apartments | 27 | 2.3% |
| 10 or more Apartments | 0 | 0.0% |
| Mobile Home / Other | 57 | 4.9% |
| Total | 1,171 | 100.0% |
Housing Structures by Occupancy in Eufaula
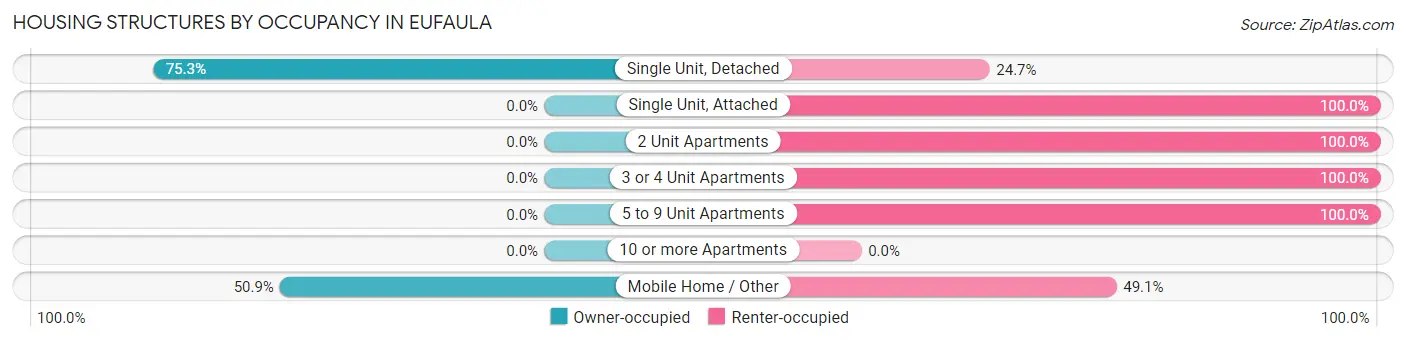
| Structure Type | Owner-occupied | Renter-occupied |
| Single Unit, Detached | 656 (75.3%) | 215 (24.7%) |
| Single Unit, Attached | 0 (0.0%) | 18 (100.0%) |
| 2 Unit Apartments | 0 (0.0%) | 114 (100.0%) |
| 3 or 4 Unit Apartments | 0 (0.0%) | 84 (100.0%) |
| 5 to 9 Unit Apartments | 0 (0.0%) | 27 (100.0%) |
| 10 or more Apartments | 0 (0.0%) | 0 (0.0%) |
| Mobile Home / Other | 29 (50.9%) | 28 (49.1%) |
| Total | 685 (58.5%) | 486 (41.5%) |
Housing Structures by Number of Rooms in Eufaula
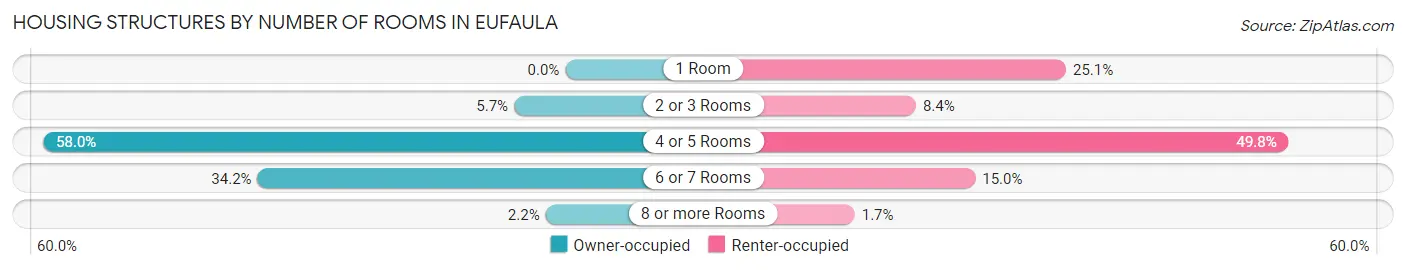
| Number of Rooms | Owner-occupied | Renter-occupied |
| 1 Room | 0 (0.0%) | 122 (25.1%) |
| 2 or 3 Rooms | 39 (5.7%) | 41 (8.4%) |
| 4 or 5 Rooms | 397 (58.0%) | 242 (49.8%) |
| 6 or 7 Rooms | 234 (34.2%) | 73 (15.0%) |
| 8 or more Rooms | 15 (2.2%) | 8 (1.7%) |
| Total | 685 (100.0%) | 486 (100.0%) |
Housing Structure by Heating Type in Eufaula
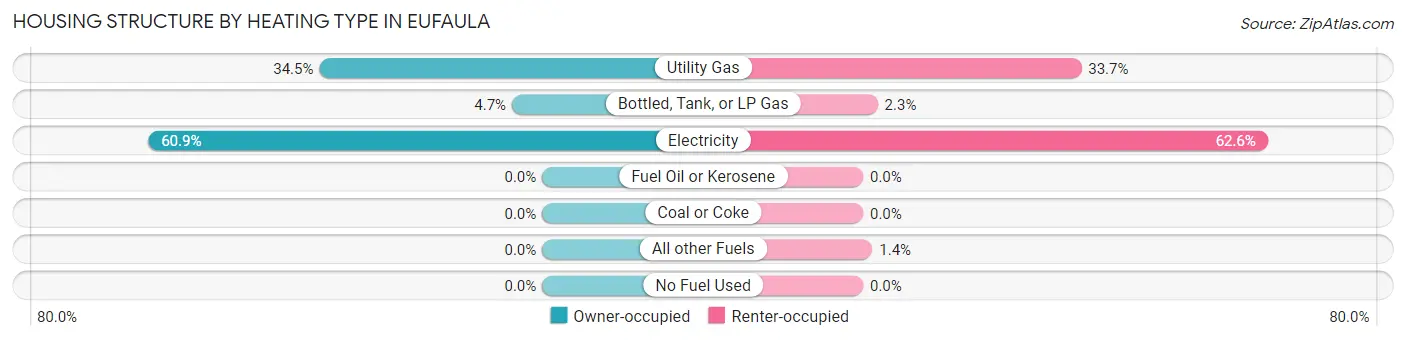
| Heating Type | Owner-occupied | Renter-occupied |
| Utility Gas | 236 (34.4%) | 164 (33.7%) |
| Bottled, Tank, or LP Gas | 32 (4.7%) | 11 (2.3%) |
| Electricity | 417 (60.9%) | 304 (62.5%) |
| Fuel Oil or Kerosene | 0 (0.0%) | 0 (0.0%) |
| Coal or Coke | 0 (0.0%) | 0 (0.0%) |
| All other Fuels | 0 (0.0%) | 7 (1.4%) |
| No Fuel Used | 0 (0.0%) | 0 (0.0%) |
| Total | 685 (100.0%) | 486 (100.0%) |
Household Vehicle Usage in Eufaula
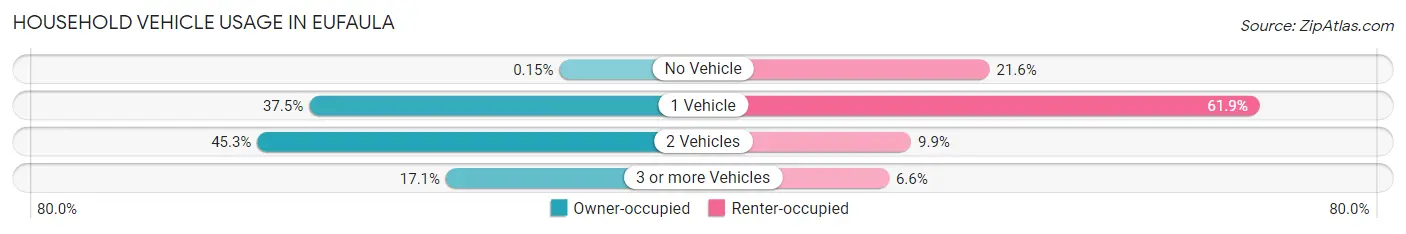
| Vehicles per Household | Owner-occupied | Renter-occupied |
| No Vehicle | 1 (0.2%) | 105 (21.6%) |
| 1 Vehicle | 257 (37.5%) | 301 (61.9%) |
| 2 Vehicles | 310 (45.3%) | 48 (9.9%) |
| 3 or more Vehicles | 117 (17.1%) | 32 (6.6%) |
| Total | 685 (100.0%) | 486 (100.0%) |
Real Estate & Mortgages in Eufaula
Real Estate and Mortgage Overview in Eufaula
| Characteristic | Without Mortgage | With Mortgage |
| Housing Units | 430 | 255 |
| Median Property Value | $159,200 | $133,100 |
| Median Household Income | $44,200 | $0 |
| Monthly Housing Costs | $371 | $0 |
| Real Estate Taxes | $977 | $0 |
Property Value by Mortgage Status in Eufaula
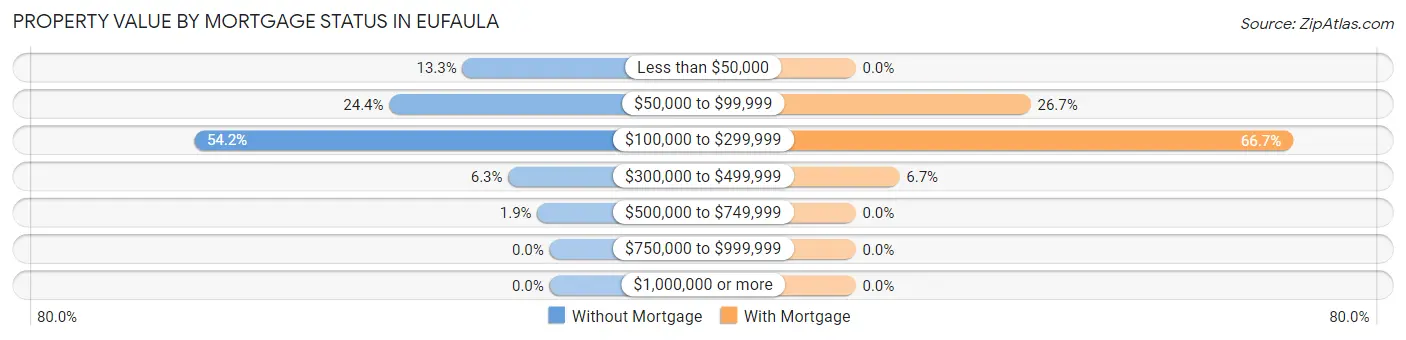
| Property Value | Without Mortgage | With Mortgage |
| Less than $50,000 | 57 (13.3%) | 0 (0.0%) |
| $50,000 to $99,999 | 105 (24.4%) | 68 (26.7%) |
| $100,000 to $299,999 | 233 (54.2%) | 170 (66.7%) |
| $300,000 to $499,999 | 27 (6.3%) | 17 (6.7%) |
| $500,000 to $749,999 | 8 (1.9%) | 0 (0.0%) |
| $750,000 to $999,999 | 0 (0.0%) | 0 (0.0%) |
| $1,000,000 or more | 0 (0.0%) | 0 (0.0%) |
| Total | 430 (100.0%) | 255 (100.0%) |
Household Income by Mortgage Status in Eufaula
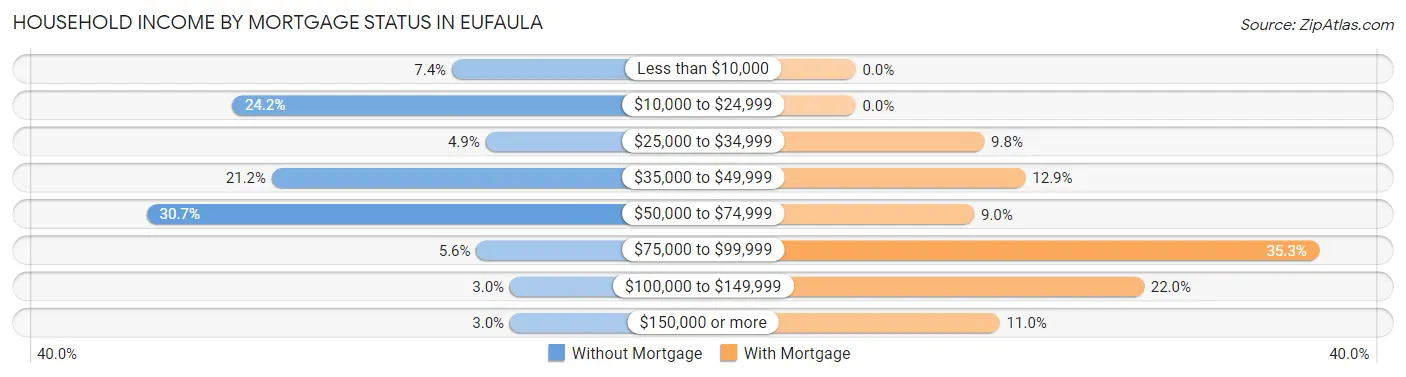
| Household Income | Without Mortgage | With Mortgage |
| Less than $10,000 | 32 (7.4%) | 0 (0.0%) |
| $10,000 to $24,999 | 104 (24.2%) | 0 (0.0%) |
| $25,000 to $34,999 | 21 (4.9%) | 25 (9.8%) |
| $35,000 to $49,999 | 91 (21.2%) | 33 (12.9%) |
| $50,000 to $74,999 | 132 (30.7%) | 23 (9.0%) |
| $75,000 to $99,999 | 24 (5.6%) | 90 (35.3%) |
| $100,000 to $149,999 | 13 (3.0%) | 56 (22.0%) |
| $150,000 or more | 13 (3.0%) | 28 (11.0%) |
| Total | 430 (100.0%) | 255 (100.0%) |
Property Value to Household Income Ratio in Eufaula
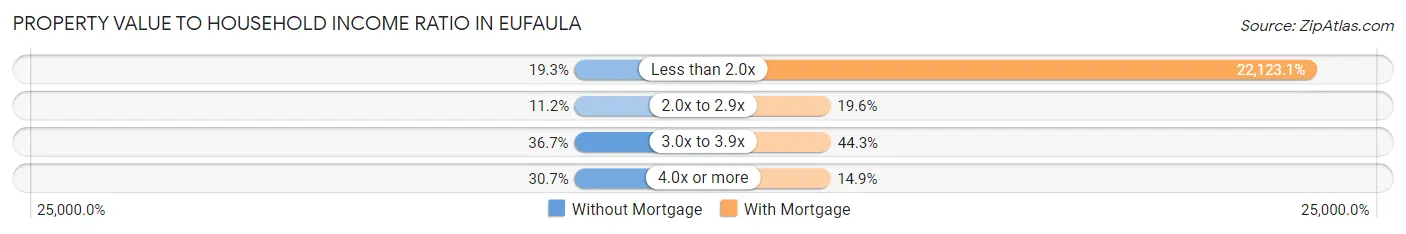
| Value-to-Income Ratio | Without Mortgage | With Mortgage |
| Less than 2.0x | 83 (19.3%) | 56,414 (22,123.1%) |
| 2.0x to 2.9x | 48 (11.2%) | 50 (19.6%) |
| 3.0x to 3.9x | 158 (36.7%) | 113 (44.3%) |
| 4.0x or more | 132 (30.7%) | 38 (14.9%) |
| Total | 430 (100.0%) | 255 (100.0%) |
Real Estate Taxes by Mortgage Status in Eufaula
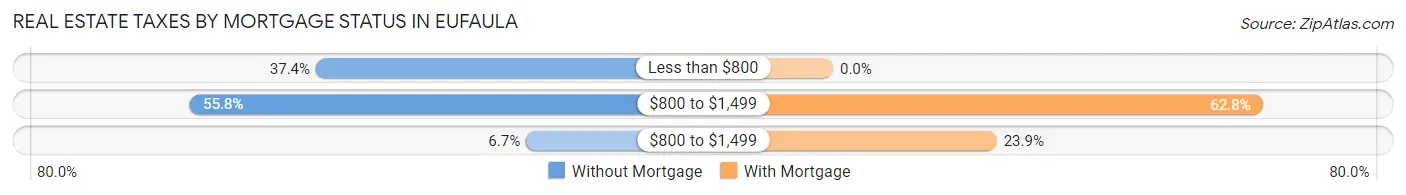
| Property Taxes | Without Mortgage | With Mortgage |
| Less than $800 | 161 (37.4%) | 0 (0.0%) |
| $800 to $1,499 | 240 (55.8%) | 160 (62.7%) |
| $800 to $1,499 | 29 (6.7%) | 61 (23.9%) |
| Total | 430 (100.0%) | 255 (100.0%) |
Health & Disability in Eufaula
Health Insurance Coverage by Age in Eufaula
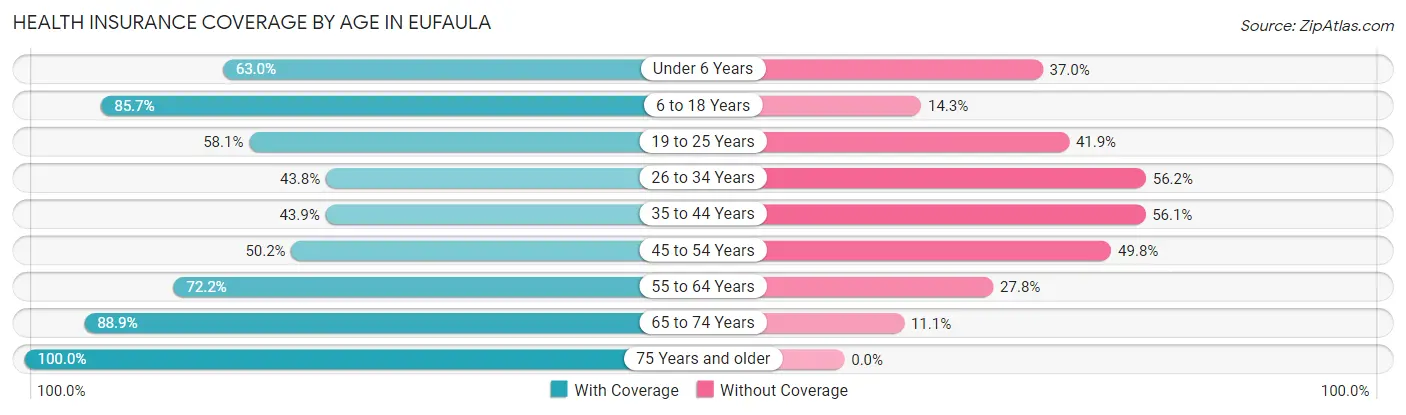
| Age Bracket | With Coverage | Without Coverage |
| Under 6 Years | 75 (63.0%) | 44 (37.0%) |
| 6 to 18 Years | 425 (85.7%) | 71 (14.3%) |
| 19 to 25 Years | 86 (58.1%) | 62 (41.9%) |
| 26 to 34 Years | 88 (43.8%) | 113 (56.2%) |
| 35 to 44 Years | 140 (43.9%) | 179 (56.1%) |
| 45 to 54 Years | 105 (50.2%) | 104 (49.8%) |
| 55 to 64 Years | 255 (72.2%) | 98 (27.8%) |
| 65 to 74 Years | 415 (88.9%) | 52 (11.1%) |
| 75 Years and older | 242 (100.0%) | 0 (0.0%) |
| Total | 1,831 (71.7%) | 723 (28.3%) |
Health Insurance Coverage by Citizenship Status in Eufaula
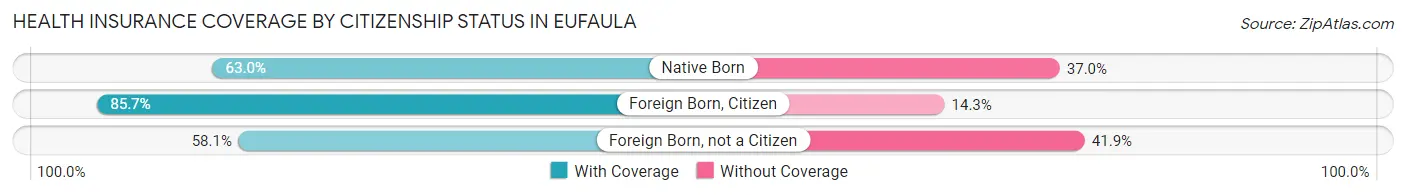
| Citizenship Status | With Coverage | Without Coverage |
| Native Born | 75 (63.0%) | 44 (37.0%) |
| Foreign Born, Citizen | 425 (85.7%) | 71 (14.3%) |
| Foreign Born, not a Citizen | 86 (58.1%) | 62 (41.9%) |
Health Insurance Coverage by Household Income in Eufaula
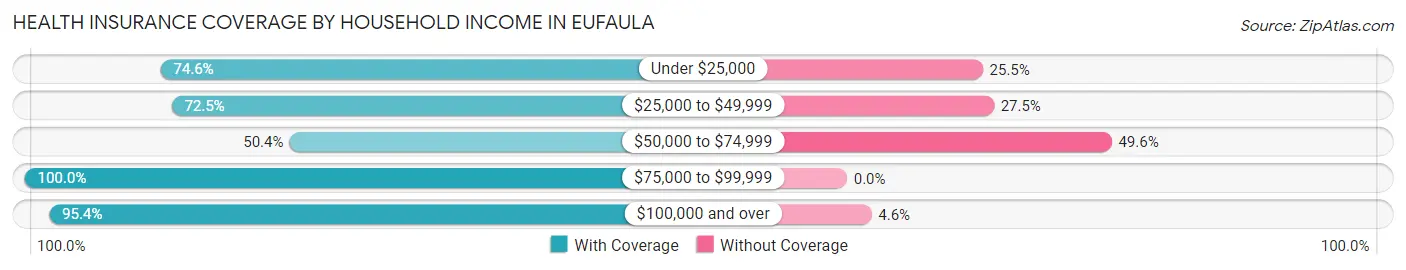
| Household Income | With Coverage | Without Coverage |
| Under $25,000 | 586 (74.6%) | 200 (25.5%) |
| $25,000 to $49,999 | 395 (72.5%) | 150 (27.5%) |
| $50,000 to $74,999 | 368 (50.4%) | 362 (49.6%) |
| $75,000 to $99,999 | 254 (100.0%) | 0 (0.0%) |
| $100,000 and over | 228 (95.4%) | 11 (4.6%) |
Public vs Private Health Insurance Coverage by Age in Eufaula
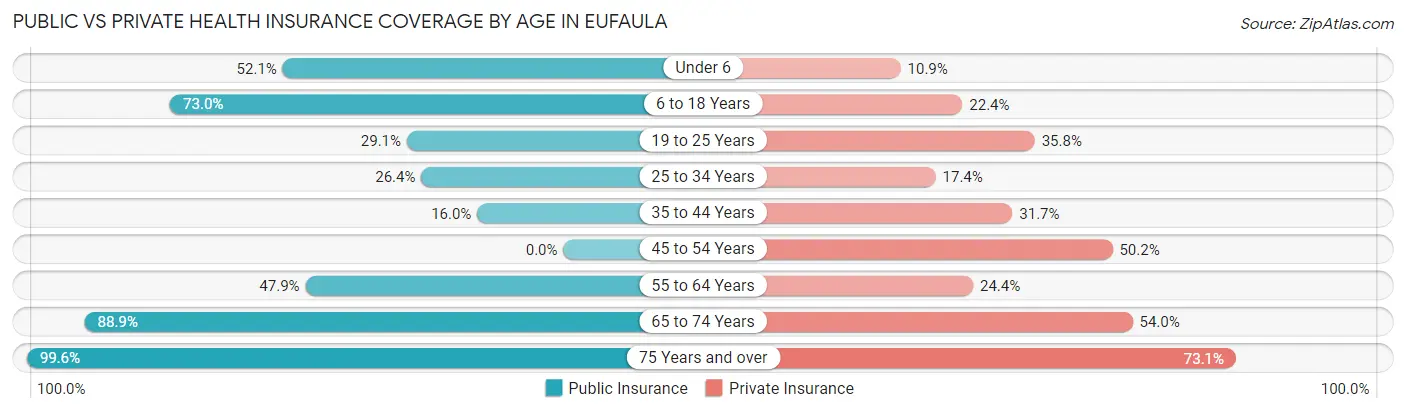
| Age Bracket | Public Insurance | Private Insurance |
| Under 6 | 62 (52.1%) | 13 (10.9%) |
| 6 to 18 Years | 362 (73.0%) | 111 (22.4%) |
| 19 to 25 Years | 43 (29.0%) | 53 (35.8%) |
| 25 to 34 Years | 53 (26.4%) | 35 (17.4%) |
| 35 to 44 Years | 51 (16.0%) | 101 (31.7%) |
| 45 to 54 Years | 0 (0.0%) | 105 (50.2%) |
| 55 to 64 Years | 169 (47.9%) | 86 (24.4%) |
| 65 to 74 Years | 415 (88.9%) | 252 (54.0%) |
| 75 Years and over | 241 (99.6%) | 177 (73.1%) |
| Total | 1,396 (54.7%) | 933 (36.5%) |
Disability Status by Sex by Age in Eufaula
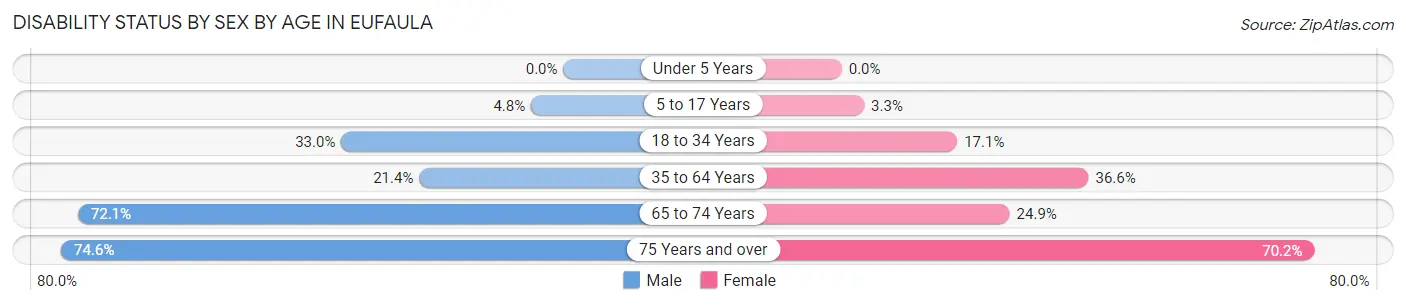
| Age Bracket | Male | Female |
| Under 5 Years | 0 (0.0%) | 0 (0.0%) |
| 5 to 17 Years | 11 (4.8%) | 11 (3.3%) |
| 18 to 34 Years | 62 (33.0%) | 30 (17.1%) |
| 35 to 64 Years | 98 (21.4%) | 155 (36.6%) |
| 65 to 74 Years | 62 (72.1%) | 95 (24.9%) |
| 75 Years and over | 88 (74.6%) | 87 (70.2%) |
Disability Class by Sex by Age in Eufaula
Disability Class: Hearing Difficulty
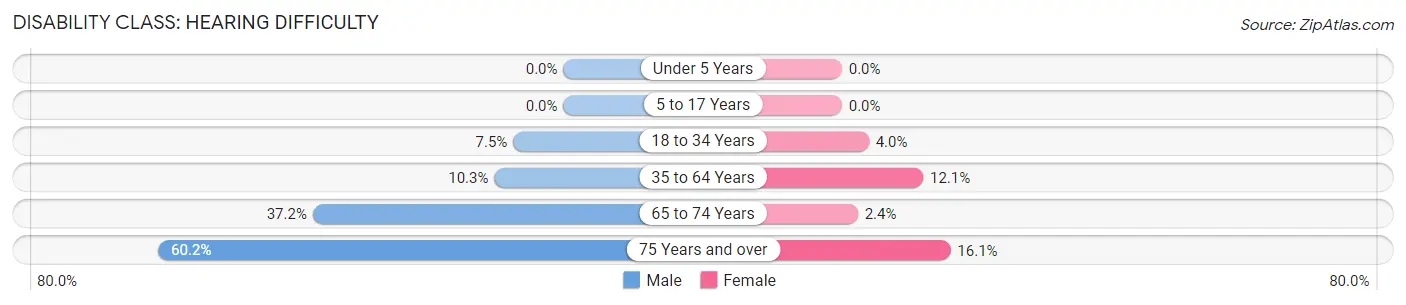
| Age Bracket | Male | Female |
| Under 5 Years | 0 (0.0%) | 0 (0.0%) |
| 5 to 17 Years | 0 (0.0%) | 0 (0.0%) |
| 18 to 34 Years | 14 (7.4%) | 7 (4.0%) |
| 35 to 64 Years | 47 (10.3%) | 51 (12.1%) |
| 65 to 74 Years | 32 (37.2%) | 9 (2.4%) |
| 75 Years and over | 71 (60.2%) | 20 (16.1%) |
Disability Class: Vision Difficulty
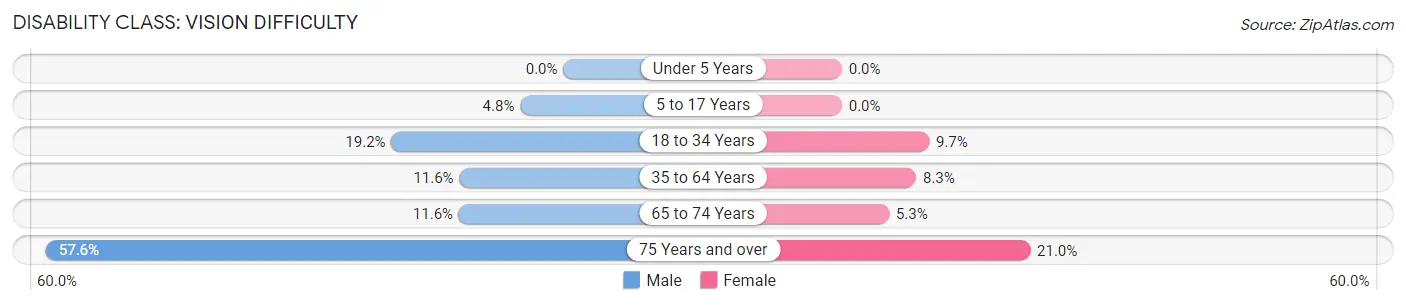
| Age Bracket | Male | Female |
| Under 5 Years | 0 (0.0%) | 0 (0.0%) |
| 5 to 17 Years | 11 (4.8%) | 0 (0.0%) |
| 18 to 34 Years | 36 (19.2%) | 17 (9.7%) |
| 35 to 64 Years | 53 (11.6%) | 35 (8.3%) |
| 65 to 74 Years | 10 (11.6%) | 20 (5.2%) |
| 75 Years and over | 68 (57.6%) | 26 (21.0%) |
Disability Class: Cognitive Difficulty
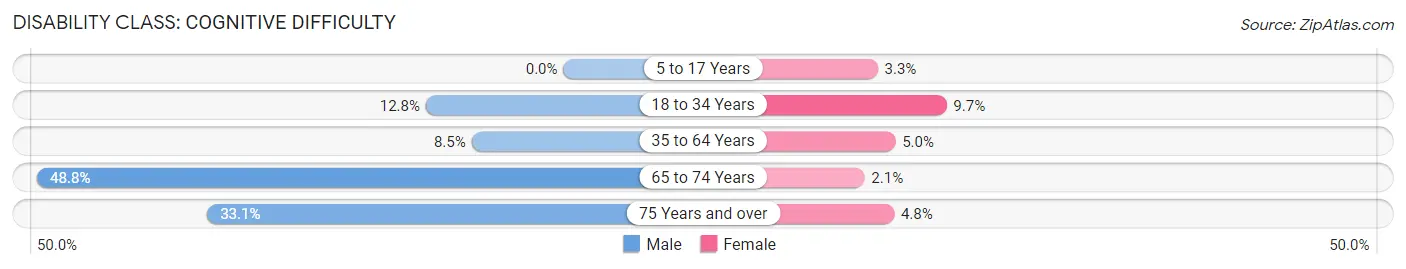
| Age Bracket | Male | Female |
| 5 to 17 Years | 0 (0.0%) | 11 (3.3%) |
| 18 to 34 Years | 24 (12.8%) | 17 (9.7%) |
| 35 to 64 Years | 39 (8.5%) | 21 (5.0%) |
| 65 to 74 Years | 42 (48.8%) | 8 (2.1%) |
| 75 Years and over | 39 (33.1%) | 6 (4.8%) |
Disability Class: Ambulatory Difficulty
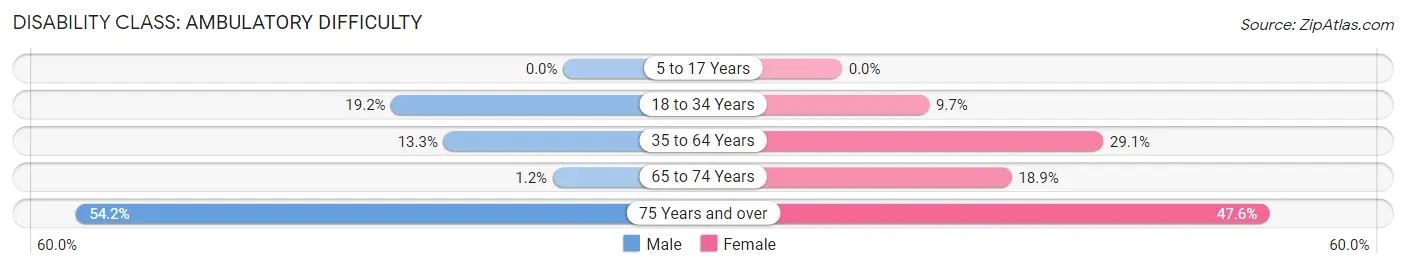
| Age Bracket | Male | Female |
| 5 to 17 Years | 0 (0.0%) | 0 (0.0%) |
| 18 to 34 Years | 36 (19.2%) | 17 (9.7%) |
| 35 to 64 Years | 61 (13.3%) | 123 (29.1%) |
| 65 to 74 Years | 1 (1.2%) | 72 (18.9%) |
| 75 Years and over | 64 (54.2%) | 59 (47.6%) |
Disability Class: Self-Care Difficulty
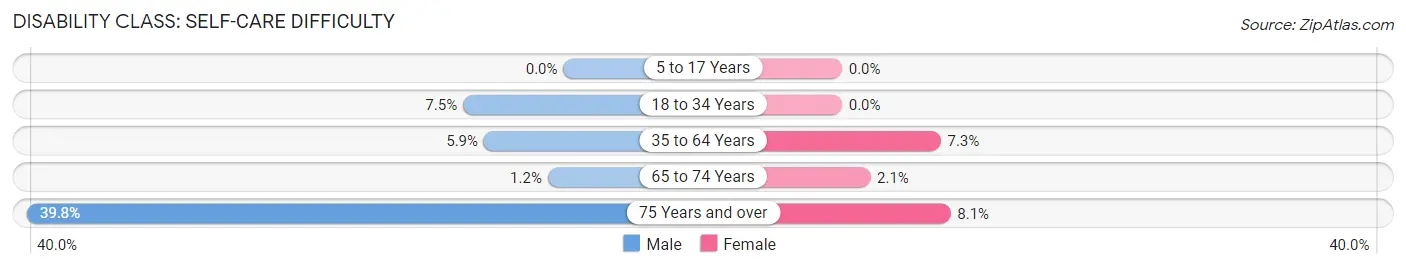
| Age Bracket | Male | Female |
| 5 to 17 Years | 0 (0.0%) | 0 (0.0%) |
| 18 to 34 Years | 14 (7.4%) | 0 (0.0%) |
| 35 to 64 Years | 27 (5.9%) | 31 (7.3%) |
| 65 to 74 Years | 1 (1.2%) | 8 (2.1%) |
| 75 Years and over | 47 (39.8%) | 10 (8.1%) |
Technology Access in Eufaula
Computing Device Access in Eufaula
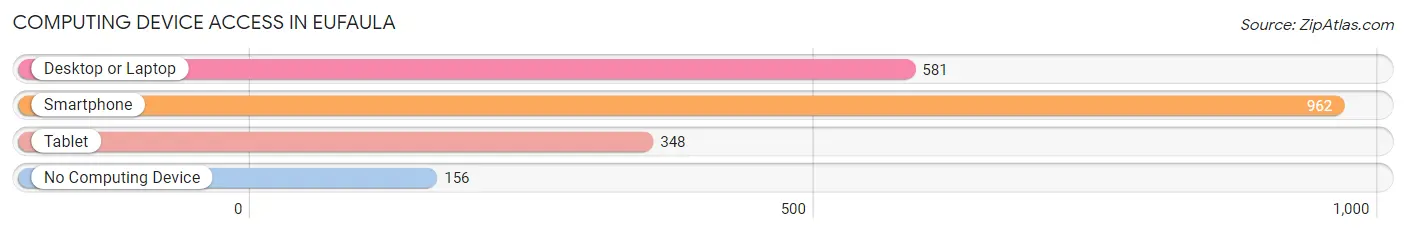
| Device Type | # Households | % Households |
| Desktop or Laptop | 581 | 49.6% |
| Smartphone | 962 | 82.2% |
| Tablet | 348 | 29.7% |
| No Computing Device | 156 | 13.3% |
| Total | 1,171 | 100.0% |
Internet Access in Eufaula
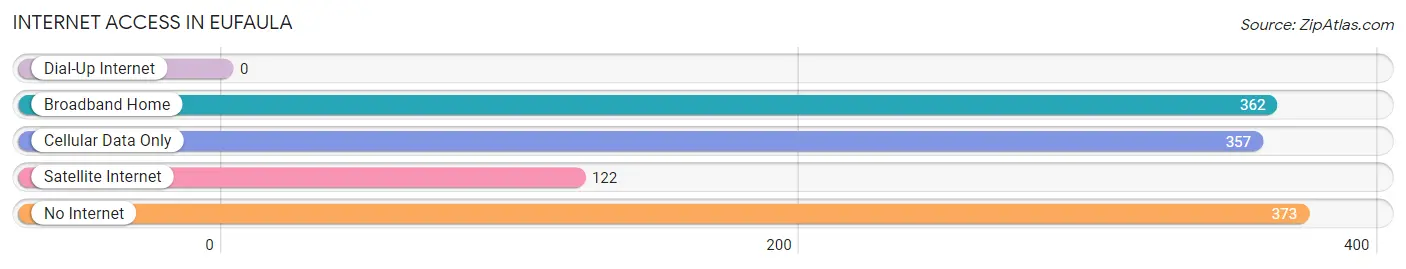
| Internet Type | # Households | % Households |
| Dial-Up Internet | 0 | 0.0% |
| Broadband Home | 362 | 30.9% |
| Cellular Data Only | 357 | 30.5% |
| Satellite Internet | 122 | 10.4% |
| No Internet | 373 | 31.9% |
| Total | 1,171 | 100.0% |
Eufaula Summary
Eufaula, Oklahoma is a small town located in McIntosh County, Oklahoma. It is situated on the banks of Lake Eufaula, a large reservoir created by the damming of the Canadian River. The town was founded in 1872 and has a population of approximately 2,500 people.
History
The area that is now Eufaula was originally inhabited by the Creek Nation, who had been living in the area since the early 1800s. The town was founded in 1872 by the Creek Nation and named after the Creek word for “black water”, which referred to the dark color of the lake. The town was incorporated in 1891 and was the first town in Oklahoma to be incorporated by the Creek Nation.
In the early 1900s, Eufaula was a thriving agricultural community, with cotton, corn, and wheat being the main crops. The town was also home to a number of businesses, including a cotton gin, a flour mill, and a sawmill.
In the 1920s, the town began to experience a decline in population due to the Great Depression. However, the town was revitalized in the 1940s when the U.S. Army Corps of Engineers built the Eufaula Dam on the Canadian River. The dam created Lake Eufaula, which provided the town with a new source of income from tourism and recreation.
Geography
Eufaula is located in the southeastern corner of Oklahoma, on the banks of Lake Eufaula. The town is situated in a rural area, surrounded by rolling hills and farmland. The town is located approximately 50 miles south of Tulsa and 100 miles east of Oklahoma City.
The climate in Eufaula is generally mild, with hot summers and cold winters. The average temperature in the summer is around 90 degrees Fahrenheit, while the average temperature in the winter is around 40 degrees Fahrenheit.
Economy
The economy of Eufaula is largely based on tourism and recreation. The town is home to a number of tourist attractions, including the Eufaula National Wildlife Refuge, the Eufaula Dam, and the Eufaula State Park. The town is also home to a number of businesses, including restaurants, retail stores, and hotels.
The town is also home to a number of manufacturing companies, including a paper mill, a plastics factory, and a metal fabrication plant. The town is also home to a number of agricultural businesses, including a cotton gin, a flour mill, and a sawmill.
Demographics
As of the 2010 census, the population of Eufaula was 2,500 people. The racial makeup of the town was 79.2% White, 15.2% Native American, 0.8% African American, 0.4% Asian, and 4.4% from other races. The median household income in the town was $30,000, and the median age was 38.
Conclusion
Eufaula, Oklahoma is a small town located in McIntosh County, Oklahoma. It is situated on the banks of Lake Eufaula, a large reservoir created by the damming of the Canadian River. The town was founded in 1872 and has a population of approximately 2,500 people. The economy of Eufaula is largely based on tourism and recreation, and the town is home to a number of businesses, including restaurants, retail stores, and hotels. The racial makeup of the town is 79.2% White, 15.2% Native American, 0.8% African American, 0.4% Asian, and 4.4% from other races. The median household income in the town was $30,000, and the median age was 38.
Common Questions
What is Per Capita Income in Eufaula?
Per Capita income in Eufaula is $21,048.
What is the Median Family Income in Eufaula?
Median Family Income in Eufaula is $54,712.
What is the Median Household income in Eufaula?
Median Household Income in Eufaula is $38,774.
What is Income or Wage Gap in Eufaula?
Income or Wage Gap in Eufaula is 53.9%.
Women in Eufaula earn 46.1 cents for every dollar earned by a man.
What is Inequality or Gini Index in Eufaula?
Inequality or Gini Index in Eufaula is 0.44.
What is the Total Population of Eufaula?
Total Population of Eufaula is 2,776.
What is the Total Male Population of Eufaula?
Total Male Population of Eufaula is 1,199.
What is the Total Female Population of Eufaula?
Total Female Population of Eufaula is 1,577.
What is the Ratio of Males per 100 Females in Eufaula?
There are 76.03 Males per 100 Females in Eufaula.
What is the Ratio of Females per 100 Males in Eufaula?
There are 131.53 Females per 100 Males in Eufaula.
What is the Median Population Age in Eufaula?
Median Population Age in Eufaula is 47.7 Years.
What is the Average Family Size in Eufaula
Average Family Size in Eufaula is 3.1 People.
What is the Average Household Size in Eufaula
Average Household Size in Eufaula is 2.2 People.
How Large is the Labor Force in Eufaula?
There are 746 People in the Labor Forcein in Eufaula.
What is the Percentage of People in the Labor Force in Eufaula?
33.5% of People are in the Labor Force in Eufaula.
What is the Unemployment Rate in Eufaula?
Unemployment Rate in Eufaula is 2.5%.