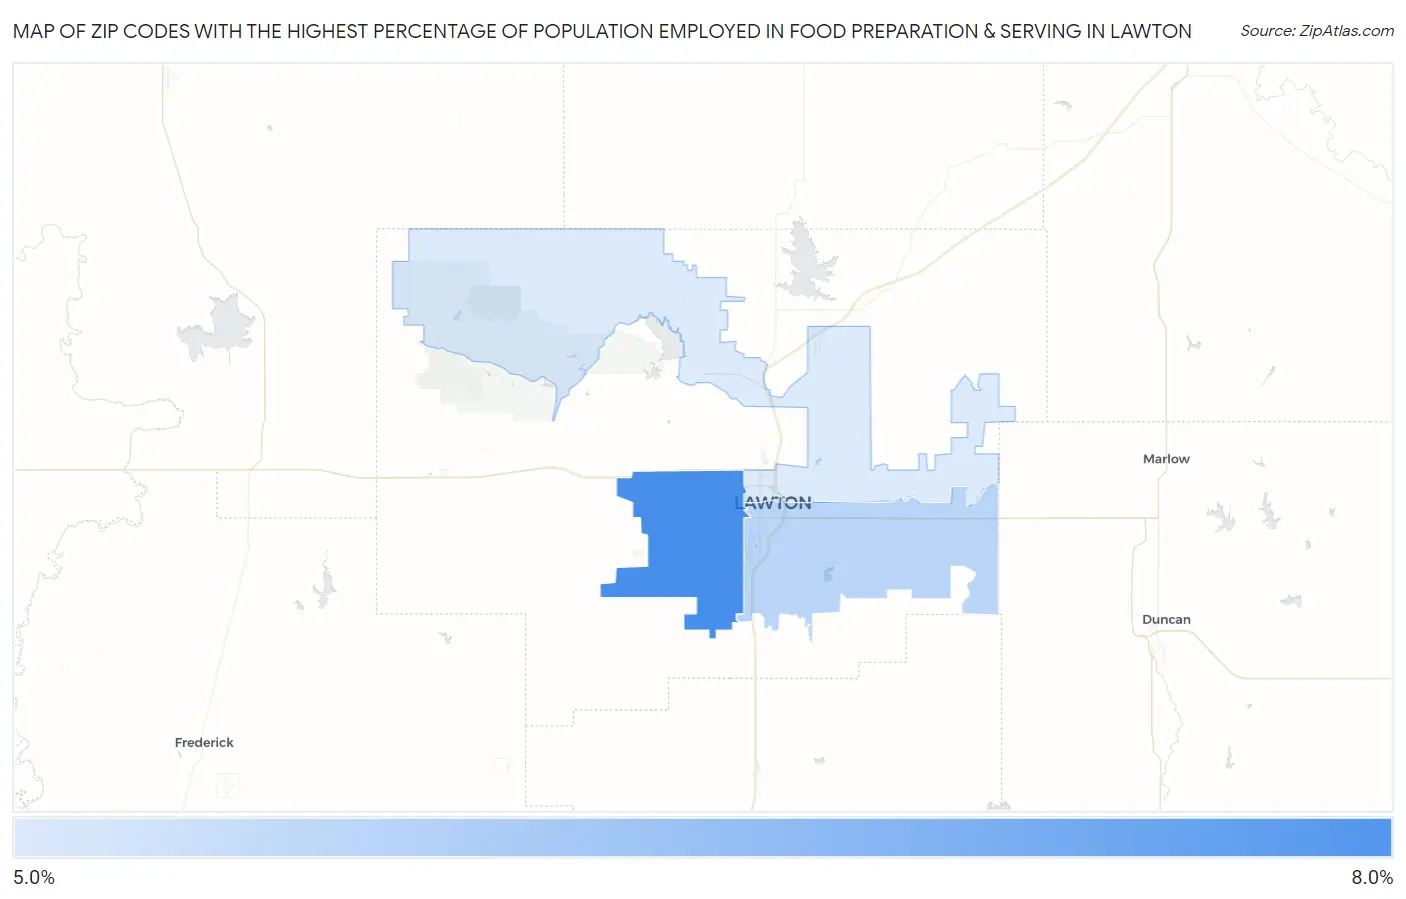
Zip Codes with the Highest Percentage of Population Employed in Food Preparation & Serving in Lawton, OK
RELATED REPORTS & OPTIONS
Food Preparation & Serving
Lawton
Compare Zip Codes
Map of Zip Codes with the Highest Percentage of Population Employed in Food Preparation & Serving in Lawton
5.6%
7.1%
Zip Codes with the Highest Percentage of Population Employed in Food Preparation & Serving in Lawton, OK
| Zip Code | % Employed | vs State | vs National | |
| 1. | 73505 | 7.1% | 5.6%(+1.49)#139 | 5.3%(+1.80)#6,371 |
| 2. | 73501 | 5.9% | 5.6%(+0.330)#213 | 5.3%(+0.640)#9,593 |
| 3. | 73507 | 5.6% | 5.6%(-0.029)#234 | 5.3%(+0.280)#10,825 |
1
Common Questions
What are the Top Zip Codes with the Highest Percentage of Population Employed in Food Preparation & Serving in Lawton, OK?
Top Zip Codes with the Highest Percentage of Population Employed in Food Preparation & Serving in Lawton, OK are:
What zip code has the Highest Percentage of Population Employed in Food Preparation & Serving in Lawton, OK?
73505 has the Highest Percentage of Population Employed in Food Preparation & Serving in Lawton, OK with 7.1%.
What is the Percentage of Population Employed in Food Preparation & Serving in Lawton, OK?
Percentage of Population Employed in Food Preparation & Serving in Lawton is 6.8%.
What is the Percentage of Population Employed in Food Preparation & Serving in Oklahoma?
Percentage of Population Employed in Food Preparation & Serving in Oklahoma is 5.6%.
What is the Percentage of Population Employed in Food Preparation & Serving in the United States?
Percentage of Population Employed in Food Preparation & Serving in the United States is 5.3%.