Zip Codes with the Highest Percentage of Population Employed in Food Preparation & Serving in Shawnee, OK
RELATED REPORTS & OPTIONS
Food Preparation & Serving
Shawnee
Compare Zip Codes
Map of Zip Codes with the Highest Percentage of Population Employed in Food Preparation & Serving in Shawnee
4.8%
5.7%
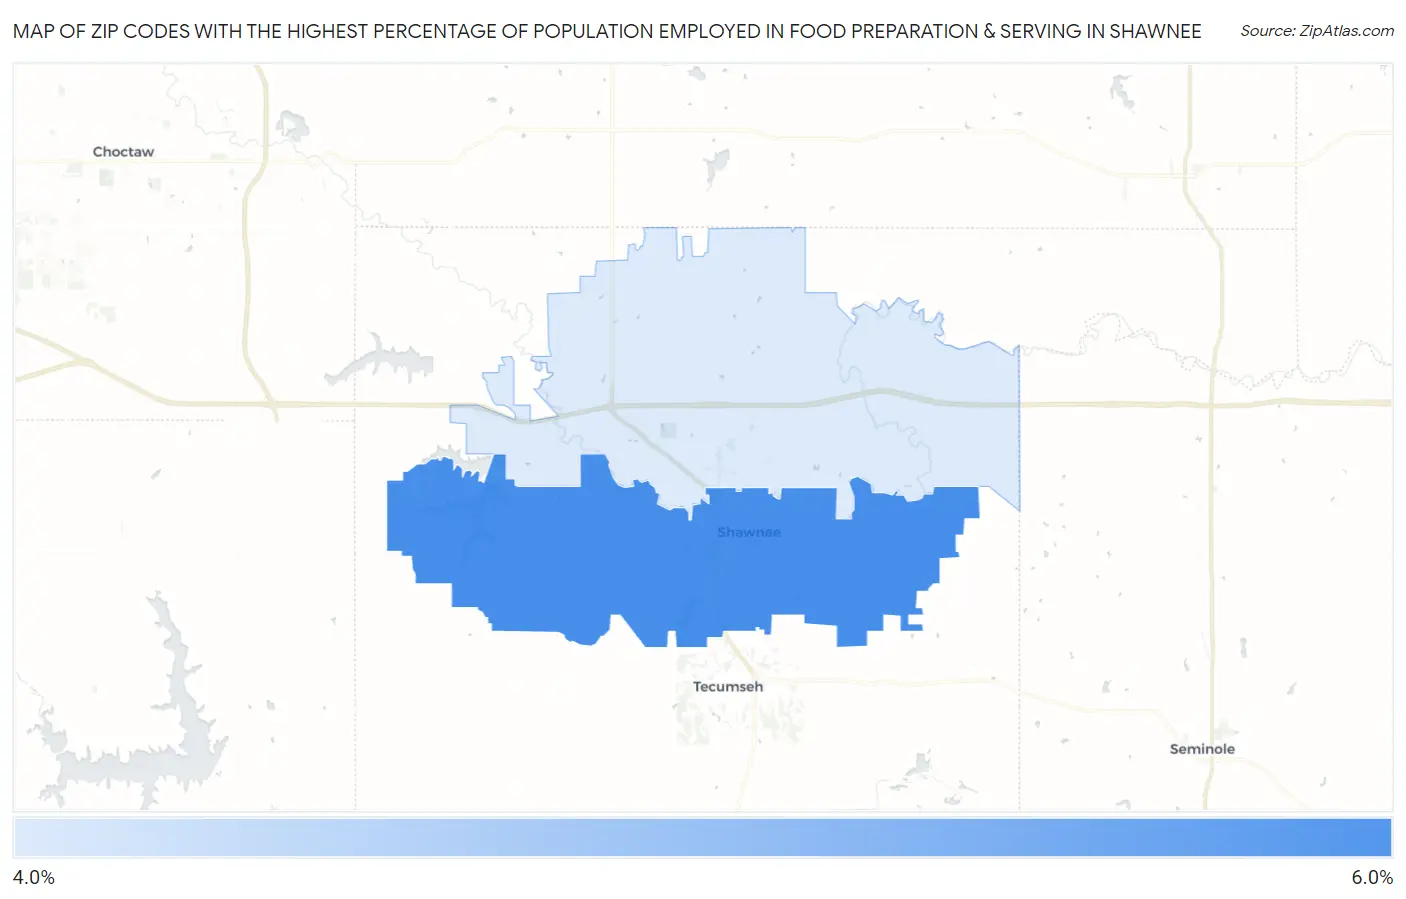
Zip Codes with the Highest Percentage of Population Employed in Food Preparation & Serving in Shawnee, OK
| Zip Code | % Employed | vs State | vs National | |
| 1. | 74801 | 5.7% | 5.6%(+0.102)#225 | 5.3%(+0.411)#10,354 |
| 2. | 74804 | 4.8% | 5.6%(-0.782)#289 | 5.3%(-0.472)#13,707 |
1
Common Questions
What are the Top Zip Codes with the Highest Percentage of Population Employed in Food Preparation & Serving in Shawnee, OK?
Top Zip Codes with the Highest Percentage of Population Employed in Food Preparation & Serving in Shawnee, OK are:
What zip code has the Highest Percentage of Population Employed in Food Preparation & Serving in Shawnee, OK?
74801 has the Highest Percentage of Population Employed in Food Preparation & Serving in Shawnee, OK with 5.7%.
What is the Percentage of Population Employed in Food Preparation & Serving in Shawnee, OK?
Percentage of Population Employed in Food Preparation & Serving in Shawnee is 6.1%.
What is the Percentage of Population Employed in Food Preparation & Serving in Oklahoma?
Percentage of Population Employed in Food Preparation & Serving in Oklahoma is 5.6%.
What is the Percentage of Population Employed in Food Preparation & Serving in the United States?
Percentage of Population Employed in Food Preparation & Serving in the United States is 5.3%.