Stoney Point, OK Map & Demographics
Stoney Point Map
Stoney Point Overview
$18,510
PER CAPITA INCOME
$64,063
AVG FAMILY INCOME
$31,375
AVG HOUSEHOLD INCOME
65.0%
WAGE / INCOME GAP [ % ]
35.0¢/ $1
WAGE / INCOME GAP [ $ ]
0.42
INEQUALITY / GINI INDEX
209
TOTAL POPULATION
83
MALE POPULATION
126
FEMALE POPULATION
65.87
MALES / 100 FEMALES
151.81
FEMALES / 100 MALES
40.9
MEDIAN AGE
3.1
AVG FAMILY SIZE
2.4
AVG HOUSEHOLD SIZE
76
LABOR FORCE [ PEOPLE ]
49.0%
PERCENT IN LABOR FORCE
9.2%
UNEMPLOYMENT RATE
Income in Stoney Point
Income Overview in Stoney Point
Per Capita Income in Stoney Point is $18,510, while median incomes of families and households are $64,063 and $31,375 respectively.
| Characteristic | Number | Measure |
| Per Capita Income | 209 | $18,510 |
| Median Family Income | 57 | $64,063 |
| Mean Family Income | 57 | $56,711 |
| Median Household Income | 87 | $31,375 |
| Mean Household Income | 87 | $42,670 |
| Income Deficit | 57 | $0 |
| Wage / Income Gap (%) | 209 | 64.97% |
| Wage / Income Gap ($) | 209 | 35.03¢ per $1 |
| Gini / Inequality Index | 209 | 0.42 |
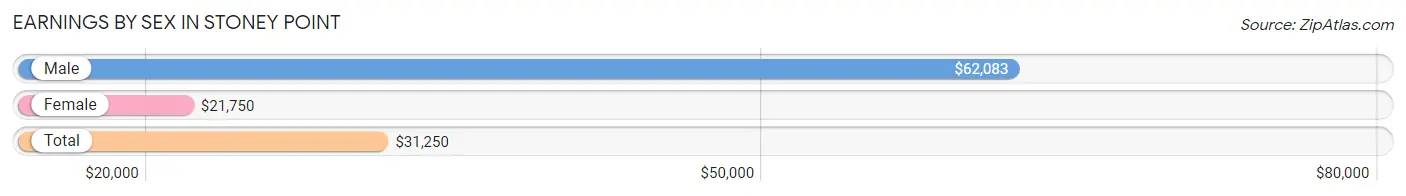
Earnings by Sex in Stoney Point
Average Earnings in Stoney Point are $31,250, $62,083 for men and $21,750 for women, a difference of 65.0%.
| Sex | Number | Average Earnings |
| Male | 17 (23.6%) | $62,083 |
| Female | 55 (76.4%) | $21,750 |
| Total | 72 (100.0%) | $31,250 |
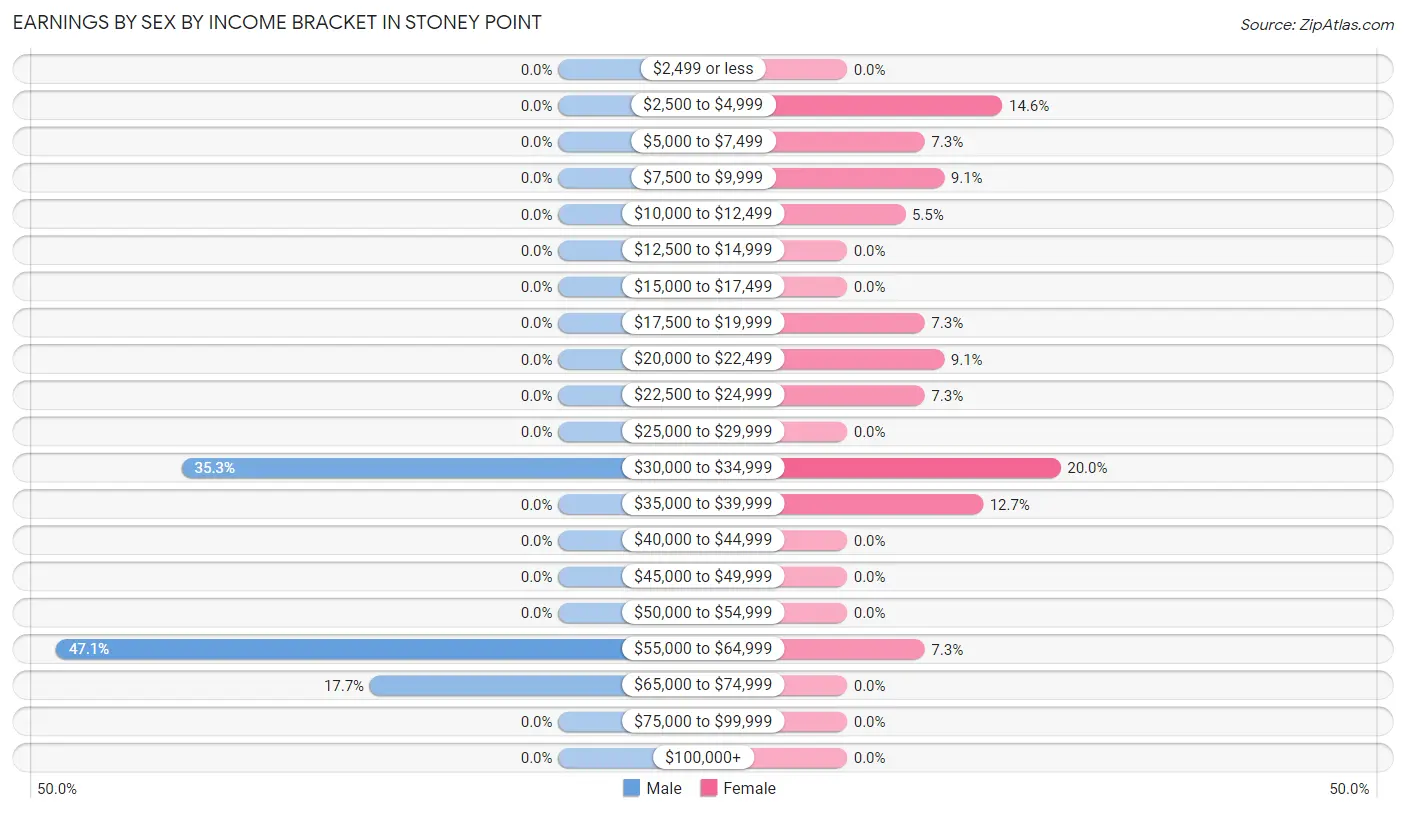
Earnings by Sex by Income Bracket in Stoney Point
The most common earnings brackets in Stoney Point are $55,000 to $64,999 for men (8 | 47.1%) and $30,000 to $34,999 for women (11 | 20.0%).
| Income | Male | Female |
| $2,499 or less | 0 (0.0%) | 0 (0.0%) |
| $2,500 to $4,999 | 0 (0.0%) | 8 (14.5%) |
| $5,000 to $7,499 | 0 (0.0%) | 4 (7.3%) |
| $7,500 to $9,999 | 0 (0.0%) | 5 (9.1%) |
| $10,000 to $12,499 | 0 (0.0%) | 3 (5.4%) |
| $12,500 to $14,999 | 0 (0.0%) | 0 (0.0%) |
| $15,000 to $17,499 | 0 (0.0%) | 0 (0.0%) |
| $17,500 to $19,999 | 0 (0.0%) | 4 (7.3%) |
| $20,000 to $22,499 | 0 (0.0%) | 5 (9.1%) |
| $22,500 to $24,999 | 0 (0.0%) | 4 (7.3%) |
| $25,000 to $29,999 | 0 (0.0%) | 0 (0.0%) |
| $30,000 to $34,999 | 6 (35.3%) | 11 (20.0%) |
| $35,000 to $39,999 | 0 (0.0%) | 7 (12.7%) |
| $40,000 to $44,999 | 0 (0.0%) | 0 (0.0%) |
| $45,000 to $49,999 | 0 (0.0%) | 0 (0.0%) |
| $50,000 to $54,999 | 0 (0.0%) | 0 (0.0%) |
| $55,000 to $64,999 | 8 (47.1%) | 4 (7.3%) |
| $65,000 to $74,999 | 3 (17.6%) | 0 (0.0%) |
| $75,000 to $99,999 | 0 (0.0%) | 0 (0.0%) |
| $100,000+ | 0 (0.0%) | 0 (0.0%) |
| Total | 17 (100.0%) | 55 (100.0%) |
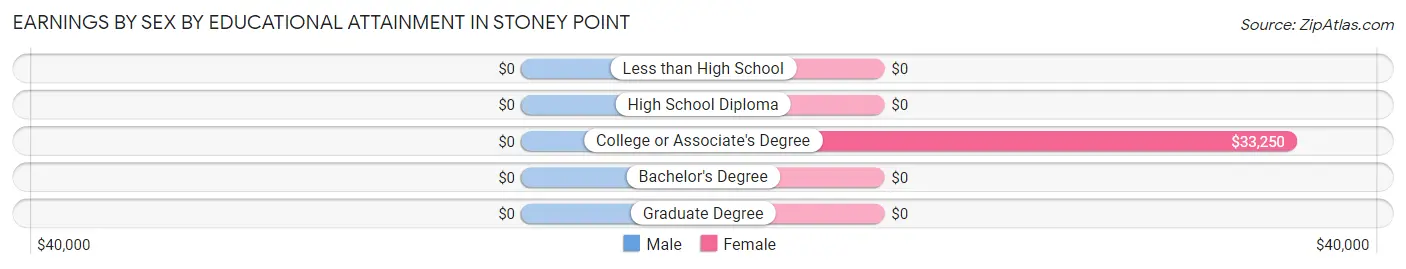
Earnings by Sex by Educational Attainment in Stoney Point
| Educational Attainment | Male Income | Female Income |
| Less than High School | - | - |
| High School Diploma | - | - |
| College or Associate's Degree | - | - |
| Bachelor's Degree | - | - |
| Graduate Degree | - | - |
| Total | $62,083 | $23,125 |
Family Income in Stoney Point
Family Income Brackets in Stoney Point
According to the Stoney Point family income data, there are 21 families falling into the $50,000 to $74,999 income range, which is the most common income bracket and makes up 36.8% of all families.
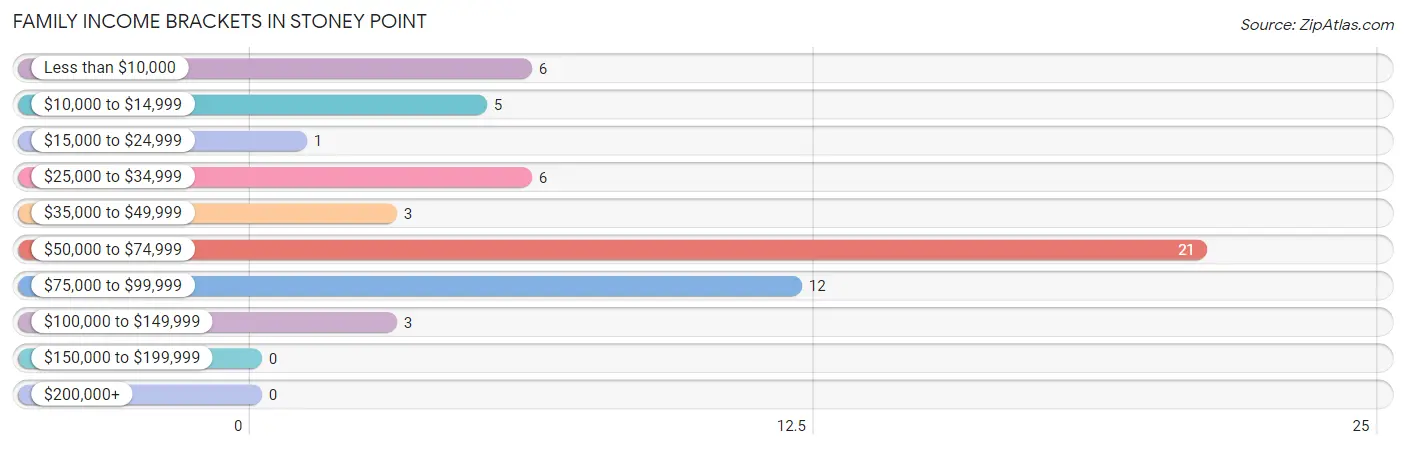
| Income Bracket | # Families | % Families |
| Less than $10,000 | 6 | 10.5% |
| $10,000 to $14,999 | 5 | 8.8% |
| $15,000 to $24,999 | 1 | 1.8% |
| $25,000 to $34,999 | 6 | 10.5% |
| $35,000 to $49,999 | 3 | 5.3% |
| $50,000 to $74,999 | 21 | 36.8% |
| $75,000 to $99,999 | 12 | 21.1% |
| $100,000 to $149,999 | 3 | 5.3% |
| $150,000 to $199,999 | 0 | 0.0% |
| $200,000+ | 0 | 0.0% |
Family Income by Famaliy Size in Stoney Point
4-person families (14 | 24.6%) account for the highest median family income in Stoney Point with $65,500 per family, while 2-person families (31 | 54.4%) have the highest median income of $32,014 per family member.
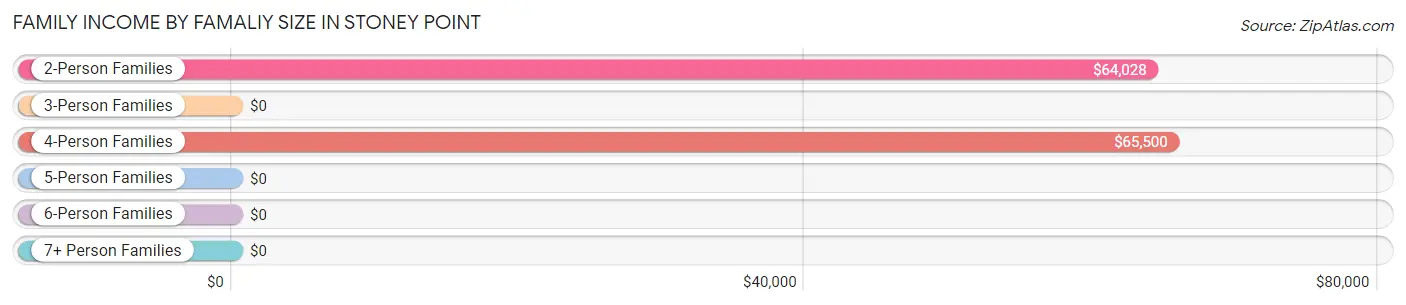
| Income Bracket | # Families | Median Income |
| 2-Person Families | 31 (54.4%) | $64,028 |
| 3-Person Families | 8 (14.0%) | $0 |
| 4-Person Families | 14 (24.6%) | $65,500 |
| 5-Person Families | 0 (0.0%) | $0 |
| 6-Person Families | 0 (0.0%) | $0 |
| 7+ Person Families | 4 (7.0%) | $0 |
| Total | 57 (100.0%) | $64,063 |
Family Income by Number of Earners in Stoney Point
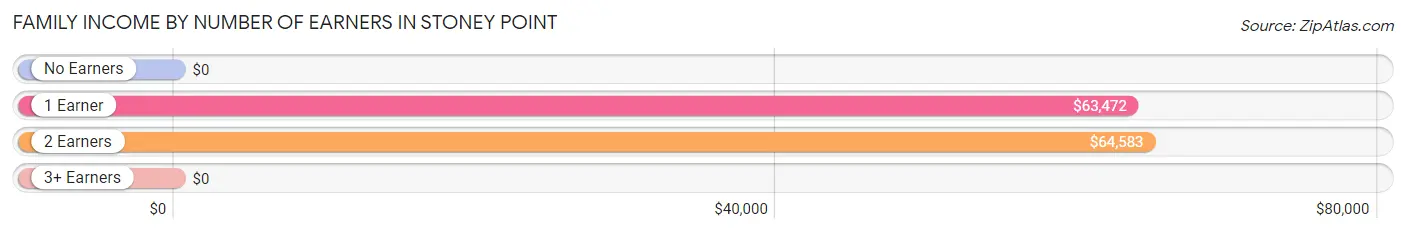
| Number of Earners | # Families | Median Income |
| No Earners | 24 (42.1%) | $0 |
| 1 Earner | 19 (33.3%) | $63,472 |
| 2 Earners | 11 (19.3%) | $64,583 |
| 3+ Earners | 3 (5.3%) | $0 |
| Total | 57 (100.0%) | $64,063 |
Household Income in Stoney Point
Household Income Brackets in Stoney Point
With 21 households falling in the category, the $50,000 to $74,999 income range is the most frequent in Stoney Point, accounting for 24.1% of all households.
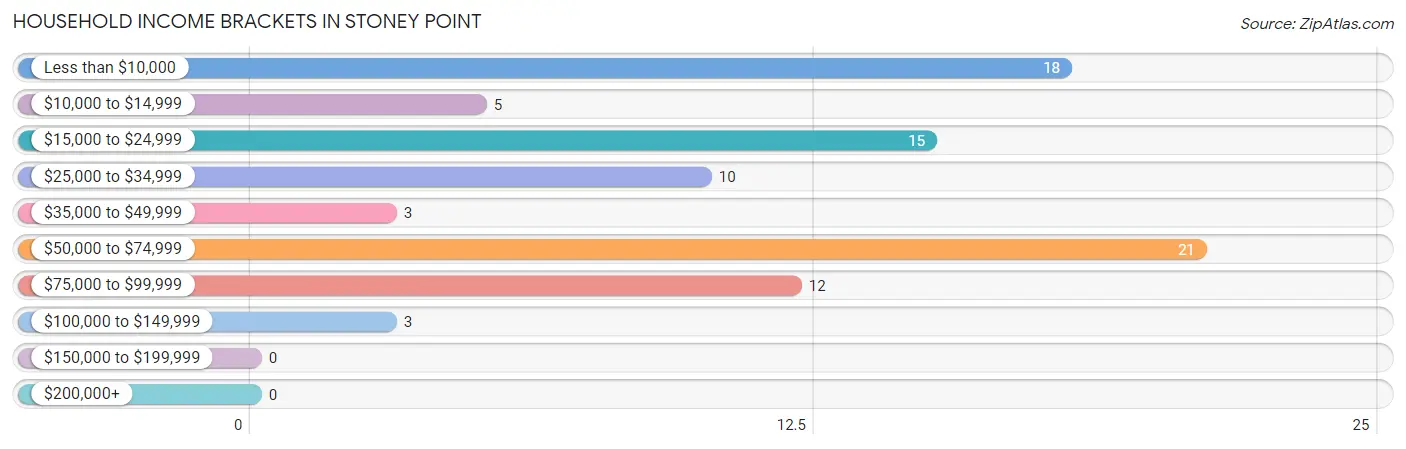
| Income Bracket | # Households | % Households |
| Less than $10,000 | 18 | 20.7% |
| $10,000 to $14,999 | 5 | 5.7% |
| $15,000 to $24,999 | 15 | 17.2% |
| $25,000 to $34,999 | 10 | 11.5% |
| $35,000 to $49,999 | 3 | 3.4% |
| $50,000 to $74,999 | 21 | 24.1% |
| $75,000 to $99,999 | 12 | 13.8% |
| $100,000 to $149,999 | 3 | 3.4% |
| $150,000 to $199,999 | 0 | 0.0% |
| $200,000+ | 0 | 0.0% |
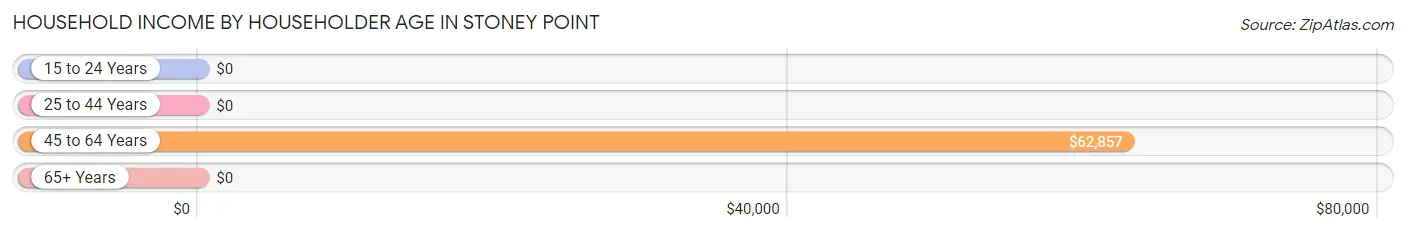
Household Income by Householder Age in Stoney Point
The median household income in Stoney Point is $31,375, with the highest median household income of $62,857 found in the 45 to 64 years age bracket for the primary householder. A total of 28 households (32.2%) fall into this category.
| Income Bracket | # Households | Median Income |
| 15 to 24 Years | 0 (0.0%) | $0 |
| 25 to 44 Years | 38 (43.7%) | $0 |
| 45 to 64 Years | 28 (32.2%) | $62,857 |
| 65+ Years | 21 (24.1%) | $0 |
| Total | 87 (100.0%) | $31,375 |
Poverty in Stoney Point
Income Below Poverty by Sex and Age in Stoney Point
With 22.9% poverty level for males and 14.3% for females among the residents of Stoney Point, 15 year old males and 35 to 44 year old females are the most vulnerable to poverty, with 2 males (100.0%) and 14 females (58.3%) in their respective age groups living below the poverty level.
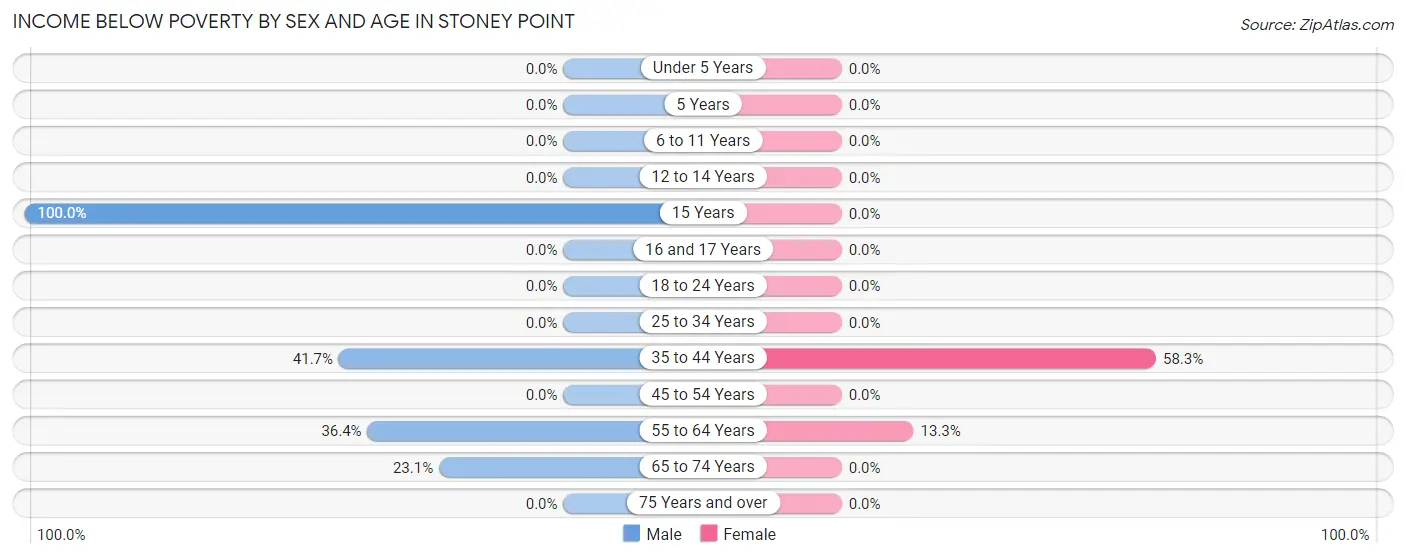
| Age Bracket | Male | Female |
| Under 5 Years | 0 (0.0%) | 0 (0.0%) |
| 5 Years | 0 (0.0%) | 0 (0.0%) |
| 6 to 11 Years | 0 (0.0%) | 0 (0.0%) |
| 12 to 14 Years | 0 (0.0%) | 0 (0.0%) |
| 15 Years | 2 (100.0%) | 0 (0.0%) |
| 16 and 17 Years | 0 (0.0%) | 0 (0.0%) |
| 18 to 24 Years | 0 (0.0%) | 0 (0.0%) |
| 25 to 34 Years | 0 (0.0%) | 0 (0.0%) |
| 35 to 44 Years | 10 (41.7%) | 14 (58.3%) |
| 45 to 54 Years | 0 (0.0%) | 0 (0.0%) |
| 55 to 64 Years | 4 (36.4%) | 4 (13.3%) |
| 65 to 74 Years | 3 (23.1%) | 0 (0.0%) |
| 75 Years and over | 0 (0.0%) | 0 (0.0%) |
| Total | 19 (22.9%) | 18 (14.3%) |
Income Above Poverty by Sex and Age in Stoney Point
According to the poverty statistics in Stoney Point, males aged under 5 years and females aged 6 to 11 years are the age groups that are most secure financially, with 100.0% of males and 100.0% of females in these age groups living above the poverty line.
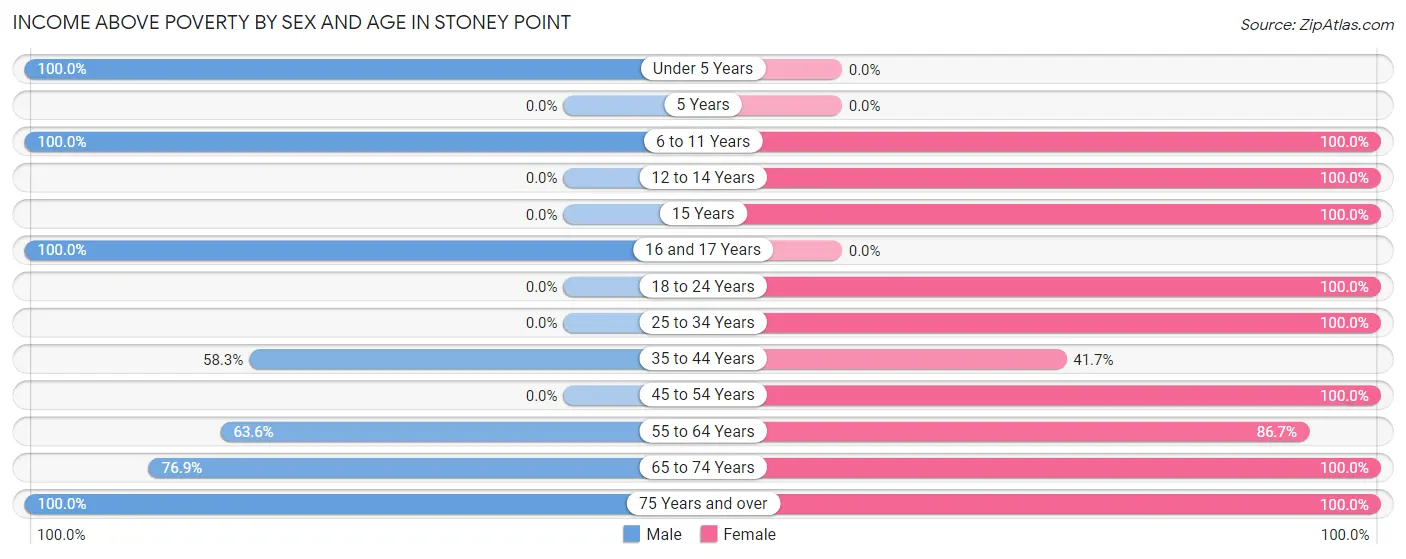
| Age Bracket | Male | Female |
| Under 5 Years | 3 (100.0%) | 0 (0.0%) |
| 5 Years | 0 (0.0%) | 0 (0.0%) |
| 6 to 11 Years | 13 (100.0%) | 13 (100.0%) |
| 12 to 14 Years | 0 (0.0%) | 18 (100.0%) |
| 15 Years | 0 (0.0%) | 5 (100.0%) |
| 16 and 17 Years | 8 (100.0%) | 0 (0.0%) |
| 18 to 24 Years | 0 (0.0%) | 5 (100.0%) |
| 25 to 34 Years | 0 (0.0%) | 11 (100.0%) |
| 35 to 44 Years | 14 (58.3%) | 10 (41.7%) |
| 45 to 54 Years | 0 (0.0%) | 8 (100.0%) |
| 55 to 64 Years | 7 (63.6%) | 26 (86.7%) |
| 65 to 74 Years | 10 (76.9%) | 5 (100.0%) |
| 75 Years and over | 9 (100.0%) | 7 (100.0%) |
| Total | 64 (77.1%) | 108 (85.7%) |
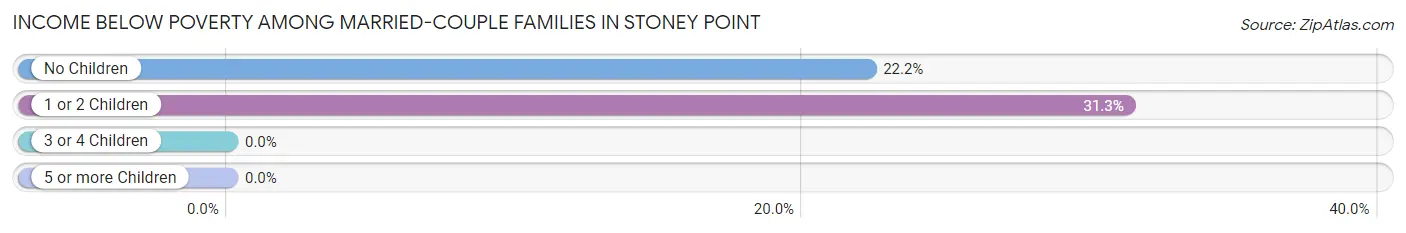
Income Below Poverty Among Married-Couple Families in Stoney Point
The poverty statistics for married-couple families in Stoney Point show that 23.4% or 11 of the total 47 families live below the poverty line. Families with 1 or 2 children have the highest poverty rate of 31.2%, comprising of 5 families. On the other hand, families with 5 or more children have the lowest poverty rate of 0.0%, which includes 0 families.
| Children | Above Poverty | Below Poverty |
| No Children | 21 (77.8%) | 6 (22.2%) |
| 1 or 2 Children | 11 (68.8%) | 5 (31.2%) |
| 3 or 4 Children | 0 (0.0%) | 0 (0.0%) |
| 5 or more Children | 4 (100.0%) | 0 (0.0%) |
| Total | 36 (76.6%) | 11 (23.4%) |
Income Below Poverty Among Single-Parent Households in Stoney Point
| Children | Single Father | Single Mother |
| No Children | 0 (0.0%) | 0 (0.0%) |
| 1 or 2 Children | 0 (0.0%) | 0 (0.0%) |
| 3 or 4 Children | 0 (0.0%) | 0 (0.0%) |
| 5 or more Children | 0 (0.0%) | 0 (0.0%) |
| Total | 0 (0.0%) | 0 (0.0%) |
Income Below Poverty Among Married-Couple vs Single-Parent Households in Stoney Point
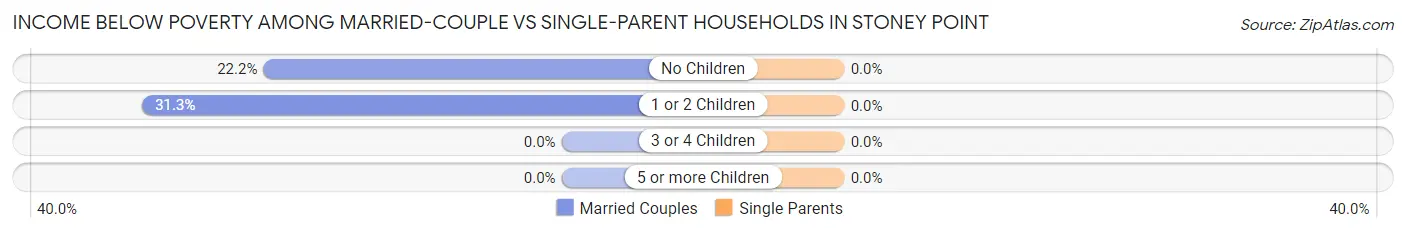
| Children | Married-Couple Families | Single-Parent Households |
| No Children | 6 (22.2%) | 0 (0.0%) |
| 1 or 2 Children | 5 (31.2%) | 0 (0.0%) |
| 3 or 4 Children | 0 (0.0%) | 0 (0.0%) |
| 5 or more Children | 0 (0.0%) | 0 (0.0%) |
| Total | 11 (23.4%) | 0 (0.0%) |
Race in Stoney Point
The most populous races in Stoney Point are White / Caucasian (107 | 51.2%), Native / Alaskan (85 | 40.7%), and Two or more Races (17 | 8.1%).
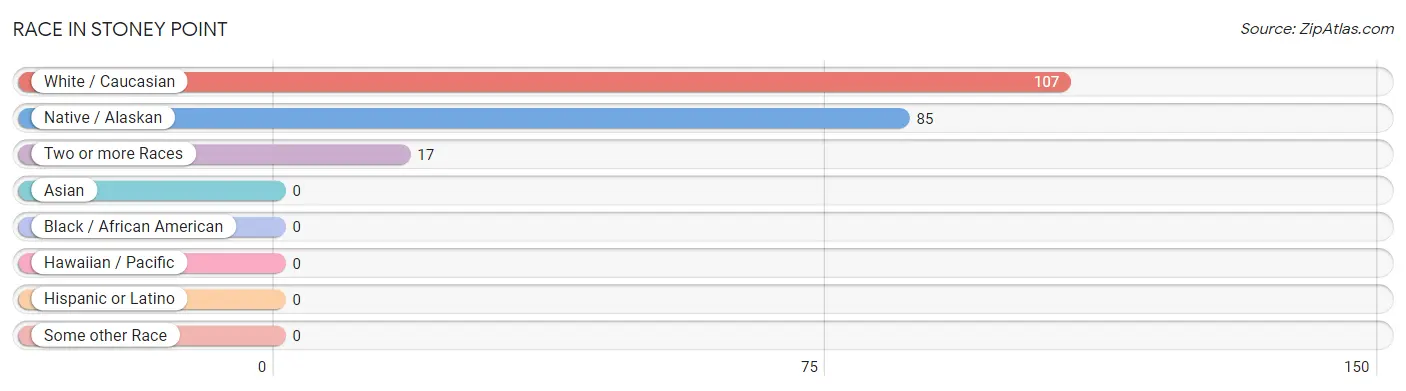
| Race | # Population | % Population |
| Asian | 0 | 0.0% |
| Black / African American | 0 | 0.0% |
| Hawaiian / Pacific | 0 | 0.0% |
| Hispanic or Latino | 0 | 0.0% |
| Native / Alaskan | 85 | 40.7% |
| White / Caucasian | 107 | 51.2% |
| Two or more Races | 17 | 8.1% |
| Some other Race | 0 | 0.0% |
| Total | 209 | 100.0% |
Ancestry in Stoney Point
The most populous ancestries reported in Stoney Point are Cherokee (65 | 31.1%), American (22 | 10.5%), German (14 | 6.7%), Irish (13 | 6.2%), and Choctaw (7 | 3.4%), together accounting for 57.9% of all Stoney Point residents.
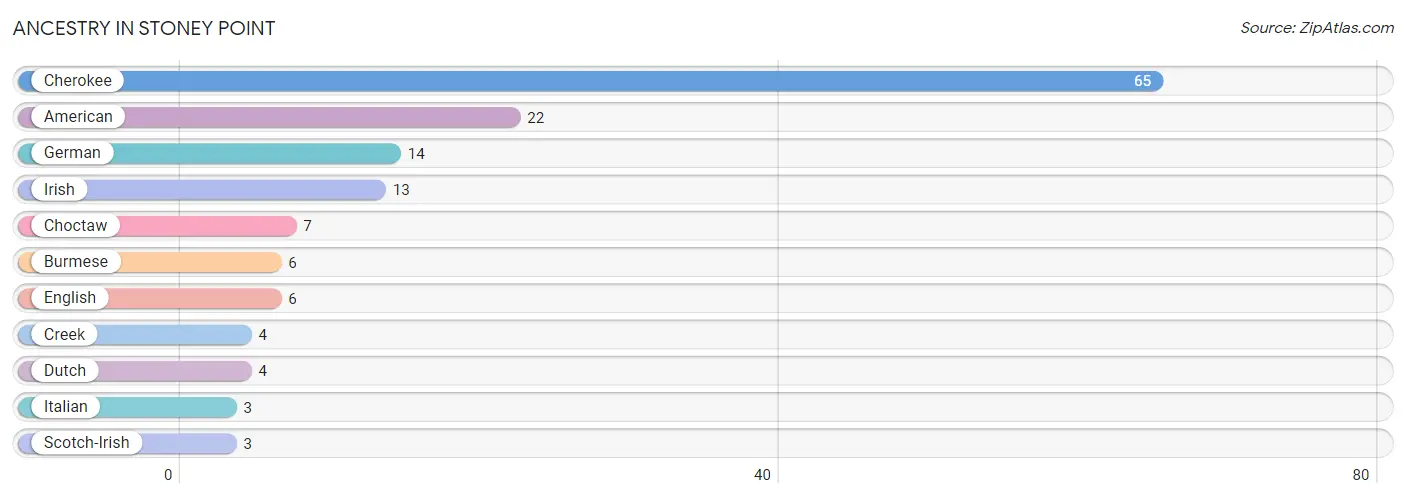
| Ancestry | # Population | % Population |
| American | 22 | 10.5% |
| Burmese | 6 | 2.9% |
| Cherokee | 65 | 31.1% |
| Choctaw | 7 | 3.4% |
| Creek | 4 | 1.9% |
| Dutch | 4 | 1.9% |
| English | 6 | 2.9% |
| German | 14 | 6.7% |
| Irish | 13 | 6.2% |
| Italian | 3 | 1.4% |
| Scotch-Irish | 3 | 1.4% | View All 11 Rows |
Immigrants in Stoney Point

| Immigration Origin | # Population | % Population | View All 0 Rows |
Sex and Age in Stoney Point
Sex and Age in Stoney Point
The most populous age groups in Stoney Point are 35 to 39 Years (12 | 14.5%) for men and 10 to 14 Years (18 | 14.3%) for women.
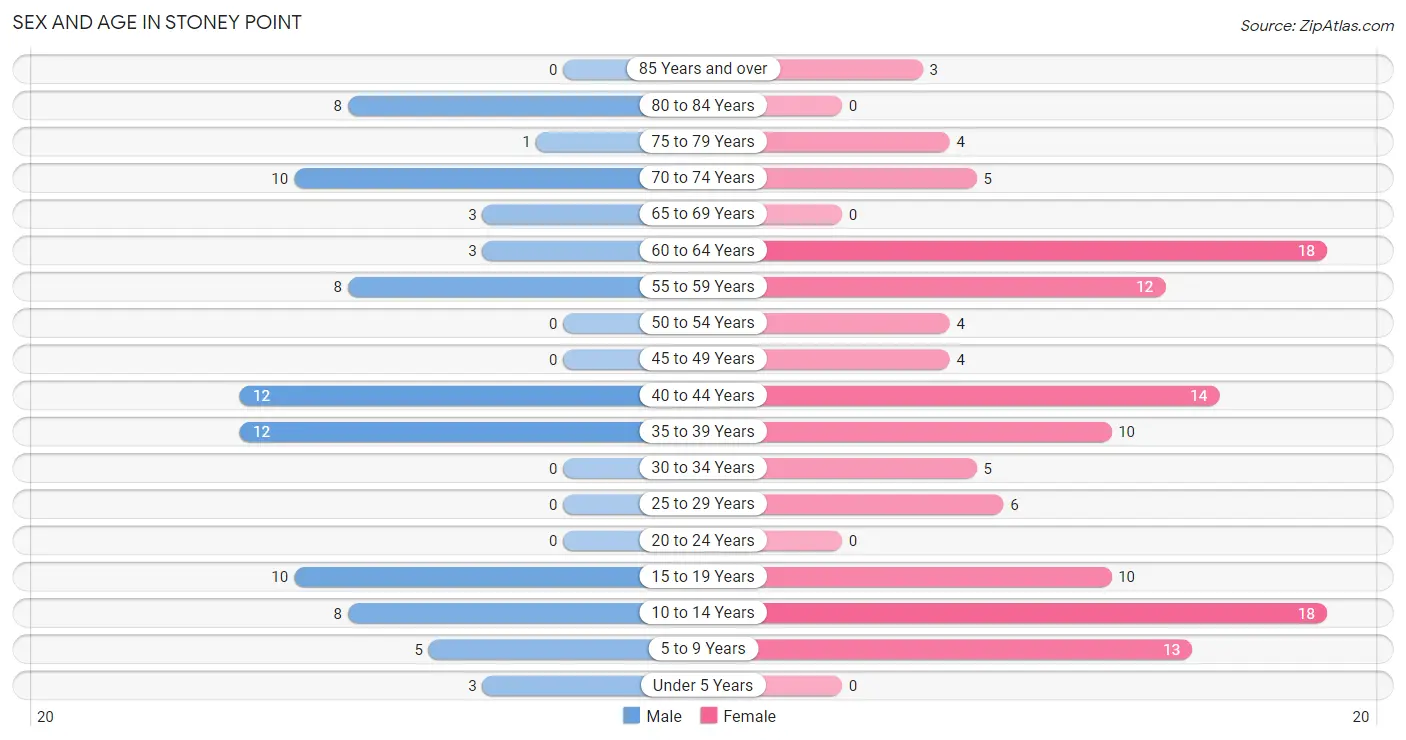
| Age Bracket | Male | Female |
| Under 5 Years | 3 (3.6%) | 0 (0.0%) |
| 5 to 9 Years | 5 (6.0%) | 13 (10.3%) |
| 10 to 14 Years | 8 (9.6%) | 18 (14.3%) |
| 15 to 19 Years | 10 (12.0%) | 10 (7.9%) |
| 20 to 24 Years | 0 (0.0%) | 0 (0.0%) |
| 25 to 29 Years | 0 (0.0%) | 6 (4.8%) |
| 30 to 34 Years | 0 (0.0%) | 5 (4.0%) |
| 35 to 39 Years | 12 (14.5%) | 10 (7.9%) |
| 40 to 44 Years | 12 (14.5%) | 14 (11.1%) |
| 45 to 49 Years | 0 (0.0%) | 4 (3.2%) |
| 50 to 54 Years | 0 (0.0%) | 4 (3.2%) |
| 55 to 59 Years | 8 (9.6%) | 12 (9.5%) |
| 60 to 64 Years | 3 (3.6%) | 18 (14.3%) |
| 65 to 69 Years | 3 (3.6%) | 0 (0.0%) |
| 70 to 74 Years | 10 (12.0%) | 5 (4.0%) |
| 75 to 79 Years | 1 (1.2%) | 4 (3.2%) |
| 80 to 84 Years | 8 (9.6%) | 0 (0.0%) |
| 85 Years and over | 0 (0.0%) | 3 (2.4%) |
| Total | 83 (100.0%) | 126 (100.0%) |
Families and Households in Stoney Point
Median Family Size in Stoney Point
The median family size in Stoney Point is 3.07 persons per family, with married-couple families (47 | 82.5%) accounting for the largest median family size of 3.28 persons per family. On the other hand, single male/father families (4 | 7.0%) represent the smallest median family size with 2.00 persons per family.
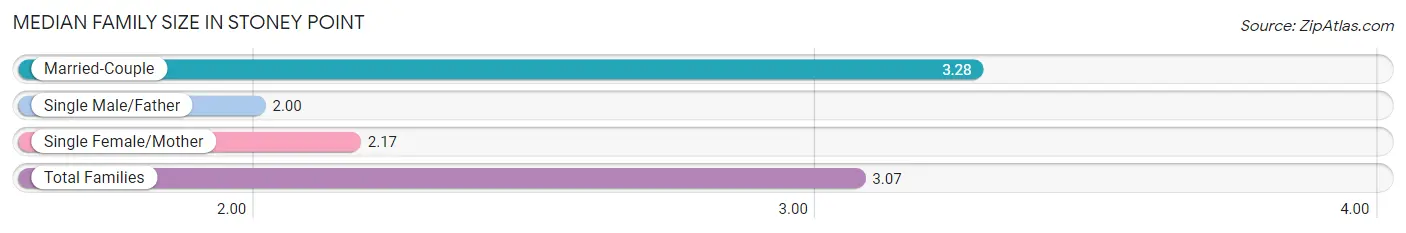
| Family Type | # Families | Family Size |
| Married-Couple | 47 (82.5%) | 3.28 |
| Single Male/Father | 4 (7.0%) | 2.00 |
| Single Female/Mother | 6 (10.5%) | 2.17 |
| Total Families | 57 (100.0%) | 3.07 |
Median Household Size in Stoney Point
The median household size in Stoney Point is 2.40 persons per household, with married-couple households (47 | 54.0%) accounting for the largest median household size of 3.28 persons per household. non-family households (30 | 34.5%) represent the smallest median household size with 1.13 persons per household.
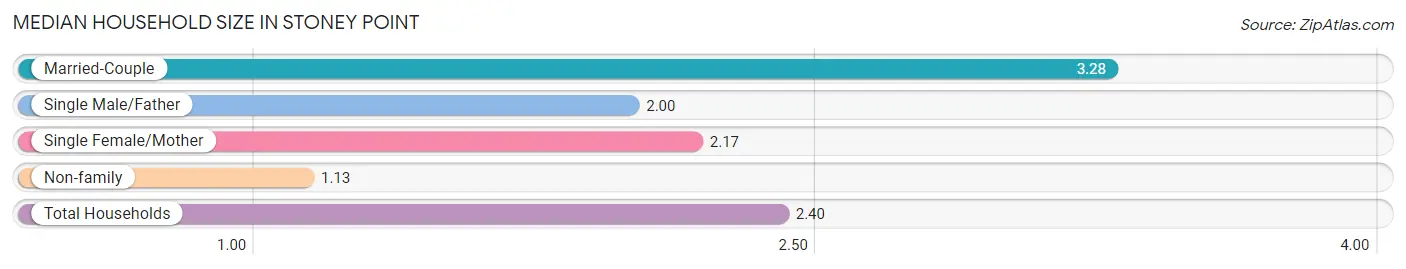
| Household Type | # Households | Household Size |
| Married-Couple | 47 (54.0%) | 3.28 |
| Single Male/Father | 4 (4.6%) | 2.00 |
| Single Female/Mother | 6 (6.9%) | 2.17 |
| Non-family | 30 (34.5%) | 1.13 |
| Total Households | 87 (100.0%) | 2.40 |
Household Size by Marriage Status in Stoney Point
Out of a total of 87 households in Stoney Point, 57 (65.5%) are family households, while 30 (34.5%) are nonfamily households. The most numerous type of family households are 2-person households, comprising 31, and the most common type of nonfamily households are 1-person households, comprising 26.
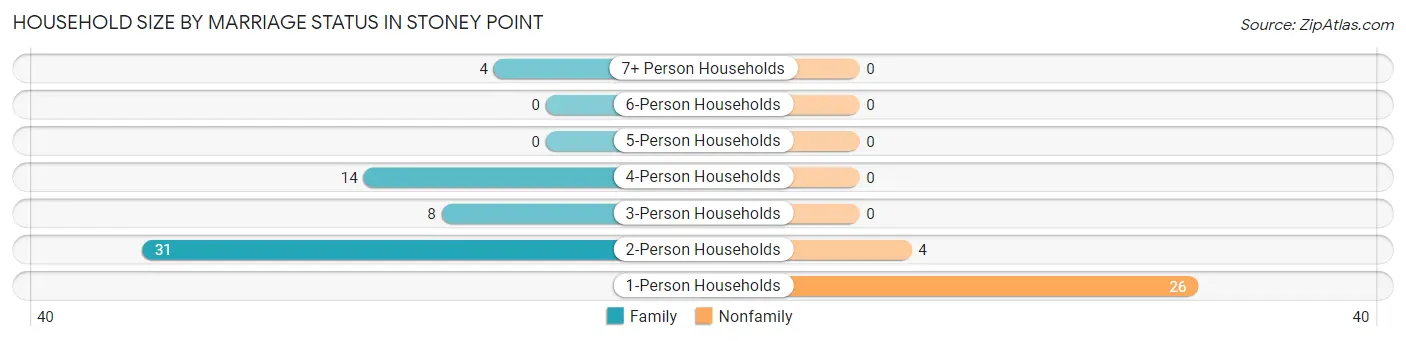
| Household Size | Family Households | Nonfamily Households |
| 1-Person Households | - | 26 (29.9%) |
| 2-Person Households | 31 (35.6%) | 4 (4.6%) |
| 3-Person Households | 8 (9.2%) | 0 (0.0%) |
| 4-Person Households | 14 (16.1%) | 0 (0.0%) |
| 5-Person Households | 0 (0.0%) | 0 (0.0%) |
| 6-Person Households | 0 (0.0%) | 0 (0.0%) |
| 7+ Person Households | 4 (4.6%) | 0 (0.0%) |
| Total | 57 (65.5%) | 30 (34.5%) |
Female Fertility in Stoney Point
Fertility by Age in Stoney Point
Average fertility rate in Stoney Point is 102.0 births per 1,000 women. Women in the age bracket of 35 to 50 years have the highest fertility rate with 179.0 births per 1,000 women. Women in the age bracket of 35 to 50 years acount for 100.0% of all women with births.
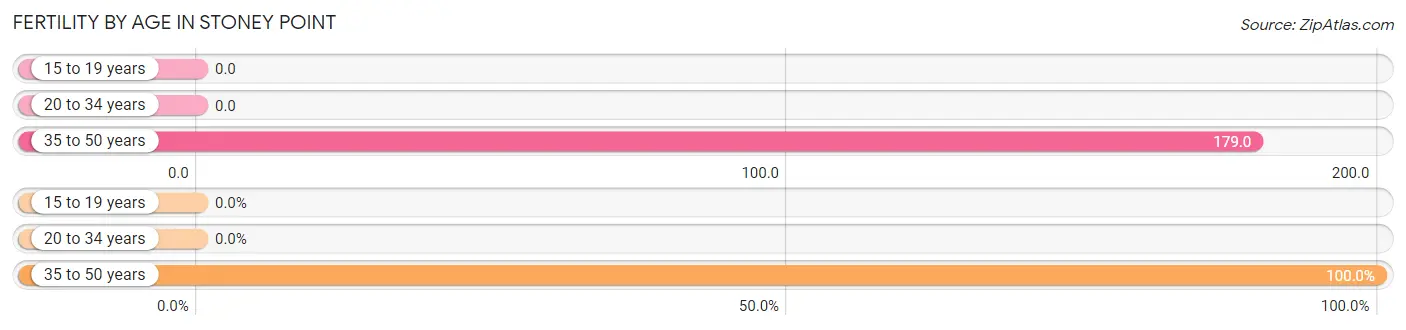
| Age Bracket | Women with Births | Births / 1,000 Women |
| 15 to 19 years | 0 (0.0%) | 0.0 |
| 20 to 34 years | 0 (0.0%) | 0.0 |
| 35 to 50 years | 5 (100.0%) | 179.0 |
| Total | 5 (100.0%) | 102.0 |
Fertility by Age by Marriage Status in Stoney Point
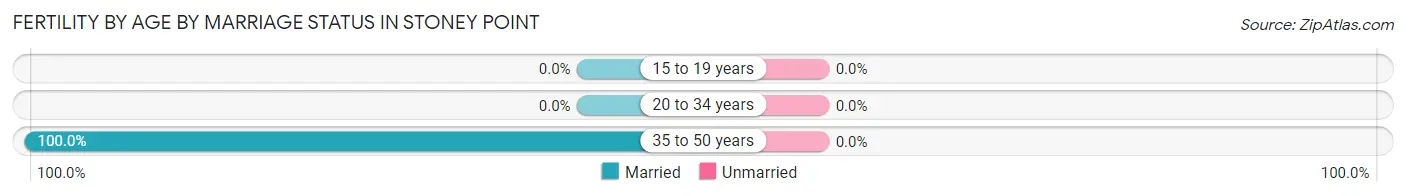
| Age Bracket | Married | Unmarried |
| 15 to 19 years | 0 (0.0%) | 0 (0.0%) |
| 20 to 34 years | 0 (0.0%) | 0 (0.0%) |
| 35 to 50 years | 5 (100.0%) | 0 (0.0%) |
| Total | 5 (100.0%) | 0 (0.0%) |
Fertility by Education in Stoney Point
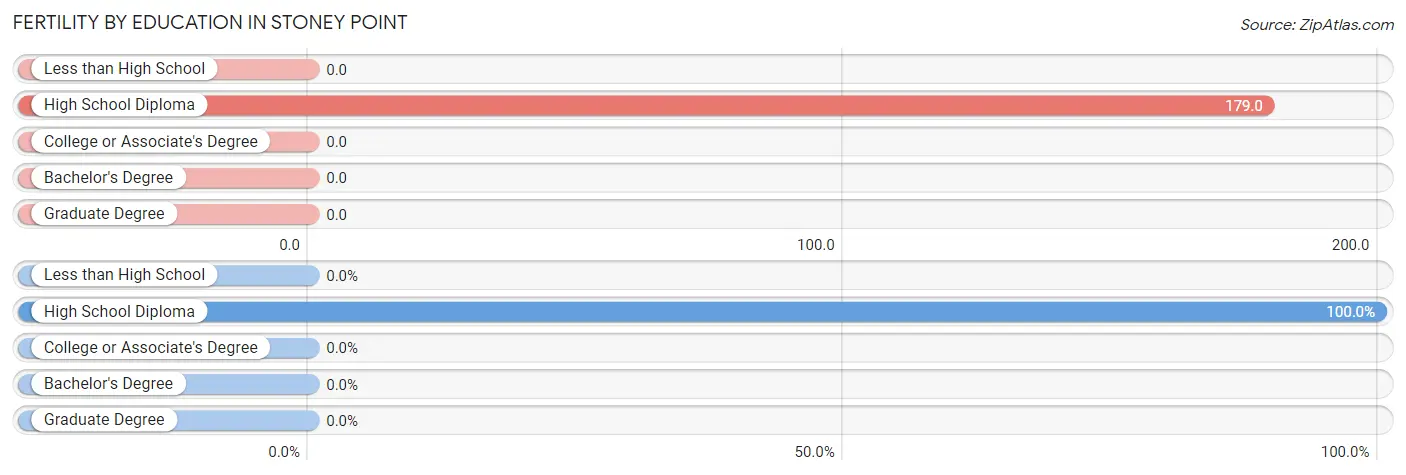
| Educational Attainment | Women with Births | Births / 1,000 Women |
| Less than High School | 0 (0.0%) | 0.0 |
| High School Diploma | 5 (100.0%) | 179.0 |
| College or Associate's Degree | 0 (0.0%) | 0.0 |
| Bachelor's Degree | 0 (0.0%) | 0.0 |
| Graduate Degree | 0 (0.0%) | 0.0 |
| Total | 5 (100.0%) | 102.0 |
Fertility by Education by Marriage Status in Stoney Point
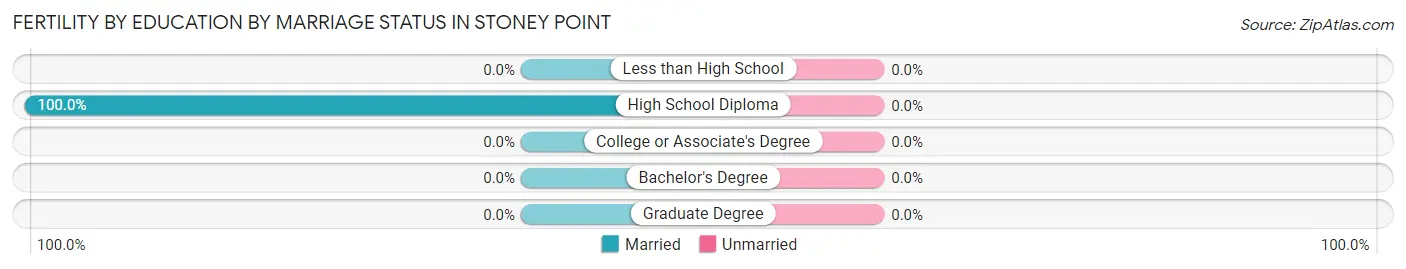
| Educational Attainment | Married | Unmarried |
| Less than High School | 0 (0.0%) | 0 (0.0%) |
| High School Diploma | 5 (100.0%) | 0 (0.0%) |
| College or Associate's Degree | 0 (0.0%) | 0 (0.0%) |
| Bachelor's Degree | 0 (0.0%) | 0 (0.0%) |
| Graduate Degree | 0 (0.0%) | 0 (0.0%) |
| Total | 5 (100.0%) | 0 (0.0%) |
Employment Characteristics in Stoney Point
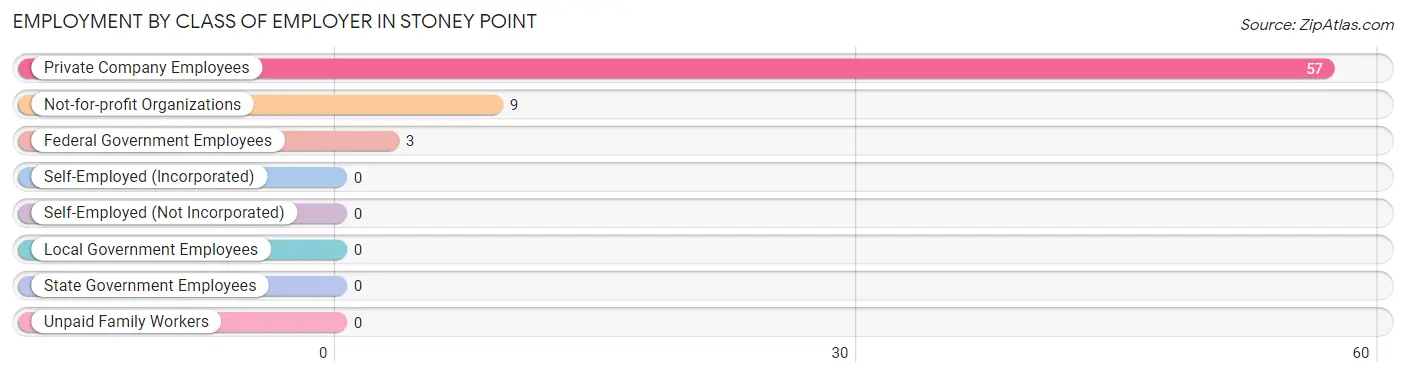
Employment by Class of Employer in Stoney Point
Among the 69 employed individuals in Stoney Point, private company employees (57 | 82.6%), not-for-profit organizations (9 | 13.0%), and federal government employees (3 | 4.3%) make up the most common classes of employment.
| Employer Class | # Employees | % Employees |
| Private Company Employees | 57 | 82.6% |
| Self-Employed (Incorporated) | 0 | 0.0% |
| Self-Employed (Not Incorporated) | 0 | 0.0% |
| Not-for-profit Organizations | 9 | 13.0% |
| Local Government Employees | 0 | 0.0% |
| State Government Employees | 0 | 0.0% |
| Federal Government Employees | 3 | 4.3% |
| Unpaid Family Workers | 0 | 0.0% |
| Total | 69 | 100.0% |
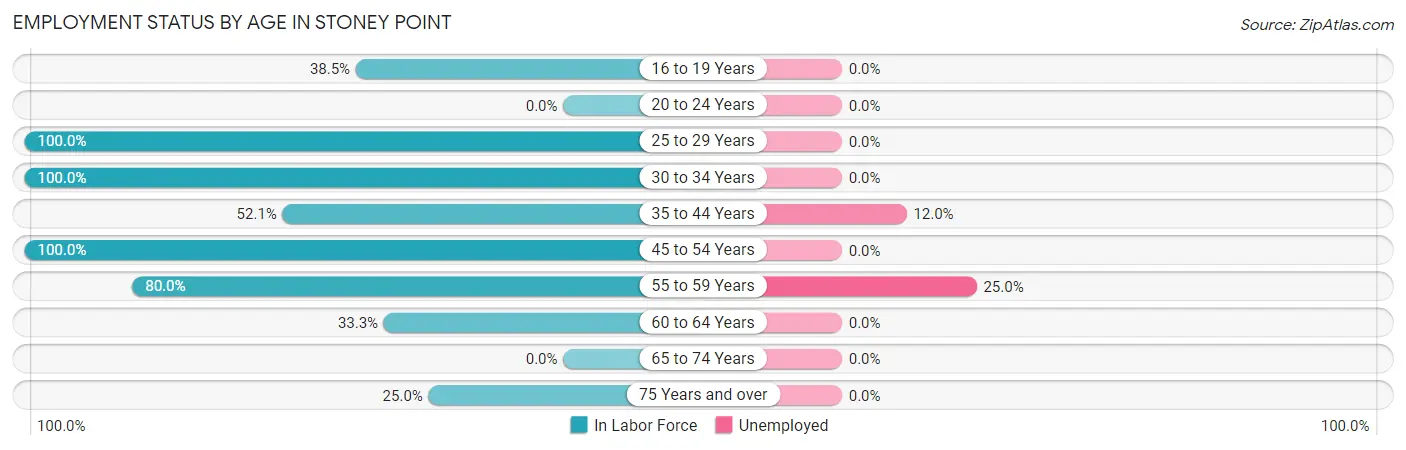
Employment Status by Age in Stoney Point
According to the labor force statistics for Stoney Point, out of the total population over 16 years of age (155), 49.0% or 76 individuals are in the labor force, with 9.2% or 7 of them unemployed. The age group with the highest labor force participation rate is 25 to 29 years, with 100.0% or 6 individuals in the labor force. Within the labor force, the 55 to 59 years age range has the highest percentage of unemployed individuals, with 25.0% or 4 of them being unemployed.
| Age Bracket | In Labor Force | Unemployed |
| 16 to 19 Years | 5 (38.5%) | 0 (0.0%) |
| 20 to 24 Years | 0 (0.0%) | 0 (0.0%) |
| 25 to 29 Years | 6 (100.0%) | 0 (0.0%) |
| 30 to 34 Years | 5 (100.0%) | 0 (0.0%) |
| 35 to 44 Years | 25 (52.1%) | 3 (12.0%) |
| 45 to 54 Years | 8 (100.0%) | 0 (0.0%) |
| 55 to 59 Years | 16 (80.0%) | 4 (25.0%) |
| 60 to 64 Years | 7 (33.3%) | 0 (0.0%) |
| 65 to 74 Years | 0 (0.0%) | 0 (0.0%) |
| 75 Years and over | 4 (25.0%) | 0 (0.0%) |
| Total | 76 (49.0%) | 7 (9.2%) |
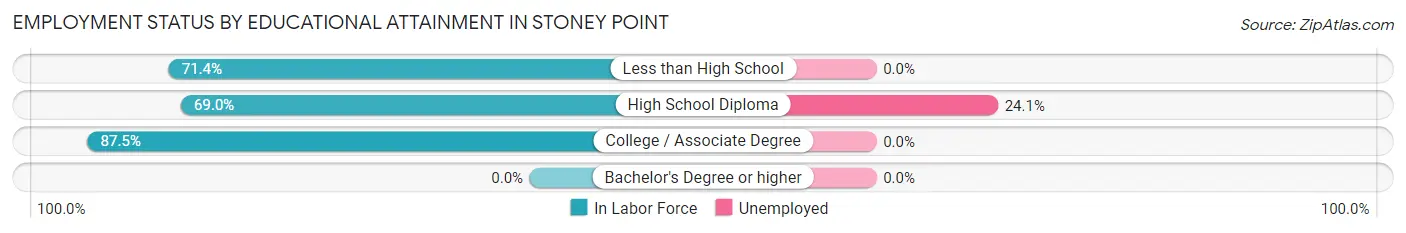
Employment Status by Educational Attainment in Stoney Point
According to labor force statistics for Stoney Point, 62.0% of individuals (67) out of the total population between 25 and 64 years of age (108) are in the labor force, with 10.4% or 7 of them being unemployed. The group with the highest labor force participation rate are those with the educational attainment of college / associate degree, with 87.5% or 28 individuals in the labor force. Within the labor force, individuals with high school diploma education have the highest percentage of unemployment, with 24.1% or 7 of them being unemployed.
| Educational Attainment | In Labor Force | Unemployed |
| Less than High School | 10 (71.4%) | 0 (0.0%) |
| High School Diploma | 29 (69.0%) | 10 (24.1%) |
| College / Associate Degree | 28 (87.5%) | 0 (0.0%) |
| Bachelor's Degree or higher | 0 (0.0%) | 0 (0.0%) |
| Total | 67 (62.0%) | 11 (10.4%) |
Employment Occupations by Sex in Stoney Point
Management, Business, Science and Arts Occupations
The most common Management, Business, Science and Arts occupations in Stoney Point are Management (15 | 21.7%), Health Diagnosing & Treating (9 | 13.0%), Community & Social Service (5 | 7.2%), and Education, Arts & Media (5 | 7.2%).
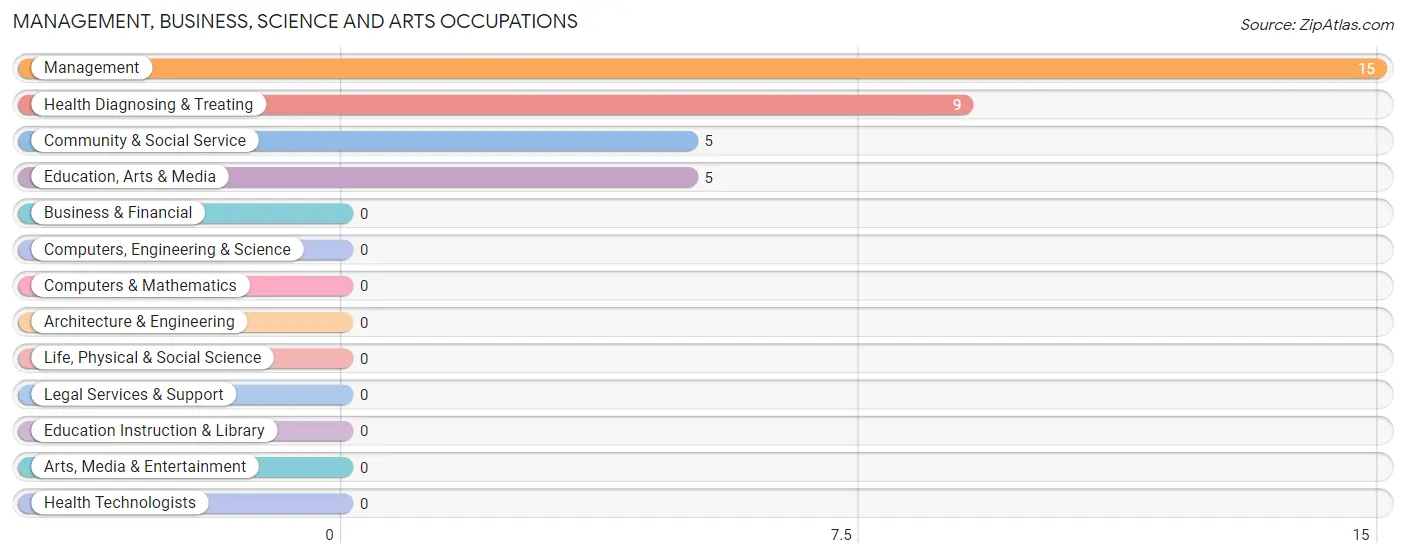
Management, Business, Science and Arts Occupations by Sex
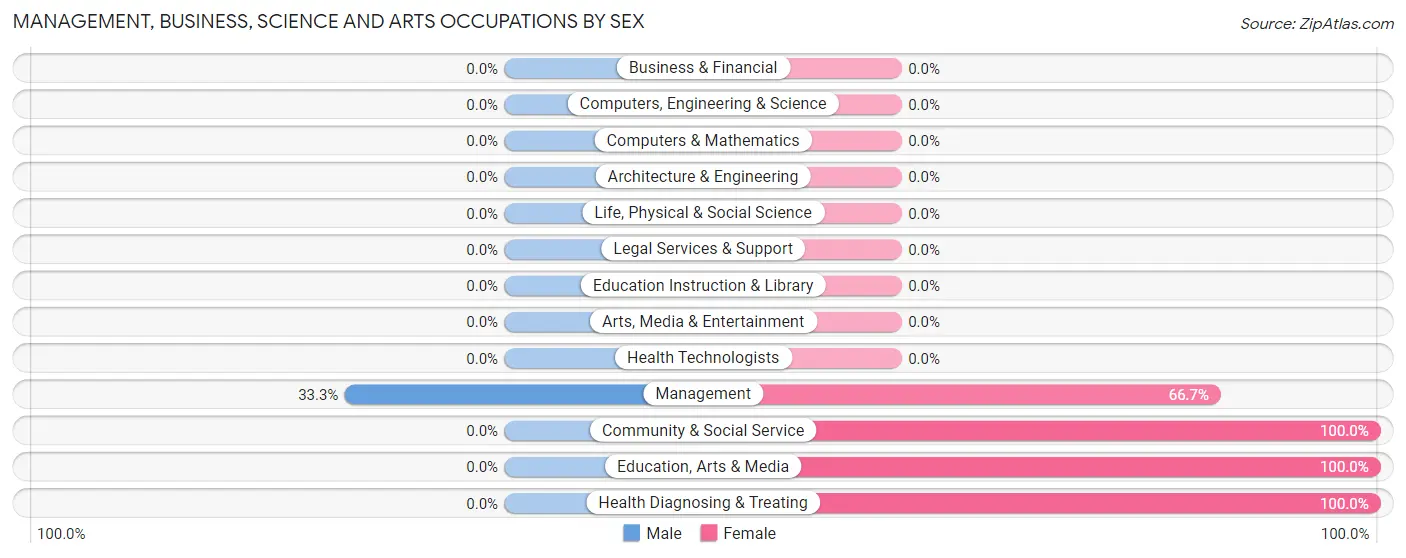
| Occupation | Male | Female |
| Management | 5 (33.3%) | 10 (66.7%) |
| Business & Financial | 0 (0.0%) | 0 (0.0%) |
| Computers, Engineering & Science | 0 (0.0%) | 0 (0.0%) |
| Computers & Mathematics | 0 (0.0%) | 0 (0.0%) |
| Architecture & Engineering | 0 (0.0%) | 0 (0.0%) |
| Life, Physical & Social Science | 0 (0.0%) | 0 (0.0%) |
| Community & Social Service | 0 (0.0%) | 5 (100.0%) |
| Education, Arts & Media | 0 (0.0%) | 5 (100.0%) |
| Legal Services & Support | 0 (0.0%) | 0 (0.0%) |
| Education Instruction & Library | 0 (0.0%) | 0 (0.0%) |
| Arts, Media & Entertainment | 0 (0.0%) | 0 (0.0%) |
| Health Diagnosing & Treating | 0 (0.0%) | 9 (100.0%) |
| Health Technologists | 0 (0.0%) | 0 (0.0%) |
| Total (Category) | 5 (17.2%) | 24 (82.8%) |
| Total (Overall) | 17 (24.6%) | 52 (75.4%) |
Services Occupations
The most common Services occupations in Stoney Point are Food Preparation & Serving (9 | 13.0%), Cleaning & Maintenance (9 | 13.0%), Personal Care & Service (5 | 7.2%), and Healthcare Support (3 | 4.3%).
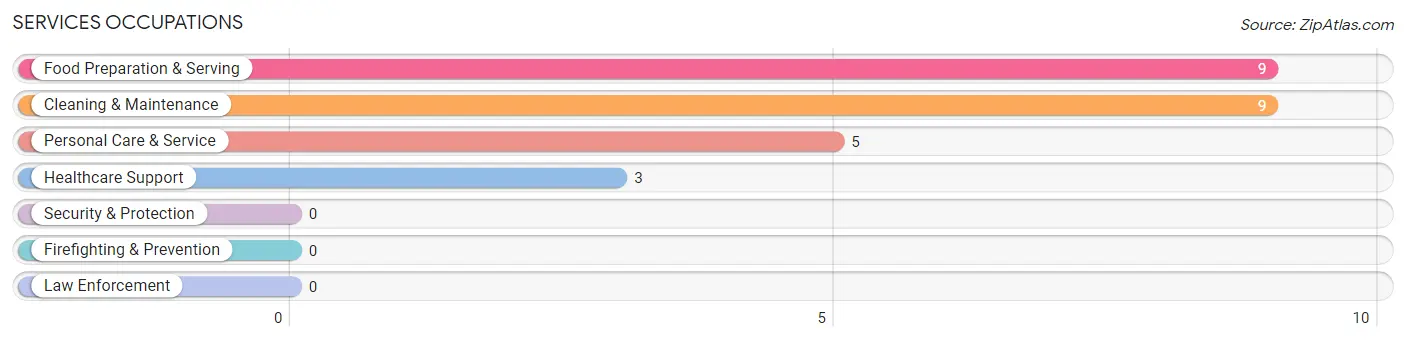
Services Occupations by Sex
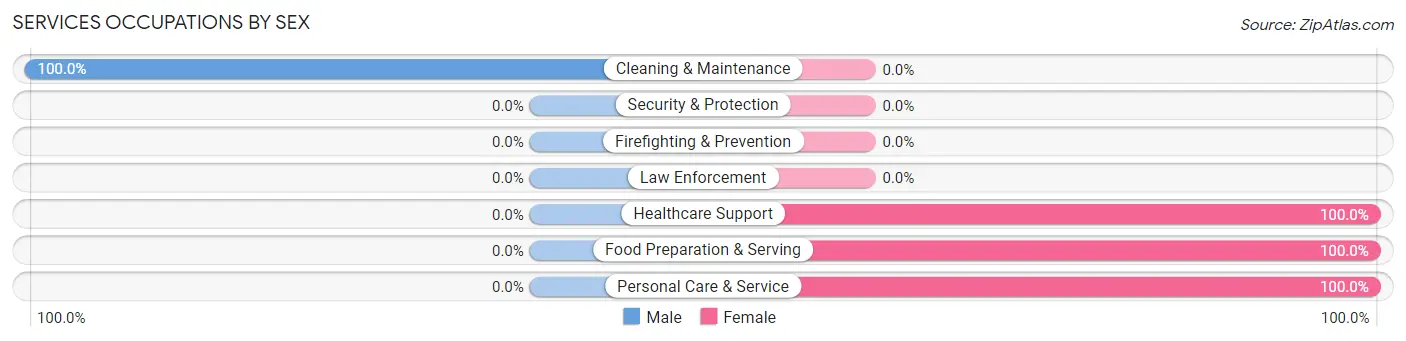
| Occupation | Male | Female |
| Healthcare Support | 0 (0.0%) | 3 (100.0%) |
| Security & Protection | 0 (0.0%) | 0 (0.0%) |
| Firefighting & Prevention | 0 (0.0%) | 0 (0.0%) |
| Law Enforcement | 0 (0.0%) | 0 (0.0%) |
| Food Preparation & Serving | 0 (0.0%) | 9 (100.0%) |
| Cleaning & Maintenance | 9 (100.0%) | 0 (0.0%) |
| Personal Care & Service | 0 (0.0%) | 5 (100.0%) |
| Total (Category) | 9 (34.6%) | 17 (65.4%) |
| Total (Overall) | 17 (24.6%) | 52 (75.4%) |
Sales and Office Occupations
The most common Sales and Office occupations in Stoney Point are , and Office & Administration (11 | 15.9%).
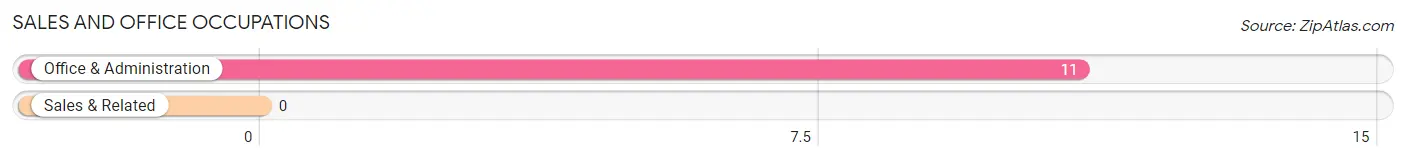
Sales and Office Occupations by Sex
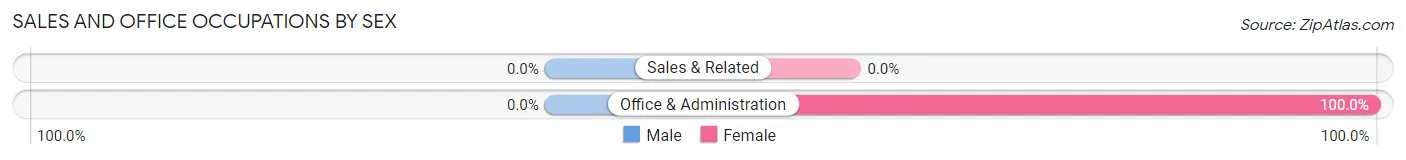
| Occupation | Male | Female |
| Sales & Related | 0 (0.0%) | 0 (0.0%) |
| Office & Administration | 0 (0.0%) | 11 (100.0%) |
| Total (Category) | 0 (0.0%) | 11 (100.0%) |
| Total (Overall) | 17 (24.6%) | 52 (75.4%) |
Natural Resources, Construction and Maintenance Occupations
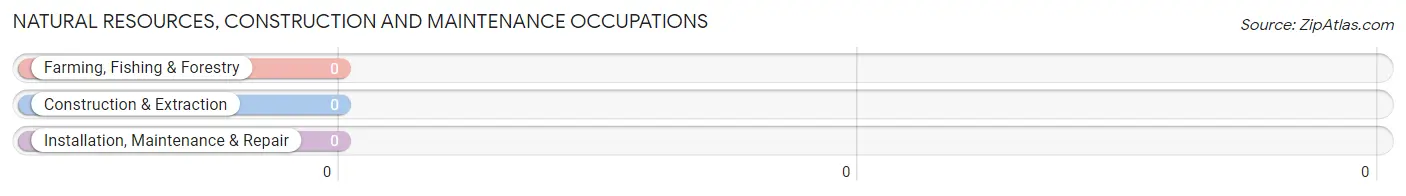
Natural Resources, Construction and Maintenance Occupations by Sex
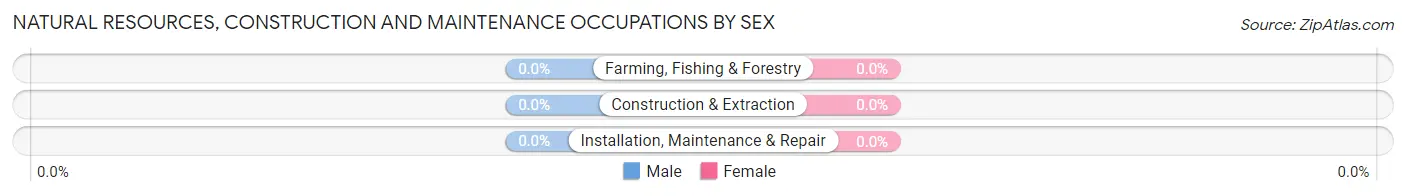
| Occupation | Male | Female |
| Farming, Fishing & Forestry | 0 (0.0%) | 0 (0.0%) |
| Construction & Extraction | 0 (0.0%) | 0 (0.0%) |
| Installation, Maintenance & Repair | 0 (0.0%) | 0 (0.0%) |
| Total (Category) | 0 (0.0%) | 0 (0.0%) |
| Total (Overall) | 17 (24.6%) | 52 (75.4%) |
Production, Transportation and Moving Occupations
The most common Production, Transportation and Moving occupations in Stoney Point are , and Transportation (3 | 4.3%).
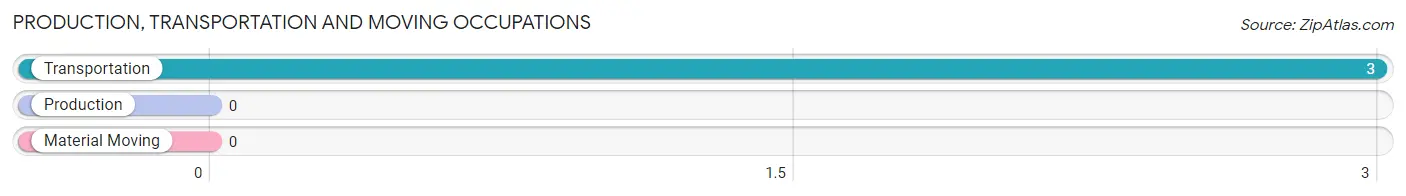
Production, Transportation and Moving Occupations by Sex
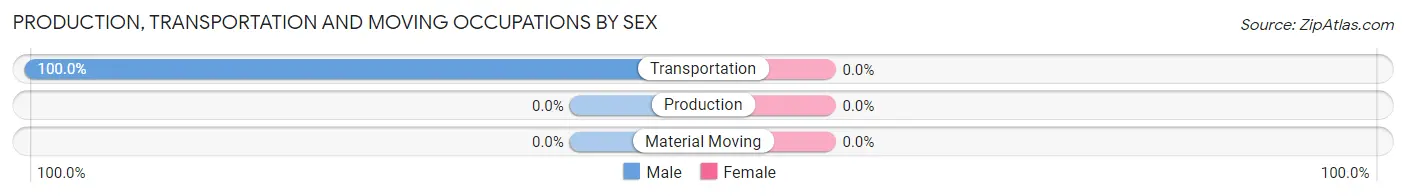
| Occupation | Male | Female |
| Production | 0 (0.0%) | 0 (0.0%) |
| Transportation | 3 (100.0%) | 0 (0.0%) |
| Material Moving | 0 (0.0%) | 0 (0.0%) |
| Total (Category) | 3 (100.0%) | 0 (0.0%) |
| Total (Overall) | 17 (24.6%) | 52 (75.4%) |
Employment Industries by Sex in Stoney Point
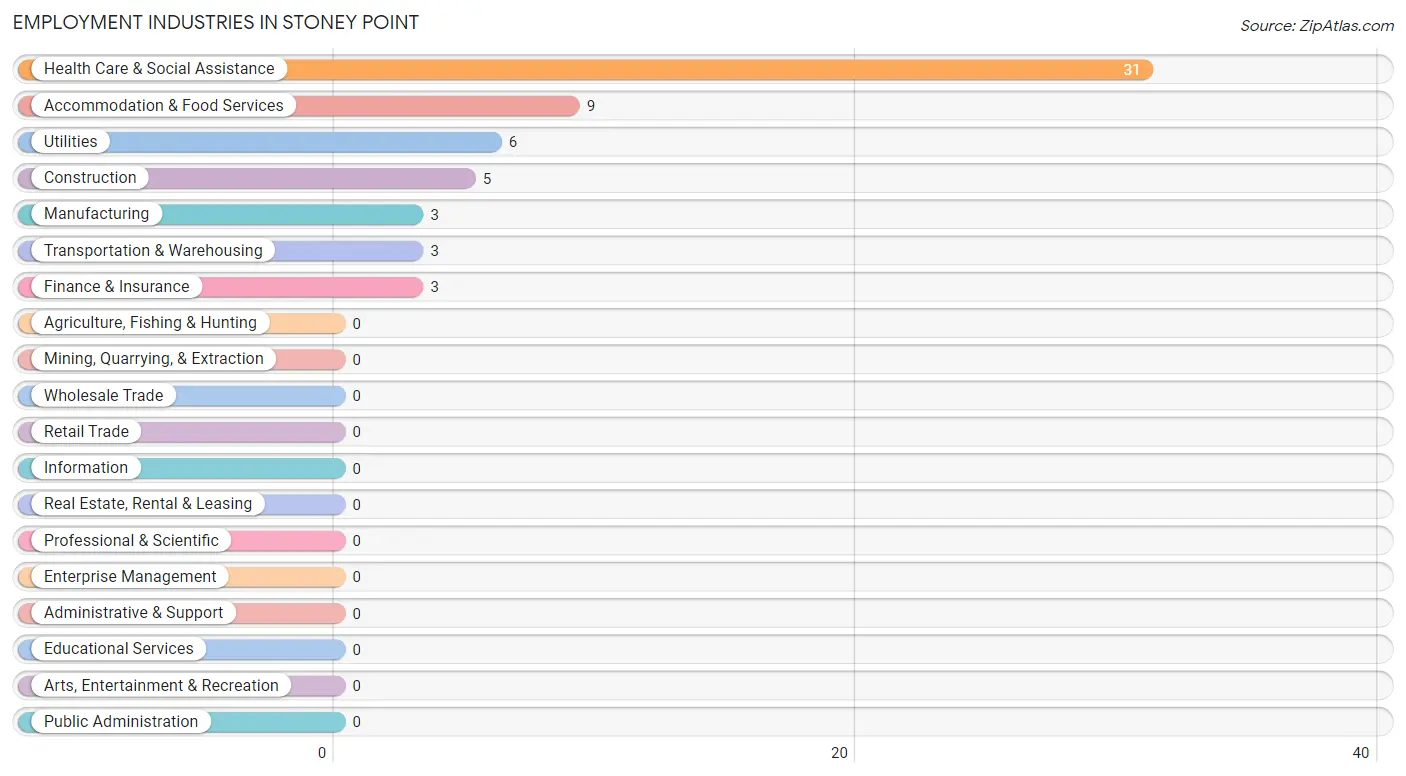
Employment Industries in Stoney Point
The major employment industries in Stoney Point include Health Care & Social Assistance (31 | 44.9%), Accommodation & Food Services (9 | 13.0%), Utilities (6 | 8.7%), Construction (5 | 7.2%), and Manufacturing (3 | 4.3%).
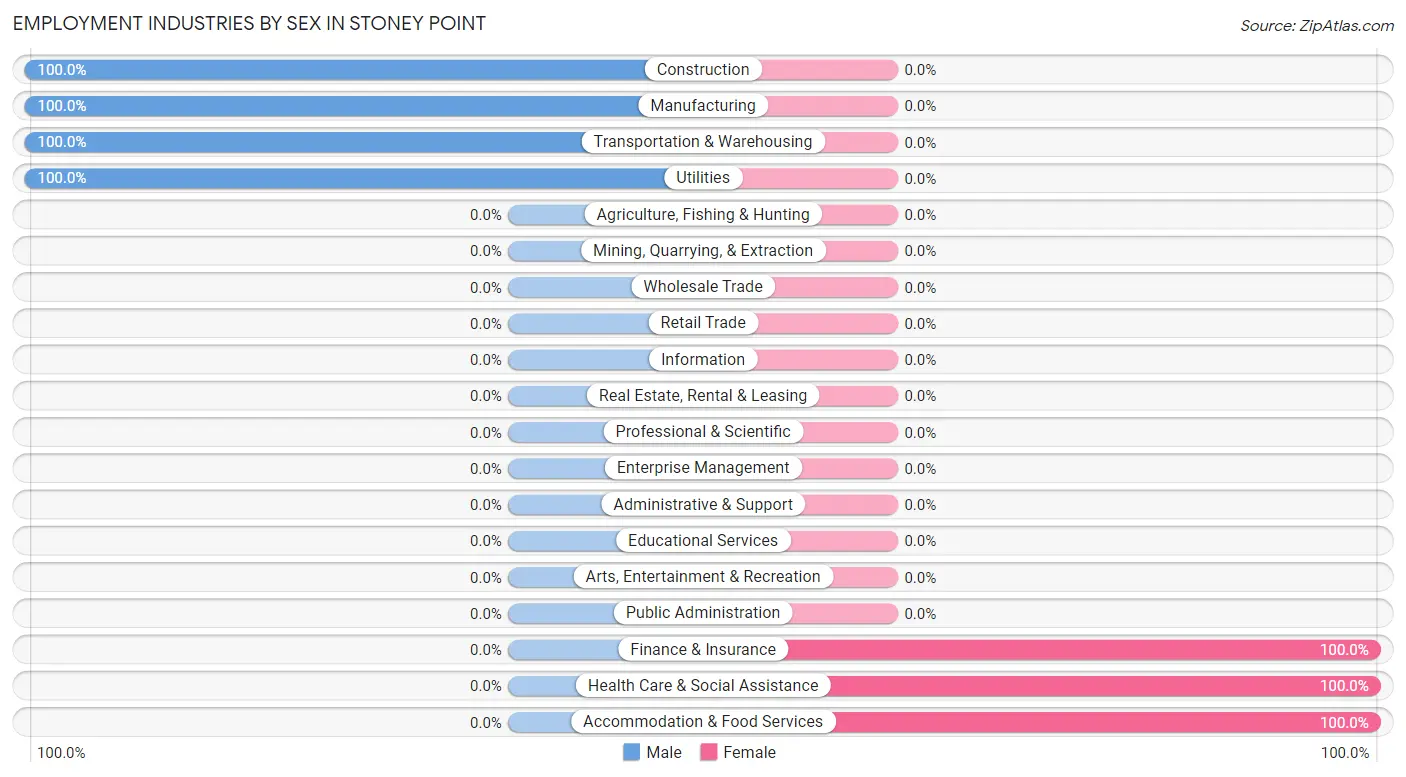
Employment Industries by Sex in Stoney Point
The Stoney Point industries that see more men than women are Construction (100.0%), Manufacturing (100.0%), and Transportation & Warehousing (100.0%), whereas the industries that tend to have a higher number of women are Finance & Insurance (100.0%), Health Care & Social Assistance (100.0%), and Accommodation & Food Services (100.0%).
| Industry | Male | Female |
| Agriculture, Fishing & Hunting | 0 (0.0%) | 0 (0.0%) |
| Mining, Quarrying, & Extraction | 0 (0.0%) | 0 (0.0%) |
| Construction | 5 (100.0%) | 0 (0.0%) |
| Manufacturing | 3 (100.0%) | 0 (0.0%) |
| Wholesale Trade | 0 (0.0%) | 0 (0.0%) |
| Retail Trade | 0 (0.0%) | 0 (0.0%) |
| Transportation & Warehousing | 3 (100.0%) | 0 (0.0%) |
| Utilities | 6 (100.0%) | 0 (0.0%) |
| Information | 0 (0.0%) | 0 (0.0%) |
| Finance & Insurance | 0 (0.0%) | 3 (100.0%) |
| Real Estate, Rental & Leasing | 0 (0.0%) | 0 (0.0%) |
| Professional & Scientific | 0 (0.0%) | 0 (0.0%) |
| Enterprise Management | 0 (0.0%) | 0 (0.0%) |
| Administrative & Support | 0 (0.0%) | 0 (0.0%) |
| Educational Services | 0 (0.0%) | 0 (0.0%) |
| Health Care & Social Assistance | 0 (0.0%) | 31 (100.0%) |
| Arts, Entertainment & Recreation | 0 (0.0%) | 0 (0.0%) |
| Accommodation & Food Services | 0 (0.0%) | 9 (100.0%) |
| Public Administration | 0 (0.0%) | 0 (0.0%) |
| Total | 17 (24.6%) | 52 (75.4%) |
Education in Stoney Point
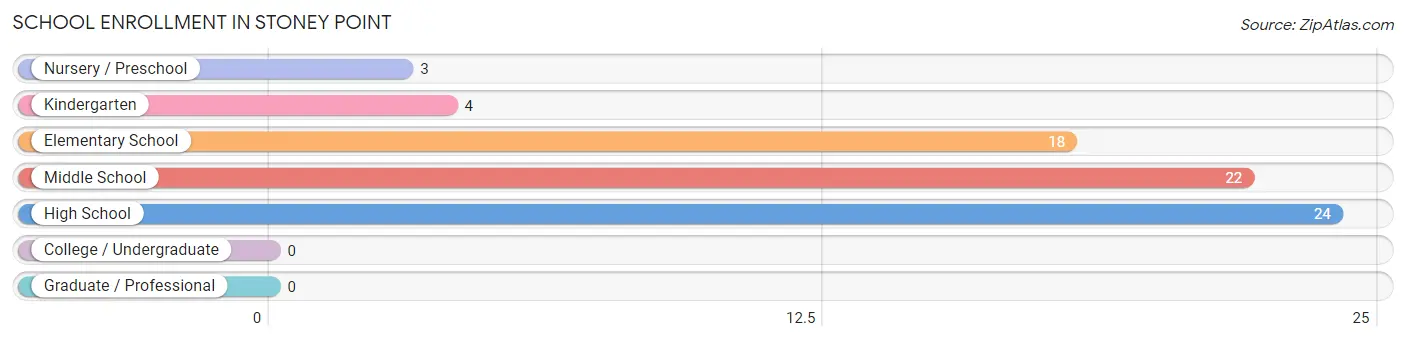
School Enrollment in Stoney Point
The most common levels of schooling among the 71 students in Stoney Point are high school (24 | 33.8%), middle school (22 | 31.0%), and elementary school (18 | 25.4%).
| School Level | # Students | % Students |
| Nursery / Preschool | 3 | 4.2% |
| Kindergarten | 4 | 5.6% |
| Elementary School | 18 | 25.4% |
| Middle School | 22 | 31.0% |
| High School | 24 | 33.8% |
| College / Undergraduate | 0 | 0.0% |
| Graduate / Professional | 0 | 0.0% |
| Total | 71 | 100.0% |
School Enrollment by Age by Funding Source in Stoney Point
Out of a total of 71 students who are enrolled in schools in Stoney Point, 3 (4.2%) attend a private institution, while the remaining 68 (95.8%) are enrolled in public schools. The age group of 3 to 4 year olds has the highest likelihood of being enrolled in private schools, with 3 (100.0% in the age bracket) enrolled. Conversely, the age group of 5 to 9 year old has the lowest likelihood of being enrolled in a private school, with 18 (100.0% in the age bracket) attending a public institution.
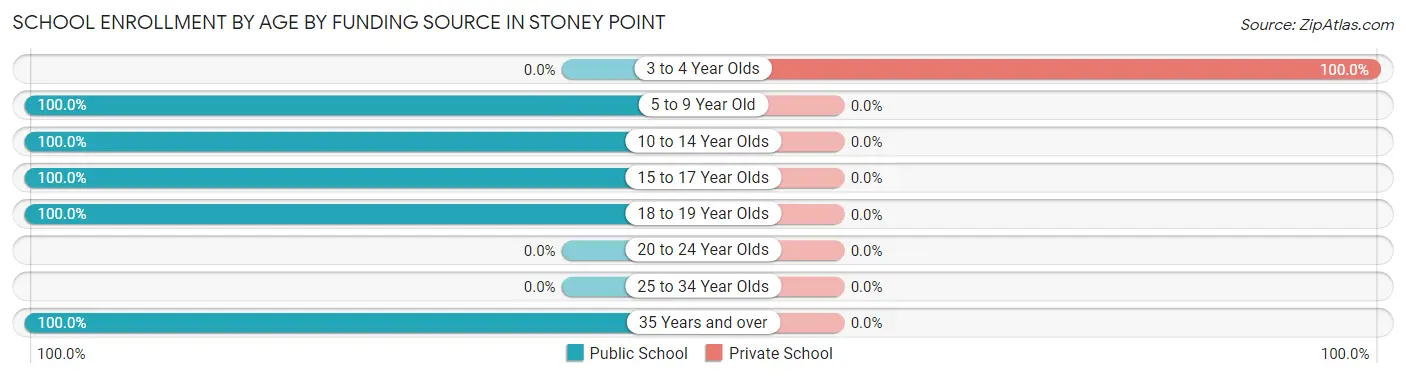
| Age Bracket | Public School | Private School |
| 3 to 4 Year Olds | 0 (0.0%) | 3 (100.0%) |
| 5 to 9 Year Old | 18 (100.0%) | 0 (0.0%) |
| 10 to 14 Year Olds | 26 (100.0%) | 0 (0.0%) |
| 15 to 17 Year Olds | 15 (100.0%) | 0 (0.0%) |
| 18 to 19 Year Olds | 5 (100.0%) | 0 (0.0%) |
| 20 to 24 Year Olds | 0 (0.0%) | 0 (0.0%) |
| 25 to 34 Year Olds | 0 (0.0%) | 0 (0.0%) |
| 35 Years and over | 4 (100.0%) | 0 (0.0%) |
| Total | 68 (95.8%) | 3 (4.2%) |
Educational Attainment by Field of Study in Stoney Point
Education (18 | 64.3%), liberal arts & history (6 | 21.4%), and visual & performing arts (4 | 14.3%) are the most common fields of study among 28 individuals in Stoney Point who have obtained a bachelor's degree or higher.
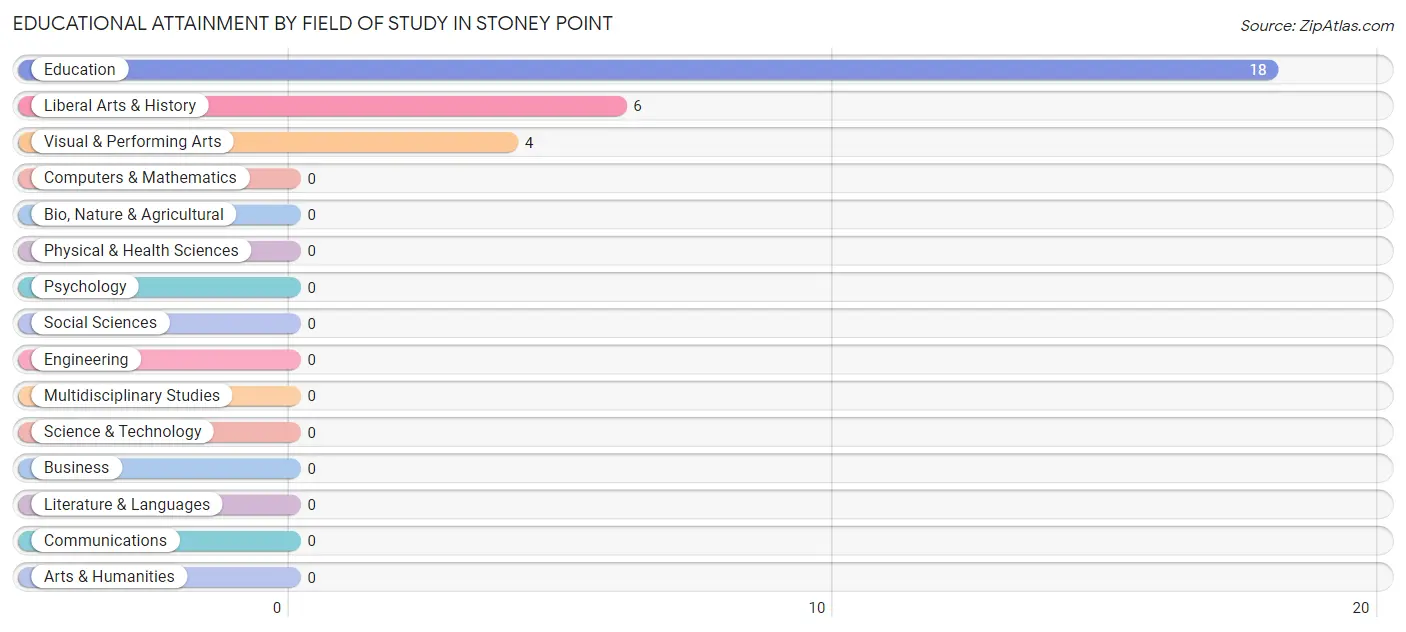
| Field of Study | # Graduates | % Graduates |
| Computers & Mathematics | 0 | 0.0% |
| Bio, Nature & Agricultural | 0 | 0.0% |
| Physical & Health Sciences | 0 | 0.0% |
| Psychology | 0 | 0.0% |
| Social Sciences | 0 | 0.0% |
| Engineering | 0 | 0.0% |
| Multidisciplinary Studies | 0 | 0.0% |
| Science & Technology | 0 | 0.0% |
| Business | 0 | 0.0% |
| Education | 18 | 64.3% |
| Literature & Languages | 0 | 0.0% |
| Liberal Arts & History | 6 | 21.4% |
| Visual & Performing Arts | 4 | 14.3% |
| Communications | 0 | 0.0% |
| Arts & Humanities | 0 | 0.0% |
| Total | 28 | 100.0% |
Transportation & Commute in Stoney Point
Vehicle Availability by Sex in Stoney Point
The most prevalent vehicle ownership categories in Stoney Point are males with 3 vehicles (9, accounting for 52.9%) and females with 3 vehicles (11, making up 17.3%).
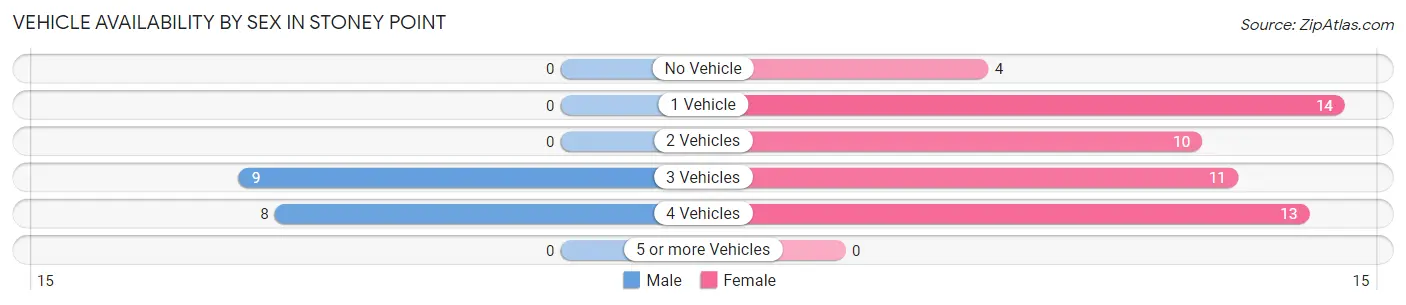
| Vehicles Available | Male | Female |
| No Vehicle | 0 (0.0%) | 4 (7.7%) |
| 1 Vehicle | 0 (0.0%) | 14 (26.9%) |
| 2 Vehicles | 0 (0.0%) | 10 (19.2%) |
| 3 Vehicles | 9 (52.9%) | 11 (21.1%) |
| 4 Vehicles | 8 (47.1%) | 13 (25.0%) |
| 5 or more Vehicles | 0 (0.0%) | 0 (0.0%) |
| Total | 17 (100.0%) | 52 (100.0%) |
Commute Time in Stoney Point
The most frequently occuring commute durations in Stoney Point are 20 to 24 minutes (21 commuters, 30.4%), 30 to 34 minutes (18 commuters, 26.1%), and 45 to 59 minutes (10 commuters, 14.5%).
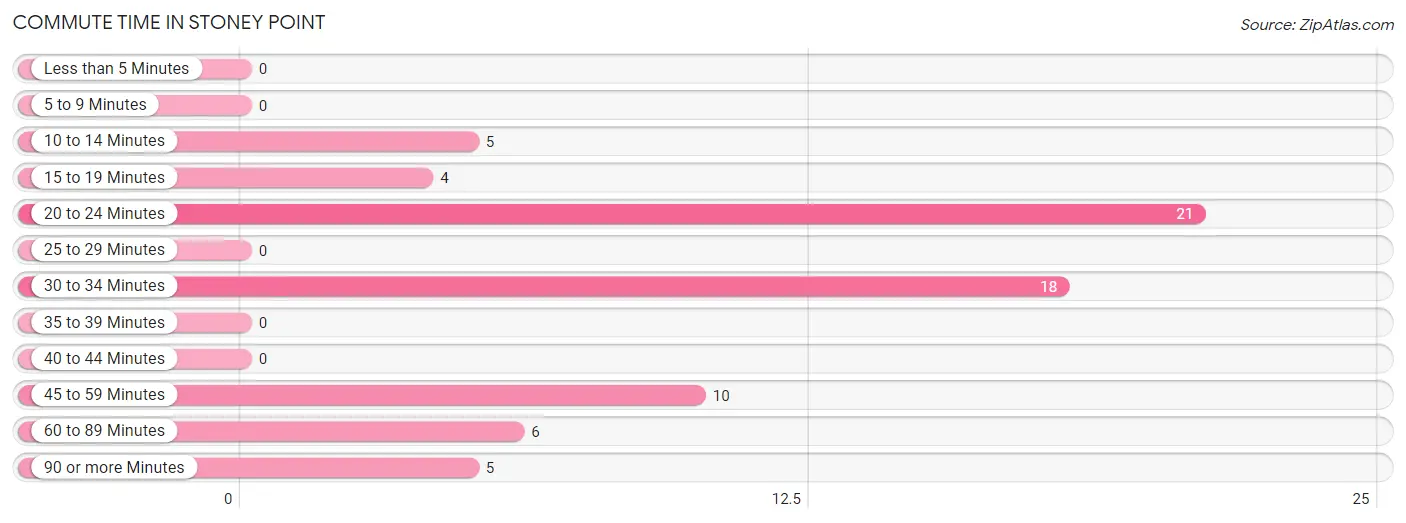
| Commute Time | # Commuters | % Commuters |
| Less than 5 Minutes | 0 | 0.0% |
| 5 to 9 Minutes | 0 | 0.0% |
| 10 to 14 Minutes | 5 | 7.2% |
| 15 to 19 Minutes | 4 | 5.8% |
| 20 to 24 Minutes | 21 | 30.4% |
| 25 to 29 Minutes | 0 | 0.0% |
| 30 to 34 Minutes | 18 | 26.1% |
| 35 to 39 Minutes | 0 | 0.0% |
| 40 to 44 Minutes | 0 | 0.0% |
| 45 to 59 Minutes | 10 | 14.5% |
| 60 to 89 Minutes | 6 | 8.7% |
| 90 or more Minutes | 5 | 7.2% |
Commute Time by Sex in Stoney Point
The most common commute times in Stoney Point are 45 to 59 minutes (6 commuters, 35.3%) for males and 20 to 24 minutes (21 commuters, 40.4%) for females.
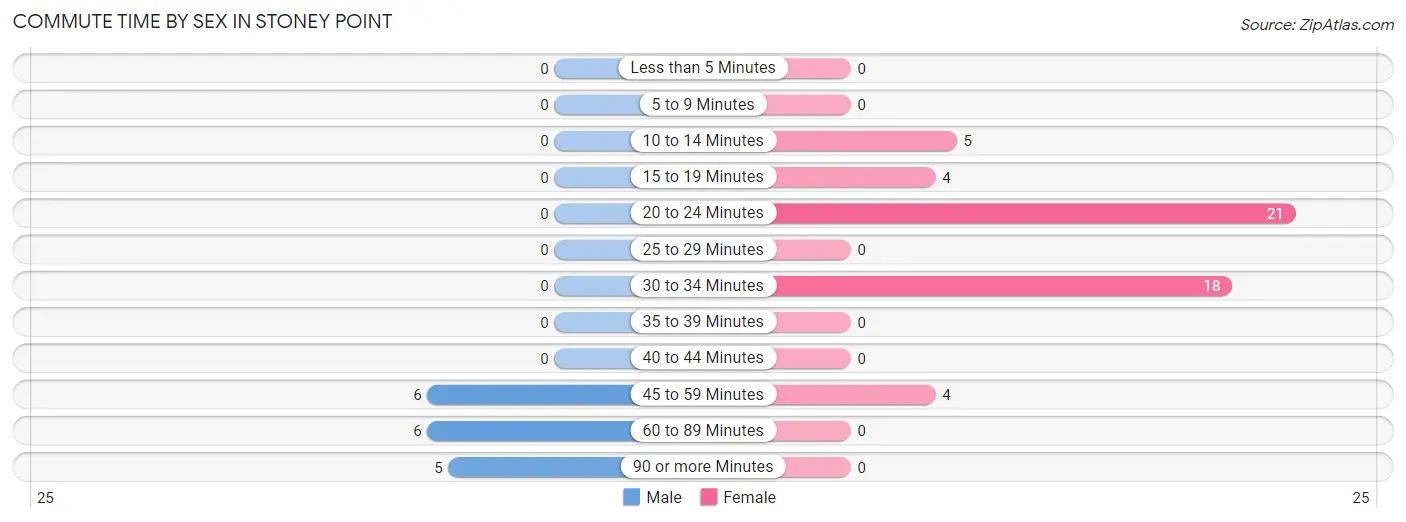
| Commute Time | Male | Female |
| Less than 5 Minutes | 0 (0.0%) | 0 (0.0%) |
| 5 to 9 Minutes | 0 (0.0%) | 0 (0.0%) |
| 10 to 14 Minutes | 0 (0.0%) | 5 (9.6%) |
| 15 to 19 Minutes | 0 (0.0%) | 4 (7.7%) |
| 20 to 24 Minutes | 0 (0.0%) | 21 (40.4%) |
| 25 to 29 Minutes | 0 (0.0%) | 0 (0.0%) |
| 30 to 34 Minutes | 0 (0.0%) | 18 (34.6%) |
| 35 to 39 Minutes | 0 (0.0%) | 0 (0.0%) |
| 40 to 44 Minutes | 0 (0.0%) | 0 (0.0%) |
| 45 to 59 Minutes | 6 (35.3%) | 4 (7.7%) |
| 60 to 89 Minutes | 6 (35.3%) | 0 (0.0%) |
| 90 or more Minutes | 5 (29.4%) | 0 (0.0%) |
Time of Departure to Work by Sex in Stoney Point
The most frequent times of departure to work in Stoney Point are 12:00 AM to 4:59 AM (8, 47.1%) for males and 7:30 AM to 7:59 AM (18, 34.6%) for females.
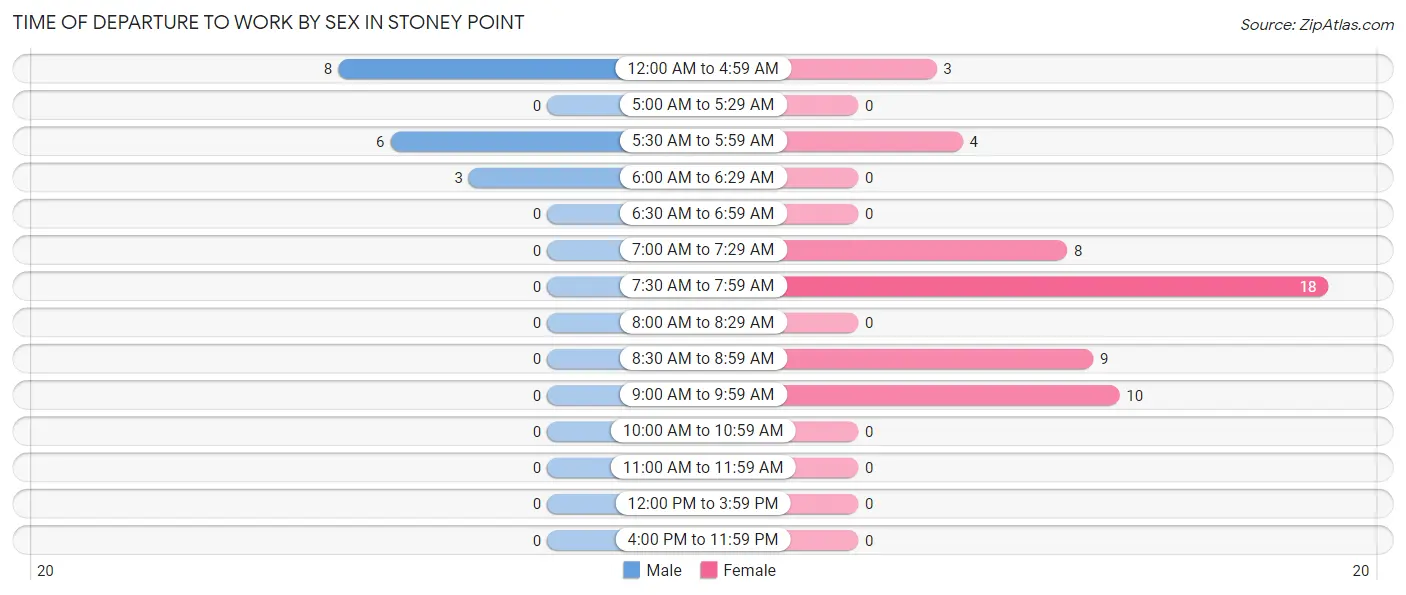
| Time of Departure | Male | Female |
| 12:00 AM to 4:59 AM | 8 (47.1%) | 3 (5.8%) |
| 5:00 AM to 5:29 AM | 0 (0.0%) | 0 (0.0%) |
| 5:30 AM to 5:59 AM | 6 (35.3%) | 4 (7.7%) |
| 6:00 AM to 6:29 AM | 3 (17.6%) | 0 (0.0%) |
| 6:30 AM to 6:59 AM | 0 (0.0%) | 0 (0.0%) |
| 7:00 AM to 7:29 AM | 0 (0.0%) | 8 (15.4%) |
| 7:30 AM to 7:59 AM | 0 (0.0%) | 18 (34.6%) |
| 8:00 AM to 8:29 AM | 0 (0.0%) | 0 (0.0%) |
| 8:30 AM to 8:59 AM | 0 (0.0%) | 9 (17.3%) |
| 9:00 AM to 9:59 AM | 0 (0.0%) | 10 (19.2%) |
| 10:00 AM to 10:59 AM | 0 (0.0%) | 0 (0.0%) |
| 11:00 AM to 11:59 AM | 0 (0.0%) | 0 (0.0%) |
| 12:00 PM to 3:59 PM | 0 (0.0%) | 0 (0.0%) |
| 4:00 PM to 11:59 PM | 0 (0.0%) | 0 (0.0%) |
| Total | 17 (100.0%) | 52 (100.0%) |
Housing Occupancy in Stoney Point
Occupancy by Ownership in Stoney Point
Of the total 87 dwellings in Stoney Point, owner-occupied units account for 78 (89.7%), while renter-occupied units make up 9 (10.3%).
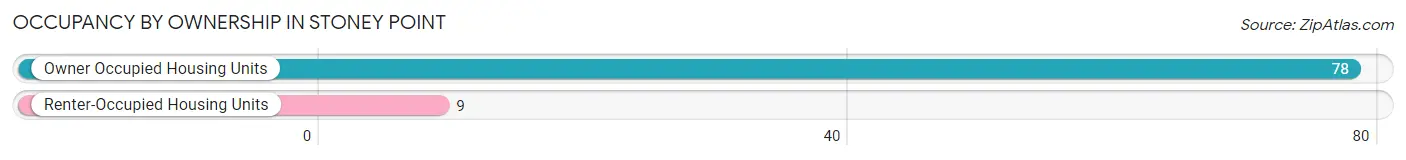
| Occupancy | # Housing Units | % Housing Units |
| Owner Occupied Housing Units | 78 | 89.7% |
| Renter-Occupied Housing Units | 9 | 10.3% |
| Total Occupied Housing Units | 87 | 100.0% |
Occupancy by Household Size in Stoney Point
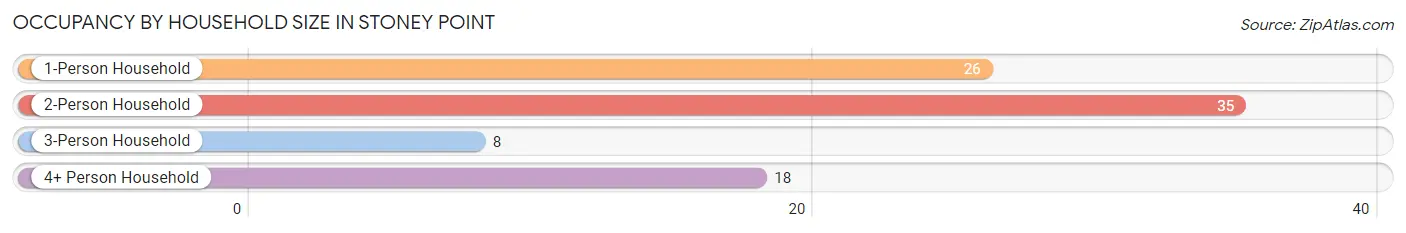
| Household Size | # Housing Units | % Housing Units |
| 1-Person Household | 26 | 29.9% |
| 2-Person Household | 35 | 40.2% |
| 3-Person Household | 8 | 9.2% |
| 4+ Person Household | 18 | 20.7% |
| Total Housing Units | 87 | 100.0% |
Occupancy by Ownership by Household Size in Stoney Point
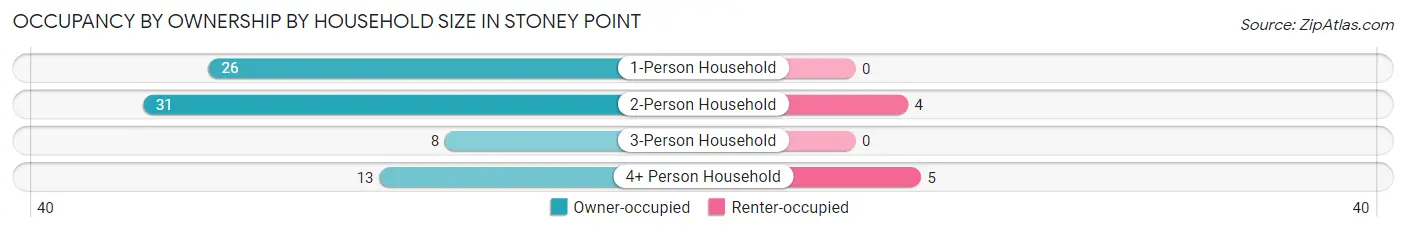
| Household Size | Owner-occupied | Renter-occupied |
| 1-Person Household | 26 (100.0%) | 0 (0.0%) |
| 2-Person Household | 31 (88.6%) | 4 (11.4%) |
| 3-Person Household | 8 (100.0%) | 0 (0.0%) |
| 4+ Person Household | 13 (72.2%) | 5 (27.8%) |
| Total Housing Units | 78 (89.7%) | 9 (10.3%) |
Occupancy by Educational Attainment in Stoney Point
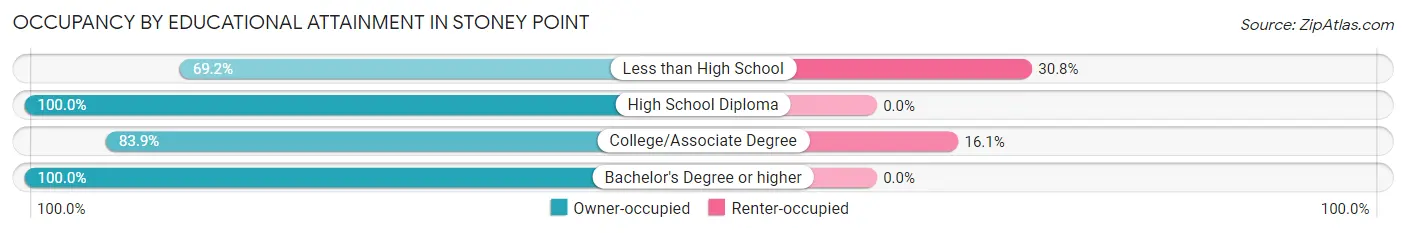
| Household Size | Owner-occupied | Renter-occupied |
| Less than High School | 9 (69.2%) | 4 (30.8%) |
| High School Diploma | 29 (100.0%) | 0 (0.0%) |
| College/Associate Degree | 26 (83.9%) | 5 (16.1%) |
| Bachelor's Degree or higher | 14 (100.0%) | 0 (0.0%) |
Occupancy by Age of Householder in Stoney Point
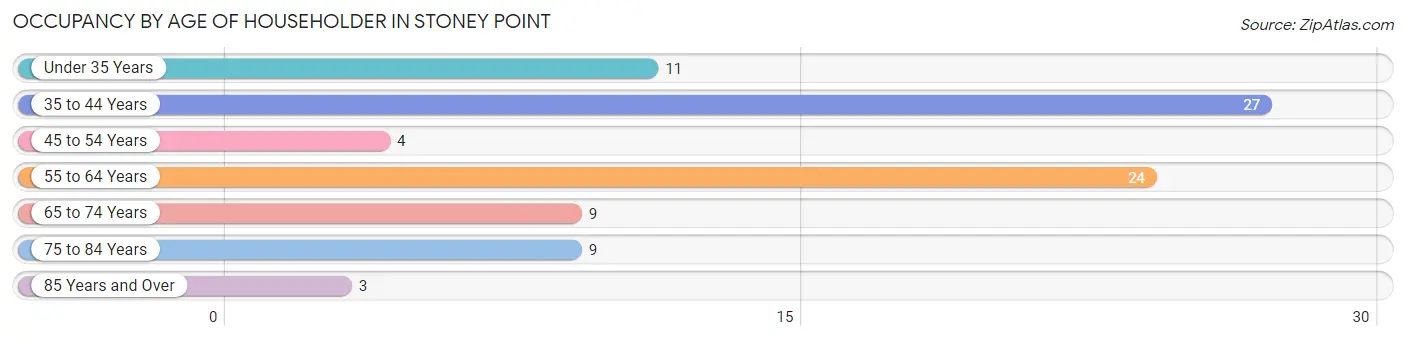
| Age Bracket | # Households | % Households |
| Under 35 Years | 11 | 12.6% |
| 35 to 44 Years | 27 | 31.0% |
| 45 to 54 Years | 4 | 4.6% |
| 55 to 64 Years | 24 | 27.6% |
| 65 to 74 Years | 9 | 10.3% |
| 75 to 84 Years | 9 | 10.3% |
| 85 Years and Over | 3 | 3.5% |
| Total | 87 | 100.0% |
Housing Finances in Stoney Point
Median Income by Occupancy in Stoney Point
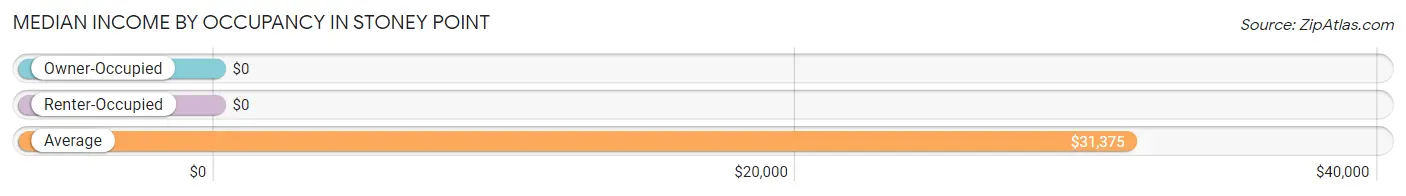
| Occupancy Type | # Households | Median Income |
| Owner-Occupied | 78 (89.7%) | $0 |
| Renter-Occupied | 9 (10.3%) | $0 |
| Average | 87 (100.0%) | $31,375 |
Occupancy by Householder Income Bracket in Stoney Point
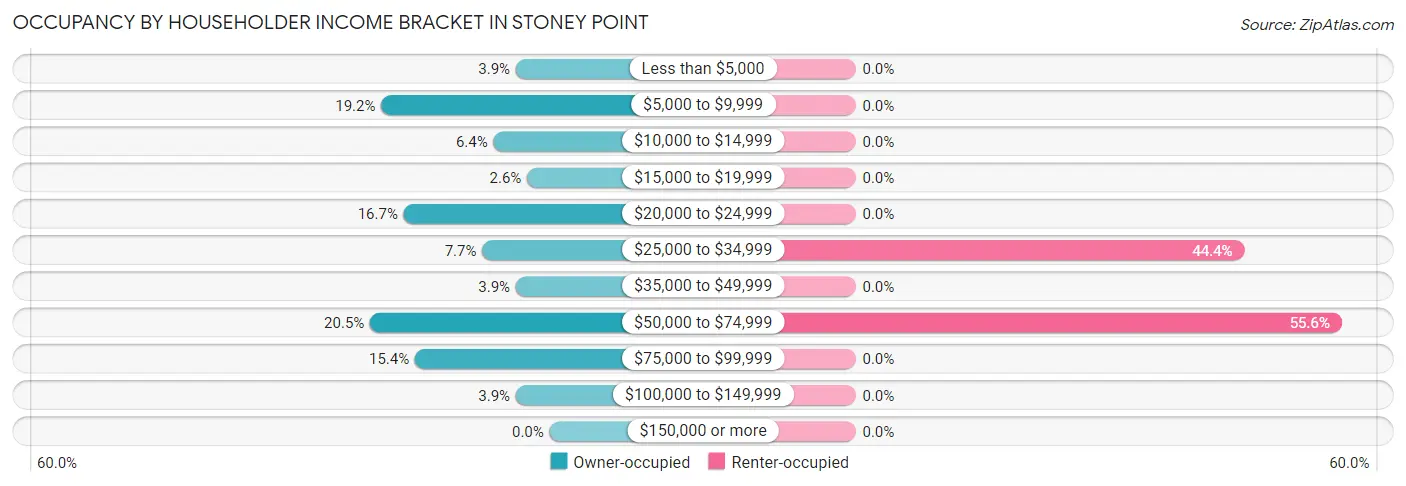
| Income Bracket | Owner-occupied | Renter-occupied |
| Less than $5,000 | 3 (3.8%) | 0 (0.0%) |
| $5,000 to $9,999 | 15 (19.2%) | 0 (0.0%) |
| $10,000 to $14,999 | 5 (6.4%) | 0 (0.0%) |
| $15,000 to $19,999 | 2 (2.6%) | 0 (0.0%) |
| $20,000 to $24,999 | 13 (16.7%) | 0 (0.0%) |
| $25,000 to $34,999 | 6 (7.7%) | 4 (44.4%) |
| $35,000 to $49,999 | 3 (3.8%) | 0 (0.0%) |
| $50,000 to $74,999 | 16 (20.5%) | 5 (55.6%) |
| $75,000 to $99,999 | 12 (15.4%) | 0 (0.0%) |
| $100,000 to $149,999 | 3 (3.8%) | 0 (0.0%) |
| $150,000 or more | 0 (0.0%) | 0 (0.0%) |
| Total | 78 (100.0%) | 9 (100.0%) |
Monthly Housing Cost Tiers in Stoney Point
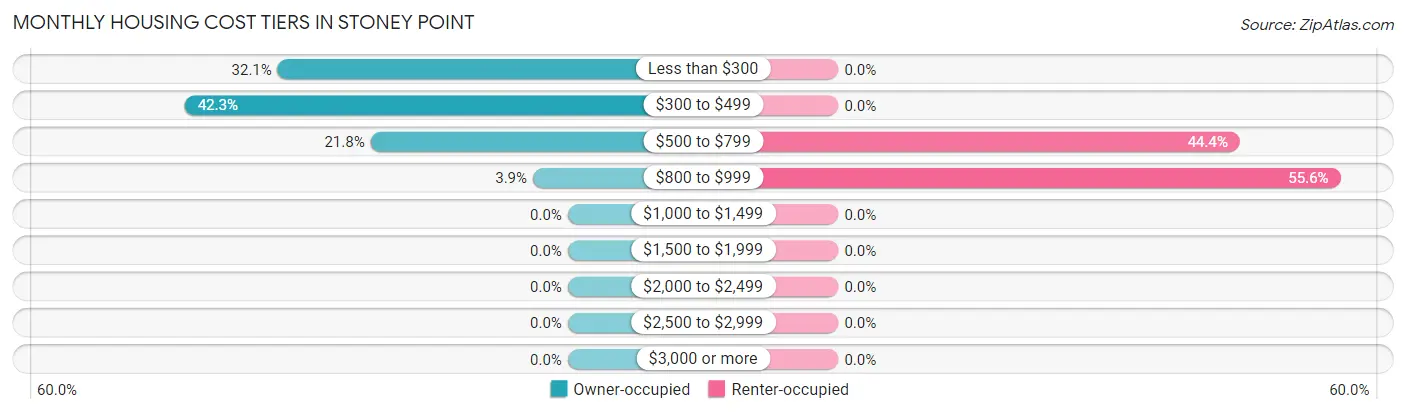
| Monthly Cost | Owner-occupied | Renter-occupied |
| Less than $300 | 25 (32.1%) | 0 (0.0%) |
| $300 to $499 | 33 (42.3%) | 0 (0.0%) |
| $500 to $799 | 17 (21.8%) | 4 (44.4%) |
| $800 to $999 | 3 (3.8%) | 5 (55.6%) |
| $1,000 to $1,499 | 0 (0.0%) | 0 (0.0%) |
| $1,500 to $1,999 | 0 (0.0%) | 0 (0.0%) |
| $2,000 to $2,499 | 0 (0.0%) | 0 (0.0%) |
| $2,500 to $2,999 | 0 (0.0%) | 0 (0.0%) |
| $3,000 or more | 0 (0.0%) | 0 (0.0%) |
| Total | 78 (100.0%) | 9 (100.0%) |
Physical Housing Characteristics in Stoney Point
Housing Structures in Stoney Point
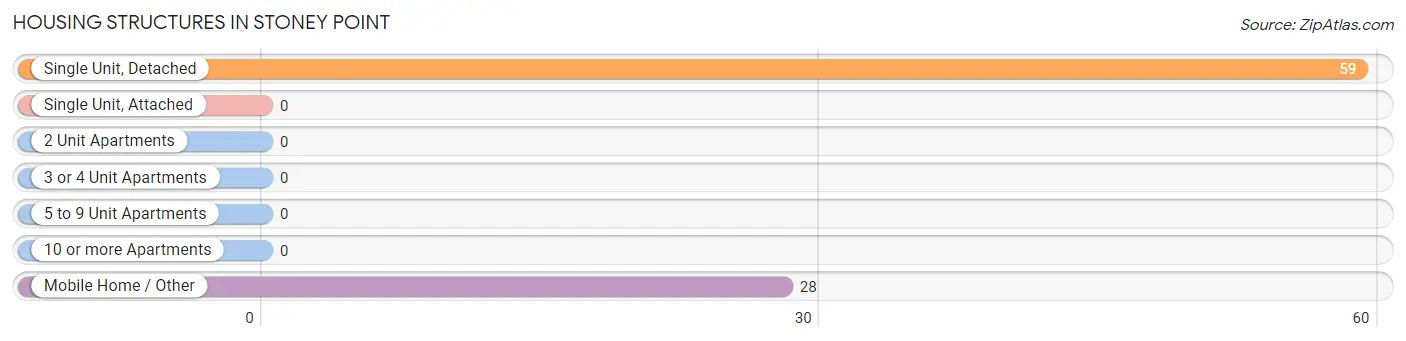
| Structure Type | # Housing Units | % Housing Units |
| Single Unit, Detached | 59 | 67.8% |
| Single Unit, Attached | 0 | 0.0% |
| 2 Unit Apartments | 0 | 0.0% |
| 3 or 4 Unit Apartments | 0 | 0.0% |
| 5 to 9 Unit Apartments | 0 | 0.0% |
| 10 or more Apartments | 0 | 0.0% |
| Mobile Home / Other | 28 | 32.2% |
| Total | 87 | 100.0% |
Housing Structures by Occupancy in Stoney Point
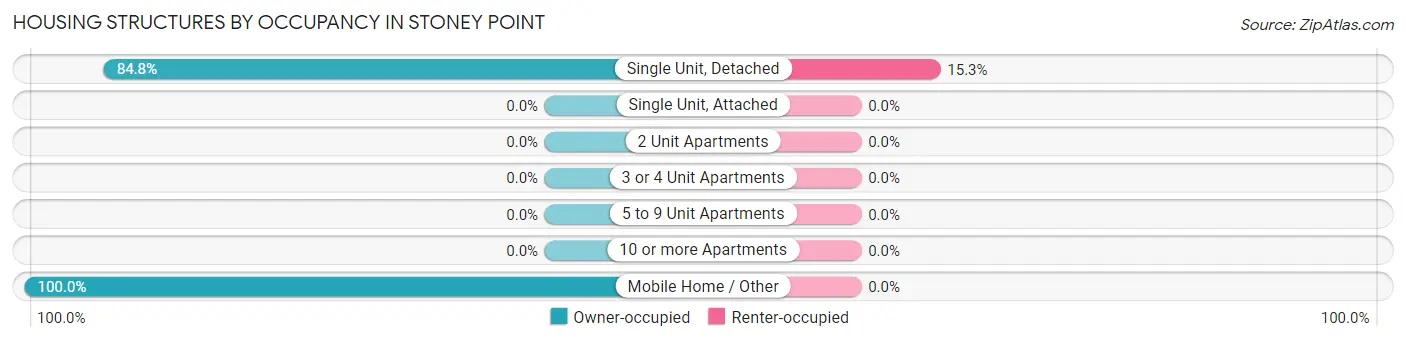
| Structure Type | Owner-occupied | Renter-occupied |
| Single Unit, Detached | 50 (84.8%) | 9 (15.2%) |
| Single Unit, Attached | 0 (0.0%) | 0 (0.0%) |
| 2 Unit Apartments | 0 (0.0%) | 0 (0.0%) |
| 3 or 4 Unit Apartments | 0 (0.0%) | 0 (0.0%) |
| 5 to 9 Unit Apartments | 0 (0.0%) | 0 (0.0%) |
| 10 or more Apartments | 0 (0.0%) | 0 (0.0%) |
| Mobile Home / Other | 28 (100.0%) | 0 (0.0%) |
| Total | 78 (89.7%) | 9 (10.3%) |
Housing Structures by Number of Rooms in Stoney Point
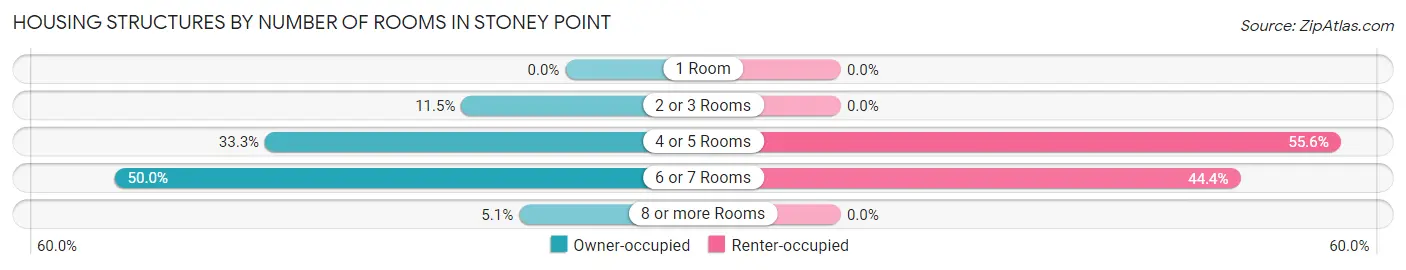
| Number of Rooms | Owner-occupied | Renter-occupied |
| 1 Room | 0 (0.0%) | 0 (0.0%) |
| 2 or 3 Rooms | 9 (11.5%) | 0 (0.0%) |
| 4 or 5 Rooms | 26 (33.3%) | 5 (55.6%) |
| 6 or 7 Rooms | 39 (50.0%) | 4 (44.4%) |
| 8 or more Rooms | 4 (5.1%) | 0 (0.0%) |
| Total | 78 (100.0%) | 9 (100.0%) |
Housing Structure by Heating Type in Stoney Point
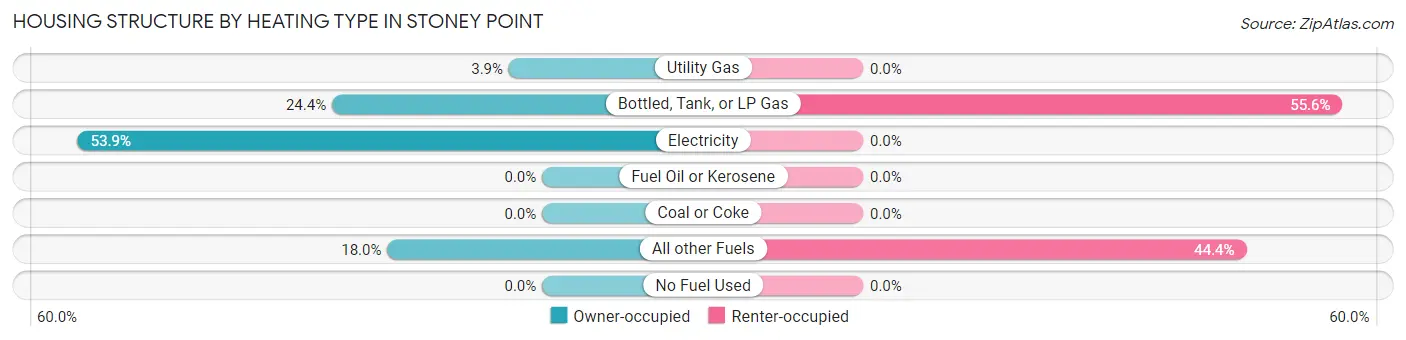
| Heating Type | Owner-occupied | Renter-occupied |
| Utility Gas | 3 (3.8%) | 0 (0.0%) |
| Bottled, Tank, or LP Gas | 19 (24.4%) | 5 (55.6%) |
| Electricity | 42 (53.8%) | 0 (0.0%) |
| Fuel Oil or Kerosene | 0 (0.0%) | 0 (0.0%) |
| Coal or Coke | 0 (0.0%) | 0 (0.0%) |
| All other Fuels | 14 (17.9%) | 4 (44.4%) |
| No Fuel Used | 0 (0.0%) | 0 (0.0%) |
| Total | 78 (100.0%) | 9 (100.0%) |
Household Vehicle Usage in Stoney Point
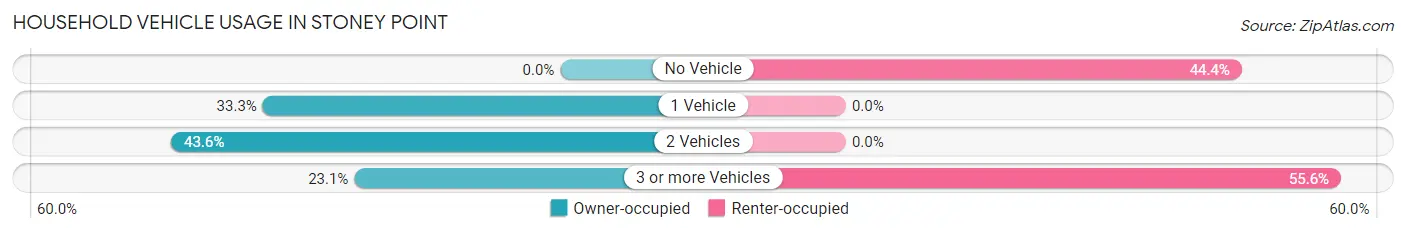
| Vehicles per Household | Owner-occupied | Renter-occupied |
| No Vehicle | 0 (0.0%) | 4 (44.4%) |
| 1 Vehicle | 26 (33.3%) | 0 (0.0%) |
| 2 Vehicles | 34 (43.6%) | 0 (0.0%) |
| 3 or more Vehicles | 18 (23.1%) | 5 (55.6%) |
| Total | 78 (100.0%) | 9 (100.0%) |
Real Estate & Mortgages in Stoney Point
Real Estate and Mortgage Overview in Stoney Point
| Characteristic | Without Mortgage | With Mortgage |
| Housing Units | 75 | 3 |
| Median Property Value | $80,600 | $0 |
| Median Household Income | - | - |
| Monthly Housing Costs | $402 | $0 |
| Real Estate Taxes | $270 | $0 |
Property Value by Mortgage Status in Stoney Point
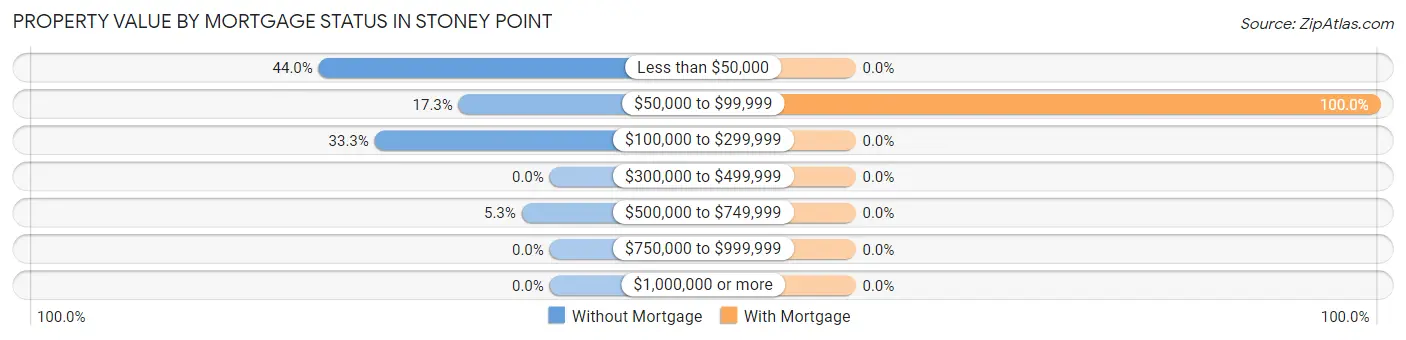
| Property Value | Without Mortgage | With Mortgage |
| Less than $50,000 | 33 (44.0%) | 0 (0.0%) |
| $50,000 to $99,999 | 13 (17.3%) | 3 (100.0%) |
| $100,000 to $299,999 | 25 (33.3%) | 0 (0.0%) |
| $300,000 to $499,999 | 0 (0.0%) | 0 (0.0%) |
| $500,000 to $749,999 | 4 (5.3%) | 0 (0.0%) |
| $750,000 to $999,999 | 0 (0.0%) | 0 (0.0%) |
| $1,000,000 or more | 0 (0.0%) | 0 (0.0%) |
| Total | 75 (100.0%) | 3 (100.0%) |
Household Income by Mortgage Status in Stoney Point
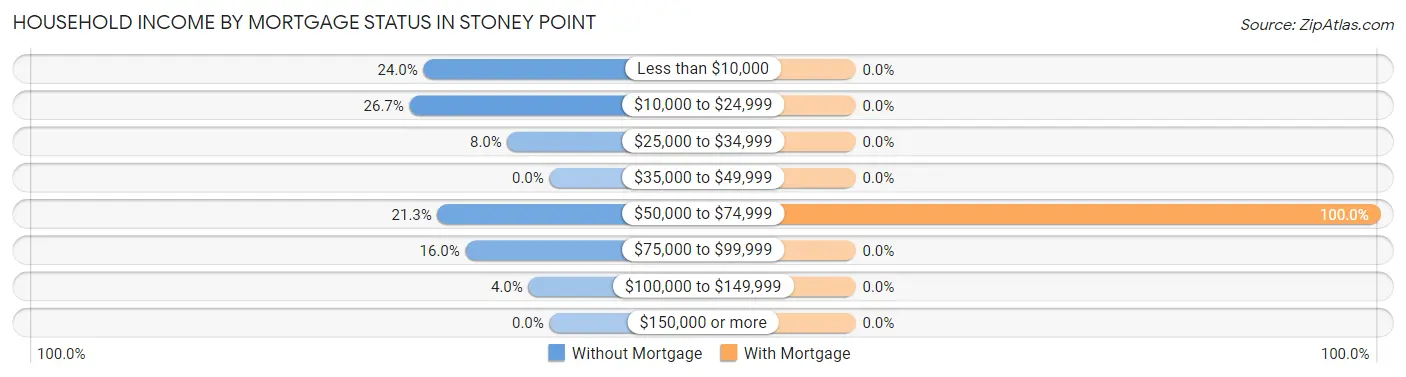
| Household Income | Without Mortgage | With Mortgage |
| Less than $10,000 | 18 (24.0%) | 0 (0.0%) |
| $10,000 to $24,999 | 20 (26.7%) | 0 (0.0%) |
| $25,000 to $34,999 | 6 (8.0%) | 0 (0.0%) |
| $35,000 to $49,999 | 0 (0.0%) | 0 (0.0%) |
| $50,000 to $74,999 | 16 (21.3%) | 3 (100.0%) |
| $75,000 to $99,999 | 12 (16.0%) | 0 (0.0%) |
| $100,000 to $149,999 | 3 (4.0%) | 0 (0.0%) |
| $150,000 or more | 0 (0.0%) | 0 (0.0%) |
| Total | 75 (100.0%) | 3 (100.0%) |
Property Value to Household Income Ratio in Stoney Point
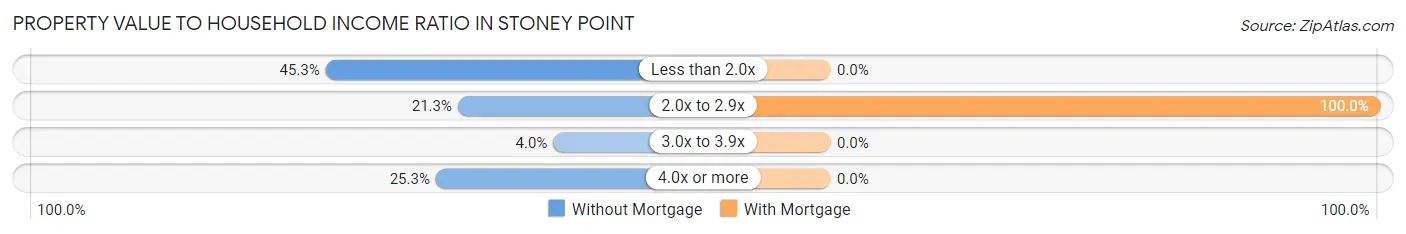
| Value-to-Income Ratio | Without Mortgage | With Mortgage |
| Less than 2.0x | 34 (45.3%) | 0 (0.0%) |
| 2.0x to 2.9x | 16 (21.3%) | 3 (100.0%) |
| 3.0x to 3.9x | 3 (4.0%) | 0 (0.0%) |
| 4.0x or more | 19 (25.3%) | 0 (0.0%) |
| Total | 75 (100.0%) | 3 (100.0%) |
Real Estate Taxes by Mortgage Status in Stoney Point
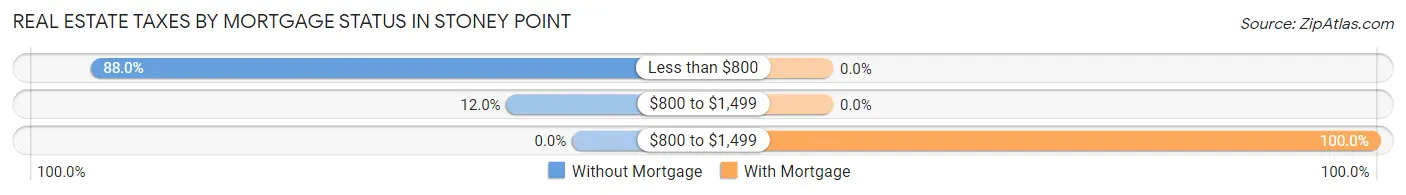
| Property Taxes | Without Mortgage | With Mortgage |
| Less than $800 | 66 (88.0%) | 0 (0.0%) |
| $800 to $1,499 | 9 (12.0%) | 0 (0.0%) |
| $800 to $1,499 | 0 (0.0%) | 3 (100.0%) |
| Total | 75 (100.0%) | 3 (100.0%) |
Health & Disability in Stoney Point
Health Insurance Coverage by Age in Stoney Point
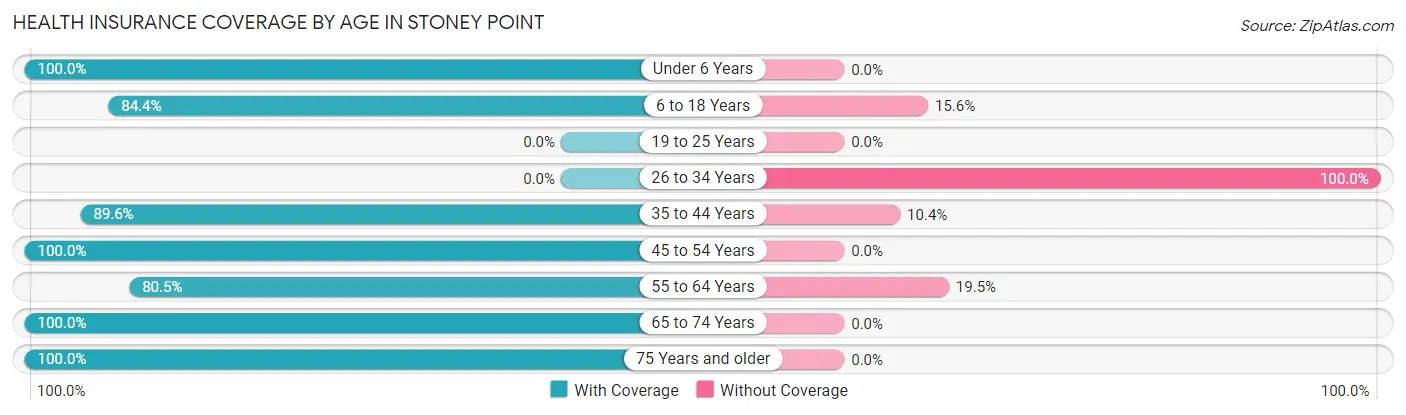
| Age Bracket | With Coverage | Without Coverage |
| Under 6 Years | 3 (100.0%) | 0 (0.0%) |
| 6 to 18 Years | 54 (84.4%) | 10 (15.6%) |
| 19 to 25 Years | 0 (0.0%) | 0 (0.0%) |
| 26 to 34 Years | 0 (0.0%) | 11 (100.0%) |
| 35 to 44 Years | 43 (89.6%) | 5 (10.4%) |
| 45 to 54 Years | 8 (100.0%) | 0 (0.0%) |
| 55 to 64 Years | 33 (80.5%) | 8 (19.5%) |
| 65 to 74 Years | 18 (100.0%) | 0 (0.0%) |
| 75 Years and older | 16 (100.0%) | 0 (0.0%) |
| Total | 175 (83.7%) | 34 (16.3%) |
Health Insurance Coverage by Citizenship Status in Stoney Point
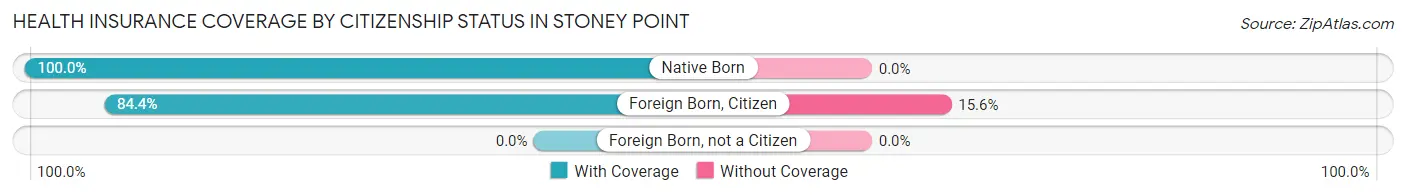
| Citizenship Status | With Coverage | Without Coverage |
| Native Born | 3 (100.0%) | 0 (0.0%) |
| Foreign Born, Citizen | 54 (84.4%) | 10 (15.6%) |
| Foreign Born, not a Citizen | 0 (0.0%) | 0 (0.0%) |
Health Insurance Coverage by Household Income in Stoney Point
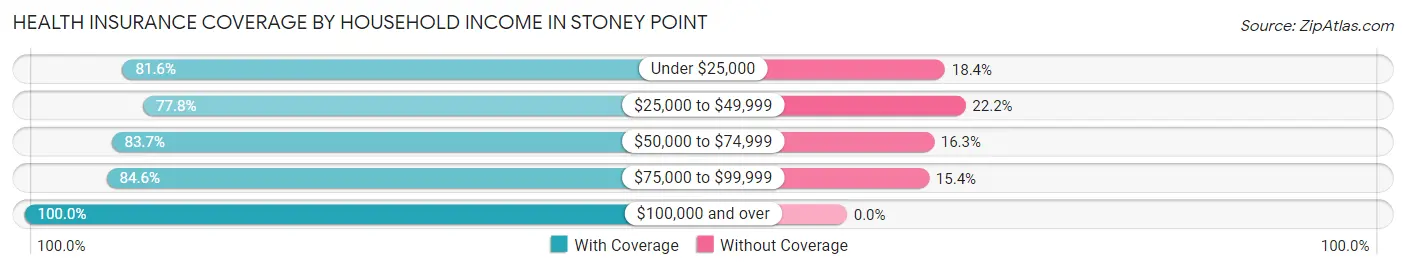
| Household Income | With Coverage | Without Coverage |
| Under $25,000 | 40 (81.6%) | 9 (18.4%) |
| $25,000 to $49,999 | 21 (77.8%) | 6 (22.2%) |
| $50,000 to $74,999 | 77 (83.7%) | 15 (16.3%) |
| $75,000 to $99,999 | 22 (84.6%) | 4 (15.4%) |
| $100,000 and over | 15 (100.0%) | 0 (0.0%) |
Public vs Private Health Insurance Coverage by Age in Stoney Point
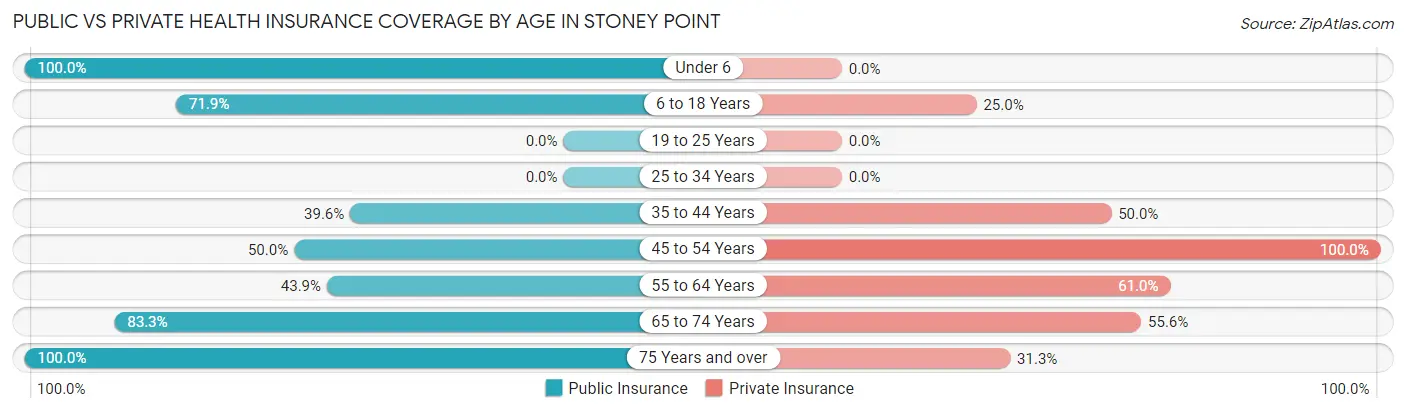
| Age Bracket | Public Insurance | Private Insurance |
| Under 6 | 3 (100.0%) | 0 (0.0%) |
| 6 to 18 Years | 46 (71.9%) | 16 (25.0%) |
| 19 to 25 Years | 0 (0.0%) | 0 (0.0%) |
| 25 to 34 Years | 0 (0.0%) | 0 (0.0%) |
| 35 to 44 Years | 19 (39.6%) | 24 (50.0%) |
| 45 to 54 Years | 4 (50.0%) | 8 (100.0%) |
| 55 to 64 Years | 18 (43.9%) | 25 (61.0%) |
| 65 to 74 Years | 15 (83.3%) | 10 (55.6%) |
| 75 Years and over | 16 (100.0%) | 5 (31.2%) |
| Total | 121 (57.9%) | 88 (42.1%) |
Disability Status by Sex by Age in Stoney Point
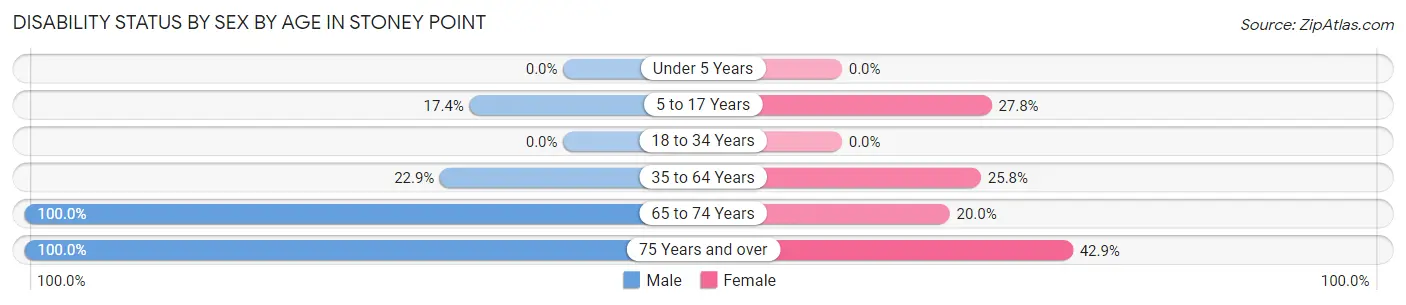
| Age Bracket | Male | Female |
| Under 5 Years | 0 (0.0%) | 0 (0.0%) |
| 5 to 17 Years | 4 (17.4%) | 10 (27.8%) |
| 18 to 34 Years | 0 (0.0%) | 0 (0.0%) |
| 35 to 64 Years | 8 (22.9%) | 16 (25.8%) |
| 65 to 74 Years | 13 (100.0%) | 1 (20.0%) |
| 75 Years and over | 9 (100.0%) | 3 (42.9%) |
Disability Class by Sex by Age in Stoney Point
Disability Class: Hearing Difficulty
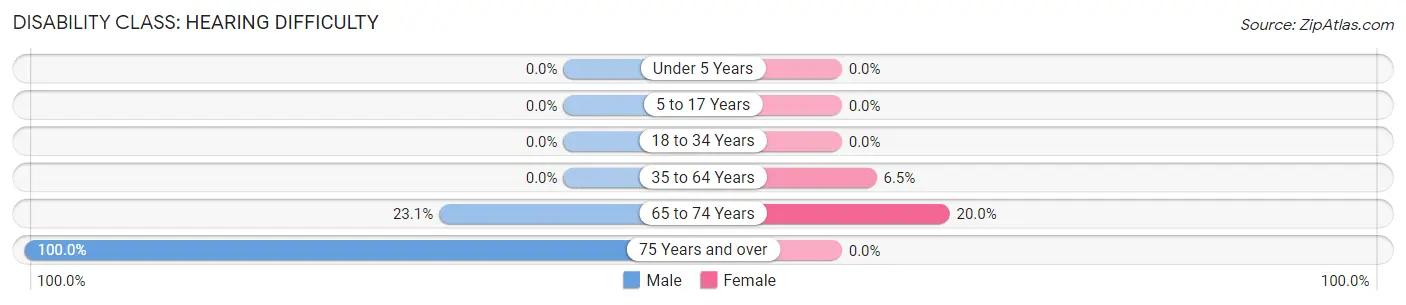
| Age Bracket | Male | Female |
| Under 5 Years | 0 (0.0%) | 0 (0.0%) |
| 5 to 17 Years | 0 (0.0%) | 0 (0.0%) |
| 18 to 34 Years | 0 (0.0%) | 0 (0.0%) |
| 35 to 64 Years | 0 (0.0%) | 4 (6.5%) |
| 65 to 74 Years | 3 (23.1%) | 1 (20.0%) |
| 75 Years and over | 9 (100.0%) | 0 (0.0%) |
Disability Class: Vision Difficulty
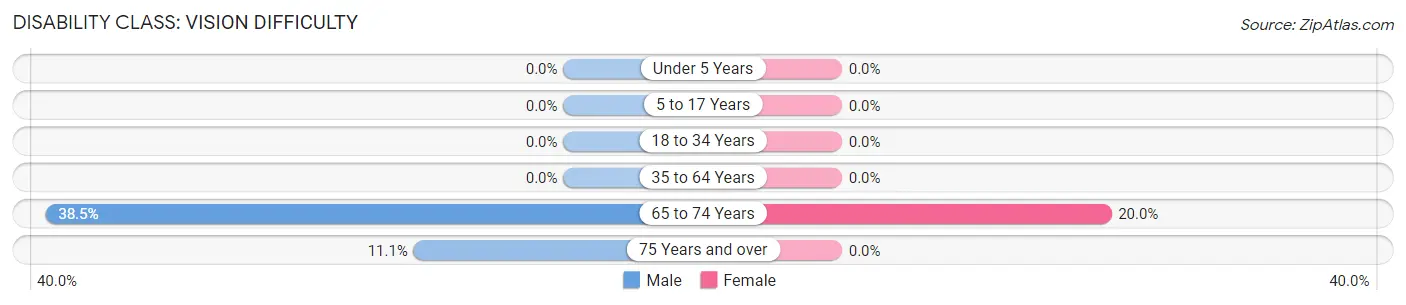
| Age Bracket | Male | Female |
| Under 5 Years | 0 (0.0%) | 0 (0.0%) |
| 5 to 17 Years | 0 (0.0%) | 0 (0.0%) |
| 18 to 34 Years | 0 (0.0%) | 0 (0.0%) |
| 35 to 64 Years | 0 (0.0%) | 0 (0.0%) |
| 65 to 74 Years | 5 (38.5%) | 1 (20.0%) |
| 75 Years and over | 1 (11.1%) | 0 (0.0%) |
Disability Class: Cognitive Difficulty
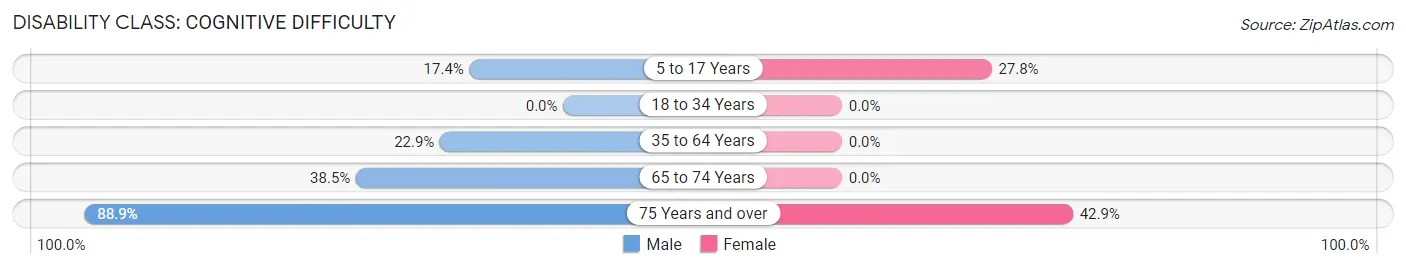
| Age Bracket | Male | Female |
| 5 to 17 Years | 4 (17.4%) | 10 (27.8%) |
| 18 to 34 Years | 0 (0.0%) | 0 (0.0%) |
| 35 to 64 Years | 8 (22.9%) | 0 (0.0%) |
| 65 to 74 Years | 5 (38.5%) | 0 (0.0%) |
| 75 Years and over | 8 (88.9%) | 3 (42.9%) |
Disability Class: Ambulatory Difficulty
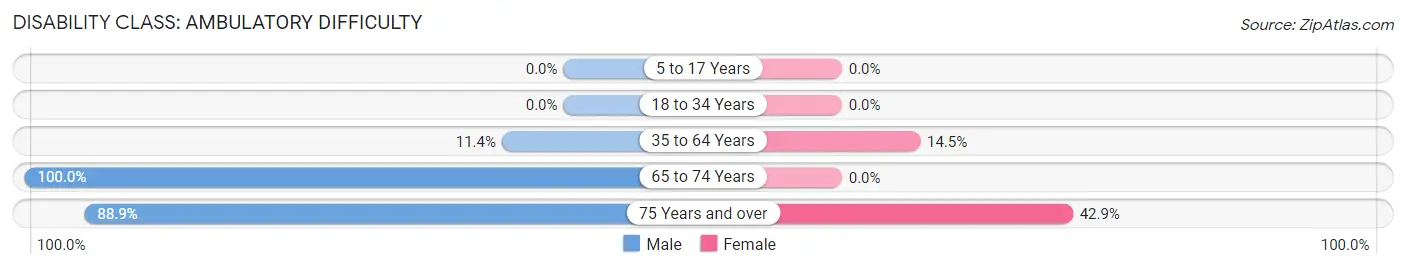
| Age Bracket | Male | Female |
| 5 to 17 Years | 0 (0.0%) | 0 (0.0%) |
| 18 to 34 Years | 0 (0.0%) | 0 (0.0%) |
| 35 to 64 Years | 4 (11.4%) | 9 (14.5%) |
| 65 to 74 Years | 13 (100.0%) | 0 (0.0%) |
| 75 Years and over | 8 (88.9%) | 3 (42.9%) |
Disability Class: Self-Care Difficulty
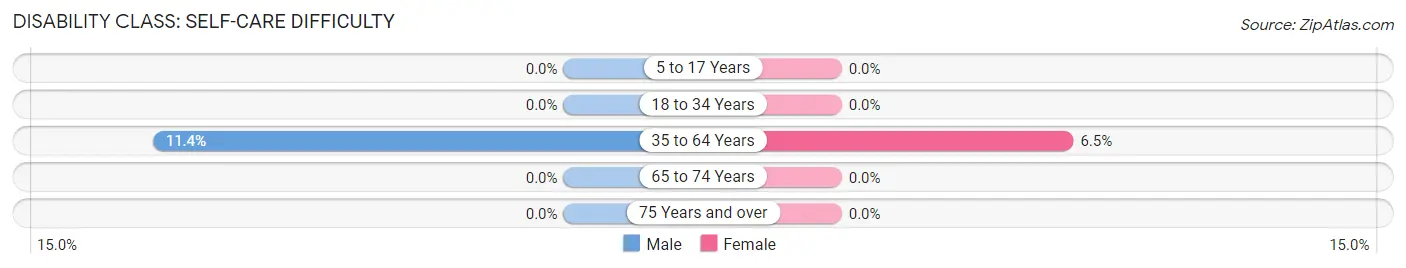
| Age Bracket | Male | Female |
| 5 to 17 Years | 0 (0.0%) | 0 (0.0%) |
| 18 to 34 Years | 0 (0.0%) | 0 (0.0%) |
| 35 to 64 Years | 4 (11.4%) | 4 (6.5%) |
| 65 to 74 Years | 0 (0.0%) | 0 (0.0%) |
| 75 Years and over | 0 (0.0%) | 0 (0.0%) |
Technology Access in Stoney Point
Computing Device Access in Stoney Point
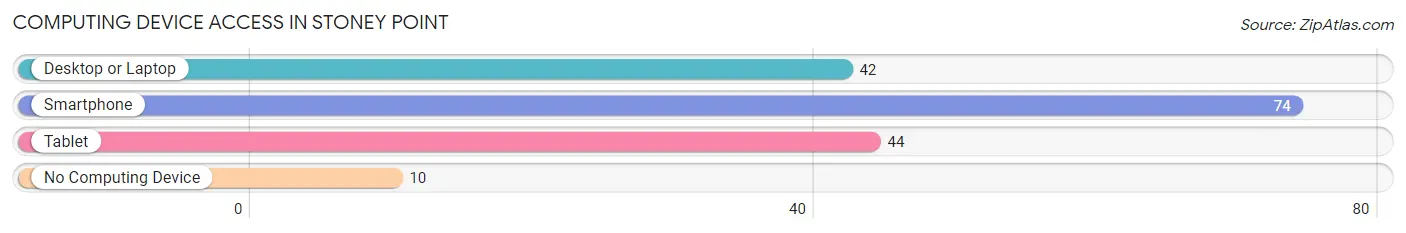
| Device Type | # Households | % Households |
| Desktop or Laptop | 42 | 48.3% |
| Smartphone | 74 | 85.1% |
| Tablet | 44 | 50.6% |
| No Computing Device | 10 | 11.5% |
| Total | 87 | 100.0% |
Internet Access in Stoney Point
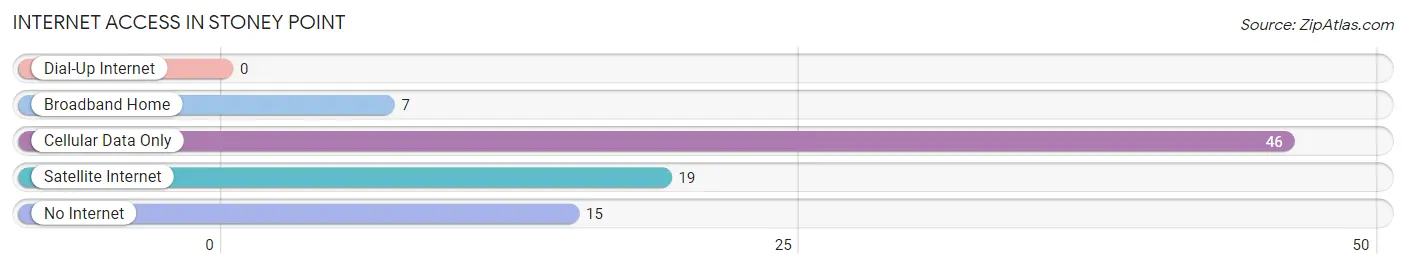
| Internet Type | # Households | % Households |
| Dial-Up Internet | 0 | 0.0% |
| Broadband Home | 7 | 8.1% |
| Cellular Data Only | 46 | 52.9% |
| Satellite Internet | 19 | 21.8% |
| No Internet | 15 | 17.2% |
| Total | 87 | 100.0% |
Stoney Point Summary
Stoney Point is a small unincorporated community located in the southeastern corner of Oklahoma, in the United States. It is situated in the foothills of the Ouachita Mountains, in the foothills of the Kiamichi Mountains, and is part of the Choctaw Nation. The community is located in Pushmataha County, and is approximately 10 miles south of Antlers, Oklahoma.
History
The area that is now Stoney Point was originally inhabited by the Choctaw Indians. The Choctaw were a Native American tribe that lived in the area for centuries before the arrival of European settlers. The Choctaw were forcibly removed from the area in the 1830s as part of the Indian Removal Act.
The first European settlers to the area arrived in the late 1800s. The settlement was originally known as “Stoney Point”, and was named after the rocky terrain of the area. The settlement was officially established in 1891, and was home to a variety of businesses, including a general store, a blacksmith shop, and a post office.
Geography
Stoney Point is located in the southeastern corner of Oklahoma, in the foothills of the Ouachita Mountains and the Kiamichi Mountains. The community is situated in Pushmataha County, and is approximately 10 miles south of Antlers, Oklahoma. The area is characterized by rolling hills, dense forests, and numerous creeks and streams.
The climate in Stoney Point is generally mild, with hot summers and cold winters. The average annual temperature is around 65°F (18°C), and the average annual precipitation is around 40 inches (101 cm).
Economy
The economy of Stoney Point is largely based on agriculture and forestry. The area is home to a variety of farms, including cattle, poultry, and hog farms. The area is also home to several timber companies, which harvest timber from the surrounding forests.
In addition to agriculture and forestry, Stoney Point is home to a variety of small businesses, including restaurants, convenience stores, and gas stations. The community is also home to a number of churches, and is served by a local school district.
Demographics
As of the 2010 census, the population of Stoney Point was 1,072. The racial makeup of the community was 95.3% White, 0.9% African American, 0.7% Native American, 0.2% Asian, and 2.9% from other races. The median household income was $30,938, and the median family income was $37,813.
Stoney Point is served by the Pushmataha County School District, which includes one elementary school, one middle school, and one high school. The community is also home to a number of churches, including the Stoney Point Baptist Church, the Stoney Point Methodist Church, and the Stoney Point Pentecostal Church.
Common Questions
What is Per Capita Income in Stoney Point?
Per Capita income in Stoney Point is $18,510.
What is the Median Family Income in Stoney Point?
Median Family Income in Stoney Point is $64,063.
What is the Median Household income in Stoney Point?
Median Household Income in Stoney Point is $31,375.
What is Income or Wage Gap in Stoney Point?
Income or Wage Gap in Stoney Point is 65.0%.
Women in Stoney Point earn 35.0 cents for every dollar earned by a man.
What is Inequality or Gini Index in Stoney Point?
Inequality or Gini Index in Stoney Point is 0.42.
What is the Total Population of Stoney Point?
Total Population of Stoney Point is 209.
What is the Total Male Population of Stoney Point?
Total Male Population of Stoney Point is 83.
What is the Total Female Population of Stoney Point?
Total Female Population of Stoney Point is 126.
What is the Ratio of Males per 100 Females in Stoney Point?
There are 65.87 Males per 100 Females in Stoney Point.
What is the Ratio of Females per 100 Males in Stoney Point?
There are 151.81 Females per 100 Males in Stoney Point.
What is the Median Population Age in Stoney Point?
Median Population Age in Stoney Point is 40.9 Years.
What is the Average Family Size in Stoney Point
Average Family Size in Stoney Point is 3.1 People.
What is the Average Household Size in Stoney Point
Average Household Size in Stoney Point is 2.4 People.
How Large is the Labor Force in Stoney Point?
There are 76 People in the Labor Forcein in Stoney Point.
What is the Percentage of People in the Labor Force in Stoney Point?
49.0% of People are in the Labor Force in Stoney Point.
What is the Unemployment Rate in Stoney Point?
Unemployment Rate in Stoney Point is 9.2%.