Steely Hollow, OK Map & Demographics
Steely Hollow Map
Steely Hollow Overview
$46,186
PER CAPITA INCOME
$62,167
AVG FAMILY INCOME
$82,153
AVG HOUSEHOLD INCOME
51.6%
WAGE / INCOME GAP [ % ]
48.4¢/ $1
WAGE / INCOME GAP [ $ ]
0.24
INEQUALITY / GINI INDEX
258
TOTAL POPULATION
65
MALE POPULATION
193
FEMALE POPULATION
33.68
MALES / 100 FEMALES
296.92
FEMALES / 100 MALES
57.8
MEDIAN AGE
3.1
AVG FAMILY SIZE
1.7
AVG HOUSEHOLD SIZE
85
LABOR FORCE [ PEOPLE ]
39.0%
PERCENT IN LABOR FORCE
3.5%
UNEMPLOYMENT RATE
Income in Steely Hollow
Income Overview in Steely Hollow
Per Capita Income in Steely Hollow is $46,186, while median incomes of families and households are $62,167 and $82,153 respectively.
| Characteristic | Number | Measure |
| Per Capita Income | 258 | $46,186 |
| Median Family Income | 48 | $62,167 |
| Mean Family Income | 48 | $74,013 |
| Median Household Income | 155 | $82,153 |
| Mean Household Income | 155 | $74,759 |
| Income Deficit | 48 | $0 |
| Wage / Income Gap (%) | 258 | 51.59% |
| Wage / Income Gap ($) | 258 | 48.41¢ per $1 |
| Gini / Inequality Index | 258 | 0.24 |
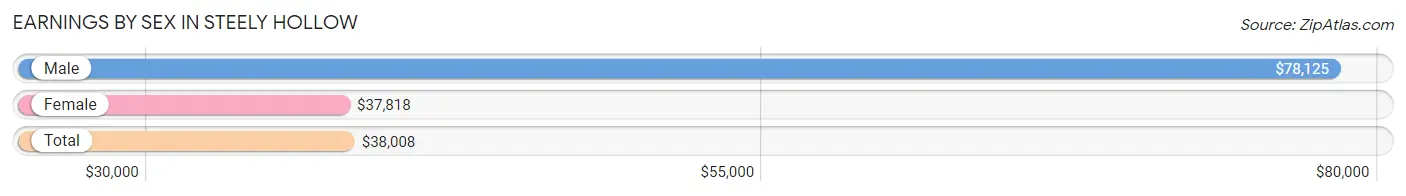
Earnings by Sex in Steely Hollow
Average Earnings in Steely Hollow are $38,008, $78,125 for men and $37,818 for women, a difference of 51.6%.
| Sex | Number | Average Earnings |
| Male | 27 (18.5%) | $78,125 |
| Female | 119 (81.5%) | $37,818 |
| Total | 146 (100.0%) | $38,008 |
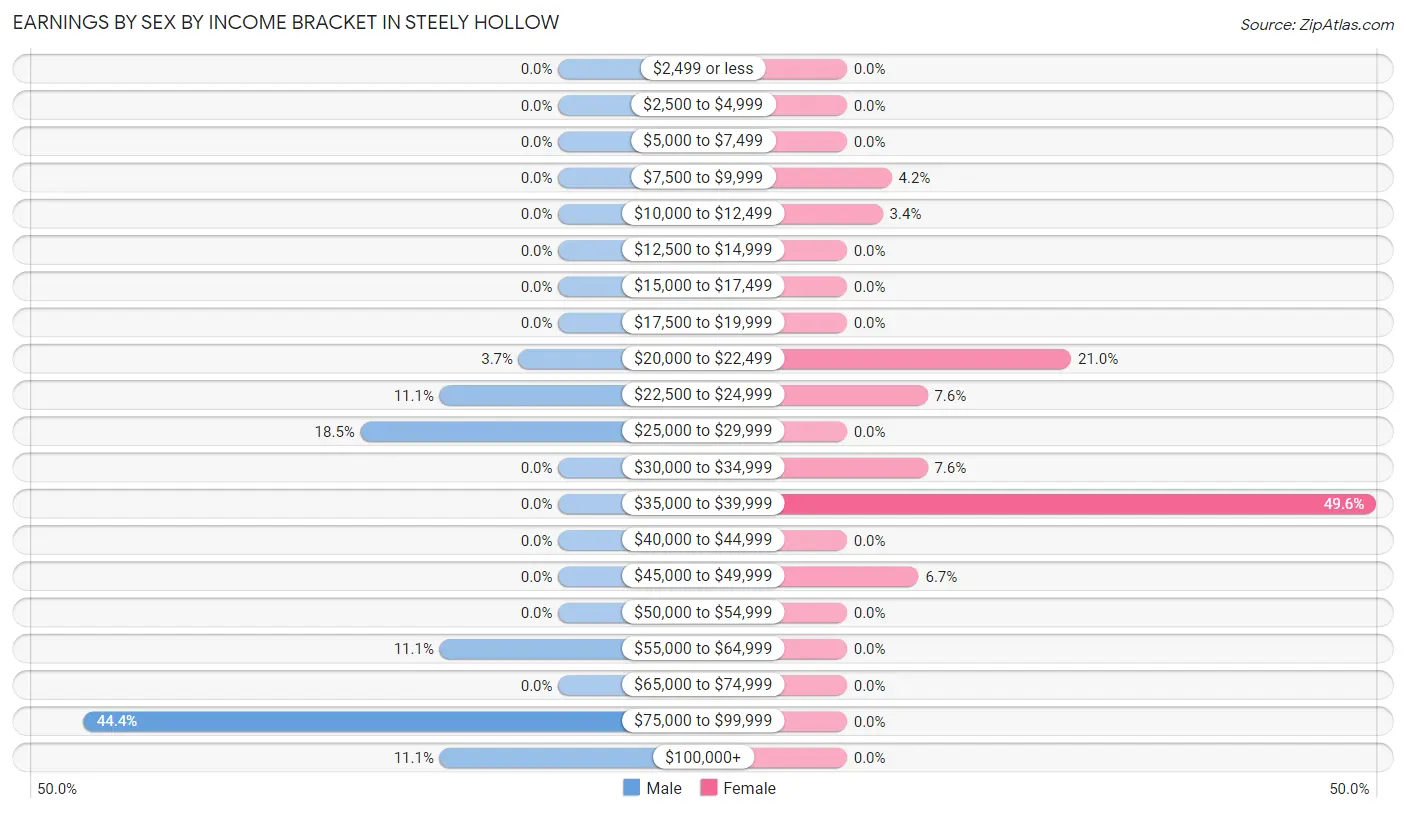
Earnings by Sex by Income Bracket in Steely Hollow
The most common earnings brackets in Steely Hollow are $75,000 to $99,999 for men (12 | 44.4%) and $35,000 to $39,999 for women (59 | 49.6%).
| Income | Male | Female |
| $2,499 or less | 0 (0.0%) | 0 (0.0%) |
| $2,500 to $4,999 | 0 (0.0%) | 0 (0.0%) |
| $5,000 to $7,499 | 0 (0.0%) | 0 (0.0%) |
| $7,500 to $9,999 | 0 (0.0%) | 5 (4.2%) |
| $10,000 to $12,499 | 0 (0.0%) | 4 (3.4%) |
| $12,500 to $14,999 | 0 (0.0%) | 0 (0.0%) |
| $15,000 to $17,499 | 0 (0.0%) | 0 (0.0%) |
| $17,500 to $19,999 | 0 (0.0%) | 0 (0.0%) |
| $20,000 to $22,499 | 1 (3.7%) | 25 (21.0%) |
| $22,500 to $24,999 | 3 (11.1%) | 9 (7.6%) |
| $25,000 to $29,999 | 5 (18.5%) | 0 (0.0%) |
| $30,000 to $34,999 | 0 (0.0%) | 9 (7.6%) |
| $35,000 to $39,999 | 0 (0.0%) | 59 (49.6%) |
| $40,000 to $44,999 | 0 (0.0%) | 0 (0.0%) |
| $45,000 to $49,999 | 0 (0.0%) | 8 (6.7%) |
| $50,000 to $54,999 | 0 (0.0%) | 0 (0.0%) |
| $55,000 to $64,999 | 3 (11.1%) | 0 (0.0%) |
| $65,000 to $74,999 | 0 (0.0%) | 0 (0.0%) |
| $75,000 to $99,999 | 12 (44.4%) | 0 (0.0%) |
| $100,000+ | 3 (11.1%) | 0 (0.0%) |
| Total | 27 (100.0%) | 119 (100.0%) |
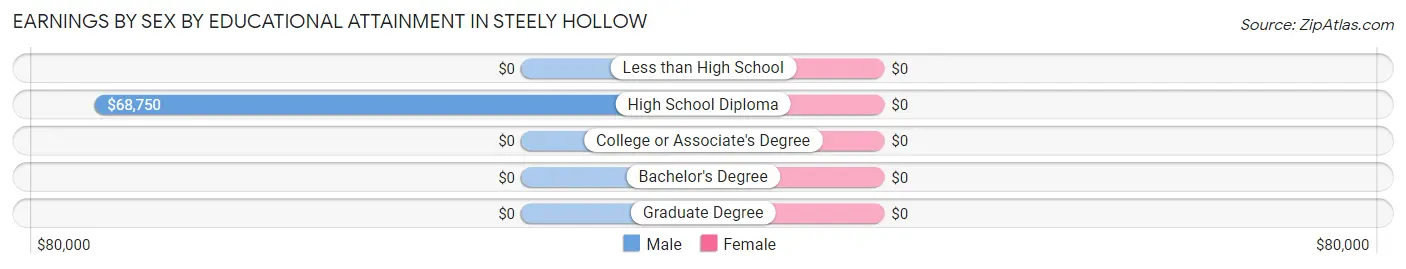
Earnings by Sex by Educational Attainment in Steely Hollow
| Educational Attainment | Male Income | Female Income |
| Less than High School | - | - |
| High School Diploma | $68,750 | $0 |
| College or Associate's Degree | - | - |
| Bachelor's Degree | - | - |
| Graduate Degree | - | - |
| Total | $79,167 | $37,924 |
Family Income in Steely Hollow
Family Income Brackets in Steely Hollow
According to the Steely Hollow family income data, there are 24 families falling into the $50,000 to $74,999 income range, which is the most common income bracket and makes up 50.0% of all families.
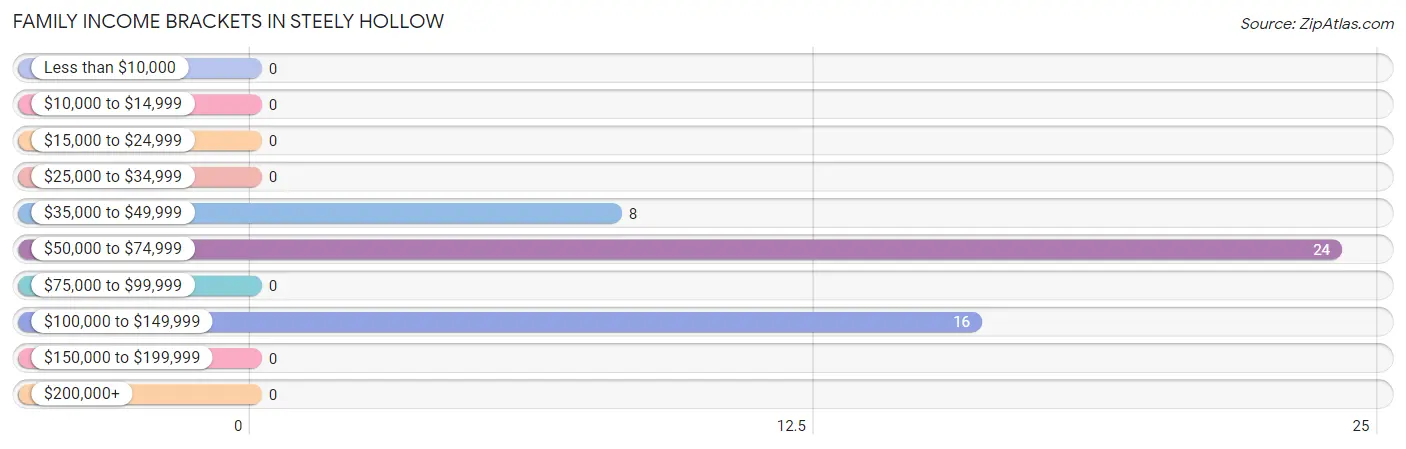
| Income Bracket | # Families | % Families |
| Less than $10,000 | 0 | 0.0% |
| $10,000 to $14,999 | 0 | 0.0% |
| $15,000 to $24,999 | 0 | 0.0% |
| $25,000 to $34,999 | 0 | 0.0% |
| $35,000 to $49,999 | 8 | 16.7% |
| $50,000 to $74,999 | 24 | 50.0% |
| $75,000 to $99,999 | 0 | 0.0% |
| $100,000 to $149,999 | 16 | 33.3% |
| $150,000 to $199,999 | 0 | 0.0% |
| $200,000+ | 0 | 0.0% |
Family Income by Famaliy Size in Steely Hollow
3-person families (19 | 39.6%) account for the highest median family income in Steely Hollow with $103,958 per family, while 3-person families (19 | 39.6%) have the highest median income of $34,653 per family member.
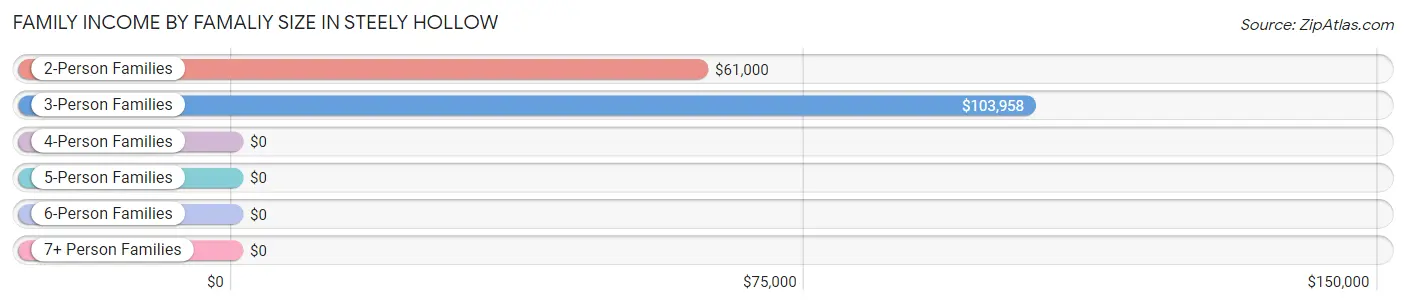
| Income Bracket | # Families | Median Income |
| 2-Person Families | 24 (50.0%) | $61,000 |
| 3-Person Families | 19 (39.6%) | $103,958 |
| 4-Person Families | 0 (0.0%) | $0 |
| 5-Person Families | 2 (4.2%) | $0 |
| 6-Person Families | 3 (6.2%) | $0 |
| 7+ Person Families | 0 (0.0%) | $0 |
| Total | 48 (100.0%) | $62,167 |
Family Income by Number of Earners in Steely Hollow
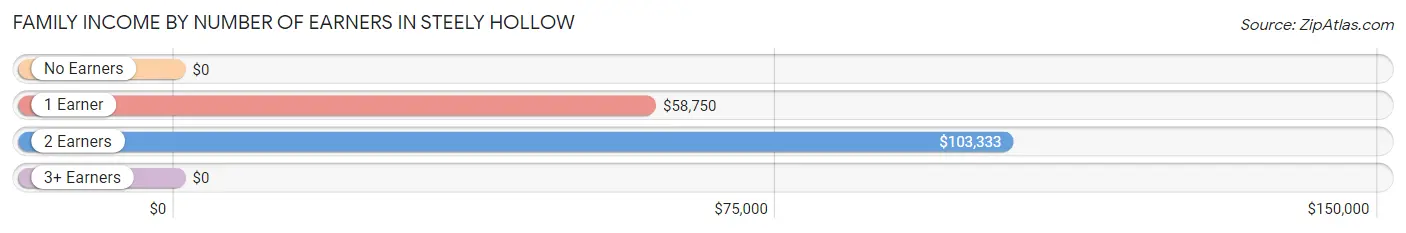
| Number of Earners | # Families | Median Income |
| No Earners | 17 (35.4%) | $0 |
| 1 Earner | 9 (18.8%) | $58,750 |
| 2 Earners | 22 (45.8%) | $103,333 |
| 3+ Earners | 0 (0.0%) | $0 |
| Total | 48 (100.0%) | $62,167 |
Household Income in Steely Hollow
Household Income Brackets in Steely Hollow
With 75 households falling in the category, the $100,000 to $149,999 income range is the most frequent in Steely Hollow, accounting for 48.4% of all households.
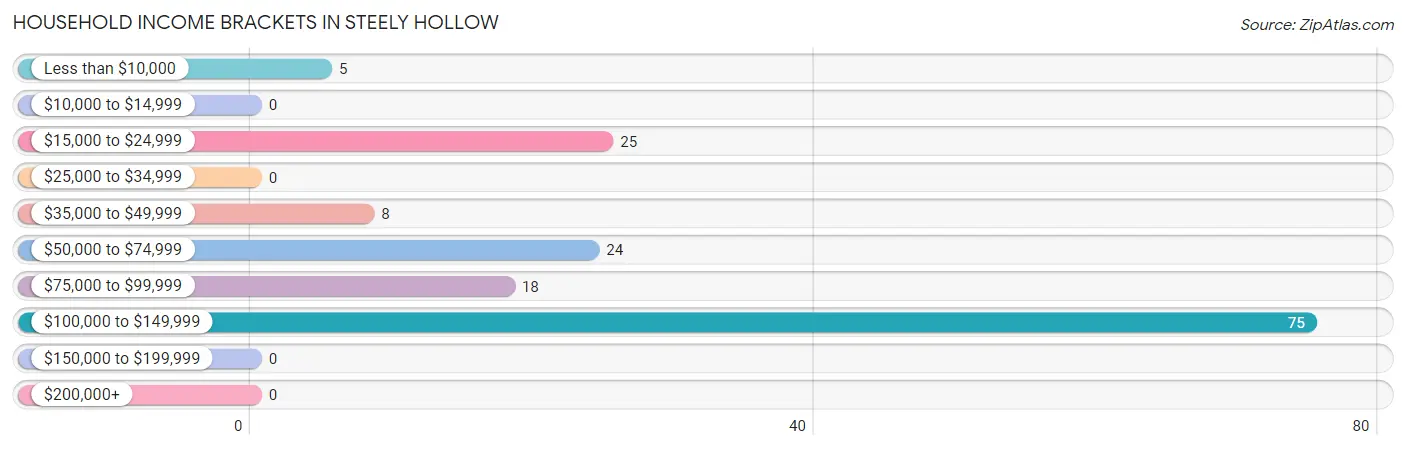
| Income Bracket | # Households | % Households |
| Less than $10,000 | 5 | 3.2% |
| $10,000 to $14,999 | 0 | 0.0% |
| $15,000 to $24,999 | 25 | 16.1% |
| $25,000 to $34,999 | 0 | 0.0% |
| $35,000 to $49,999 | 8 | 5.2% |
| $50,000 to $74,999 | 24 | 15.5% |
| $75,000 to $99,999 | 18 | 11.6% |
| $100,000 to $149,999 | 75 | 48.4% |
| $150,000 to $199,999 | 0 | 0.0% |
| $200,000+ | 0 | 0.0% |
Household Income by Householder Age in Steely Hollow
The median household income in Steely Hollow is $82,153, with the highest median household income of $115,357 found in the 25 to 44 years age bracket for the primary householder. A total of 12 households (7.7%) fall into this category. Meanwhile, the 15 to 24 years age bracket for the primary householder has the lowest median household income of $0, with 5 households (3.2%) in this group.
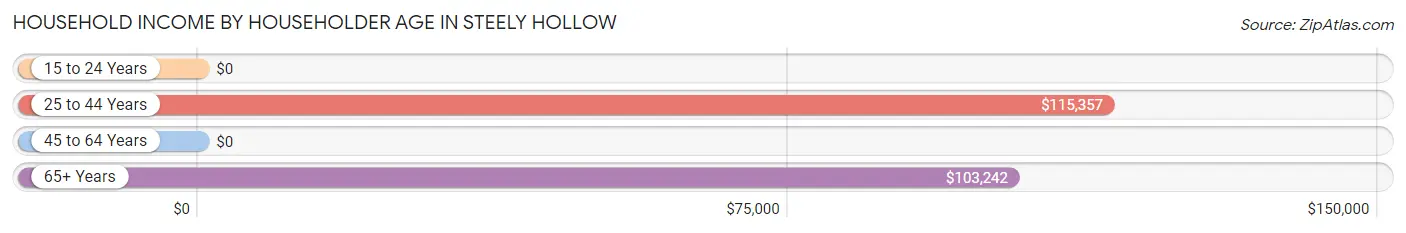
| Income Bracket | # Households | Median Income |
| 15 to 24 Years | 5 (3.2%) | $0 |
| 25 to 44 Years | 12 (7.7%) | $115,357 |
| 45 to 64 Years | 55 (35.5%) | $0 |
| 65+ Years | 83 (53.5%) | $103,242 |
| Total | 155 (100.0%) | $82,153 |
Poverty in Steely Hollow
Income Below Poverty by Sex and Age in Steely Hollow
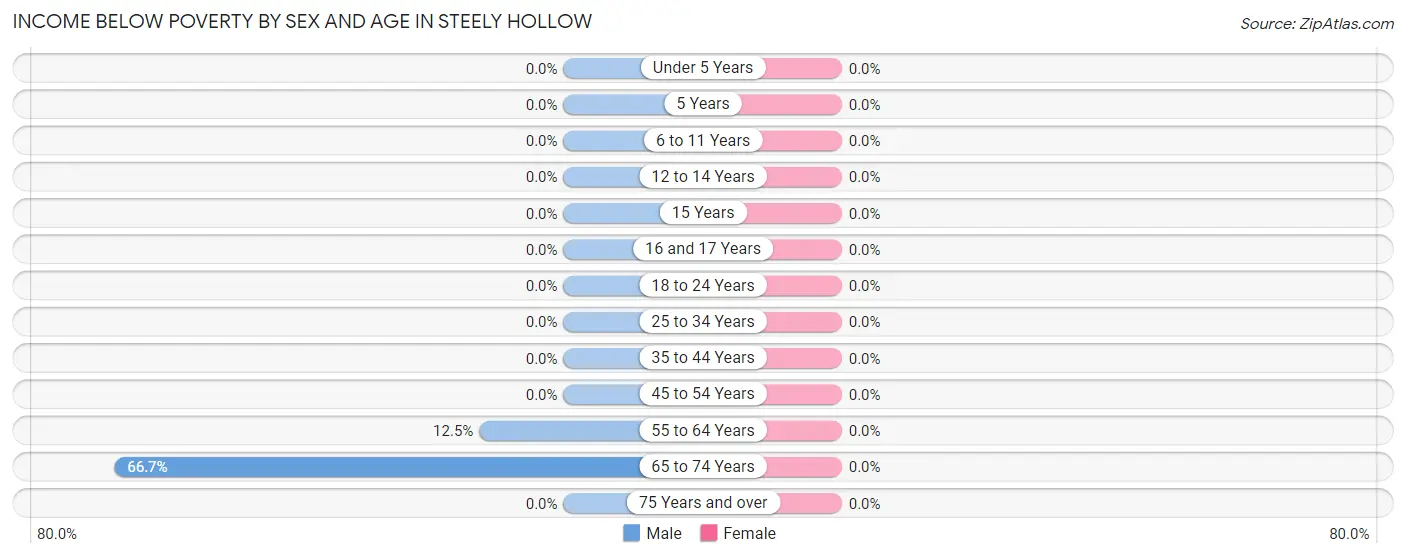
| Age Bracket | Male | Female |
| Under 5 Years | 0 (0.0%) | 0 (0.0%) |
| 5 Years | 0 (0.0%) | 0 (0.0%) |
| 6 to 11 Years | 0 (0.0%) | 0 (0.0%) |
| 12 to 14 Years | 0 (0.0%) | 0 (0.0%) |
| 15 Years | 0 (0.0%) | 0 (0.0%) |
| 16 and 17 Years | 0 (0.0%) | 0 (0.0%) |
| 18 to 24 Years | 0 (0.0%) | 0 (0.0%) |
| 25 to 34 Years | 0 (0.0%) | 0 (0.0%) |
| 35 to 44 Years | 0 (0.0%) | 0 (0.0%) |
| 45 to 54 Years | 0 (0.0%) | 0 (0.0%) |
| 55 to 64 Years | 3 (12.5%) | 0 (0.0%) |
| 65 to 74 Years | 2 (66.7%) | 0 (0.0%) |
| 75 Years and over | 0 (0.0%) | 0 (0.0%) |
| Total | 5 (7.7%) | 0 (0.0%) |
Income Above Poverty by Sex and Age in Steely Hollow
According to the poverty statistics in Steely Hollow, males aged under 5 years and females aged under 5 years are the age groups that are most secure financially, with 100.0% of males and 100.0% of females in these age groups living above the poverty line.
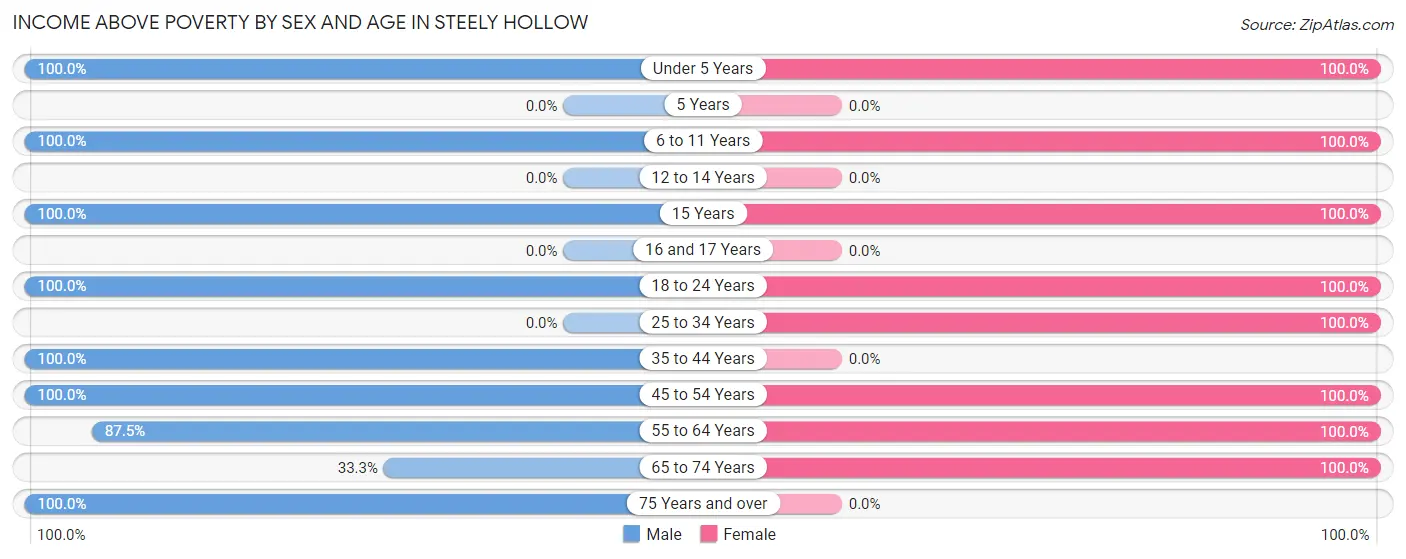
| Age Bracket | Male | Female |
| Under 5 Years | 3 (100.0%) | 9 (100.0%) |
| 5 Years | 0 (0.0%) | 0 (0.0%) |
| 6 to 11 Years | 3 (100.0%) | 21 (100.0%) |
| 12 to 14 Years | 0 (0.0%) | 0 (0.0%) |
| 15 Years | 2 (100.0%) | 2 (100.0%) |
| 16 and 17 Years | 0 (0.0%) | 0 (0.0%) |
| 18 to 24 Years | 10 (100.0%) | 5 (100.0%) |
| 25 to 34 Years | 0 (0.0%) | 20 (100.0%) |
| 35 to 44 Years | 11 (100.0%) | 0 (0.0%) |
| 45 to 54 Years | 6 (100.0%) | 28 (100.0%) |
| 55 to 64 Years | 21 (87.5%) | 13 (100.0%) |
| 65 to 74 Years | 1 (33.3%) | 95 (100.0%) |
| 75 Years and over | 3 (100.0%) | 0 (0.0%) |
| Total | 60 (92.3%) | 193 (100.0%) |
Income Below Poverty Among Married-Couple Families in Steely Hollow
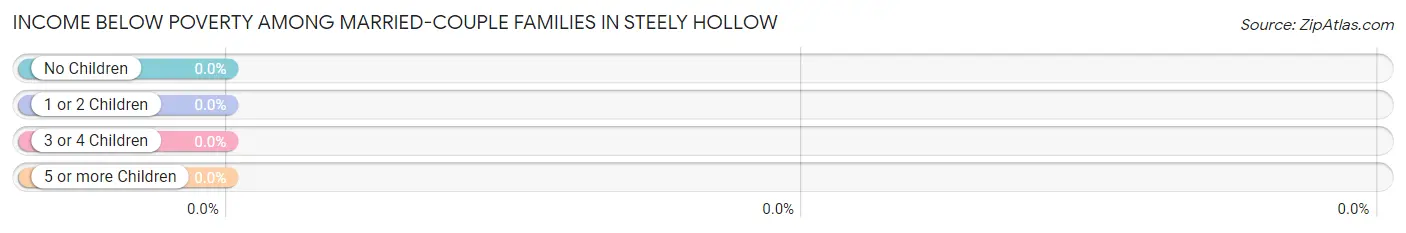
| Children | Above Poverty | Below Poverty |
| No Children | 24 (100.0%) | 0 (0.0%) |
| 1 or 2 Children | 21 (100.0%) | 0 (0.0%) |
| 3 or 4 Children | 3 (100.0%) | 0 (0.0%) |
| 5 or more Children | 0 (0.0%) | 0 (0.0%) |
| Total | 48 (100.0%) | 0 (0.0%) |
Income Below Poverty Among Single-Parent Households in Steely Hollow
| Children | Single Father | Single Mother |
| No Children | 0 (0.0%) | 0 (0.0%) |
| 1 or 2 Children | 0 (0.0%) | 0 (0.0%) |
| 3 or 4 Children | 0 (0.0%) | 0 (0.0%) |
| 5 or more Children | 0 (0.0%) | 0 (0.0%) |
| Total | 0 (0.0%) | 0 (0.0%) |
Income Below Poverty Among Married-Couple vs Single-Parent Households in Steely Hollow
| Children | Married-Couple Families | Single-Parent Households |
| No Children | 0 (0.0%) | 0 (0.0%) |
| 1 or 2 Children | 0 (0.0%) | 0 (0.0%) |
| 3 or 4 Children | 0 (0.0%) | 0 (0.0%) |
| 5 or more Children | 0 (0.0%) | 0 (0.0%) |
| Total | 0 (0.0%) | 0 (0.0%) |
Race in Steely Hollow
The most populous races in Steely Hollow are Native / Alaskan (123 | 47.7%), White / Caucasian (85 | 33.0%), and Two or more Races (42 | 16.3%).
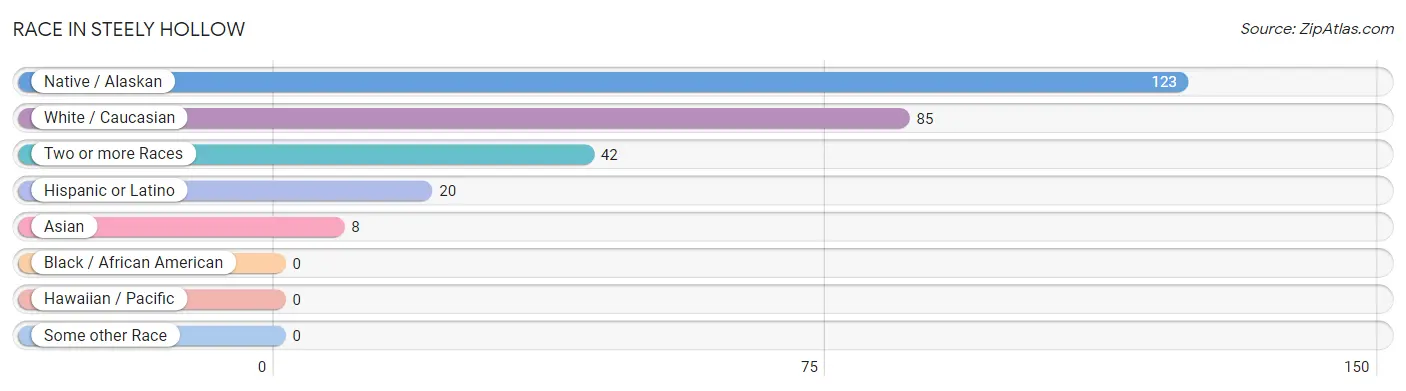
| Race | # Population | % Population |
| Asian | 8 | 3.1% |
| Black / African American | 0 | 0.0% |
| Hawaiian / Pacific | 0 | 0.0% |
| Hispanic or Latino | 20 | 7.7% |
| Native / Alaskan | 123 | 47.7% |
| White / Caucasian | 85 | 33.0% |
| Two or more Races | 42 | 16.3% |
| Some other Race | 0 | 0.0% |
| Total | 258 | 100.0% |
Ancestry in Steely Hollow
The most populous ancestries reported in Steely Hollow are Cherokee (98 | 38.0%), French (24 | 9.3%), German (24 | 9.3%), Dominican (20 | 7.7%), and Irish (17 | 6.6%), together accounting for 70.9% of all Steely Hollow residents.
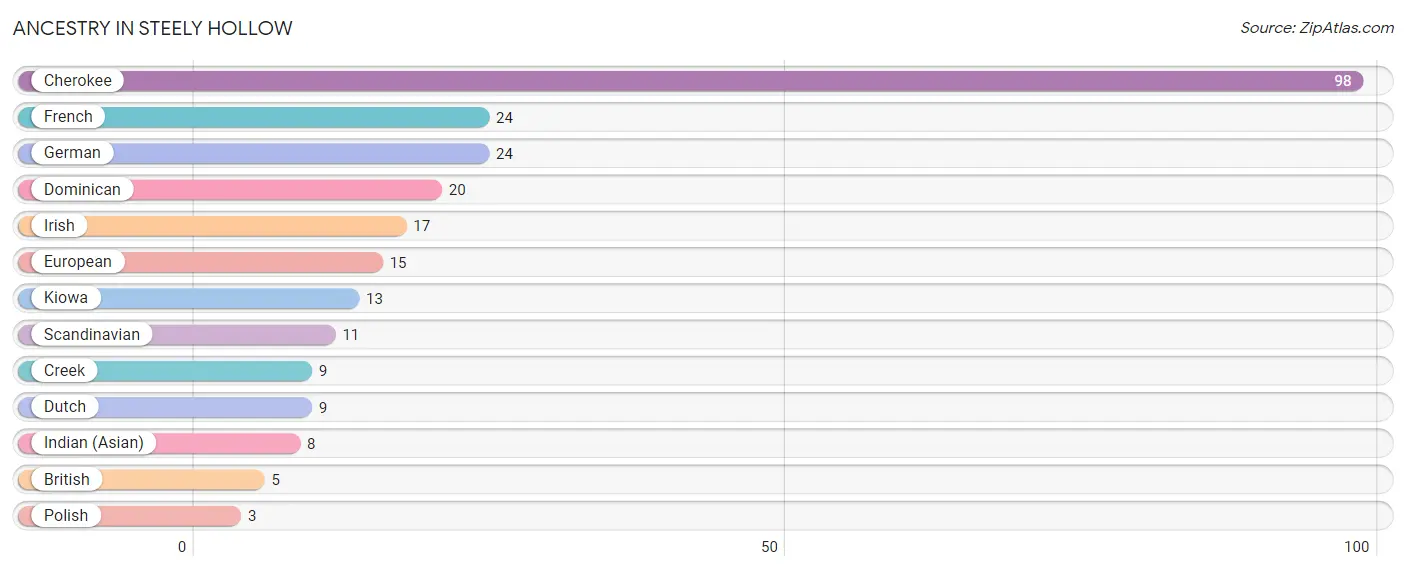
| Ancestry | # Population | % Population |
| British | 5 | 1.9% |
| Cherokee | 98 | 38.0% |
| Creek | 9 | 3.5% |
| Dominican | 20 | 7.7% |
| Dutch | 9 | 3.5% |
| European | 15 | 5.8% |
| French | 24 | 9.3% |
| German | 24 | 9.3% |
| Indian (Asian) | 8 | 3.1% |
| Irish | 17 | 6.6% |
| Kiowa | 13 | 5.0% |
| Polish | 3 | 1.2% |
| Scandinavian | 11 | 4.3% | View All 13 Rows |
Immigrants in Steely Hollow
The most numerous immigrant groups reported in Steely Hollow came from Caribbean (20 | 7.7%), Dominican Republic (20 | 7.7%), Latin America (20 | 7.7%), Asia (8 | 3.1%), and Laos (8 | 3.1%), together accounting for 29.4% of all Steely Hollow residents.
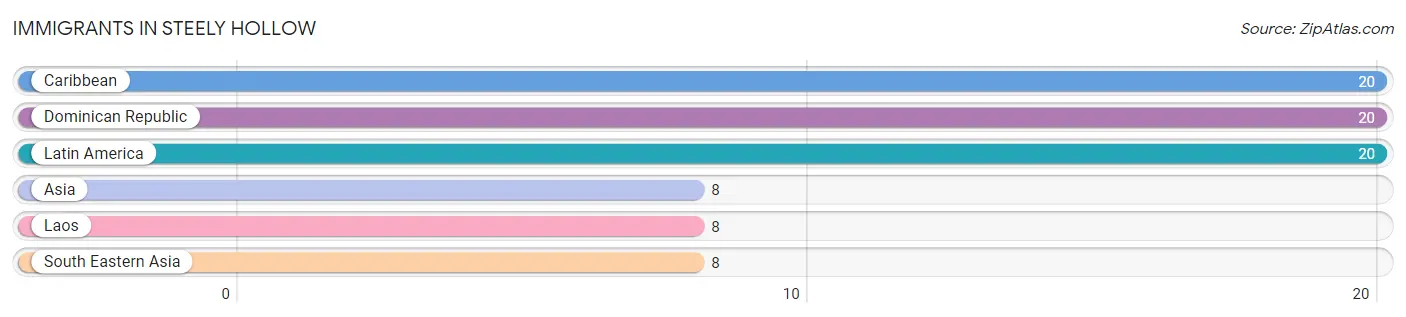
| Immigration Origin | # Population | % Population |
| Asia | 8 | 3.1% |
| Caribbean | 20 | 7.7% |
| Dominican Republic | 20 | 7.7% |
| Laos | 8 | 3.1% |
| Latin America | 20 | 7.7% |
| South Eastern Asia | 8 | 3.1% | View All 6 Rows |
Sex and Age in Steely Hollow
Sex and Age in Steely Hollow
The most populous age groups in Steely Hollow are 60 to 64 Years (21 | 32.3%) for men and 65 to 69 Years (91 | 47.1%) for women.
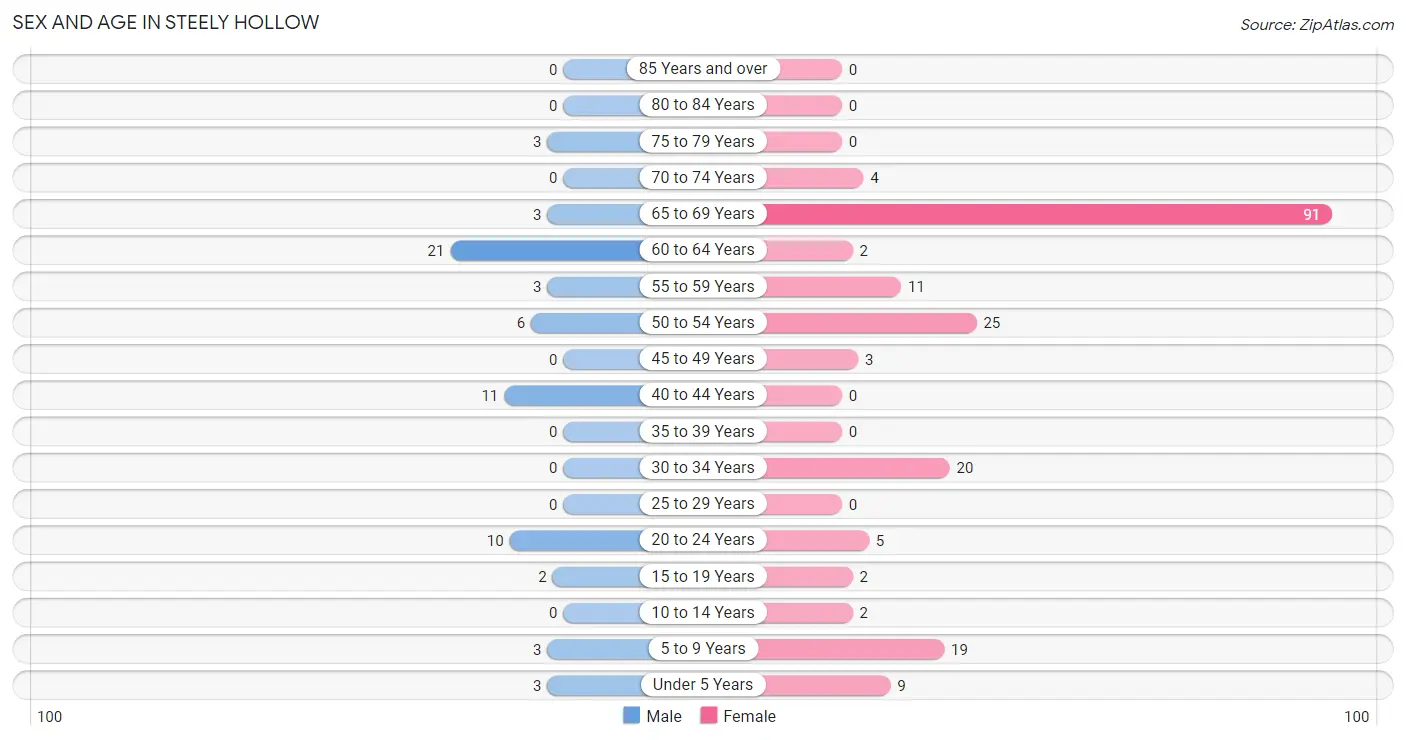
| Age Bracket | Male | Female |
| Under 5 Years | 3 (4.6%) | 9 (4.7%) |
| 5 to 9 Years | 3 (4.6%) | 19 (9.8%) |
| 10 to 14 Years | 0 (0.0%) | 2 (1.0%) |
| 15 to 19 Years | 2 (3.1%) | 2 (1.0%) |
| 20 to 24 Years | 10 (15.4%) | 5 (2.6%) |
| 25 to 29 Years | 0 (0.0%) | 0 (0.0%) |
| 30 to 34 Years | 0 (0.0%) | 20 (10.4%) |
| 35 to 39 Years | 0 (0.0%) | 0 (0.0%) |
| 40 to 44 Years | 11 (16.9%) | 0 (0.0%) |
| 45 to 49 Years | 0 (0.0%) | 3 (1.5%) |
| 50 to 54 Years | 6 (9.2%) | 25 (13.0%) |
| 55 to 59 Years | 3 (4.6%) | 11 (5.7%) |
| 60 to 64 Years | 21 (32.3%) | 2 (1.0%) |
| 65 to 69 Years | 3 (4.6%) | 91 (47.1%) |
| 70 to 74 Years | 0 (0.0%) | 4 (2.1%) |
| 75 to 79 Years | 3 (4.6%) | 0 (0.0%) |
| 80 to 84 Years | 0 (0.0%) | 0 (0.0%) |
| 85 Years and over | 0 (0.0%) | 0 (0.0%) |
| Total | 65 (100.0%) | 193 (100.0%) |
Families and Households in Steely Hollow
Median Family Size in Steely Hollow
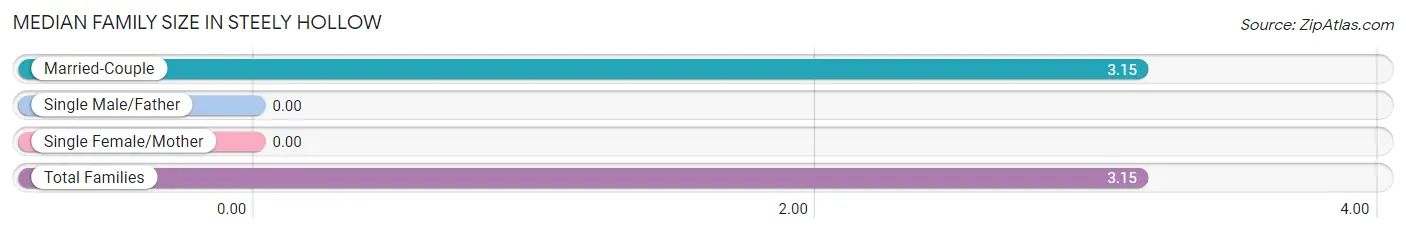
| Family Type | # Families | Family Size |
| Married-Couple | 48 (100.0%) | 3.15 |
| Single Male/Father | 0 (0.0%) | - |
| Single Female/Mother | 0 (0.0%) | - |
| Total Families | 48 (100.0%) | 3.15 |
Median Household Size in Steely Hollow
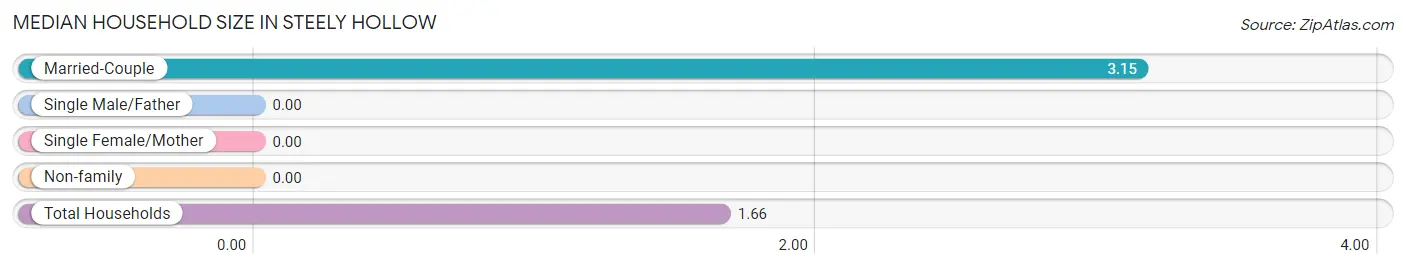
| Household Type | # Households | Household Size |
| Married-Couple | 48 (31.0%) | 3.15 |
| Single Male/Father | 0 (0.0%) | - |
| Single Female/Mother | 0 (0.0%) | - |
| Non-family | 107 (69.0%) | - |
| Total Households | 155 (100.0%) | 1.66 |
Household Size by Marriage Status in Steely Hollow
Out of a total of 155 households in Steely Hollow, 48 (31.0%) are family households, while 107 (69.0%) are nonfamily households. The most numerous type of family households are 2-person households, comprising 24, and the most common type of nonfamily households are 1-person households, comprising 107.
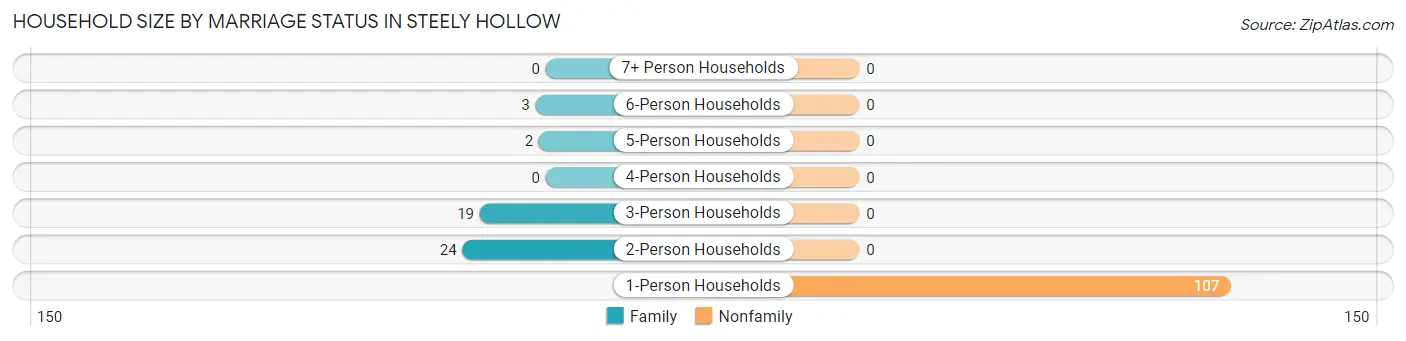
| Household Size | Family Households | Nonfamily Households |
| 1-Person Households | - | 107 (69.0%) |
| 2-Person Households | 24 (15.5%) | 0 (0.0%) |
| 3-Person Households | 19 (12.3%) | 0 (0.0%) |
| 4-Person Households | 0 (0.0%) | 0 (0.0%) |
| 5-Person Households | 2 (1.3%) | 0 (0.0%) |
| 6-Person Households | 3 (1.9%) | 0 (0.0%) |
| 7+ Person Households | 0 (0.0%) | 0 (0.0%) |
| Total | 48 (31.0%) | 107 (69.0%) |
Female Fertility in Steely Hollow
Fertility by Age in Steely Hollow
Average fertility rate in Steely Hollow is 100.0 births per 1,000 women. Women in the age bracket of 35 to 50 years have the highest fertility rate with 1,000.0 births per 1,000 women. Women in the age bracket of 35 to 50 years acount for 100.0% of all women with births.
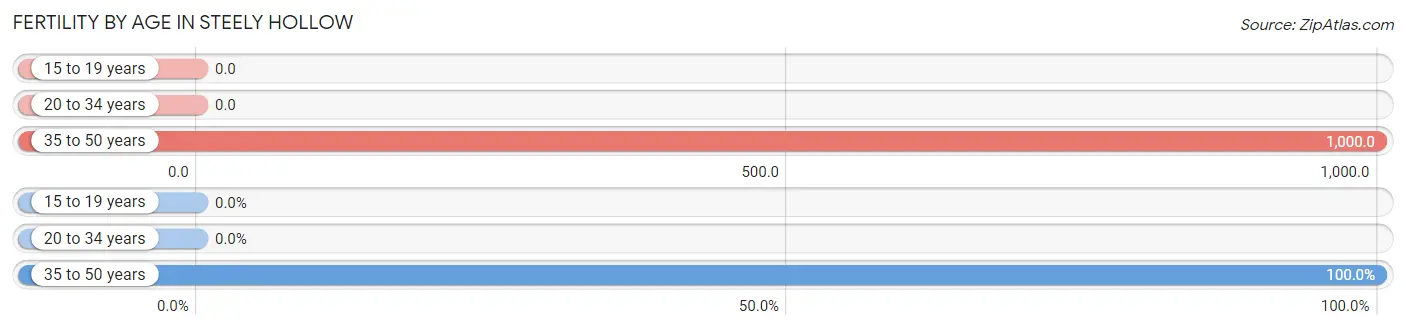
| Age Bracket | Women with Births | Births / 1,000 Women |
| 15 to 19 years | 0 (0.0%) | 0.0 |
| 20 to 34 years | 0 (0.0%) | 0.0 |
| 35 to 50 years | 3 (100.0%) | 1,000.0 |
| Total | 3 (100.0%) | 100.0 |
Fertility by Age by Marriage Status in Steely Hollow
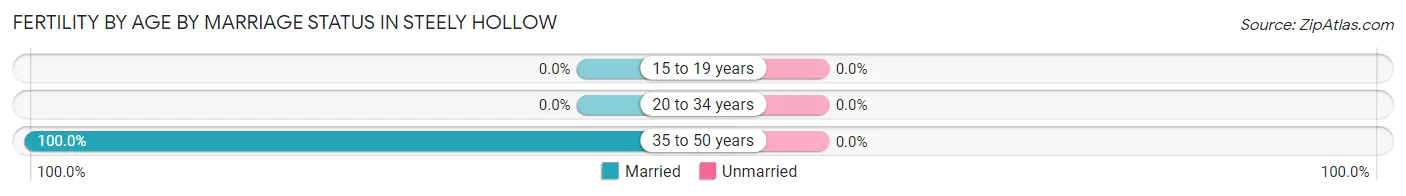
| Age Bracket | Married | Unmarried |
| 15 to 19 years | 0 (0.0%) | 0 (0.0%) |
| 20 to 34 years | 0 (0.0%) | 0 (0.0%) |
| 35 to 50 years | 3 (100.0%) | 0 (0.0%) |
| Total | 3 (100.0%) | 0 (0.0%) |
Fertility by Education in Steely Hollow
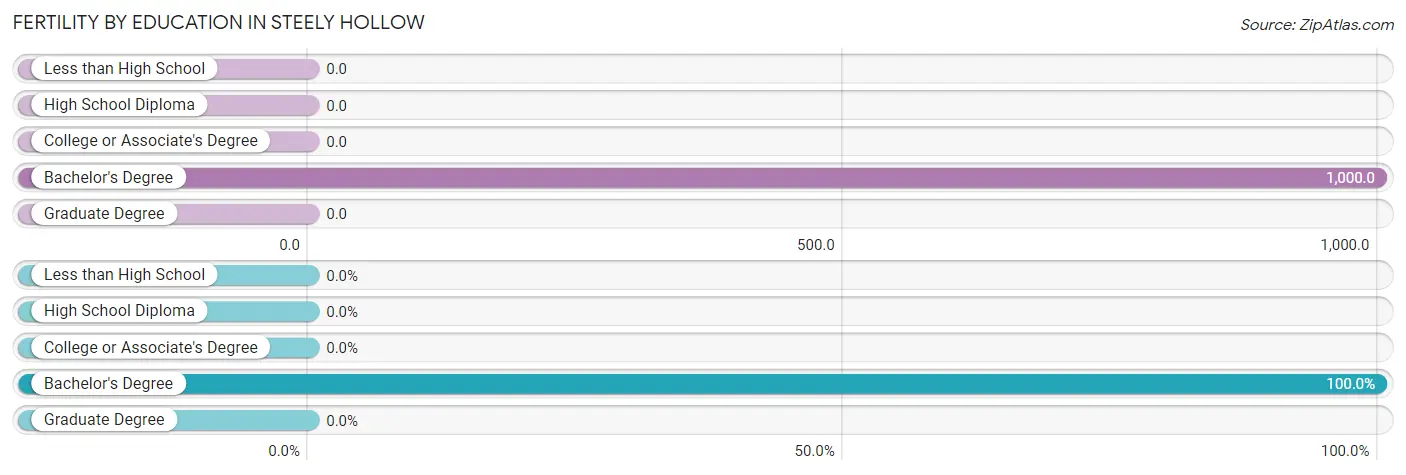
| Educational Attainment | Women with Births | Births / 1,000 Women |
| Less than High School | 0 (0.0%) | 0.0 |
| High School Diploma | 0 (0.0%) | 0.0 |
| College or Associate's Degree | 0 (0.0%) | 0.0 |
| Bachelor's Degree | 3 (100.0%) | 1,000.0 |
| Graduate Degree | 0 (0.0%) | 0.0 |
| Total | 3 (100.0%) | 100.0 |
Fertility by Education by Marriage Status in Steely Hollow
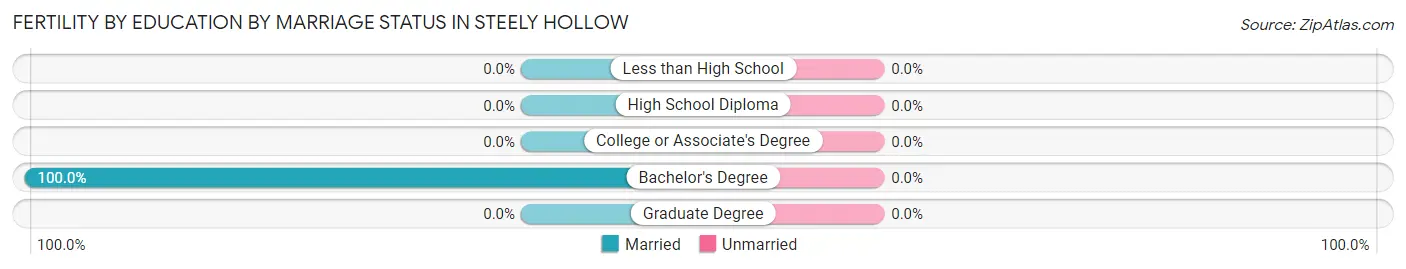
| Educational Attainment | Married | Unmarried |
| Less than High School | 0 (0.0%) | 0 (0.0%) |
| High School Diploma | 0 (0.0%) | 0 (0.0%) |
| College or Associate's Degree | 0 (0.0%) | 0 (0.0%) |
| Bachelor's Degree | 3 (100.0%) | 0 (0.0%) |
| Graduate Degree | 0 (0.0%) | 0 (0.0%) |
| Total | 3 (100.0%) | 0 (0.0%) |
Employment Characteristics in Steely Hollow
Employment by Class of Employer in Steely Hollow
Among the 82 employed individuals in Steely Hollow, private company employees (44 | 53.7%), federal government employees (25 | 30.5%), and self-employed (not incorporated) (8 | 9.8%) make up the most common classes of employment.
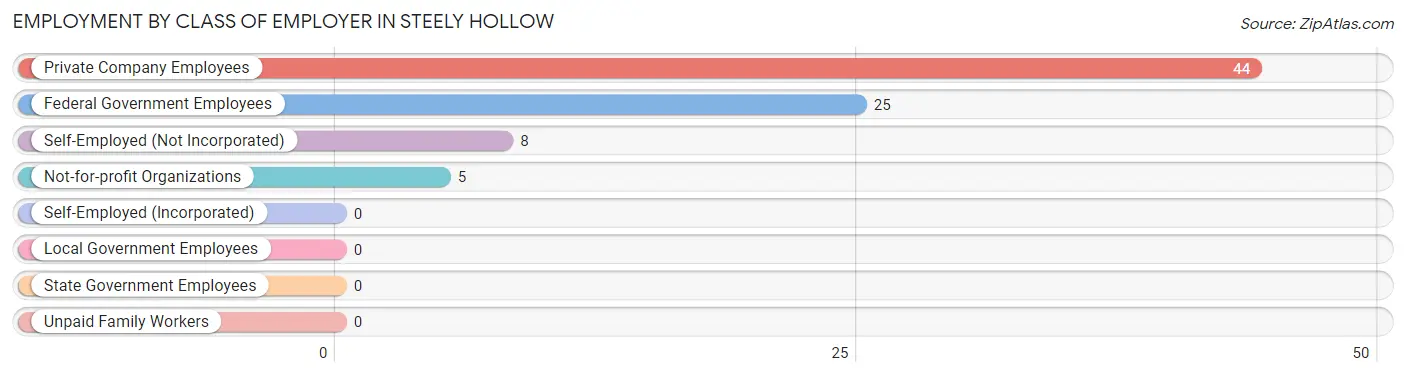
| Employer Class | # Employees | % Employees |
| Private Company Employees | 44 | 53.7% |
| Self-Employed (Incorporated) | 0 | 0.0% |
| Self-Employed (Not Incorporated) | 8 | 9.8% |
| Not-for-profit Organizations | 5 | 6.1% |
| Local Government Employees | 0 | 0.0% |
| State Government Employees | 0 | 0.0% |
| Federal Government Employees | 25 | 30.5% |
| Unpaid Family Workers | 0 | 0.0% |
| Total | 82 | 100.0% |
Employment Status by Age in Steely Hollow
According to the labor force statistics for Steely Hollow, out of the total population over 16 years of age (218), 39.0% or 85 individuals are in the labor force, with 3.5% or 3 of them unemployed. The age group with the highest labor force participation rate is 55 to 59 years, with 100.0% or 14 individuals in the labor force. Within the labor force, the 55 to 59 years age range has the highest percentage of unemployed individuals, with 21.4% or 3 of them being unemployed.
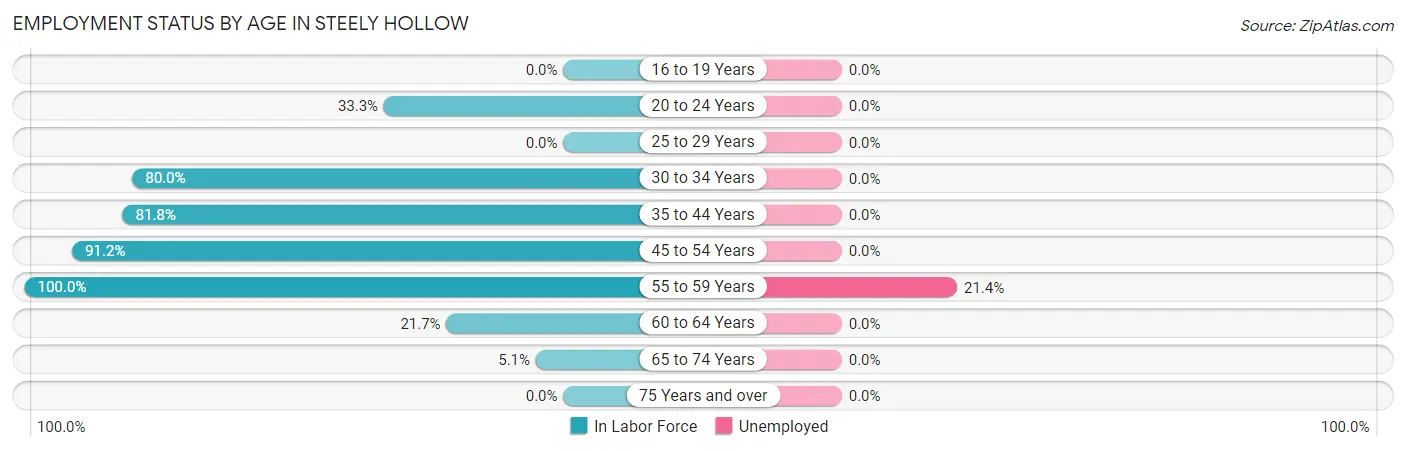
| Age Bracket | In Labor Force | Unemployed |
| 16 to 19 Years | 0 (0.0%) | 0 (0.0%) |
| 20 to 24 Years | 5 (33.3%) | 0 (0.0%) |
| 25 to 29 Years | 0 (0.0%) | 0 (0.0%) |
| 30 to 34 Years | 16 (80.0%) | 0 (0.0%) |
| 35 to 44 Years | 9 (81.8%) | 0 (0.0%) |
| 45 to 54 Years | 31 (91.2%) | 0 (0.0%) |
| 55 to 59 Years | 14 (100.0%) | 3 (21.4%) |
| 60 to 64 Years | 5 (21.7%) | 0 (0.0%) |
| 65 to 74 Years | 5 (5.1%) | 0 (0.0%) |
| 75 Years and over | 0 (0.0%) | 0 (0.0%) |
| Total | 85 (39.0%) | 3 (3.5%) |
Employment Status by Educational Attainment in Steely Hollow
According to labor force statistics for Steely Hollow, 73.5% of individuals (75) out of the total population between 25 and 64 years of age (102) are in the labor force, with 4.0% or 3 of them being unemployed. The group with the highest labor force participation rate are those with the educational attainment of less than high school, with 100.0% or 8 individuals in the labor force. Within the labor force, individuals with bachelor's degree or higher education have the highest percentage of unemployment, with 8.1% or 3 of them being unemployed.
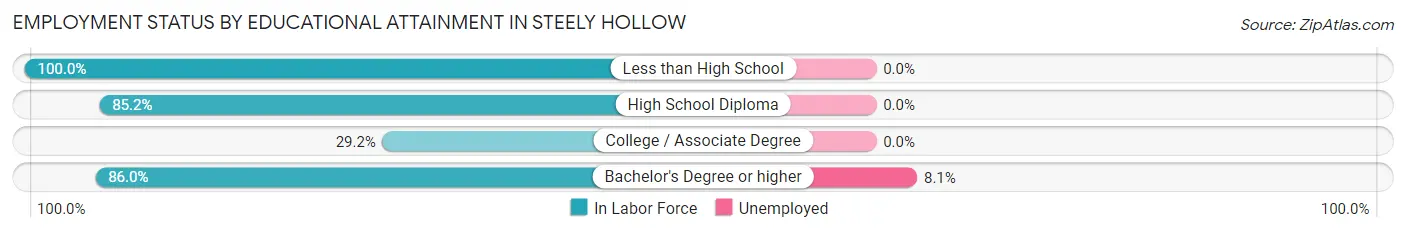
| Educational Attainment | In Labor Force | Unemployed |
| Less than High School | 8 (100.0%) | 0 (0.0%) |
| High School Diploma | 23 (85.2%) | 0 (0.0%) |
| College / Associate Degree | 7 (29.2%) | 0 (0.0%) |
| Bachelor's Degree or higher | 37 (86.0%) | 3 (8.1%) |
| Total | 75 (73.5%) | 4 (4.0%) |
Employment Occupations by Sex in Steely Hollow
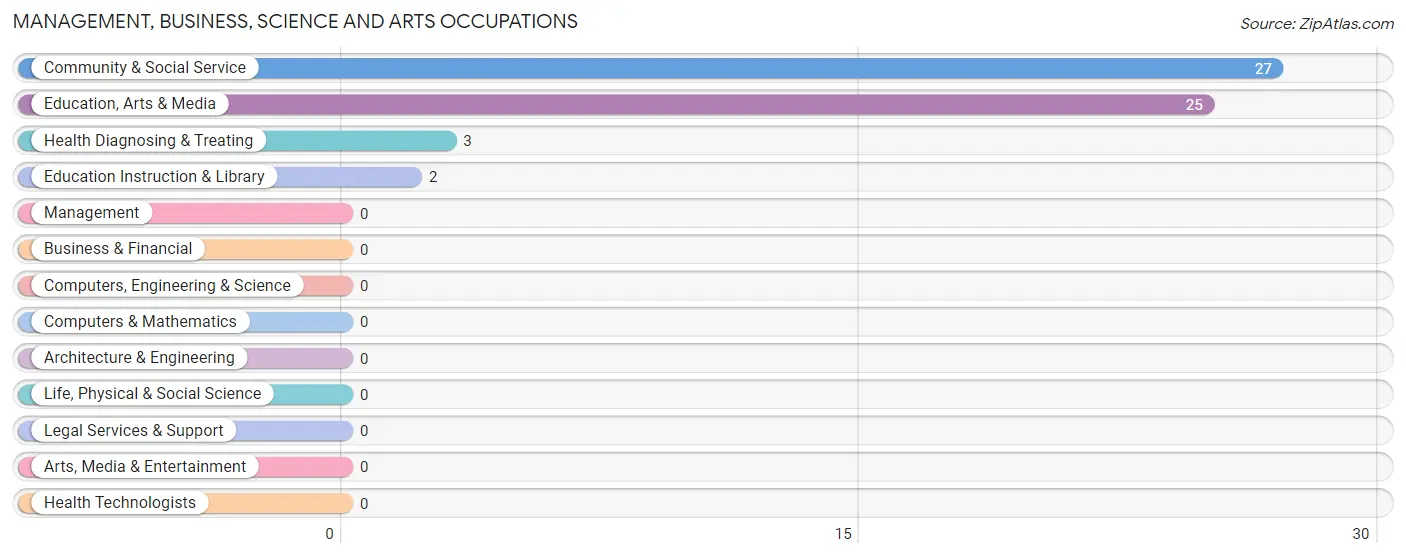
Management, Business, Science and Arts Occupations
The most common Management, Business, Science and Arts occupations in Steely Hollow are Community & Social Service (27 | 32.9%), Education, Arts & Media (25 | 30.5%), Health Diagnosing & Treating (3 | 3.7%), and Education Instruction & Library (2 | 2.4%).
Management, Business, Science and Arts Occupations by Sex
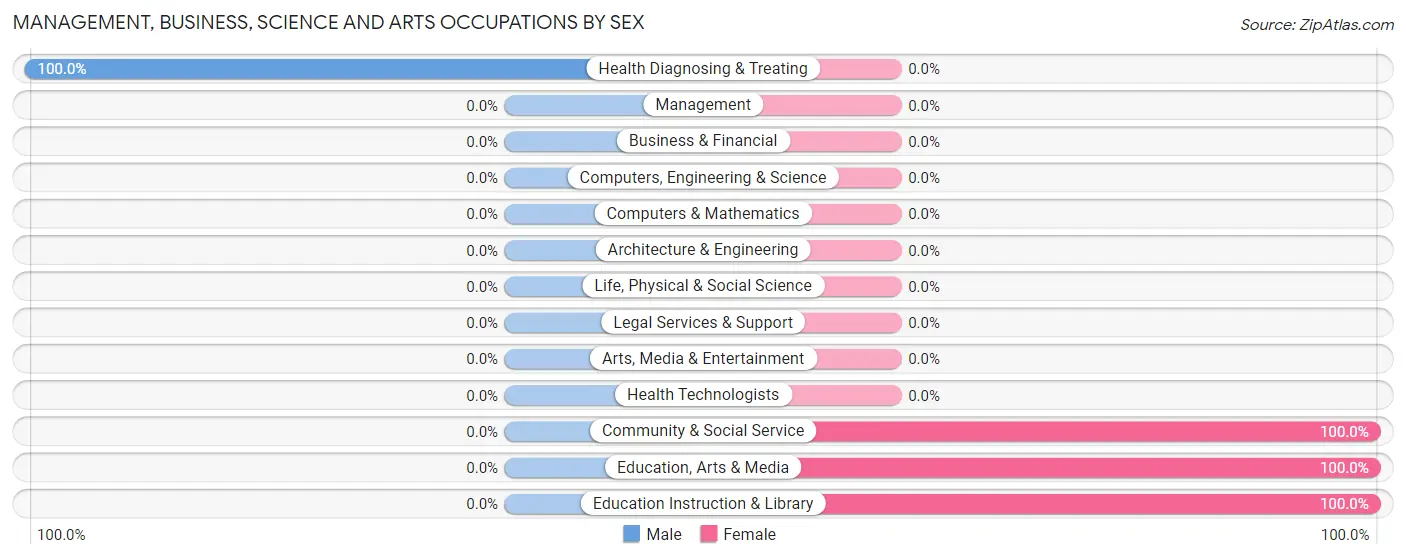
| Occupation | Male | Female |
| Management | 0 (0.0%) | 0 (0.0%) |
| Business & Financial | 0 (0.0%) | 0 (0.0%) |
| Computers, Engineering & Science | 0 (0.0%) | 0 (0.0%) |
| Computers & Mathematics | 0 (0.0%) | 0 (0.0%) |
| Architecture & Engineering | 0 (0.0%) | 0 (0.0%) |
| Life, Physical & Social Science | 0 (0.0%) | 0 (0.0%) |
| Community & Social Service | 0 (0.0%) | 27 (100.0%) |
| Education, Arts & Media | 0 (0.0%) | 25 (100.0%) |
| Legal Services & Support | 0 (0.0%) | 0 (0.0%) |
| Education Instruction & Library | 0 (0.0%) | 2 (100.0%) |
| Arts, Media & Entertainment | 0 (0.0%) | 0 (0.0%) |
| Health Diagnosing & Treating | 3 (100.0%) | 0 (0.0%) |
| Health Technologists | 0 (0.0%) | 0 (0.0%) |
| Total (Category) | 3 (10.0%) | 27 (90.0%) |
| Total (Overall) | 27 (32.9%) | 55 (67.1%) |
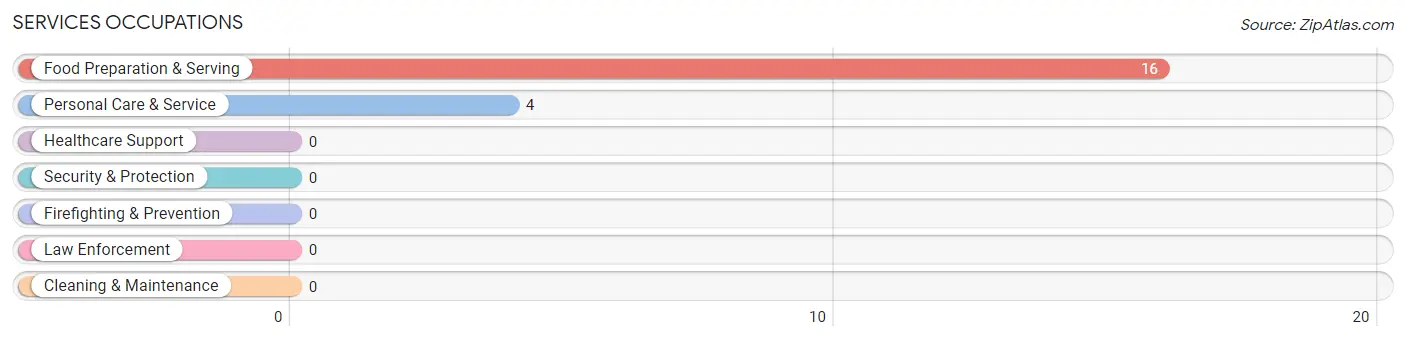
Services Occupations
The most common Services occupations in Steely Hollow are Food Preparation & Serving (16 | 19.5%), and Personal Care & Service (4 | 4.9%).
Services Occupations by Sex
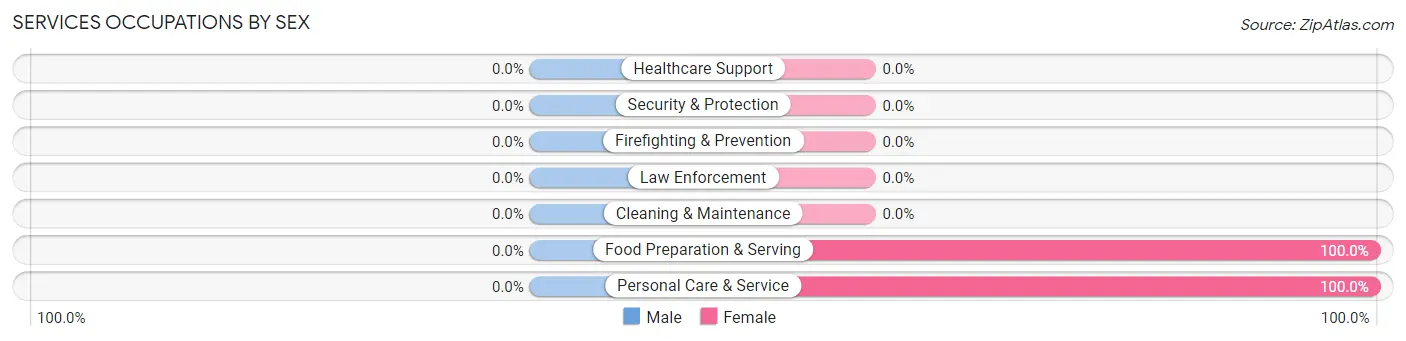
| Occupation | Male | Female |
| Healthcare Support | 0 (0.0%) | 0 (0.0%) |
| Security & Protection | 0 (0.0%) | 0 (0.0%) |
| Firefighting & Prevention | 0 (0.0%) | 0 (0.0%) |
| Law Enforcement | 0 (0.0%) | 0 (0.0%) |
| Food Preparation & Serving | 0 (0.0%) | 16 (100.0%) |
| Cleaning & Maintenance | 0 (0.0%) | 0 (0.0%) |
| Personal Care & Service | 0 (0.0%) | 4 (100.0%) |
| Total (Category) | 0 (0.0%) | 20 (100.0%) |
| Total (Overall) | 27 (32.9%) | 55 (67.1%) |
Sales and Office Occupations
The most common Sales and Office occupations in Steely Hollow are Office & Administration (9 | 11.0%), and Sales & Related (6 | 7.3%).
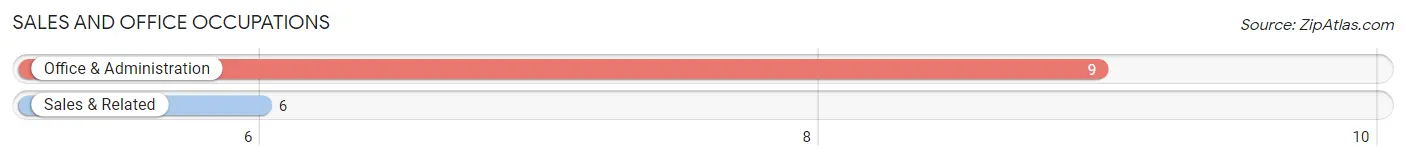
Sales and Office Occupations by Sex
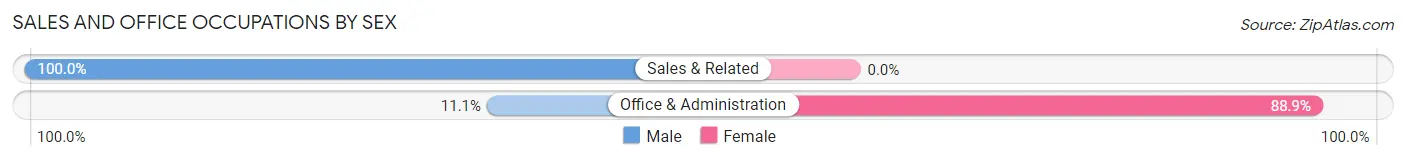
| Occupation | Male | Female |
| Sales & Related | 6 (100.0%) | 0 (0.0%) |
| Office & Administration | 1 (11.1%) | 8 (88.9%) |
| Total (Category) | 7 (46.7%) | 8 (53.3%) |
| Total (Overall) | 27 (32.9%) | 55 (67.1%) |
Natural Resources, Construction and Maintenance Occupations
The most common Natural Resources, Construction and Maintenance occupations in Steely Hollow are Installation, Maintenance & Repair (5 | 6.1%), and Construction & Extraction (3 | 3.7%).
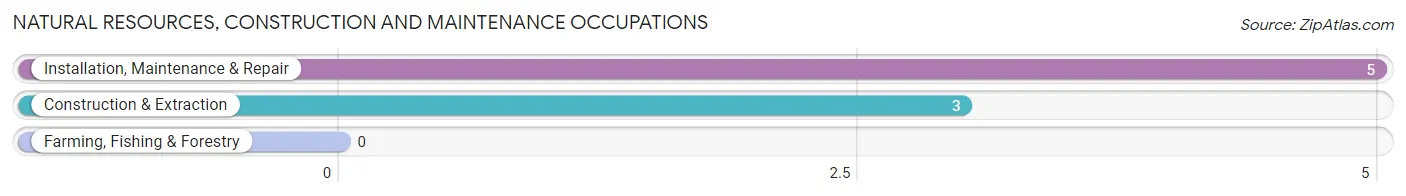
Natural Resources, Construction and Maintenance Occupations by Sex
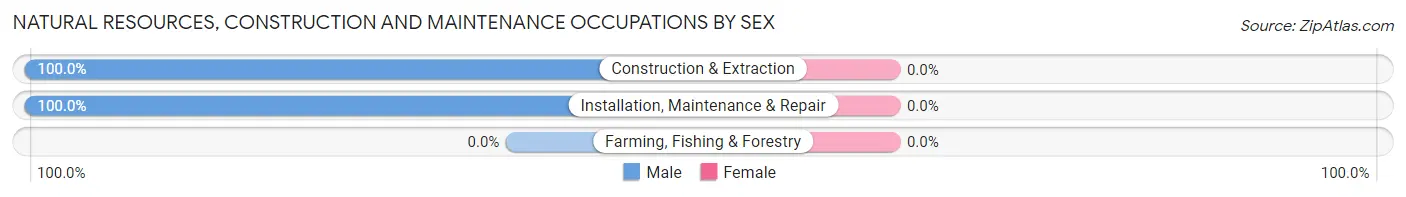
| Occupation | Male | Female |
| Farming, Fishing & Forestry | 0 (0.0%) | 0 (0.0%) |
| Construction & Extraction | 3 (100.0%) | 0 (0.0%) |
| Installation, Maintenance & Repair | 5 (100.0%) | 0 (0.0%) |
| Total (Category) | 8 (100.0%) | 0 (0.0%) |
| Total (Overall) | 27 (32.9%) | 55 (67.1%) |
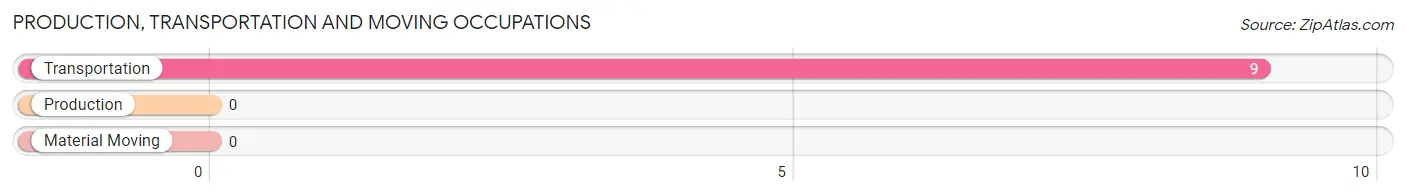
Production, Transportation and Moving Occupations
The most common Production, Transportation and Moving occupations in Steely Hollow are , and Transportation (9 | 11.0%).
Production, Transportation and Moving Occupations by Sex
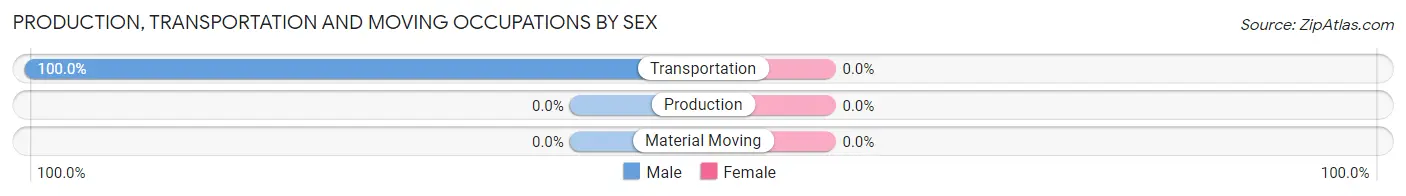
| Occupation | Male | Female |
| Production | 0 (0.0%) | 0 (0.0%) |
| Transportation | 9 (100.0%) | 0 (0.0%) |
| Material Moving | 0 (0.0%) | 0 (0.0%) |
| Total (Category) | 9 (100.0%) | 0 (0.0%) |
| Total (Overall) | 27 (32.9%) | 55 (67.1%) |
Employment Industries by Sex in Steely Hollow
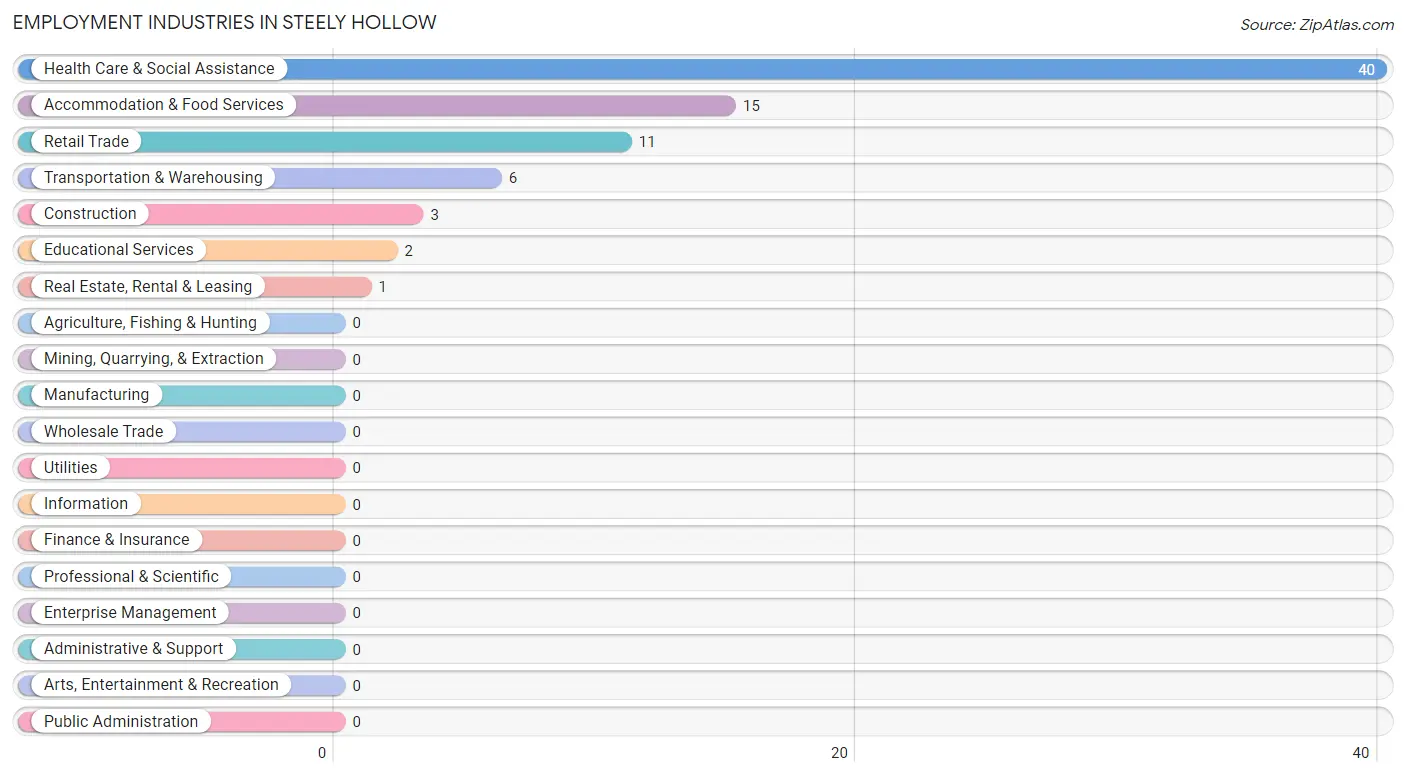
Employment Industries in Steely Hollow
The major employment industries in Steely Hollow include Health Care & Social Assistance (40 | 48.8%), Accommodation & Food Services (15 | 18.3%), Retail Trade (11 | 13.4%), Transportation & Warehousing (6 | 7.3%), and Construction (3 | 3.7%).
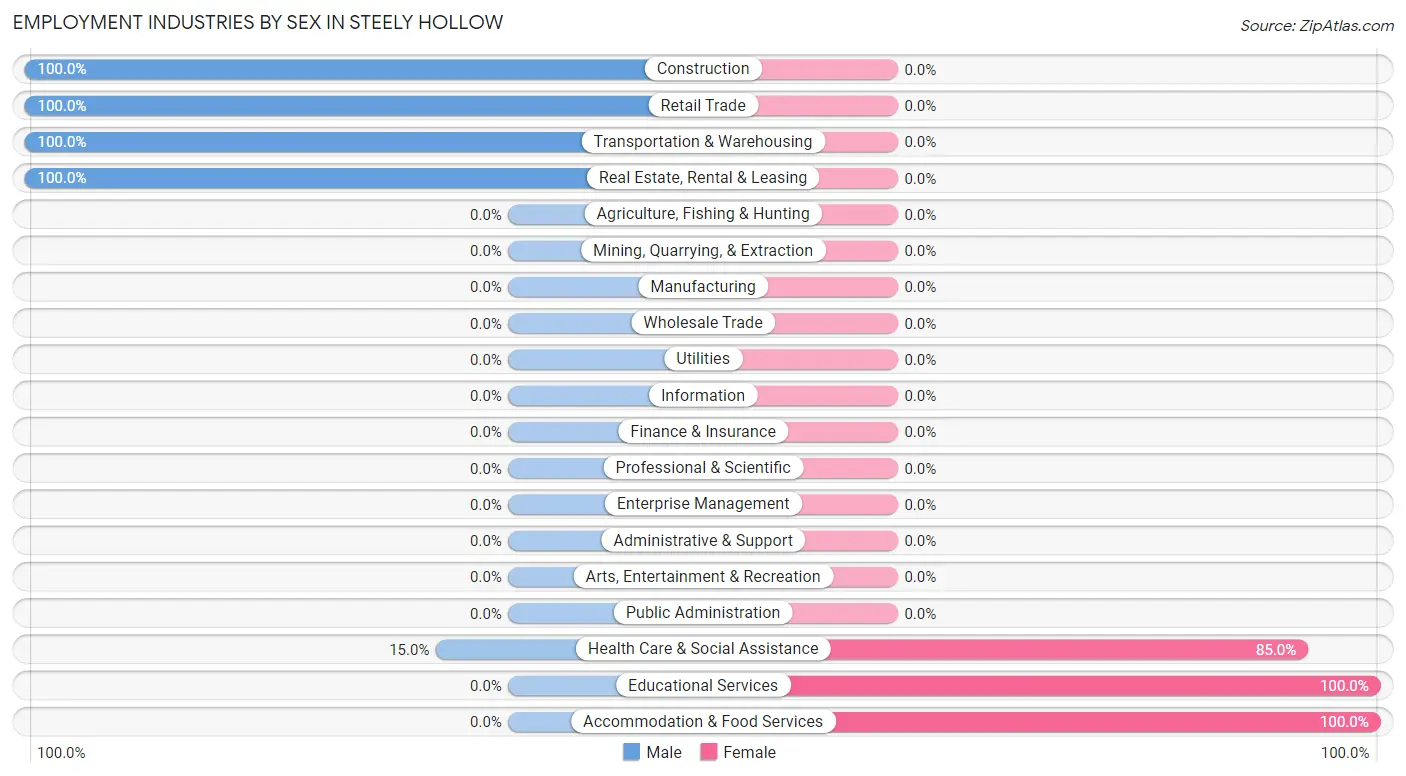
Employment Industries by Sex in Steely Hollow
The Steely Hollow industries that see more men than women are Construction (100.0%), Retail Trade (100.0%), and Transportation & Warehousing (100.0%), whereas the industries that tend to have a higher number of women are Educational Services (100.0%), Accommodation & Food Services (100.0%), and Health Care & Social Assistance (85.0%).
| Industry | Male | Female |
| Agriculture, Fishing & Hunting | 0 (0.0%) | 0 (0.0%) |
| Mining, Quarrying, & Extraction | 0 (0.0%) | 0 (0.0%) |
| Construction | 3 (100.0%) | 0 (0.0%) |
| Manufacturing | 0 (0.0%) | 0 (0.0%) |
| Wholesale Trade | 0 (0.0%) | 0 (0.0%) |
| Retail Trade | 11 (100.0%) | 0 (0.0%) |
| Transportation & Warehousing | 6 (100.0%) | 0 (0.0%) |
| Utilities | 0 (0.0%) | 0 (0.0%) |
| Information | 0 (0.0%) | 0 (0.0%) |
| Finance & Insurance | 0 (0.0%) | 0 (0.0%) |
| Real Estate, Rental & Leasing | 1 (100.0%) | 0 (0.0%) |
| Professional & Scientific | 0 (0.0%) | 0 (0.0%) |
| Enterprise Management | 0 (0.0%) | 0 (0.0%) |
| Administrative & Support | 0 (0.0%) | 0 (0.0%) |
| Educational Services | 0 (0.0%) | 2 (100.0%) |
| Health Care & Social Assistance | 6 (15.0%) | 34 (85.0%) |
| Arts, Entertainment & Recreation | 0 (0.0%) | 0 (0.0%) |
| Accommodation & Food Services | 0 (0.0%) | 15 (100.0%) |
| Public Administration | 0 (0.0%) | 0 (0.0%) |
| Total | 27 (32.9%) | 55 (67.1%) |
Education in Steely Hollow
School Enrollment in Steely Hollow
The most common levels of schooling among the 38 students in Steely Hollow are middle school (13 | 34.2%), elementary school (11 | 28.9%), and college / undergraduate (7 | 18.4%).
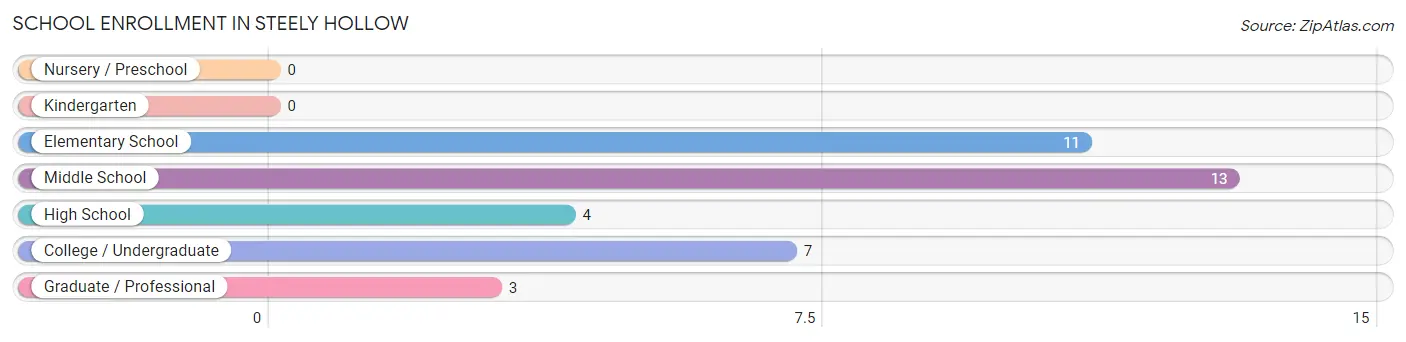
| School Level | # Students | % Students |
| Nursery / Preschool | 0 | 0.0% |
| Kindergarten | 0 | 0.0% |
| Elementary School | 11 | 28.9% |
| Middle School | 13 | 34.2% |
| High School | 4 | 10.5% |
| College / Undergraduate | 7 | 18.4% |
| Graduate / Professional | 3 | 7.9% |
| Total | 38 | 100.0% |
School Enrollment by Age by Funding Source in Steely Hollow
Out of a total of 38 students who are enrolled in schools in Steely Hollow, 8 (21.1%) attend a private institution, while the remaining 30 (78.9%) are enrolled in public schools. The age group of 15 to 17 year olds has the highest likelihood of being enrolled in private schools, with 2 (50.0% in the age bracket) enrolled. Conversely, the age group of 10 to 14 year olds has the lowest likelihood of being enrolled in a private school, with 2 (100.0% in the age bracket) attending a public institution.
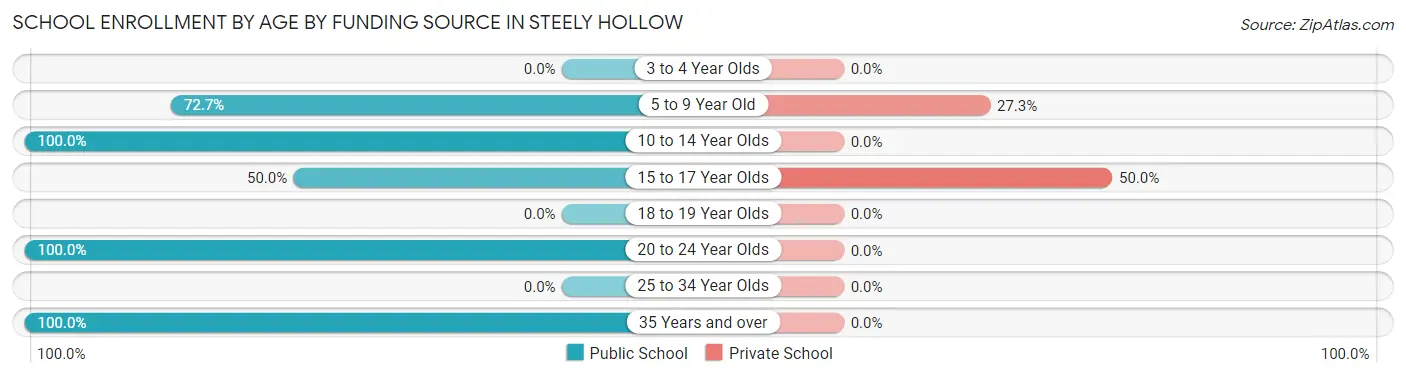
| Age Bracket | Public School | Private School |
| 3 to 4 Year Olds | 0 (0.0%) | 0 (0.0%) |
| 5 to 9 Year Old | 16 (72.7%) | 6 (27.3%) |
| 10 to 14 Year Olds | 2 (100.0%) | 0 (0.0%) |
| 15 to 17 Year Olds | 2 (50.0%) | 2 (50.0%) |
| 18 to 19 Year Olds | 0 (0.0%) | 0 (0.0%) |
| 20 to 24 Year Olds | 5 (100.0%) | 0 (0.0%) |
| 25 to 34 Year Olds | 0 (0.0%) | 0 (0.0%) |
| 35 Years and over | 5 (100.0%) | 0 (0.0%) |
| Total | 30 (78.9%) | 8 (21.1%) |
Educational Attainment by Field of Study in Steely Hollow
Education (87 | 71.3%), bio, nature & agricultural (14 | 11.5%), physical & health sciences (6 | 4.9%), business (6 | 4.9%), and computers & mathematics (3 | 2.5%) are the most common fields of study among 122 individuals in Steely Hollow who have obtained a bachelor's degree or higher.
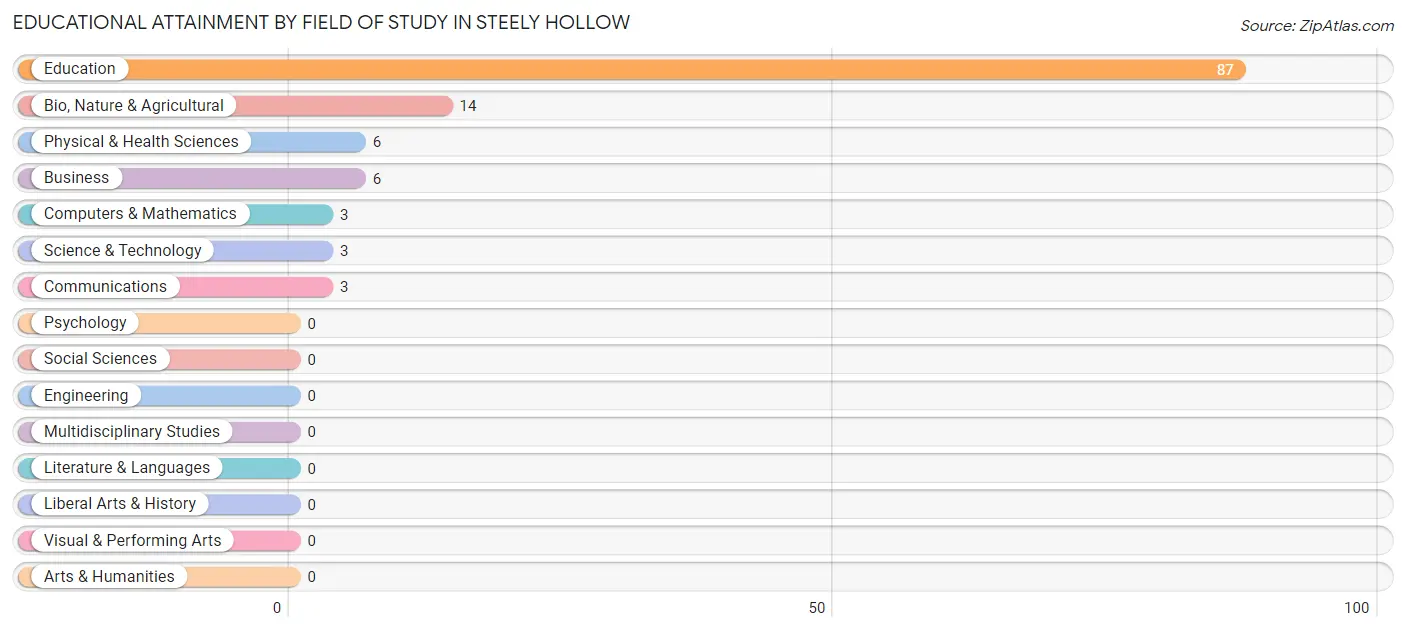
| Field of Study | # Graduates | % Graduates |
| Computers & Mathematics | 3 | 2.5% |
| Bio, Nature & Agricultural | 14 | 11.5% |
| Physical & Health Sciences | 6 | 4.9% |
| Psychology | 0 | 0.0% |
| Social Sciences | 0 | 0.0% |
| Engineering | 0 | 0.0% |
| Multidisciplinary Studies | 0 | 0.0% |
| Science & Technology | 3 | 2.5% |
| Business | 6 | 4.9% |
| Education | 87 | 71.3% |
| Literature & Languages | 0 | 0.0% |
| Liberal Arts & History | 0 | 0.0% |
| Visual & Performing Arts | 0 | 0.0% |
| Communications | 3 | 2.5% |
| Arts & Humanities | 0 | 0.0% |
| Total | 122 | 100.0% |
Transportation & Commute in Steely Hollow
Vehicle Availability by Sex in Steely Hollow
The most prevalent vehicle ownership categories in Steely Hollow are males with 2 vehicles (12, accounting for 44.4%) and females with 2 vehicles (20, making up 21.8%).
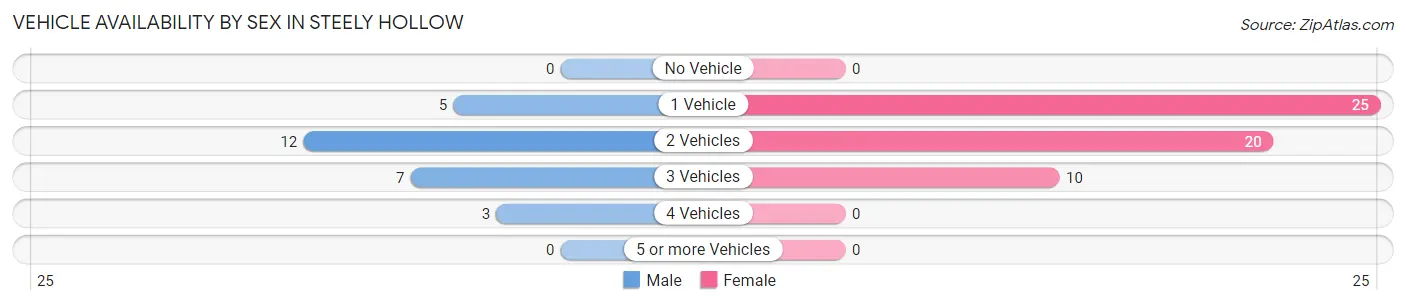
| Vehicles Available | Male | Female |
| No Vehicle | 0 (0.0%) | 0 (0.0%) |
| 1 Vehicle | 5 (18.5%) | 25 (45.5%) |
| 2 Vehicles | 12 (44.4%) | 20 (36.4%) |
| 3 Vehicles | 7 (25.9%) | 10 (18.2%) |
| 4 Vehicles | 3 (11.1%) | 0 (0.0%) |
| 5 or more Vehicles | 0 (0.0%) | 0 (0.0%) |
| Total | 27 (100.0%) | 55 (100.0%) |
Commute Time in Steely Hollow
The most frequently occuring commute durations in Steely Hollow are 30 to 34 minutes (30 commuters, 41.1%), 15 to 19 minutes (20 commuters, 27.4%), and 45 to 59 minutes (13 commuters, 17.8%).
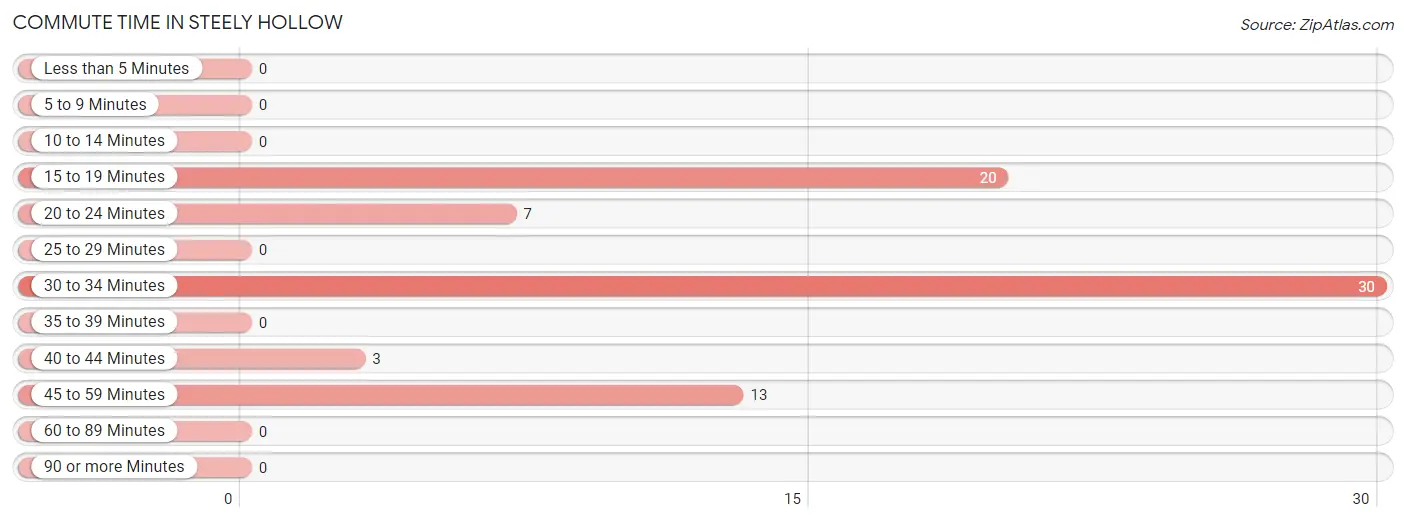
| Commute Time | # Commuters | % Commuters |
| Less than 5 Minutes | 0 | 0.0% |
| 5 to 9 Minutes | 0 | 0.0% |
| 10 to 14 Minutes | 0 | 0.0% |
| 15 to 19 Minutes | 20 | 27.4% |
| 20 to 24 Minutes | 7 | 9.6% |
| 25 to 29 Minutes | 0 | 0.0% |
| 30 to 34 Minutes | 30 | 41.1% |
| 35 to 39 Minutes | 0 | 0.0% |
| 40 to 44 Minutes | 3 | 4.1% |
| 45 to 59 Minutes | 13 | 17.8% |
| 60 to 89 Minutes | 0 | 0.0% |
| 90 or more Minutes | 0 | 0.0% |
Commute Time by Sex in Steely Hollow
The most common commute times in Steely Hollow are 15 to 19 minutes (9 commuters, 34.6%) for males and 30 to 34 minutes (25 commuters, 53.2%) for females.
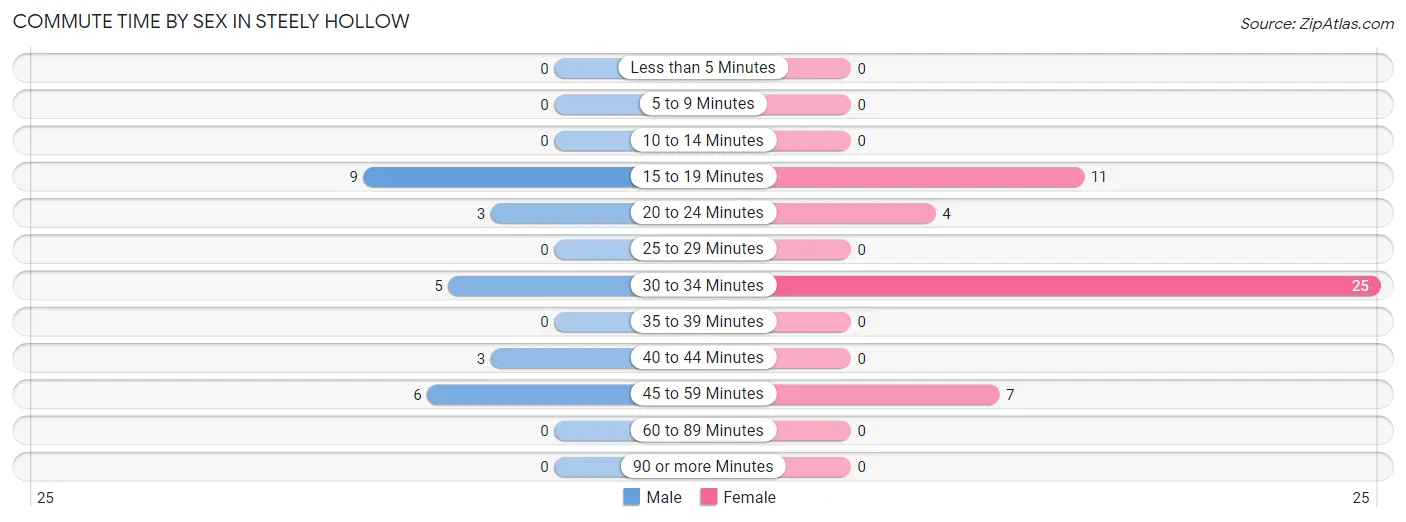
| Commute Time | Male | Female |
| Less than 5 Minutes | 0 (0.0%) | 0 (0.0%) |
| 5 to 9 Minutes | 0 (0.0%) | 0 (0.0%) |
| 10 to 14 Minutes | 0 (0.0%) | 0 (0.0%) |
| 15 to 19 Minutes | 9 (34.6%) | 11 (23.4%) |
| 20 to 24 Minutes | 3 (11.5%) | 4 (8.5%) |
| 25 to 29 Minutes | 0 (0.0%) | 0 (0.0%) |
| 30 to 34 Minutes | 5 (19.2%) | 25 (53.2%) |
| 35 to 39 Minutes | 0 (0.0%) | 0 (0.0%) |
| 40 to 44 Minutes | 3 (11.5%) | 0 (0.0%) |
| 45 to 59 Minutes | 6 (23.1%) | 7 (14.9%) |
| 60 to 89 Minutes | 0 (0.0%) | 0 (0.0%) |
| 90 or more Minutes | 0 (0.0%) | 0 (0.0%) |
Time of Departure to Work by Sex in Steely Hollow
The most frequent times of departure to work in Steely Hollow are 7:30 AM to 7:59 AM (9, 34.6%) for males and 12:00 PM to 3:59 PM (25, 53.2%) for females.
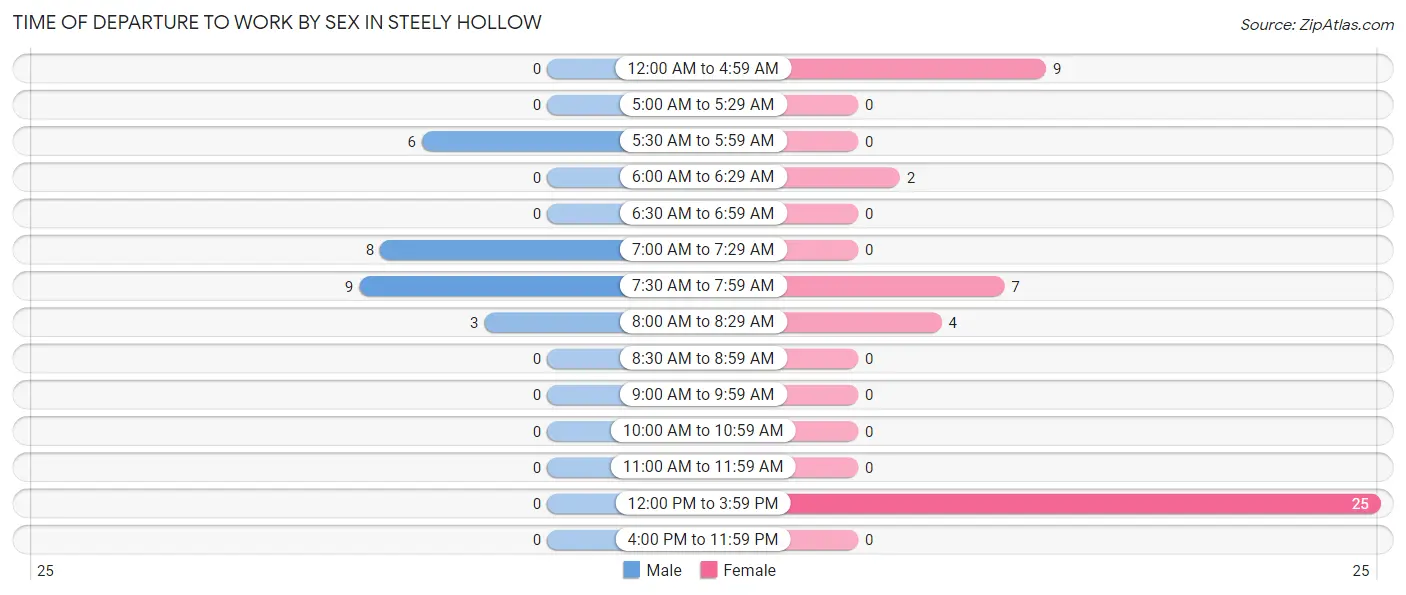
| Time of Departure | Male | Female |
| 12:00 AM to 4:59 AM | 0 (0.0%) | 9 (19.2%) |
| 5:00 AM to 5:29 AM | 0 (0.0%) | 0 (0.0%) |
| 5:30 AM to 5:59 AM | 6 (23.1%) | 0 (0.0%) |
| 6:00 AM to 6:29 AM | 0 (0.0%) | 2 (4.3%) |
| 6:30 AM to 6:59 AM | 0 (0.0%) | 0 (0.0%) |
| 7:00 AM to 7:29 AM | 8 (30.8%) | 0 (0.0%) |
| 7:30 AM to 7:59 AM | 9 (34.6%) | 7 (14.9%) |
| 8:00 AM to 8:29 AM | 3 (11.5%) | 4 (8.5%) |
| 8:30 AM to 8:59 AM | 0 (0.0%) | 0 (0.0%) |
| 9:00 AM to 9:59 AM | 0 (0.0%) | 0 (0.0%) |
| 10:00 AM to 10:59 AM | 0 (0.0%) | 0 (0.0%) |
| 11:00 AM to 11:59 AM | 0 (0.0%) | 0 (0.0%) |
| 12:00 PM to 3:59 PM | 0 (0.0%) | 25 (53.2%) |
| 4:00 PM to 11:59 PM | 0 (0.0%) | 0 (0.0%) |
| Total | 26 (100.0%) | 47 (100.0%) |
Housing Occupancy in Steely Hollow
Occupancy by Ownership in Steely Hollow
Of the total 155 dwellings in Steely Hollow, owner-occupied units account for 79 (51.0%), while renter-occupied units make up 76 (49.0%).
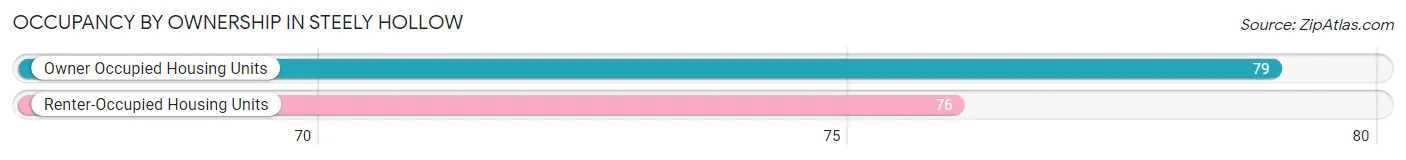
| Occupancy | # Housing Units | % Housing Units |
| Owner Occupied Housing Units | 79 | 51.0% |
| Renter-Occupied Housing Units | 76 | 49.0% |
| Total Occupied Housing Units | 155 | 100.0% |
Occupancy by Household Size in Steely Hollow
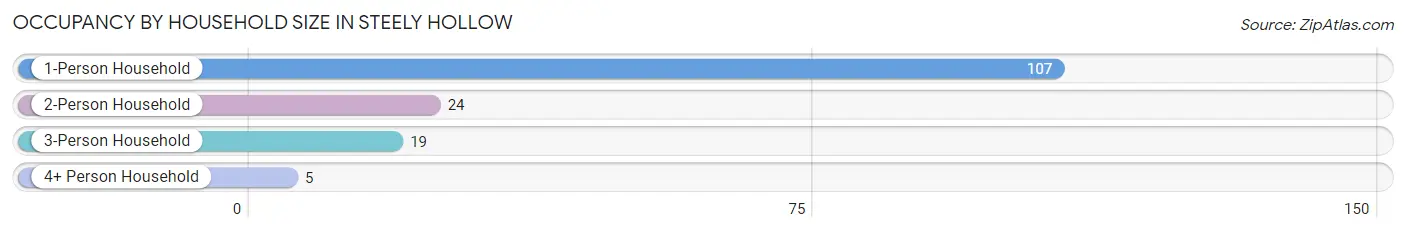
| Household Size | # Housing Units | % Housing Units |
| 1-Person Household | 107 | 69.0% |
| 2-Person Household | 24 | 15.5% |
| 3-Person Household | 19 | 12.3% |
| 4+ Person Household | 5 | 3.2% |
| Total Housing Units | 155 | 100.0% |
Occupancy by Ownership by Household Size in Steely Hollow
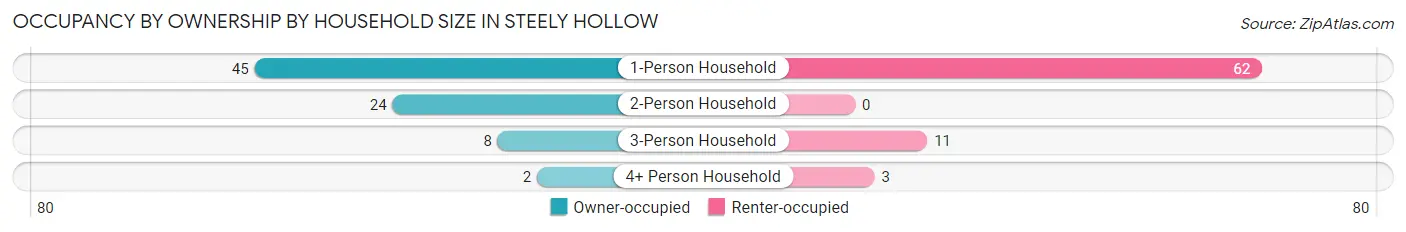
| Household Size | Owner-occupied | Renter-occupied |
| 1-Person Household | 45 (42.1%) | 62 (57.9%) |
| 2-Person Household | 24 (100.0%) | 0 (0.0%) |
| 3-Person Household | 8 (42.1%) | 11 (57.9%) |
| 4+ Person Household | 2 (40.0%) | 3 (60.0%) |
| Total Housing Units | 79 (51.0%) | 76 (49.0%) |
Occupancy by Educational Attainment in Steely Hollow
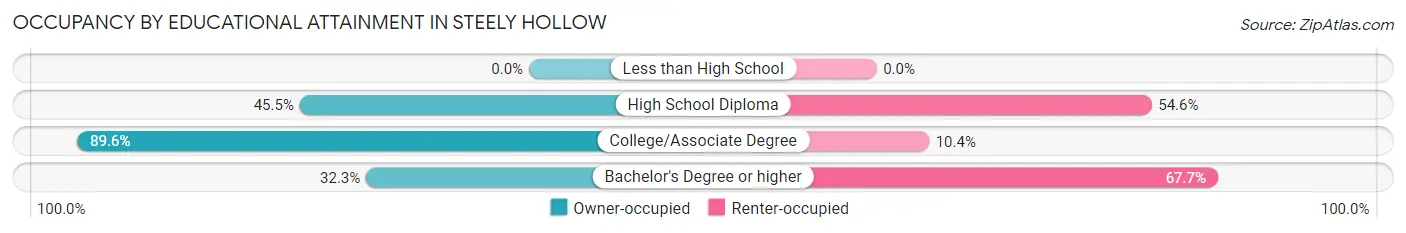
| Household Size | Owner-occupied | Renter-occupied |
| Less than High School | 0 (0.0%) | 0 (0.0%) |
| High School Diploma | 5 (45.5%) | 6 (54.5%) |
| College/Associate Degree | 43 (89.6%) | 5 (10.4%) |
| Bachelor's Degree or higher | 31 (32.3%) | 65 (67.7%) |
Occupancy by Age of Householder in Steely Hollow
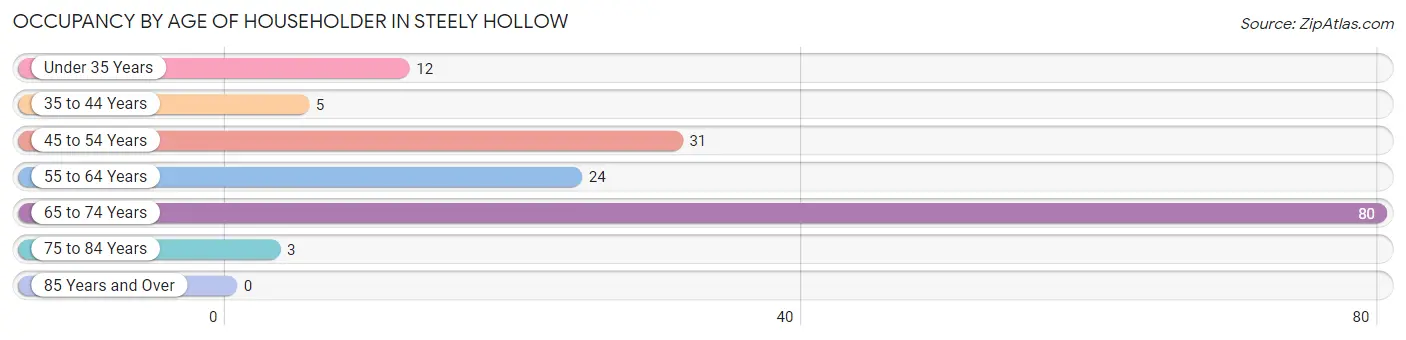
| Age Bracket | # Households | % Households |
| Under 35 Years | 12 | 7.7% |
| 35 to 44 Years | 5 | 3.2% |
| 45 to 54 Years | 31 | 20.0% |
| 55 to 64 Years | 24 | 15.5% |
| 65 to 74 Years | 80 | 51.6% |
| 75 to 84 Years | 3 | 1.9% |
| 85 Years and Over | 0 | 0.0% |
| Total | 155 | 100.0% |
Housing Finances in Steely Hollow
Median Income by Occupancy in Steely Hollow
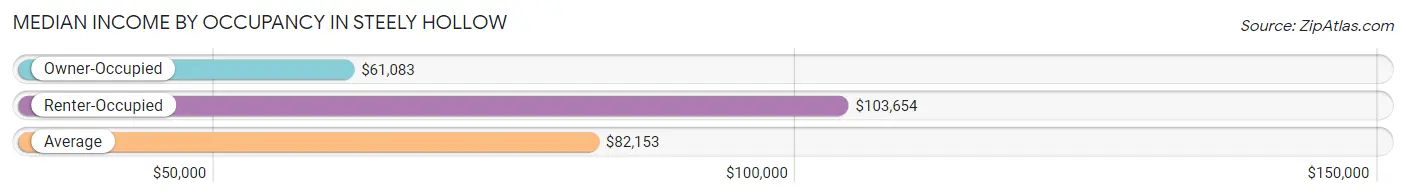
| Occupancy Type | # Households | Median Income |
| Owner-Occupied | 79 (51.0%) | $61,083 |
| Renter-Occupied | 76 (49.0%) | $103,654 |
| Average | 155 (100.0%) | $82,153 |
Occupancy by Householder Income Bracket in Steely Hollow
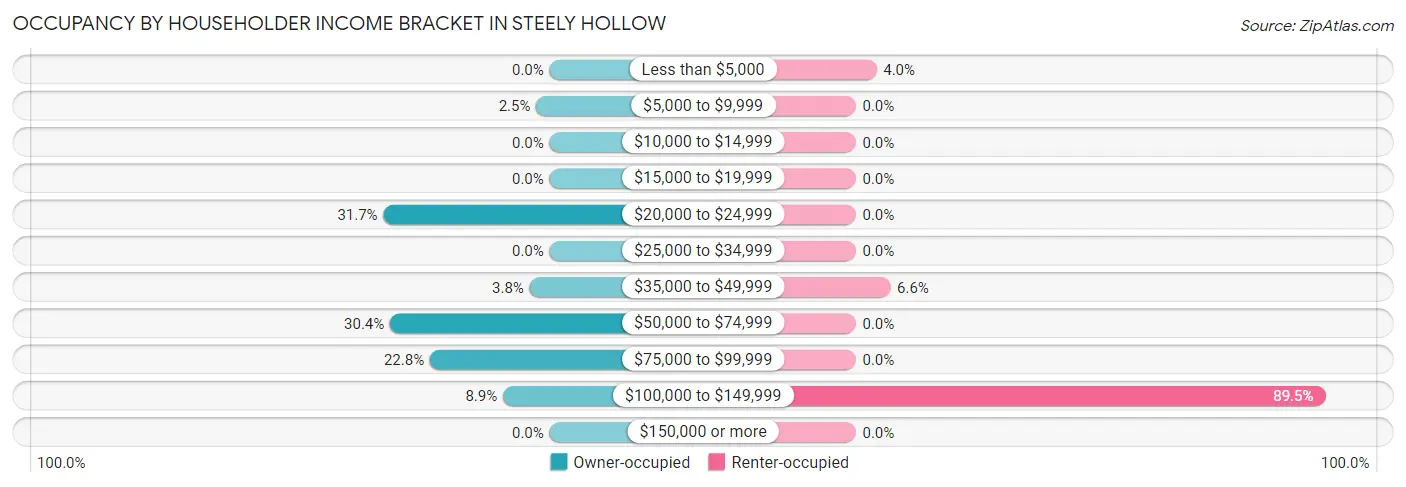
| Income Bracket | Owner-occupied | Renter-occupied |
| Less than $5,000 | 0 (0.0%) | 3 (4.0%) |
| $5,000 to $9,999 | 2 (2.5%) | 0 (0.0%) |
| $10,000 to $14,999 | 0 (0.0%) | 0 (0.0%) |
| $15,000 to $19,999 | 0 (0.0%) | 0 (0.0%) |
| $20,000 to $24,999 | 25 (31.7%) | 0 (0.0%) |
| $25,000 to $34,999 | 0 (0.0%) | 0 (0.0%) |
| $35,000 to $49,999 | 3 (3.8%) | 5 (6.6%) |
| $50,000 to $74,999 | 24 (30.4%) | 0 (0.0%) |
| $75,000 to $99,999 | 18 (22.8%) | 0 (0.0%) |
| $100,000 to $149,999 | 7 (8.9%) | 68 (89.5%) |
| $150,000 or more | 0 (0.0%) | 0 (0.0%) |
| Total | 79 (100.0%) | 76 (100.0%) |
Monthly Housing Cost Tiers in Steely Hollow
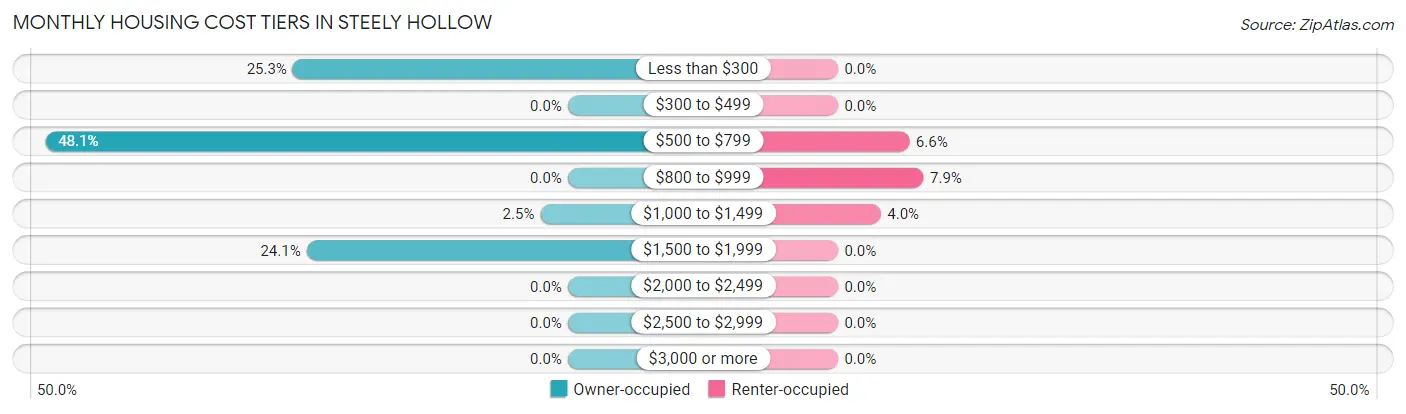
| Monthly Cost | Owner-occupied | Renter-occupied |
| Less than $300 | 20 (25.3%) | 0 (0.0%) |
| $300 to $499 | 0 (0.0%) | 0 (0.0%) |
| $500 to $799 | 38 (48.1%) | 5 (6.6%) |
| $800 to $999 | 0 (0.0%) | 6 (7.9%) |
| $1,000 to $1,499 | 2 (2.5%) | 3 (4.0%) |
| $1,500 to $1,999 | 19 (24.0%) | 0 (0.0%) |
| $2,000 to $2,499 | 0 (0.0%) | 0 (0.0%) |
| $2,500 to $2,999 | 0 (0.0%) | 0 (0.0%) |
| $3,000 or more | 0 (0.0%) | 0 (0.0%) |
| Total | 79 (100.0%) | 76 (100.0%) |
Physical Housing Characteristics in Steely Hollow
Housing Structures in Steely Hollow
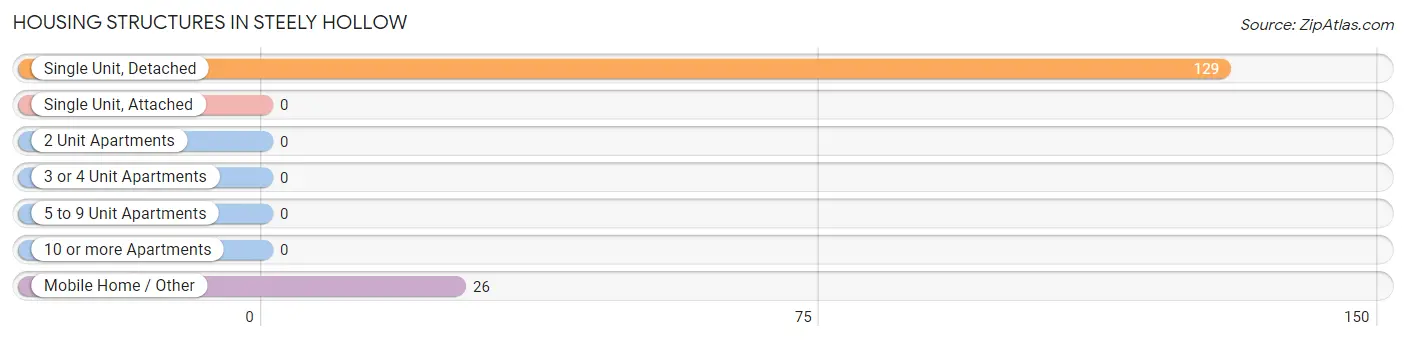
| Structure Type | # Housing Units | % Housing Units |
| Single Unit, Detached | 129 | 83.2% |
| Single Unit, Attached | 0 | 0.0% |
| 2 Unit Apartments | 0 | 0.0% |
| 3 or 4 Unit Apartments | 0 | 0.0% |
| 5 to 9 Unit Apartments | 0 | 0.0% |
| 10 or more Apartments | 0 | 0.0% |
| Mobile Home / Other | 26 | 16.8% |
| Total | 155 | 100.0% |
Housing Structures by Occupancy in Steely Hollow
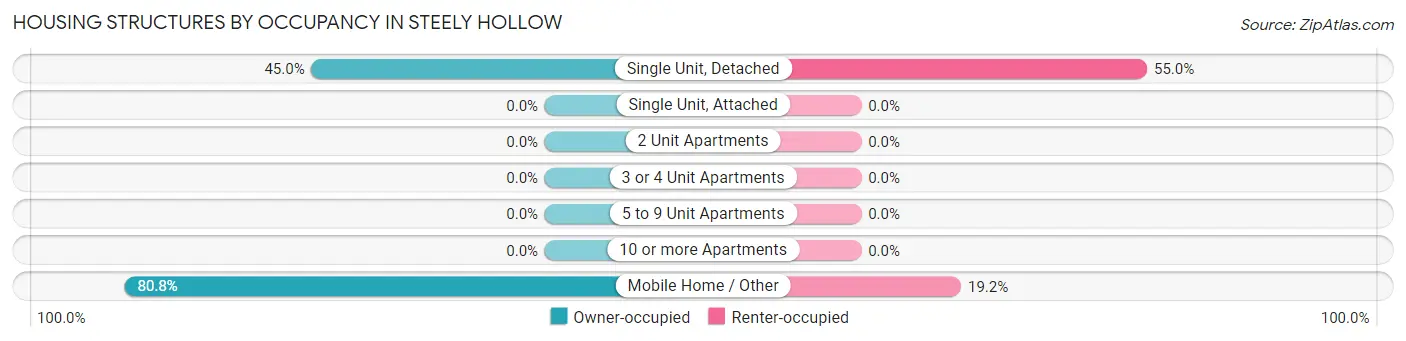
| Structure Type | Owner-occupied | Renter-occupied |
| Single Unit, Detached | 58 (45.0%) | 71 (55.0%) |
| Single Unit, Attached | 0 (0.0%) | 0 (0.0%) |
| 2 Unit Apartments | 0 (0.0%) | 0 (0.0%) |
| 3 or 4 Unit Apartments | 0 (0.0%) | 0 (0.0%) |
| 5 to 9 Unit Apartments | 0 (0.0%) | 0 (0.0%) |
| 10 or more Apartments | 0 (0.0%) | 0 (0.0%) |
| Mobile Home / Other | 21 (80.8%) | 5 (19.2%) |
| Total | 79 (51.0%) | 76 (49.0%) |
Housing Structures by Number of Rooms in Steely Hollow

| Number of Rooms | Owner-occupied | Renter-occupied |
| 1 Room | 0 (0.0%) | 0 (0.0%) |
| 2 or 3 Rooms | 25 (31.7%) | 0 (0.0%) |
| 4 or 5 Rooms | 27 (34.2%) | 14 (18.4%) |
| 6 or 7 Rooms | 22 (27.9%) | 62 (81.6%) |
| 8 or more Rooms | 5 (6.3%) | 0 (0.0%) |
| Total | 79 (100.0%) | 76 (100.0%) |
Housing Structure by Heating Type in Steely Hollow
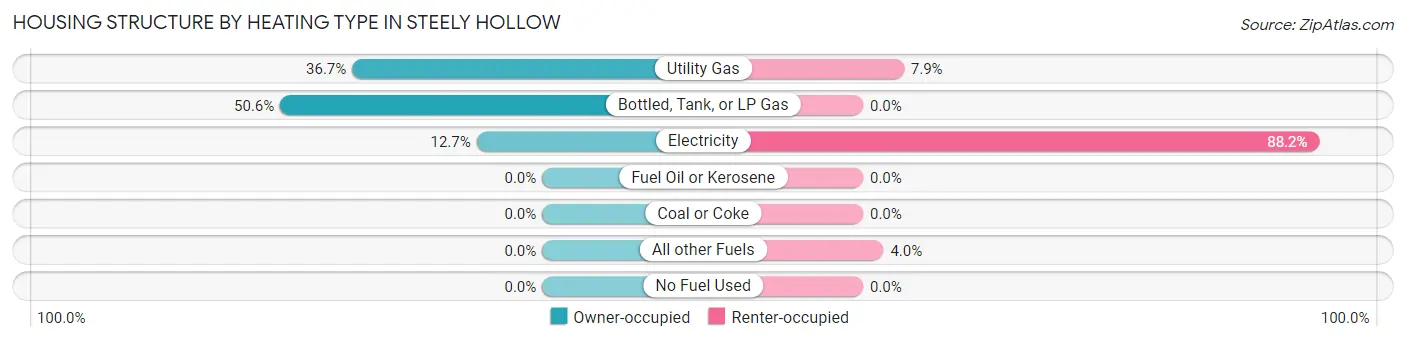
| Heating Type | Owner-occupied | Renter-occupied |
| Utility Gas | 29 (36.7%) | 6 (7.9%) |
| Bottled, Tank, or LP Gas | 40 (50.6%) | 0 (0.0%) |
| Electricity | 10 (12.7%) | 67 (88.2%) |
| Fuel Oil or Kerosene | 0 (0.0%) | 0 (0.0%) |
| Coal or Coke | 0 (0.0%) | 0 (0.0%) |
| All other Fuels | 0 (0.0%) | 3 (4.0%) |
| No Fuel Used | 0 (0.0%) | 0 (0.0%) |
| Total | 79 (100.0%) | 76 (100.0%) |
Household Vehicle Usage in Steely Hollow
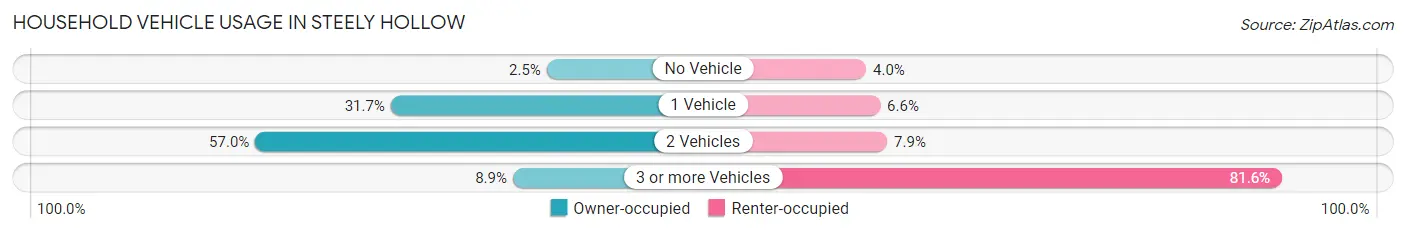
| Vehicles per Household | Owner-occupied | Renter-occupied |
| No Vehicle | 2 (2.5%) | 3 (4.0%) |
| 1 Vehicle | 25 (31.7%) | 5 (6.6%) |
| 2 Vehicles | 45 (57.0%) | 6 (7.9%) |
| 3 or more Vehicles | 7 (8.9%) | 62 (81.6%) |
| Total | 79 (100.0%) | 76 (100.0%) |
Real Estate & Mortgages in Steely Hollow
Real Estate and Mortgage Overview in Steely Hollow
| Characteristic | Without Mortgage | With Mortgage |
| Housing Units | 8 | 71 |
| Median Property Value | - | - |
| Median Household Income | $59,167 | $0 |
| Monthly Housing Costs | $667 | $0 |
| Real Estate Taxes | - | - |
Property Value by Mortgage Status in Steely Hollow
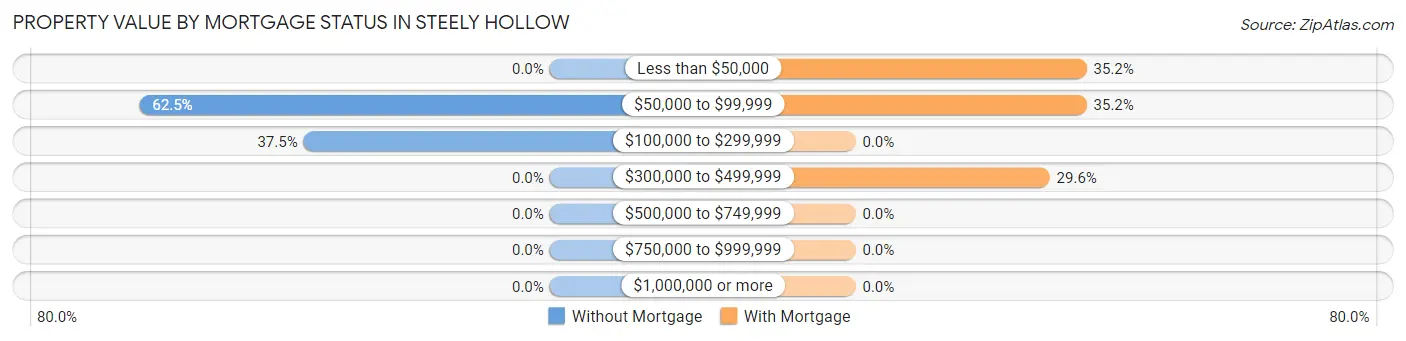
| Property Value | Without Mortgage | With Mortgage |
| Less than $50,000 | 0 (0.0%) | 25 (35.2%) |
| $50,000 to $99,999 | 5 (62.5%) | 25 (35.2%) |
| $100,000 to $299,999 | 3 (37.5%) | 0 (0.0%) |
| $300,000 to $499,999 | 0 (0.0%) | 21 (29.6%) |
| $500,000 to $749,999 | 0 (0.0%) | 0 (0.0%) |
| $750,000 to $999,999 | 0 (0.0%) | 0 (0.0%) |
| $1,000,000 or more | 0 (0.0%) | 0 (0.0%) |
| Total | 8 (100.0%) | 71 (100.0%) |
Household Income by Mortgage Status in Steely Hollow
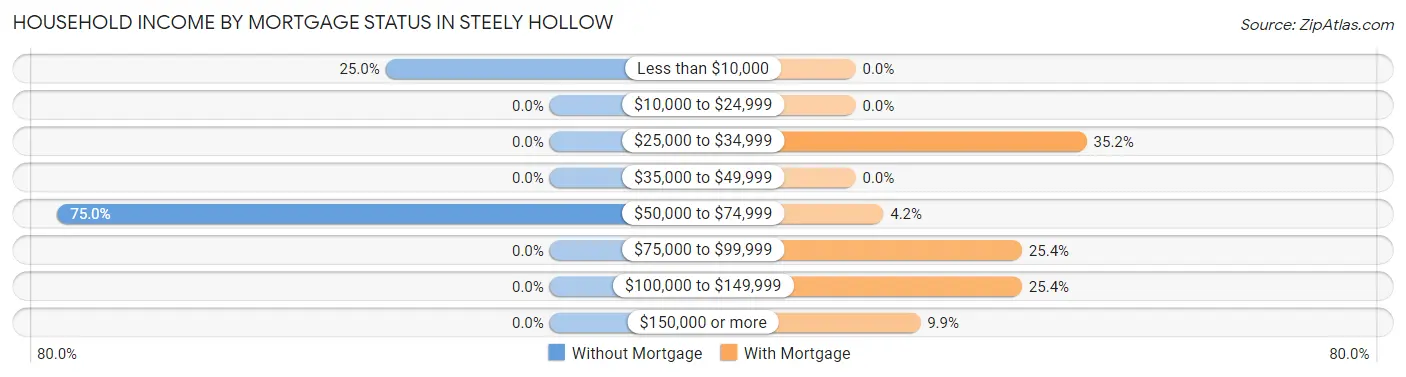
| Household Income | Without Mortgage | With Mortgage |
| Less than $10,000 | 2 (25.0%) | 0 (0.0%) |
| $10,000 to $24,999 | 0 (0.0%) | 0 (0.0%) |
| $25,000 to $34,999 | 0 (0.0%) | 25 (35.2%) |
| $35,000 to $49,999 | 0 (0.0%) | 0 (0.0%) |
| $50,000 to $74,999 | 6 (75.0%) | 3 (4.2%) |
| $75,000 to $99,999 | 0 (0.0%) | 18 (25.4%) |
| $100,000 to $149,999 | 0 (0.0%) | 18 (25.4%) |
| $150,000 or more | 0 (0.0%) | 7 (9.9%) |
| Total | 8 (100.0%) | 71 (100.0%) |
Property Value to Household Income Ratio in Steely Hollow
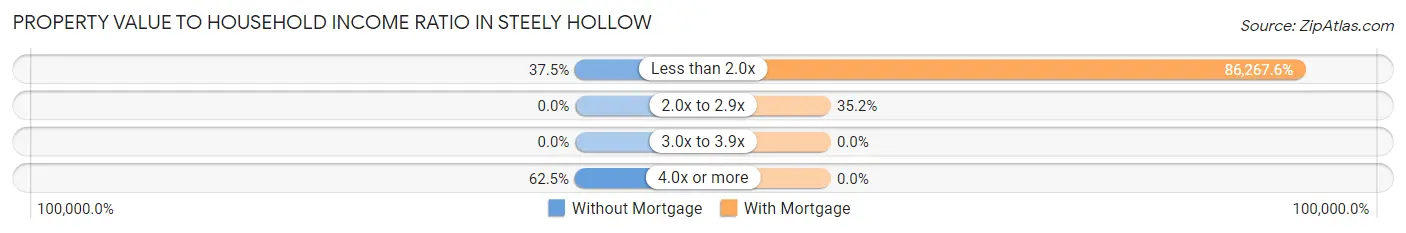
| Value-to-Income Ratio | Without Mortgage | With Mortgage |
| Less than 2.0x | 3 (37.5%) | 61,250 (86,267.6%) |
| 2.0x to 2.9x | 0 (0.0%) | 25 (35.2%) |
| 3.0x to 3.9x | 0 (0.0%) | 0 (0.0%) |
| 4.0x or more | 5 (62.5%) | 0 (0.0%) |
| Total | 8 (100.0%) | 71 (100.0%) |
Real Estate Taxes by Mortgage Status in Steely Hollow
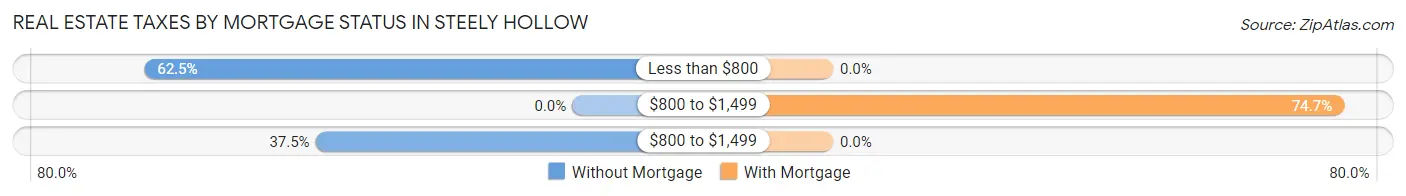
| Property Taxes | Without Mortgage | With Mortgage |
| Less than $800 | 5 (62.5%) | 0 (0.0%) |
| $800 to $1,499 | 0 (0.0%) | 53 (74.7%) |
| $800 to $1,499 | 3 (37.5%) | 0 (0.0%) |
| Total | 8 (100.0%) | 71 (100.0%) |
Health & Disability in Steely Hollow
Health Insurance Coverage by Age in Steely Hollow
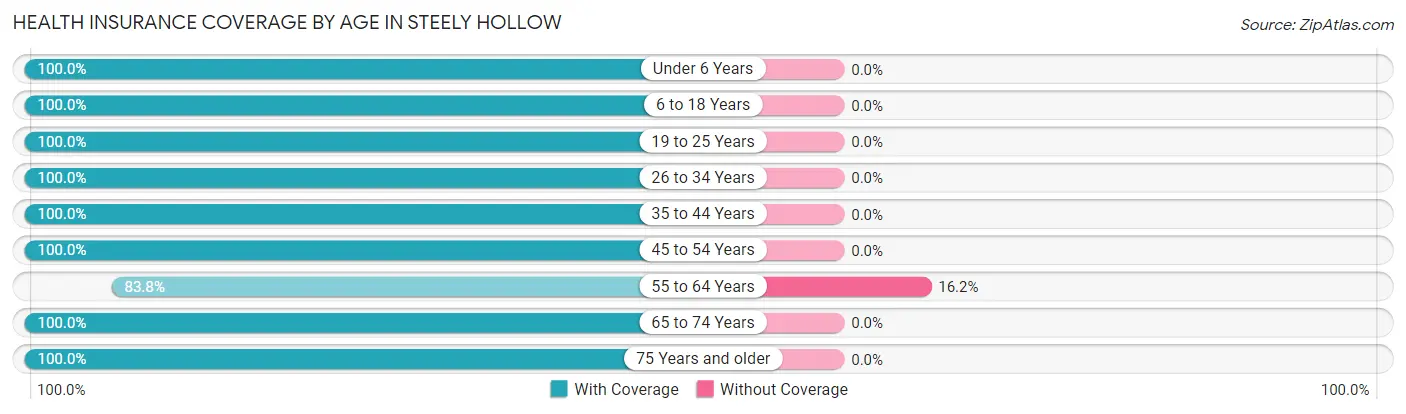
| Age Bracket | With Coverage | Without Coverage |
| Under 6 Years | 12 (100.0%) | 0 (0.0%) |
| 6 to 18 Years | 28 (100.0%) | 0 (0.0%) |
| 19 to 25 Years | 15 (100.0%) | 0 (0.0%) |
| 26 to 34 Years | 20 (100.0%) | 0 (0.0%) |
| 35 to 44 Years | 11 (100.0%) | 0 (0.0%) |
| 45 to 54 Years | 34 (100.0%) | 0 (0.0%) |
| 55 to 64 Years | 31 (83.8%) | 6 (16.2%) |
| 65 to 74 Years | 98 (100.0%) | 0 (0.0%) |
| 75 Years and older | 3 (100.0%) | 0 (0.0%) |
| Total | 252 (97.7%) | 6 (2.3%) |
Health Insurance Coverage by Citizenship Status in Steely Hollow
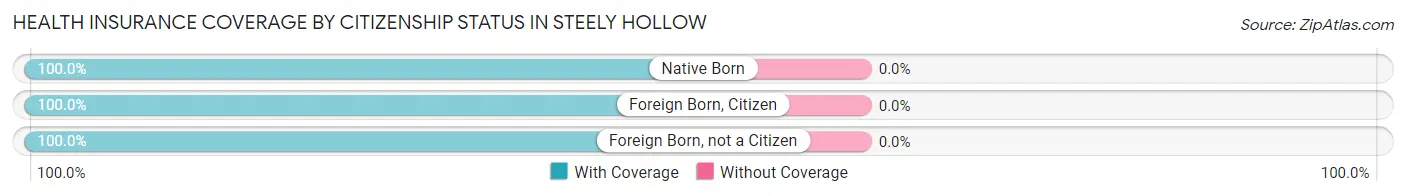
| Citizenship Status | With Coverage | Without Coverage |
| Native Born | 12 (100.0%) | 0 (0.0%) |
| Foreign Born, Citizen | 28 (100.0%) | 0 (0.0%) |
| Foreign Born, not a Citizen | 15 (100.0%) | 0 (0.0%) |
Health Insurance Coverage by Household Income in Steely Hollow
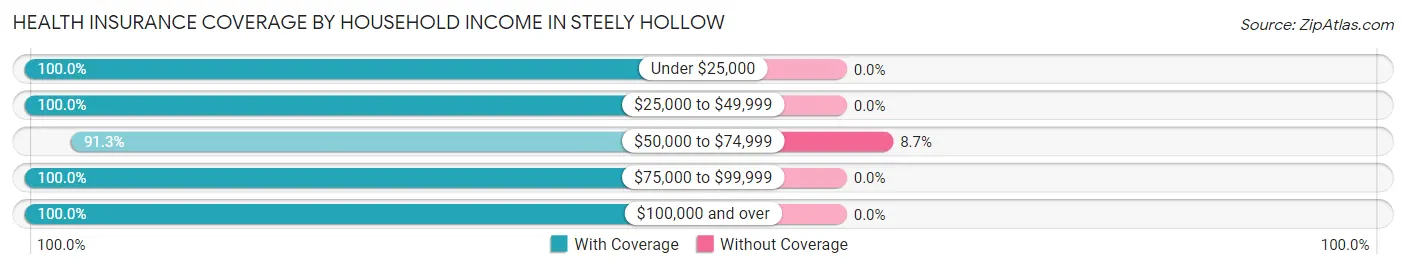
| Household Income | With Coverage | Without Coverage |
| Under $25,000 | 30 (100.0%) | 0 (0.0%) |
| $25,000 to $49,999 | 21 (100.0%) | 0 (0.0%) |
| $50,000 to $74,999 | 63 (91.3%) | 6 (8.7%) |
| $75,000 to $99,999 | 18 (100.0%) | 0 (0.0%) |
| $100,000 and over | 120 (100.0%) | 0 (0.0%) |
Public vs Private Health Insurance Coverage by Age in Steely Hollow
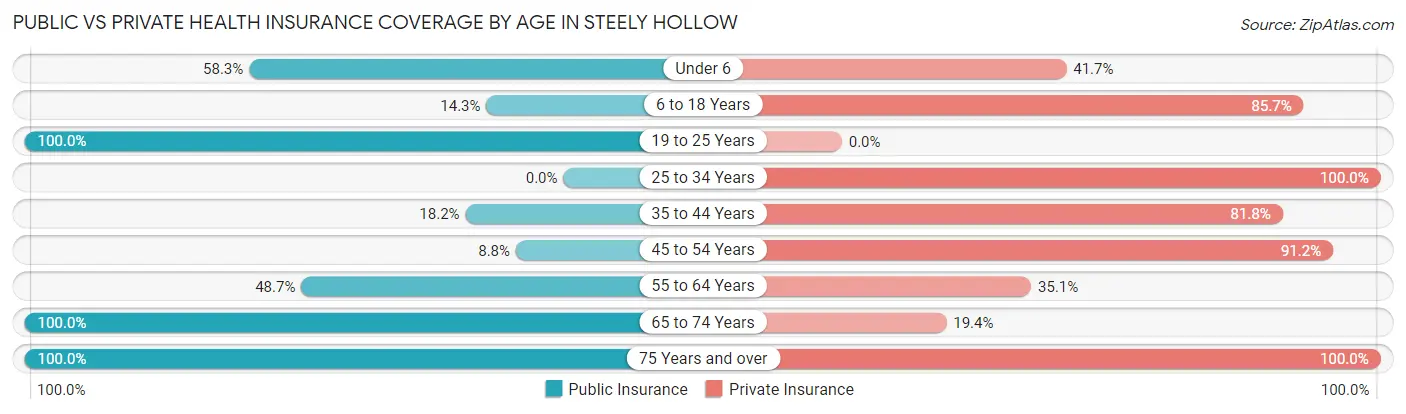
| Age Bracket | Public Insurance | Private Insurance |
| Under 6 | 7 (58.3%) | 5 (41.7%) |
| 6 to 18 Years | 4 (14.3%) | 24 (85.7%) |
| 19 to 25 Years | 15 (100.0%) | 0 (0.0%) |
| 25 to 34 Years | 0 (0.0%) | 20 (100.0%) |
| 35 to 44 Years | 2 (18.2%) | 9 (81.8%) |
| 45 to 54 Years | 3 (8.8%) | 31 (91.2%) |
| 55 to 64 Years | 18 (48.6%) | 13 (35.1%) |
| 65 to 74 Years | 98 (100.0%) | 19 (19.4%) |
| 75 Years and over | 3 (100.0%) | 3 (100.0%) |
| Total | 150 (58.1%) | 124 (48.1%) |
Disability Status by Sex by Age in Steely Hollow
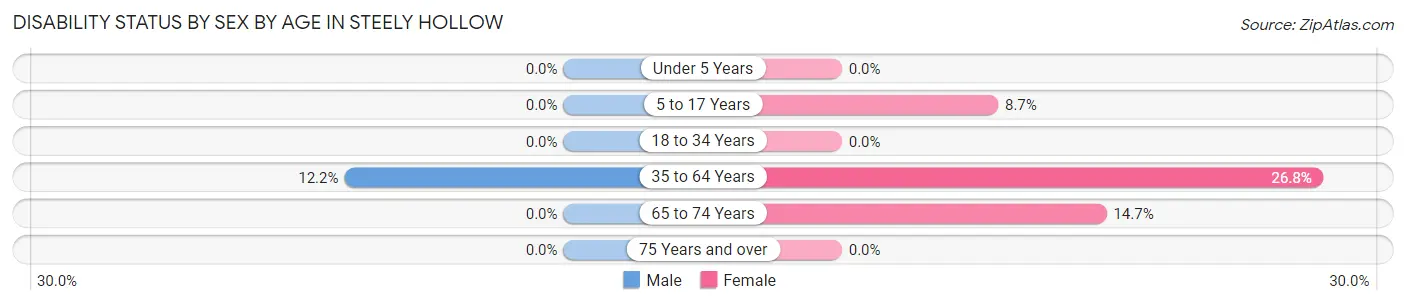
| Age Bracket | Male | Female |
| Under 5 Years | 0 (0.0%) | 0 (0.0%) |
| 5 to 17 Years | 0 (0.0%) | 2 (8.7%) |
| 18 to 34 Years | 0 (0.0%) | 0 (0.0%) |
| 35 to 64 Years | 5 (12.2%) | 11 (26.8%) |
| 65 to 74 Years | 0 (0.0%) | 14 (14.7%) |
| 75 Years and over | 0 (0.0%) | 0 (0.0%) |
Disability Class by Sex by Age in Steely Hollow
Disability Class: Hearing Difficulty

| Age Bracket | Male | Female |
| Under 5 Years | 0 (0.0%) | 0 (0.0%) |
| 5 to 17 Years | 0 (0.0%) | 2 (8.7%) |
| 18 to 34 Years | 0 (0.0%) | 0 (0.0%) |
| 35 to 64 Years | 3 (7.3%) | 0 (0.0%) |
| 65 to 74 Years | 0 (0.0%) | 0 (0.0%) |
| 75 Years and over | 0 (0.0%) | 0 (0.0%) |
Disability Class: Vision Difficulty
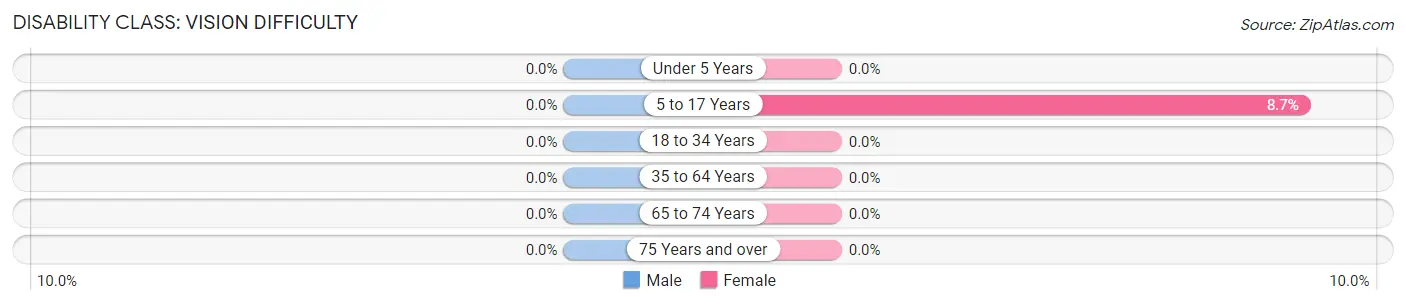
| Age Bracket | Male | Female |
| Under 5 Years | 0 (0.0%) | 0 (0.0%) |
| 5 to 17 Years | 0 (0.0%) | 2 (8.7%) |
| 18 to 34 Years | 0 (0.0%) | 0 (0.0%) |
| 35 to 64 Years | 0 (0.0%) | 0 (0.0%) |
| 65 to 74 Years | 0 (0.0%) | 0 (0.0%) |
| 75 Years and over | 0 (0.0%) | 0 (0.0%) |
Disability Class: Cognitive Difficulty
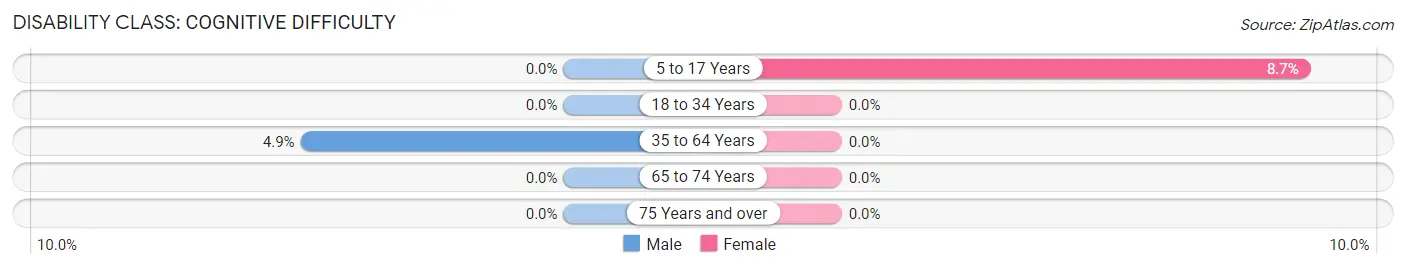
| Age Bracket | Male | Female |
| 5 to 17 Years | 0 (0.0%) | 2 (8.7%) |
| 18 to 34 Years | 0 (0.0%) | 0 (0.0%) |
| 35 to 64 Years | 2 (4.9%) | 0 (0.0%) |
| 65 to 74 Years | 0 (0.0%) | 0 (0.0%) |
| 75 Years and over | 0 (0.0%) | 0 (0.0%) |
Disability Class: Ambulatory Difficulty
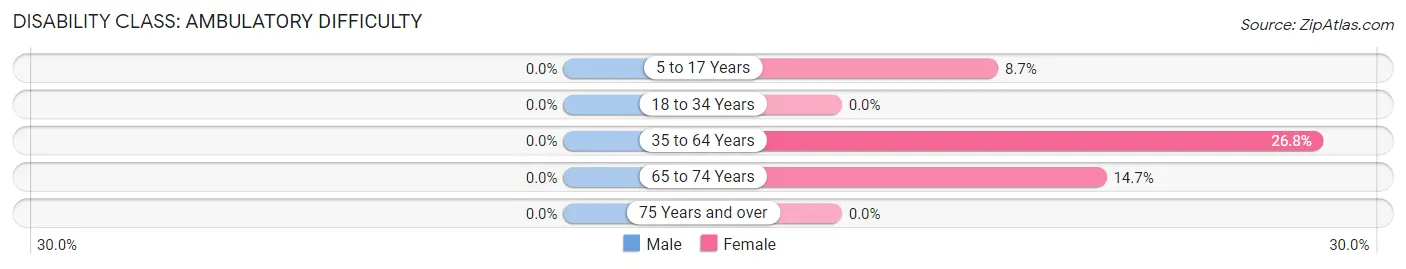
| Age Bracket | Male | Female |
| 5 to 17 Years | 0 (0.0%) | 2 (8.7%) |
| 18 to 34 Years | 0 (0.0%) | 0 (0.0%) |
| 35 to 64 Years | 0 (0.0%) | 11 (26.8%) |
| 65 to 74 Years | 0 (0.0%) | 14 (14.7%) |
| 75 Years and over | 0 (0.0%) | 0 (0.0%) |
Disability Class: Self-Care Difficulty
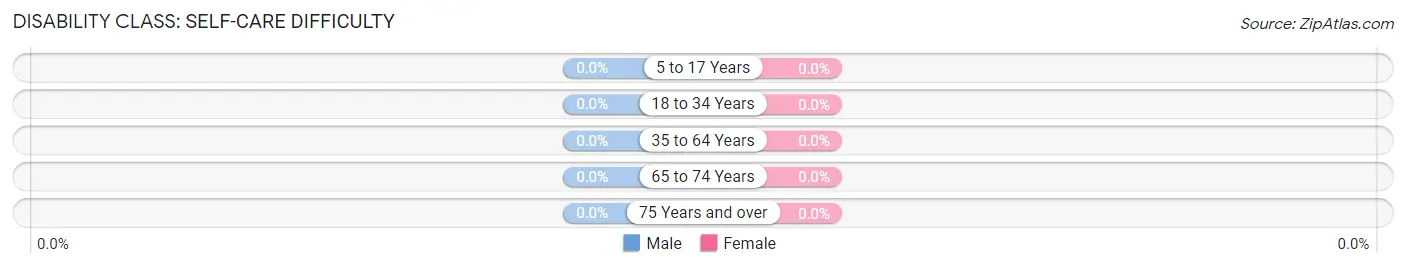
| Age Bracket | Male | Female |
| 5 to 17 Years | 0 (0.0%) | 0 (0.0%) |
| 18 to 34 Years | 0 (0.0%) | 0 (0.0%) |
| 35 to 64 Years | 0 (0.0%) | 0 (0.0%) |
| 65 to 74 Years | 0 (0.0%) | 0 (0.0%) |
| 75 Years and over | 0 (0.0%) | 0 (0.0%) |
Technology Access in Steely Hollow
Computing Device Access in Steely Hollow
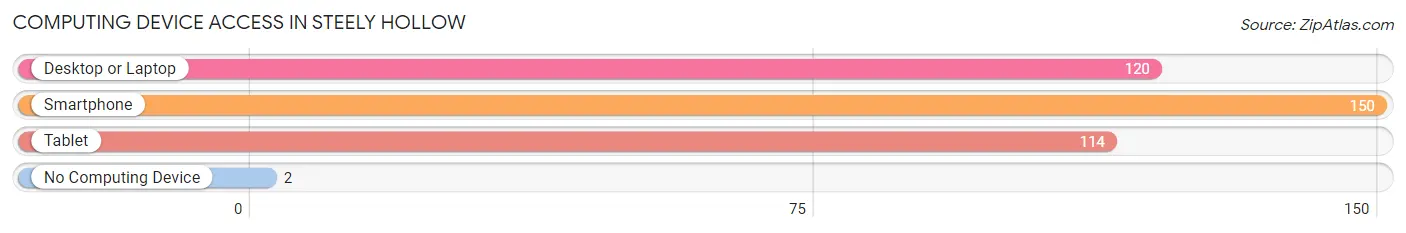
| Device Type | # Households | % Households |
| Desktop or Laptop | 120 | 77.4% |
| Smartphone | 150 | 96.8% |
| Tablet | 114 | 73.6% |
| No Computing Device | 2 | 1.3% |
| Total | 155 | 100.0% |
Internet Access in Steely Hollow
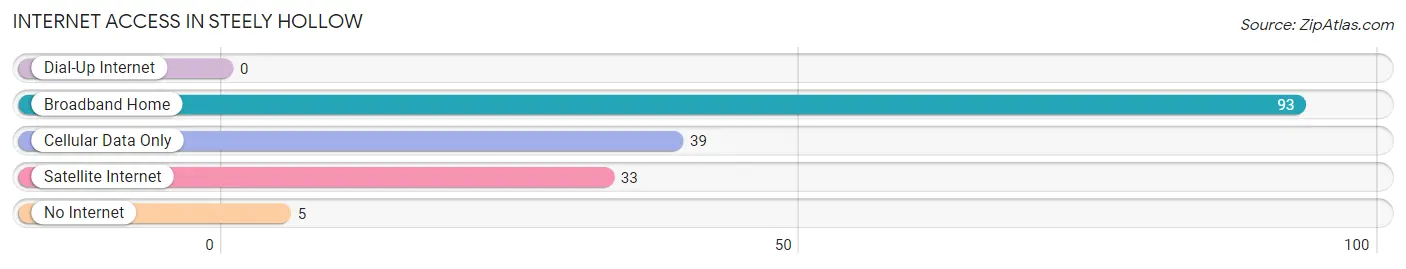
| Internet Type | # Households | % Households |
| Dial-Up Internet | 0 | 0.0% |
| Broadband Home | 93 | 60.0% |
| Cellular Data Only | 39 | 25.2% |
| Satellite Internet | 33 | 21.3% |
| No Internet | 5 | 3.2% |
| Total | 155 | 100.0% |
Steely Hollow Summary
Steely Hollow, Oklahoma is a small town located in the northeastern corner of the state. It is situated in the foothills of the Ozark Mountains and is surrounded by rolling hills and lush forests. The town has a population of just over 1,000 people and is known for its rural charm and friendly atmosphere.
Geography
Steely Hollow is located in the northeastern corner of Oklahoma, in the foothills of the Ozark Mountains. The town is situated on the banks of the Arkansas River, which provides a scenic backdrop to the town. The town is surrounded by rolling hills and lush forests, making it a popular destination for outdoor enthusiasts. The town is also home to several small lakes, which provide a great opportunity for fishing and other recreational activities.
Economy
The economy of Steely Hollow is largely based on agriculture and tourism. The town is home to several small farms, which produce a variety of crops, including corn, soybeans, and wheat. The town also has a thriving tourism industry, with many visitors coming to enjoy the scenic beauty of the area. The town is also home to several small businesses, including restaurants, shops, and other services.
Demographics
As of the 2010 census, the population of Steely Hollow was 1,072. The town is predominantly white, with a small minority population of African Americans, Hispanics, and Native Americans. The median household income in the town is $37,000, and the median age is 38. The town has a high rate of homeownership, with nearly 80% of the population owning their own homes.
History
Steely Hollow was founded in the late 1800s by a group of settlers from Arkansas. The town was named after a local blacksmith, who was known for his skill in forging steel. The town grew slowly over the years, and by the early 1900s, it had become a thriving community. The town was home to several small businesses, including a general store, a blacksmith shop, and a sawmill.
In the mid-1900s, the town began to decline as the local economy shifted away from agriculture and towards tourism. The town was revitalized in the late 1990s, when a new highway was built, connecting Steely Hollow to the larger cities of Tulsa and Oklahoma City. This new highway brought an influx of visitors to the town, and the local economy began to rebound.
Today, Steely Hollow is a thriving small town with a strong sense of community. The town is home to several small businesses, including restaurants, shops, and other services. The town is also home to several small farms, which produce a variety of crops, including corn, soybeans, and wheat. The town is a popular destination for outdoor enthusiasts, and the scenic beauty of the area makes it a great place to visit.
Common Questions
What is Per Capita Income in Steely Hollow?
Per Capita income in Steely Hollow is $46,186.
What is the Median Family Income in Steely Hollow?
Median Family Income in Steely Hollow is $62,167.
What is the Median Household income in Steely Hollow?
Median Household Income in Steely Hollow is $82,153.
What is Income or Wage Gap in Steely Hollow?
Income or Wage Gap in Steely Hollow is 51.6%.
Women in Steely Hollow earn 48.4 cents for every dollar earned by a man.
What is Inequality or Gini Index in Steely Hollow?
Inequality or Gini Index in Steely Hollow is 0.24.
What is the Total Population of Steely Hollow?
Total Population of Steely Hollow is 258.
What is the Total Male Population of Steely Hollow?
Total Male Population of Steely Hollow is 65.
What is the Total Female Population of Steely Hollow?
Total Female Population of Steely Hollow is 193.
What is the Ratio of Males per 100 Females in Steely Hollow?
There are 33.68 Males per 100 Females in Steely Hollow.
What is the Ratio of Females per 100 Males in Steely Hollow?
There are 296.92 Females per 100 Males in Steely Hollow.
What is the Median Population Age in Steely Hollow?
Median Population Age in Steely Hollow is 57.8 Years.
What is the Average Family Size in Steely Hollow
Average Family Size in Steely Hollow is 3.1 People.
What is the Average Household Size in Steely Hollow
Average Household Size in Steely Hollow is 1.7 People.
How Large is the Labor Force in Steely Hollow?
There are 85 People in the Labor Forcein in Steely Hollow.
What is the Percentage of People in the Labor Force in Steely Hollow?
39.0% of People are in the Labor Force in Steely Hollow.
What is the Unemployment Rate in Steely Hollow?
Unemployment Rate in Steely Hollow is 3.5%.