Richland County, MT Map & Demographics
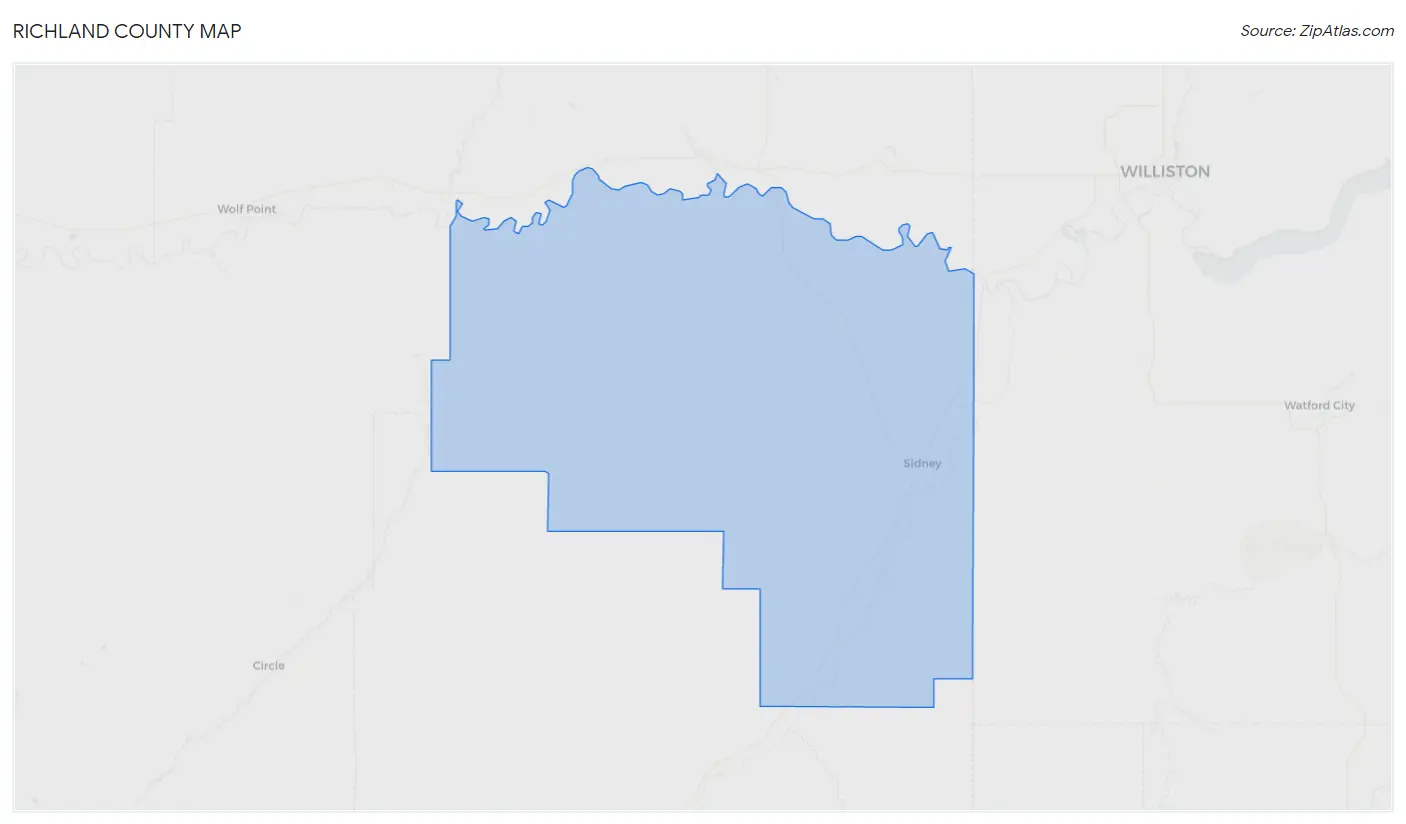
Richland County Map
Richland County Overview
$34,169
PER CAPITA INCOME
$85,947
AVG FAMILY INCOME
$67,515
AVG HOUSEHOLD INCOME
37.2%
WAGE / INCOME GAP [ % ]
62.8¢/ $1
WAGE / INCOME GAP [ $ ]
$9,973
FAMILY INCOME DEFICIT
0.45
INEQUALITY / GINI INDEX
11,366
TOTAL POPULATION
5,710
MALE POPULATION
5,656
FEMALE POPULATION
100.95
MALES / 100 FEMALES
99.05
FEMALES / 100 MALES
38.3
MEDIAN AGE
3.3
AVG FAMILY SIZE
2.5
AVG HOUSEHOLD SIZE
5,918
LABOR FORCE [ PEOPLE ]
66.8%
PERCENT IN LABOR FORCE
4.9%
UNEMPLOYMENT RATE
Richland County Area Codes
Income in Richland County
Income Overview in Richland County
Per Capita Income in Richland County is $34,169, while median incomes of families and households are $85,947 and $67,515 respectively.
| Characteristic | Number | Measure |
| Per Capita Income | 11,366 | $34,169 |
| Median Family Income | 2,649 | $85,947 |
| Mean Family Income | 2,649 | $101,400 |
| Median Household Income | 4,529 | $67,515 |
| Mean Household Income | 4,529 | $85,016 |
| Income Deficit | 2,649 | $9,973 |
| Wage / Income Gap (%) | 11,366 | 37.16% |
| Wage / Income Gap ($) | 11,366 | 62.84¢ per $1 |
| Gini / Inequality Index | 11,366 | 0.45 |
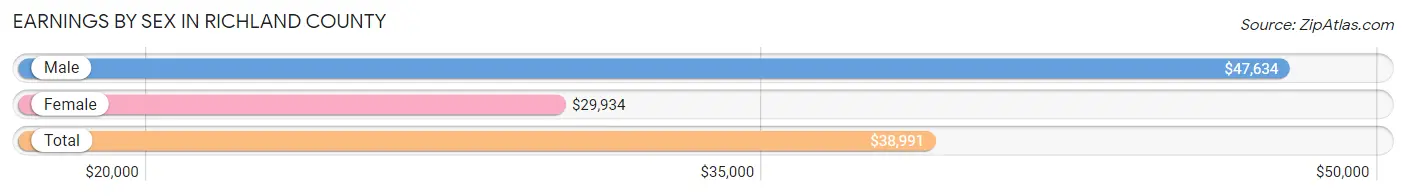
Earnings by Sex in Richland County
Average Earnings in Richland County are $38,991, $47,634 for men and $29,934 for women, a difference of 37.2%.
| Sex | Number | Average Earnings |
| Male | 3,343 (53.0%) | $47,634 |
| Female | 2,963 (47.0%) | $29,934 |
| Total | 6,306 (100.0%) | $38,991 |
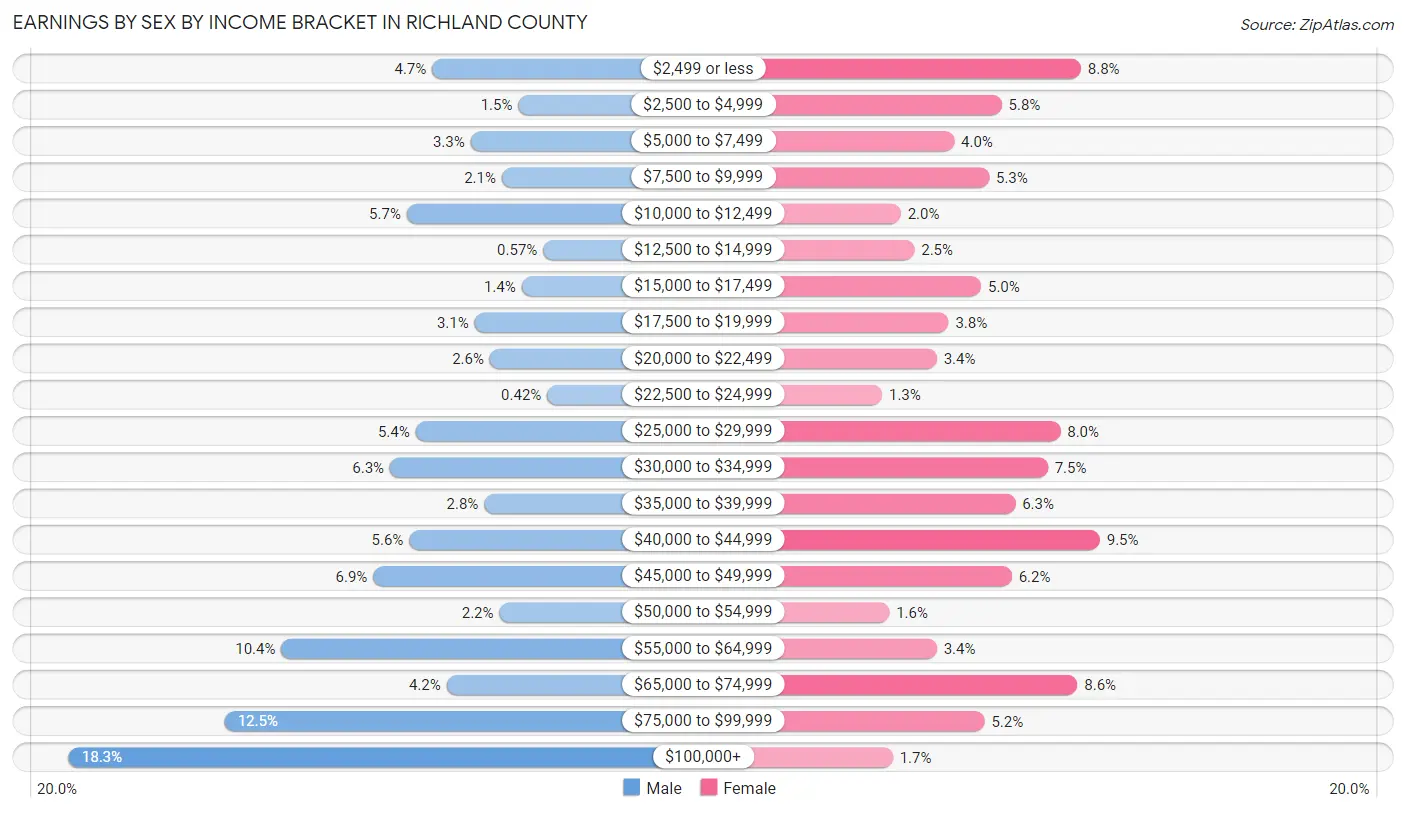
Earnings by Sex by Income Bracket in Richland County
The most common earnings brackets in Richland County are $100,000+ for men (613 | 18.3%) and $40,000 to $44,999 for women (281 | 9.5%).
| Income | Male | Female |
| $2,499 or less | 158 (4.7%) | 260 (8.8%) |
| $2,500 to $4,999 | 50 (1.5%) | 172 (5.8%) |
| $5,000 to $7,499 | 110 (3.3%) | 119 (4.0%) |
| $7,500 to $9,999 | 71 (2.1%) | 158 (5.3%) |
| $10,000 to $12,499 | 190 (5.7%) | 60 (2.0%) |
| $12,500 to $14,999 | 19 (0.6%) | 75 (2.5%) |
| $15,000 to $17,499 | 46 (1.4%) | 149 (5.0%) |
| $17,500 to $19,999 | 105 (3.1%) | 113 (3.8%) |
| $20,000 to $22,499 | 86 (2.6%) | 100 (3.4%) |
| $22,500 to $24,999 | 14 (0.4%) | 39 (1.3%) |
| $25,000 to $29,999 | 179 (5.3%) | 237 (8.0%) |
| $30,000 to $34,999 | 211 (6.3%) | 223 (7.5%) |
| $35,000 to $39,999 | 93 (2.8%) | 187 (6.3%) |
| $40,000 to $44,999 | 187 (5.6%) | 281 (9.5%) |
| $45,000 to $49,999 | 232 (6.9%) | 183 (6.2%) |
| $50,000 to $54,999 | 74 (2.2%) | 47 (1.6%) |
| $55,000 to $64,999 | 347 (10.4%) | 100 (3.4%) |
| $65,000 to $74,999 | 140 (4.2%) | 256 (8.6%) |
| $75,000 to $99,999 | 418 (12.5%) | 153 (5.2%) |
| $100,000+ | 613 (18.3%) | 51 (1.7%) |
| Total | 3,343 (100.0%) | 2,963 (100.0%) |
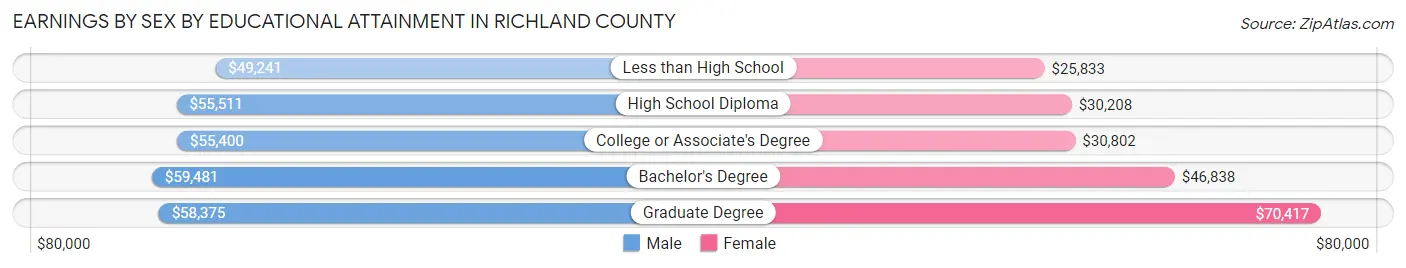
Earnings by Sex by Educational Attainment in Richland County
Average earnings in Richland County are $57,605 for men and $34,715 for women, a difference of 39.7%. Men with an educational attainment of bachelor's degree enjoy the highest average annual earnings of $59,481, while those with less than high school education earn the least with $49,241. Women with an educational attainment of graduate degree earn the most with the average annual earnings of $70,417, while those with less than high school education have the smallest earnings of $25,833.
| Educational Attainment | Male Income | Female Income |
| Less than High School | $49,241 | $25,833 |
| High School Diploma | $55,511 | $30,208 |
| College or Associate's Degree | $55,400 | $30,802 |
| Bachelor's Degree | $59,481 | $46,838 |
| Graduate Degree | $58,375 | $70,417 |
| Total | $57,605 | $34,715 |
Family Income in Richland County
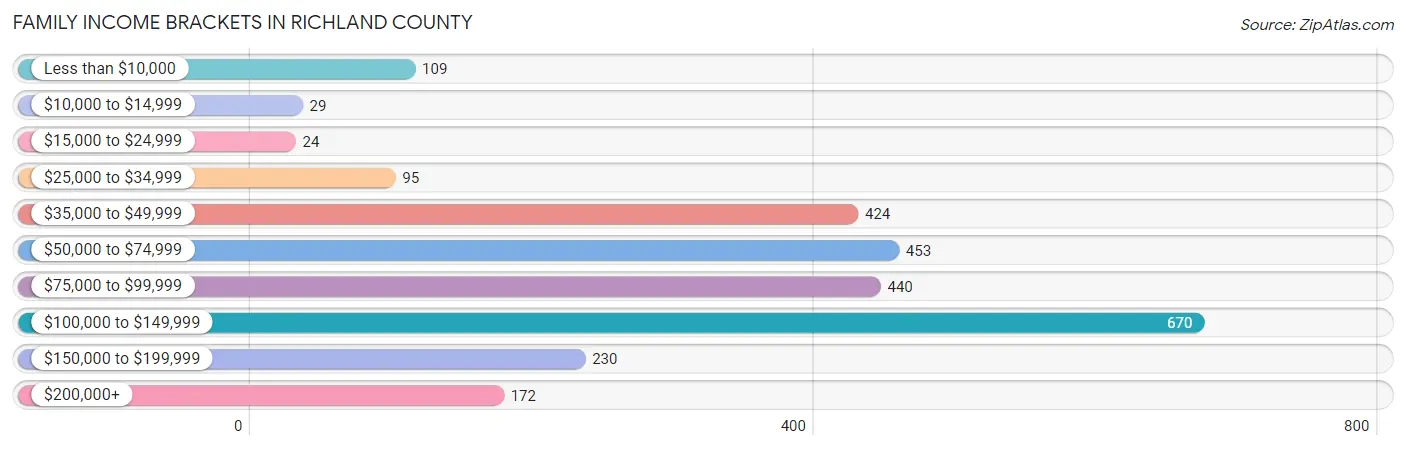
Family Income Brackets in Richland County
According to the Richland County family income data, there are 670 families falling into the $100,000 to $149,999 income range, which is the most common income bracket and makes up 25.3% of all families. Conversely, the $15,000 to $24,999 income bracket is the least frequent group with only 24 families (0.9%) belonging to this category.
| Income Bracket | # Families | % Families |
| Less than $10,000 | 109 | 4.1% |
| $10,000 to $14,999 | 29 | 1.1% |
| $15,000 to $24,999 | 24 | 0.9% |
| $25,000 to $34,999 | 95 | 3.6% |
| $35,000 to $49,999 | 424 | 16.0% |
| $50,000 to $74,999 | 453 | 17.1% |
| $75,000 to $99,999 | 440 | 16.6% |
| $100,000 to $149,999 | 670 | 25.3% |
| $150,000 to $199,999 | 230 | 8.7% |
| $200,000+ | 172 | 6.5% |
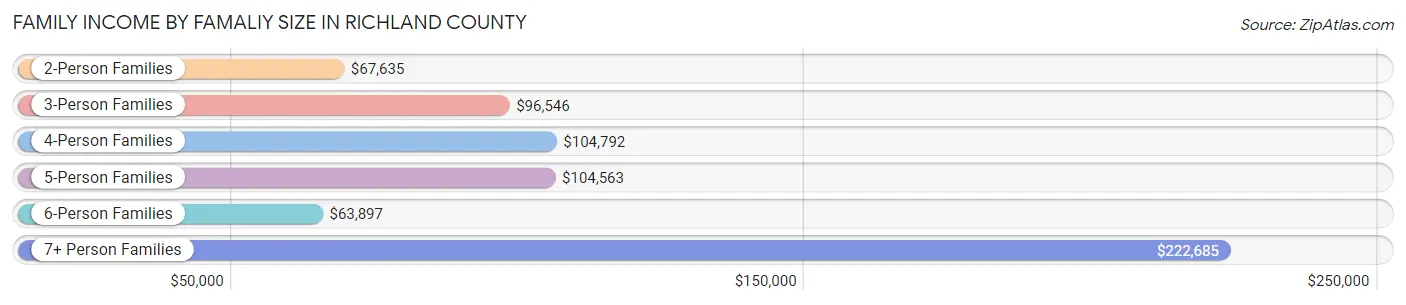
Family Income by Famaliy Size in Richland County
7+ person families (116 | 4.4%) account for the highest median family income in Richland County with $222,685 per family, while 2-person families (1,574 | 59.4%) have the highest median income of $33,818 per family member.
| Income Bracket | # Families | Median Income |
| 2-Person Families | 1,574 (59.4%) | $67,635 |
| 3-Person Families | 381 (14.4%) | $96,546 |
| 4-Person Families | 343 (13.0%) | $104,792 |
| 5-Person Families | 214 (8.1%) | $104,563 |
| 6-Person Families | 21 (0.8%) | $63,897 |
| 7+ Person Families | 116 (4.4%) | $222,685 |
| Total | 2,649 (100.0%) | $85,947 |
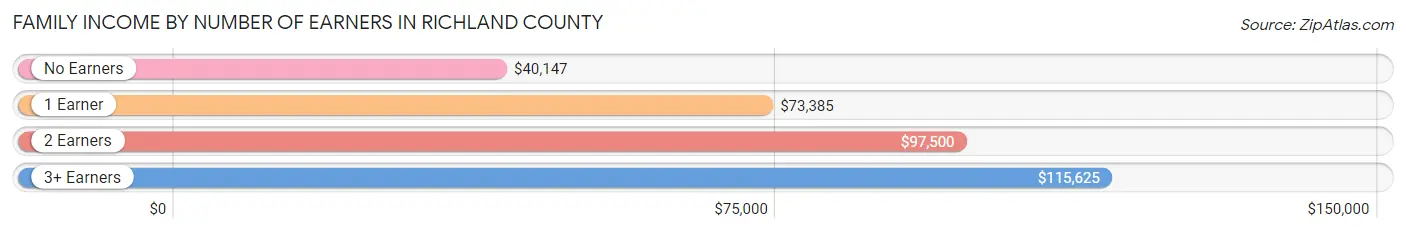
Family Income by Number of Earners in Richland County
The median family income in Richland County is $85,947, with families comprising 3+ earners (265) having the highest median family income of $115,625, while families with no earners (324) have the lowest median family income of $40,147, accounting for 10.0% and 12.2% of families, respectively.
| Number of Earners | # Families | Median Income |
| No Earners | 324 (12.2%) | $40,147 |
| 1 Earner | 818 (30.9%) | $73,385 |
| 2 Earners | 1,242 (46.9%) | $97,500 |
| 3+ Earners | 265 (10.0%) | $115,625 |
| Total | 2,649 (100.0%) | $85,947 |
Household Income in Richland County
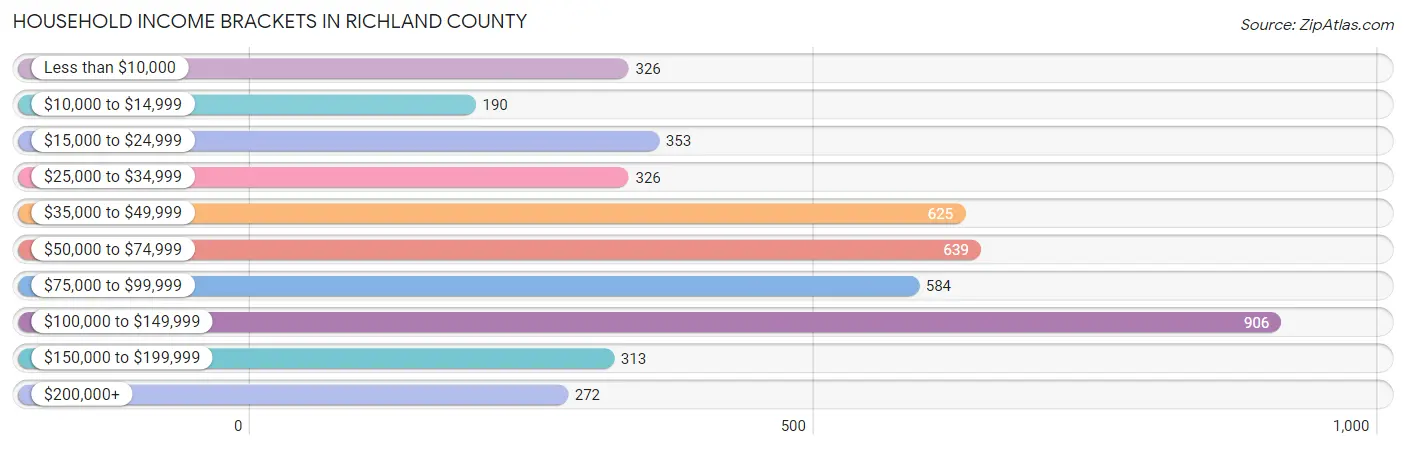
Household Income Brackets in Richland County
With 906 households falling in the category, the $100,000 to $149,999 income range is the most frequent in Richland County, accounting for 20.0% of all households. In contrast, only 190 households (4.2%) fall into the $10,000 to $14,999 income bracket, making it the least populous group.
| Income Bracket | # Households | % Households |
| Less than $10,000 | 326 | 7.2% |
| $10,000 to $14,999 | 190 | 4.2% |
| $15,000 to $24,999 | 353 | 7.8% |
| $25,000 to $34,999 | 326 | 7.2% |
| $35,000 to $49,999 | 625 | 13.8% |
| $50,000 to $74,999 | 639 | 14.1% |
| $75,000 to $99,999 | 584 | 12.9% |
| $100,000 to $149,999 | 906 | 20.0% |
| $150,000 to $199,999 | 313 | 6.9% |
| $200,000+ | 272 | 6.0% |
Household Income by Householder Age in Richland County
The median household income in Richland County is $67,515, with the highest median household income of $90,000 found in the 25 to 44 years age bracket for the primary householder. A total of 1,514 households (33.4%) fall into this category. Meanwhile, the 65+ years age bracket for the primary householder has the lowest median household income of $36,845, with 1,185 households (26.2%) in this group.
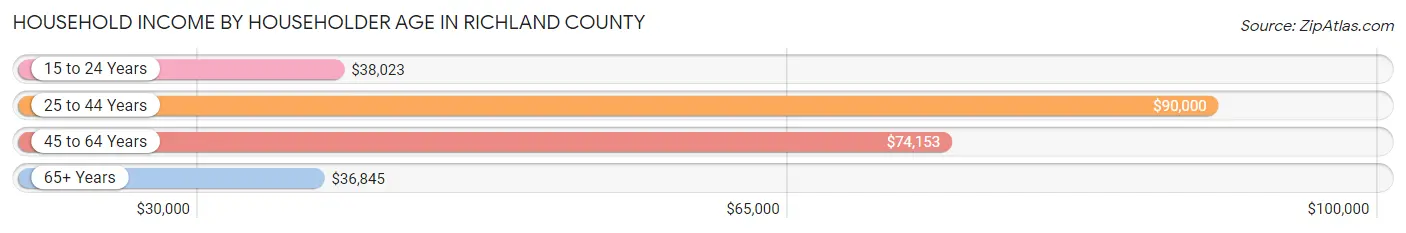
| Income Bracket | # Households | Median Income |
| 15 to 24 Years | 264 (5.8%) | $38,023 |
| 25 to 44 Years | 1,514 (33.4%) | $90,000 |
| 45 to 64 Years | 1,566 (34.6%) | $74,153 |
| 65+ Years | 1,185 (26.2%) | $36,845 |
| Total | 4,529 (100.0%) | $67,515 |
Poverty in Richland County
Income Below Poverty by Sex and Age in Richland County
With 6.8% poverty level for males and 9.9% for females among the residents of Richland County, 16 and 17 year old males and 65 to 74 year old females are the most vulnerable to poverty, with 38 males (16.0%) and 141 females (21.7%) in their respective age groups living below the poverty level.
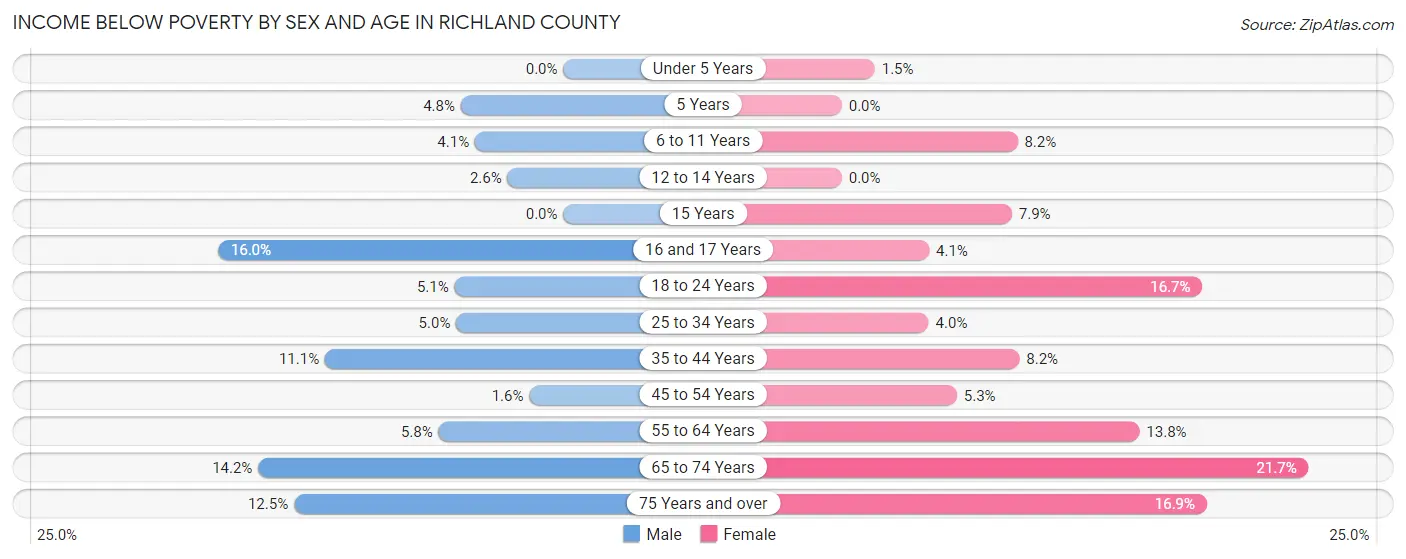
| Age Bracket | Male | Female |
| Under 5 Years | 0 (0.0%) | 5 (1.5%) |
| 5 Years | 4 (4.8%) | 0 (0.0%) |
| 6 to 11 Years | 22 (4.1%) | 37 (8.2%) |
| 12 to 14 Years | 5 (2.6%) | 0 (0.0%) |
| 15 Years | 0 (0.0%) | 9 (7.9%) |
| 16 and 17 Years | 38 (16.0%) | 6 (4.1%) |
| 18 to 24 Years | 22 (5.1%) | 83 (16.7%) |
| 25 to 34 Years | 37 (5.0%) | 30 (4.0%) |
| 35 to 44 Years | 79 (11.1%) | 56 (8.2%) |
| 45 to 54 Years | 10 (1.6%) | 33 (5.3%) |
| 55 to 64 Years | 46 (5.8%) | 95 (13.8%) |
| 65 to 74 Years | 81 (14.2%) | 141 (21.7%) |
| 75 Years and over | 41 (12.5%) | 62 (16.9%) |
| Total | 385 (6.8%) | 557 (9.9%) |
Income Above Poverty by Sex and Age in Richland County
According to the poverty statistics in Richland County, males aged under 5 years and females aged 5 years are the age groups that are most secure financially, with 100.0% of males and 100.0% of females in these age groups living above the poverty line.
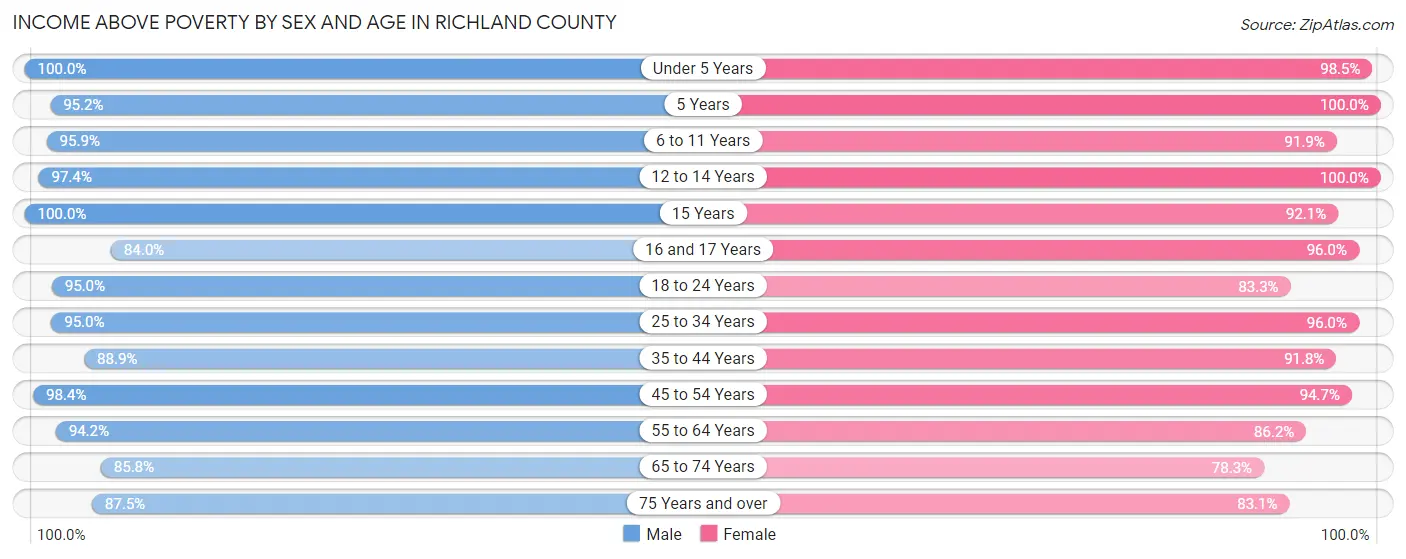
| Age Bracket | Male | Female |
| Under 5 Years | 367 (100.0%) | 321 (98.5%) |
| 5 Years | 80 (95.2%) | 82 (100.0%) |
| 6 to 11 Years | 515 (95.9%) | 417 (91.8%) |
| 12 to 14 Years | 188 (97.4%) | 247 (100.0%) |
| 15 Years | 55 (100.0%) | 105 (92.1%) |
| 16 and 17 Years | 199 (84.0%) | 142 (96.0%) |
| 18 to 24 Years | 414 (95.0%) | 413 (83.3%) |
| 25 to 34 Years | 707 (95.0%) | 715 (96.0%) |
| 35 to 44 Years | 635 (88.9%) | 624 (91.8%) |
| 45 to 54 Years | 624 (98.4%) | 585 (94.7%) |
| 55 to 64 Years | 748 (94.2%) | 593 (86.2%) |
| 65 to 74 Years | 491 (85.8%) | 510 (78.3%) |
| 75 Years and over | 287 (87.5%) | 304 (83.1%) |
| Total | 5,310 (93.2%) | 5,058 (90.1%) |
Income Below Poverty Among Married-Couple Families in Richland County
The poverty statistics for married-couple families in Richland County show that 4.6% or 100 of the total 2,167 families live below the poverty line. Families with no children have the highest poverty rate of 6.7%, comprising of 93 families. On the other hand, families with 3 or 4 children have the lowest poverty rate of 0.0%, which includes 0 families.
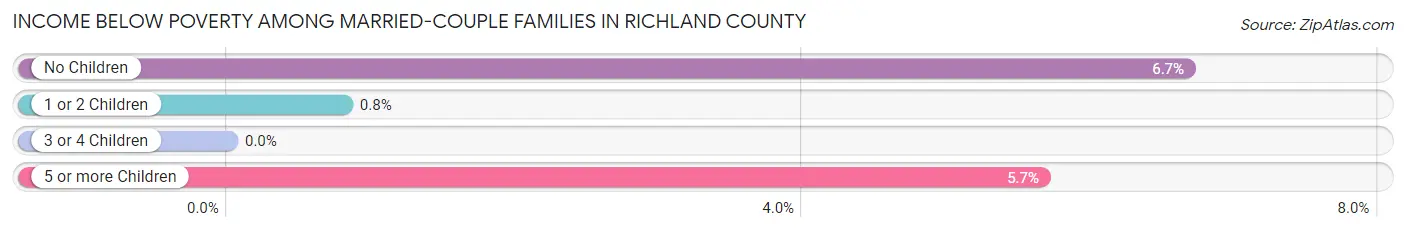
| Children | Above Poverty | Below Poverty |
| No Children | 1,302 (93.3%) | 93 (6.7%) |
| 1 or 2 Children | 496 (99.2%) | 4 (0.8%) |
| 3 or 4 Children | 219 (100.0%) | 0 (0.0%) |
| 5 or more Children | 50 (94.3%) | 3 (5.7%) |
| Total | 2,067 (95.4%) | 100 (4.6%) |
Income Below Poverty Among Single-Parent Households in Richland County
According to the poverty data in Richland County, 13.4% or 26 single-father households and 12.5% or 36 single-mother households are living below the poverty line. Among single-father households, those with 1 or 2 children have the highest poverty rate, with 18 households (19.2%) experiencing poverty. Likewise, among single-mother households, those with 3 or 4 children have the highest poverty rate, with 6 households (100.0%) falling below the poverty line.
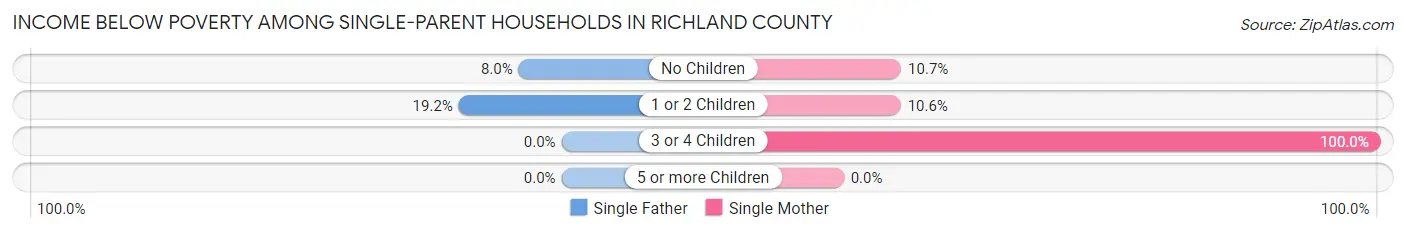
| Children | Single Father | Single Mother |
| No Children | 8 (8.0%) | 6 (10.7%) |
| 1 or 2 Children | 18 (19.2%) | 24 (10.6%) |
| 3 or 4 Children | 0 (0.0%) | 6 (100.0%) |
| 5 or more Children | 0 (0.0%) | 0 (0.0%) |
| Total | 26 (13.4%) | 36 (12.5%) |
Income Below Poverty Among Married-Couple vs Single-Parent Households in Richland County
The poverty data for Richland County shows that 100 of the married-couple family households (4.6%) and 62 of the single-parent households (12.9%) are living below the poverty level. Within the married-couple family households, those with no children have the highest poverty rate, with 93 households (6.7%) falling below the poverty line. Among the single-parent households, those with 3 or 4 children have the highest poverty rate, with 6 household (100.0%) living below poverty.
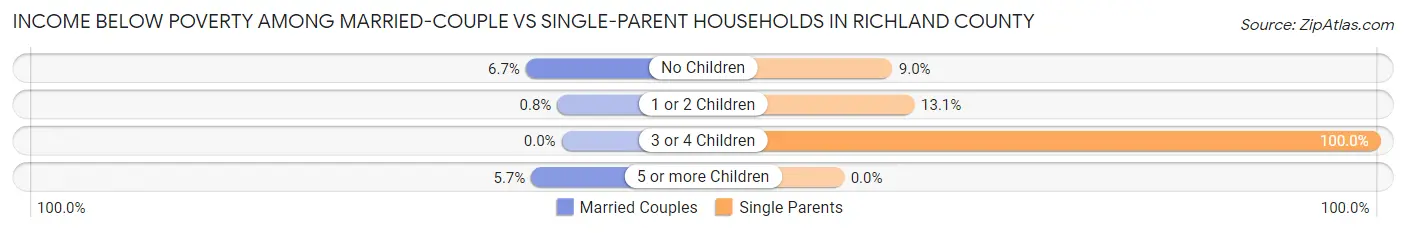
| Children | Married-Couple Families | Single-Parent Households |
| No Children | 93 (6.7%) | 14 (9.0%) |
| 1 or 2 Children | 4 (0.8%) | 42 (13.1%) |
| 3 or 4 Children | 0 (0.0%) | 6 (100.0%) |
| 5 or more Children | 3 (5.7%) | 0 (0.0%) |
| Total | 100 (4.6%) | 62 (12.9%) |
Race in Richland County
The most populous races in Richland County are White / Caucasian (10,278 | 90.4%), Hispanic or Latino (658 | 5.8%), and Two or more Races (586 | 5.2%).
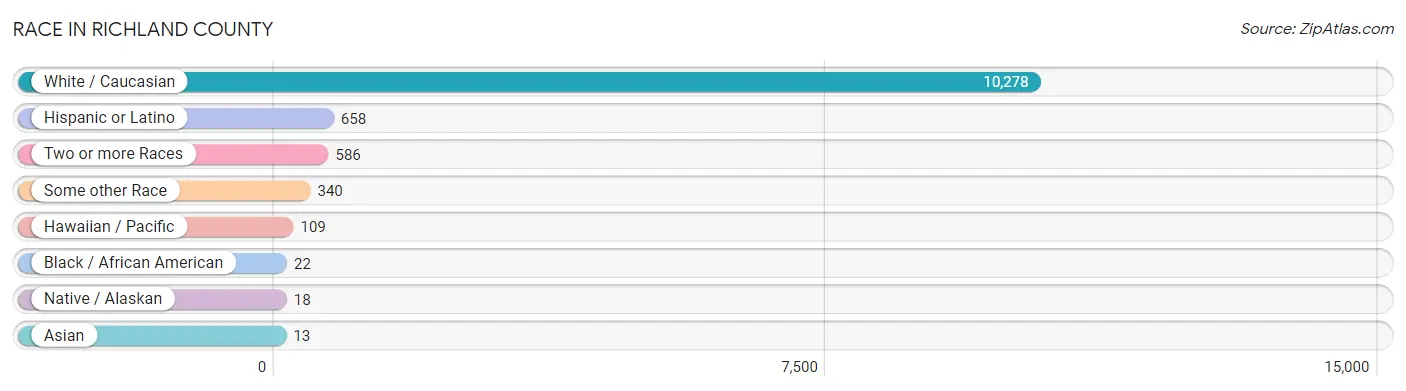
| Race | # Population | % Population |
| Asian | 13 | 0.1% |
| Black / African American | 22 | 0.2% |
| Hawaiian / Pacific | 109 | 1.0% |
| Hispanic or Latino | 658 | 5.8% |
| Native / Alaskan | 18 | 0.2% |
| White / Caucasian | 10,278 | 90.4% |
| Two or more Races | 586 | 5.2% |
| Some other Race | 340 | 3.0% |
| Total | 11,366 | 100.0% |
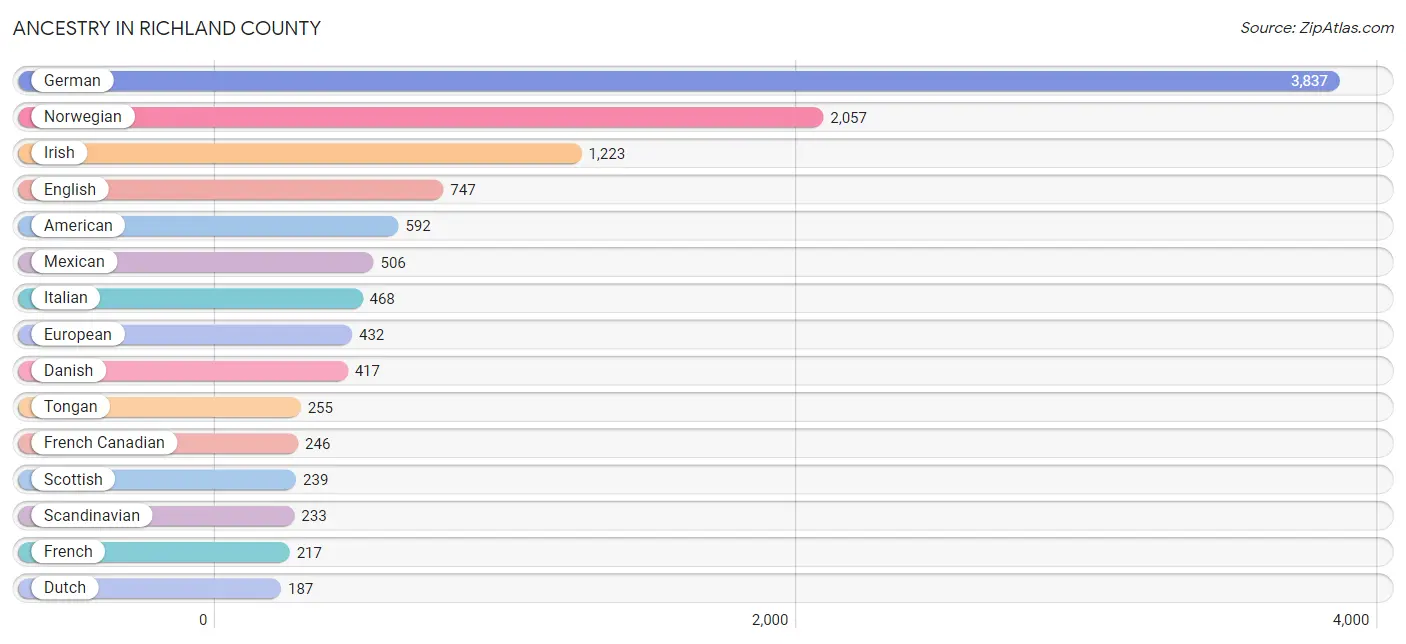
Ancestry in Richland County
The most populous ancestries reported in Richland County are German (3,837 | 33.8%), Norwegian (2,057 | 18.1%), Irish (1,223 | 10.8%), English (747 | 6.6%), and American (592 | 5.2%), together accounting for 74.4% of all Richland County residents.
| Ancestry | # Population | % Population |
| American | 592 | 5.2% |
| Assyrian / Chaldean / Syriac | 9 | 0.1% |
| Australian | 3 | 0.0% |
| Austrian | 19 | 0.2% |
| Basque | 4 | 0.0% |
| Belgian | 38 | 0.3% |
| Blackfeet | 18 | 0.2% |
| British | 101 | 0.9% |
| Bulgarian | 1 | 0.0% |
| Canadian | 1 | 0.0% |
| Central American | 11 | 0.1% |
| Chippewa | 5 | 0.0% |
| Colombian | 64 | 0.6% |
| Croatian | 2 | 0.0% |
| Czech | 80 | 0.7% |
| Czechoslovakian | 21 | 0.2% |
| Danish | 417 | 3.7% |
| Dutch | 187 | 1.7% |
| English | 747 | 6.6% |
| European | 432 | 3.8% |
| Finnish | 15 | 0.1% |
| French | 217 | 1.9% |
| French American Indian | 3 | 0.0% |
| French Canadian | 246 | 2.2% |
| German | 3,837 | 33.8% |
| Greek | 49 | 0.4% |
| Honduran | 11 | 0.1% |
| Hungarian | 64 | 0.6% |
| Indian (Asian) | 4 | 0.0% |
| Irish | 1,223 | 10.8% |
| Italian | 468 | 4.1% |
| Korean | 32 | 0.3% |
| Lithuanian | 4 | 0.0% |
| Mexican | 506 | 4.4% |
| Mongolian | 3 | 0.0% |
| Native Hawaiian | 16 | 0.1% |
| Norwegian | 2,057 | 18.1% |
| Pakistani | 34 | 0.3% |
| Pennsylvania German | 56 | 0.5% |
| Polish | 135 | 1.2% |
| Portuguese | 13 | 0.1% |
| Romanian | 40 | 0.4% |
| Russian | 94 | 0.8% |
| Scandinavian | 233 | 2.1% |
| Scotch-Irish | 11 | 0.1% |
| Scottish | 239 | 2.1% |
| Sioux | 182 | 1.6% |
| Slovene | 1 | 0.0% |
| South American | 64 | 0.6% |
| Swedish | 110 | 1.0% |
| Swiss | 4 | 0.0% |
| Tongan | 255 | 2.2% |
| Ukrainian | 13 | 0.1% |
| Welsh | 41 | 0.4% | View All 54 Rows |
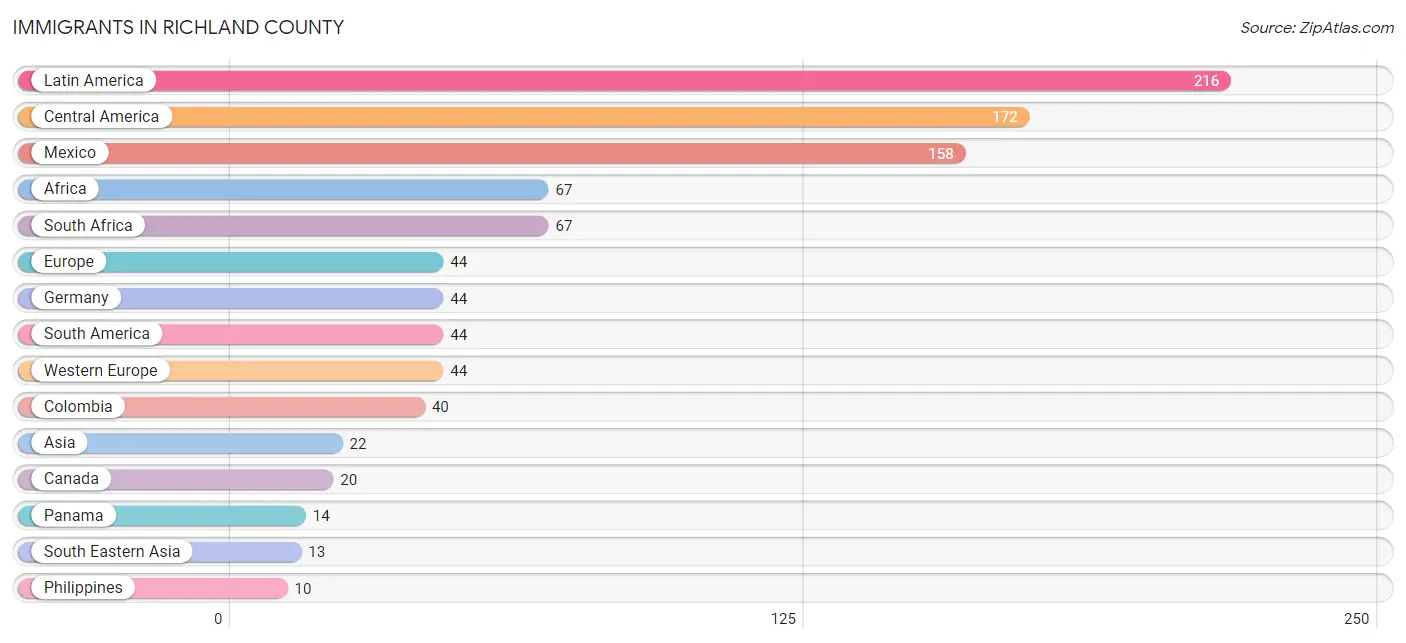
Immigrants in Richland County
The most numerous immigrant groups reported in Richland County came from Latin America (216 | 1.9%), Central America (172 | 1.5%), Mexico (158 | 1.4%), Africa (67 | 0.6%), and South Africa (67 | 0.6%), together accounting for 6.0% of all Richland County residents.
| Immigration Origin | # Population | % Population |
| Africa | 67 | 0.6% |
| Asia | 22 | 0.2% |
| Australia | 5 | 0.0% |
| Canada | 20 | 0.2% |
| Central America | 172 | 1.5% |
| Colombia | 40 | 0.4% |
| Europe | 44 | 0.4% |
| Germany | 44 | 0.4% |
| Iraq | 9 | 0.1% |
| Latin America | 216 | 1.9% |
| Malaysia | 3 | 0.0% |
| Mexico | 158 | 1.4% |
| Oceania | 5 | 0.0% |
| Panama | 14 | 0.1% |
| Philippines | 10 | 0.1% |
| South Africa | 67 | 0.6% |
| South America | 44 | 0.4% |
| South Eastern Asia | 13 | 0.1% |
| Venezuela | 4 | 0.0% |
| Western Asia | 9 | 0.1% |
| Western Europe | 44 | 0.4% | View All 21 Rows |
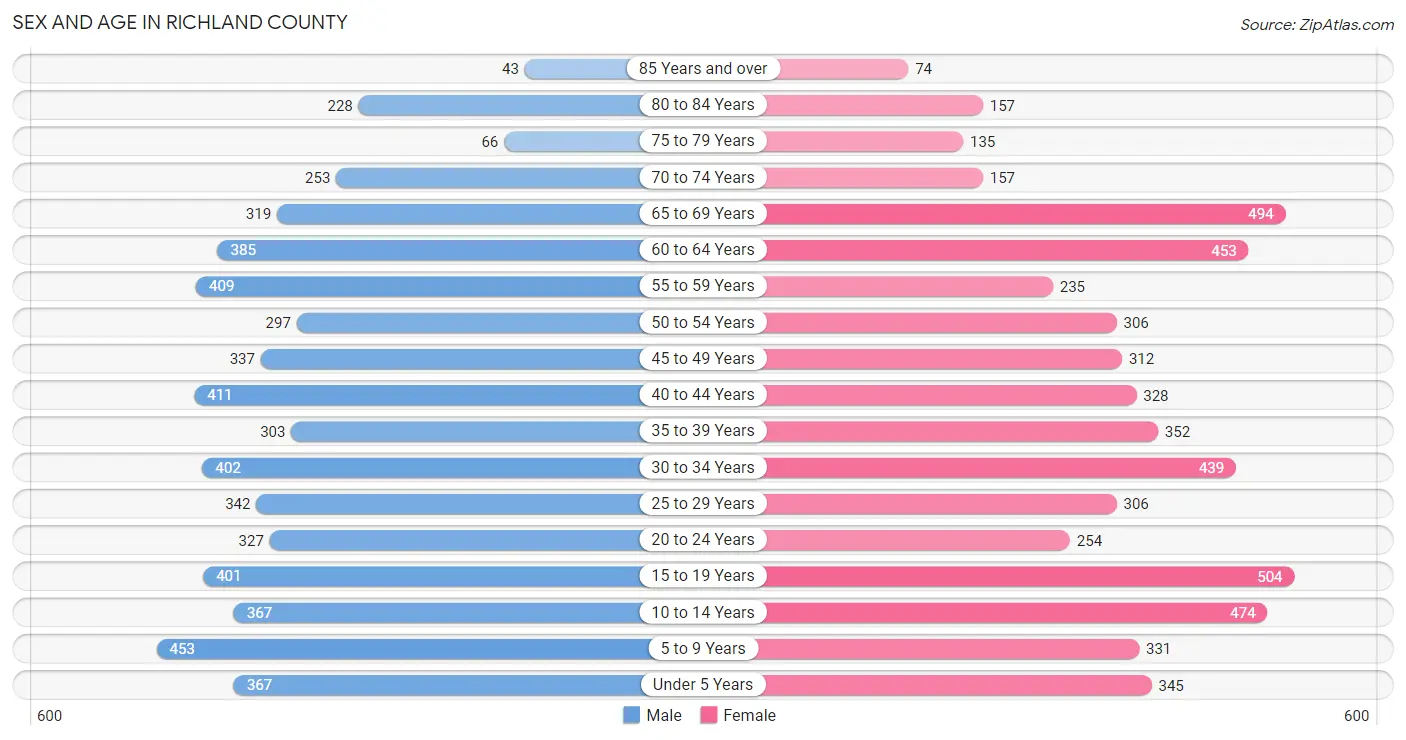
Sex and Age in Richland County
Sex and Age in Richland County
The most populous age groups in Richland County are 5 to 9 Years (453 | 7.9%) for men and 15 to 19 Years (504 | 8.9%) for women.
| Age Bracket | Male | Female |
| Under 5 Years | 367 (6.4%) | 345 (6.1%) |
| 5 to 9 Years | 453 (7.9%) | 331 (5.9%) |
| 10 to 14 Years | 367 (6.4%) | 474 (8.4%) |
| 15 to 19 Years | 401 (7.0%) | 504 (8.9%) |
| 20 to 24 Years | 327 (5.7%) | 254 (4.5%) |
| 25 to 29 Years | 342 (6.0%) | 306 (5.4%) |
| 30 to 34 Years | 402 (7.0%) | 439 (7.8%) |
| 35 to 39 Years | 303 (5.3%) | 352 (6.2%) |
| 40 to 44 Years | 411 (7.2%) | 328 (5.8%) |
| 45 to 49 Years | 337 (5.9%) | 312 (5.5%) |
| 50 to 54 Years | 297 (5.2%) | 306 (5.4%) |
| 55 to 59 Years | 409 (7.2%) | 235 (4.2%) |
| 60 to 64 Years | 385 (6.7%) | 453 (8.0%) |
| 65 to 69 Years | 319 (5.6%) | 494 (8.7%) |
| 70 to 74 Years | 253 (4.4%) | 157 (2.8%) |
| 75 to 79 Years | 66 (1.2%) | 135 (2.4%) |
| 80 to 84 Years | 228 (4.0%) | 157 (2.8%) |
| 85 Years and over | 43 (0.7%) | 74 (1.3%) |
| Total | 5,710 (100.0%) | 5,656 (100.0%) |
Families and Households in Richland County
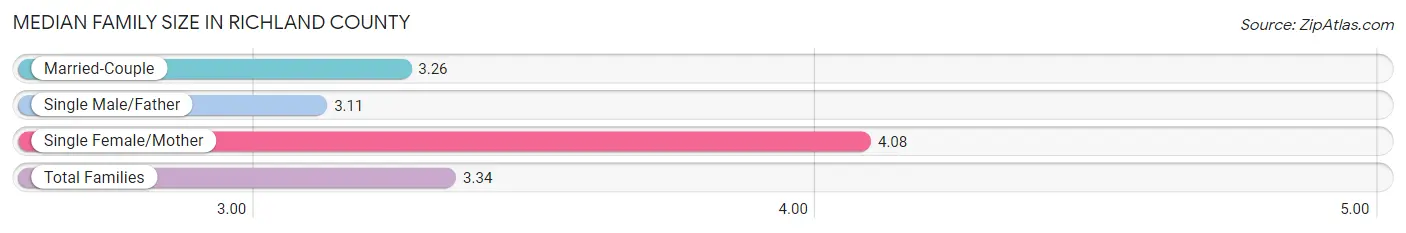
Median Family Size in Richland County
The median family size in Richland County is 3.34 persons per family, with single female/mother families (288 | 10.9%) accounting for the largest median family size of 4.08 persons per family. On the other hand, single male/father families (194 | 7.3%) represent the smallest median family size with 3.11 persons per family.
| Family Type | # Families | Family Size |
| Married-Couple | 2,167 (81.8%) | 3.26 |
| Single Male/Father | 194 (7.3%) | 3.11 |
| Single Female/Mother | 288 (10.9%) | 4.08 |
| Total Families | 2,649 (100.0%) | 3.34 |
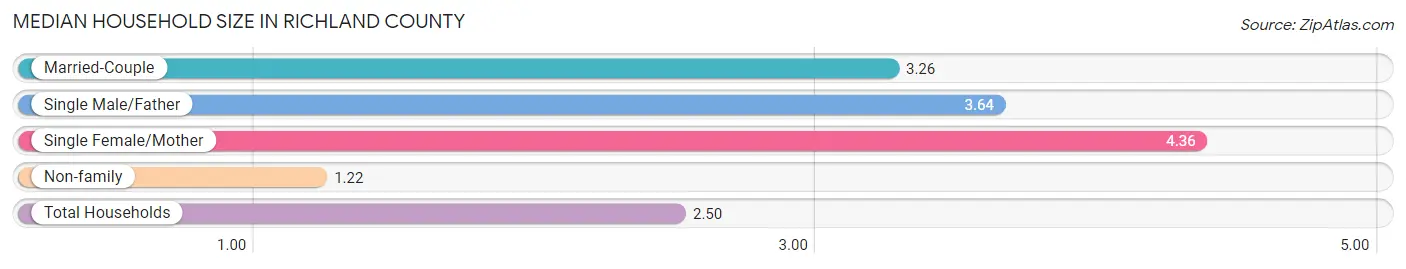
Median Household Size in Richland County
The median household size in Richland County is 2.50 persons per household, with single female/mother households (288 | 6.4%) accounting for the largest median household size of 4.36 persons per household. non-family households (1,880 | 41.5%) represent the smallest median household size with 1.22 persons per household.
| Household Type | # Households | Household Size |
| Married-Couple | 2,167 (47.8%) | 3.26 |
| Single Male/Father | 194 (4.3%) | 3.64 |
| Single Female/Mother | 288 (6.4%) | 4.36 |
| Non-family | 1,880 (41.5%) | 1.22 |
| Total Households | 4,529 (100.0%) | 2.50 |
Household Size by Marriage Status in Richland County
Out of a total of 4,529 households in Richland County, 2,649 (58.5%) are family households, while 1,880 (41.5%) are nonfamily households. The most numerous type of family households are 2-person households, comprising 1,476, and the most common type of nonfamily households are 1-person households, comprising 1,624.
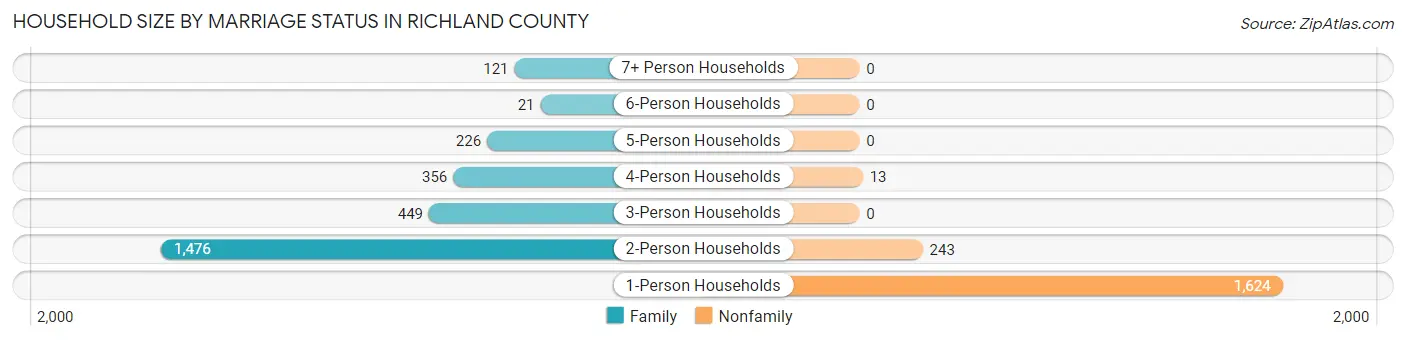
| Household Size | Family Households | Nonfamily Households |
| 1-Person Households | - | 1,624 (35.9%) |
| 2-Person Households | 1,476 (32.6%) | 243 (5.4%) |
| 3-Person Households | 449 (9.9%) | 0 (0.0%) |
| 4-Person Households | 356 (7.9%) | 13 (0.3%) |
| 5-Person Households | 226 (5.0%) | 0 (0.0%) |
| 6-Person Households | 21 (0.5%) | 0 (0.0%) |
| 7+ Person Households | 121 (2.7%) | 0 (0.0%) |
| Total | 2,649 (58.5%) | 1,880 (41.5%) |
Female Fertility in Richland County
Fertility by Age in Richland County
Average fertility rate in Richland County is 52.0 births per 1,000 women. Women in the age bracket of 20 to 34 years have the highest fertility rate with 105.0 births per 1,000 women. Women in the age bracket of 20 to 34 years acount for 78.4% of all women with births.
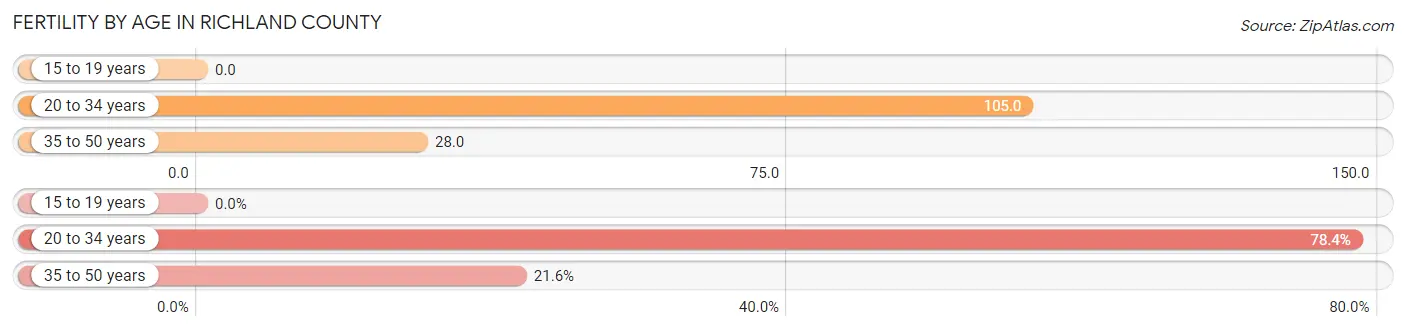
| Age Bracket | Women with Births | Births / 1,000 Women |
| 15 to 19 years | 0 (0.0%) | 0.0 |
| 20 to 34 years | 105 (78.4%) | 105.0 |
| 35 to 50 years | 29 (21.6%) | 28.0 |
| Total | 134 (100.0%) | 52.0 |
Fertility by Age by Marriage Status in Richland County
94.0% of women with births (134) in Richland County are married. The highest percentage of unmarried women with births falls into 35 to 50 years age bracket with 27.6% of them unmarried at the time of birth, while the lowest percentage of unmarried women with births belong to 20 to 34 years age bracket with 0.0% of them unmarried.
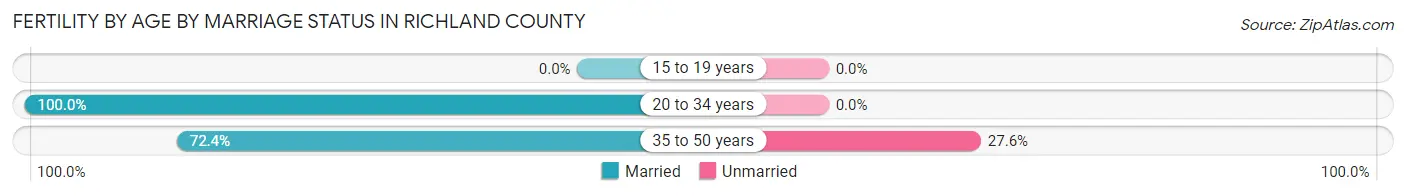
| Age Bracket | Married | Unmarried |
| 15 to 19 years | 0 (0.0%) | 0 (0.0%) |
| 20 to 34 years | 105 (100.0%) | 0 (0.0%) |
| 35 to 50 years | 21 (72.4%) | 8 (27.6%) |
| Total | 126 (94.0%) | 8 (6.0%) |
Fertility by Education in Richland County
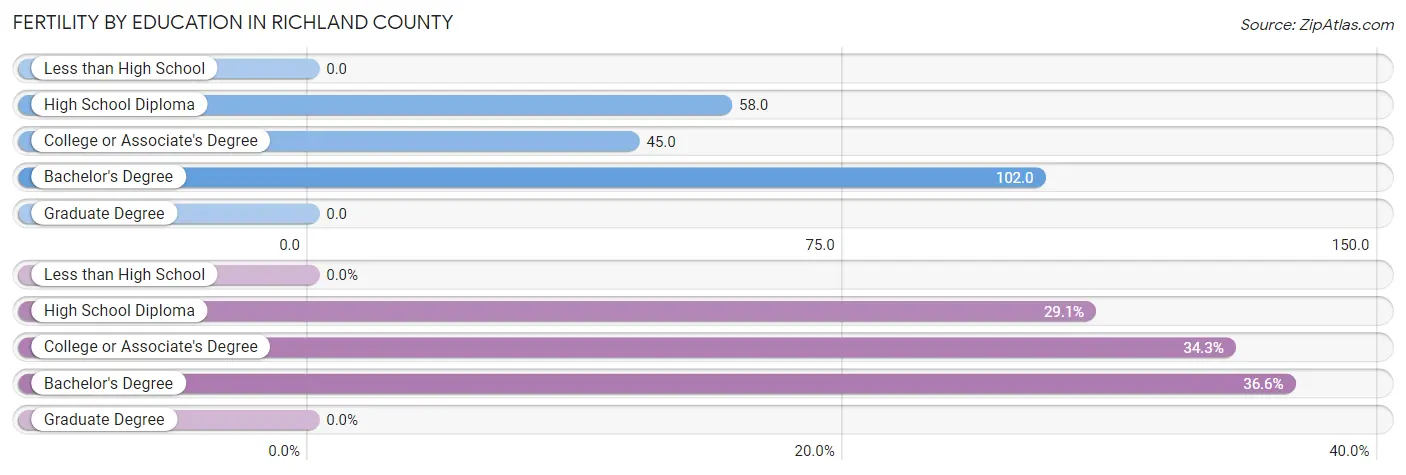
| Educational Attainment | Women with Births | Births / 1,000 Women |
| Less than High School | 0 (0.0%) | 0.0 |
| High School Diploma | 39 (29.1%) | 58.0 |
| College or Associate's Degree | 46 (34.3%) | 45.0 |
| Bachelor's Degree | 49 (36.6%) | 102.0 |
| Graduate Degree | 0 (0.0%) | 0.0 |
| Total | 134 (100.0%) | 52.0 |
Fertility by Education by Marriage Status in Richland County
6.0% of women with births in Richland County are unmarried. Women with the educational attainment of bachelor's degree are most likely to be married with 100.0% of them married at childbirth, while women with the educational attainment of high school diploma are least likely to be married with 15.4% of them unmarried at childbirth.
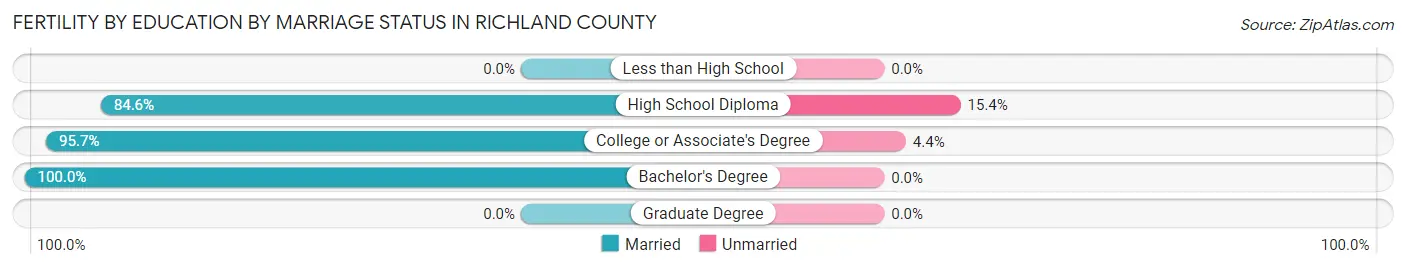
| Educational Attainment | Married | Unmarried |
| Less than High School | 0 (0.0%) | 0 (0.0%) |
| High School Diploma | 33 (84.6%) | 6 (15.4%) |
| College or Associate's Degree | 44 (95.7%) | 2 (4.3%) |
| Bachelor's Degree | 49 (100.0%) | 0 (0.0%) |
| Graduate Degree | 0 (0.0%) | 0 (0.0%) |
| Total | 126 (94.0%) | 8 (6.0%) |
Employment Characteristics in Richland County
Employment by Class of Employer in Richland County
Among the 5,451 employed individuals in Richland County, private company employees (3,455 | 63.4%), self-employed (not incorporated) (478 | 8.8%), and local government employees (460 | 8.4%) make up the most common classes of employment.
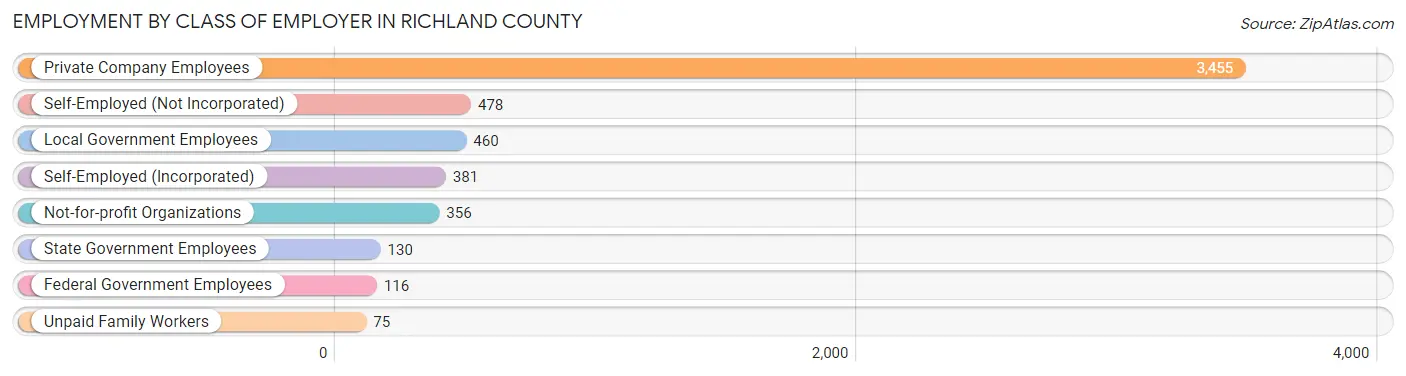
| Employer Class | # Employees | % Employees |
| Private Company Employees | 3,455 | 63.4% |
| Self-Employed (Incorporated) | 381 | 7.0% |
| Self-Employed (Not Incorporated) | 478 | 8.8% |
| Not-for-profit Organizations | 356 | 6.5% |
| Local Government Employees | 460 | 8.4% |
| State Government Employees | 130 | 2.4% |
| Federal Government Employees | 116 | 2.1% |
| Unpaid Family Workers | 75 | 1.4% |
| Total | 5,451 | 100.0% |
Employment Status by Age in Richland County
According to the labor force statistics for Richland County, out of the total population over 16 years of age (8,860), 66.8% or 5,918 individuals are in the labor force, with 4.9% or 290 of them unemployed. The age group with the highest labor force participation rate is 25 to 29 years, with 97.8% or 634 individuals in the labor force. Within the labor force, the 16 to 19 years age range has the highest percentage of unemployed individuals, with 40.2% or 187 of them being unemployed.
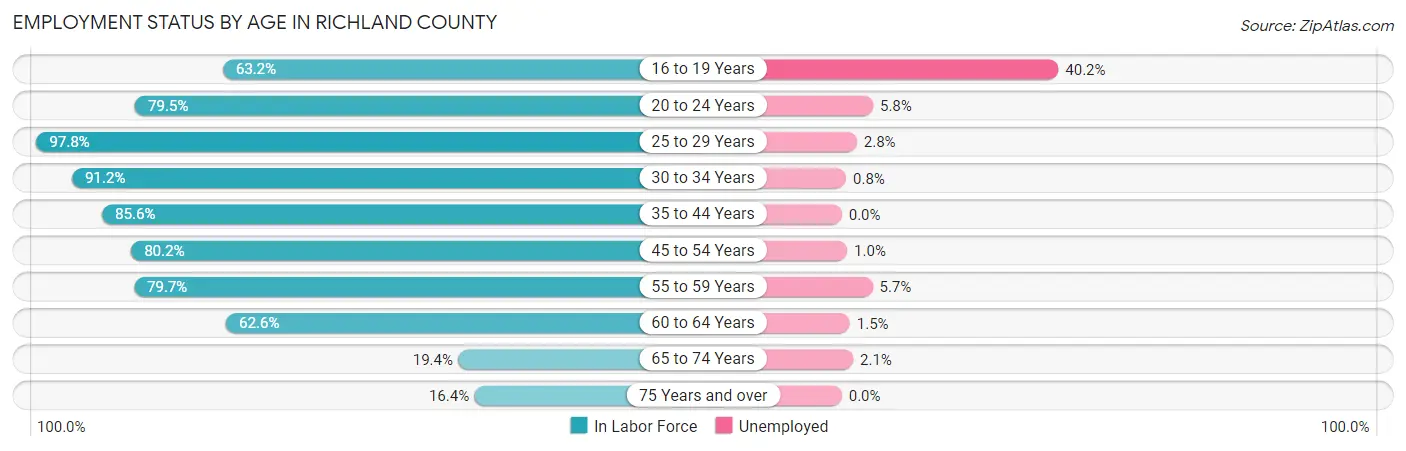
| Age Bracket | In Labor Force | Unemployed |
| 16 to 19 Years | 465 (63.2%) | 187 (40.2%) |
| 20 to 24 Years | 462 (79.5%) | 27 (5.8%) |
| 25 to 29 Years | 634 (97.8%) | 18 (2.8%) |
| 30 to 34 Years | 767 (91.2%) | 6 (0.8%) |
| 35 to 44 Years | 1,193 (85.6%) | 0 (0.0%) |
| 45 to 54 Years | 1,004 (80.2%) | 10 (1.0%) |
| 55 to 59 Years | 513 (79.7%) | 29 (5.7%) |
| 60 to 64 Years | 525 (62.6%) | 8 (1.5%) |
| 65 to 74 Years | 237 (19.4%) | 5 (2.1%) |
| 75 Years and over | 115 (16.4%) | 0 (0.0%) |
| Total | 5,918 (66.8%) | 290 (4.9%) |
Employment Status by Educational Attainment in Richland County
According to labor force statistics for Richland County, 82.5% of individuals (4,634) out of the total population between 25 and 64 years of age (5,617) are in the labor force, with 1.5% or 70 of them being unemployed. The group with the highest labor force participation rate are those with the educational attainment of bachelor's degree or higher, with 87.0% or 780 individuals in the labor force. Within the labor force, individuals with less than high school education have the highest percentage of unemployment, with 3.1% or 4 of them being unemployed.
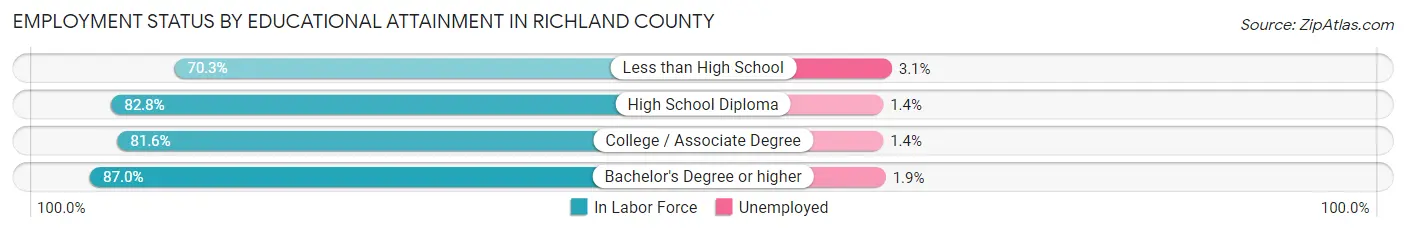
| Educational Attainment | In Labor Force | Unemployed |
| Less than High School | 130 (70.3%) | 6 (3.1%) |
| High School Diploma | 1,845 (82.8%) | 31 (1.4%) |
| College / Associate Degree | 1,883 (81.6%) | 32 (1.4%) |
| Bachelor's Degree or higher | 780 (87.0%) | 17 (1.9%) |
| Total | 4,634 (82.5%) | 84 (1.5%) |
Employment Occupations by Sex in Richland County
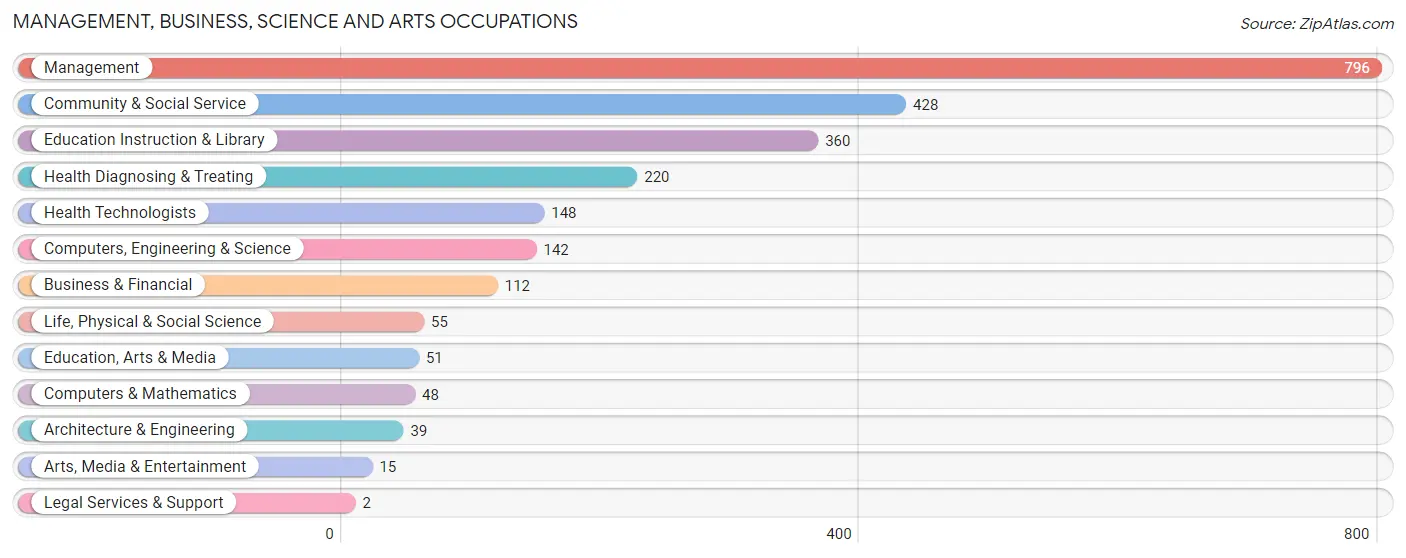
Management, Business, Science and Arts Occupations
The most common Management, Business, Science and Arts occupations in Richland County are Management (796 | 14.1%), Community & Social Service (428 | 7.6%), Education Instruction & Library (360 | 6.4%), Health Diagnosing & Treating (220 | 3.9%), and Health Technologists (148 | 2.6%).
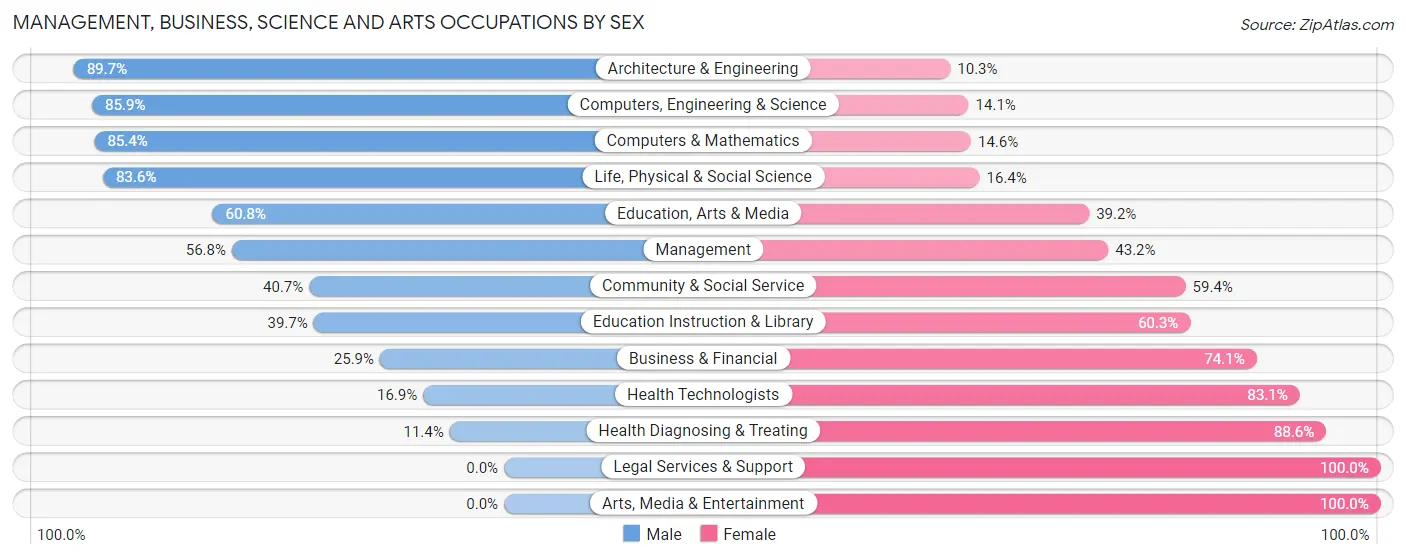
Management, Business, Science and Arts Occupations by Sex
Within the Management, Business, Science and Arts occupations in Richland County, the most male-oriented occupations are Architecture & Engineering (89.7%), Computers, Engineering & Science (85.9%), and Computers & Mathematics (85.4%), while the most female-oriented occupations are Legal Services & Support (100.0%), Arts, Media & Entertainment (100.0%), and Health Diagnosing & Treating (88.6%).
| Occupation | Male | Female |
| Management | 452 (56.8%) | 344 (43.2%) |
| Business & Financial | 29 (25.9%) | 83 (74.1%) |
| Computers, Engineering & Science | 122 (85.9%) | 20 (14.1%) |
| Computers & Mathematics | 41 (85.4%) | 7 (14.6%) |
| Architecture & Engineering | 35 (89.7%) | 4 (10.3%) |
| Life, Physical & Social Science | 46 (83.6%) | 9 (16.4%) |
| Community & Social Service | 174 (40.6%) | 254 (59.4%) |
| Education, Arts & Media | 31 (60.8%) | 20 (39.2%) |
| Legal Services & Support | 0 (0.0%) | 2 (100.0%) |
| Education Instruction & Library | 143 (39.7%) | 217 (60.3%) |
| Arts, Media & Entertainment | 0 (0.0%) | 15 (100.0%) |
| Health Diagnosing & Treating | 25 (11.4%) | 195 (88.6%) |
| Health Technologists | 25 (16.9%) | 123 (83.1%) |
| Total (Category) | 802 (47.2%) | 896 (52.8%) |
| Total (Overall) | 3,099 (55.1%) | 2,526 (44.9%) |
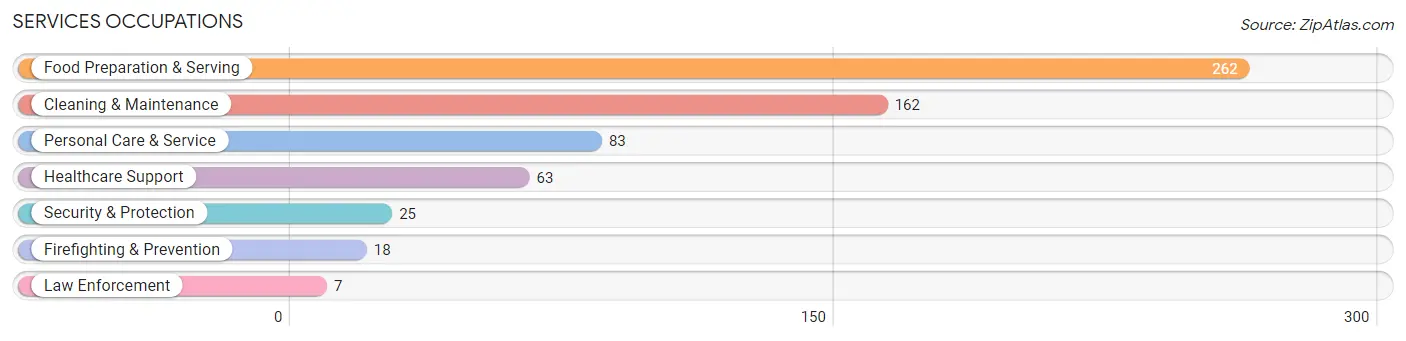
Services Occupations
The most common Services occupations in Richland County are Food Preparation & Serving (262 | 4.7%), Cleaning & Maintenance (162 | 2.9%), Personal Care & Service (83 | 1.5%), Healthcare Support (63 | 1.1%), and Security & Protection (25 | 0.4%).
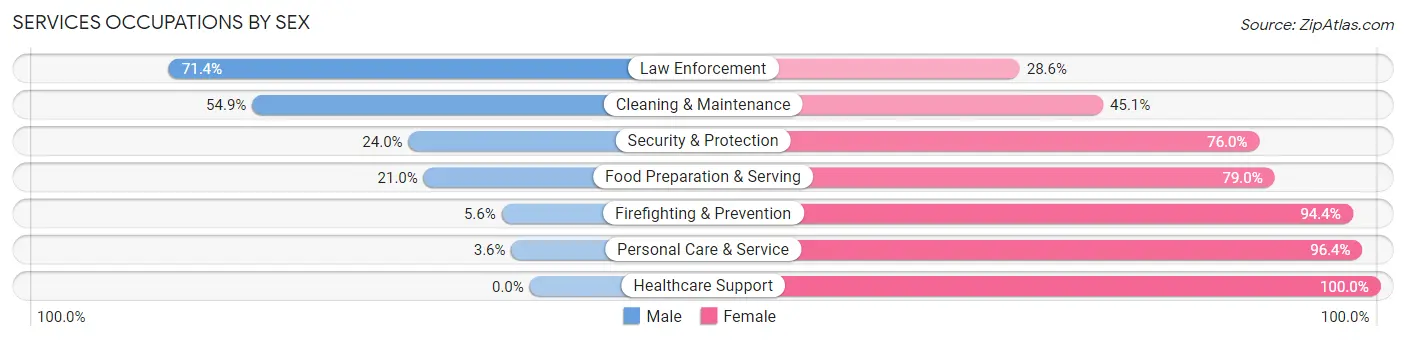
Services Occupations by Sex
Within the Services occupations in Richland County, the most male-oriented occupations are Law Enforcement (71.4%), Cleaning & Maintenance (54.9%), and Security & Protection (24.0%), while the most female-oriented occupations are Healthcare Support (100.0%), Personal Care & Service (96.4%), and Firefighting & Prevention (94.4%).
| Occupation | Male | Female |
| Healthcare Support | 0 (0.0%) | 63 (100.0%) |
| Security & Protection | 6 (24.0%) | 19 (76.0%) |
| Firefighting & Prevention | 1 (5.6%) | 17 (94.4%) |
| Law Enforcement | 5 (71.4%) | 2 (28.6%) |
| Food Preparation & Serving | 55 (21.0%) | 207 (79.0%) |
| Cleaning & Maintenance | 89 (54.9%) | 73 (45.1%) |
| Personal Care & Service | 3 (3.6%) | 80 (96.4%) |
| Total (Category) | 153 (25.7%) | 442 (74.3%) |
| Total (Overall) | 3,099 (55.1%) | 2,526 (44.9%) |
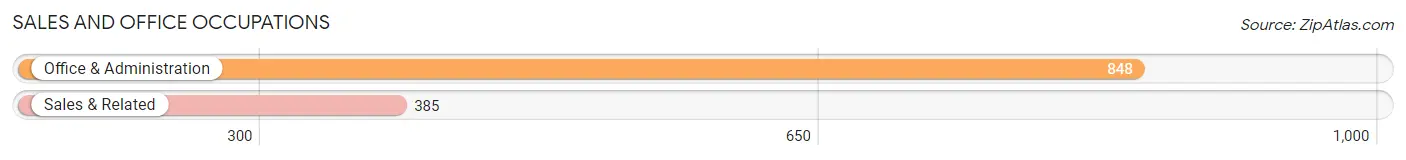
Sales and Office Occupations
The most common Sales and Office occupations in Richland County are Office & Administration (848 | 15.1%), and Sales & Related (385 | 6.8%).
Sales and Office Occupations by Sex
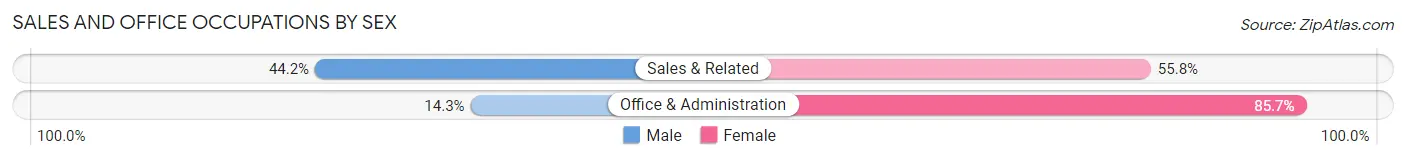
| Occupation | Male | Female |
| Sales & Related | 170 (44.2%) | 215 (55.8%) |
| Office & Administration | 121 (14.3%) | 727 (85.7%) |
| Total (Category) | 291 (23.6%) | 942 (76.4%) |
| Total (Overall) | 3,099 (55.1%) | 2,526 (44.9%) |
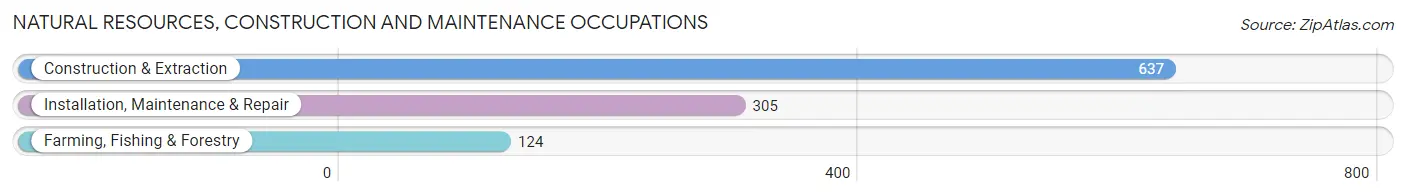
Natural Resources, Construction and Maintenance Occupations
The most common Natural Resources, Construction and Maintenance occupations in Richland County are Construction & Extraction (637 | 11.3%), Installation, Maintenance & Repair (305 | 5.4%), and Farming, Fishing & Forestry (124 | 2.2%).
Natural Resources, Construction and Maintenance Occupations by Sex
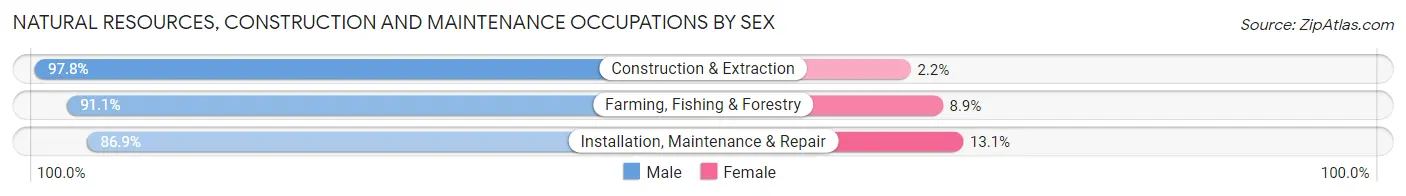
| Occupation | Male | Female |
| Farming, Fishing & Forestry | 113 (91.1%) | 11 (8.9%) |
| Construction & Extraction | 623 (97.8%) | 14 (2.2%) |
| Installation, Maintenance & Repair | 265 (86.9%) | 40 (13.1%) |
| Total (Category) | 1,001 (93.9%) | 65 (6.1%) |
| Total (Overall) | 3,099 (55.1%) | 2,526 (44.9%) |
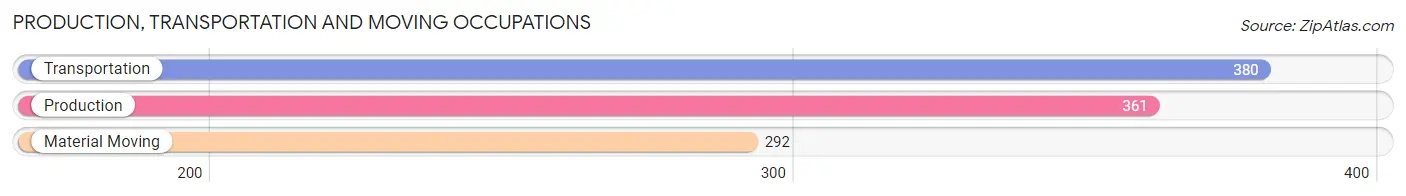
Production, Transportation and Moving Occupations
The most common Production, Transportation and Moving occupations in Richland County are Transportation (380 | 6.8%), Production (361 | 6.4%), and Material Moving (292 | 5.2%).
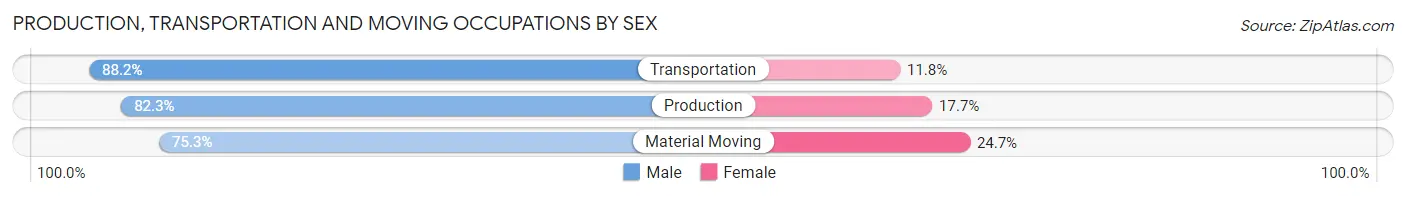
Production, Transportation and Moving Occupations by Sex
| Occupation | Male | Female |
| Production | 297 (82.3%) | 64 (17.7%) |
| Transportation | 335 (88.2%) | 45 (11.8%) |
| Material Moving | 220 (75.3%) | 72 (24.7%) |
| Total (Category) | 852 (82.5%) | 181 (17.5%) |
| Total (Overall) | 3,099 (55.1%) | 2,526 (44.9%) |
Employment Industries by Sex in Richland County
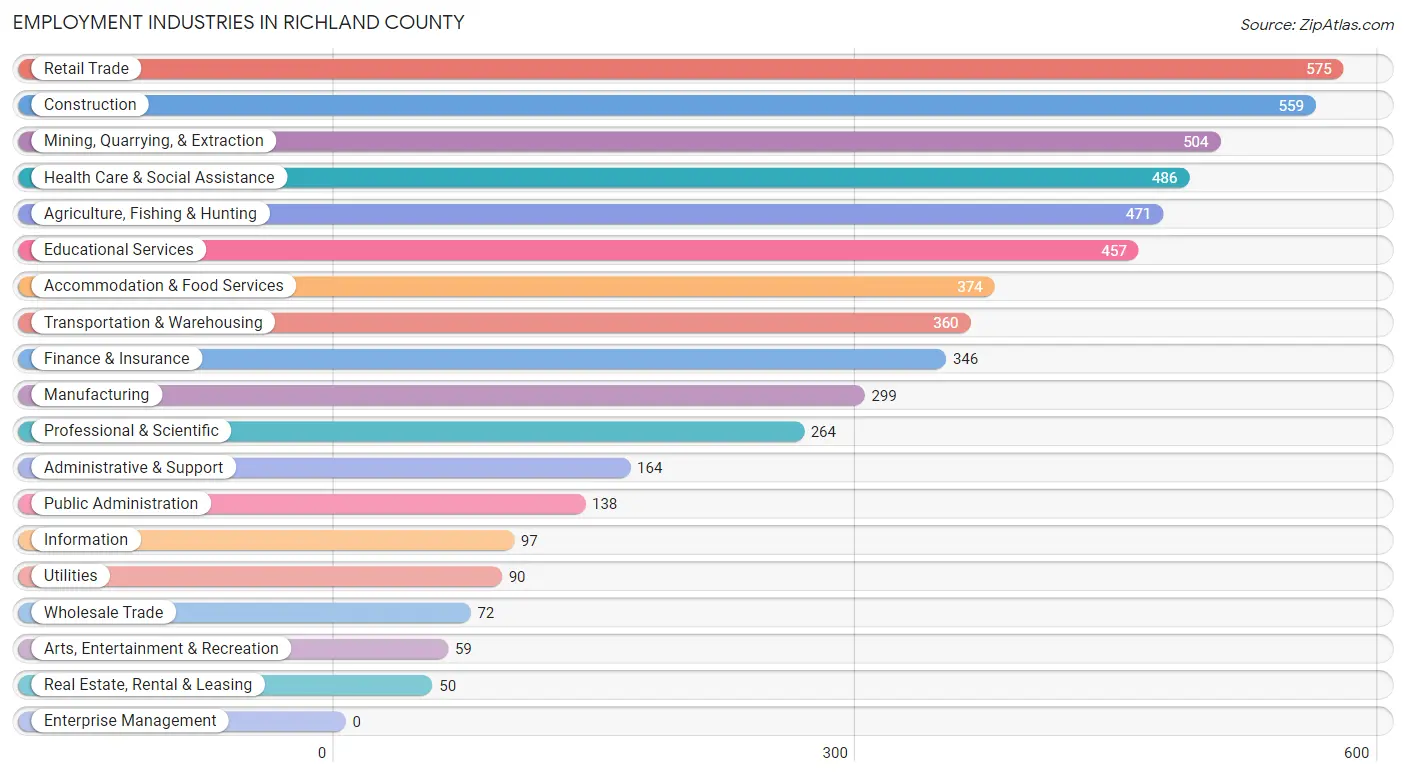
Employment Industries in Richland County
The major employment industries in Richland County include Retail Trade (575 | 10.2%), Construction (559 | 9.9%), Mining, Quarrying, & Extraction (504 | 9.0%), Health Care & Social Assistance (486 | 8.6%), and Agriculture, Fishing & Hunting (471 | 8.4%).
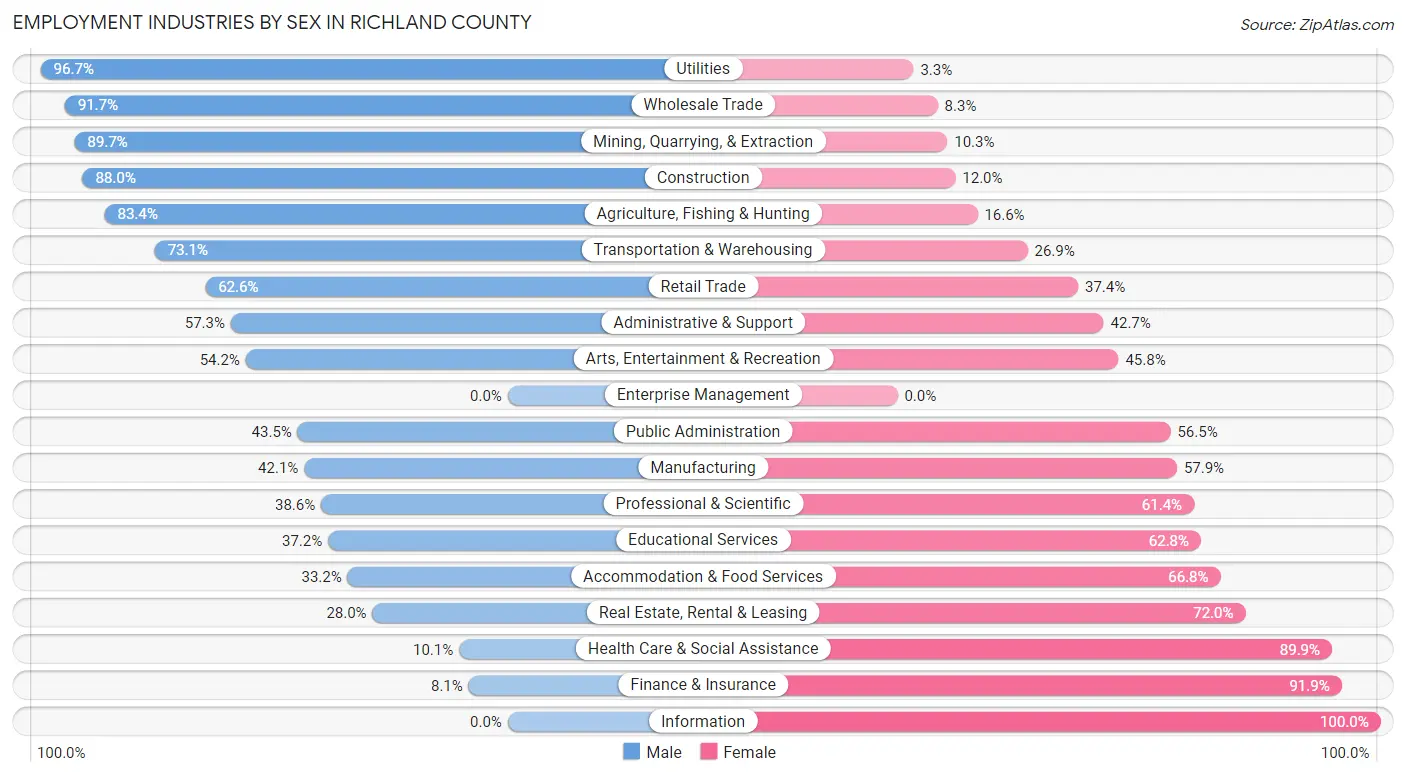
Employment Industries by Sex in Richland County
The Richland County industries that see more men than women are Utilities (96.7%), Wholesale Trade (91.7%), and Mining, Quarrying, & Extraction (89.7%), whereas the industries that tend to have a higher number of women are Information (100.0%), Finance & Insurance (91.9%), and Health Care & Social Assistance (89.9%).
| Industry | Male | Female |
| Agriculture, Fishing & Hunting | 393 (83.4%) | 78 (16.6%) |
| Mining, Quarrying, & Extraction | 452 (89.7%) | 52 (10.3%) |
| Construction | 492 (88.0%) | 67 (12.0%) |
| Manufacturing | 126 (42.1%) | 173 (57.9%) |
| Wholesale Trade | 66 (91.7%) | 6 (8.3%) |
| Retail Trade | 360 (62.6%) | 215 (37.4%) |
| Transportation & Warehousing | 263 (73.1%) | 97 (26.9%) |
| Utilities | 87 (96.7%) | 3 (3.3%) |
| Information | 0 (0.0%) | 97 (100.0%) |
| Finance & Insurance | 28 (8.1%) | 318 (91.9%) |
| Real Estate, Rental & Leasing | 14 (28.0%) | 36 (72.0%) |
| Professional & Scientific | 102 (38.6%) | 162 (61.4%) |
| Enterprise Management | 0 (0.0%) | 0 (0.0%) |
| Administrative & Support | 94 (57.3%) | 70 (42.7%) |
| Educational Services | 170 (37.2%) | 287 (62.8%) |
| Health Care & Social Assistance | 49 (10.1%) | 437 (89.9%) |
| Arts, Entertainment & Recreation | 32 (54.2%) | 27 (45.8%) |
| Accommodation & Food Services | 124 (33.2%) | 250 (66.8%) |
| Public Administration | 60 (43.5%) | 78 (56.5%) |
| Total | 3,099 (55.1%) | 2,526 (44.9%) |
Education in Richland County
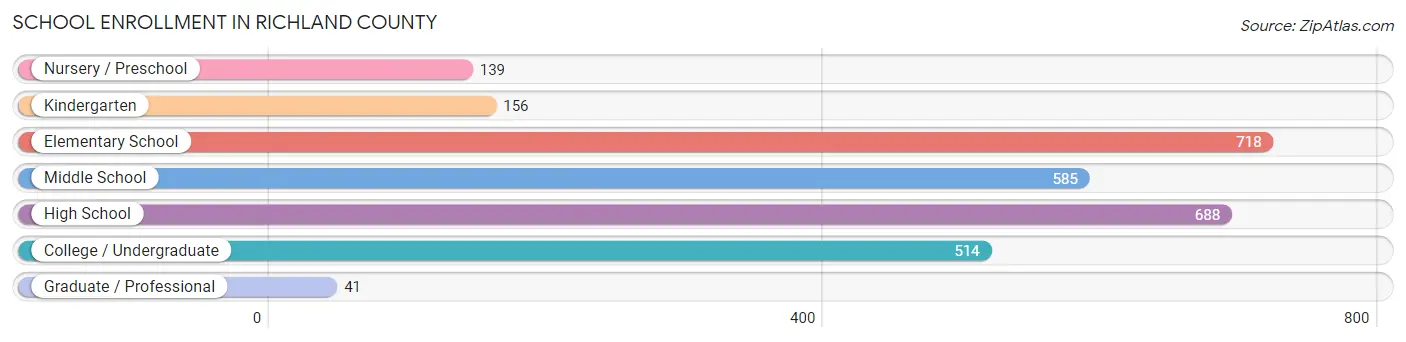
School Enrollment in Richland County
The most common levels of schooling among the 2,841 students in Richland County are elementary school (718 | 25.3%), high school (688 | 24.2%), and middle school (585 | 20.6%).
| School Level | # Students | % Students |
| Nursery / Preschool | 139 | 4.9% |
| Kindergarten | 156 | 5.5% |
| Elementary School | 718 | 25.3% |
| Middle School | 585 | 20.6% |
| High School | 688 | 24.2% |
| College / Undergraduate | 514 | 18.1% |
| Graduate / Professional | 41 | 1.4% |
| Total | 2,841 | 100.0% |
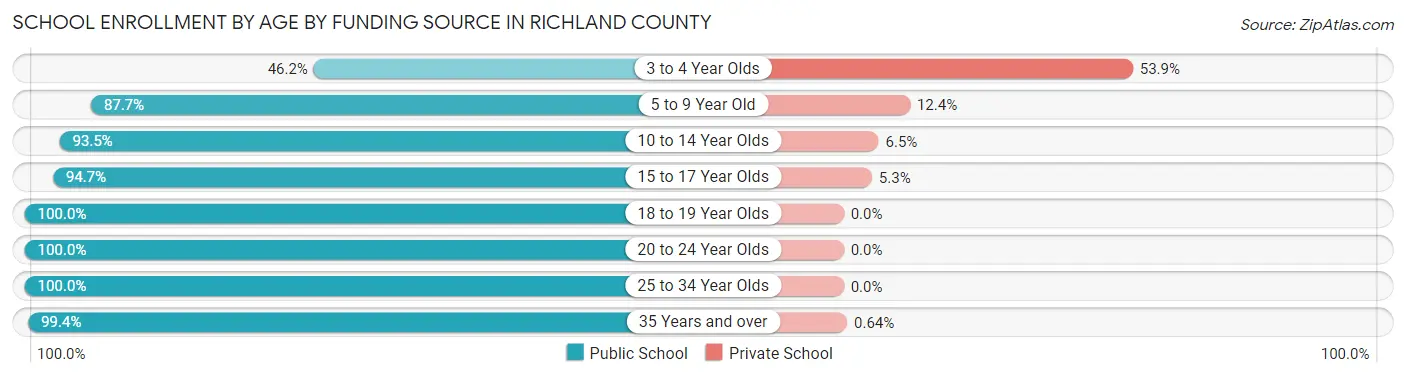
School Enrollment by Age by Funding Source in Richland County
Out of a total of 2,841 students who are enrolled in schools in Richland County, 210 (7.4%) attend a private institution, while the remaining 2,631 (92.6%) are enrolled in public schools. The age group of 3 to 4 year olds has the highest likelihood of being enrolled in private schools, with 35 (53.8% in the age bracket) enrolled. Conversely, the age group of 18 to 19 year olds has the lowest likelihood of being enrolled in a private school, with 285 (100.0% in the age bracket) attending a public institution.
| Age Bracket | Public School | Private School |
| 3 to 4 Year Olds | 30 (46.2%) | 35 (53.8%) |
| 5 to 9 Year Old | 646 (87.6%) | 91 (12.3%) |
| 10 to 14 Year Olds | 777 (93.5%) | 54 (6.5%) |
| 15 to 17 Year Olds | 522 (94.7%) | 29 (5.3%) |
| 18 to 19 Year Olds | 285 (100.0%) | 0 (0.0%) |
| 20 to 24 Year Olds | 154 (100.0%) | 0 (0.0%) |
| 25 to 34 Year Olds | 62 (100.0%) | 0 (0.0%) |
| 35 Years and over | 155 (99.4%) | 1 (0.6%) |
| Total | 2,631 (92.6%) | 210 (7.4%) |
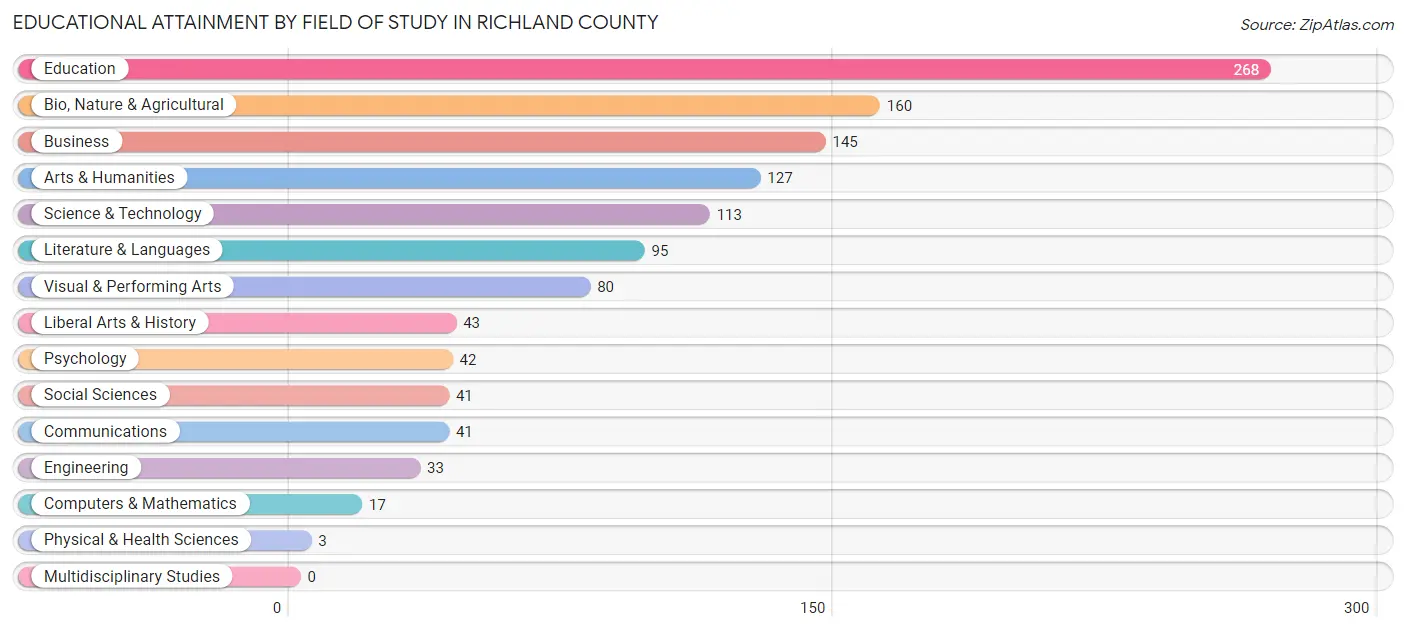
Educational Attainment by Field of Study in Richland County
Education (268 | 22.2%), bio, nature & agricultural (160 | 13.3%), business (145 | 12.0%), arts & humanities (127 | 10.5%), and science & technology (113 | 9.3%) are the most common fields of study among 1,208 individuals in Richland County who have obtained a bachelor's degree or higher.
| Field of Study | # Graduates | % Graduates |
| Computers & Mathematics | 17 | 1.4% |
| Bio, Nature & Agricultural | 160 | 13.3% |
| Physical & Health Sciences | 3 | 0.3% |
| Psychology | 42 | 3.5% |
| Social Sciences | 41 | 3.4% |
| Engineering | 33 | 2.7% |
| Multidisciplinary Studies | 0 | 0.0% |
| Science & Technology | 113 | 9.3% |
| Business | 145 | 12.0% |
| Education | 268 | 22.2% |
| Literature & Languages | 95 | 7.9% |
| Liberal Arts & History | 43 | 3.6% |
| Visual & Performing Arts | 80 | 6.6% |
| Communications | 41 | 3.4% |
| Arts & Humanities | 127 | 10.5% |
| Total | 1,208 | 100.0% |
Transportation & Commute in Richland County
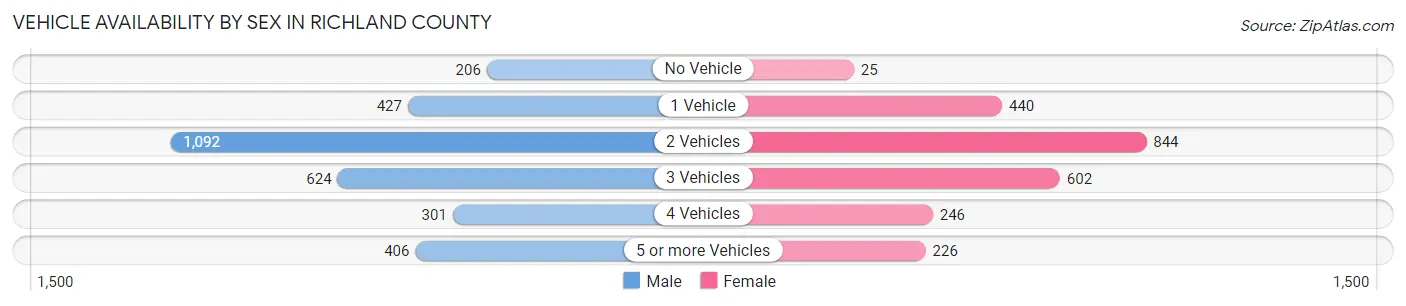
Vehicle Availability by Sex in Richland County
The most prevalent vehicle ownership categories in Richland County are males with 2 vehicles (1,092, accounting for 35.7%) and females with 2 vehicles (844, making up 45.8%).
| Vehicles Available | Male | Female |
| No Vehicle | 206 (6.7%) | 25 (1.1%) |
| 1 Vehicle | 427 (14.0%) | 440 (18.5%) |
| 2 Vehicles | 1,092 (35.7%) | 844 (35.4%) |
| 3 Vehicles | 624 (20.4%) | 602 (25.3%) |
| 4 Vehicles | 301 (9.9%) | 246 (10.3%) |
| 5 or more Vehicles | 406 (13.3%) | 226 (9.5%) |
| Total | 3,056 (100.0%) | 2,383 (100.0%) |
Commute Time in Richland County
The most frequently occuring commute durations in Richland County are 5 to 9 minutes (1,391 commuters, 26.8%), 10 to 14 minutes (780 commuters, 15.0%), and 15 to 19 minutes (654 commuters, 12.6%).
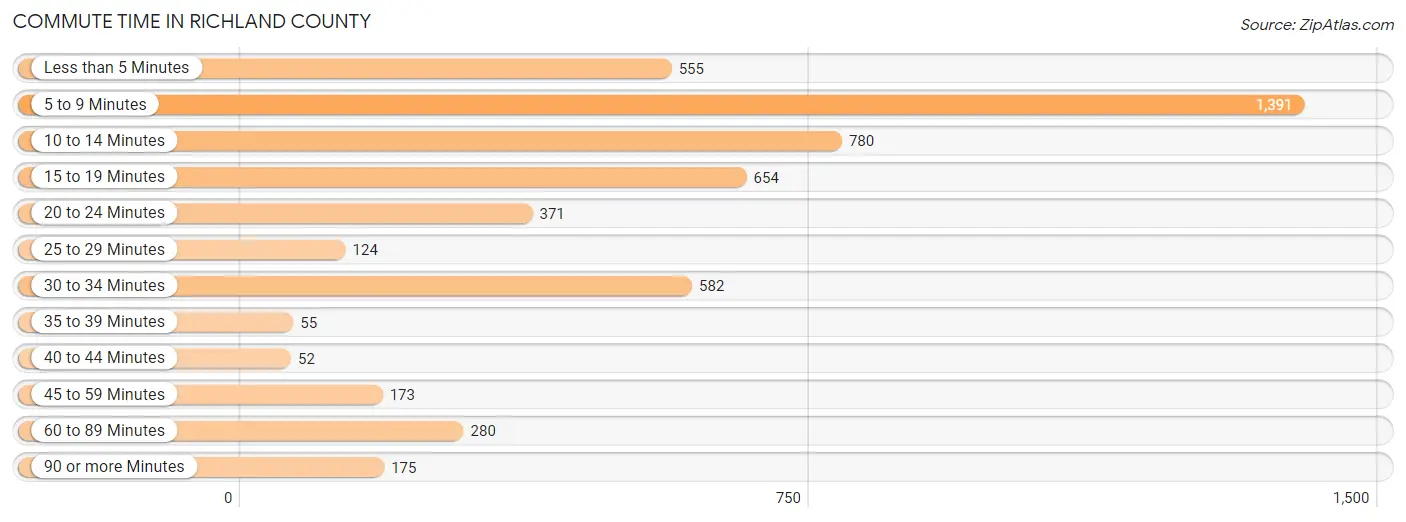
| Commute Time | # Commuters | % Commuters |
| Less than 5 Minutes | 555 | 10.7% |
| 5 to 9 Minutes | 1,391 | 26.8% |
| 10 to 14 Minutes | 780 | 15.0% |
| 15 to 19 Minutes | 654 | 12.6% |
| 20 to 24 Minutes | 371 | 7.1% |
| 25 to 29 Minutes | 124 | 2.4% |
| 30 to 34 Minutes | 582 | 11.2% |
| 35 to 39 Minutes | 55 | 1.1% |
| 40 to 44 Minutes | 52 | 1.0% |
| 45 to 59 Minutes | 173 | 3.3% |
| 60 to 89 Minutes | 280 | 5.4% |
| 90 or more Minutes | 175 | 3.4% |
Commute Time by Sex in Richland County
The most common commute times in Richland County are 5 to 9 minutes (569 commuters, 19.3%) for males and 5 to 9 minutes (822 commuters, 36.6%) for females.
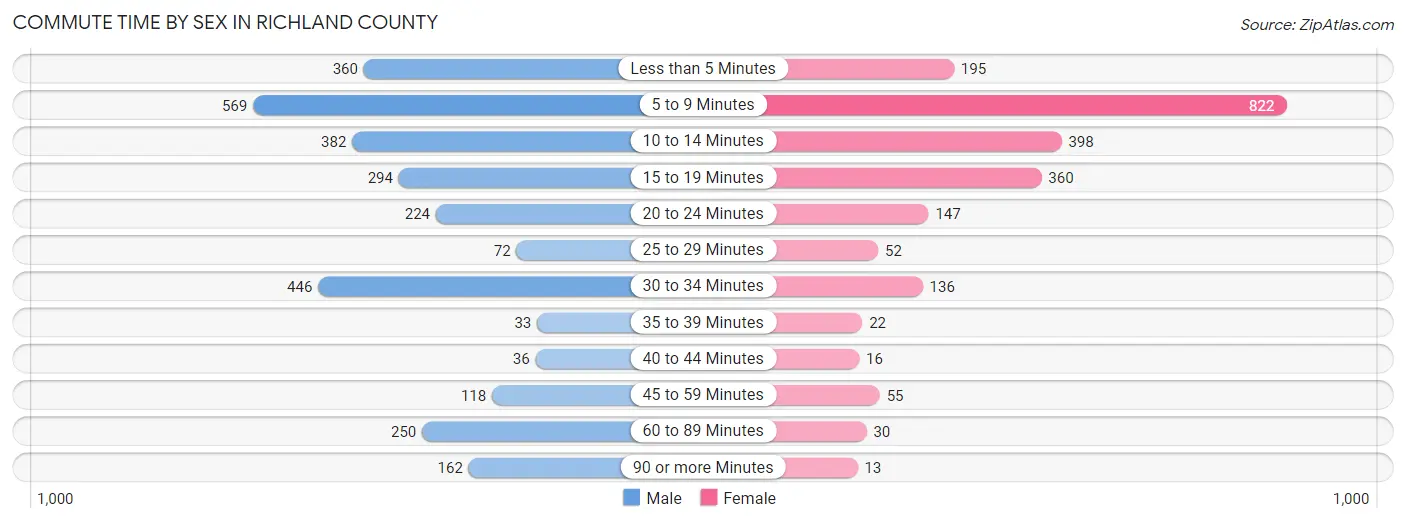
| Commute Time | Male | Female |
| Less than 5 Minutes | 360 (12.2%) | 195 (8.7%) |
| 5 to 9 Minutes | 569 (19.3%) | 822 (36.6%) |
| 10 to 14 Minutes | 382 (13.0%) | 398 (17.7%) |
| 15 to 19 Minutes | 294 (10.0%) | 360 (16.0%) |
| 20 to 24 Minutes | 224 (7.6%) | 147 (6.5%) |
| 25 to 29 Minutes | 72 (2.4%) | 52 (2.3%) |
| 30 to 34 Minutes | 446 (15.1%) | 136 (6.1%) |
| 35 to 39 Minutes | 33 (1.1%) | 22 (1.0%) |
| 40 to 44 Minutes | 36 (1.2%) | 16 (0.7%) |
| 45 to 59 Minutes | 118 (4.0%) | 55 (2.5%) |
| 60 to 89 Minutes | 250 (8.5%) | 30 (1.3%) |
| 90 or more Minutes | 162 (5.5%) | 13 (0.6%) |
Time of Departure to Work by Sex in Richland County
The most frequent times of departure to work in Richland County are 6:00 AM to 6:29 AM (438, 14.9%) for males and 7:30 AM to 7:59 AM (554, 24.7%) for females.
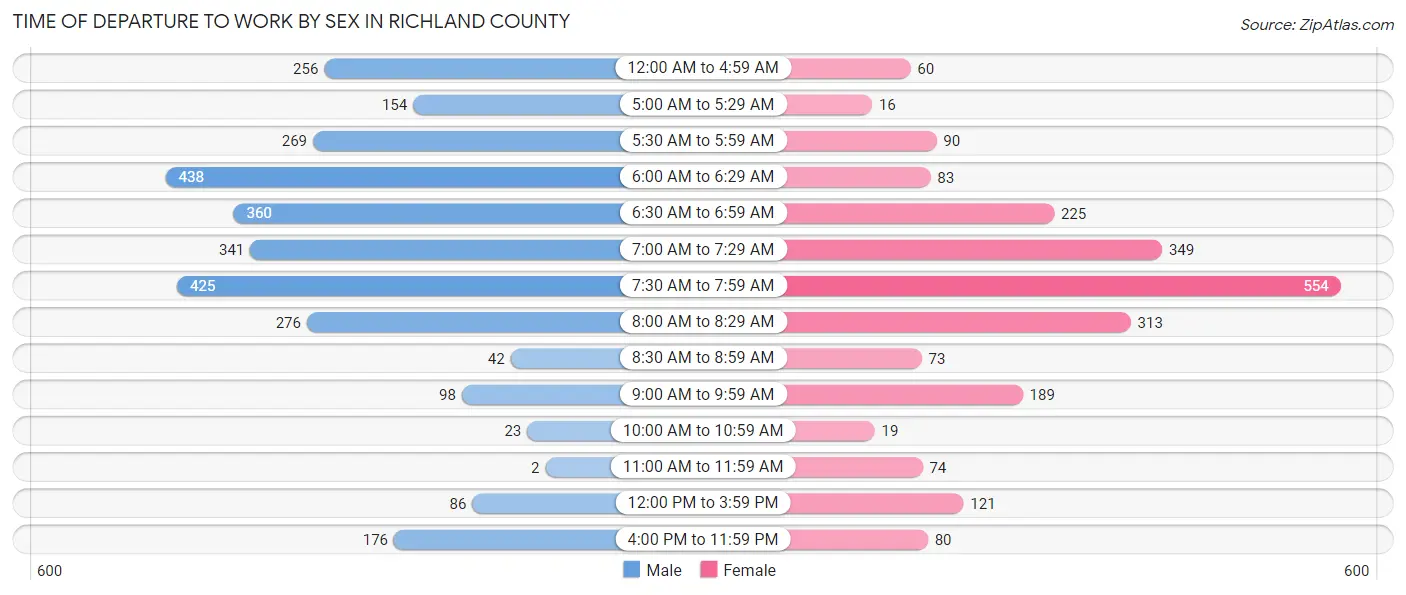
| Time of Departure | Male | Female |
| 12:00 AM to 4:59 AM | 256 (8.7%) | 60 (2.7%) |
| 5:00 AM to 5:29 AM | 154 (5.2%) | 16 (0.7%) |
| 5:30 AM to 5:59 AM | 269 (9.1%) | 90 (4.0%) |
| 6:00 AM to 6:29 AM | 438 (14.9%) | 83 (3.7%) |
| 6:30 AM to 6:59 AM | 360 (12.2%) | 225 (10.0%) |
| 7:00 AM to 7:29 AM | 341 (11.6%) | 349 (15.5%) |
| 7:30 AM to 7:59 AM | 425 (14.4%) | 554 (24.7%) |
| 8:00 AM to 8:29 AM | 276 (9.4%) | 313 (13.9%) |
| 8:30 AM to 8:59 AM | 42 (1.4%) | 73 (3.3%) |
| 9:00 AM to 9:59 AM | 98 (3.3%) | 189 (8.4%) |
| 10:00 AM to 10:59 AM | 23 (0.8%) | 19 (0.9%) |
| 11:00 AM to 11:59 AM | 2 (0.1%) | 74 (3.3%) |
| 12:00 PM to 3:59 PM | 86 (2.9%) | 121 (5.4%) |
| 4:00 PM to 11:59 PM | 176 (6.0%) | 80 (3.6%) |
| Total | 2,946 (100.0%) | 2,246 (100.0%) |
Housing Occupancy in Richland County
Occupancy by Ownership in Richland County
Of the total 4,529 dwellings in Richland County, owner-occupied units account for 3,132 (69.2%), while renter-occupied units make up 1,397 (30.8%).
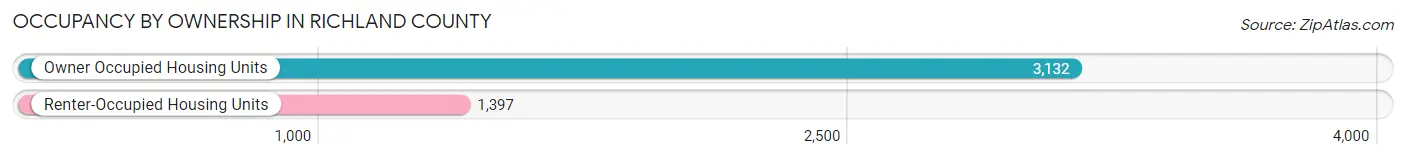
| Occupancy | # Housing Units | % Housing Units |
| Owner Occupied Housing Units | 3,132 | 69.2% |
| Renter-Occupied Housing Units | 1,397 | 30.8% |
| Total Occupied Housing Units | 4,529 | 100.0% |
Occupancy by Household Size in Richland County
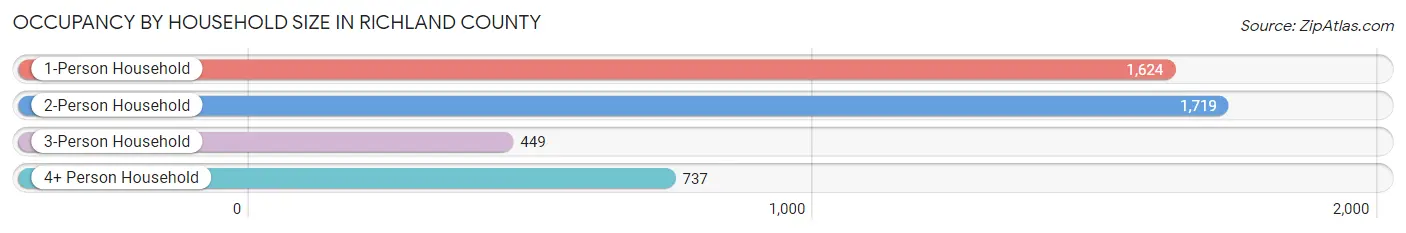
| Household Size | # Housing Units | % Housing Units |
| 1-Person Household | 1,624 | 35.9% |
| 2-Person Household | 1,719 | 38.0% |
| 3-Person Household | 449 | 9.9% |
| 4+ Person Household | 737 | 16.3% |
| Total Housing Units | 4,529 | 100.0% |
Occupancy by Ownership by Household Size in Richland County
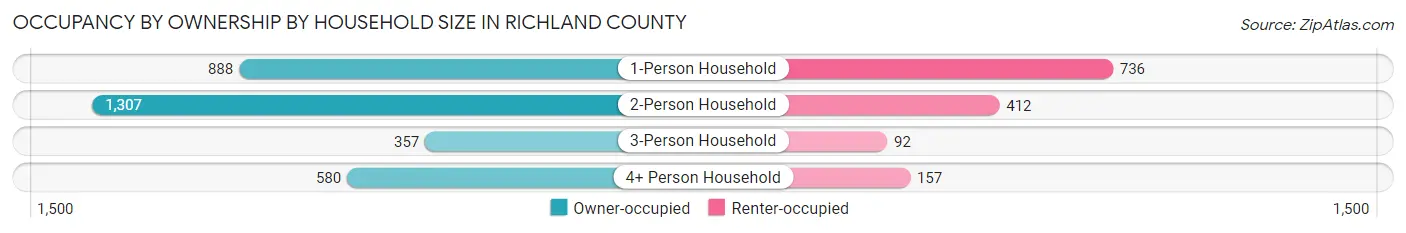
| Household Size | Owner-occupied | Renter-occupied |
| 1-Person Household | 888 (54.7%) | 736 (45.3%) |
| 2-Person Household | 1,307 (76.0%) | 412 (24.0%) |
| 3-Person Household | 357 (79.5%) | 92 (20.5%) |
| 4+ Person Household | 580 (78.7%) | 157 (21.3%) |
| Total Housing Units | 3,132 (69.2%) | 1,397 (30.8%) |
Occupancy by Educational Attainment in Richland County
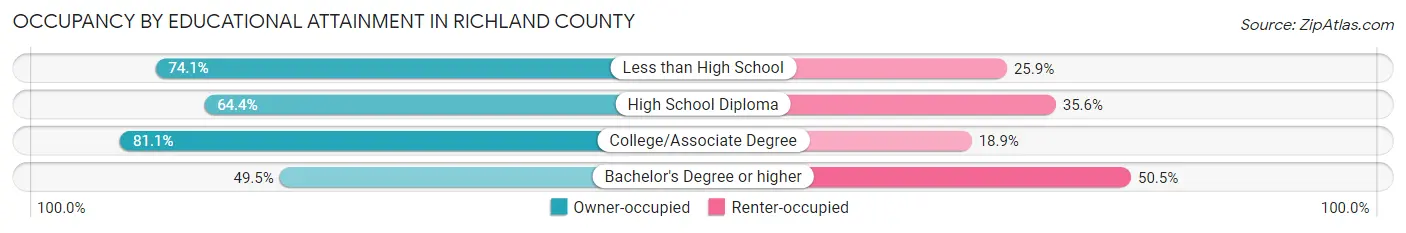
| Household Size | Owner-occupied | Renter-occupied |
| Less than High School | 157 (74.1%) | 55 (25.9%) |
| High School Diploma | 1,126 (64.4%) | 623 (35.6%) |
| College/Associate Degree | 1,485 (81.1%) | 347 (18.9%) |
| Bachelor's Degree or higher | 364 (49.5%) | 372 (50.5%) |
Occupancy by Age of Householder in Richland County
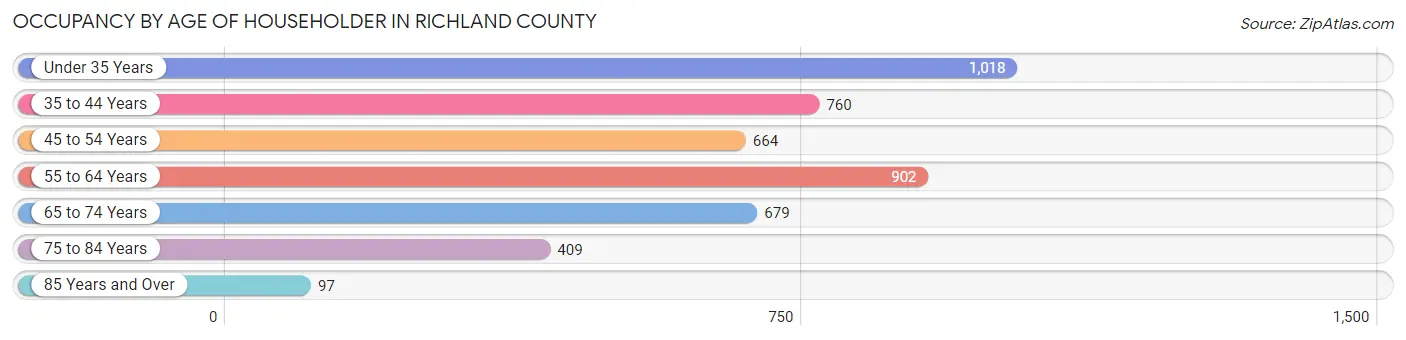
| Age Bracket | # Households | % Households |
| Under 35 Years | 1,018 | 22.5% |
| 35 to 44 Years | 760 | 16.8% |
| 45 to 54 Years | 664 | 14.7% |
| 55 to 64 Years | 902 | 19.9% |
| 65 to 74 Years | 679 | 15.0% |
| 75 to 84 Years | 409 | 9.0% |
| 85 Years and Over | 97 | 2.1% |
| Total | 4,529 | 100.0% |
Housing Finances in Richland County
Median Income by Occupancy in Richland County
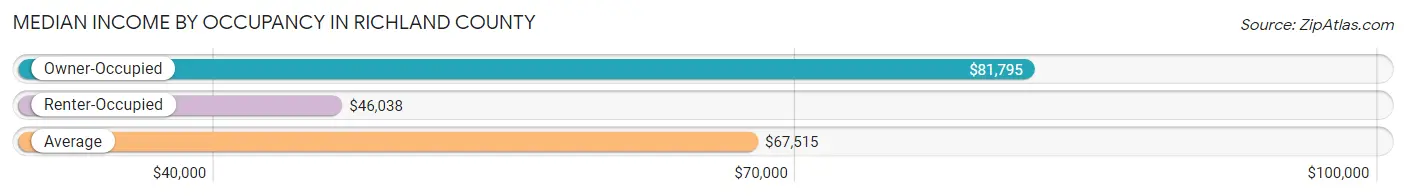
| Occupancy Type | # Households | Median Income |
| Owner-Occupied | 3,132 (69.2%) | $81,795 |
| Renter-Occupied | 1,397 (30.8%) | $46,038 |
| Average | 4,529 (100.0%) | $67,515 |
Occupancy by Householder Income Bracket in Richland County
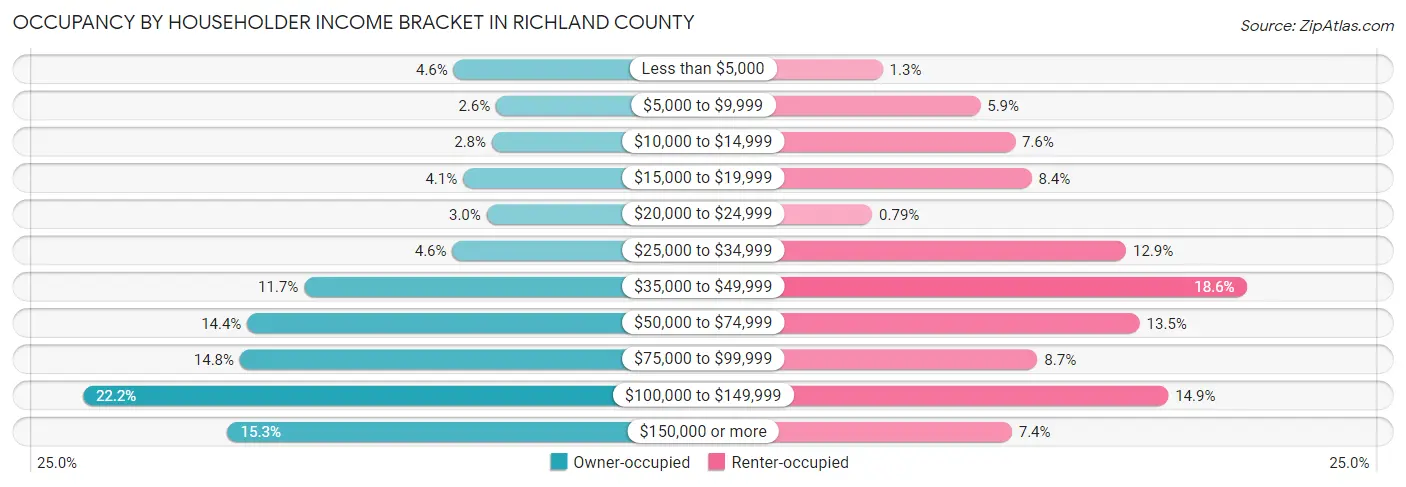
| Income Bracket | Owner-occupied | Renter-occupied |
| Less than $5,000 | 143 (4.6%) | 18 (1.3%) |
| $5,000 to $9,999 | 80 (2.5%) | 83 (5.9%) |
| $10,000 to $14,999 | 86 (2.8%) | 106 (7.6%) |
| $15,000 to $19,999 | 129 (4.1%) | 117 (8.4%) |
| $20,000 to $24,999 | 94 (3.0%) | 11 (0.8%) |
| $25,000 to $34,999 | 145 (4.6%) | 180 (12.9%) |
| $35,000 to $49,999 | 366 (11.7%) | 260 (18.6%) |
| $50,000 to $74,999 | 451 (14.4%) | 189 (13.5%) |
| $75,000 to $99,999 | 462 (14.7%) | 121 (8.7%) |
| $100,000 to $149,999 | 696 (22.2%) | 208 (14.9%) |
| $150,000 or more | 480 (15.3%) | 104 (7.4%) |
| Total | 3,132 (100.0%) | 1,397 (100.0%) |
Monthly Housing Cost Tiers in Richland County
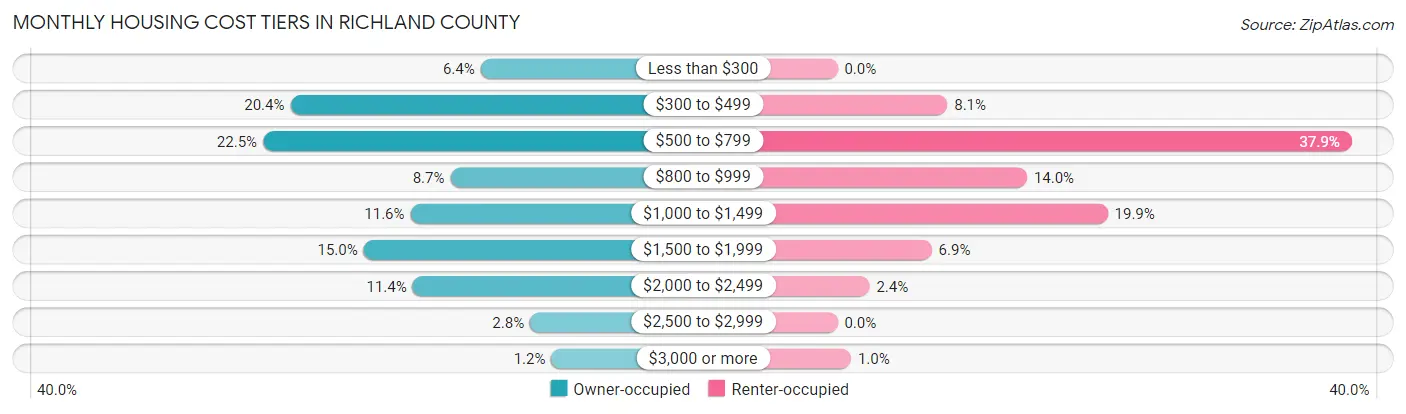
| Monthly Cost | Owner-occupied | Renter-occupied |
| Less than $300 | 201 (6.4%) | 0 (0.0%) |
| $300 to $499 | 640 (20.4%) | 113 (8.1%) |
| $500 to $799 | 703 (22.5%) | 529 (37.9%) |
| $800 to $999 | 271 (8.6%) | 195 (14.0%) |
| $1,000 to $1,499 | 363 (11.6%) | 278 (19.9%) |
| $1,500 to $1,999 | 471 (15.0%) | 97 (6.9%) |
| $2,000 to $2,499 | 358 (11.4%) | 33 (2.4%) |
| $2,500 to $2,999 | 87 (2.8%) | 0 (0.0%) |
| $3,000 or more | 38 (1.2%) | 14 (1.0%) |
| Total | 3,132 (100.0%) | 1,397 (100.0%) |
Physical Housing Characteristics in Richland County
Housing Structures in Richland County
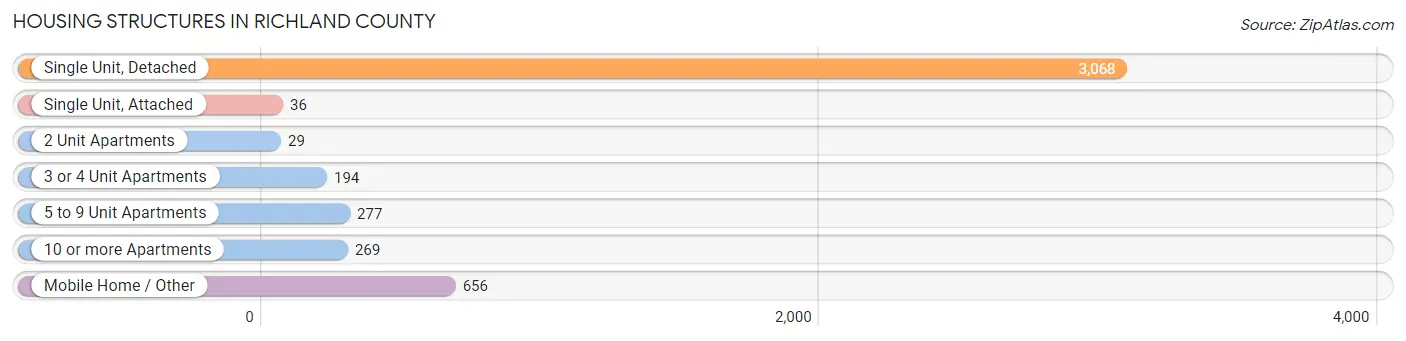
| Structure Type | # Housing Units | % Housing Units |
| Single Unit, Detached | 3,068 | 67.7% |
| Single Unit, Attached | 36 | 0.8% |
| 2 Unit Apartments | 29 | 0.6% |
| 3 or 4 Unit Apartments | 194 | 4.3% |
| 5 to 9 Unit Apartments | 277 | 6.1% |
| 10 or more Apartments | 269 | 5.9% |
| Mobile Home / Other | 656 | 14.5% |
| Total | 4,529 | 100.0% |
Housing Structures by Occupancy in Richland County
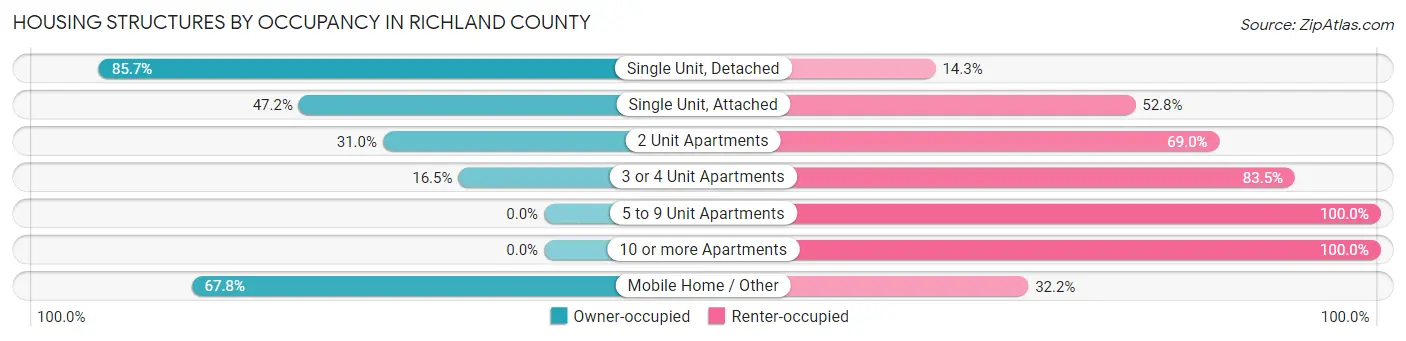
| Structure Type | Owner-occupied | Renter-occupied |
| Single Unit, Detached | 2,629 (85.7%) | 439 (14.3%) |
| Single Unit, Attached | 17 (47.2%) | 19 (52.8%) |
| 2 Unit Apartments | 9 (31.0%) | 20 (69.0%) |
| 3 or 4 Unit Apartments | 32 (16.5%) | 162 (83.5%) |
| 5 to 9 Unit Apartments | 0 (0.0%) | 277 (100.0%) |
| 10 or more Apartments | 0 (0.0%) | 269 (100.0%) |
| Mobile Home / Other | 445 (67.8%) | 211 (32.2%) |
| Total | 3,132 (69.2%) | 1,397 (30.8%) |
Housing Structures by Number of Rooms in Richland County
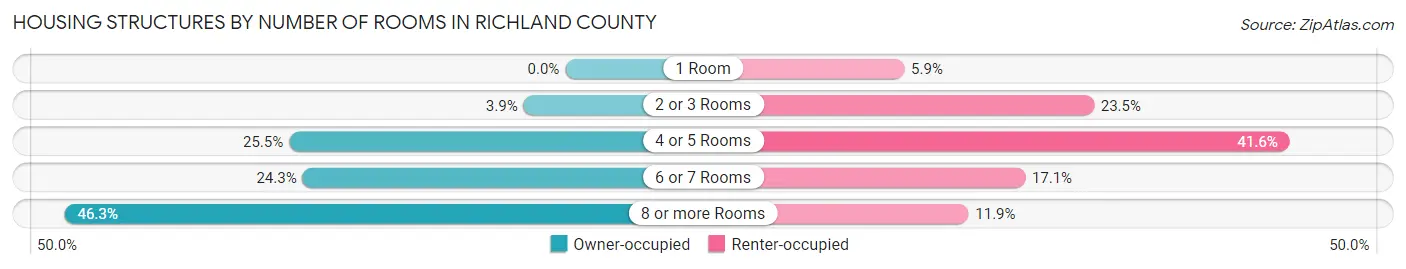
| Number of Rooms | Owner-occupied | Renter-occupied |
| 1 Room | 0 (0.0%) | 83 (5.9%) |
| 2 or 3 Rooms | 121 (3.9%) | 328 (23.5%) |
| 4 or 5 Rooms | 800 (25.5%) | 581 (41.6%) |
| 6 or 7 Rooms | 761 (24.3%) | 239 (17.1%) |
| 8 or more Rooms | 1,450 (46.3%) | 166 (11.9%) |
| Total | 3,132 (100.0%) | 1,397 (100.0%) |
Housing Structure by Heating Type in Richland County
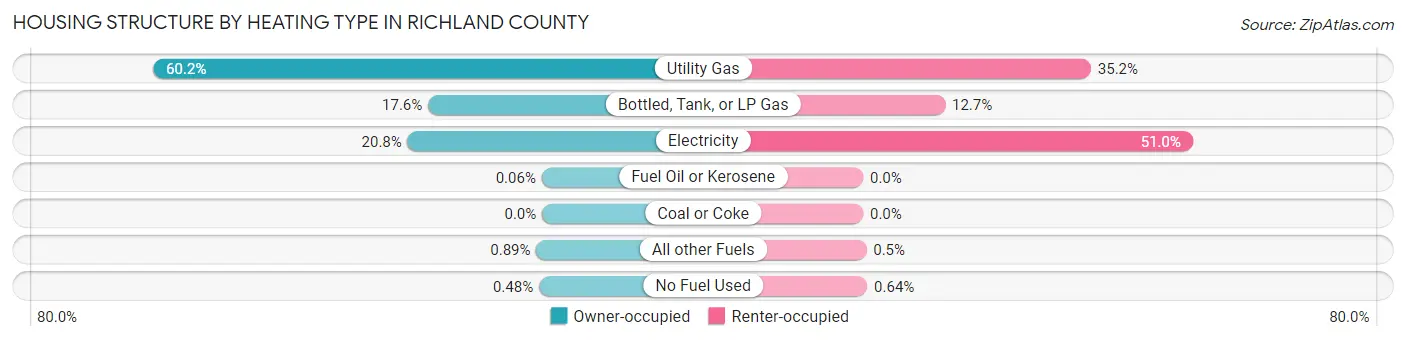
| Heating Type | Owner-occupied | Renter-occupied |
| Utility Gas | 1,884 (60.2%) | 492 (35.2%) |
| Bottled, Tank, or LP Gas | 552 (17.6%) | 177 (12.7%) |
| Electricity | 651 (20.8%) | 712 (51.0%) |
| Fuel Oil or Kerosene | 2 (0.1%) | 0 (0.0%) |
| Coal or Coke | 0 (0.0%) | 0 (0.0%) |
| All other Fuels | 28 (0.9%) | 7 (0.5%) |
| No Fuel Used | 15 (0.5%) | 9 (0.6%) |
| Total | 3,132 (100.0%) | 1,397 (100.0%) |
Household Vehicle Usage in Richland County
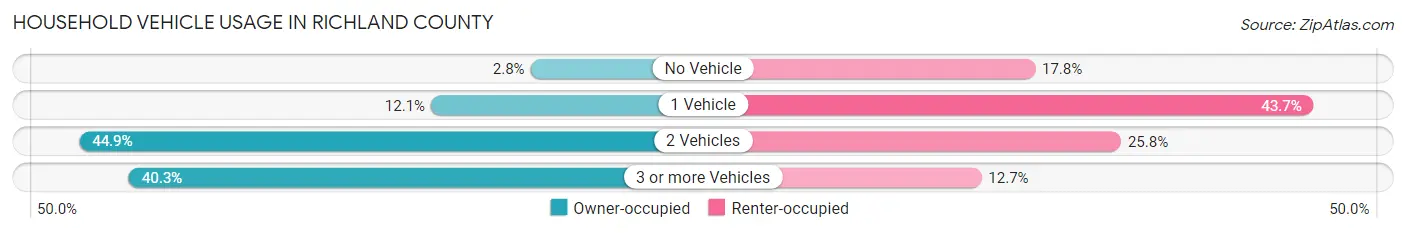
| Vehicles per Household | Owner-occupied | Renter-occupied |
| No Vehicle | 87 (2.8%) | 248 (17.7%) |
| 1 Vehicle | 378 (12.1%) | 611 (43.7%) |
| 2 Vehicles | 1,406 (44.9%) | 360 (25.8%) |
| 3 or more Vehicles | 1,261 (40.3%) | 178 (12.7%) |
| Total | 3,132 (100.0%) | 1,397 (100.0%) |
Real Estate & Mortgages in Richland County
Real Estate and Mortgage Overview in Richland County
| Characteristic | Without Mortgage | With Mortgage |
| Housing Units | 1,732 | 1,400 |
| Median Property Value | $229,500 | $263,900 |
| Median Household Income | $52,056 | $294 |
| Monthly Housing Costs | $507 | $38 |
| Real Estate Taxes | $1,569 | $88 |
Property Value by Mortgage Status in Richland County
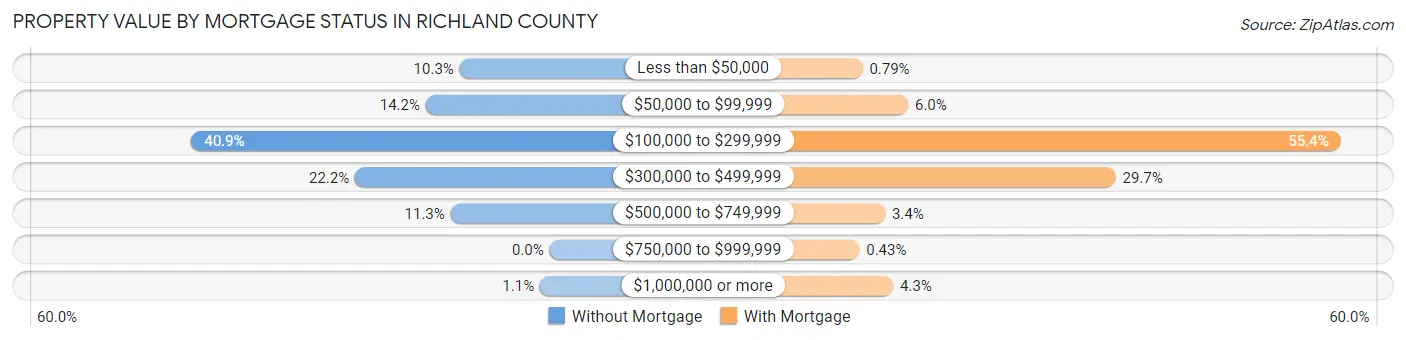
| Property Value | Without Mortgage | With Mortgage |
| Less than $50,000 | 178 (10.3%) | 11 (0.8%) |
| $50,000 to $99,999 | 245 (14.1%) | 84 (6.0%) |
| $100,000 to $299,999 | 709 (40.9%) | 776 (55.4%) |
| $300,000 to $499,999 | 385 (22.2%) | 416 (29.7%) |
| $500,000 to $749,999 | 196 (11.3%) | 47 (3.4%) |
| $750,000 to $999,999 | 0 (0.0%) | 6 (0.4%) |
| $1,000,000 or more | 19 (1.1%) | 60 (4.3%) |
| Total | 1,732 (100.0%) | 1,400 (100.0%) |
Household Income by Mortgage Status in Richland County
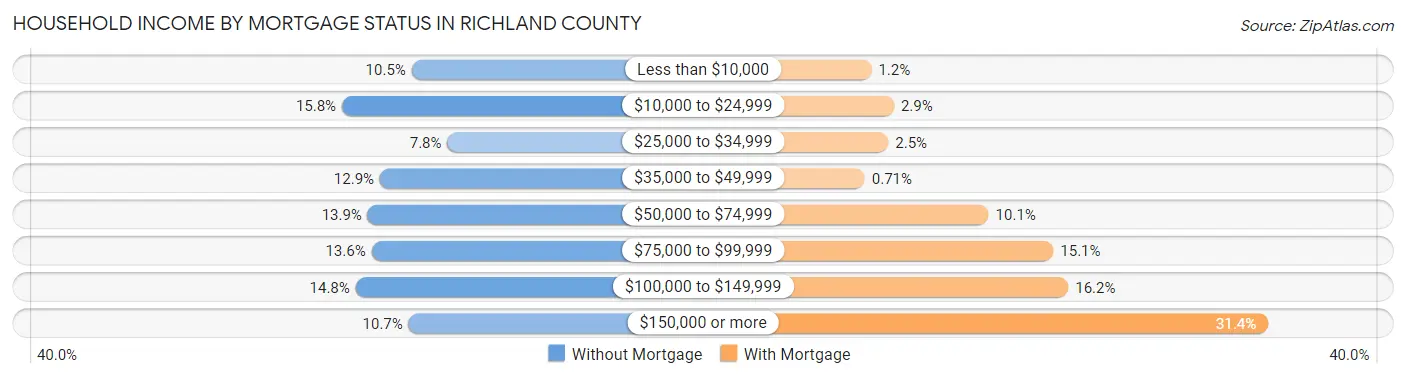
| Household Income | Without Mortgage | With Mortgage |
| Less than $10,000 | 182 (10.5%) | 17 (1.2%) |
| $10,000 to $24,999 | 274 (15.8%) | 41 (2.9%) |
| $25,000 to $34,999 | 135 (7.8%) | 35 (2.5%) |
| $35,000 to $49,999 | 224 (12.9%) | 10 (0.7%) |
| $50,000 to $74,999 | 240 (13.9%) | 142 (10.1%) |
| $75,000 to $99,999 | 235 (13.6%) | 211 (15.1%) |
| $100,000 to $149,999 | 256 (14.8%) | 227 (16.2%) |
| $150,000 or more | 186 (10.7%) | 440 (31.4%) |
| Total | 1,732 (100.0%) | 1,400 (100.0%) |
Property Value to Household Income Ratio in Richland County
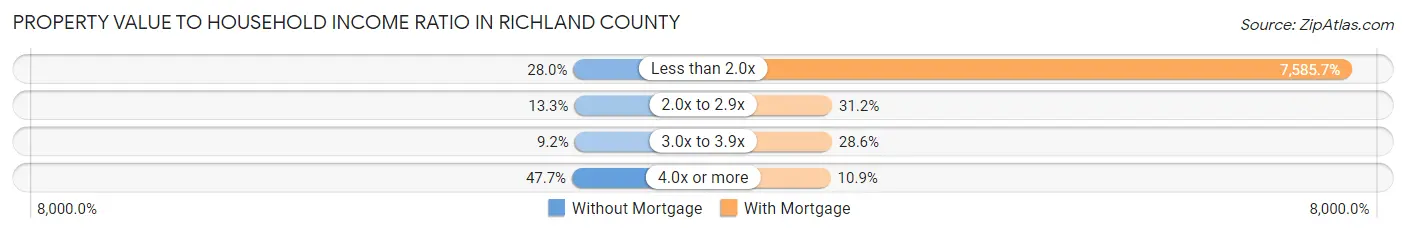
| Value-to-Income Ratio | Without Mortgage | With Mortgage |
| Less than 2.0x | 485 (28.0%) | 106,200 (7,585.7%) |
| 2.0x to 2.9x | 230 (13.3%) | 437 (31.2%) |
| 3.0x to 3.9x | 160 (9.2%) | 400 (28.6%) |
| 4.0x or more | 826 (47.7%) | 152 (10.9%) |
| Total | 1,732 (100.0%) | 1,400 (100.0%) |
Real Estate Taxes by Mortgage Status in Richland County
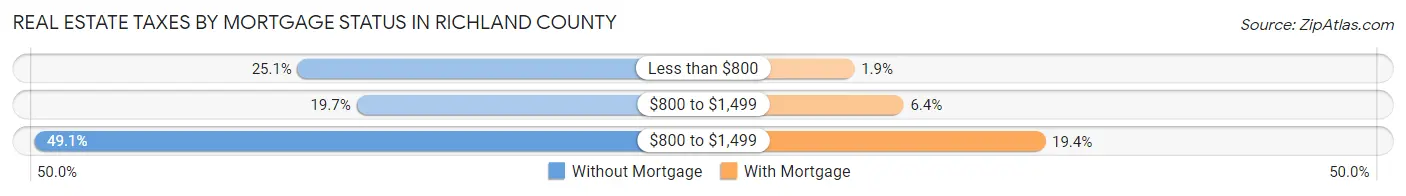
| Property Taxes | Without Mortgage | With Mortgage |
| Less than $800 | 434 (25.1%) | 27 (1.9%) |
| $800 to $1,499 | 341 (19.7%) | 90 (6.4%) |
| $800 to $1,499 | 851 (49.1%) | 271 (19.4%) |
| Total | 1,732 (100.0%) | 1,400 (100.0%) |
Health & Disability in Richland County
Health Insurance Coverage by Age in Richland County
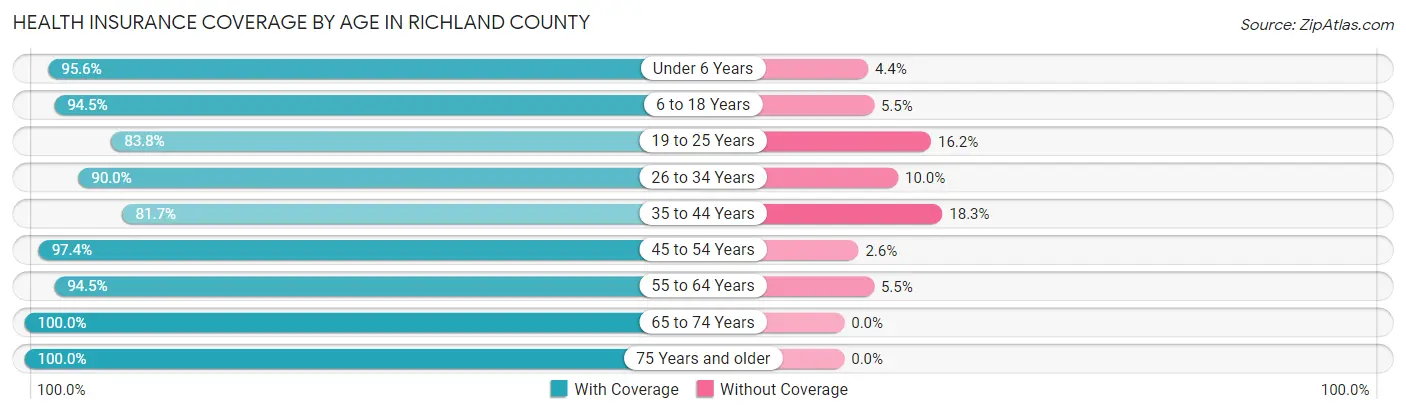
| Age Bracket | With Coverage | Without Coverage |
| Under 6 Years | 866 (95.6%) | 40 (4.4%) |
| 6 to 18 Years | 1,980 (94.5%) | 116 (5.5%) |
| 19 to 25 Years | 741 (83.8%) | 143 (16.2%) |
| 26 to 34 Years | 1,283 (90.0%) | 143 (10.0%) |
| 35 to 44 Years | 1,139 (81.7%) | 255 (18.3%) |
| 45 to 54 Years | 1,219 (97.4%) | 33 (2.6%) |
| 55 to 64 Years | 1,400 (94.5%) | 82 (5.5%) |
| 65 to 74 Years | 1,223 (100.0%) | 0 (0.0%) |
| 75 Years and older | 694 (100.0%) | 0 (0.0%) |
| Total | 10,545 (92.8%) | 812 (7.1%) |
Health Insurance Coverage by Citizenship Status in Richland County
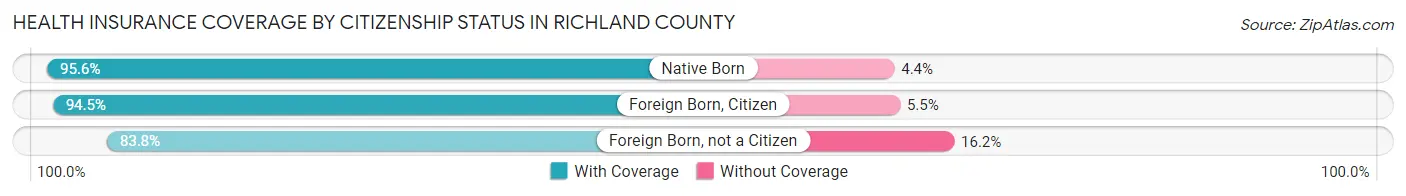
| Citizenship Status | With Coverage | Without Coverage |
| Native Born | 866 (95.6%) | 40 (4.4%) |
| Foreign Born, Citizen | 1,980 (94.5%) | 116 (5.5%) |
| Foreign Born, not a Citizen | 741 (83.8%) | 143 (16.2%) |
Health Insurance Coverage by Household Income in Richland County
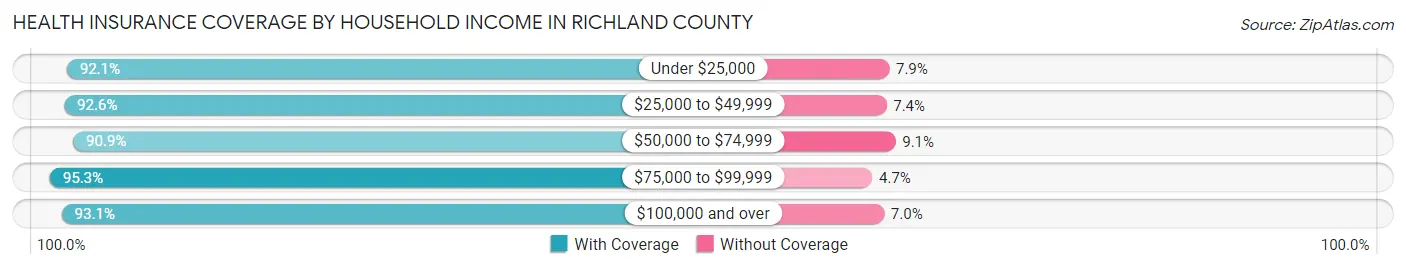
| Household Income | With Coverage | Without Coverage |
| Under $25,000 | 1,024 (92.1%) | 88 (7.9%) |
| $25,000 to $49,999 | 1,640 (92.6%) | 131 (7.4%) |
| $50,000 to $74,999 | 1,702 (90.9%) | 170 (9.1%) |
| $75,000 to $99,999 | 1,689 (95.3%) | 84 (4.7%) |
| $100,000 and over | 4,458 (93.0%) | 333 (7.0%) |
Public vs Private Health Insurance Coverage by Age in Richland County
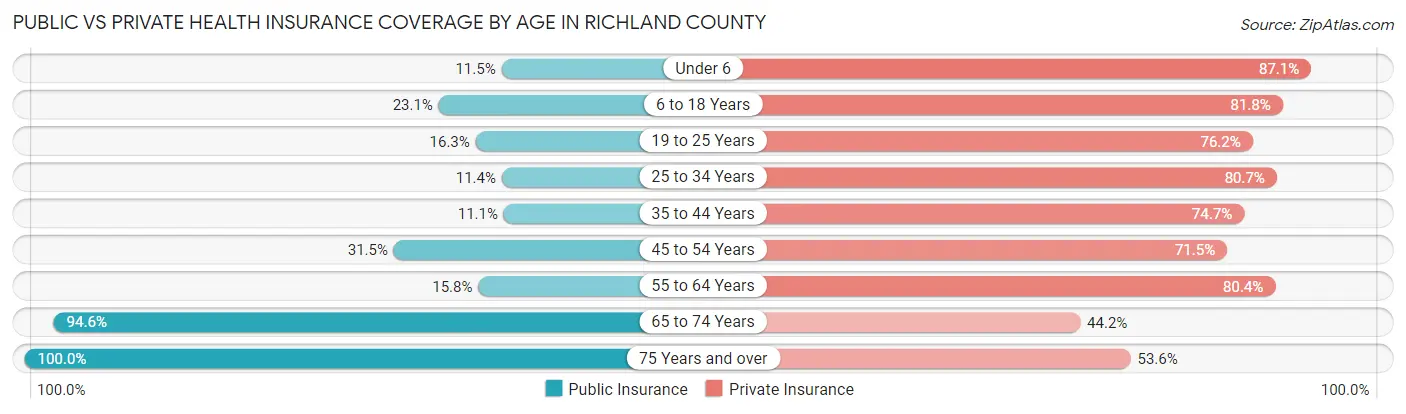
| Age Bracket | Public Insurance | Private Insurance |
| Under 6 | 104 (11.5%) | 789 (87.1%) |
| 6 to 18 Years | 485 (23.1%) | 1,715 (81.8%) |
| 19 to 25 Years | 144 (16.3%) | 674 (76.2%) |
| 25 to 34 Years | 163 (11.4%) | 1,151 (80.7%) |
| 35 to 44 Years | 154 (11.1%) | 1,041 (74.7%) |
| 45 to 54 Years | 394 (31.5%) | 895 (71.5%) |
| 55 to 64 Years | 234 (15.8%) | 1,192 (80.4%) |
| 65 to 74 Years | 1,157 (94.6%) | 541 (44.2%) |
| 75 Years and over | 694 (100.0%) | 372 (53.6%) |
| Total | 3,529 (31.1%) | 8,370 (73.7%) |
Disability Status by Sex by Age in Richland County
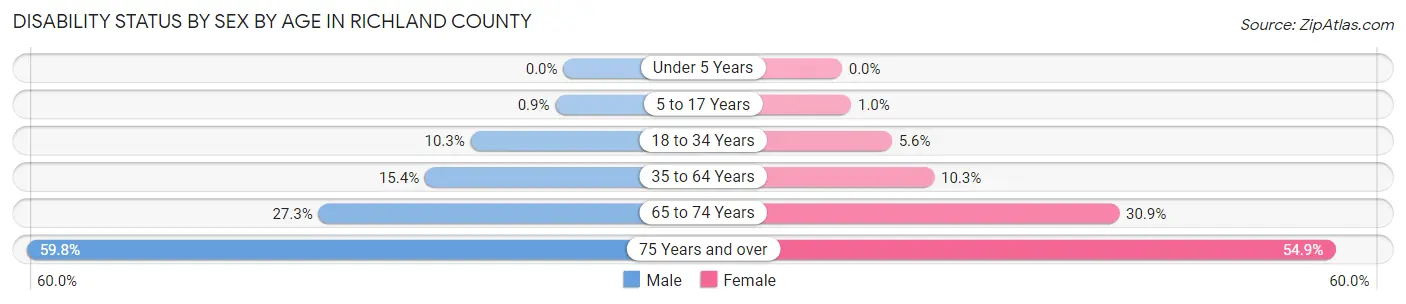
| Age Bracket | Male | Female |
| Under 5 Years | 0 (0.0%) | 0 (0.0%) |
| 5 to 17 Years | 10 (0.9%) | 11 (1.0%) |
| 18 to 34 Years | 122 (10.3%) | 69 (5.6%) |
| 35 to 64 Years | 330 (15.4%) | 204 (10.3%) |
| 65 to 74 Years | 156 (27.3%) | 201 (30.9%) |
| 75 Years and over | 196 (59.8%) | 201 (54.9%) |
Disability Class by Sex by Age in Richland County
Disability Class: Hearing Difficulty
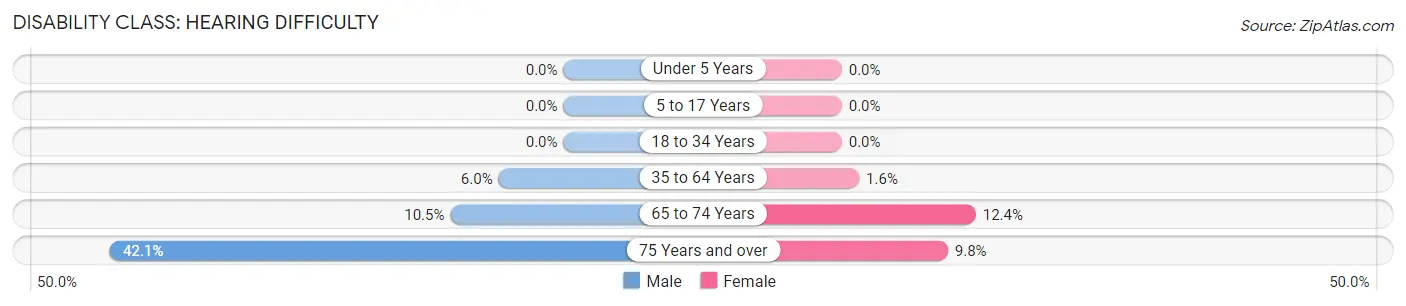
| Age Bracket | Male | Female |
| Under 5 Years | 0 (0.0%) | 0 (0.0%) |
| 5 to 17 Years | 0 (0.0%) | 0 (0.0%) |
| 18 to 34 Years | 0 (0.0%) | 0 (0.0%) |
| 35 to 64 Years | 129 (6.0%) | 32 (1.6%) |
| 65 to 74 Years | 60 (10.5%) | 81 (12.4%) |
| 75 Years and over | 138 (42.1%) | 36 (9.8%) |
Disability Class: Vision Difficulty
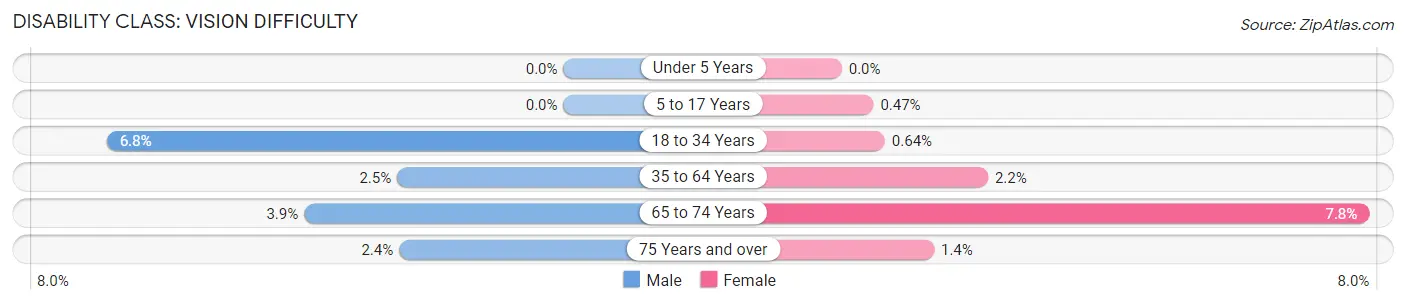
| Age Bracket | Male | Female |
| Under 5 Years | 0 (0.0%) | 0 (0.0%) |
| 5 to 17 Years | 0 (0.0%) | 5 (0.5%) |
| 18 to 34 Years | 80 (6.8%) | 8 (0.6%) |
| 35 to 64 Years | 53 (2.5%) | 43 (2.2%) |
| 65 to 74 Years | 22 (3.8%) | 51 (7.8%) |
| 75 Years and over | 8 (2.4%) | 5 (1.4%) |
Disability Class: Cognitive Difficulty
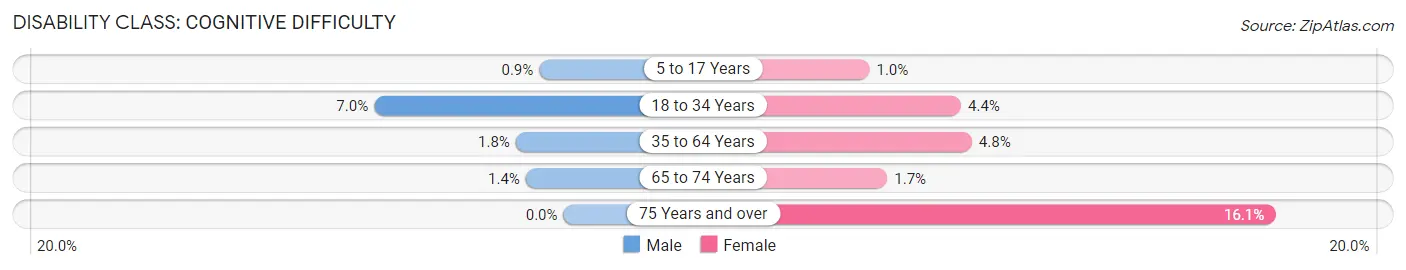
| Age Bracket | Male | Female |
| 5 to 17 Years | 10 (0.9%) | 11 (1.0%) |
| 18 to 34 Years | 83 (7.0%) | 55 (4.4%) |
| 35 to 64 Years | 38 (1.8%) | 96 (4.8%) |
| 65 to 74 Years | 8 (1.4%) | 11 (1.7%) |
| 75 Years and over | 0 (0.0%) | 59 (16.1%) |
Disability Class: Ambulatory Difficulty
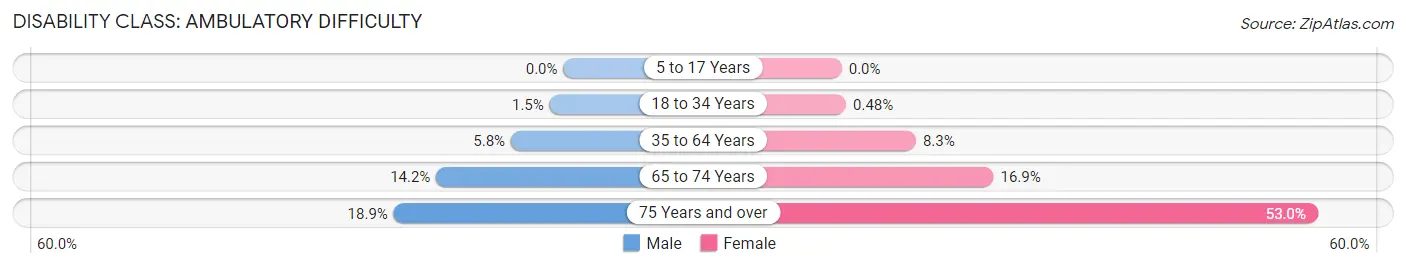
| Age Bracket | Male | Female |
| 5 to 17 Years | 0 (0.0%) | 0 (0.0%) |
| 18 to 34 Years | 18 (1.5%) | 6 (0.5%) |
| 35 to 64 Years | 125 (5.8%) | 164 (8.3%) |
| 65 to 74 Years | 81 (14.2%) | 110 (16.9%) |
| 75 Years and over | 62 (18.9%) | 194 (53.0%) |
Disability Class: Self-Care Difficulty
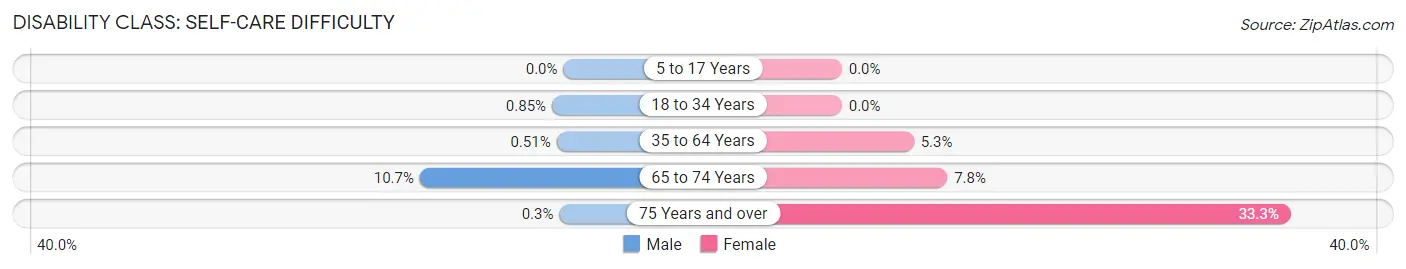
| Age Bracket | Male | Female |
| 5 to 17 Years | 0 (0.0%) | 0 (0.0%) |
| 18 to 34 Years | 10 (0.9%) | 0 (0.0%) |
| 35 to 64 Years | 11 (0.5%) | 106 (5.3%) |
| 65 to 74 Years | 61 (10.7%) | 51 (7.8%) |
| 75 Years and over | 1 (0.3%) | 122 (33.3%) |
Technology Access in Richland County
Computing Device Access in Richland County
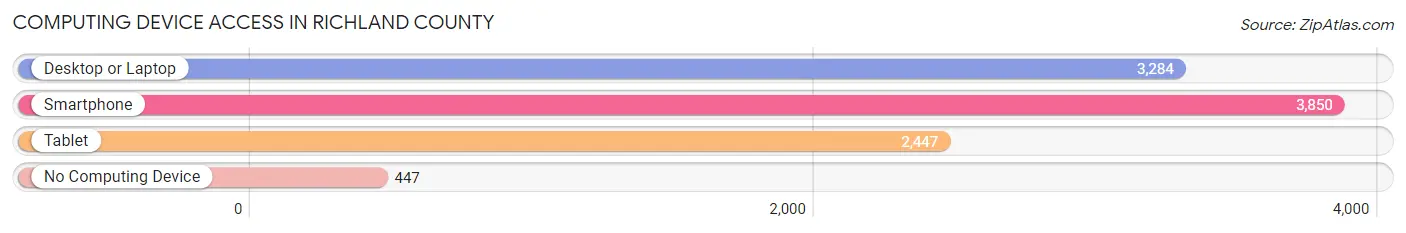
| Device Type | # Households | % Households |
| Desktop or Laptop | 3,284 | 72.5% |
| Smartphone | 3,850 | 85.0% |
| Tablet | 2,447 | 54.0% |
| No Computing Device | 447 | 9.9% |
| Total | 4,529 | 100.0% |
Internet Access in Richland County
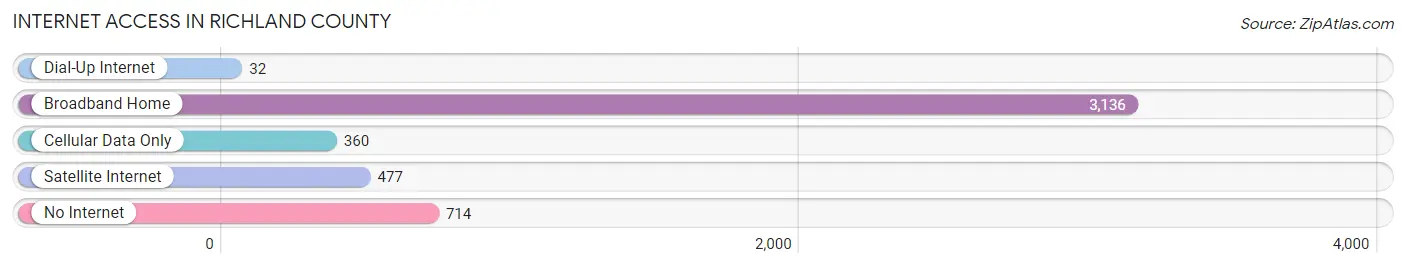
| Internet Type | # Households | % Households |
| Dial-Up Internet | 32 | 0.7% |
| Broadband Home | 3,136 | 69.2% |
| Cellular Data Only | 360 | 8.0% |
| Satellite Internet | 477 | 10.5% |
| No Internet | 714 | 15.8% |
| Total | 4,529 | 100.0% |
Richland County Summary
Richland County, Montana is located in the northeastern corner of the state and is bordered by Roosevelt County to the north, Dawson County to the east, Wibaux County to the south, and Fallon County to the west. The county seat is Sidney, and the largest city is Fairview. Richland County is part of the Great Plains region of Montana and is home to a variety of landscapes, including rolling hills, prairies, and badlands.
History
Richland County was established in 1914 and was named after the Richland Creek, which flows through the county. The area was originally inhabited by the Assiniboine and Sioux Native American tribes, who were later displaced by settlers in the late 19th century. The first settlers in the area were ranchers and farmers, who were attracted to the area by the abundance of natural resources.
The county was officially organized in 1914, and the first county seat was located in Fairview. In 1915, the county seat was moved to Sidney, where it remains today. The county has experienced steady population growth since its establishment, with the population increasing from 4,845 in 1920 to 10,845 in 2020.
Geography
Richland County is located in the northeastern corner of Montana and is bordered by Roosevelt County to the north, Dawson County to the east, Wibaux County to the south, and Fallon County to the west. The county covers an area of 1,845 square miles and is part of the Great Plains region of Montana.
The county is home to a variety of landscapes, including rolling hills, prairies, and badlands. The county is also home to several rivers and streams, including the Yellowstone River, the Missouri River, and the Milk River. The county is also home to several lakes, including Lake Sakakawea, Lake Audubon, and Lake Oahe.
Economy
Richland County’s economy is largely based on agriculture and energy production. The county is home to several large farms and ranches, which produce a variety of crops, including wheat, barley, corn, and hay. The county is also home to several oil and gas fields, which produce a significant amount of oil and natural gas.
In addition to agriculture and energy production, Richland County is also home to several manufacturing and service industries. The county is home to several manufacturing plants, which produce a variety of products, including furniture, clothing, and electronics. The county is also home to several service industries, including healthcare, education, and tourism.
Demographics
As of the 2020 census, Richland County had a population of 10,845. The population is spread out across the county, with the largest population centers being Sidney (3,845) and Fairview (2,845). The county is predominantly white (94.2%), with the remaining population being made up of Native American (2.2%), African American (1.2%), Asian (0.7%), and other (1.7%).
The median household income in Richland County is $50,845, and the median home value is $150,000. The county has a poverty rate of 11.2%, and the unemployment rate is 3.7%. The county is served by several public school districts, including Sidney Public Schools, Fairview Public Schools, and Savage Public Schools.
Common Questions
What is Per Capita Income in Richland County?
Per Capita income in Richland County is $34,169.
What is the Median Family Income in Richland County?
Median Family Income in Richland County is $85,947.
What is the Median Household income in Richland County?
Median Household Income in Richland County is $67,515.
What is Income or Wage Gap in Richland County?
Income or Wage Gap in Richland County is 37.2%.
Women in Richland County earn 62.8 cents for every dollar earned by a man.
What is Family Income Deficit in Richland County?
Family Income Deficit in Richland County is $9,973.
Families that are below poverty line in Richland County earn $9,973 less on average than the poverty threshold level.
What is Inequality or Gini Index in Richland County?
Inequality or Gini Index in Richland County is 0.45.
What is the Total Population of Richland County?
Total Population of Richland County is 11,366.
What is the Total Male Population of Richland County?
Total Male Population of Richland County is 5,710.
What is the Total Female Population of Richland County?
Total Female Population of Richland County is 5,656.
What is the Ratio of Males per 100 Females in Richland County?
There are 100.95 Males per 100 Females in Richland County.
What is the Ratio of Females per 100 Males in Richland County?
There are 99.05 Females per 100 Males in Richland County.
What is the Median Population Age in Richland County?
Median Population Age in Richland County is 38.3 Years.
What is the Average Family Size in Richland County
Average Family Size in Richland County is 3.3 People.
What is the Average Household Size in Richland County
Average Household Size in Richland County is 2.5 People.
How Large is the Labor Force in Richland County?
There are 5,918 People in the Labor Forcein in Richland County.
What is the Percentage of People in the Labor Force in Richland County?
66.8% of People are in the Labor Force in Richland County.
What is the Unemployment Rate in Richland County?
Unemployment Rate in Richland County is 4.9%.