Carbon County, MT Map & Demographics
Carbon County Map
Carbon County Overview
$40,838
PER CAPITA INCOME
$85,625
AVG FAMILY INCOME
$66,780
AVG HOUSEHOLD INCOME
39.4%
WAGE / INCOME GAP [ % ]
60.6¢/ $1
WAGE / INCOME GAP [ $ ]
$7,326
FAMILY INCOME DEFICIT
0.46
INEQUALITY / GINI INDEX
10,645
TOTAL POPULATION
5,410
MALE POPULATION
5,235
FEMALE POPULATION
103.34
MALES / 100 FEMALES
96.77
FEMALES / 100 MALES
50.7
MEDIAN AGE
2.9
AVG FAMILY SIZE
2.3
AVG HOUSEHOLD SIZE
5,506
LABOR FORCE [ PEOPLE ]
61.1%
PERCENT IN LABOR FORCE
4.9%
UNEMPLOYMENT RATE
Carbon County Area Codes
Income in Carbon County
Income Overview in Carbon County
Per Capita Income in Carbon County is $40,838, while median incomes of families and households are $85,625 and $66,780 respectively.
| Characteristic | Number | Measure |
| Per Capita Income | 10,645 | $40,838 |
| Median Family Income | 2,850 | $85,625 |
| Mean Family Income | 2,850 | $110,601 |
| Median Household Income | 4,650 | $66,780 |
| Mean Household Income | 4,650 | $88,921 |
| Income Deficit | 2,850 | $7,326 |
| Wage / Income Gap (%) | 10,645 | 39.35% |
| Wage / Income Gap ($) | 10,645 | 60.65¢ per $1 |
| Gini / Inequality Index | 10,645 | 0.46 |
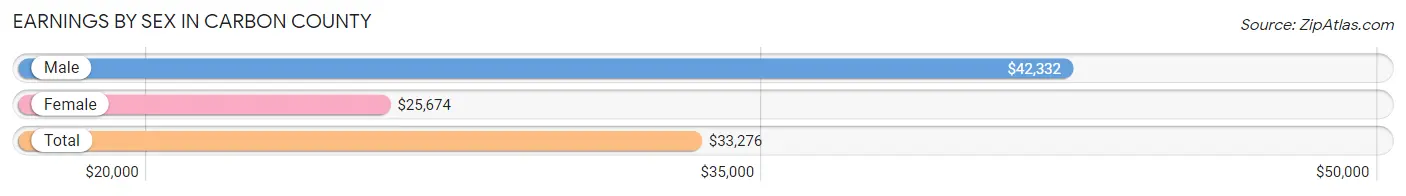
Earnings by Sex in Carbon County
Average Earnings in Carbon County are $33,276, $42,332 for men and $25,674 for women, a difference of 39.4%.
| Sex | Number | Average Earnings |
| Male | 3,242 (55.2%) | $42,332 |
| Female | 2,635 (44.8%) | $25,674 |
| Total | 5,877 (100.0%) | $33,276 |
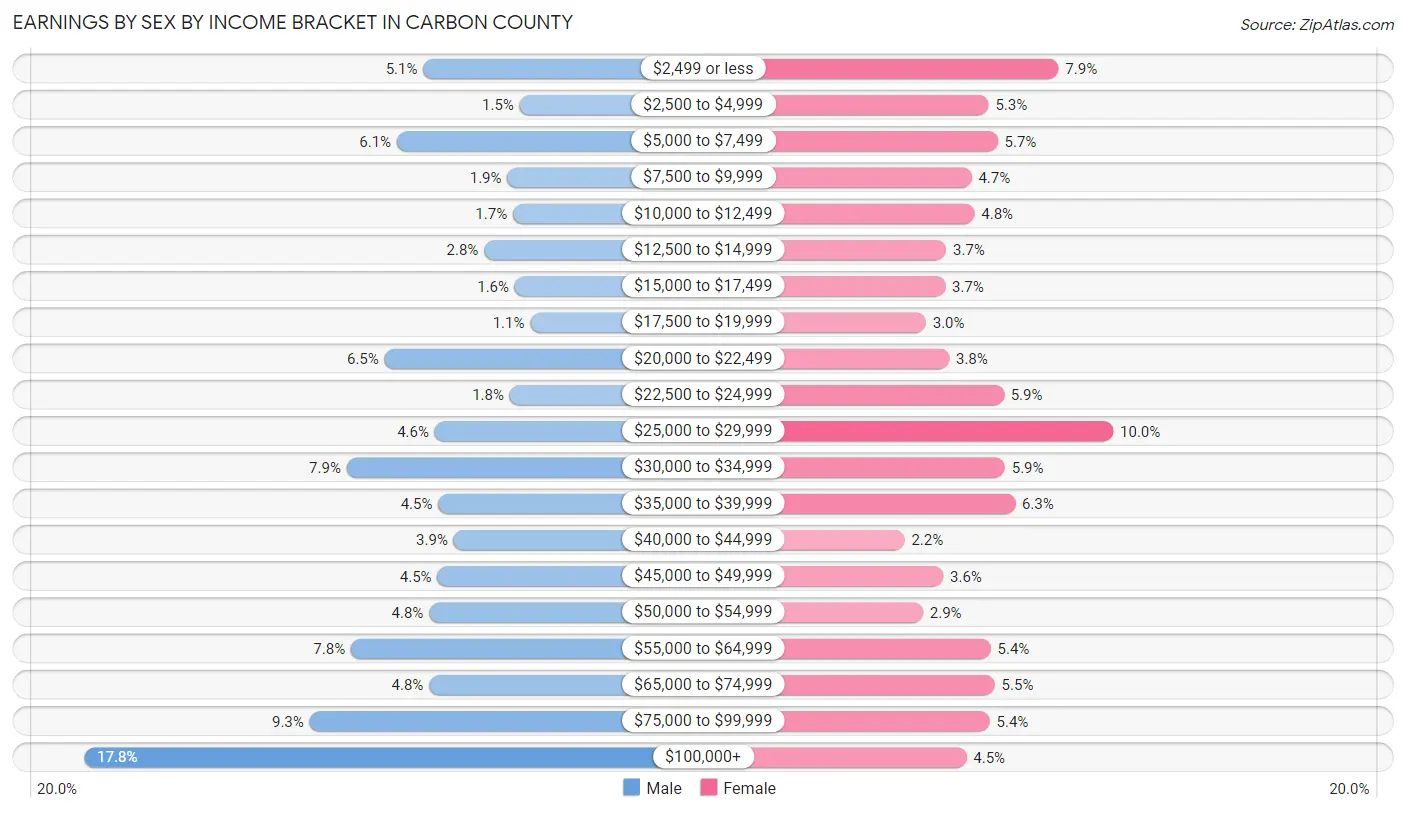
Earnings by Sex by Income Bracket in Carbon County
The most common earnings brackets in Carbon County are $100,000+ for men (576 | 17.8%) and $25,000 to $29,999 for women (263 | 10.0%).
| Income | Male | Female |
| $2,499 or less | 164 (5.1%) | 209 (7.9%) |
| $2,500 to $4,999 | 47 (1.5%) | 140 (5.3%) |
| $5,000 to $7,499 | 196 (6.0%) | 149 (5.7%) |
| $7,500 to $9,999 | 62 (1.9%) | 123 (4.7%) |
| $10,000 to $12,499 | 55 (1.7%) | 126 (4.8%) |
| $12,500 to $14,999 | 90 (2.8%) | 98 (3.7%) |
| $15,000 to $17,499 | 53 (1.6%) | 97 (3.7%) |
| $17,500 to $19,999 | 34 (1.1%) | 78 (3.0%) |
| $20,000 to $22,499 | 211 (6.5%) | 101 (3.8%) |
| $22,500 to $24,999 | 59 (1.8%) | 155 (5.9%) |
| $25,000 to $29,999 | 150 (4.6%) | 263 (10.0%) |
| $30,000 to $34,999 | 257 (7.9%) | 156 (5.9%) |
| $35,000 to $39,999 | 146 (4.5%) | 166 (6.3%) |
| $40,000 to $44,999 | 127 (3.9%) | 57 (2.2%) |
| $45,000 to $49,999 | 147 (4.5%) | 95 (3.6%) |
| $50,000 to $54,999 | 157 (4.8%) | 75 (2.9%) |
| $55,000 to $64,999 | 252 (7.8%) | 142 (5.4%) |
| $65,000 to $74,999 | 157 (4.8%) | 146 (5.5%) |
| $75,000 to $99,999 | 302 (9.3%) | 141 (5.3%) |
| $100,000+ | 576 (17.8%) | 118 (4.5%) |
| Total | 3,242 (100.0%) | 2,635 (100.0%) |
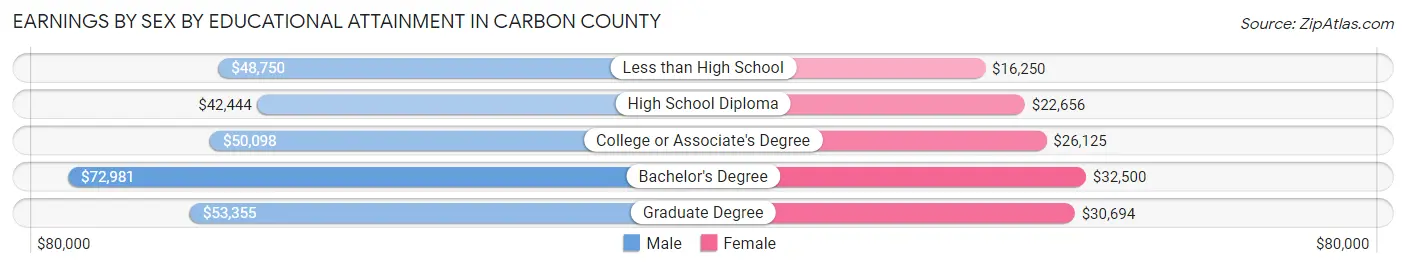
Earnings by Sex by Educational Attainment in Carbon County
Average earnings in Carbon County are $50,022 for men and $27,557 for women, a difference of 44.9%. Men with an educational attainment of bachelor's degree enjoy the highest average annual earnings of $72,981, while those with high school diploma education earn the least with $42,444. Women with an educational attainment of bachelor's degree earn the most with the average annual earnings of $32,500, while those with less than high school education have the smallest earnings of $16,250.
| Educational Attainment | Male Income | Female Income |
| Less than High School | $48,750 | $16,250 |
| High School Diploma | $42,444 | $22,656 |
| College or Associate's Degree | $50,098 | $26,125 |
| Bachelor's Degree | $72,981 | $32,500 |
| Graduate Degree | $53,355 | $30,694 |
| Total | $50,022 | $27,557 |
Family Income in Carbon County
Family Income Brackets in Carbon County
According to the Carbon County family income data, there are 559 families falling into the $75,000 to $99,999 income range, which is the most common income bracket and makes up 19.6% of all families. Conversely, the less than $10,000 income bracket is the least frequent group with only 51 families (1.8%) belonging to this category.
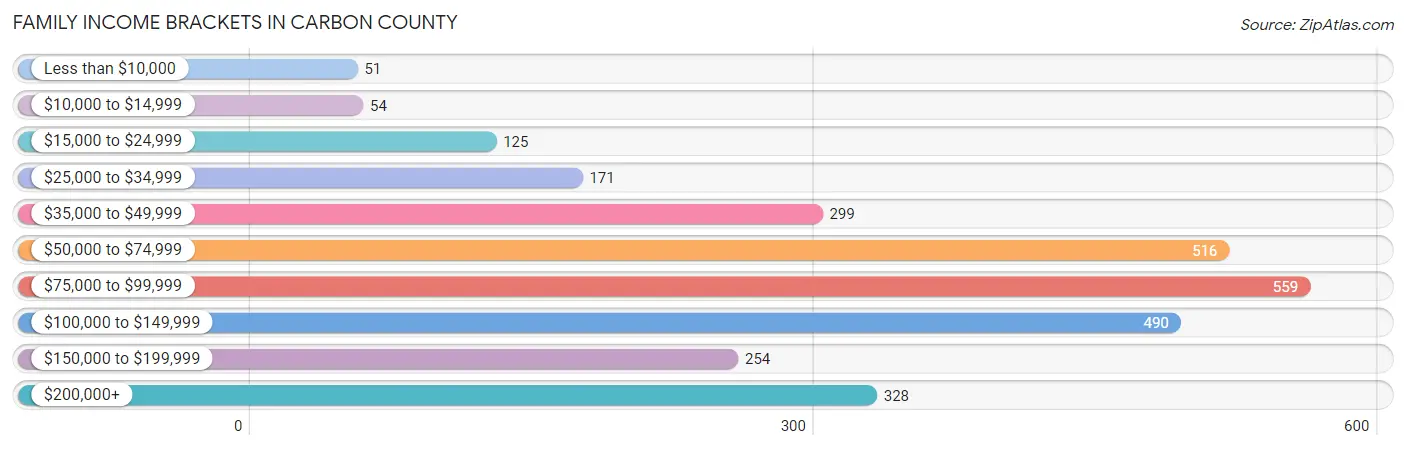
| Income Bracket | # Families | % Families |
| Less than $10,000 | 51 | 1.8% |
| $10,000 to $14,999 | 54 | 1.9% |
| $15,000 to $24,999 | 125 | 4.4% |
| $25,000 to $34,999 | 171 | 6.0% |
| $35,000 to $49,999 | 299 | 10.5% |
| $50,000 to $74,999 | 516 | 18.1% |
| $75,000 to $99,999 | 559 | 19.6% |
| $100,000 to $149,999 | 490 | 17.2% |
| $150,000 to $199,999 | 254 | 8.9% |
| $200,000+ | 328 | 11.5% |
Family Income by Famaliy Size in Carbon County
7+ person families (6 | 0.2%) account for the highest median family income in Carbon County with $203,750 per family, while 2-person families (1,786 | 62.7%) have the highest median income of $43,237 per family member.
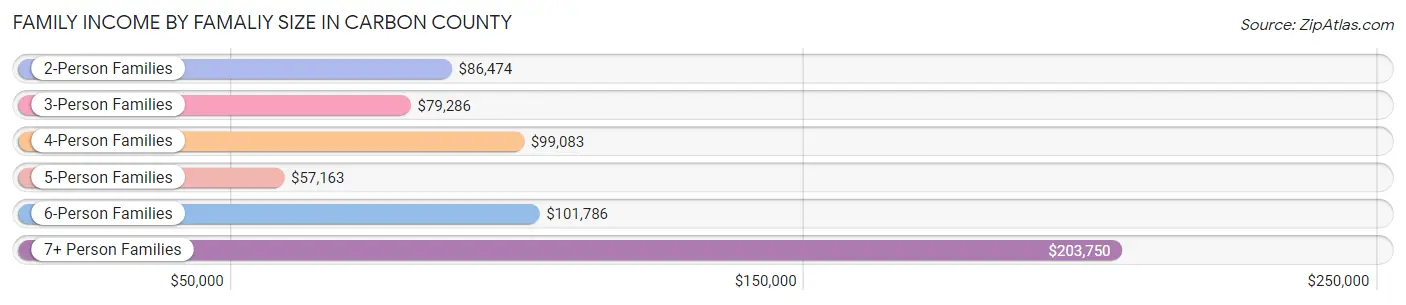
| Income Bracket | # Families | Median Income |
| 2-Person Families | 1,786 (62.7%) | $86,474 |
| 3-Person Families | 466 (16.4%) | $79,286 |
| 4-Person Families | 397 (13.9%) | $99,083 |
| 5-Person Families | 159 (5.6%) | $57,163 |
| 6-Person Families | 36 (1.3%) | $101,786 |
| 7+ Person Families | 6 (0.2%) | $203,750 |
| Total | 2,850 (100.0%) | $85,625 |
Family Income by Number of Earners in Carbon County
The median family income in Carbon County is $85,625, with families comprising 3+ earners (175) having the highest median family income of $143,173, while families with 1 earner (766) have the lowest median family income of $64,417, accounting for 6.1% and 26.9% of families, respectively.
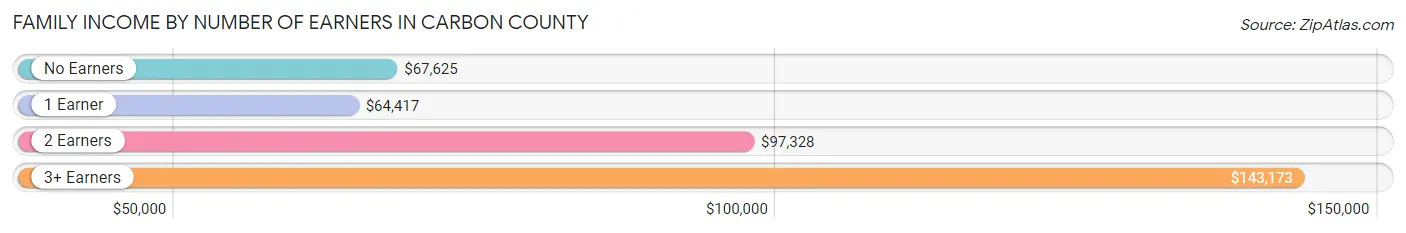
| Number of Earners | # Families | Median Income |
| No Earners | 682 (23.9%) | $67,625 |
| 1 Earner | 766 (26.9%) | $64,417 |
| 2 Earners | 1,227 (43.0%) | $97,328 |
| 3+ Earners | 175 (6.1%) | $143,173 |
| Total | 2,850 (100.0%) | $85,625 |
Household Income in Carbon County
Household Income Brackets in Carbon County
With 786 households falling in the category, the $75,000 to $99,999 income range is the most frequent in Carbon County, accounting for 16.9% of all households. In contrast, only 121 households (2.6%) fall into the less than $10,000 income bracket, making it the least populous group.
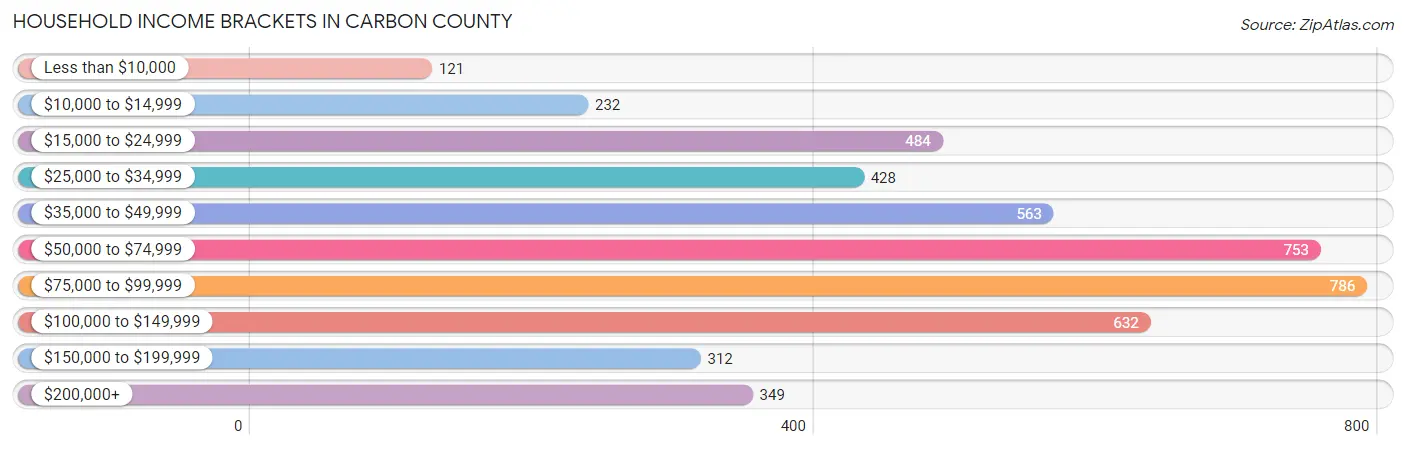
| Income Bracket | # Households | % Households |
| Less than $10,000 | 121 | 2.6% |
| $10,000 to $14,999 | 232 | 5.0% |
| $15,000 to $24,999 | 484 | 10.4% |
| $25,000 to $34,999 | 428 | 9.2% |
| $35,000 to $49,999 | 563 | 12.1% |
| $50,000 to $74,999 | 753 | 16.2% |
| $75,000 to $99,999 | 786 | 16.9% |
| $100,000 to $149,999 | 632 | 13.6% |
| $150,000 to $199,999 | 312 | 6.7% |
| $200,000+ | 349 | 7.5% |
Household Income by Householder Age in Carbon County
The median household income in Carbon County is $66,780, with the highest median household income of $71,705 found in the 45 to 64 years age bracket for the primary householder. A total of 1,767 households (38.0%) fall into this category. Meanwhile, the 15 to 24 years age bracket for the primary householder has the lowest median household income of $22,230, with 72 households (1.5%) in this group.
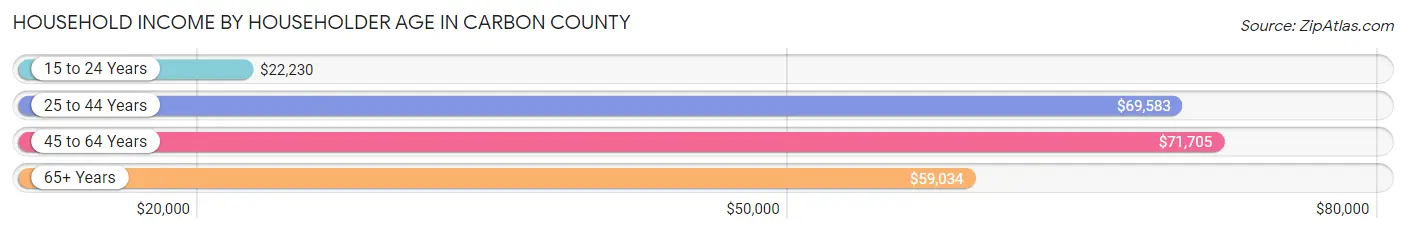
| Income Bracket | # Households | Median Income |
| 15 to 24 Years | 72 (1.5%) | $22,230 |
| 25 to 44 Years | 1,132 (24.3%) | $69,583 |
| 45 to 64 Years | 1,767 (38.0%) | $71,705 |
| 65+ Years | 1,679 (36.1%) | $59,034 |
| Total | 4,650 (100.0%) | $66,780 |
Poverty in Carbon County
Income Below Poverty by Sex and Age in Carbon County
With 9.5% poverty level for males and 11.0% for females among the residents of Carbon County, under 5 year old males and under 5 year old females are the most vulnerable to poverty, with 63 males (35.6%) and 43 females (21.9%) in their respective age groups living below the poverty level.
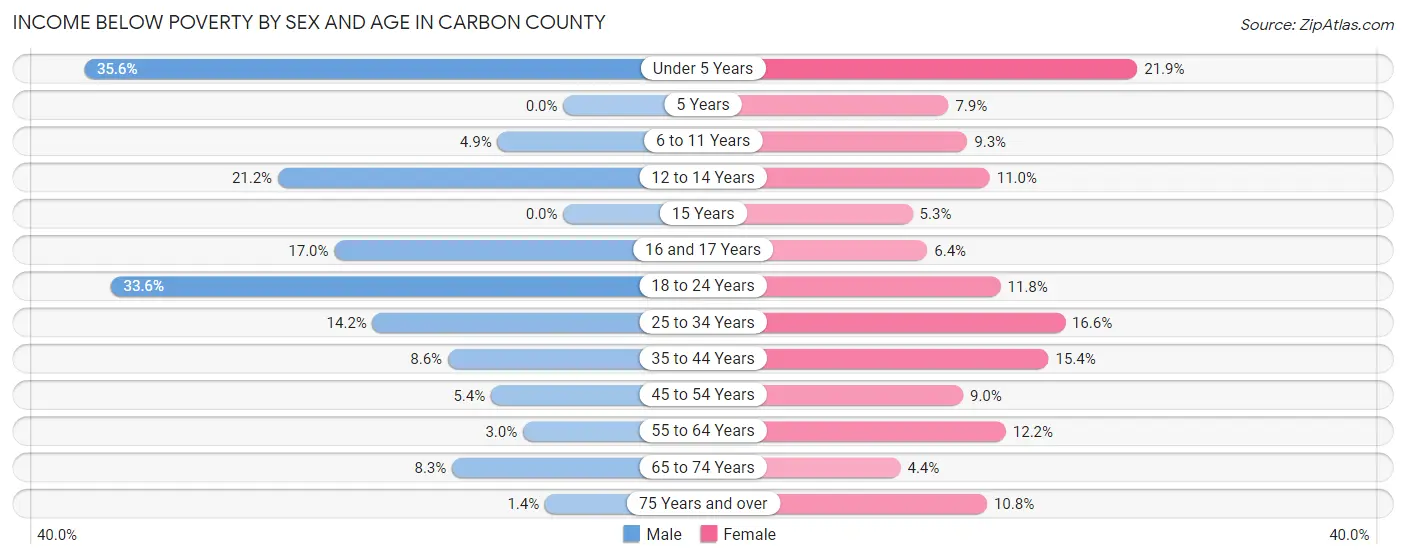
| Age Bracket | Male | Female |
| Under 5 Years | 63 (35.6%) | 43 (21.9%) |
| 5 Years | 0 (0.0%) | 8 (7.9%) |
| 6 to 11 Years | 15 (4.9%) | 26 (9.3%) |
| 12 to 14 Years | 25 (21.2%) | 20 (11.0%) |
| 15 Years | 0 (0.0%) | 3 (5.3%) |
| 16 and 17 Years | 17 (17.0%) | 8 (6.4%) |
| 18 to 24 Years | 121 (33.6%) | 25 (11.8%) |
| 25 to 34 Years | 63 (14.2%) | 84 (16.6%) |
| 35 to 44 Years | 54 (8.6%) | 99 (15.3%) |
| 45 to 54 Years | 37 (5.4%) | 53 (9.0%) |
| 55 to 64 Years | 28 (3.0%) | 110 (12.2%) |
| 65 to 74 Years | 74 (8.3%) | 39 (4.4%) |
| 75 Years and over | 7 (1.4%) | 51 (10.8%) |
| Total | 504 (9.5%) | 569 (11.0%) |
Income Above Poverty by Sex and Age in Carbon County
According to the poverty statistics in Carbon County, males aged 5 years and females aged 65 to 74 years are the age groups that are most secure financially, with 100.0% of males and 95.6% of females in these age groups living above the poverty line.
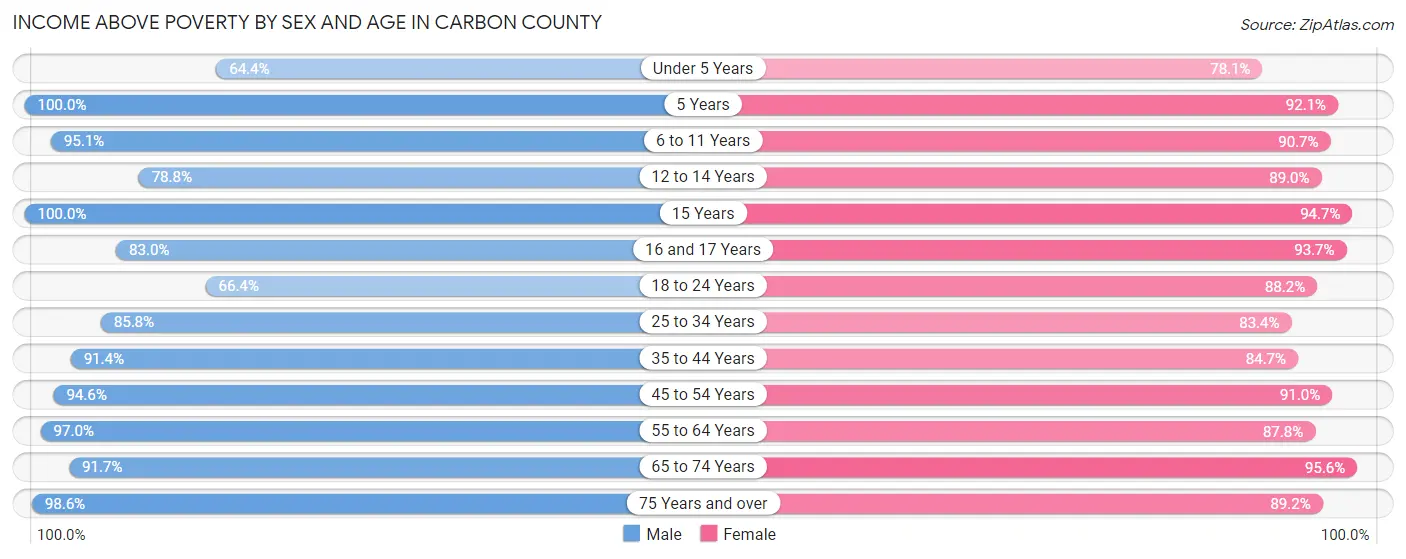
| Age Bracket | Male | Female |
| Under 5 Years | 114 (64.4%) | 153 (78.1%) |
| 5 Years | 39 (100.0%) | 93 (92.1%) |
| 6 to 11 Years | 292 (95.1%) | 253 (90.7%) |
| 12 to 14 Years | 93 (78.8%) | 162 (89.0%) |
| 15 Years | 90 (100.0%) | 54 (94.7%) |
| 16 and 17 Years | 83 (83.0%) | 118 (93.6%) |
| 18 to 24 Years | 239 (66.4%) | 187 (88.2%) |
| 25 to 34 Years | 382 (85.8%) | 423 (83.4%) |
| 35 to 44 Years | 576 (91.4%) | 546 (84.7%) |
| 45 to 54 Years | 652 (94.6%) | 536 (91.0%) |
| 55 to 64 Years | 908 (97.0%) | 793 (87.8%) |
| 65 to 74 Years | 822 (91.7%) | 855 (95.6%) |
| 75 Years and over | 506 (98.6%) | 422 (89.2%) |
| Total | 4,796 (90.5%) | 4,595 (89.0%) |
Income Below Poverty Among Married-Couple Families in Carbon County
The poverty statistics for married-couple families in Carbon County show that 5.5% or 136 of the total 2,480 families live below the poverty line. Families with 3 or 4 children have the highest poverty rate of 30.1%, comprising of 43 families. On the other hand, families with 5 or more children have the lowest poverty rate of 0.0%, which includes 0 families.
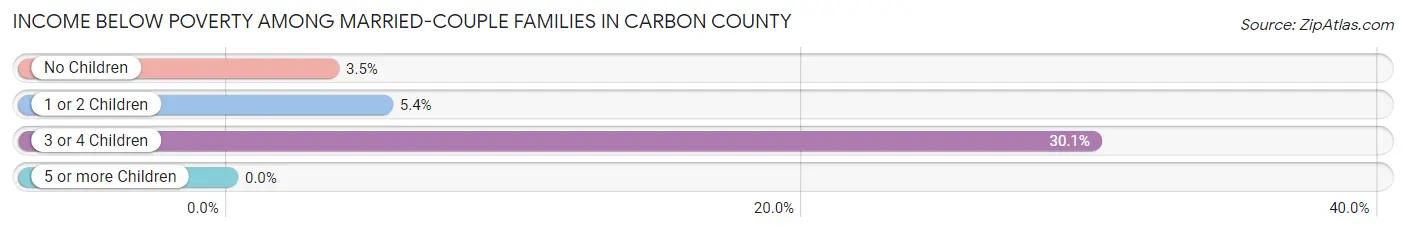
| Children | Above Poverty | Below Poverty |
| No Children | 1,697 (96.5%) | 62 (3.5%) |
| 1 or 2 Children | 544 (94.6%) | 31 (5.4%) |
| 3 or 4 Children | 100 (69.9%) | 43 (30.1%) |
| 5 or more Children | 3 (100.0%) | 0 (0.0%) |
| Total | 2,344 (94.5%) | 136 (5.5%) |
Income Below Poverty Among Single-Parent Households in Carbon County
According to the poverty data in Carbon County, 9.6% or 13 single-father households and 25.6% or 60 single-mother households are living below the poverty line. Among single-father households, those with 3 or 4 children have the highest poverty rate, with 3 households (17.6%) experiencing poverty. Likewise, among single-mother households, those with 5 or more children have the highest poverty rate, with 2 households (100.0%) falling below the poverty line.
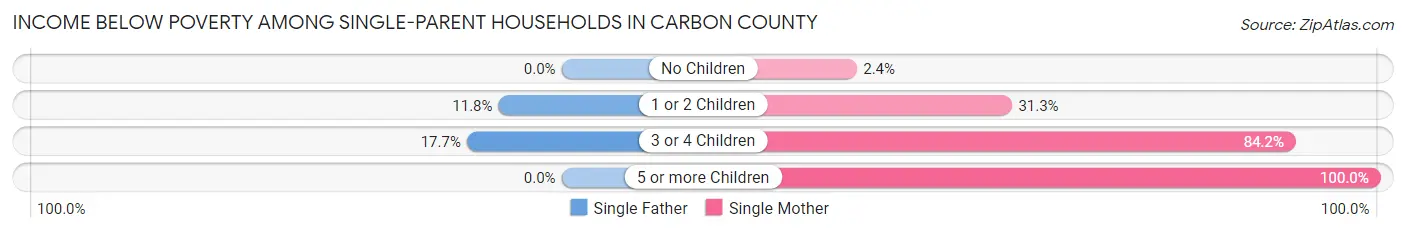
| Children | Single Father | Single Mother |
| No Children | 0 (0.0%) | 2 (2.4%) |
| 1 or 2 Children | 10 (11.8%) | 40 (31.2%) |
| 3 or 4 Children | 3 (17.6%) | 16 (84.2%) |
| 5 or more Children | 0 (0.0%) | 2 (100.0%) |
| Total | 13 (9.6%) | 60 (25.6%) |
Income Below Poverty Among Married-Couple vs Single-Parent Households in Carbon County
The poverty data for Carbon County shows that 136 of the married-couple family households (5.5%) and 73 of the single-parent households (19.7%) are living below the poverty level. Within the married-couple family households, those with 3 or 4 children have the highest poverty rate, with 43 households (30.1%) falling below the poverty line. Among the single-parent households, those with 5 or more children have the highest poverty rate, with 2 household (100.0%) living below poverty.
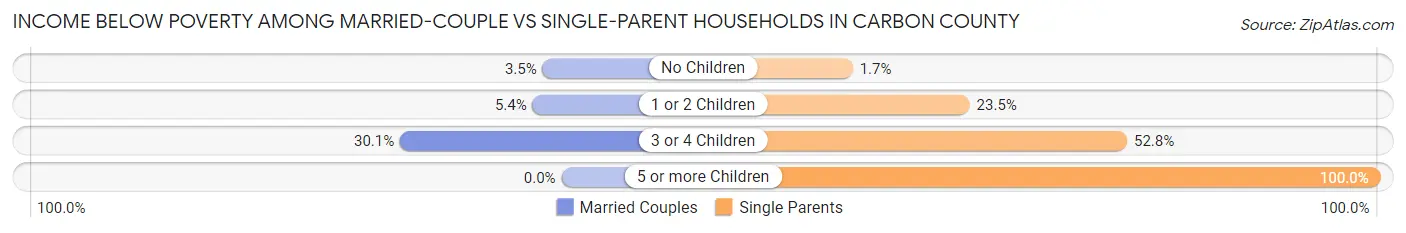
| Children | Married-Couple Families | Single-Parent Households |
| No Children | 62 (3.5%) | 2 (1.7%) |
| 1 or 2 Children | 31 (5.4%) | 50 (23.5%) |
| 3 or 4 Children | 43 (30.1%) | 19 (52.8%) |
| 5 or more Children | 0 (0.0%) | 2 (100.0%) |
| Total | 136 (5.5%) | 73 (19.7%) |
Race in Carbon County
The most populous races in Carbon County are White / Caucasian (9,999 | 93.9%), Two or more Races (331 | 3.1%), and Hispanic or Latino (306 | 2.9%).
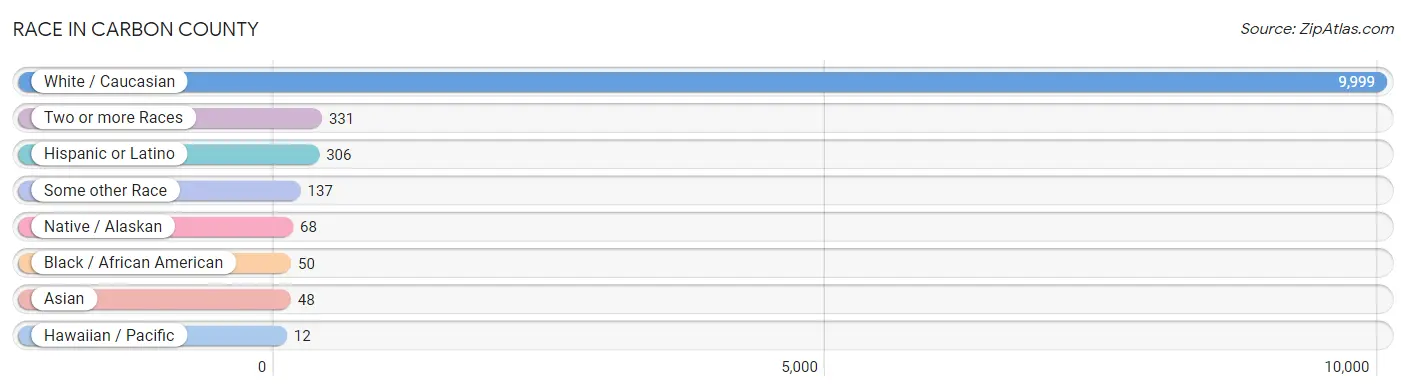
| Race | # Population | % Population |
| Asian | 48 | 0.4% |
| Black / African American | 50 | 0.5% |
| Hawaiian / Pacific | 12 | 0.1% |
| Hispanic or Latino | 306 | 2.9% |
| Native / Alaskan | 68 | 0.6% |
| White / Caucasian | 9,999 | 93.9% |
| Two or more Races | 331 | 3.1% |
| Some other Race | 137 | 1.3% |
| Total | 10,645 | 100.0% |
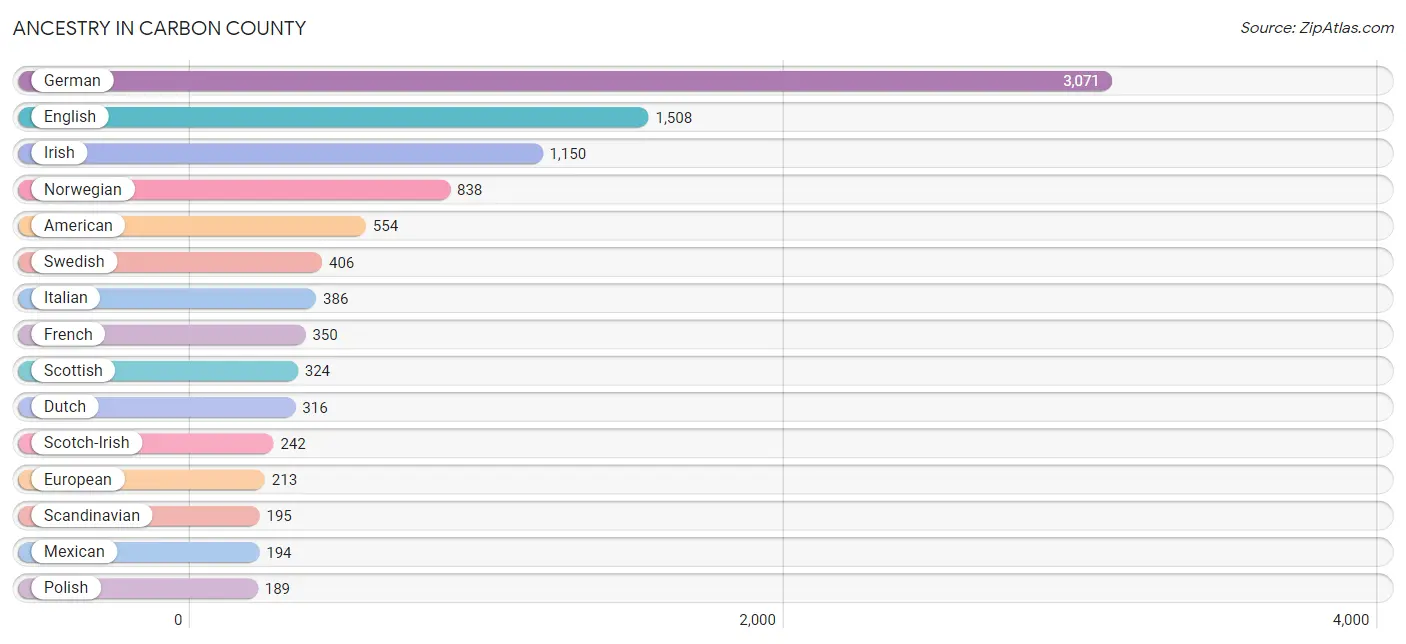
Ancestry in Carbon County
The most populous ancestries reported in Carbon County are German (3,071 | 28.8%), English (1,508 | 14.2%), Irish (1,150 | 10.8%), Norwegian (838 | 7.9%), and American (554 | 5.2%), together accounting for 66.9% of all Carbon County residents.
| Ancestry | # Population | % Population |
| American | 554 | 5.2% |
| Apache | 2 | 0.0% |
| Argentinean | 25 | 0.2% |
| Austrian | 5 | 0.1% |
| Basque | 14 | 0.1% |
| Belgian | 20 | 0.2% |
| Belizean | 1 | 0.0% |
| Blackfeet | 8 | 0.1% |
| British | 95 | 0.9% |
| Canadian | 44 | 0.4% |
| Celtic | 1 | 0.0% |
| Cherokee | 48 | 0.4% |
| Cheyenne | 15 | 0.1% |
| Chippewa | 61 | 0.6% |
| Colombian | 1 | 0.0% |
| Croatian | 33 | 0.3% |
| Crow | 54 | 0.5% |
| Czech | 134 | 1.3% |
| Czechoslovakian | 10 | 0.1% |
| Danish | 105 | 1.0% |
| Delaware | 4 | 0.0% |
| Dutch | 316 | 3.0% |
| Eastern European | 5 | 0.1% |
| English | 1,508 | 14.2% |
| Ethiopian | 12 | 0.1% |
| European | 213 | 2.0% |
| Finnish | 186 | 1.8% |
| French | 350 | 3.3% |
| French Canadian | 73 | 0.7% |
| German | 3,071 | 28.8% |
| German Russian | 2 | 0.0% |
| Greek | 94 | 0.9% |
| Hungarian | 29 | 0.3% |
| Iranian | 6 | 0.1% |
| Irish | 1,150 | 10.8% |
| Italian | 386 | 3.6% |
| Korean | 57 | 0.5% |
| Lithuanian | 18 | 0.2% |
| Mexican | 194 | 1.8% |
| Northern European | 7 | 0.1% |
| Norwegian | 838 | 7.9% |
| Pennsylvania German | 10 | 0.1% |
| Peruvian | 13 | 0.1% |
| Polish | 189 | 1.8% |
| Portuguese | 7 | 0.1% |
| Romanian | 6 | 0.1% |
| Russian | 76 | 0.7% |
| Scandinavian | 195 | 1.8% |
| Scotch-Irish | 242 | 2.3% |
| Scottish | 324 | 3.0% |
| Shoshone | 3 | 0.0% |
| Sioux | 27 | 0.3% |
| Slavic | 1 | 0.0% |
| Slovak | 14 | 0.1% |
| South American | 39 | 0.4% |
| Spaniard | 48 | 0.4% |
| Spanish | 9 | 0.1% |
| Subsaharan African | 12 | 0.1% |
| Swedish | 406 | 3.8% |
| Swiss | 22 | 0.2% |
| Ukrainian | 36 | 0.3% |
| Welsh | 94 | 0.9% |
| Yugoslavian | 44 | 0.4% | View All 63 Rows |
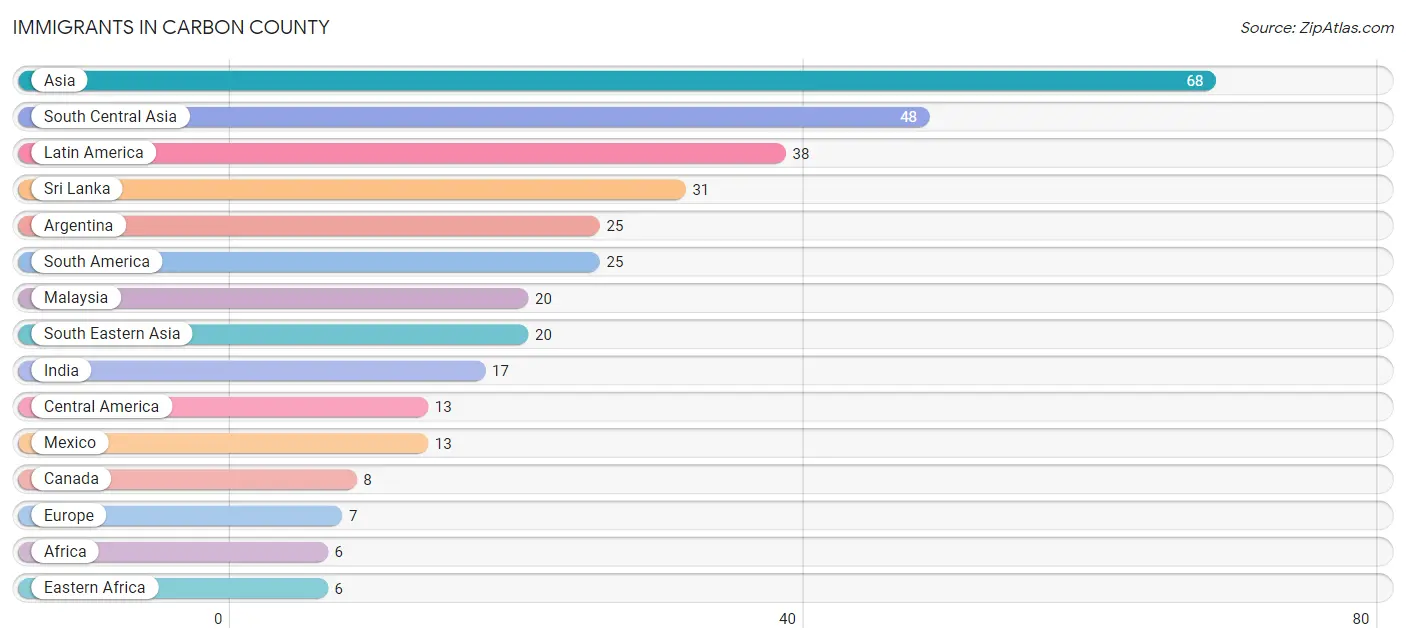
Immigrants in Carbon County
The most numerous immigrant groups reported in Carbon County came from Asia (68 | 0.6%), South Central Asia (48 | 0.4%), Latin America (38 | 0.4%), Sri Lanka (31 | 0.3%), and Argentina (25 | 0.2%), together accounting for 2.0% of all Carbon County residents.
| Immigration Origin | # Population | % Population |
| Africa | 6 | 0.1% |
| Argentina | 25 | 0.2% |
| Asia | 68 | 0.6% |
| Canada | 8 | 0.1% |
| Central America | 13 | 0.1% |
| Eastern Africa | 6 | 0.1% |
| Ethiopia | 6 | 0.1% |
| Europe | 7 | 0.1% |
| Germany | 3 | 0.0% |
| India | 17 | 0.2% |
| Italy | 2 | 0.0% |
| Latin America | 38 | 0.4% |
| Malaysia | 20 | 0.2% |
| Mexico | 13 | 0.1% |
| Northern Europe | 2 | 0.0% |
| Oceania | 2 | 0.0% |
| South America | 25 | 0.2% |
| South Central Asia | 48 | 0.4% |
| South Eastern Asia | 20 | 0.2% |
| Southern Europe | 2 | 0.0% |
| Sri Lanka | 31 | 0.3% |
| Western Europe | 3 | 0.0% | View All 22 Rows |
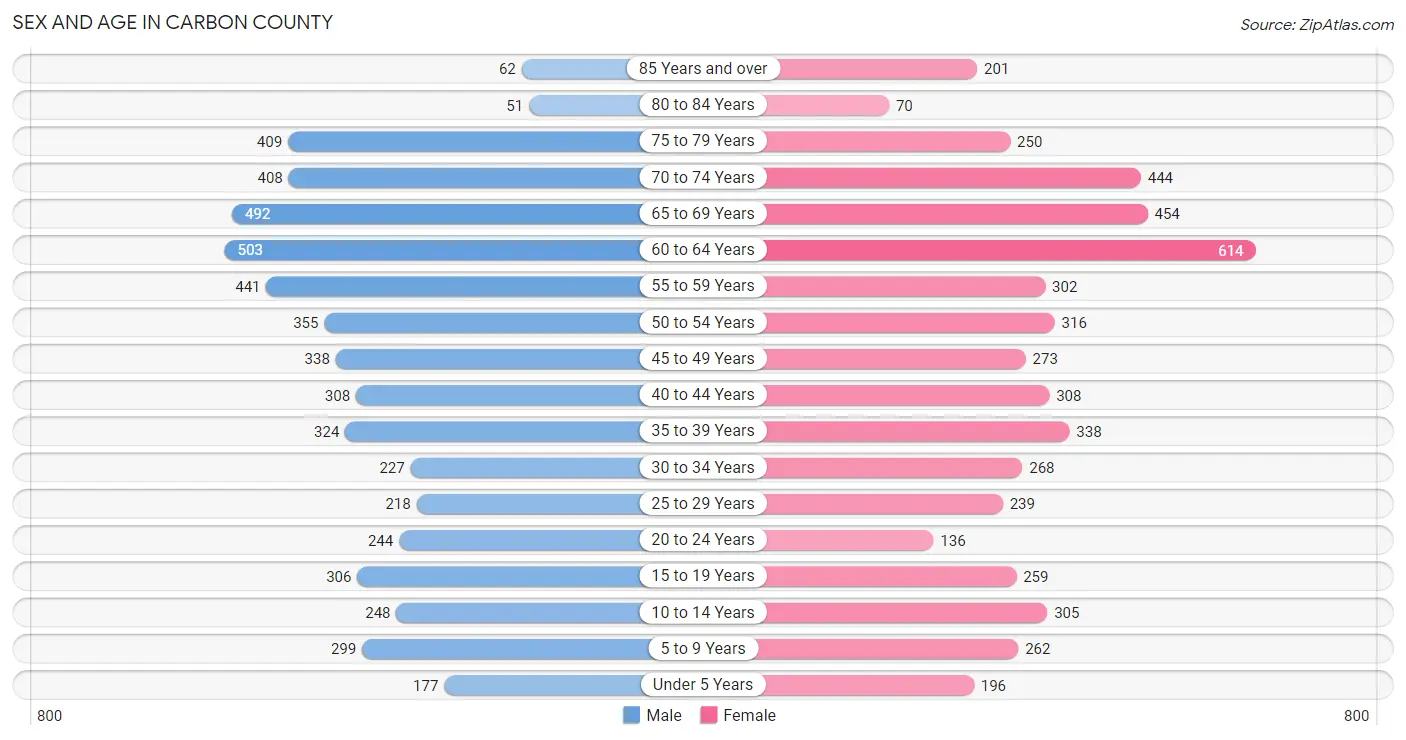
Sex and Age in Carbon County
Sex and Age in Carbon County
The most populous age groups in Carbon County are 60 to 64 Years (503 | 9.3%) for men and 60 to 64 Years (614 | 11.7%) for women.
| Age Bracket | Male | Female |
| Under 5 Years | 177 (3.3%) | 196 (3.7%) |
| 5 to 9 Years | 299 (5.5%) | 262 (5.0%) |
| 10 to 14 Years | 248 (4.6%) | 305 (5.8%) |
| 15 to 19 Years | 306 (5.7%) | 259 (5.0%) |
| 20 to 24 Years | 244 (4.5%) | 136 (2.6%) |
| 25 to 29 Years | 218 (4.0%) | 239 (4.6%) |
| 30 to 34 Years | 227 (4.2%) | 268 (5.1%) |
| 35 to 39 Years | 324 (6.0%) | 338 (6.5%) |
| 40 to 44 Years | 308 (5.7%) | 308 (5.9%) |
| 45 to 49 Years | 338 (6.2%) | 273 (5.2%) |
| 50 to 54 Years | 355 (6.6%) | 316 (6.0%) |
| 55 to 59 Years | 441 (8.2%) | 302 (5.8%) |
| 60 to 64 Years | 503 (9.3%) | 614 (11.7%) |
| 65 to 69 Years | 492 (9.1%) | 454 (8.7%) |
| 70 to 74 Years | 408 (7.5%) | 444 (8.5%) |
| 75 to 79 Years | 409 (7.6%) | 250 (4.8%) |
| 80 to 84 Years | 51 (0.9%) | 70 (1.3%) |
| 85 Years and over | 62 (1.1%) | 201 (3.8%) |
| Total | 5,410 (100.0%) | 5,235 (100.0%) |
Families and Households in Carbon County
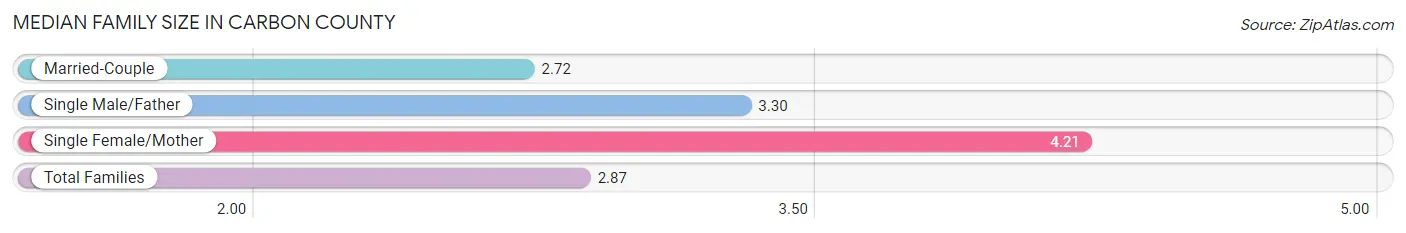
Median Family Size in Carbon County
The median family size in Carbon County is 2.87 persons per family, with single female/mother families (234 | 8.2%) accounting for the largest median family size of 4.21 persons per family. On the other hand, married-couple families (2,480 | 87.0%) represent the smallest median family size with 2.72 persons per family.
| Family Type | # Families | Family Size |
| Married-Couple | 2,480 (87.0%) | 2.72 |
| Single Male/Father | 136 (4.8%) | 3.30 |
| Single Female/Mother | 234 (8.2%) | 4.21 |
| Total Families | 2,850 (100.0%) | 2.87 |
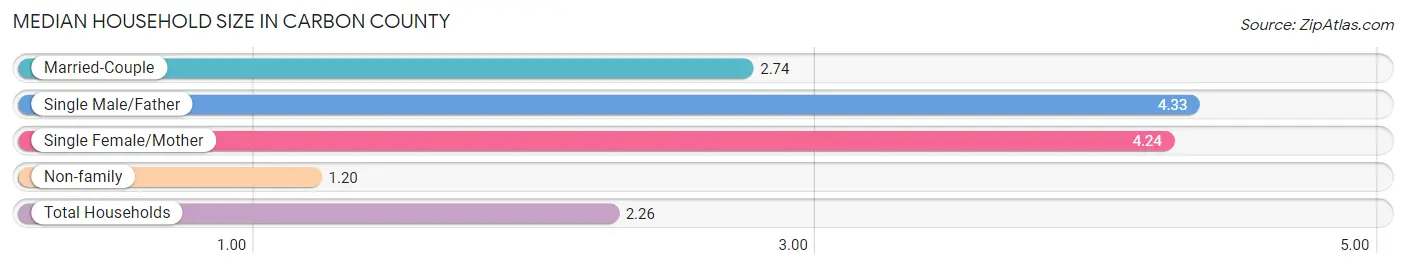
Median Household Size in Carbon County
The median household size in Carbon County is 2.26 persons per household, with single male/father households (136 | 2.9%) accounting for the largest median household size of 4.33 persons per household. non-family households (1,800 | 38.7%) represent the smallest median household size with 1.20 persons per household.
| Household Type | # Households | Household Size |
| Married-Couple | 2,480 (53.3%) | 2.74 |
| Single Male/Father | 136 (2.9%) | 4.33 |
| Single Female/Mother | 234 (5.0%) | 4.24 |
| Non-family | 1,800 (38.7%) | 1.20 |
| Total Households | 4,650 (100.0%) | 2.26 |
Household Size by Marriage Status in Carbon County
Out of a total of 4,650 households in Carbon County, 2,850 (61.3%) are family households, while 1,800 (38.7%) are nonfamily households. The most numerous type of family households are 2-person households, comprising 1,751, and the most common type of nonfamily households are 1-person households, comprising 1,567.
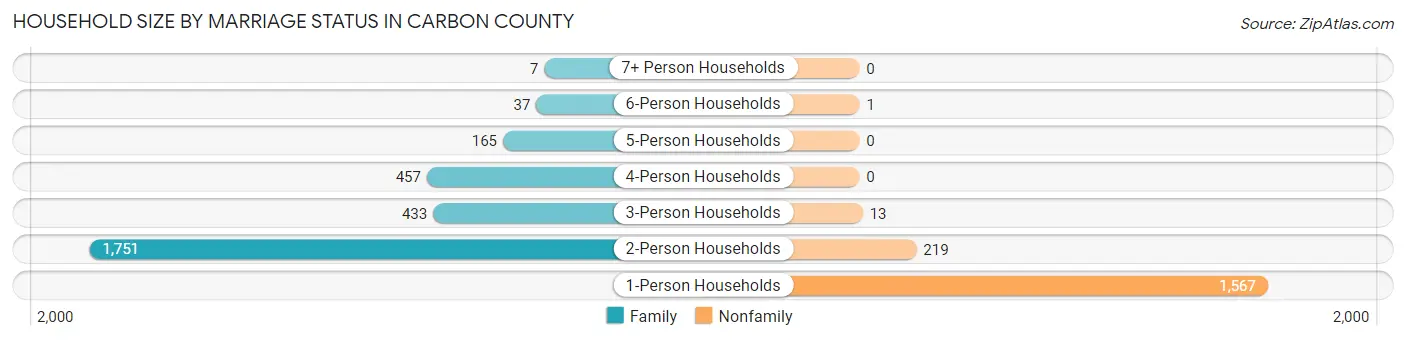
| Household Size | Family Households | Nonfamily Households |
| 1-Person Households | - | 1,567 (33.7%) |
| 2-Person Households | 1,751 (37.7%) | 219 (4.7%) |
| 3-Person Households | 433 (9.3%) | 13 (0.3%) |
| 4-Person Households | 457 (9.8%) | 0 (0.0%) |
| 5-Person Households | 165 (3.5%) | 0 (0.0%) |
| 6-Person Households | 37 (0.8%) | 1 (0.0%) |
| 7+ Person Households | 7 (0.2%) | 0 (0.0%) |
| Total | 2,850 (61.3%) | 1,800 (38.7%) |
Female Fertility in Carbon County
Fertility by Age in Carbon County
Average fertility rate in Carbon County is 68.0 births per 1,000 women. Women in the age bracket of 20 to 34 years have the highest fertility rate with 159.0 births per 1,000 women. Women in the age bracket of 20 to 34 years acount for 80.3% of all women with births.
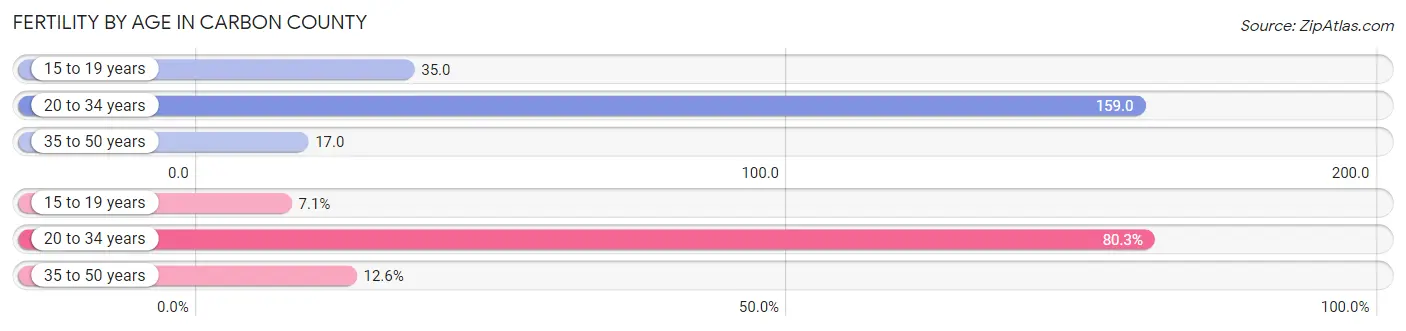
| Age Bracket | Women with Births | Births / 1,000 Women |
| 15 to 19 years | 9 (7.1%) | 35.0 |
| 20 to 34 years | 102 (80.3%) | 159.0 |
| 35 to 50 years | 16 (12.6%) | 17.0 |
| Total | 127 (100.0%) | 68.0 |
Fertility by Age by Marriage Status in Carbon County
86.6% of women with births (127) in Carbon County are married. The highest percentage of unmarried women with births falls into 15 to 19 years age bracket with 100.0% of them unmarried at the time of birth, while the lowest percentage of unmarried women with births belong to 35 to 50 years age bracket with 0.0% of them unmarried.
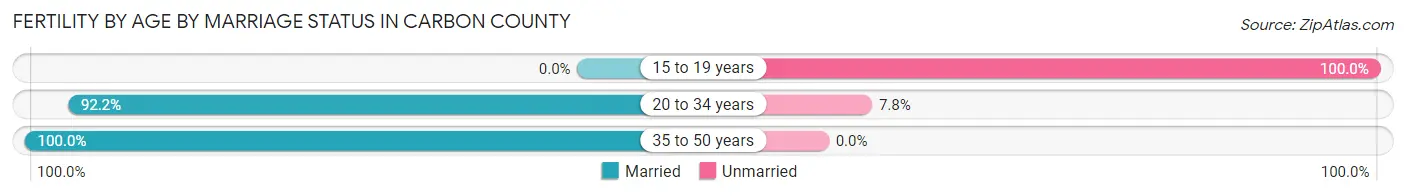
| Age Bracket | Married | Unmarried |
| 15 to 19 years | 0 (0.0%) | 9 (100.0%) |
| 20 to 34 years | 94 (92.2%) | 8 (7.8%) |
| 35 to 50 years | 16 (100.0%) | 0 (0.0%) |
| Total | 110 (86.6%) | 17 (13.4%) |
Fertility by Education in Carbon County
Average fertility rate in Carbon County is 68.0 births per 1,000 women. Women with the education attainment of high school diploma have the highest fertility rate of 138.0 births per 1,000 women, while women with the education attainment of bachelor's degree have the lowest fertility at 27.0 births per 1,000 women. Women with the education attainment of high school diploma represent 46.5% of all women with births.
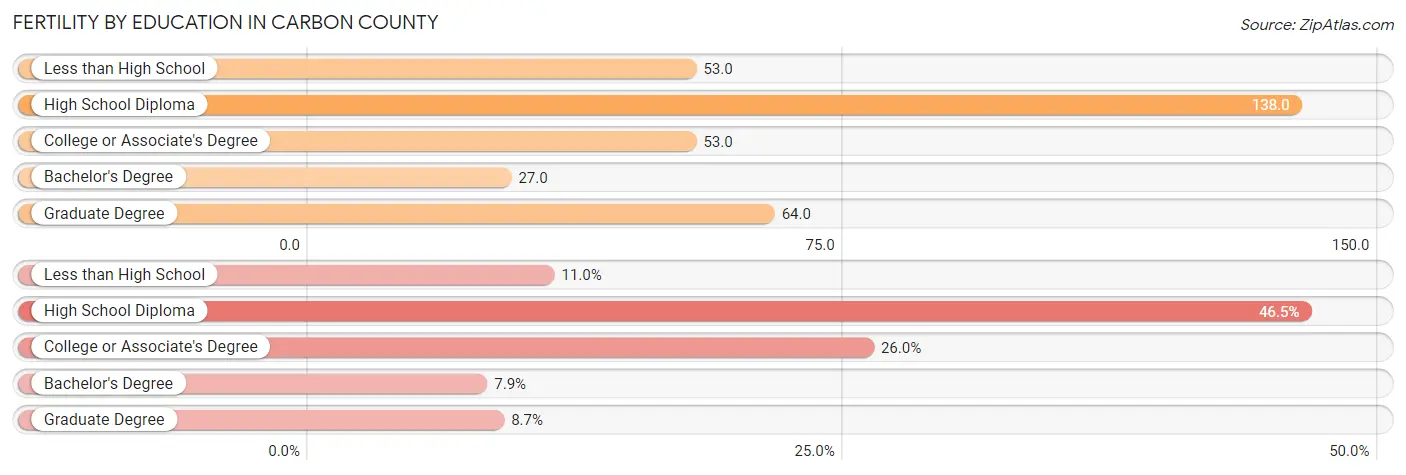
| Educational Attainment | Women with Births | Births / 1,000 Women |
| Less than High School | 14 (11.0%) | 53.0 |
| High School Diploma | 59 (46.5%) | 138.0 |
| College or Associate's Degree | 33 (26.0%) | 53.0 |
| Bachelor's Degree | 10 (7.9%) | 27.0 |
| Graduate Degree | 11 (8.7%) | 64.0 |
| Total | 127 (100.0%) | 68.0 |
Fertility by Education by Marriage Status in Carbon County
13.4% of women with births in Carbon County are unmarried. Women with the educational attainment of high school diploma are most likely to be married with 100.0% of them married at childbirth, while women with the educational attainment of less than high school are least likely to be married with 64.3% of them unmarried at childbirth.
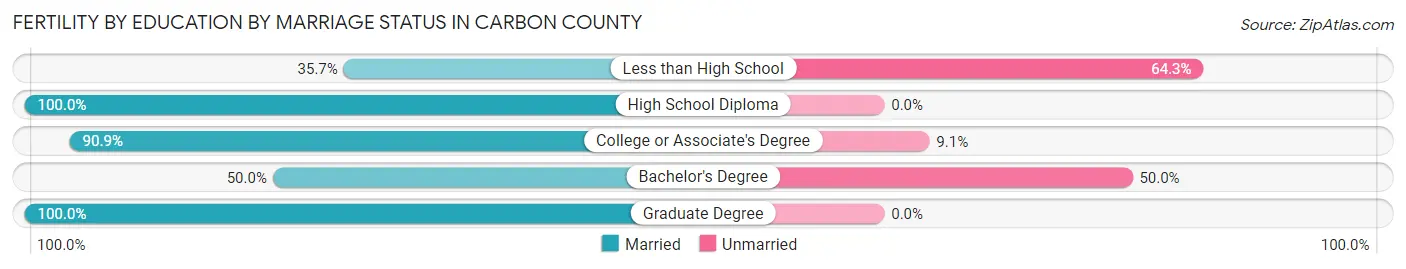
| Educational Attainment | Married | Unmarried |
| Less than High School | 5 (35.7%) | 9 (64.3%) |
| High School Diploma | 59 (100.0%) | 0 (0.0%) |
| College or Associate's Degree | 30 (90.9%) | 3 (9.1%) |
| Bachelor's Degree | 5 (50.0%) | 5 (50.0%) |
| Graduate Degree | 11 (100.0%) | 0 (0.0%) |
| Total | 110 (86.6%) | 17 (13.4%) |
Employment Characteristics in Carbon County
Employment by Class of Employer in Carbon County
Among the 5,137 employed individuals in Carbon County, private company employees (2,974 | 57.9%), self-employed (not incorporated) (598 | 11.6%), and not-for-profit organizations (505 | 9.8%) make up the most common classes of employment.
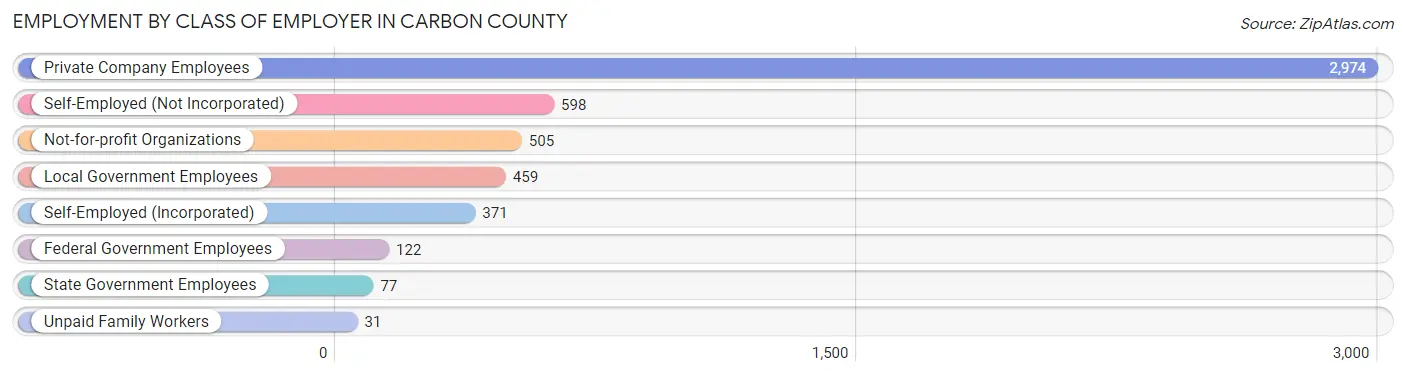
| Employer Class | # Employees | % Employees |
| Private Company Employees | 2,974 | 57.9% |
| Self-Employed (Incorporated) | 371 | 7.2% |
| Self-Employed (Not Incorporated) | 598 | 11.6% |
| Not-for-profit Organizations | 505 | 9.8% |
| Local Government Employees | 459 | 8.9% |
| State Government Employees | 77 | 1.5% |
| Federal Government Employees | 122 | 2.4% |
| Unpaid Family Workers | 31 | 0.6% |
| Total | 5,137 | 100.0% |
Employment Status by Age in Carbon County
According to the labor force statistics for Carbon County, out of the total population over 16 years of age (9,011), 61.1% or 5,506 individuals are in the labor force, with 4.9% or 270 of them unemployed. The age group with the highest labor force participation rate is 20 to 24 years, with 93.2% or 354 individuals in the labor force. Within the labor force, the 16 to 19 years age range has the highest percentage of unemployed individuals, with 24.7% or 58 of them being unemployed.
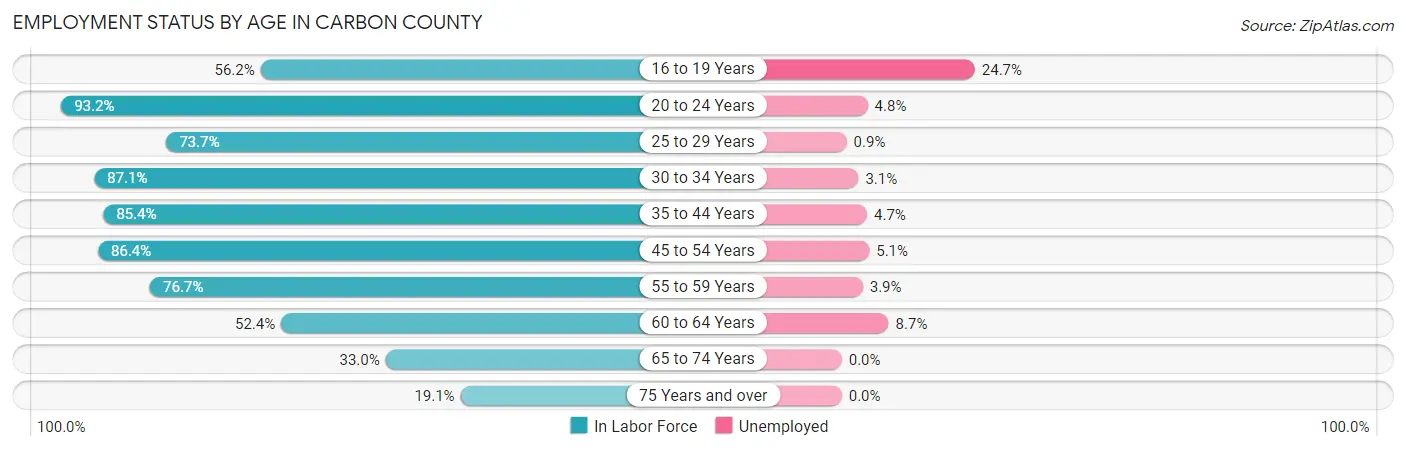
| Age Bracket | In Labor Force | Unemployed |
| 16 to 19 Years | 235 (56.2%) | 58 (24.7%) |
| 20 to 24 Years | 354 (93.2%) | 17 (4.8%) |
| 25 to 29 Years | 337 (73.7%) | 3 (0.9%) |
| 30 to 34 Years | 431 (87.1%) | 13 (3.1%) |
| 35 to 44 Years | 1,091 (85.4%) | 51 (4.7%) |
| 45 to 54 Years | 1,108 (86.4%) | 57 (5.1%) |
| 55 to 59 Years | 570 (76.7%) | 22 (3.9%) |
| 60 to 64 Years | 585 (52.4%) | 51 (8.7%) |
| 65 to 74 Years | 593 (33.0%) | 0 (0.0%) |
| 75 Years and over | 199 (19.1%) | 0 (0.0%) |
| Total | 5,506 (61.1%) | 270 (4.9%) |
Employment Status by Educational Attainment in Carbon County
According to labor force statistics for Carbon County, 76.7% of individuals (4,120) out of the total population between 25 and 64 years of age (5,372) are in the labor force, with 4.8% or 198 of them being unemployed. The group with the highest labor force participation rate are those with the educational attainment of bachelor's degree or higher, with 80.6% or 1,201 individuals in the labor force. Within the labor force, individuals with less than high school education have the highest percentage of unemployment, with 9.2% or 11 of them being unemployed.
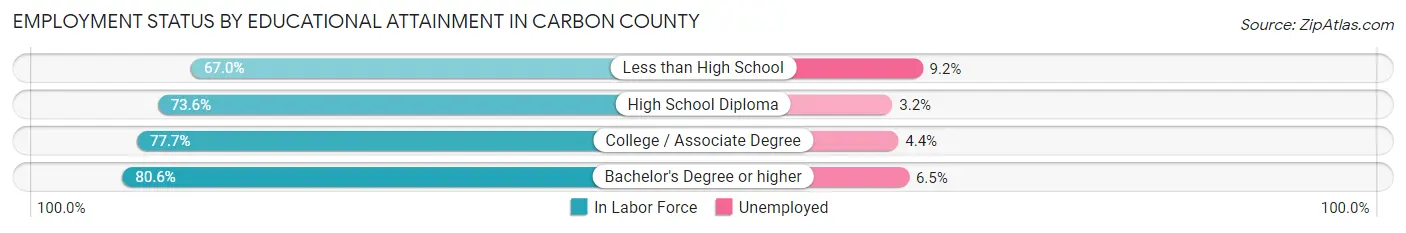
| Educational Attainment | In Labor Force | Unemployed |
| Less than High School | 120 (67.0%) | 16 (9.2%) |
| High School Diploma | 1,342 (73.6%) | 58 (3.2%) |
| College / Associate Degree | 1,460 (77.7%) | 83 (4.4%) |
| Bachelor's Degree or higher | 1,201 (80.6%) | 97 (6.5%) |
| Total | 4,120 (76.7%) | 258 (4.8%) |
Employment Occupations by Sex in Carbon County
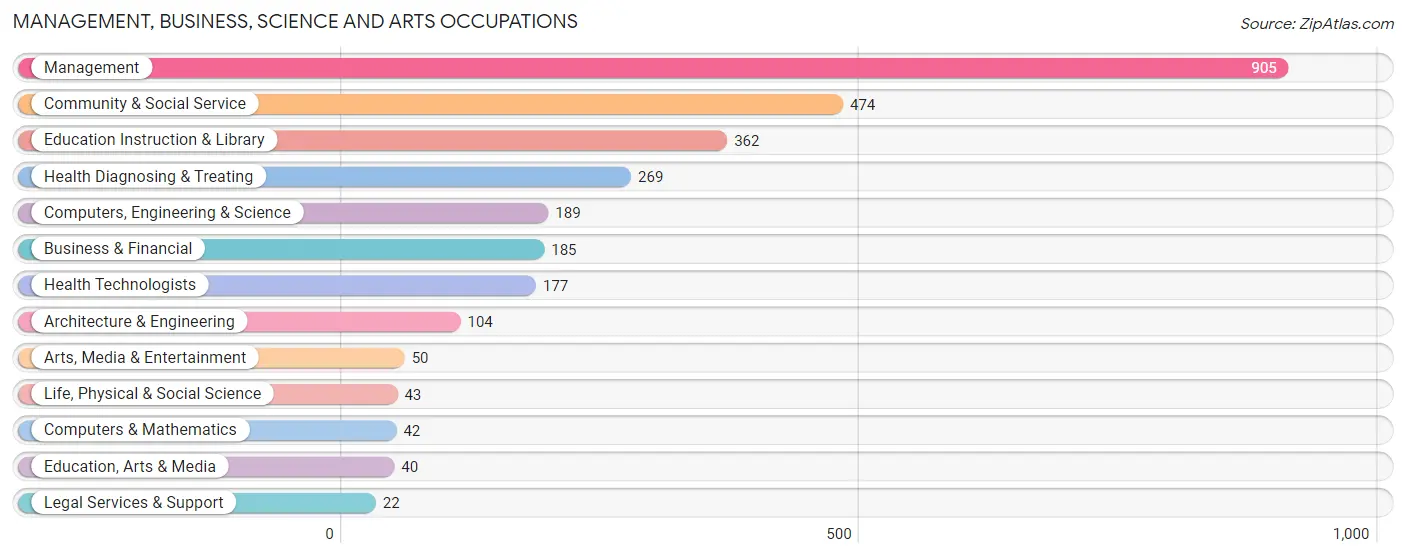
Management, Business, Science and Arts Occupations
The most common Management, Business, Science and Arts occupations in Carbon County are Management (905 | 17.3%), Community & Social Service (474 | 9.1%), Education Instruction & Library (362 | 6.9%), Health Diagnosing & Treating (269 | 5.2%), and Computers, Engineering & Science (189 | 3.6%).
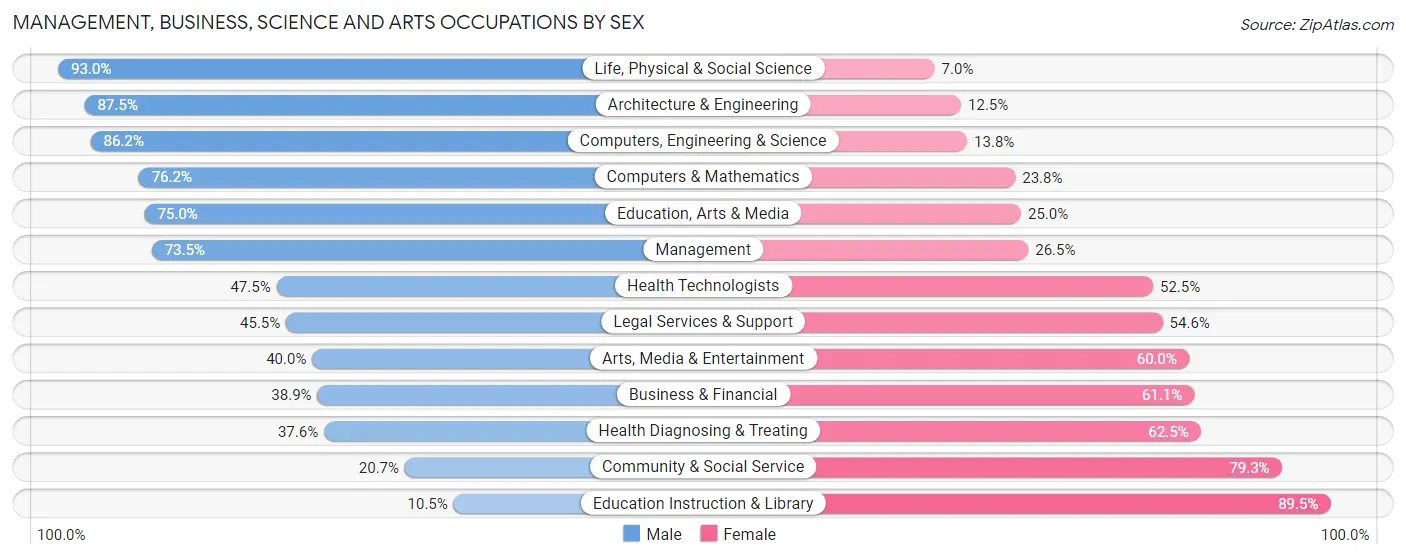
Management, Business, Science and Arts Occupations by Sex
Within the Management, Business, Science and Arts occupations in Carbon County, the most male-oriented occupations are Life, Physical & Social Science (93.0%), Architecture & Engineering (87.5%), and Computers, Engineering & Science (86.2%), while the most female-oriented occupations are Education Instruction & Library (89.5%), Community & Social Service (79.3%), and Health Diagnosing & Treating (62.5%).
| Occupation | Male | Female |
| Management | 665 (73.5%) | 240 (26.5%) |
| Business & Financial | 72 (38.9%) | 113 (61.1%) |
| Computers, Engineering & Science | 163 (86.2%) | 26 (13.8%) |
| Computers & Mathematics | 32 (76.2%) | 10 (23.8%) |
| Architecture & Engineering | 91 (87.5%) | 13 (12.5%) |
| Life, Physical & Social Science | 40 (93.0%) | 3 (7.0%) |
| Community & Social Service | 98 (20.7%) | 376 (79.3%) |
| Education, Arts & Media | 30 (75.0%) | 10 (25.0%) |
| Legal Services & Support | 10 (45.5%) | 12 (54.5%) |
| Education Instruction & Library | 38 (10.5%) | 324 (89.5%) |
| Arts, Media & Entertainment | 20 (40.0%) | 30 (60.0%) |
| Health Diagnosing & Treating | 101 (37.6%) | 168 (62.5%) |
| Health Technologists | 84 (47.5%) | 93 (52.5%) |
| Total (Category) | 1,099 (54.3%) | 923 (45.7%) |
| Total (Overall) | 2,911 (55.8%) | 2,304 (44.2%) |
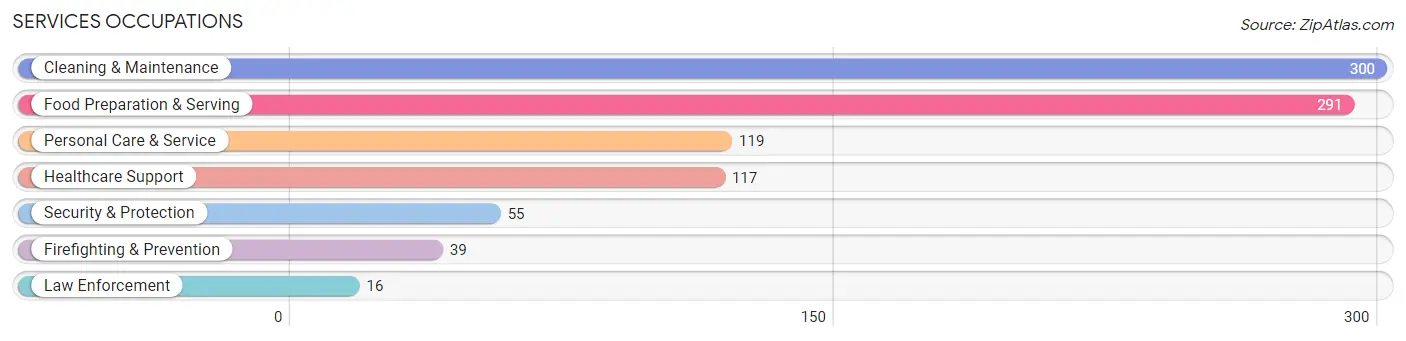
Services Occupations
The most common Services occupations in Carbon County are Cleaning & Maintenance (300 | 5.8%), Food Preparation & Serving (291 | 5.6%), Personal Care & Service (119 | 2.3%), Healthcare Support (117 | 2.2%), and Security & Protection (55 | 1.1%).
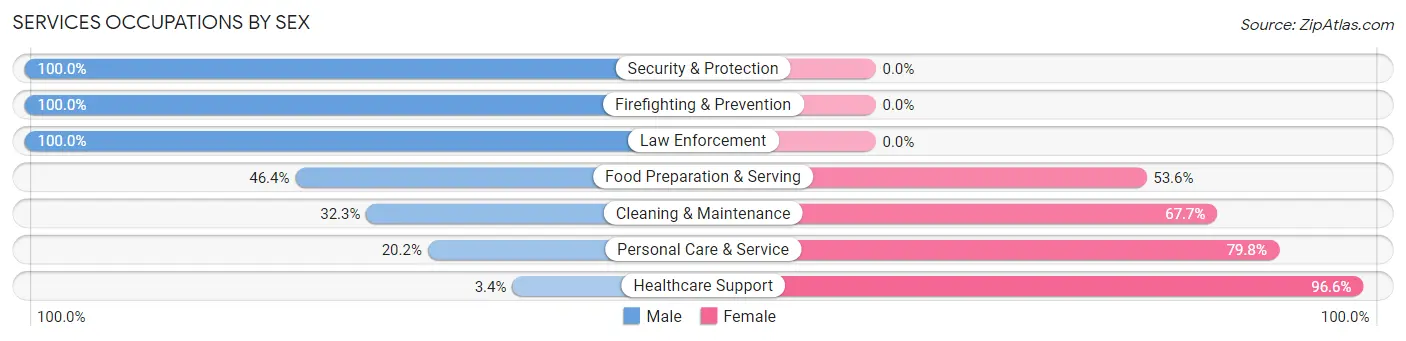
Services Occupations by Sex
Within the Services occupations in Carbon County, the most male-oriented occupations are Security & Protection (100.0%), Firefighting & Prevention (100.0%), and Law Enforcement (100.0%), while the most female-oriented occupations are Healthcare Support (96.6%), Personal Care & Service (79.8%), and Cleaning & Maintenance (67.7%).
| Occupation | Male | Female |
| Healthcare Support | 4 (3.4%) | 113 (96.6%) |
| Security & Protection | 55 (100.0%) | 0 (0.0%) |
| Firefighting & Prevention | 39 (100.0%) | 0 (0.0%) |
| Law Enforcement | 16 (100.0%) | 0 (0.0%) |
| Food Preparation & Serving | 135 (46.4%) | 156 (53.6%) |
| Cleaning & Maintenance | 97 (32.3%) | 203 (67.7%) |
| Personal Care & Service | 24 (20.2%) | 95 (79.8%) |
| Total (Category) | 315 (35.7%) | 567 (64.3%) |
| Total (Overall) | 2,911 (55.8%) | 2,304 (44.2%) |
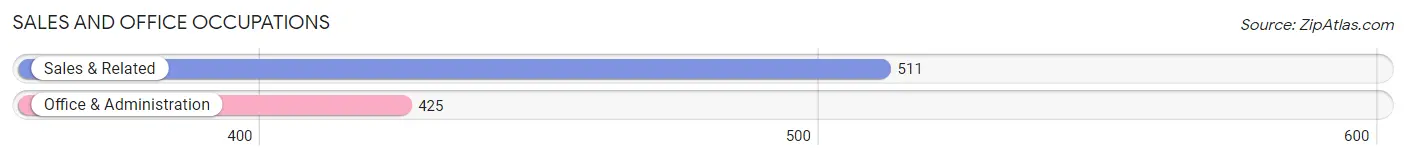
Sales and Office Occupations
The most common Sales and Office occupations in Carbon County are Sales & Related (511 | 9.8%), and Office & Administration (425 | 8.2%).
Sales and Office Occupations by Sex
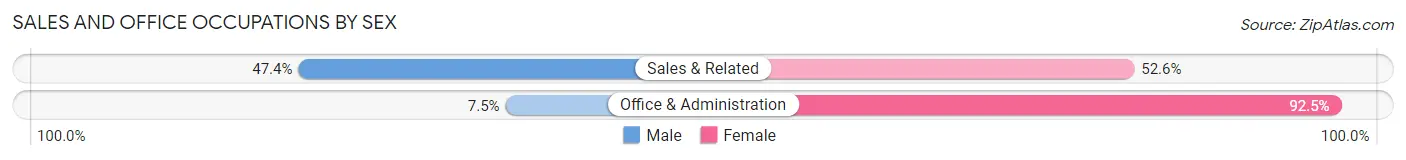
| Occupation | Male | Female |
| Sales & Related | 242 (47.4%) | 269 (52.6%) |
| Office & Administration | 32 (7.5%) | 393 (92.5%) |
| Total (Category) | 274 (29.3%) | 662 (70.7%) |
| Total (Overall) | 2,911 (55.8%) | 2,304 (44.2%) |
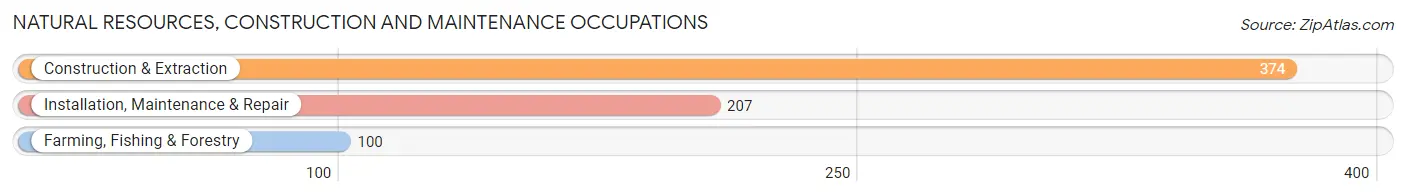
Natural Resources, Construction and Maintenance Occupations
The most common Natural Resources, Construction and Maintenance occupations in Carbon County are Construction & Extraction (374 | 7.2%), Installation, Maintenance & Repair (207 | 4.0%), and Farming, Fishing & Forestry (100 | 1.9%).
Natural Resources, Construction and Maintenance Occupations by Sex
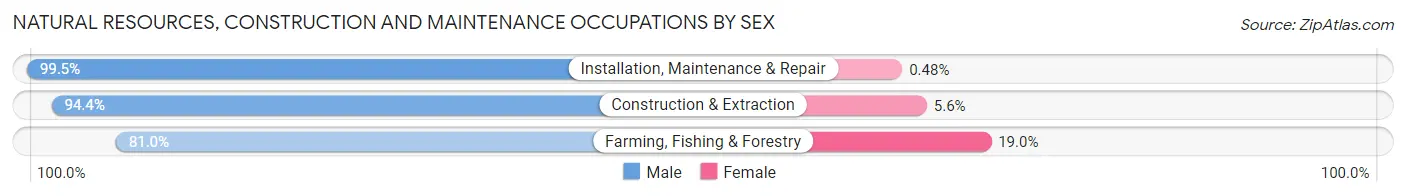
| Occupation | Male | Female |
| Farming, Fishing & Forestry | 81 (81.0%) | 19 (19.0%) |
| Construction & Extraction | 353 (94.4%) | 21 (5.6%) |
| Installation, Maintenance & Repair | 206 (99.5%) | 1 (0.5%) |
| Total (Category) | 640 (94.0%) | 41 (6.0%) |
| Total (Overall) | 2,911 (55.8%) | 2,304 (44.2%) |
Production, Transportation and Moving Occupations
The most common Production, Transportation and Moving occupations in Carbon County are Transportation (269 | 5.2%), Production (233 | 4.5%), and Material Moving (192 | 3.7%).
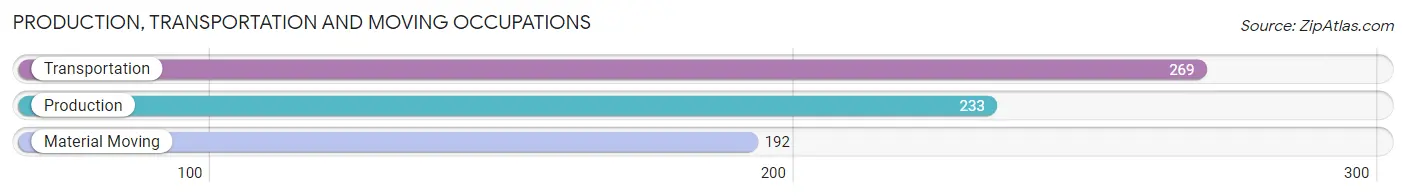
Production, Transportation and Moving Occupations by Sex
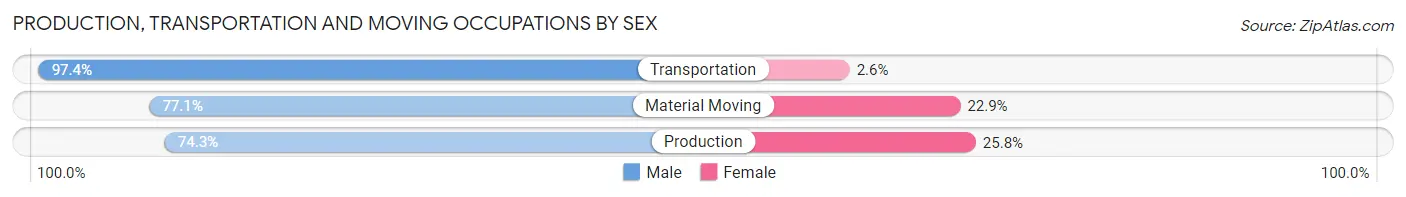
| Occupation | Male | Female |
| Production | 173 (74.3%) | 60 (25.8%) |
| Transportation | 262 (97.4%) | 7 (2.6%) |
| Material Moving | 148 (77.1%) | 44 (22.9%) |
| Total (Category) | 583 (84.0%) | 111 (16.0%) |
| Total (Overall) | 2,911 (55.8%) | 2,304 (44.2%) |
Employment Industries by Sex in Carbon County
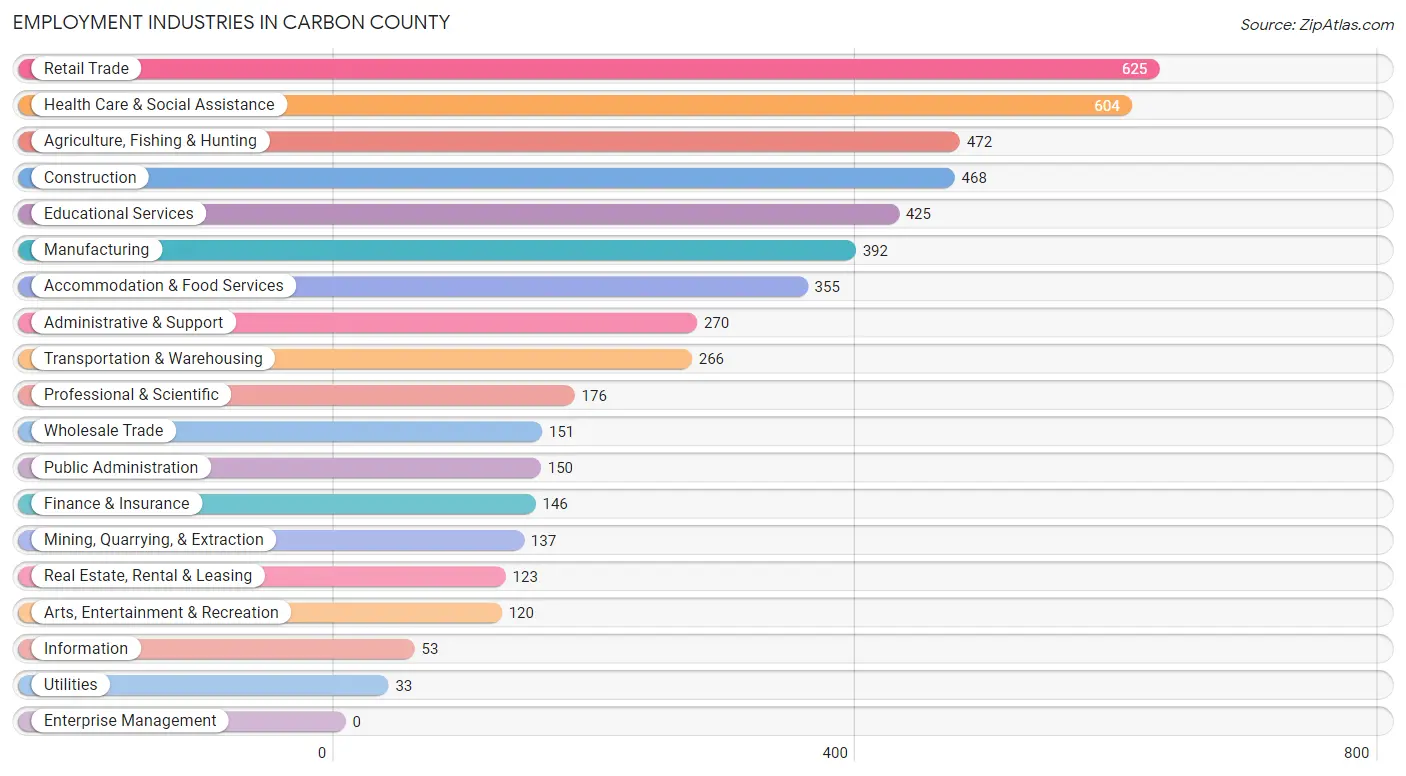
Employment Industries in Carbon County
The major employment industries in Carbon County include Retail Trade (625 | 12.0%), Health Care & Social Assistance (604 | 11.6%), Agriculture, Fishing & Hunting (472 | 9.0%), Construction (468 | 9.0%), and Educational Services (425 | 8.2%).
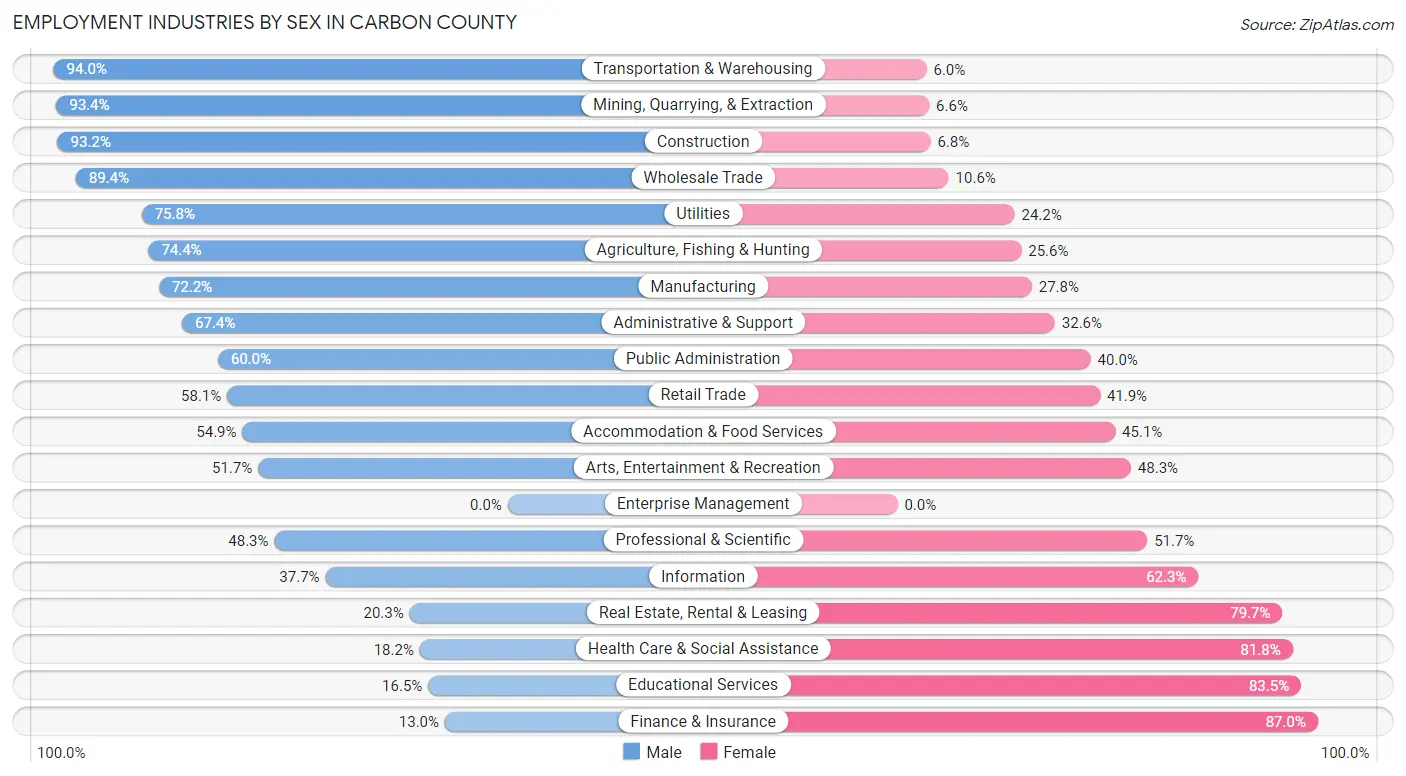
Employment Industries by Sex in Carbon County
The Carbon County industries that see more men than women are Transportation & Warehousing (94.0%), Mining, Quarrying, & Extraction (93.4%), and Construction (93.2%), whereas the industries that tend to have a higher number of women are Finance & Insurance (87.0%), Educational Services (83.5%), and Health Care & Social Assistance (81.8%).
| Industry | Male | Female |
| Agriculture, Fishing & Hunting | 351 (74.4%) | 121 (25.6%) |
| Mining, Quarrying, & Extraction | 128 (93.4%) | 9 (6.6%) |
| Construction | 436 (93.2%) | 32 (6.8%) |
| Manufacturing | 283 (72.2%) | 109 (27.8%) |
| Wholesale Trade | 135 (89.4%) | 16 (10.6%) |
| Retail Trade | 363 (58.1%) | 262 (41.9%) |
| Transportation & Warehousing | 250 (94.0%) | 16 (6.0%) |
| Utilities | 25 (75.8%) | 8 (24.2%) |
| Information | 20 (37.7%) | 33 (62.3%) |
| Finance & Insurance | 19 (13.0%) | 127 (87.0%) |
| Real Estate, Rental & Leasing | 25 (20.3%) | 98 (79.7%) |
| Professional & Scientific | 85 (48.3%) | 91 (51.7%) |
| Enterprise Management | 0 (0.0%) | 0 (0.0%) |
| Administrative & Support | 182 (67.4%) | 88 (32.6%) |
| Educational Services | 70 (16.5%) | 355 (83.5%) |
| Health Care & Social Assistance | 110 (18.2%) | 494 (81.8%) |
| Arts, Entertainment & Recreation | 62 (51.7%) | 58 (48.3%) |
| Accommodation & Food Services | 195 (54.9%) | 160 (45.1%) |
| Public Administration | 90 (60.0%) | 60 (40.0%) |
| Total | 2,911 (55.8%) | 2,304 (44.2%) |
Education in Carbon County
School Enrollment in Carbon County
The most common levels of schooling among the 1,838 students in Carbon County are high school (482 | 26.2%), middle school (475 | 25.8%), and elementary school (375 | 20.4%).
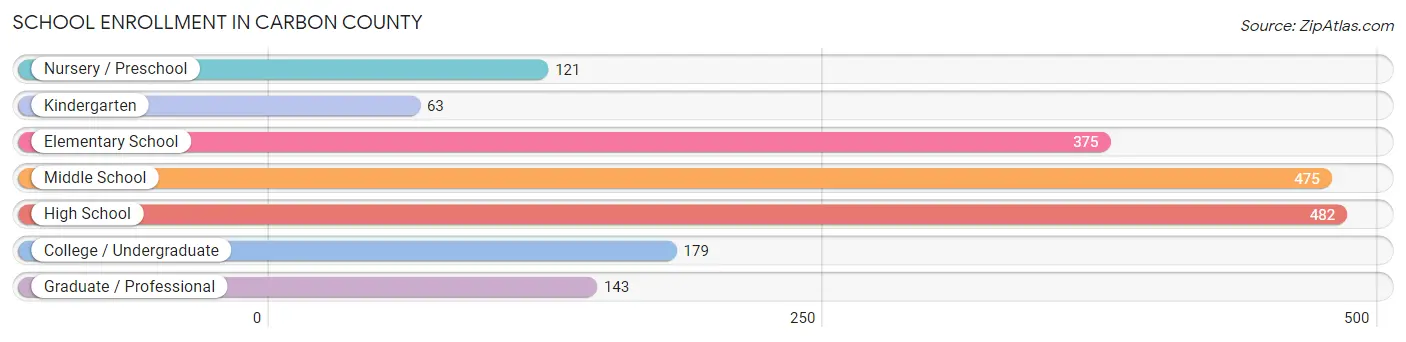
| School Level | # Students | % Students |
| Nursery / Preschool | 121 | 6.6% |
| Kindergarten | 63 | 3.4% |
| Elementary School | 375 | 20.4% |
| Middle School | 475 | 25.8% |
| High School | 482 | 26.2% |
| College / Undergraduate | 179 | 9.7% |
| Graduate / Professional | 143 | 7.8% |
| Total | 1,838 | 100.0% |
School Enrollment by Age by Funding Source in Carbon County
Out of a total of 1,838 students who are enrolled in schools in Carbon County, 289 (15.7%) attend a private institution, while the remaining 1,549 (84.3%) are enrolled in public schools. The age group of 25 to 34 year olds has the highest likelihood of being enrolled in private schools, with 18 (75.0% in the age bracket) enrolled. Conversely, the age group of 20 to 24 year olds has the lowest likelihood of being enrolled in a private school, with 31 (100.0% in the age bracket) attending a public institution.
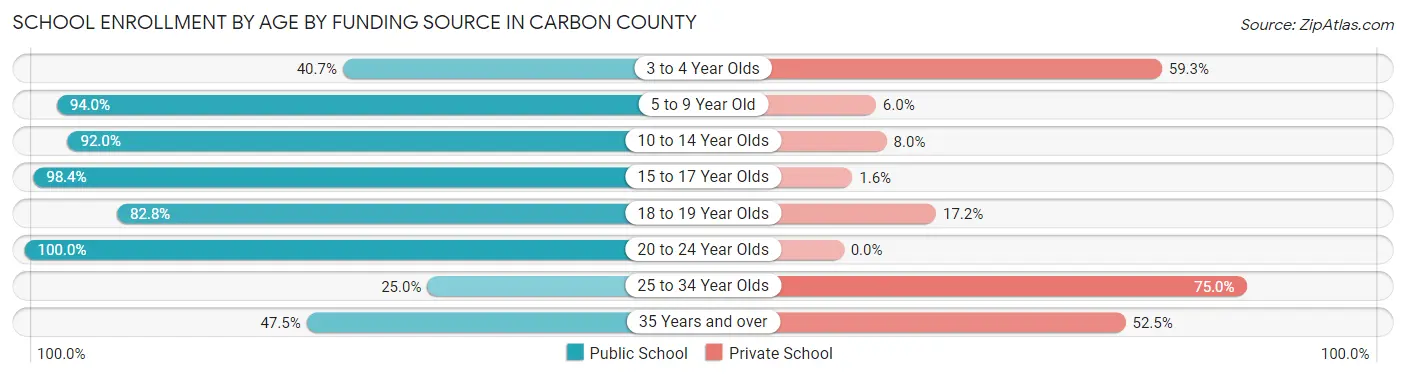
| Age Bracket | Public School | Private School |
| 3 to 4 Year Olds | 33 (40.7%) | 48 (59.3%) |
| 5 to 9 Year Old | 407 (94.0%) | 26 (6.0%) |
| 10 to 14 Year Olds | 494 (92.0%) | 43 (8.0%) |
| 15 to 17 Year Olds | 364 (98.4%) | 6 (1.6%) |
| 18 to 19 Year Olds | 101 (82.8%) | 21 (17.2%) |
| 20 to 24 Year Olds | 31 (100.0%) | 0 (0.0%) |
| 25 to 34 Year Olds | 6 (25.0%) | 18 (75.0%) |
| 35 Years and over | 114 (47.5%) | 126 (52.5%) |
| Total | 1,549 (84.3%) | 289 (15.7%) |
Educational Attainment by Field of Study in Carbon County
Education (640 | 22.9%), business (353 | 12.6%), bio, nature & agricultural (275 | 9.8%), engineering (233 | 8.3%), and social sciences (225 | 8.0%) are the most common fields of study among 2,797 individuals in Carbon County who have obtained a bachelor's degree or higher.
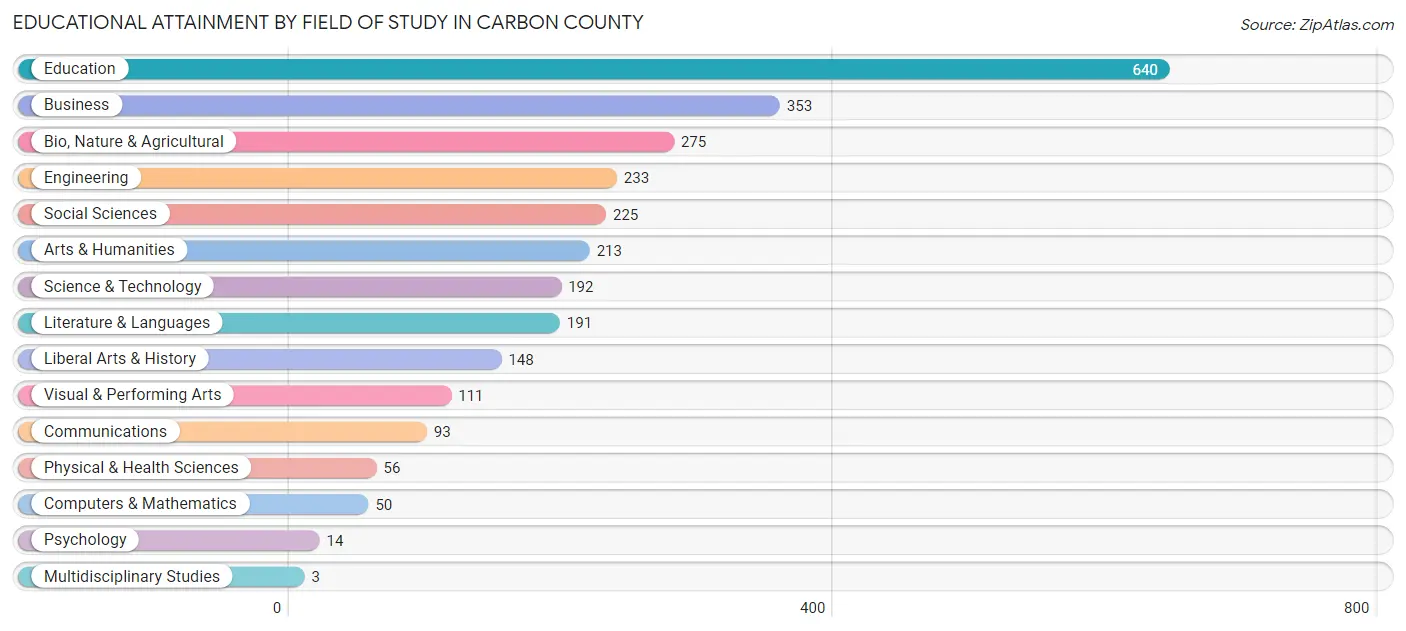
| Field of Study | # Graduates | % Graduates |
| Computers & Mathematics | 50 | 1.8% |
| Bio, Nature & Agricultural | 275 | 9.8% |
| Physical & Health Sciences | 56 | 2.0% |
| Psychology | 14 | 0.5% |
| Social Sciences | 225 | 8.0% |
| Engineering | 233 | 8.3% |
| Multidisciplinary Studies | 3 | 0.1% |
| Science & Technology | 192 | 6.9% |
| Business | 353 | 12.6% |
| Education | 640 | 22.9% |
| Literature & Languages | 191 | 6.8% |
| Liberal Arts & History | 148 | 5.3% |
| Visual & Performing Arts | 111 | 4.0% |
| Communications | 93 | 3.3% |
| Arts & Humanities | 213 | 7.6% |
| Total | 2,797 | 100.0% |
Transportation & Commute in Carbon County
Vehicle Availability by Sex in Carbon County
The most prevalent vehicle ownership categories in Carbon County are males with 2 vehicles (848, accounting for 29.5%) and females with 2 vehicles (590, making up 37.8%).
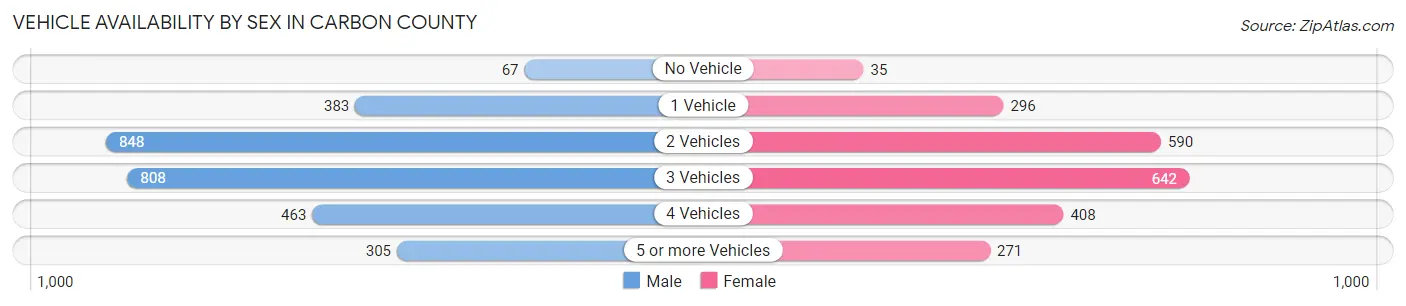
| Vehicles Available | Male | Female |
| No Vehicle | 67 (2.3%) | 35 (1.6%) |
| 1 Vehicle | 383 (13.3%) | 296 (13.2%) |
| 2 Vehicles | 848 (29.5%) | 590 (26.3%) |
| 3 Vehicles | 808 (28.1%) | 642 (28.6%) |
| 4 Vehicles | 463 (16.1%) | 408 (18.2%) |
| 5 or more Vehicles | 305 (10.6%) | 271 (12.1%) |
| Total | 2,874 (100.0%) | 2,242 (100.0%) |
Commute Time in Carbon County
The most frequently occuring commute durations in Carbon County are 5 to 9 minutes (840 commuters, 18.2%), less than 5 minutes (593 commuters, 12.9%), and 10 to 14 minutes (527 commuters, 11.5%).
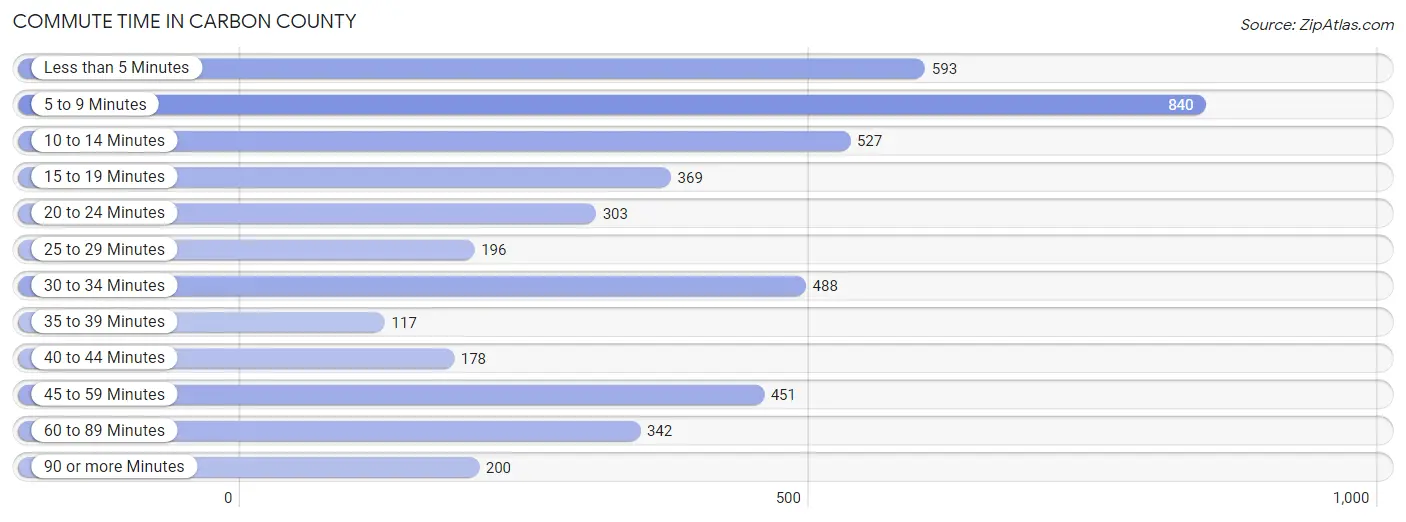
| Commute Time | # Commuters | % Commuters |
| Less than 5 Minutes | 593 | 12.9% |
| 5 to 9 Minutes | 840 | 18.2% |
| 10 to 14 Minutes | 527 | 11.5% |
| 15 to 19 Minutes | 369 | 8.0% |
| 20 to 24 Minutes | 303 | 6.6% |
| 25 to 29 Minutes | 196 | 4.3% |
| 30 to 34 Minutes | 488 | 10.6% |
| 35 to 39 Minutes | 117 | 2.5% |
| 40 to 44 Minutes | 178 | 3.9% |
| 45 to 59 Minutes | 451 | 9.8% |
| 60 to 89 Minutes | 342 | 7.4% |
| 90 or more Minutes | 200 | 4.3% |
Commute Time by Sex in Carbon County
The most common commute times in Carbon County are 5 to 9 minutes (378 commuters, 14.3%) for males and 5 to 9 minutes (462 commuters, 23.6%) for females.
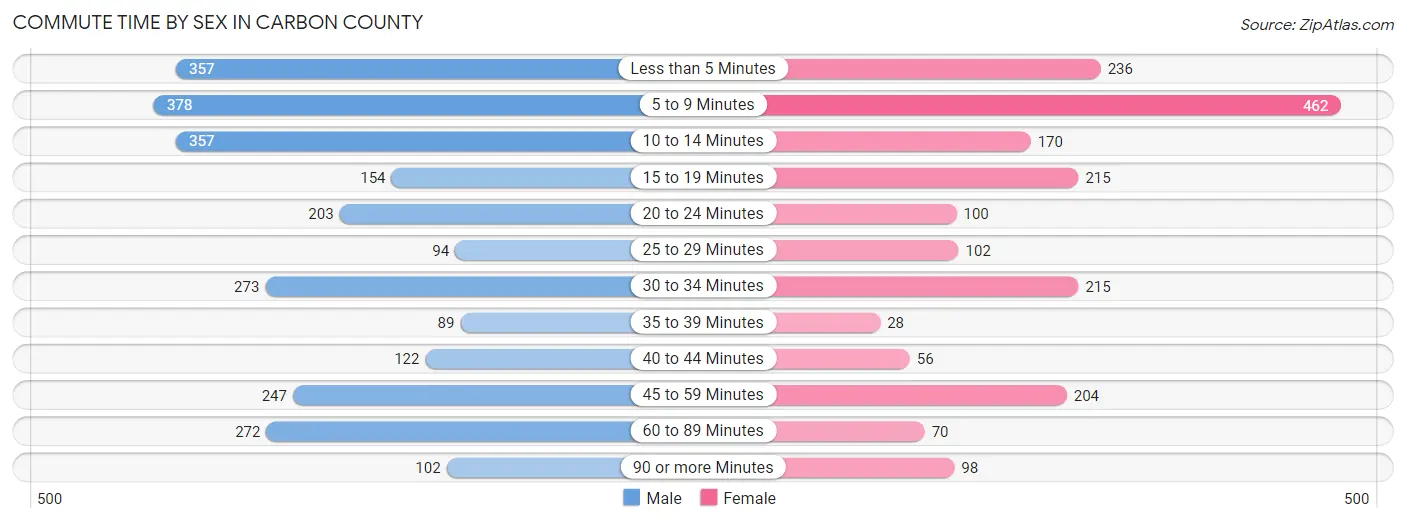
| Commute Time | Male | Female |
| Less than 5 Minutes | 357 (13.5%) | 236 (12.1%) |
| 5 to 9 Minutes | 378 (14.3%) | 462 (23.6%) |
| 10 to 14 Minutes | 357 (13.5%) | 170 (8.7%) |
| 15 to 19 Minutes | 154 (5.8%) | 215 (11.0%) |
| 20 to 24 Minutes | 203 (7.7%) | 100 (5.1%) |
| 25 to 29 Minutes | 94 (3.5%) | 102 (5.2%) |
| 30 to 34 Minutes | 273 (10.3%) | 215 (11.0%) |
| 35 to 39 Minutes | 89 (3.4%) | 28 (1.4%) |
| 40 to 44 Minutes | 122 (4.6%) | 56 (2.9%) |
| 45 to 59 Minutes | 247 (9.3%) | 204 (10.4%) |
| 60 to 89 Minutes | 272 (10.3%) | 70 (3.6%) |
| 90 or more Minutes | 102 (3.8%) | 98 (5.0%) |
Time of Departure to Work by Sex in Carbon County
The most frequent times of departure to work in Carbon County are 5:30 AM to 5:59 AM (417, 15.8%) for males and 7:30 AM to 7:59 AM (375, 19.2%) for females.
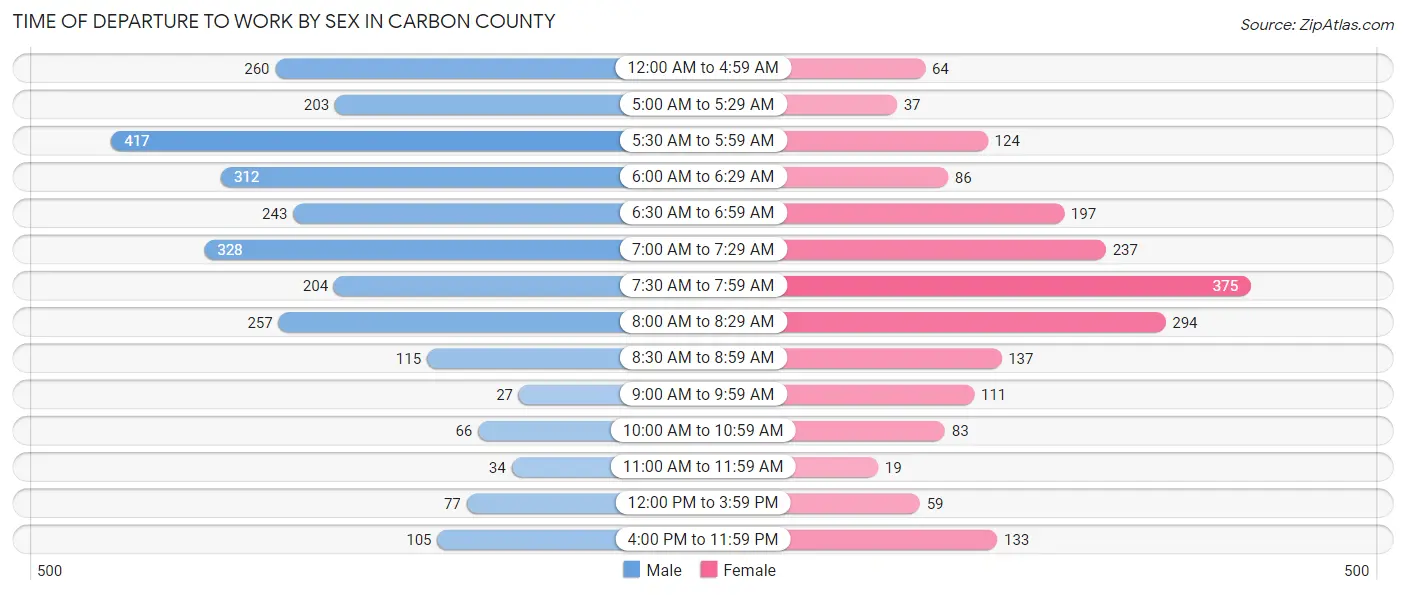
| Time of Departure | Male | Female |
| 12:00 AM to 4:59 AM | 260 (9.8%) | 64 (3.3%) |
| 5:00 AM to 5:29 AM | 203 (7.7%) | 37 (1.9%) |
| 5:30 AM to 5:59 AM | 417 (15.8%) | 124 (6.3%) |
| 6:00 AM to 6:29 AM | 312 (11.8%) | 86 (4.4%) |
| 6:30 AM to 6:59 AM | 243 (9.2%) | 197 (10.1%) |
| 7:00 AM to 7:29 AM | 328 (12.4%) | 237 (12.1%) |
| 7:30 AM to 7:59 AM | 204 (7.7%) | 375 (19.2%) |
| 8:00 AM to 8:29 AM | 257 (9.7%) | 294 (15.0%) |
| 8:30 AM to 8:59 AM | 115 (4.3%) | 137 (7.0%) |
| 9:00 AM to 9:59 AM | 27 (1.0%) | 111 (5.7%) |
| 10:00 AM to 10:59 AM | 66 (2.5%) | 83 (4.2%) |
| 11:00 AM to 11:59 AM | 34 (1.3%) | 19 (1.0%) |
| 12:00 PM to 3:59 PM | 77 (2.9%) | 59 (3.0%) |
| 4:00 PM to 11:59 PM | 105 (4.0%) | 133 (6.8%) |
| Total | 2,648 (100.0%) | 1,956 (100.0%) |
Housing Occupancy in Carbon County
Occupancy by Ownership in Carbon County
Of the total 4,650 dwellings in Carbon County, owner-occupied units account for 3,432 (73.8%), while renter-occupied units make up 1,218 (26.2%).
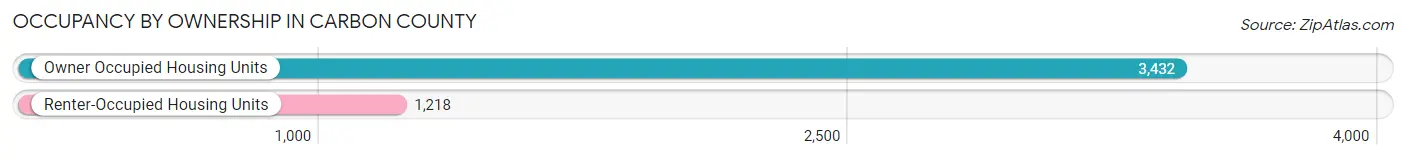
| Occupancy | # Housing Units | % Housing Units |
| Owner Occupied Housing Units | 3,432 | 73.8% |
| Renter-Occupied Housing Units | 1,218 | 26.2% |
| Total Occupied Housing Units | 4,650 | 100.0% |
Occupancy by Household Size in Carbon County
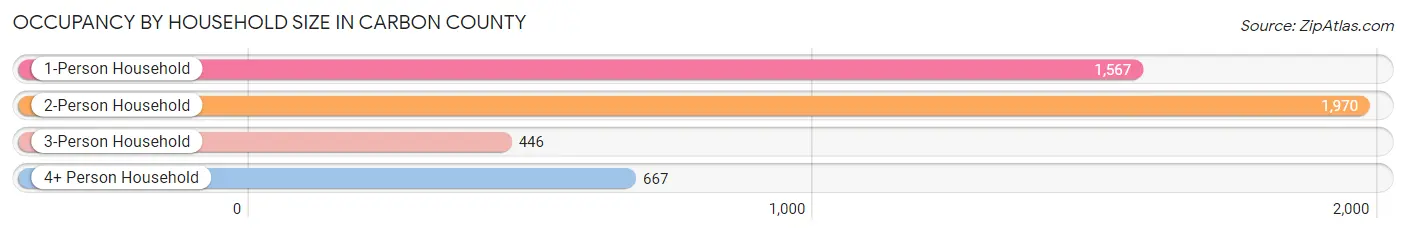
| Household Size | # Housing Units | % Housing Units |
| 1-Person Household | 1,567 | 33.7% |
| 2-Person Household | 1,970 | 42.4% |
| 3-Person Household | 446 | 9.6% |
| 4+ Person Household | 667 | 14.3% |
| Total Housing Units | 4,650 | 100.0% |
Occupancy by Ownership by Household Size in Carbon County
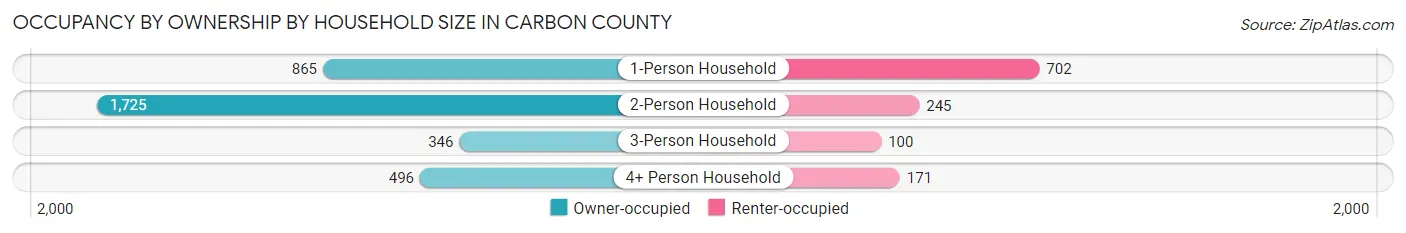
| Household Size | Owner-occupied | Renter-occupied |
| 1-Person Household | 865 (55.2%) | 702 (44.8%) |
| 2-Person Household | 1,725 (87.6%) | 245 (12.4%) |
| 3-Person Household | 346 (77.6%) | 100 (22.4%) |
| 4+ Person Household | 496 (74.4%) | 171 (25.6%) |
| Total Housing Units | 3,432 (73.8%) | 1,218 (26.2%) |
Occupancy by Educational Attainment in Carbon County
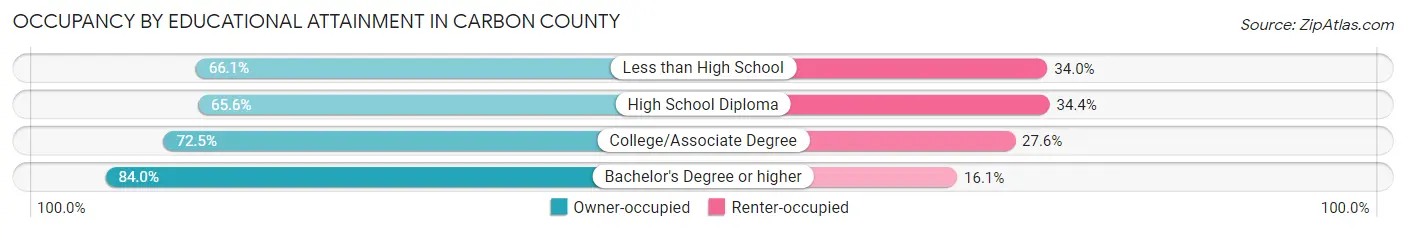
| Household Size | Owner-occupied | Renter-occupied |
| Less than High School | 107 (66.0%) | 55 (34.0%) |
| High School Diploma | 971 (65.6%) | 509 (34.4%) |
| College/Associate Degree | 1,078 (72.5%) | 410 (27.6%) |
| Bachelor's Degree or higher | 1,276 (84.0%) | 244 (16.1%) |
Occupancy by Age of Householder in Carbon County
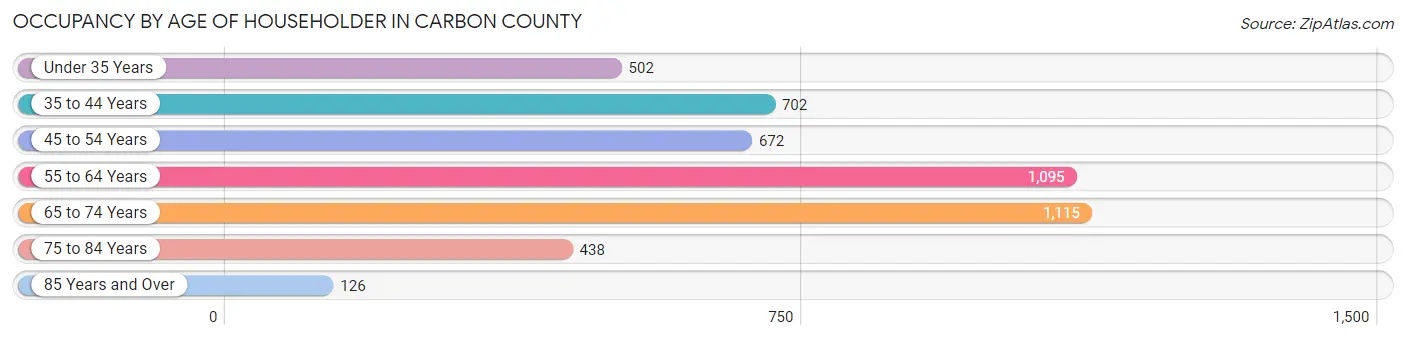
| Age Bracket | # Households | % Households |
| Under 35 Years | 502 | 10.8% |
| 35 to 44 Years | 702 | 15.1% |
| 45 to 54 Years | 672 | 14.4% |
| 55 to 64 Years | 1,095 | 23.5% |
| 65 to 74 Years | 1,115 | 24.0% |
| 75 to 84 Years | 438 | 9.4% |
| 85 Years and Over | 126 | 2.7% |
| Total | 4,650 | 100.0% |
Housing Finances in Carbon County
Median Income by Occupancy in Carbon County
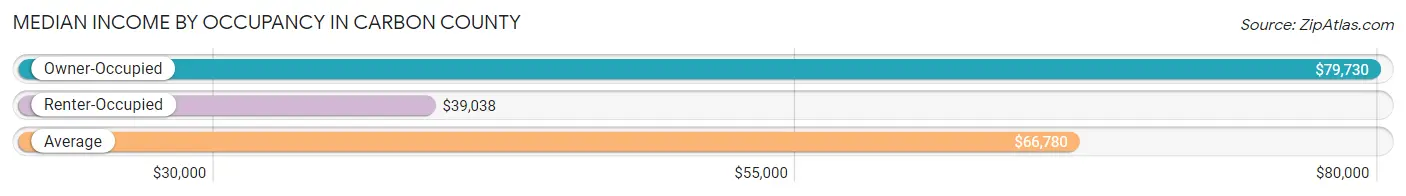
| Occupancy Type | # Households | Median Income |
| Owner-Occupied | 3,432 (73.8%) | $79,730 |
| Renter-Occupied | 1,218 (26.2%) | $39,038 |
| Average | 4,650 (100.0%) | $66,780 |
Occupancy by Householder Income Bracket in Carbon County
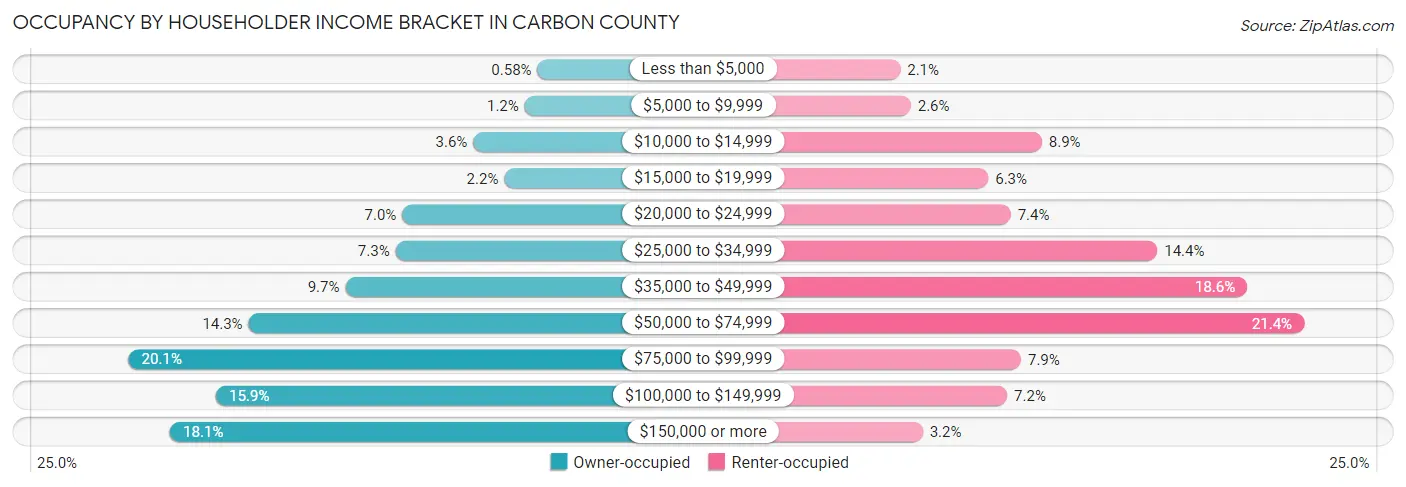
| Income Bracket | Owner-occupied | Renter-occupied |
| Less than $5,000 | 20 (0.6%) | 26 (2.1%) |
| $5,000 to $9,999 | 41 (1.2%) | 32 (2.6%) |
| $10,000 to $14,999 | 125 (3.6%) | 108 (8.9%) |
| $15,000 to $19,999 | 74 (2.2%) | 77 (6.3%) |
| $20,000 to $24,999 | 241 (7.0%) | 90 (7.4%) |
| $25,000 to $34,999 | 252 (7.3%) | 175 (14.4%) |
| $35,000 to $49,999 | 334 (9.7%) | 227 (18.6%) |
| $50,000 to $74,999 | 492 (14.3%) | 260 (21.3%) |
| $75,000 to $99,999 | 688 (20.1%) | 96 (7.9%) |
| $100,000 to $149,999 | 545 (15.9%) | 88 (7.2%) |
| $150,000 or more | 620 (18.1%) | 39 (3.2%) |
| Total | 3,432 (100.0%) | 1,218 (100.0%) |
Monthly Housing Cost Tiers in Carbon County
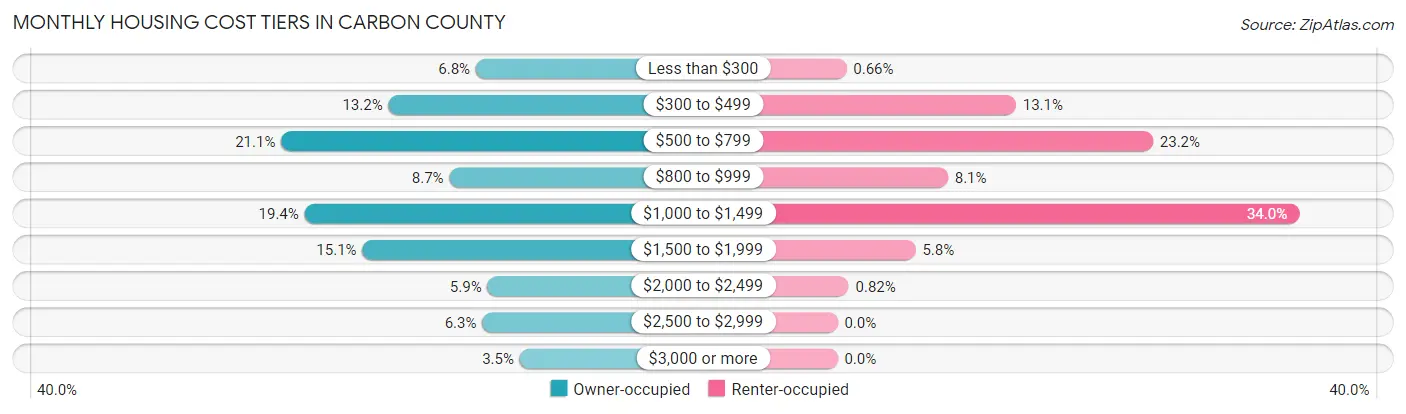
| Monthly Cost | Owner-occupied | Renter-occupied |
| Less than $300 | 232 (6.8%) | 8 (0.7%) |
| $300 to $499 | 453 (13.2%) | 160 (13.1%) |
| $500 to $799 | 724 (21.1%) | 283 (23.2%) |
| $800 to $999 | 299 (8.7%) | 99 (8.1%) |
| $1,000 to $1,499 | 665 (19.4%) | 414 (34.0%) |
| $1,500 to $1,999 | 519 (15.1%) | 70 (5.8%) |
| $2,000 to $2,499 | 203 (5.9%) | 10 (0.8%) |
| $2,500 to $2,999 | 216 (6.3%) | 0 (0.0%) |
| $3,000 or more | 121 (3.5%) | 0 (0.0%) |
| Total | 3,432 (100.0%) | 1,218 (100.0%) |
Physical Housing Characteristics in Carbon County
Housing Structures in Carbon County
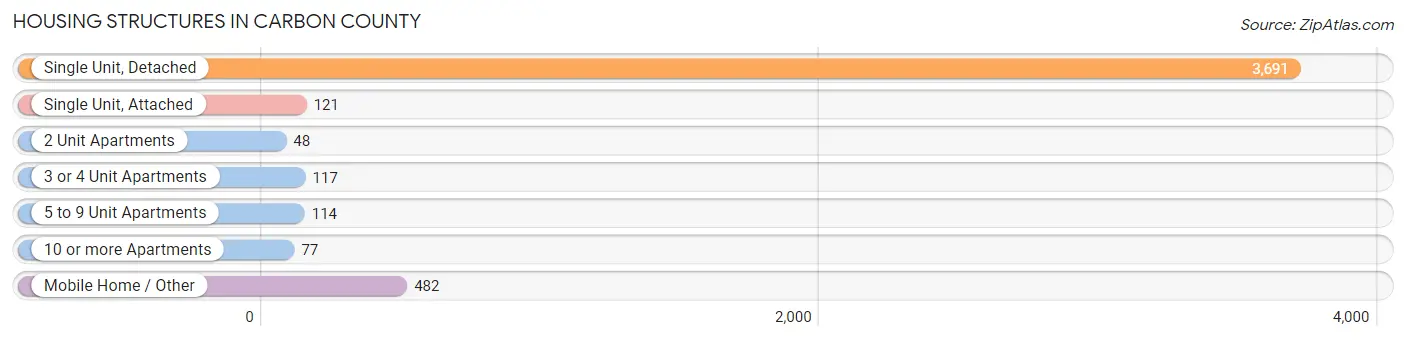
| Structure Type | # Housing Units | % Housing Units |
| Single Unit, Detached | 3,691 | 79.4% |
| Single Unit, Attached | 121 | 2.6% |
| 2 Unit Apartments | 48 | 1.0% |
| 3 or 4 Unit Apartments | 117 | 2.5% |
| 5 to 9 Unit Apartments | 114 | 2.5% |
| 10 or more Apartments | 77 | 1.7% |
| Mobile Home / Other | 482 | 10.4% |
| Total | 4,650 | 100.0% |
Housing Structures by Occupancy in Carbon County
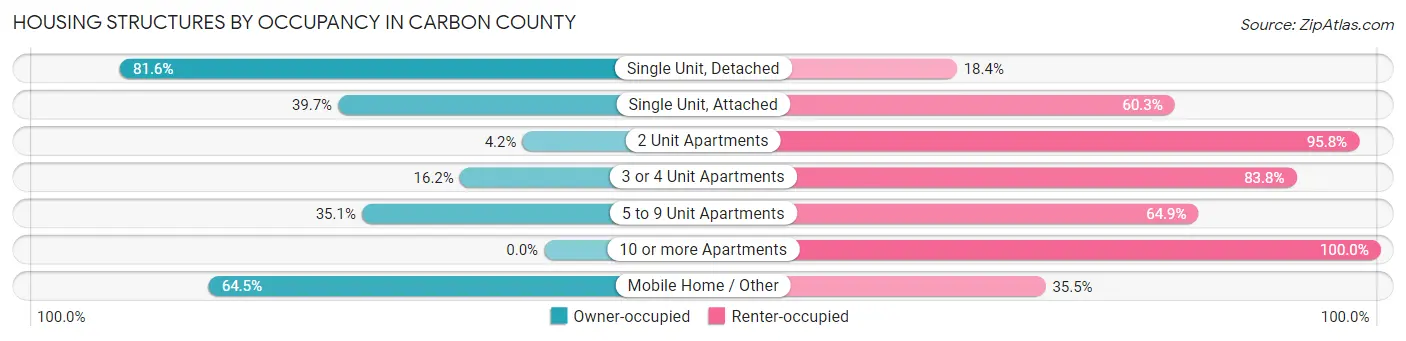
| Structure Type | Owner-occupied | Renter-occupied |
| Single Unit, Detached | 3,012 (81.6%) | 679 (18.4%) |
| Single Unit, Attached | 48 (39.7%) | 73 (60.3%) |
| 2 Unit Apartments | 2 (4.2%) | 46 (95.8%) |
| 3 or 4 Unit Apartments | 19 (16.2%) | 98 (83.8%) |
| 5 to 9 Unit Apartments | 40 (35.1%) | 74 (64.9%) |
| 10 or more Apartments | 0 (0.0%) | 77 (100.0%) |
| Mobile Home / Other | 311 (64.5%) | 171 (35.5%) |
| Total | 3,432 (73.8%) | 1,218 (26.2%) |
Housing Structures by Number of Rooms in Carbon County
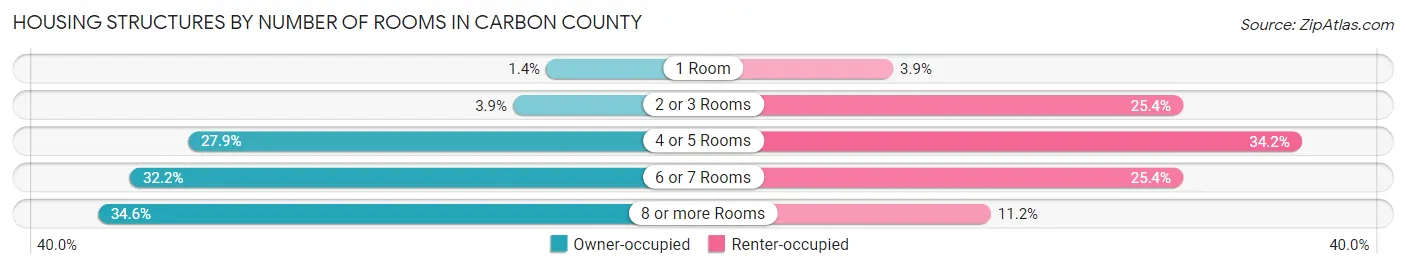
| Number of Rooms | Owner-occupied | Renter-occupied |
| 1 Room | 49 (1.4%) | 48 (3.9%) |
| 2 or 3 Rooms | 133 (3.9%) | 309 (25.4%) |
| 4 or 5 Rooms | 958 (27.9%) | 416 (34.2%) |
| 6 or 7 Rooms | 1,105 (32.2%) | 309 (25.4%) |
| 8 or more Rooms | 1,187 (34.6%) | 136 (11.2%) |
| Total | 3,432 (100.0%) | 1,218 (100.0%) |
Housing Structure by Heating Type in Carbon County
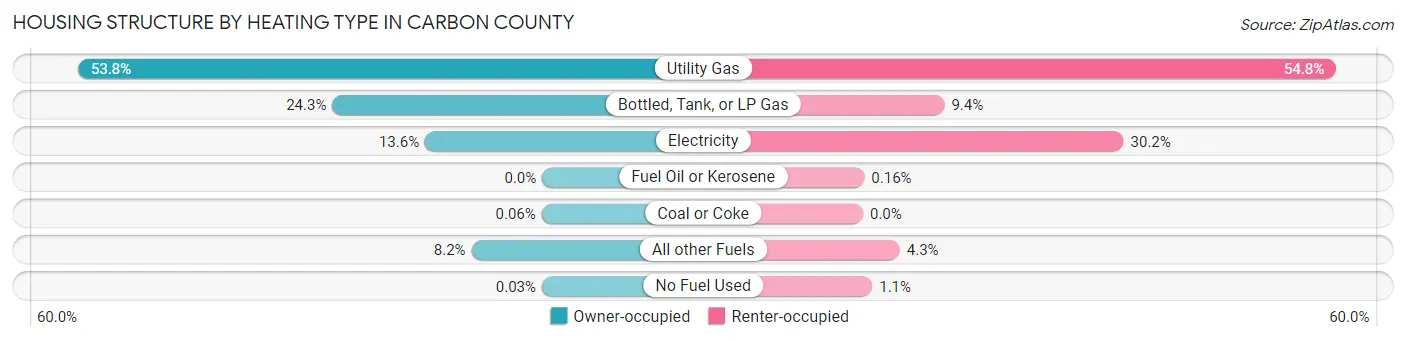
| Heating Type | Owner-occupied | Renter-occupied |
| Utility Gas | 1,847 (53.8%) | 668 (54.8%) |
| Bottled, Tank, or LP Gas | 835 (24.3%) | 115 (9.4%) |
| Electricity | 466 (13.6%) | 368 (30.2%) |
| Fuel Oil or Kerosene | 0 (0.0%) | 2 (0.2%) |
| Coal or Coke | 2 (0.1%) | 0 (0.0%) |
| All other Fuels | 281 (8.2%) | 52 (4.3%) |
| No Fuel Used | 1 (0.0%) | 13 (1.1%) |
| Total | 3,432 (100.0%) | 1,218 (100.0%) |
Household Vehicle Usage in Carbon County
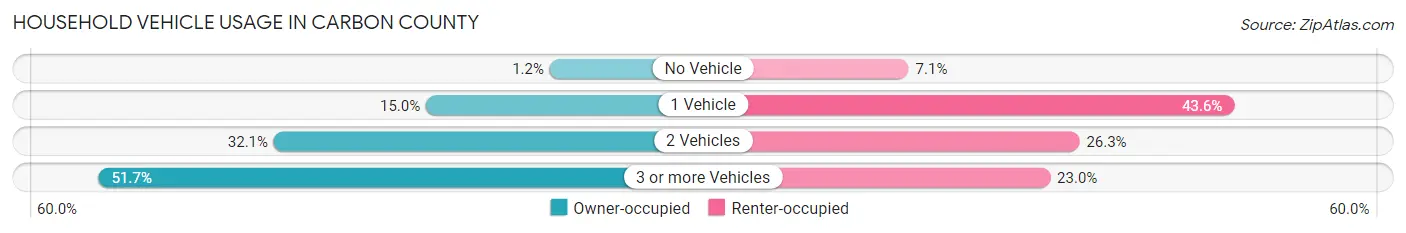
| Vehicles per Household | Owner-occupied | Renter-occupied |
| No Vehicle | 40 (1.2%) | 87 (7.1%) |
| 1 Vehicle | 516 (15.0%) | 531 (43.6%) |
| 2 Vehicles | 1,101 (32.1%) | 320 (26.3%) |
| 3 or more Vehicles | 1,775 (51.7%) | 280 (23.0%) |
| Total | 3,432 (100.0%) | 1,218 (100.0%) |
Real Estate & Mortgages in Carbon County
Real Estate and Mortgage Overview in Carbon County
| Characteristic | Without Mortgage | With Mortgage |
| Housing Units | 1,614 | 1,818 |
| Median Property Value | $336,500 | $369,000 |
| Median Household Income | $72,586 | $382 |
| Monthly Housing Costs | $536 | $121 |
| Real Estate Taxes | $2,150 | $77 |
Property Value by Mortgage Status in Carbon County
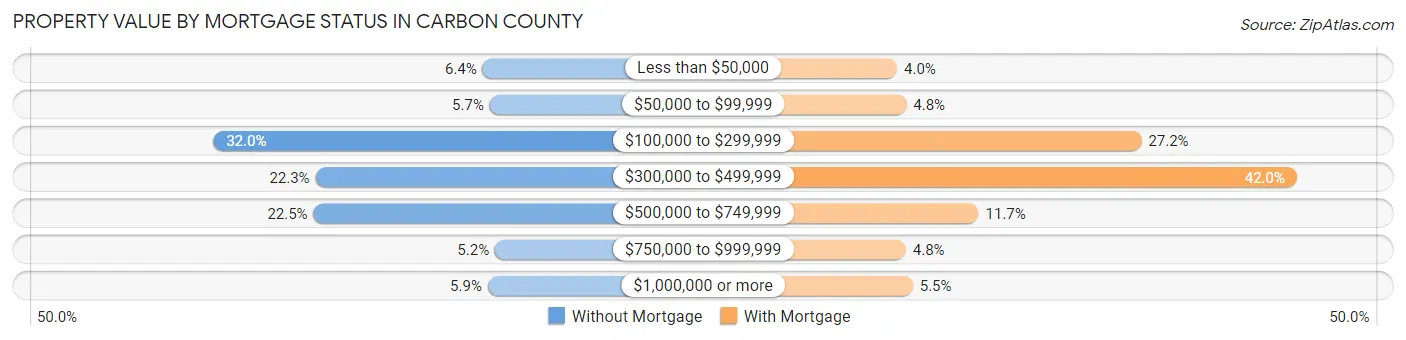
| Property Value | Without Mortgage | With Mortgage |
| Less than $50,000 | 103 (6.4%) | 72 (4.0%) |
| $50,000 to $99,999 | 92 (5.7%) | 88 (4.8%) |
| $100,000 to $299,999 | 517 (32.0%) | 495 (27.2%) |
| $300,000 to $499,999 | 360 (22.3%) | 764 (42.0%) |
| $500,000 to $749,999 | 363 (22.5%) | 213 (11.7%) |
| $750,000 to $999,999 | 84 (5.2%) | 87 (4.8%) |
| $1,000,000 or more | 95 (5.9%) | 99 (5.4%) |
| Total | 1,614 (100.0%) | 1,818 (100.0%) |
Household Income by Mortgage Status in Carbon County
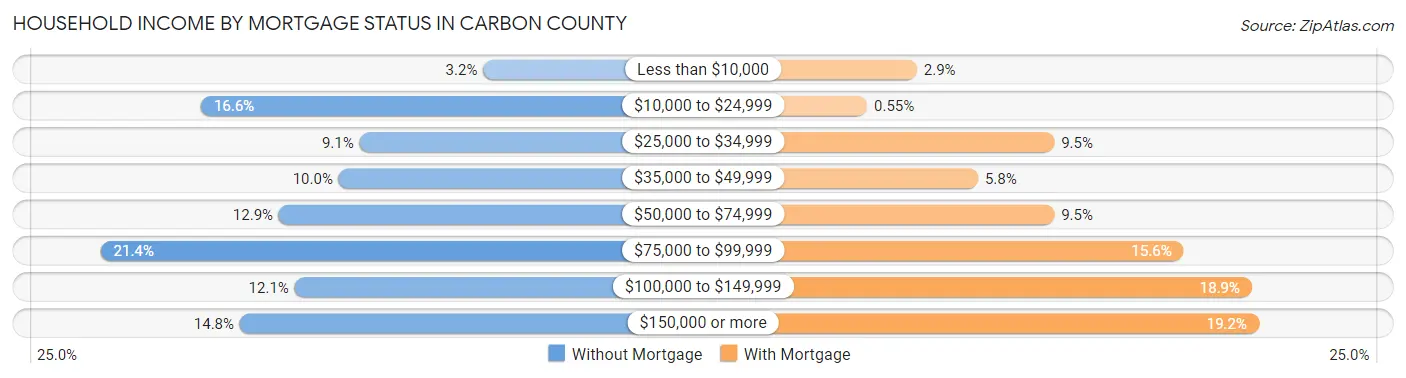
| Household Income | Without Mortgage | With Mortgage |
| Less than $10,000 | 51 (3.2%) | 53 (2.9%) |
| $10,000 to $24,999 | 268 (16.6%) | 10 (0.5%) |
| $25,000 to $34,999 | 146 (9.0%) | 172 (9.5%) |
| $35,000 to $49,999 | 162 (10.0%) | 106 (5.8%) |
| $50,000 to $74,999 | 208 (12.9%) | 172 (9.5%) |
| $75,000 to $99,999 | 345 (21.4%) | 284 (15.6%) |
| $100,000 to $149,999 | 196 (12.1%) | 343 (18.9%) |
| $150,000 or more | 238 (14.7%) | 349 (19.2%) |
| Total | 1,614 (100.0%) | 1,818 (100.0%) |
Property Value to Household Income Ratio in Carbon County
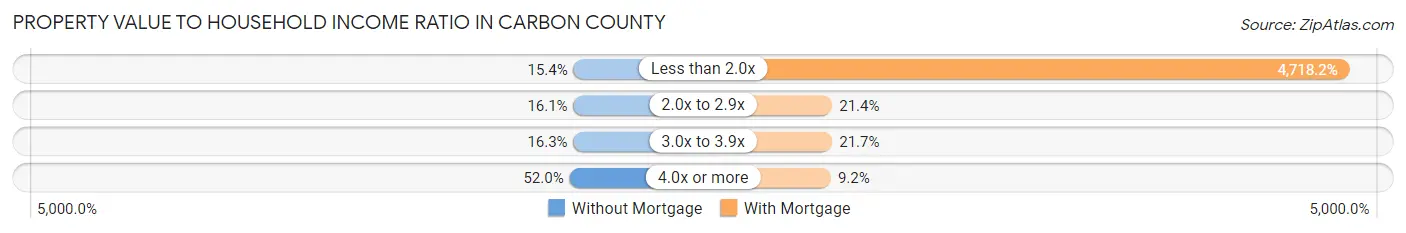
| Value-to-Income Ratio | Without Mortgage | With Mortgage |
| Less than 2.0x | 248 (15.4%) | 85,776 (4,718.1%) |
| 2.0x to 2.9x | 260 (16.1%) | 389 (21.4%) |
| 3.0x to 3.9x | 263 (16.3%) | 395 (21.7%) |
| 4.0x or more | 840 (52.0%) | 168 (9.2%) |
| Total | 1,614 (100.0%) | 1,818 (100.0%) |
Real Estate Taxes by Mortgage Status in Carbon County
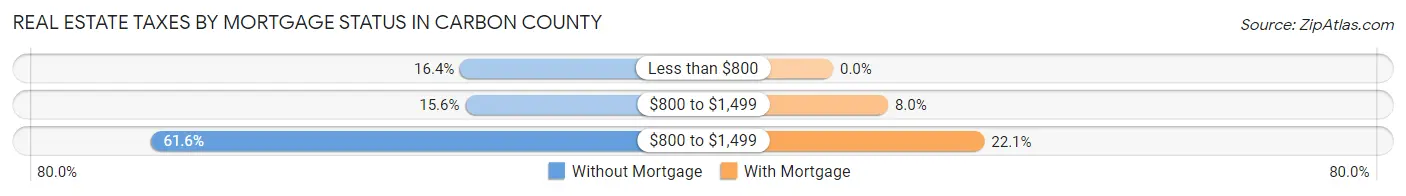
| Property Taxes | Without Mortgage | With Mortgage |
| Less than $800 | 264 (16.4%) | 0 (0.0%) |
| $800 to $1,499 | 252 (15.6%) | 146 (8.0%) |
| $800 to $1,499 | 994 (61.6%) | 402 (22.1%) |
| Total | 1,614 (100.0%) | 1,818 (100.0%) |
Health & Disability in Carbon County
Health Insurance Coverage by Age in Carbon County
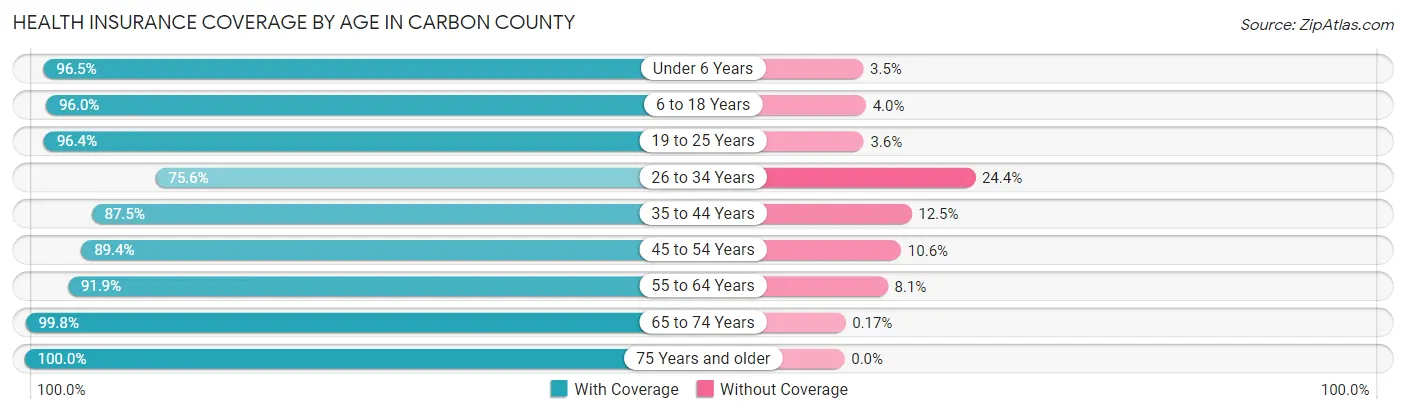
| Age Bracket | With Coverage | Without Coverage |
| Under 6 Years | 495 (96.5%) | 18 (3.5%) |
| 6 to 18 Years | 1,394 (96.0%) | 58 (4.0%) |
| 19 to 25 Years | 511 (96.4%) | 19 (3.6%) |
| 26 to 34 Years | 661 (75.6%) | 213 (24.4%) |
| 35 to 44 Years | 1,114 (87.5%) | 159 (12.5%) |
| 45 to 54 Years | 1,143 (89.4%) | 135 (10.6%) |
| 55 to 64 Years | 1,687 (91.9%) | 148 (8.1%) |
| 65 to 74 Years | 1,787 (99.8%) | 3 (0.2%) |
| 75 Years and older | 986 (100.0%) | 0 (0.0%) |
| Total | 9,778 (92.8%) | 753 (7.1%) |
Health Insurance Coverage by Citizenship Status in Carbon County
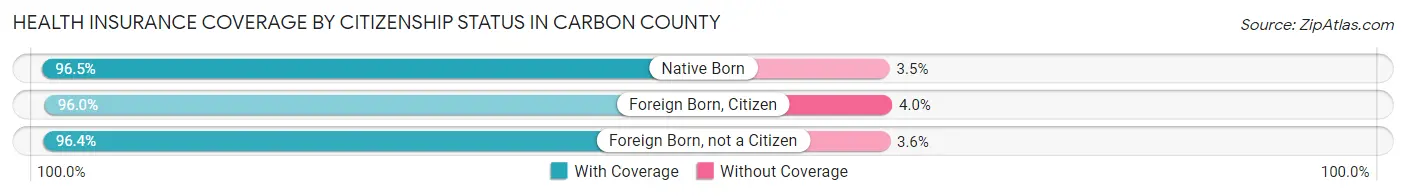
| Citizenship Status | With Coverage | Without Coverage |
| Native Born | 495 (96.5%) | 18 (3.5%) |
| Foreign Born, Citizen | 1,394 (96.0%) | 58 (4.0%) |
| Foreign Born, not a Citizen | 511 (96.4%) | 19 (3.6%) |
Health Insurance Coverage by Household Income in Carbon County
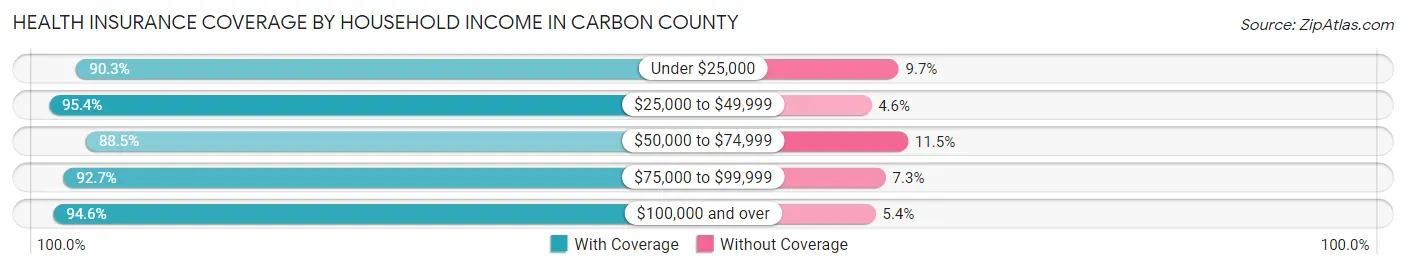
| Household Income | With Coverage | Without Coverage |
| Under $25,000 | 1,098 (90.3%) | 118 (9.7%) |
| $25,000 to $49,999 | 1,754 (95.4%) | 84 (4.6%) |
| $50,000 to $74,999 | 1,559 (88.5%) | 202 (11.5%) |
| $75,000 to $99,999 | 1,986 (92.7%) | 156 (7.3%) |
| $100,000 and over | 3,357 (94.6%) | 191 (5.4%) |
Public vs Private Health Insurance Coverage by Age in Carbon County
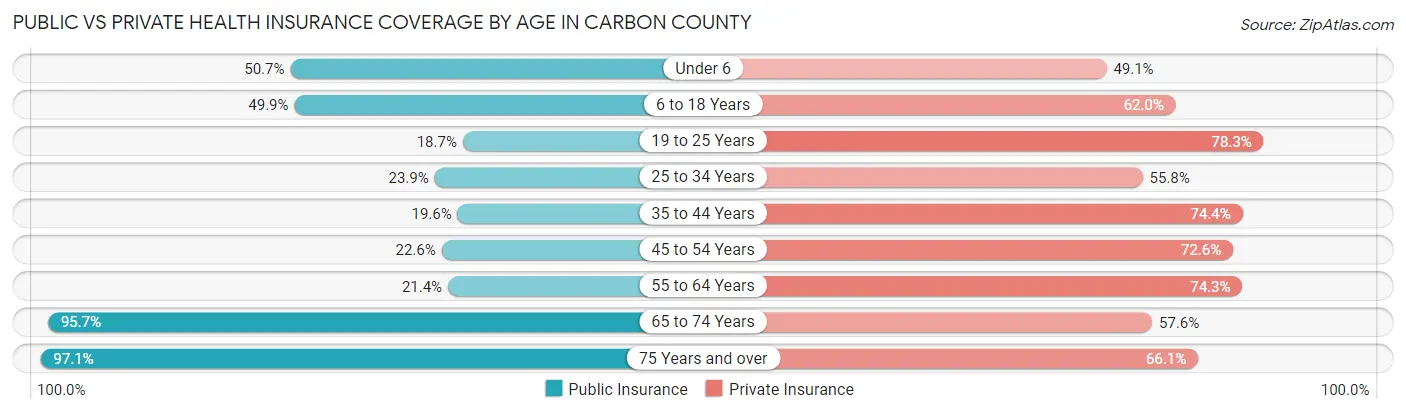
| Age Bracket | Public Insurance | Private Insurance |
| Under 6 | 260 (50.7%) | 252 (49.1%) |
| 6 to 18 Years | 725 (49.9%) | 900 (62.0%) |
| 19 to 25 Years | 99 (18.7%) | 415 (78.3%) |
| 25 to 34 Years | 209 (23.9%) | 488 (55.8%) |
| 35 to 44 Years | 250 (19.6%) | 947 (74.4%) |
| 45 to 54 Years | 289 (22.6%) | 928 (72.6%) |
| 55 to 64 Years | 393 (21.4%) | 1,364 (74.3%) |
| 65 to 74 Years | 1,713 (95.7%) | 1,031 (57.6%) |
| 75 Years and over | 957 (97.1%) | 652 (66.1%) |
| Total | 4,895 (46.5%) | 6,977 (66.2%) |
Disability Status by Sex by Age in Carbon County
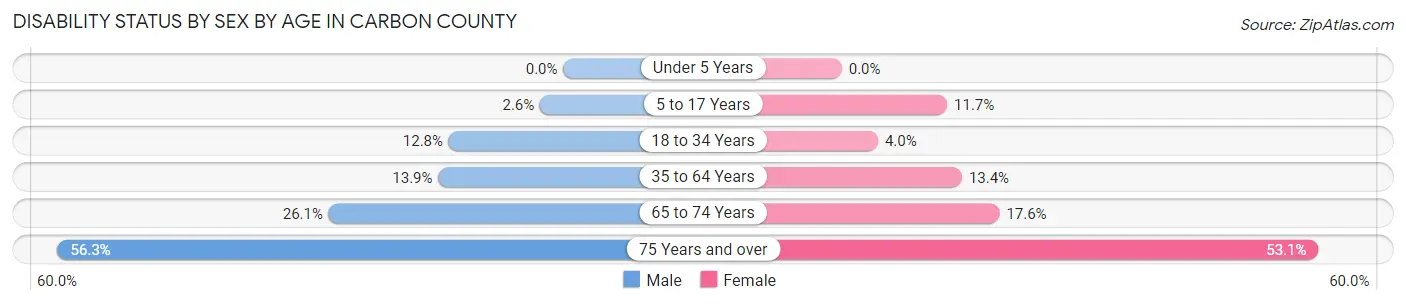
| Age Bracket | Male | Female |
| Under 5 Years | 0 (0.0%) | 0 (0.0%) |
| 5 to 17 Years | 19 (2.6%) | 88 (11.7%) |
| 18 to 34 Years | 101 (12.8%) | 29 (4.0%) |
| 35 to 64 Years | 313 (13.9%) | 286 (13.4%) |
| 65 to 74 Years | 234 (26.1%) | 157 (17.6%) |
| 75 Years and over | 289 (56.3%) | 251 (53.1%) |
Disability Class by Sex by Age in Carbon County
Disability Class: Hearing Difficulty
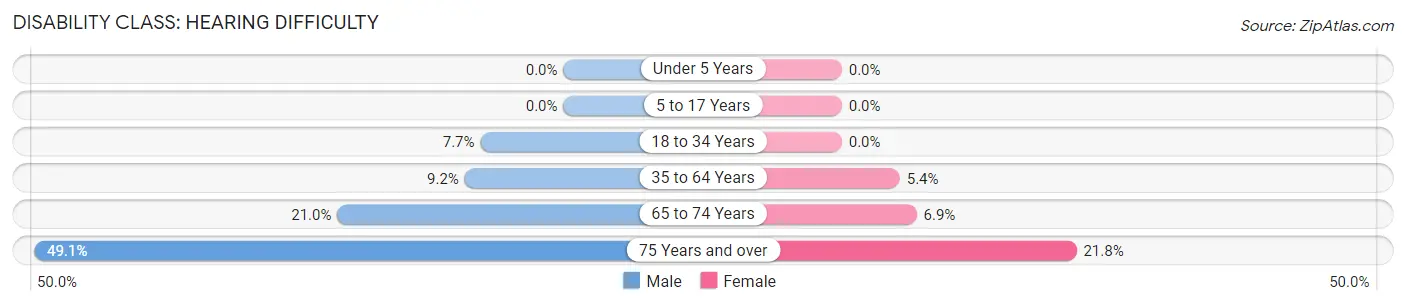
| Age Bracket | Male | Female |
| Under 5 Years | 0 (0.0%) | 0 (0.0%) |
| 5 to 17 Years | 0 (0.0%) | 0 (0.0%) |
| 18 to 34 Years | 61 (7.7%) | 0 (0.0%) |
| 35 to 64 Years | 206 (9.2%) | 115 (5.4%) |
| 65 to 74 Years | 188 (21.0%) | 62 (6.9%) |
| 75 Years and over | 252 (49.1%) | 103 (21.8%) |
Disability Class: Vision Difficulty
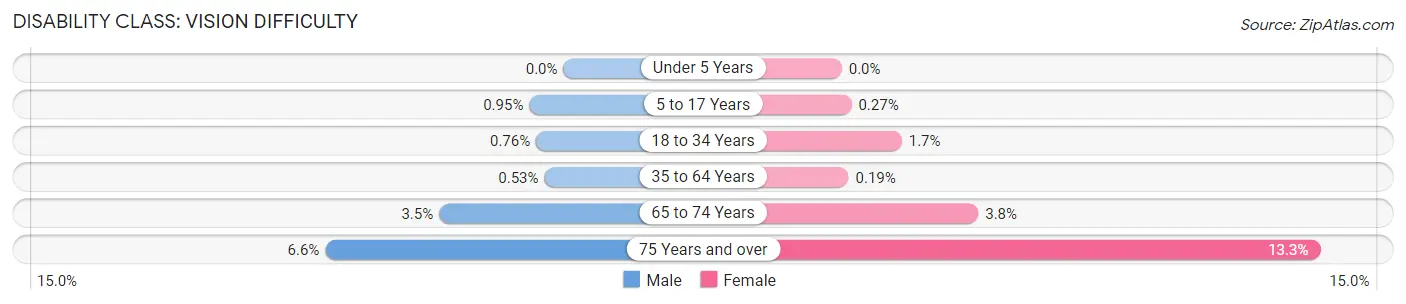
| Age Bracket | Male | Female |
| Under 5 Years | 0 (0.0%) | 0 (0.0%) |
| 5 to 17 Years | 7 (0.9%) | 2 (0.3%) |
| 18 to 34 Years | 6 (0.8%) | 12 (1.7%) |
| 35 to 64 Years | 12 (0.5%) | 4 (0.2%) |
| 65 to 74 Years | 31 (3.5%) | 34 (3.8%) |
| 75 Years and over | 34 (6.6%) | 63 (13.3%) |
Disability Class: Cognitive Difficulty
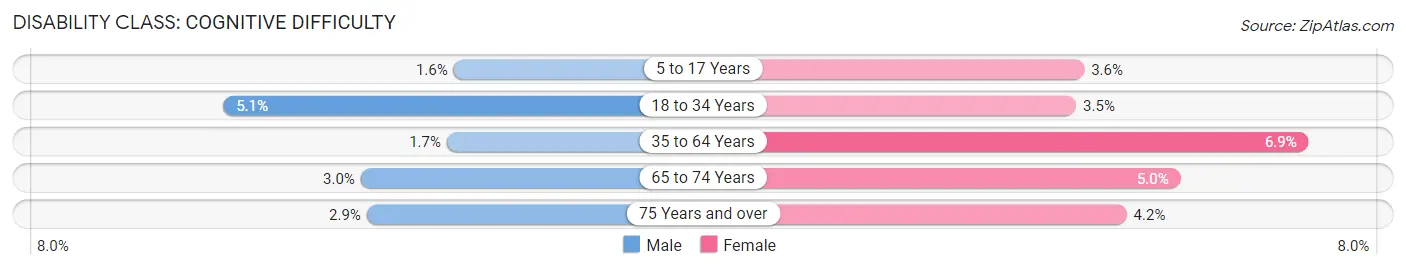
| Age Bracket | Male | Female |
| 5 to 17 Years | 12 (1.6%) | 27 (3.6%) |
| 18 to 34 Years | 40 (5.1%) | 25 (3.5%) |
| 35 to 64 Years | 39 (1.7%) | 148 (6.9%) |
| 65 to 74 Years | 27 (3.0%) | 45 (5.0%) |
| 75 Years and over | 15 (2.9%) | 20 (4.2%) |
Disability Class: Ambulatory Difficulty
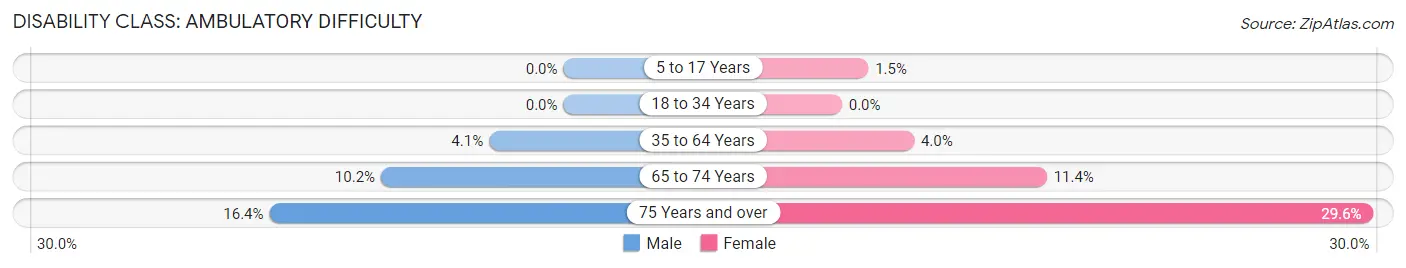
| Age Bracket | Male | Female |
| 5 to 17 Years | 0 (0.0%) | 11 (1.5%) |
| 18 to 34 Years | 0 (0.0%) | 0 (0.0%) |
| 35 to 64 Years | 93 (4.1%) | 86 (4.0%) |
| 65 to 74 Years | 91 (10.2%) | 102 (11.4%) |
| 75 Years and over | 84 (16.4%) | 140 (29.6%) |
Disability Class: Self-Care Difficulty
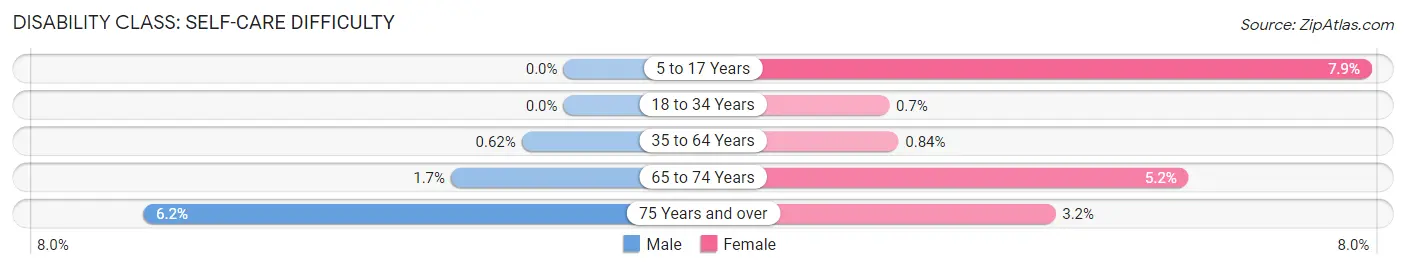
| Age Bracket | Male | Female |
| 5 to 17 Years | 0 (0.0%) | 59 (7.9%) |
| 18 to 34 Years | 0 (0.0%) | 5 (0.7%) |
| 35 to 64 Years | 14 (0.6%) | 18 (0.8%) |
| 65 to 74 Years | 15 (1.7%) | 46 (5.1%) |
| 75 Years and over | 32 (6.2%) | 15 (3.2%) |
Technology Access in Carbon County
Computing Device Access in Carbon County
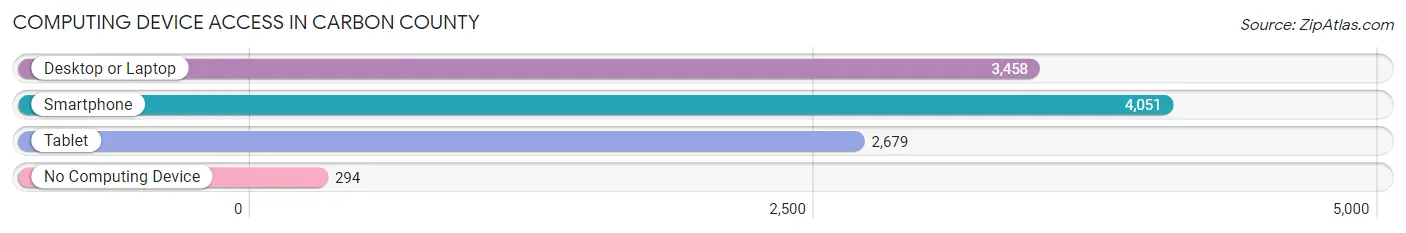
| Device Type | # Households | % Households |
| Desktop or Laptop | 3,458 | 74.4% |
| Smartphone | 4,051 | 87.1% |
| Tablet | 2,679 | 57.6% |
| No Computing Device | 294 | 6.3% |
| Total | 4,650 | 100.0% |
Internet Access in Carbon County
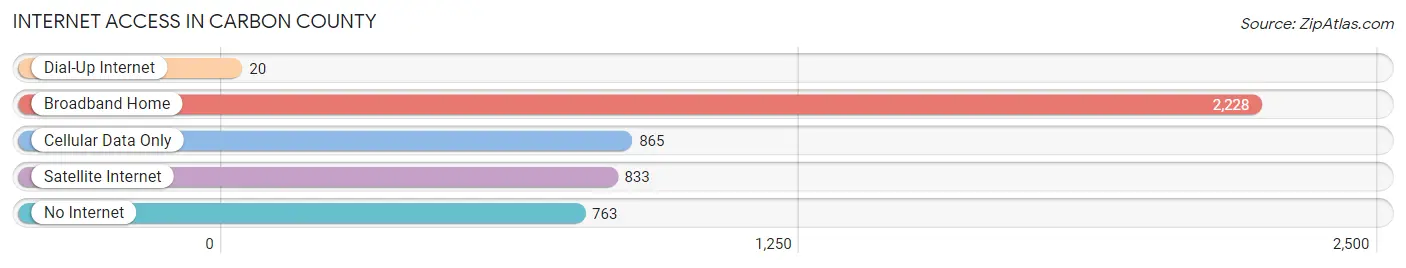
| Internet Type | # Households | % Households |
| Dial-Up Internet | 20 | 0.4% |
| Broadband Home | 2,228 | 47.9% |
| Cellular Data Only | 865 | 18.6% |
| Satellite Internet | 833 | 17.9% |
| No Internet | 763 | 16.4% |
| Total | 4,650 | 100.0% |
Carbon County Summary
Carbon County, Montana is located in the south-central part of the state and is bordered by Yellowstone National Park to the south, Park County to the east, Stillwater County to the north, and Sweet Grass County to the west. The county seat is Red Lodge, and the largest city is Bridger. Carbon County is home to a population of approximately 9,845 people, according to the 2010 census.
Geography
Carbon County is located in the south-central part of Montana and is bordered by Yellowstone National Park to the south, Park County to the east, Stillwater County to the north, and Sweet Grass County to the west. The county covers an area of 2,845 square miles and is the fourth largest county in the state. The county is divided into two distinct regions: the Beartooth Mountains to the west and the Pryor Mountains to the east. The Beartooth Mountains are part of the Rocky Mountains and are home to some of the highest peaks in the state, including Granite Peak, which is the highest point in Montana at 12,807 feet. The Pryor Mountains are part of the Great Plains and are home to the Pryor Mountain Wild Horse Range, which is home to a herd of wild horses.
The county is home to several rivers and streams, including the Clarks Fork of the Yellowstone River, the Stillwater River, and the Boulder River. The county is also home to several lakes, including the Red Lodge Reservoir, the Beartooth Lake, and the Boulder Lake.
Climate
Carbon County has a semi-arid climate, with hot summers and cold winters. The average annual temperature is 44.3°F, with an average high of 68.2°F in July and an average low of 20.4°F in January. The average annual precipitation is 16.3 inches, with an average of 28.3 inches of snowfall per year.
Economy
The economy of Carbon County is largely based on agriculture, tourism, and energy production. Agriculture is the largest sector of the economy, with the majority of the county’s land being used for ranching and farming. The county is home to several large ranches, including the Red Lodge Ranch, the Beartooth Ranch, and the Pryor Mountain Ranch.
Tourism is also an important part of the economy, with the county being home to several popular tourist attractions, including the Beartooth Highway, the Red Lodge Ski Area, and the Pryor Mountain Wild Horse Range.
Energy production is also an important part of the economy, with the county being home to several coal mines and natural gas wells. The county is also home to several wind farms, which provide energy to the region.
Demographics
According to the 2010 census, Carbon County has a population of 9,845 people. The population is spread out with a median age of 44.3 years. The racial makeup of the county is 94.3% White, 0.7% Native American, 0.3% Asian, 0.2% Black or African American, 0.1% Pacific Islander, and 4.4% from other races. The largest ancestry groups in the county are German (25.3%), Irish (17.2%), English (14.2%), Norwegian (10.2%), and Swedish (7.2%).
The median household income in Carbon County is $41,945, and the median family income is $50,945. The per capita income is $22,945. Approximately 11.3% of the population is below the poverty line.
Conclusion
Carbon County, Montana is located in the south-central part of the state and is bordered by Yellowstone National Park to the south, Park County to the east, Stillwater County to the north, and Sweet Grass County to the west. The county is home to a population of approximately 9,845 people, according to the 2010 census. The county is divided into two distinct regions: the Beartooth Mountains to the west and the Pryor Mountains to the east. The economy of Carbon County is largely based on agriculture, tourism, and energy production. The racial makeup of the county is 94.3% White, 0.7% Native American, 0.3% Asian, 0.2% Black or African American, 0.1% Pacific Islander, and 4.4% from other races. The median household income in Carbon County is $41,945, and the median family income is $50,945. Carbon County is a unique and diverse county with a rich history and culture.
Common Questions
What is Per Capita Income in Carbon County?
Per Capita income in Carbon County is $40,838.
What is the Median Family Income in Carbon County?
Median Family Income in Carbon County is $85,625.
What is the Median Household income in Carbon County?
Median Household Income in Carbon County is $66,780.
What is Income or Wage Gap in Carbon County?
Income or Wage Gap in Carbon County is 39.4%.
Women in Carbon County earn 60.6 cents for every dollar earned by a man.
What is Family Income Deficit in Carbon County?
Family Income Deficit in Carbon County is $7,326.
Families that are below poverty line in Carbon County earn $7,326 less on average than the poverty threshold level.
What is Inequality or Gini Index in Carbon County?
Inequality or Gini Index in Carbon County is 0.46.
What is the Total Population of Carbon County?
Total Population of Carbon County is 10,645.
What is the Total Male Population of Carbon County?
Total Male Population of Carbon County is 5,410.
What is the Total Female Population of Carbon County?
Total Female Population of Carbon County is 5,235.
What is the Ratio of Males per 100 Females in Carbon County?
There are 103.34 Males per 100 Females in Carbon County.
What is the Ratio of Females per 100 Males in Carbon County?
There are 96.77 Females per 100 Males in Carbon County.
What is the Median Population Age in Carbon County?
Median Population Age in Carbon County is 50.7 Years.
What is the Average Family Size in Carbon County
Average Family Size in Carbon County is 2.9 People.
What is the Average Household Size in Carbon County
Average Household Size in Carbon County is 2.3 People.
How Large is the Labor Force in Carbon County?
There are 5,506 People in the Labor Forcein in Carbon County.
What is the Percentage of People in the Labor Force in Carbon County?
61.1% of People are in the Labor Force in Carbon County.
What is the Unemployment Rate in Carbon County?
Unemployment Rate in Carbon County is 4.9%.