Valley County, MT Map & Demographics
Valley County Map
Valley County Overview
$30,941
PER CAPITA INCOME
$83,179
AVG FAMILY INCOME
$59,725
AVG HOUSEHOLD INCOME
25.2%
WAGE / INCOME GAP [ % ]
74.8¢/ $1
WAGE / INCOME GAP [ $ ]
0.41
INEQUALITY / GINI INDEX
7,552
TOTAL POPULATION
3,862
MALE POPULATION
3,690
FEMALE POPULATION
104.66
MALES / 100 FEMALES
95.55
FEMALES / 100 MALES
43.2
MEDIAN AGE
3.5
AVG FAMILY SIZE
2.6
AVG HOUSEHOLD SIZE
3,619
LABOR FORCE [ PEOPLE ]
60.1%
PERCENT IN LABOR FORCE
4.0%
UNEMPLOYMENT RATE
Valley County Area Codes
Income in Valley County
Income Overview in Valley County
Per Capita Income in Valley County is $30,941, while median incomes of families and households are $83,179 and $59,725 respectively.
| Characteristic | Number | Measure |
| Per Capita Income | 7,552 | $30,941 |
| Median Family Income | 1,713 | $83,179 |
| Mean Family Income | 1,713 | $92,656 |
| Median Household Income | 2,833 | $59,725 |
| Mean Household Income | 2,833 | $76,011 |
| Income Deficit | 1,713 | $0 |
| Wage / Income Gap (%) | 7,552 | 25.19% |
| Wage / Income Gap ($) | 7,552 | 74.81¢ per $1 |
| Gini / Inequality Index | 7,552 | 0.41 |
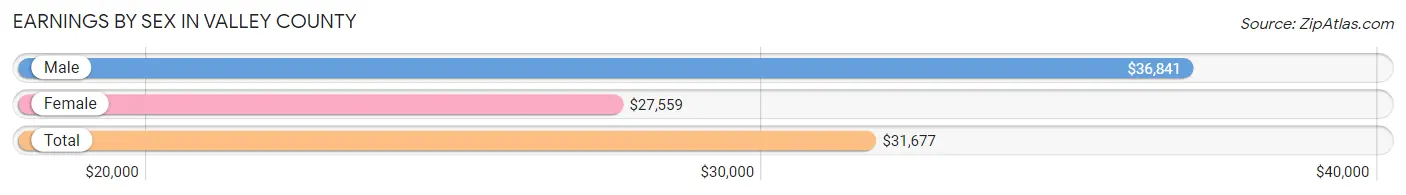
Earnings by Sex in Valley County
Average Earnings in Valley County are $31,677, $36,841 for men and $27,559 for women, a difference of 25.2%.
| Sex | Number | Average Earnings |
| Male | 2,119 (54.1%) | $36,841 |
| Female | 1,799 (45.9%) | $27,559 |
| Total | 3,918 (100.0%) | $31,677 |
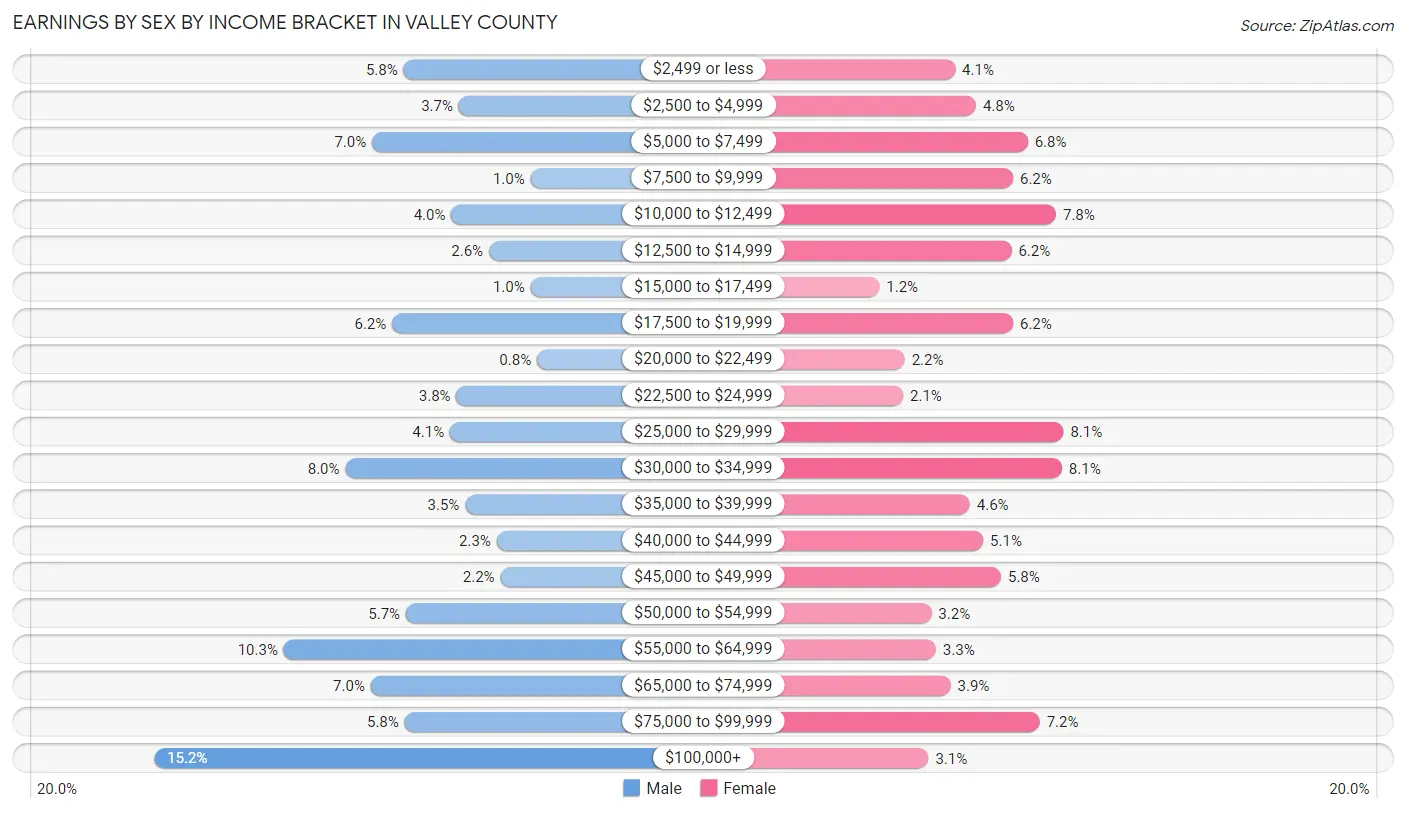
Earnings by Sex by Income Bracket in Valley County
The most common earnings brackets in Valley County are $100,000+ for men (321 | 15.1%) and $25,000 to $29,999 for women (146 | 8.1%).
| Income | Male | Female |
| $2,499 or less | 123 (5.8%) | 73 (4.1%) |
| $2,500 to $4,999 | 79 (3.7%) | 87 (4.8%) |
| $5,000 to $7,499 | 148 (7.0%) | 122 (6.8%) |
| $7,500 to $9,999 | 22 (1.0%) | 112 (6.2%) |
| $10,000 to $12,499 | 85 (4.0%) | 141 (7.8%) |
| $12,500 to $14,999 | 55 (2.6%) | 111 (6.2%) |
| $15,000 to $17,499 | 22 (1.0%) | 22 (1.2%) |
| $17,500 to $19,999 | 132 (6.2%) | 112 (6.2%) |
| $20,000 to $22,499 | 17 (0.8%) | 39 (2.2%) |
| $22,500 to $24,999 | 81 (3.8%) | 38 (2.1%) |
| $25,000 to $29,999 | 86 (4.1%) | 146 (8.1%) |
| $30,000 to $34,999 | 169 (8.0%) | 145 (8.1%) |
| $35,000 to $39,999 | 74 (3.5%) | 83 (4.6%) |
| $40,000 to $44,999 | 49 (2.3%) | 92 (5.1%) |
| $45,000 to $49,999 | 46 (2.2%) | 104 (5.8%) |
| $50,000 to $54,999 | 121 (5.7%) | 57 (3.2%) |
| $55,000 to $64,999 | 218 (10.3%) | 60 (3.3%) |
| $65,000 to $74,999 | 149 (7.0%) | 70 (3.9%) |
| $75,000 to $99,999 | 122 (5.8%) | 130 (7.2%) |
| $100,000+ | 321 (15.1%) | 55 (3.1%) |
| Total | 2,119 (100.0%) | 1,799 (100.0%) |
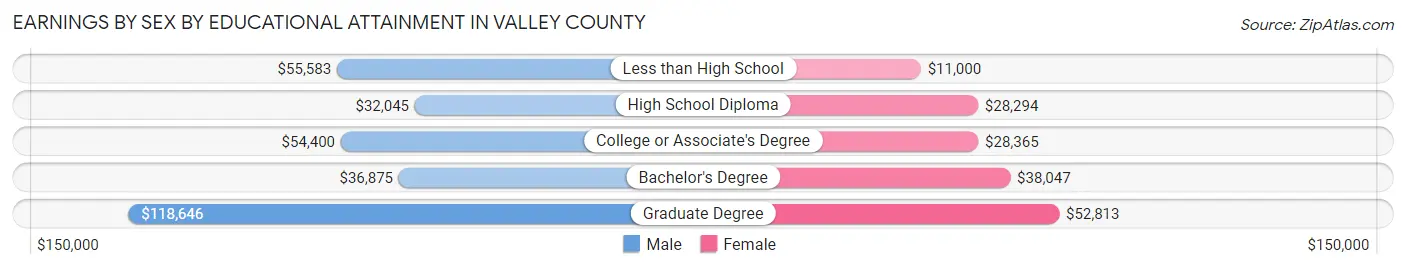
Earnings by Sex by Educational Attainment in Valley County
Average earnings in Valley County are $44,773 for men and $29,988 for women, a difference of 33.0%. Men with an educational attainment of graduate degree enjoy the highest average annual earnings of $118,646, while those with high school diploma education earn the least with $32,045. Women with an educational attainment of graduate degree earn the most with the average annual earnings of $52,813, while those with less than high school education have the smallest earnings of $11,000.
| Educational Attainment | Male Income | Female Income |
| Less than High School | $55,583 | $11,000 |
| High School Diploma | $32,045 | $28,294 |
| College or Associate's Degree | $54,400 | $28,365 |
| Bachelor's Degree | $36,875 | $38,047 |
| Graduate Degree | $118,646 | $52,813 |
| Total | $44,773 | $29,988 |
Family Income in Valley County
Family Income Brackets in Valley County
According to the Valley County family income data, there are 415 families falling into the $75,000 to $99,999 income range, which is the most common income bracket and makes up 24.2% of all families. Conversely, the $10,000 to $14,999 income bracket is the least frequent group with only 17 families (1.0%) belonging to this category.
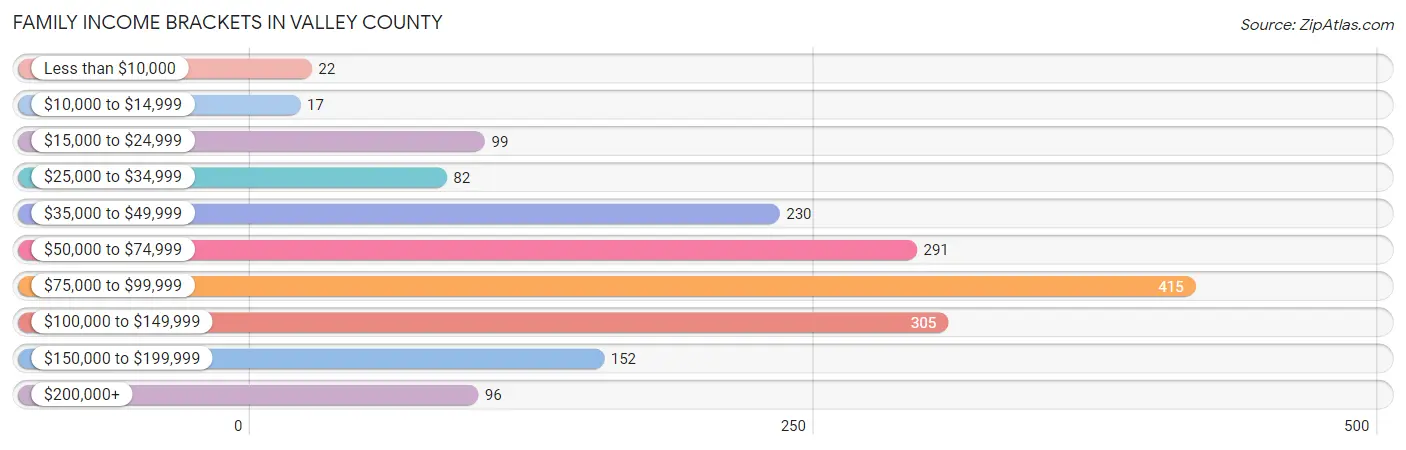
| Income Bracket | # Families | % Families |
| Less than $10,000 | 22 | 1.3% |
| $10,000 to $14,999 | 17 | 1.0% |
| $15,000 to $24,999 | 99 | 5.8% |
| $25,000 to $34,999 | 82 | 4.8% |
| $35,000 to $49,999 | 230 | 13.4% |
| $50,000 to $74,999 | 291 | 17.0% |
| $75,000 to $99,999 | 415 | 24.2% |
| $100,000 to $149,999 | 305 | 17.8% |
| $150,000 to $199,999 | 152 | 8.9% |
| $200,000+ | 96 | 5.6% |
Family Income by Famaliy Size in Valley County
7+ person families (25 | 1.5%) account for the highest median family income in Valley County with $109,375 per family, while 2-person families (987 | 57.6%) have the highest median income of $36,490 per family member.
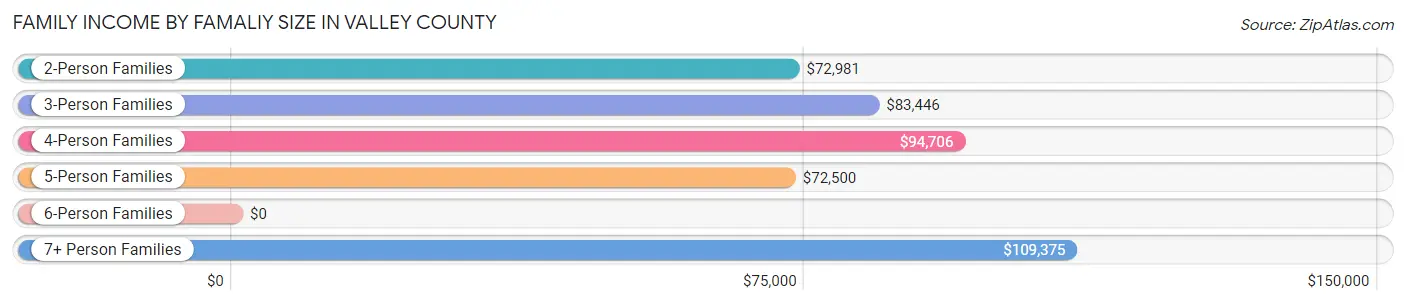
| Income Bracket | # Families | Median Income |
| 2-Person Families | 987 (57.6%) | $72,981 |
| 3-Person Families | 260 (15.2%) | $83,446 |
| 4-Person Families | 320 (18.7%) | $94,706 |
| 5-Person Families | 90 (5.2%) | $72,500 |
| 6-Person Families | 31 (1.8%) | $0 |
| 7+ Person Families | 25 (1.5%) | $109,375 |
| Total | 1,713 (100.0%) | $83,179 |
Family Income by Number of Earners in Valley County
The median family income in Valley County is $83,179, with families comprising 3+ earners (247) having the highest median family income of $104,688, while families with no earners (302) have the lowest median family income of $45,313, accounting for 14.4% and 17.6% of families, respectively.
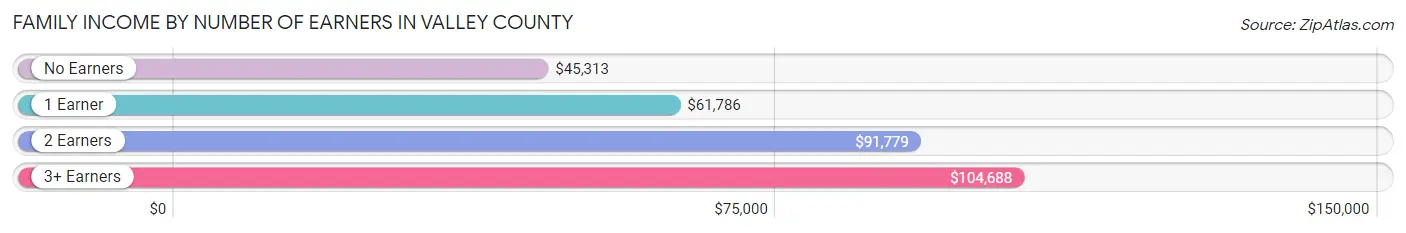
| Number of Earners | # Families | Median Income |
| No Earners | 302 (17.6%) | $45,313 |
| 1 Earner | 546 (31.9%) | $61,786 |
| 2 Earners | 618 (36.1%) | $91,779 |
| 3+ Earners | 247 (14.4%) | $104,688 |
| Total | 1,713 (100.0%) | $83,179 |
Household Income in Valley County
Household Income Brackets in Valley County
With 490 households falling in the category, the $75,000 to $99,999 income range is the most frequent in Valley County, accounting for 17.3% of all households. In contrast, only 96 households (3.4%) fall into the less than $10,000 income bracket, making it the least populous group.
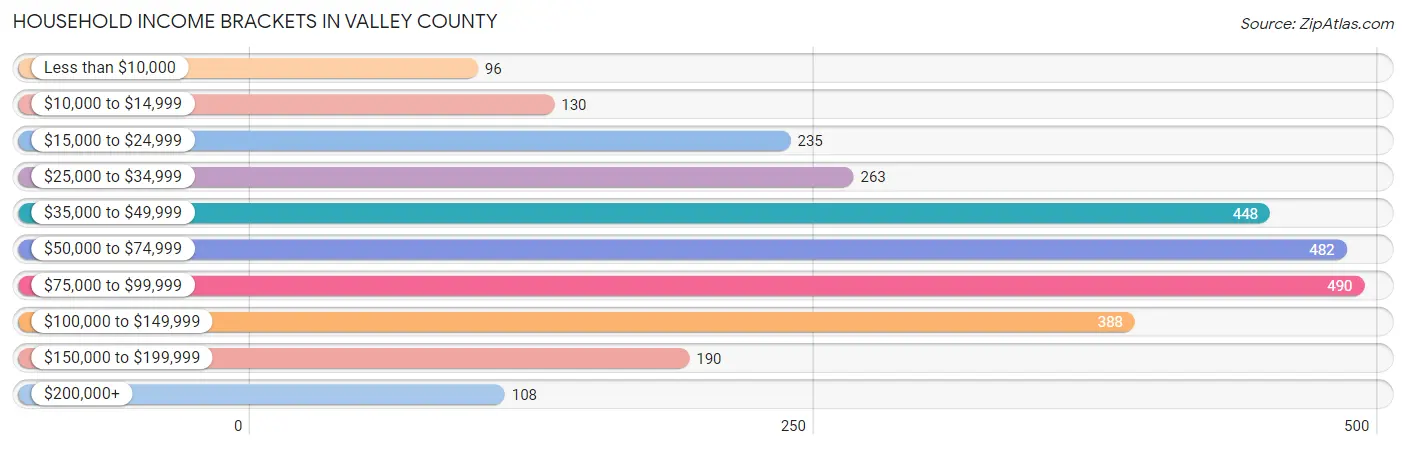
| Income Bracket | # Households | % Households |
| Less than $10,000 | 96 | 3.4% |
| $10,000 to $14,999 | 130 | 4.6% |
| $15,000 to $24,999 | 235 | 8.3% |
| $25,000 to $34,999 | 263 | 9.3% |
| $35,000 to $49,999 | 448 | 15.8% |
| $50,000 to $74,999 | 482 | 17.0% |
| $75,000 to $99,999 | 490 | 17.3% |
| $100,000 to $149,999 | 388 | 13.7% |
| $150,000 to $199,999 | 190 | 6.7% |
| $200,000+ | 108 | 3.8% |
Household Income by Householder Age in Valley County
The median household income in Valley County is $59,725, with the highest median household income of $84,281 found in the 45 to 64 years age bracket for the primary householder. A total of 977 households (34.5%) fall into this category. Meanwhile, the 65+ years age bracket for the primary householder has the lowest median household income of $39,432, with 1,111 households (39.2%) in this group.
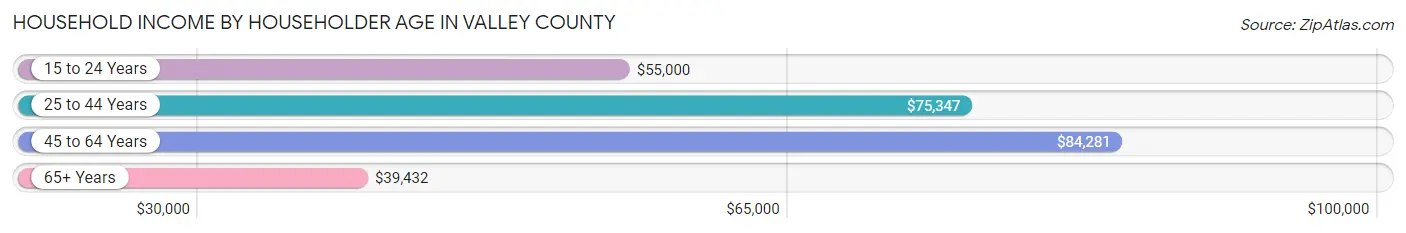
| Income Bracket | # Households | Median Income |
| 15 to 24 Years | 46 (1.6%) | $55,000 |
| 25 to 44 Years | 699 (24.7%) | $75,347 |
| 45 to 64 Years | 977 (34.5%) | $84,281 |
| 65+ Years | 1,111 (39.2%) | $39,432 |
| Total | 2,833 (100.0%) | $59,725 |
Poverty in Valley County
Income Below Poverty by Sex and Age in Valley County
With 11.4% poverty level for males and 13.3% for females among the residents of Valley County, 16 and 17 year old males and 6 to 11 year old females are the most vulnerable to poverty, with 21 males (24.7%) and 89 females (37.7%) in their respective age groups living below the poverty level.
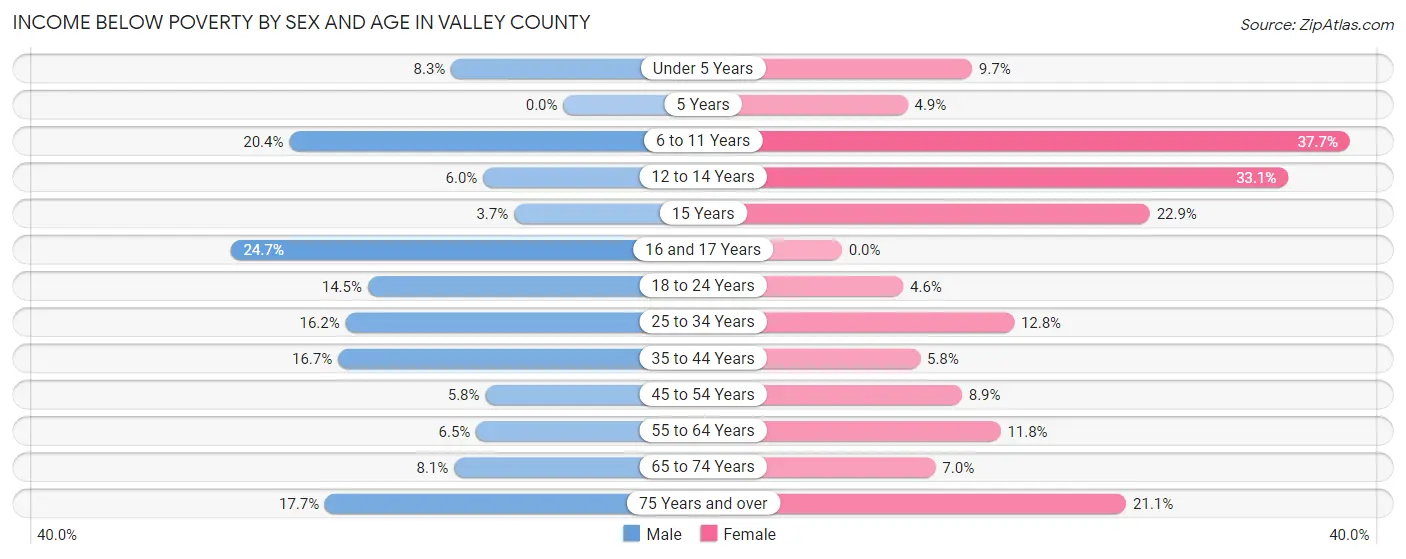
| Age Bracket | Male | Female |
| Under 5 Years | 19 (8.3%) | 17 (9.7%) |
| 5 Years | 0 (0.0%) | 2 (4.9%) |
| 6 to 11 Years | 47 (20.3%) | 89 (37.7%) |
| 12 to 14 Years | 5 (5.9%) | 56 (33.1%) |
| 15 Years | 3 (3.7%) | 8 (22.9%) |
| 16 and 17 Years | 21 (24.7%) | 0 (0.0%) |
| 18 to 24 Years | 36 (14.5%) | 10 (4.5%) |
| 25 to 34 Years | 60 (16.2%) | 52 (12.8%) |
| 35 to 44 Years | 85 (16.7%) | 23 (5.8%) |
| 45 to 54 Years | 22 (5.8%) | 35 (8.9%) |
| 55 to 64 Years | 38 (6.5%) | 63 (11.8%) |
| 65 to 74 Years | 39 (8.1%) | 33 (7.0%) |
| 75 Years and over | 52 (17.7%) | 95 (21.1%) |
| Total | 427 (11.4%) | 483 (13.3%) |
Income Above Poverty by Sex and Age in Valley County
According to the poverty statistics in Valley County, males aged 5 years and females aged 16 and 17 years are the age groups that are most secure financially, with 100.0% of males and 100.0% of females in these age groups living above the poverty line.
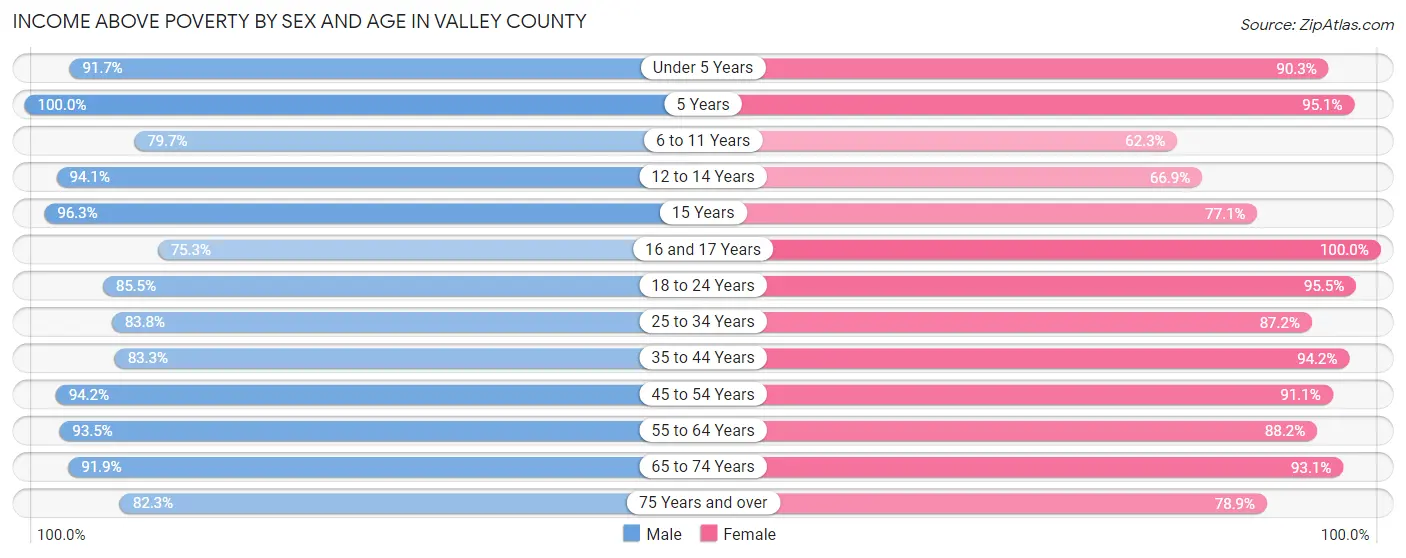
| Age Bracket | Male | Female |
| Under 5 Years | 209 (91.7%) | 159 (90.3%) |
| 5 Years | 179 (100.0%) | 39 (95.1%) |
| 6 to 11 Years | 184 (79.6%) | 147 (62.3%) |
| 12 to 14 Years | 79 (94.1%) | 113 (66.9%) |
| 15 Years | 79 (96.3%) | 27 (77.1%) |
| 16 and 17 Years | 64 (75.3%) | 92 (100.0%) |
| 18 to 24 Years | 212 (85.5%) | 210 (95.5%) |
| 25 to 34 Years | 311 (83.8%) | 355 (87.2%) |
| 35 to 44 Years | 423 (83.3%) | 373 (94.2%) |
| 45 to 54 Years | 358 (94.2%) | 358 (91.1%) |
| 55 to 64 Years | 549 (93.5%) | 472 (88.2%) |
| 65 to 74 Years | 442 (91.9%) | 442 (93.0%) |
| 75 Years and over | 242 (82.3%) | 355 (78.9%) |
| Total | 3,331 (88.6%) | 3,142 (86.7%) |
Income Below Poverty Among Married-Couple Families in Valley County
The poverty statistics for married-couple families in Valley County show that 6.5% or 90 of the total 1,392 families live below the poverty line. Families with 3 or 4 children have the highest poverty rate of 32.0%, comprising of 31 families. On the other hand, families with no children have the lowest poverty rate of 2.6%, which includes 23 families.
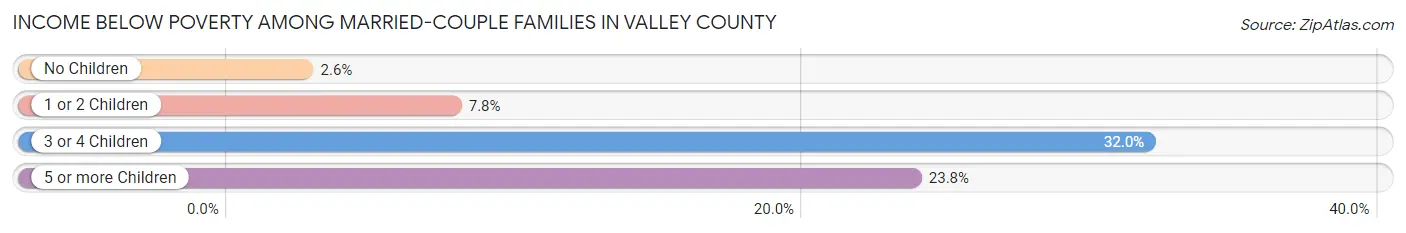
| Children | Above Poverty | Below Poverty |
| No Children | 853 (97.4%) | 23 (2.6%) |
| 1 or 2 Children | 367 (92.2%) | 31 (7.8%) |
| 3 or 4 Children | 66 (68.0%) | 31 (32.0%) |
| 5 or more Children | 16 (76.2%) | 5 (23.8%) |
| Total | 1,302 (93.5%) | 90 (6.5%) |
Income Below Poverty Among Single-Parent Households in Valley County
According to the poverty data in Valley County, 2.5% or 3 single-father households and 10.8% or 22 single-mother households are living below the poverty line. Among single-father households, those with 1 or 2 children have the highest poverty rate, with 3 households (15.8%) experiencing poverty. Likewise, among single-mother households, those with 5 or more children have the highest poverty rate, with 2 households (100.0%) falling below the poverty line.
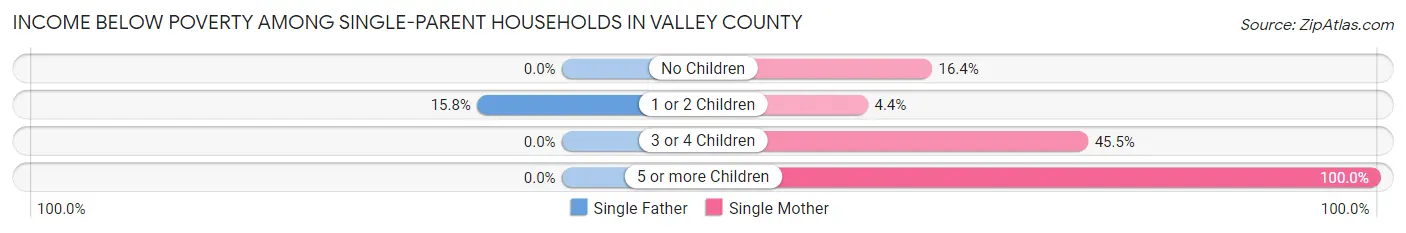
| Children | Single Father | Single Mother |
| No Children | 0 (0.0%) | 9 (16.4%) |
| 1 or 2 Children | 3 (15.8%) | 6 (4.4%) |
| 3 or 4 Children | 0 (0.0%) | 5 (45.5%) |
| 5 or more Children | 0 (0.0%) | 2 (100.0%) |
| Total | 3 (2.5%) | 22 (10.8%) |
Income Below Poverty Among Married-Couple vs Single-Parent Households in Valley County
The poverty data for Valley County shows that 90 of the married-couple family households (6.5%) and 25 of the single-parent households (7.8%) are living below the poverty level. Within the married-couple family households, those with 3 or 4 children have the highest poverty rate, with 31 households (32.0%) falling below the poverty line. Among the single-parent households, those with 5 or more children have the highest poverty rate, with 2 household (100.0%) living below poverty.
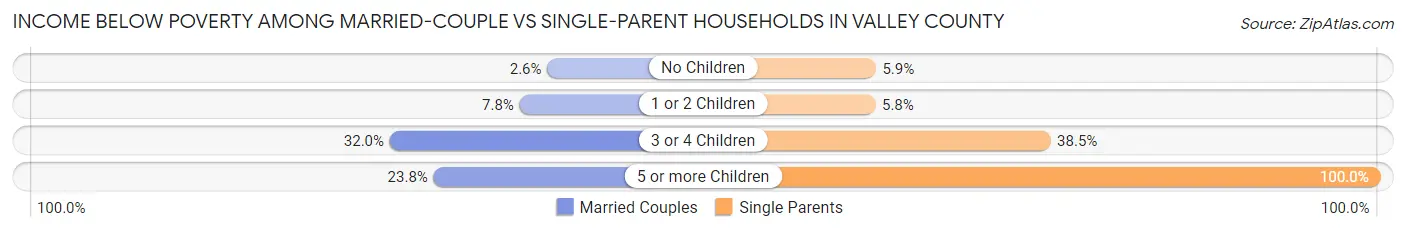
| Children | Married-Couple Families | Single-Parent Households |
| No Children | 23 (2.6%) | 9 (5.9%) |
| 1 or 2 Children | 31 (7.8%) | 9 (5.8%) |
| 3 or 4 Children | 31 (32.0%) | 5 (38.5%) |
| 5 or more Children | 5 (23.8%) | 2 (100.0%) |
| Total | 90 (6.5%) | 25 (7.8%) |
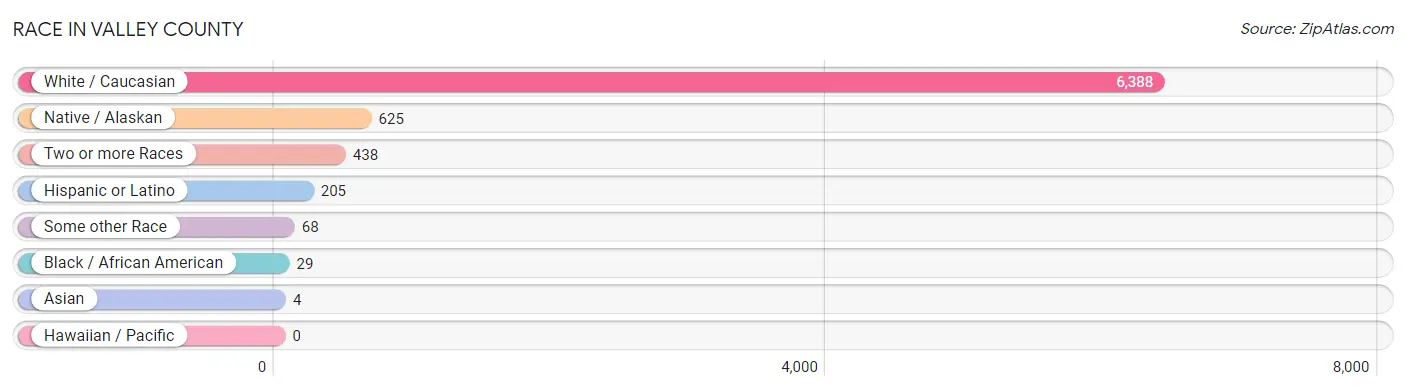
Race in Valley County
The most populous races in Valley County are White / Caucasian (6,388 | 84.6%), Native / Alaskan (625 | 8.3%), and Two or more Races (438 | 5.8%).
| Race | # Population | % Population |
| Asian | 4 | 0.1% |
| Black / African American | 29 | 0.4% |
| Hawaiian / Pacific | 0 | 0.0% |
| Hispanic or Latino | 205 | 2.7% |
| Native / Alaskan | 625 | 8.3% |
| White / Caucasian | 6,388 | 84.6% |
| Two or more Races | 438 | 5.8% |
| Some other Race | 68 | 0.9% |
| Total | 7,552 | 100.0% |
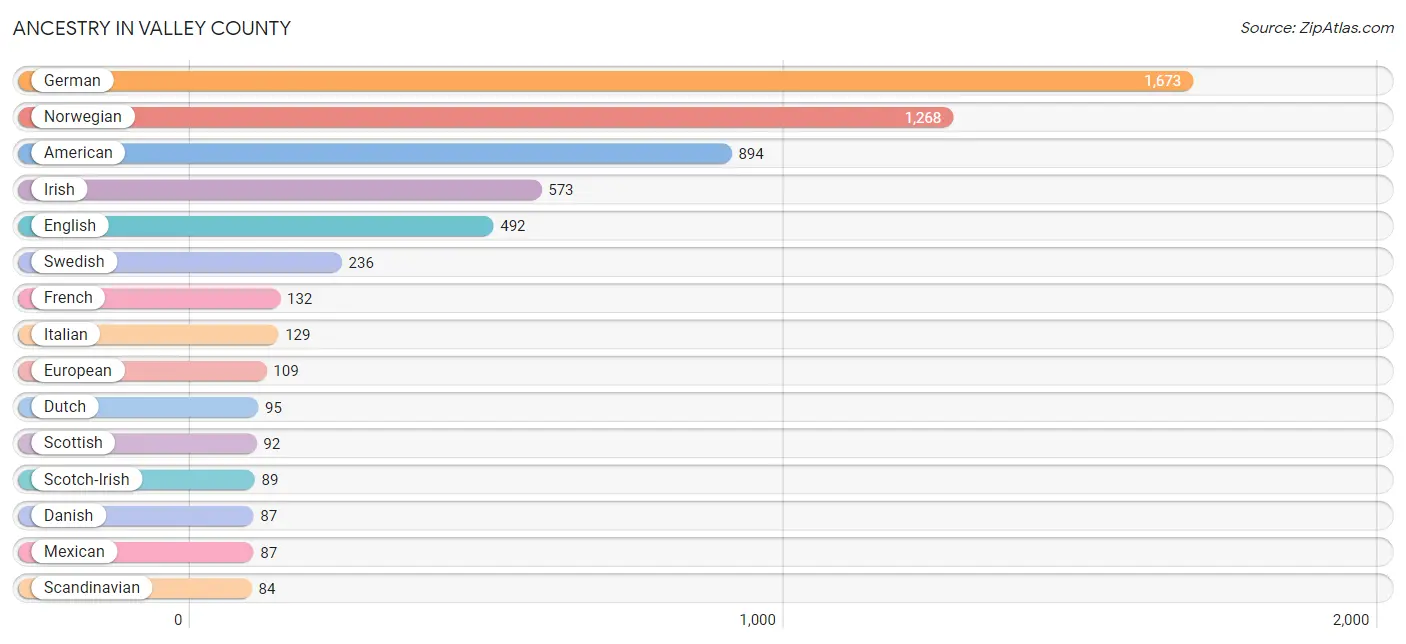
Ancestry in Valley County
The most populous ancestries reported in Valley County are German (1,673 | 22.2%), Norwegian (1,268 | 16.8%), American (894 | 11.8%), Irish (573 | 7.6%), and English (492 | 6.5%), together accounting for 64.9% of all Valley County residents.
| Ancestry | # Population | % Population |
| American | 894 | 11.8% |
| Arab | 9 | 0.1% |
| Basque | 2 | 0.0% |
| Belgian | 22 | 0.3% |
| Bhutanese | 31 | 0.4% |
| Blackfeet | 12 | 0.2% |
| British | 8 | 0.1% |
| Burmese | 1 | 0.0% |
| Cambodian | 5 | 0.1% |
| Canadian | 39 | 0.5% |
| Cherokee | 22 | 0.3% |
| Cheyenne | 4 | 0.1% |
| Chippewa | 41 | 0.5% |
| Cree | 3 | 0.0% |
| Croatian | 3 | 0.0% |
| Crow | 13 | 0.2% |
| Cuban | 6 | 0.1% |
| Czech | 18 | 0.2% |
| Danish | 87 | 1.1% |
| Dutch | 95 | 1.3% |
| Eastern European | 14 | 0.2% |
| English | 492 | 6.5% |
| Ethiopian | 2 | 0.0% |
| European | 109 | 1.4% |
| Finnish | 14 | 0.2% |
| French | 132 | 1.8% |
| French Canadian | 31 | 0.4% |
| German | 1,673 | 22.2% |
| Greek | 4 | 0.1% |
| Hungarian | 79 | 1.1% |
| Icelander | 2 | 0.0% |
| Indian (Asian) | 63 | 0.8% |
| Irish | 573 | 7.6% |
| Italian | 129 | 1.7% |
| Korean | 61 | 0.8% |
| Lebanese | 9 | 0.1% |
| Mexican | 87 | 1.1% |
| Native Hawaiian | 52 | 0.7% |
| Northern European | 1 | 0.0% |
| Norwegian | 1,268 | 16.8% |
| Osage | 1 | 0.0% |
| Pennsylvania German | 3 | 0.0% |
| Peruvian | 44 | 0.6% |
| Polish | 77 | 1.0% |
| Puerto Rican | 8 | 0.1% |
| Romanian | 1 | 0.0% |
| Russian | 52 | 0.7% |
| Scandinavian | 84 | 1.1% |
| Scotch-Irish | 89 | 1.2% |
| Scottish | 92 | 1.2% |
| Sioux | 53 | 0.7% |
| Slovak | 7 | 0.1% |
| South American | 44 | 0.6% |
| Spaniard | 31 | 0.4% |
| Spanish | 16 | 0.2% |
| Subsaharan African | 2 | 0.0% |
| Swedish | 236 | 3.1% |
| Swiss | 6 | 0.1% |
| Ukrainian | 57 | 0.7% |
| Ute | 2 | 0.0% | View All 60 Rows |
Immigrants in Valley County
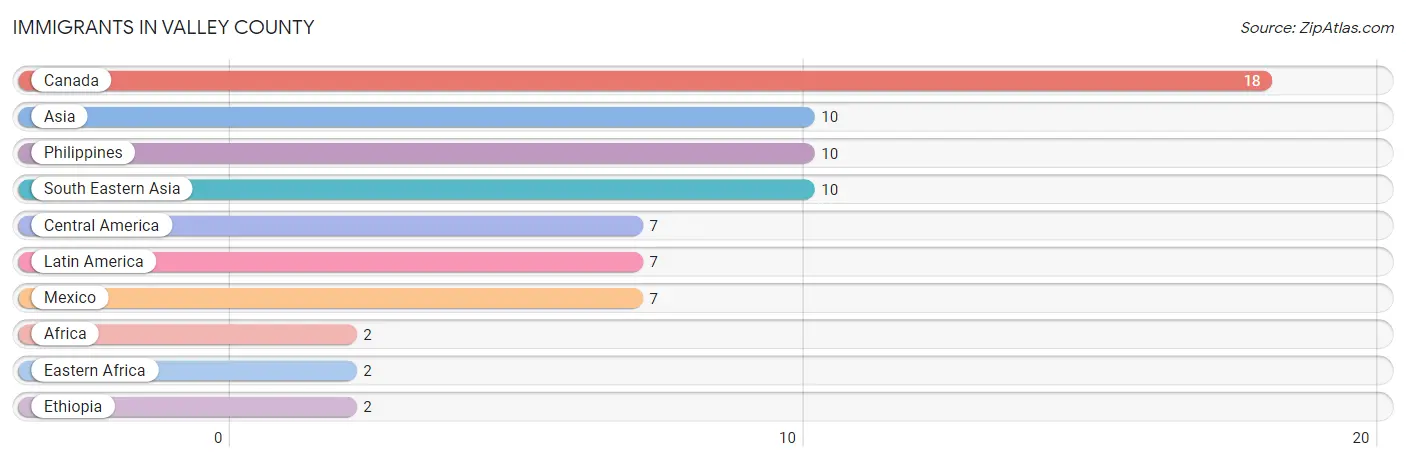
The most numerous immigrant groups reported in Valley County came from Canada (18 | 0.2%), Asia (10 | 0.1%), Philippines (10 | 0.1%), South Eastern Asia (10 | 0.1%), and Central America (7 | 0.1%), together accounting for 0.7% of all Valley County residents.
| Immigration Origin | # Population | % Population |
| Africa | 2 | 0.0% |
| Asia | 10 | 0.1% |
| Canada | 18 | 0.2% |
| Central America | 7 | 0.1% |
| Eastern Africa | 2 | 0.0% |
| Ethiopia | 2 | 0.0% |
| Latin America | 7 | 0.1% |
| Mexico | 7 | 0.1% |
| Philippines | 10 | 0.1% |
| South Eastern Asia | 10 | 0.1% | View All 10 Rows |
Sex and Age in Valley County
Sex and Age in Valley County
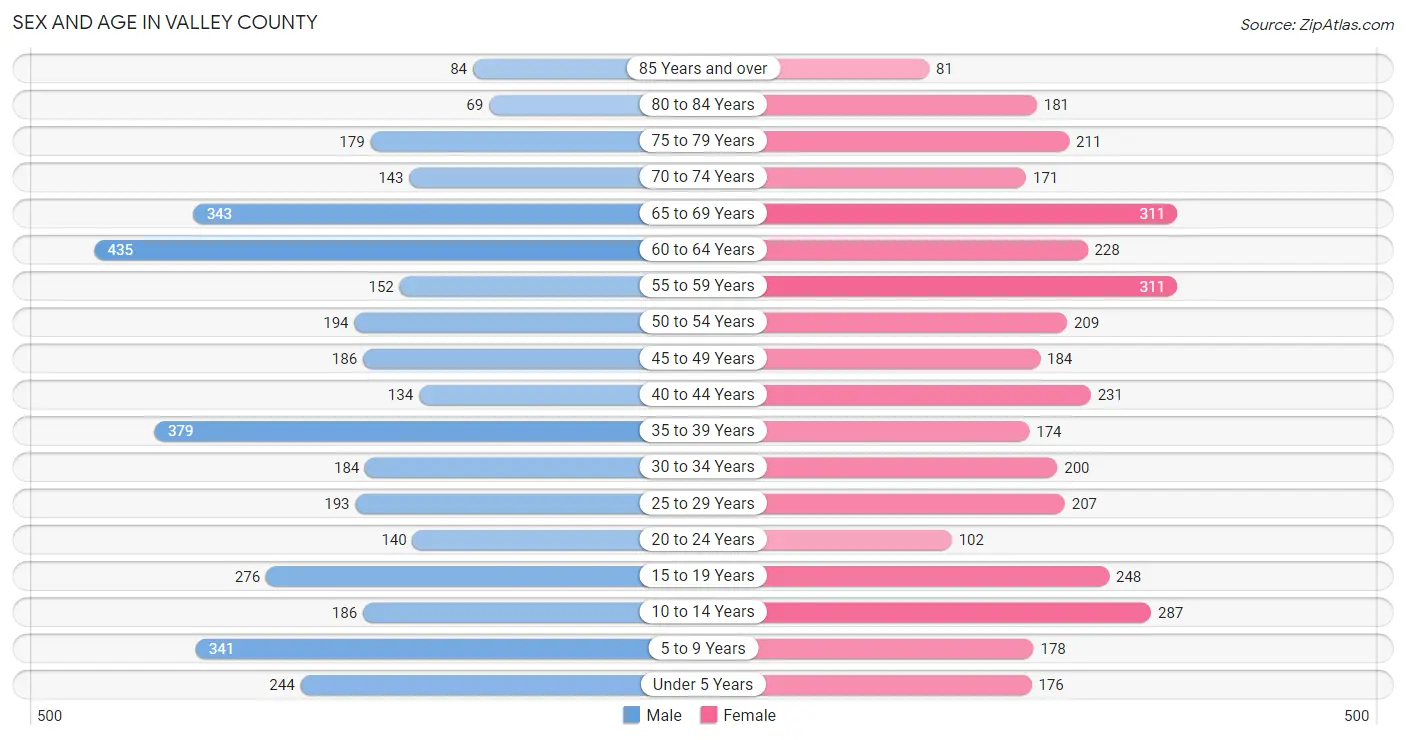
The most populous age groups in Valley County are 60 to 64 Years (435 | 11.3%) for men and 55 to 59 Years (311 | 8.4%) for women.
| Age Bracket | Male | Female |
| Under 5 Years | 244 (6.3%) | 176 (4.8%) |
| 5 to 9 Years | 341 (8.8%) | 178 (4.8%) |
| 10 to 14 Years | 186 (4.8%) | 287 (7.8%) |
| 15 to 19 Years | 276 (7.1%) | 248 (6.7%) |
| 20 to 24 Years | 140 (3.6%) | 102 (2.8%) |
| 25 to 29 Years | 193 (5.0%) | 207 (5.6%) |
| 30 to 34 Years | 184 (4.8%) | 200 (5.4%) |
| 35 to 39 Years | 379 (9.8%) | 174 (4.7%) |
| 40 to 44 Years | 134 (3.5%) | 231 (6.3%) |
| 45 to 49 Years | 186 (4.8%) | 184 (5.0%) |
| 50 to 54 Years | 194 (5.0%) | 209 (5.7%) |
| 55 to 59 Years | 152 (3.9%) | 311 (8.4%) |
| 60 to 64 Years | 435 (11.3%) | 228 (6.2%) |
| 65 to 69 Years | 343 (8.9%) | 311 (8.4%) |
| 70 to 74 Years | 143 (3.7%) | 171 (4.6%) |
| 75 to 79 Years | 179 (4.6%) | 211 (5.7%) |
| 80 to 84 Years | 69 (1.8%) | 181 (4.9%) |
| 85 Years and over | 84 (2.2%) | 81 (2.2%) |
| Total | 3,862 (100.0%) | 3,690 (100.0%) |
Families and Households in Valley County
Median Family Size in Valley County
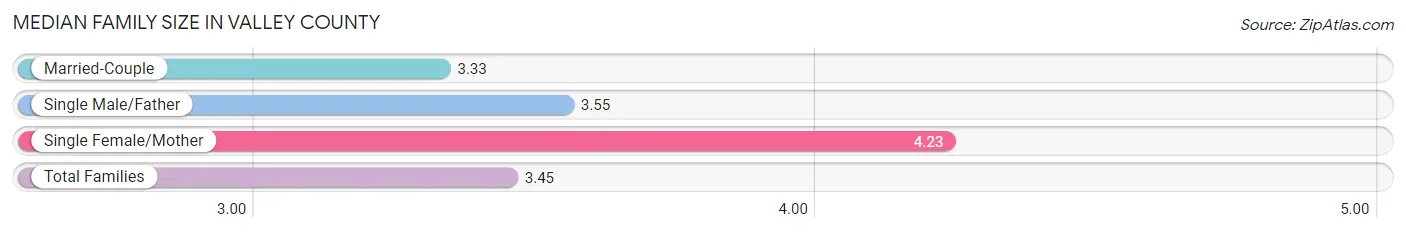
The median family size in Valley County is 3.45 persons per family, with single female/mother families (203 | 11.8%) accounting for the largest median family size of 4.23 persons per family. On the other hand, married-couple families (1,392 | 81.3%) represent the smallest median family size with 3.33 persons per family.
| Family Type | # Families | Family Size |
| Married-Couple | 1,392 (81.3%) | 3.33 |
| Single Male/Father | 118 (6.9%) | 3.55 |
| Single Female/Mother | 203 (11.8%) | 4.23 |
| Total Families | 1,713 (100.0%) | 3.45 |
Median Household Size in Valley County
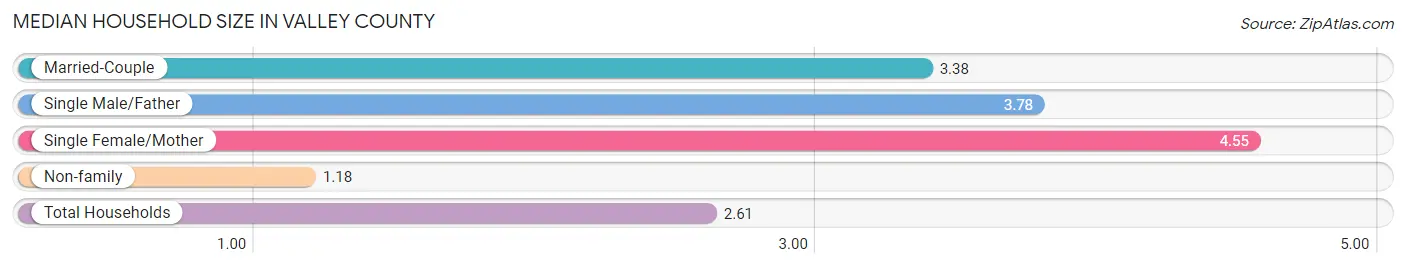
The median household size in Valley County is 2.61 persons per household, with single female/mother households (203 | 7.2%) accounting for the largest median household size of 4.55 persons per household. non-family households (1,120 | 39.5%) represent the smallest median household size with 1.18 persons per household.
| Household Type | # Households | Household Size |
| Married-Couple | 1,392 (49.1%) | 3.38 |
| Single Male/Father | 118 (4.2%) | 3.78 |
| Single Female/Mother | 203 (7.2%) | 4.55 |
| Non-family | 1,120 (39.5%) | 1.18 |
| Total Households | 2,833 (100.0%) | 2.61 |
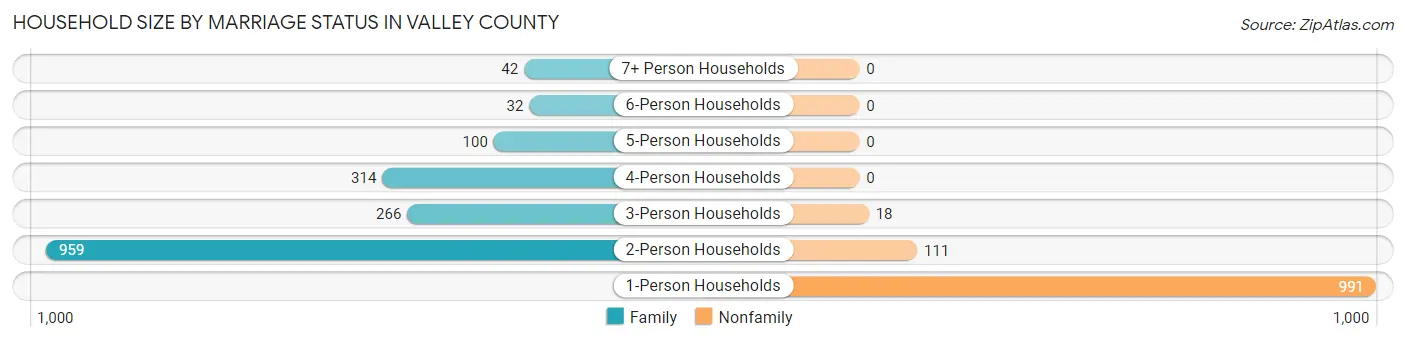
Household Size by Marriage Status in Valley County
Out of a total of 2,833 households in Valley County, 1,713 (60.5%) are family households, while 1,120 (39.5%) are nonfamily households. The most numerous type of family households are 2-person households, comprising 959, and the most common type of nonfamily households are 1-person households, comprising 991.
| Household Size | Family Households | Nonfamily Households |
| 1-Person Households | - | 991 (35.0%) |
| 2-Person Households | 959 (33.9%) | 111 (3.9%) |
| 3-Person Households | 266 (9.4%) | 18 (0.6%) |
| 4-Person Households | 314 (11.1%) | 0 (0.0%) |
| 5-Person Households | 100 (3.5%) | 0 (0.0%) |
| 6-Person Households | 32 (1.1%) | 0 (0.0%) |
| 7+ Person Households | 42 (1.5%) | 0 (0.0%) |
| Total | 1,713 (60.5%) | 1,120 (39.5%) |
Female Fertility in Valley County
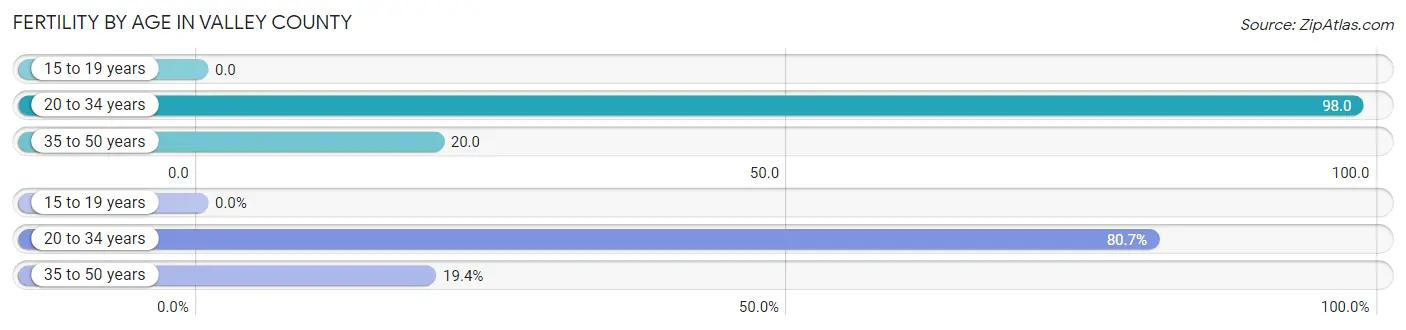
Fertility by Age in Valley County
Average fertility rate in Valley County is 45.0 births per 1,000 women. Women in the age bracket of 20 to 34 years have the highest fertility rate with 98.0 births per 1,000 women. Women in the age bracket of 20 to 34 years acount for 80.6% of all women with births.
| Age Bracket | Women with Births | Births / 1,000 Women |
| 15 to 19 years | 0 (0.0%) | 0.0 |
| 20 to 34 years | 50 (80.6%) | 98.0 |
| 35 to 50 years | 12 (19.4%) | 20.0 |
| Total | 62 (100.0%) | 45.0 |
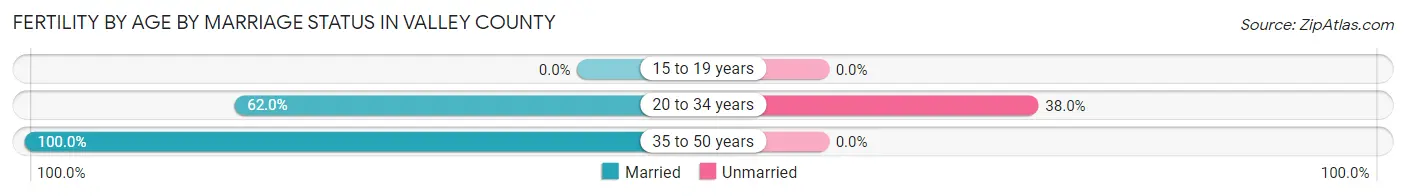
Fertility by Age by Marriage Status in Valley County
69.4% of women with births (62) in Valley County are married. The highest percentage of unmarried women with births falls into 20 to 34 years age bracket with 38.0% of them unmarried at the time of birth, while the lowest percentage of unmarried women with births belong to 35 to 50 years age bracket with 0.0% of them unmarried.
| Age Bracket | Married | Unmarried |
| 15 to 19 years | 0 (0.0%) | 0 (0.0%) |
| 20 to 34 years | 31 (62.0%) | 19 (38.0%) |
| 35 to 50 years | 12 (100.0%) | 0 (0.0%) |
| Total | 43 (69.4%) | 19 (30.6%) |
Fertility by Education in Valley County
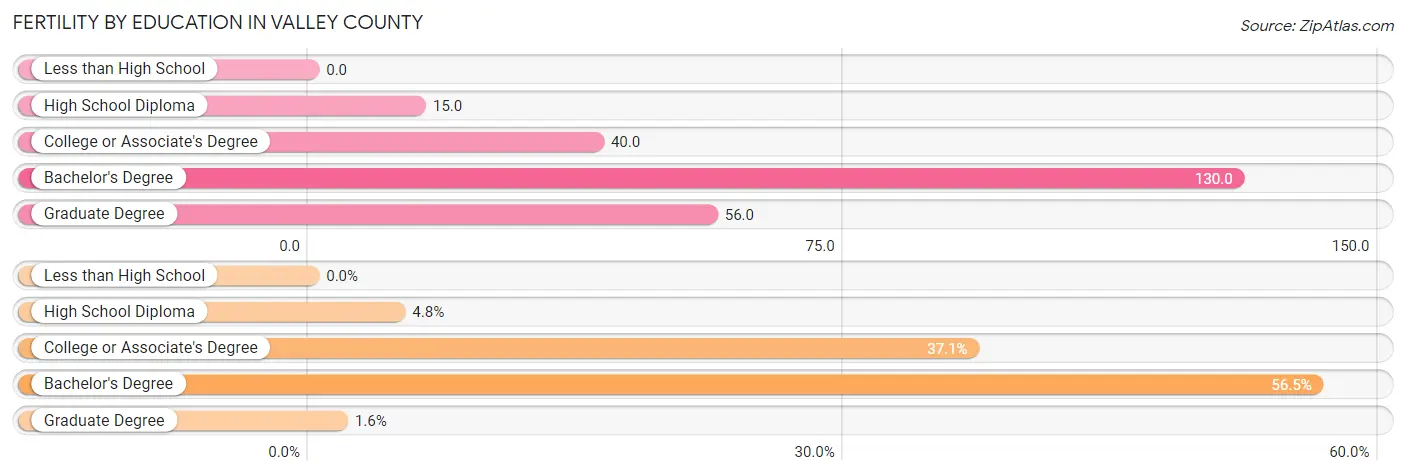
| Educational Attainment | Women with Births | Births / 1,000 Women |
| Less than High School | 0 (0.0%) | 0.0 |
| High School Diploma | 3 (4.8%) | 15.0 |
| College or Associate's Degree | 23 (37.1%) | 40.0 |
| Bachelor's Degree | 35 (56.5%) | 130.0 |
| Graduate Degree | 1 (1.6%) | 56.0 |
| Total | 62 (100.0%) | 45.0 |
Fertility by Education by Marriage Status in Valley County
30.6% of women with births in Valley County are unmarried. Women with the educational attainment of high school diploma are most likely to be married with 100.0% of them married at childbirth, while women with the educational attainment of college or associate's degree are least likely to be married with 82.6% of them unmarried at childbirth.
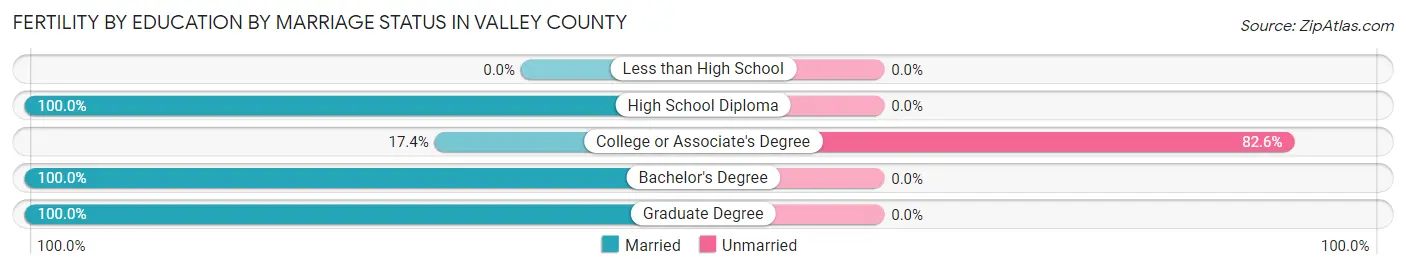
| Educational Attainment | Married | Unmarried |
| Less than High School | 0 (0.0%) | 0 (0.0%) |
| High School Diploma | 3 (100.0%) | 0 (0.0%) |
| College or Associate's Degree | 4 (17.4%) | 19 (82.6%) |
| Bachelor's Degree | 35 (100.0%) | 0 (0.0%) |
| Graduate Degree | 1 (100.0%) | 0 (0.0%) |
| Total | 43 (69.4%) | 19 (30.6%) |
Employment Characteristics in Valley County
Employment by Class of Employer in Valley County
Among the 3,358 employed individuals in Valley County, private company employees (1,835 | 54.6%), self-employed (not incorporated) (417 | 12.4%), and not-for-profit organizations (317 | 9.4%) make up the most common classes of employment.
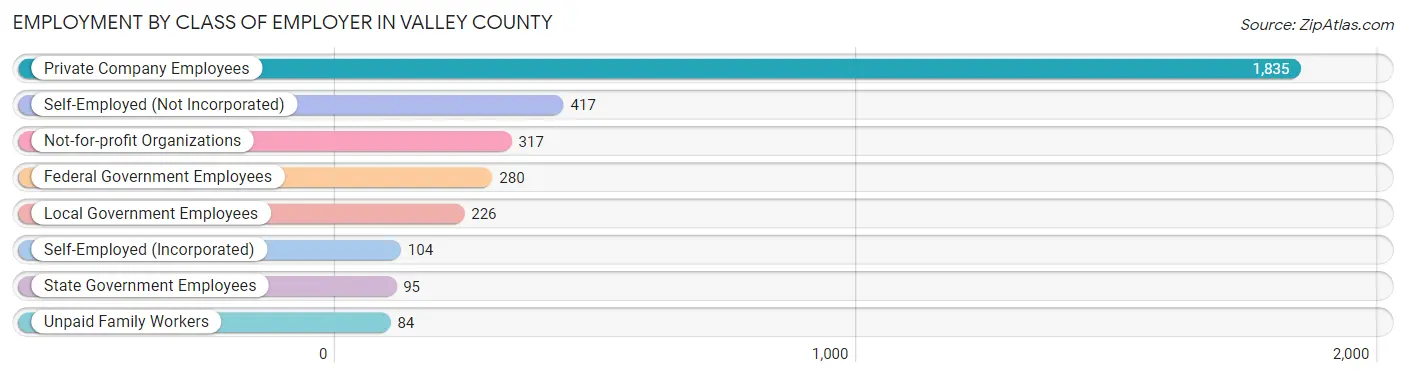
| Employer Class | # Employees | % Employees |
| Private Company Employees | 1,835 | 54.6% |
| Self-Employed (Incorporated) | 104 | 3.1% |
| Self-Employed (Not Incorporated) | 417 | 12.4% |
| Not-for-profit Organizations | 317 | 9.4% |
| Local Government Employees | 226 | 6.7% |
| State Government Employees | 95 | 2.8% |
| Federal Government Employees | 280 | 8.3% |
| Unpaid Family Workers | 84 | 2.5% |
| Total | 3,358 | 100.0% |
Employment Status by Age in Valley County
According to the labor force statistics for Valley County, out of the total population over 16 years of age (6,022), 60.1% or 3,619 individuals are in the labor force, with 4.0% or 145 of them unemployed. The age group with the highest labor force participation rate is 45 to 54 years, with 86.7% or 670 individuals in the labor force. Within the labor force, the 65 to 74 years age range has the highest percentage of unemployed individuals, with 14.5% or 40 of them being unemployed.
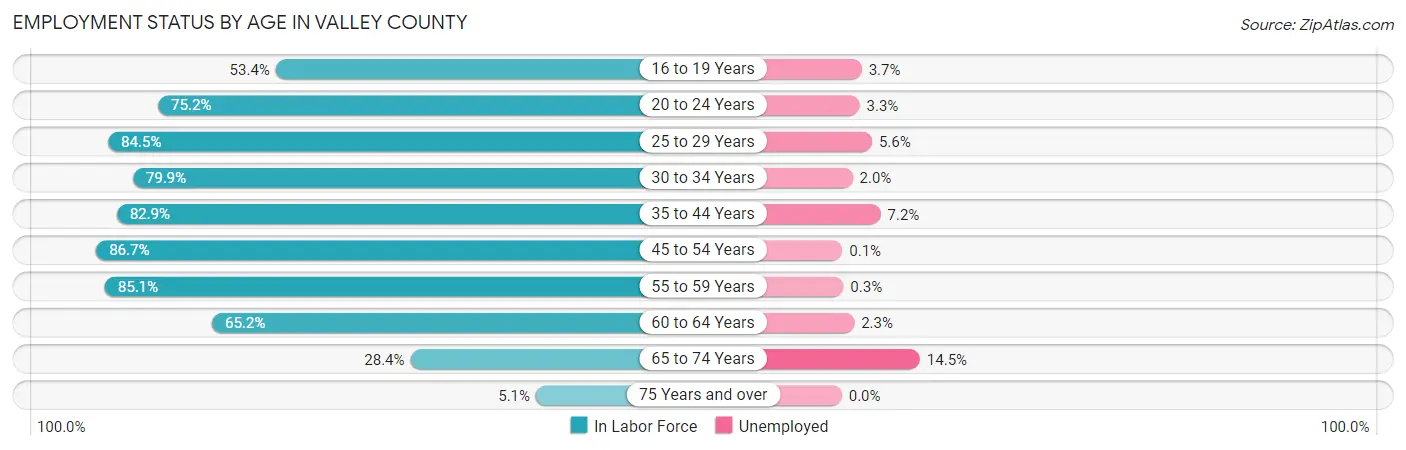
| Age Bracket | In Labor Force | Unemployed |
| 16 to 19 Years | 217 (53.4%) | 8 (3.7%) |
| 20 to 24 Years | 182 (75.2%) | 6 (3.3%) |
| 25 to 29 Years | 338 (84.5%) | 19 (5.6%) |
| 30 to 34 Years | 307 (79.9%) | 6 (2.0%) |
| 35 to 44 Years | 761 (82.9%) | 55 (7.2%) |
| 45 to 54 Years | 670 (86.7%) | 1 (0.1%) |
| 55 to 59 Years | 394 (85.1%) | 1 (0.3%) |
| 60 to 64 Years | 432 (65.2%) | 10 (2.3%) |
| 65 to 74 Years | 275 (28.4%) | 40 (14.5%) |
| 75 Years and over | 41 (5.1%) | 0 (0.0%) |
| Total | 3,619 (60.1%) | 145 (4.0%) |
Employment Status by Educational Attainment in Valley County
According to labor force statistics for Valley County, 80.6% of individuals (2,902) out of the total population between 25 and 64 years of age (3,601) are in the labor force, with 3.2% or 93 of them being unemployed. The group with the highest labor force participation rate are those with the educational attainment of bachelor's degree or higher, with 87.0% or 604 individuals in the labor force. Within the labor force, individuals with less than high school education have the highest percentage of unemployment, with 6.5% or 7 of them being unemployed.
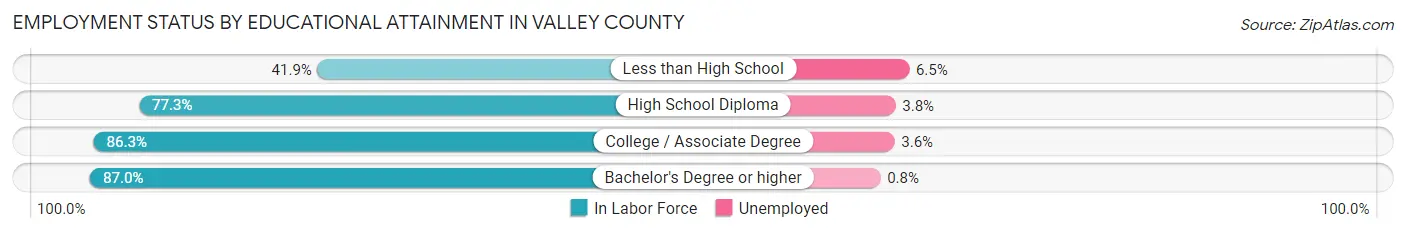
| Educational Attainment | In Labor Force | Unemployed |
| Less than High School | 108 (41.9%) | 17 (6.5%) |
| High School Diploma | 826 (77.3%) | 41 (3.8%) |
| College / Associate Degree | 1,364 (86.3%) | 57 (3.6%) |
| Bachelor's Degree or higher | 604 (87.0%) | 6 (0.8%) |
| Total | 2,902 (80.6%) | 115 (3.2%) |
Employment Occupations by Sex in Valley County
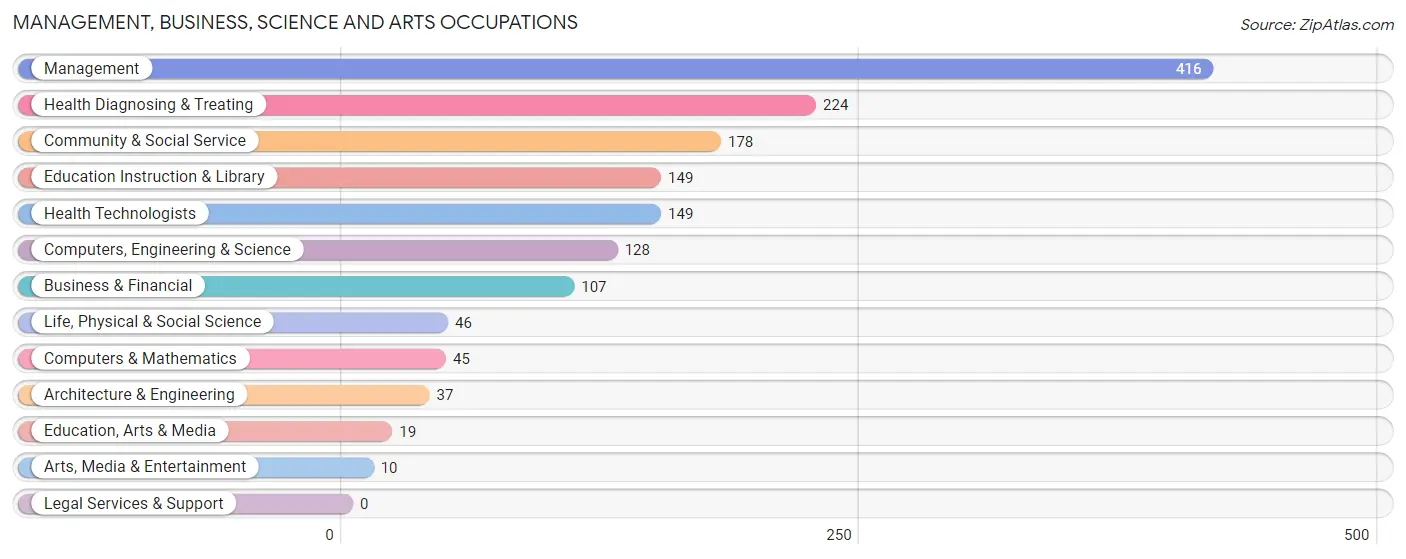
Management, Business, Science and Arts Occupations
The most common Management, Business, Science and Arts occupations in Valley County are Management (416 | 12.0%), Health Diagnosing & Treating (224 | 6.5%), Community & Social Service (178 | 5.1%), Education Instruction & Library (149 | 4.3%), and Health Technologists (149 | 4.3%).
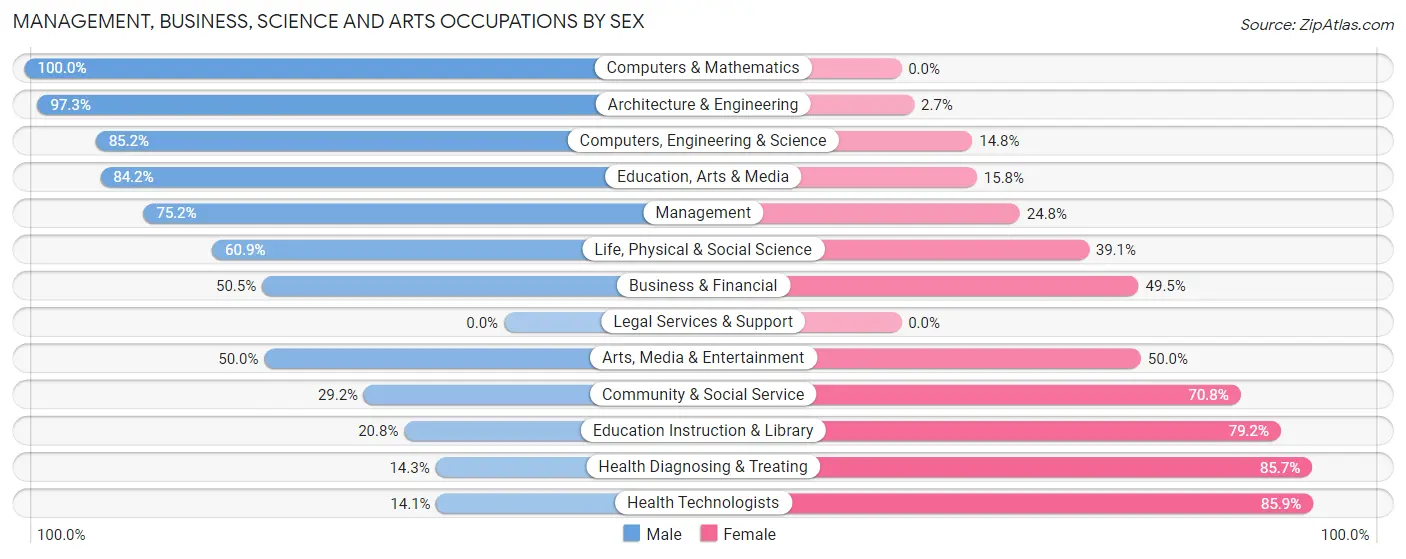
Management, Business, Science and Arts Occupations by Sex
Within the Management, Business, Science and Arts occupations in Valley County, the most male-oriented occupations are Computers & Mathematics (100.0%), Architecture & Engineering (97.3%), and Computers, Engineering & Science (85.2%), while the most female-oriented occupations are Health Technologists (85.9%), Health Diagnosing & Treating (85.7%), and Education Instruction & Library (79.2%).
| Occupation | Male | Female |
| Management | 313 (75.2%) | 103 (24.8%) |
| Business & Financial | 54 (50.5%) | 53 (49.5%) |
| Computers, Engineering & Science | 109 (85.2%) | 19 (14.8%) |
| Computers & Mathematics | 45 (100.0%) | 0 (0.0%) |
| Architecture & Engineering | 36 (97.3%) | 1 (2.7%) |
| Life, Physical & Social Science | 28 (60.9%) | 18 (39.1%) |
| Community & Social Service | 52 (29.2%) | 126 (70.8%) |
| Education, Arts & Media | 16 (84.2%) | 3 (15.8%) |
| Legal Services & Support | 0 (0.0%) | 0 (0.0%) |
| Education Instruction & Library | 31 (20.8%) | 118 (79.2%) |
| Arts, Media & Entertainment | 5 (50.0%) | 5 (50.0%) |
| Health Diagnosing & Treating | 32 (14.3%) | 192 (85.7%) |
| Health Technologists | 21 (14.1%) | 128 (85.9%) |
| Total (Category) | 560 (53.2%) | 493 (46.8%) |
| Total (Overall) | 1,851 (53.3%) | 1,620 (46.7%) |
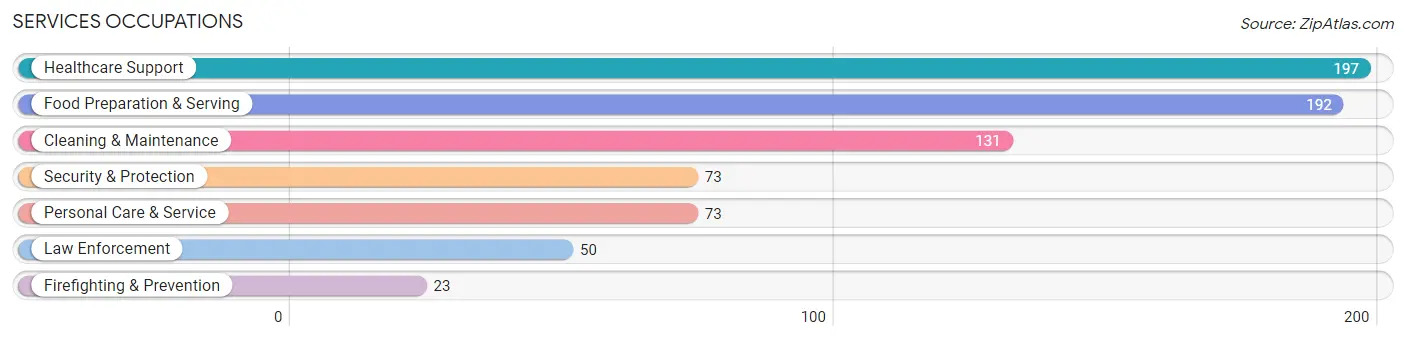
Services Occupations
The most common Services occupations in Valley County are Healthcare Support (197 | 5.7%), Food Preparation & Serving (192 | 5.5%), Cleaning & Maintenance (131 | 3.8%), Security & Protection (73 | 2.1%), and Personal Care & Service (73 | 2.1%).
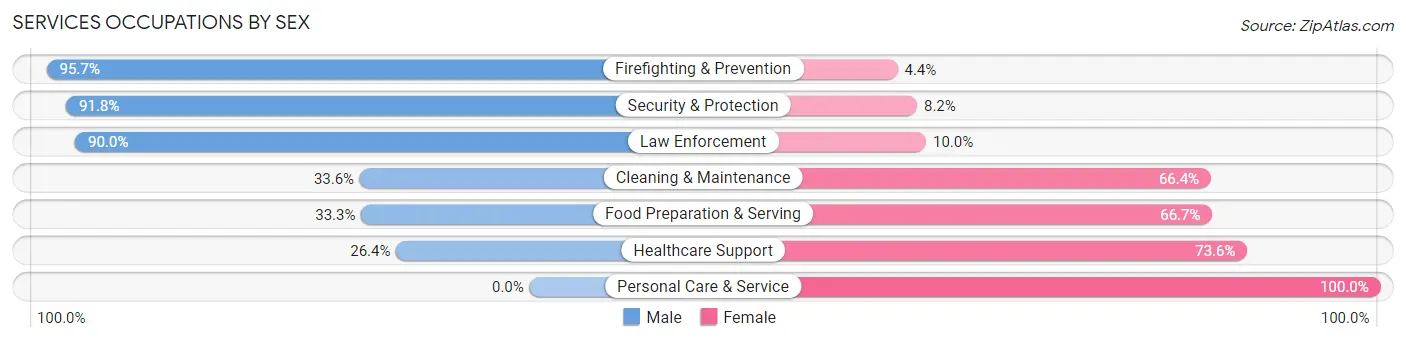
Services Occupations by Sex
Within the Services occupations in Valley County, the most male-oriented occupations are Firefighting & Prevention (95.7%), Security & Protection (91.8%), and Law Enforcement (90.0%), while the most female-oriented occupations are Personal Care & Service (100.0%), Healthcare Support (73.6%), and Food Preparation & Serving (66.7%).
| Occupation | Male | Female |
| Healthcare Support | 52 (26.4%) | 145 (73.6%) |
| Security & Protection | 67 (91.8%) | 6 (8.2%) |
| Firefighting & Prevention | 22 (95.7%) | 1 (4.3%) |
| Law Enforcement | 45 (90.0%) | 5 (10.0%) |
| Food Preparation & Serving | 64 (33.3%) | 128 (66.7%) |
| Cleaning & Maintenance | 44 (33.6%) | 87 (66.4%) |
| Personal Care & Service | 0 (0.0%) | 73 (100.0%) |
| Total (Category) | 227 (34.1%) | 439 (65.9%) |
| Total (Overall) | 1,851 (53.3%) | 1,620 (46.7%) |
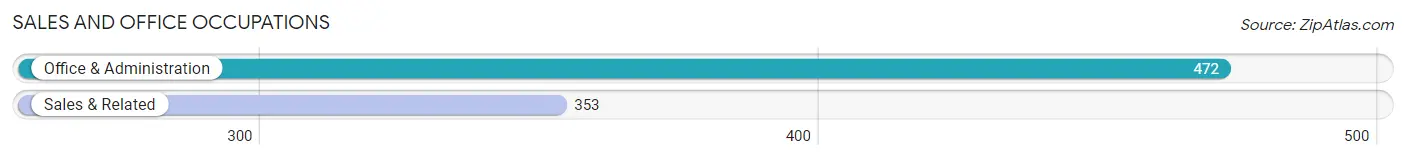
Sales and Office Occupations
The most common Sales and Office occupations in Valley County are Office & Administration (472 | 13.6%), and Sales & Related (353 | 10.2%).
Sales and Office Occupations by Sex
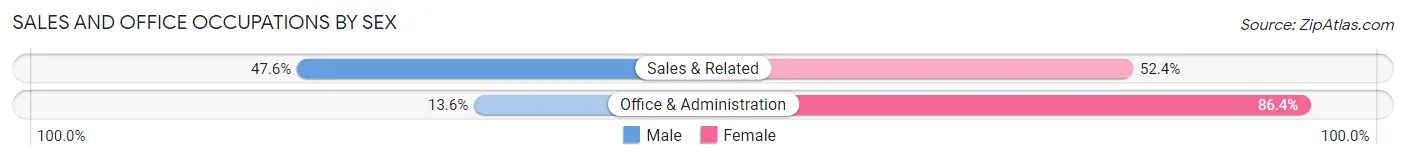
| Occupation | Male | Female |
| Sales & Related | 168 (47.6%) | 185 (52.4%) |
| Office & Administration | 64 (13.6%) | 408 (86.4%) |
| Total (Category) | 232 (28.1%) | 593 (71.9%) |
| Total (Overall) | 1,851 (53.3%) | 1,620 (46.7%) |
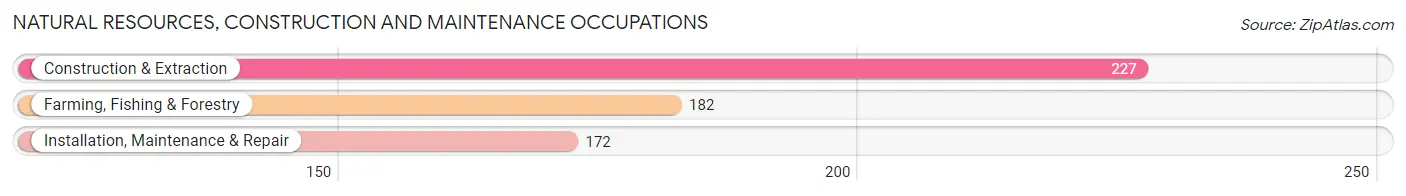
Natural Resources, Construction and Maintenance Occupations
The most common Natural Resources, Construction and Maintenance occupations in Valley County are Construction & Extraction (227 | 6.5%), Farming, Fishing & Forestry (182 | 5.2%), and Installation, Maintenance & Repair (172 | 5.0%).
Natural Resources, Construction and Maintenance Occupations by Sex
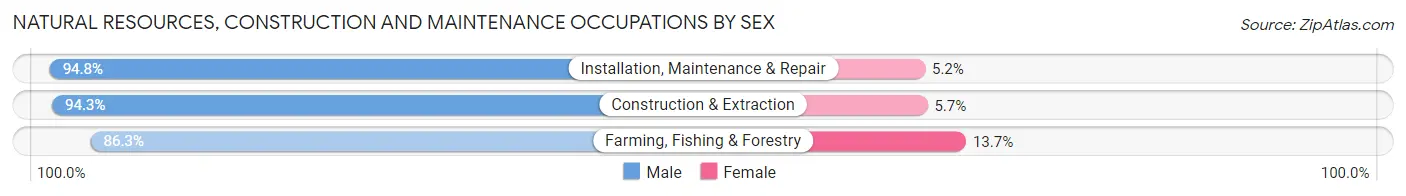
| Occupation | Male | Female |
| Farming, Fishing & Forestry | 157 (86.3%) | 25 (13.7%) |
| Construction & Extraction | 214 (94.3%) | 13 (5.7%) |
| Installation, Maintenance & Repair | 163 (94.8%) | 9 (5.2%) |
| Total (Category) | 534 (91.9%) | 47 (8.1%) |
| Total (Overall) | 1,851 (53.3%) | 1,620 (46.7%) |
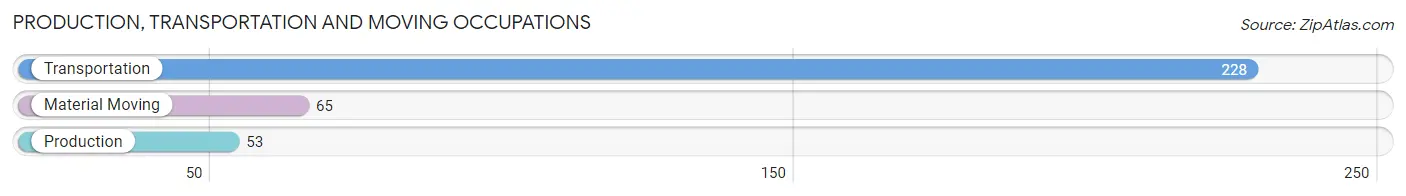
Production, Transportation and Moving Occupations
The most common Production, Transportation and Moving occupations in Valley County are Transportation (228 | 6.6%), Material Moving (65 | 1.9%), and Production (53 | 1.5%).
Production, Transportation and Moving Occupations by Sex
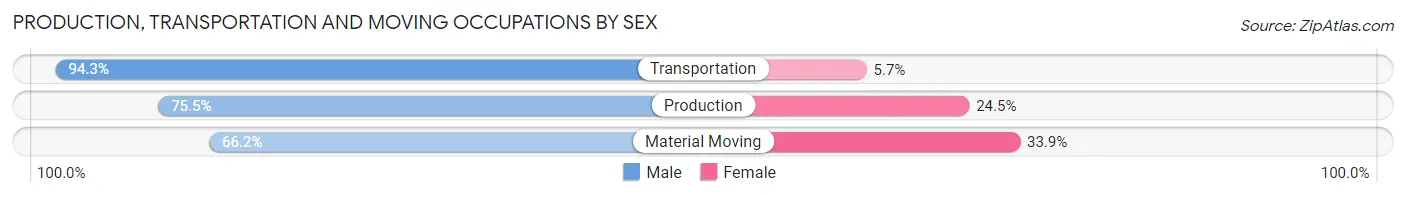
| Occupation | Male | Female |
| Production | 40 (75.5%) | 13 (24.5%) |
| Transportation | 215 (94.3%) | 13 (5.7%) |
| Material Moving | 43 (66.1%) | 22 (33.9%) |
| Total (Category) | 298 (86.1%) | 48 (13.9%) |
| Total (Overall) | 1,851 (53.3%) | 1,620 (46.7%) |
Employment Industries by Sex in Valley County
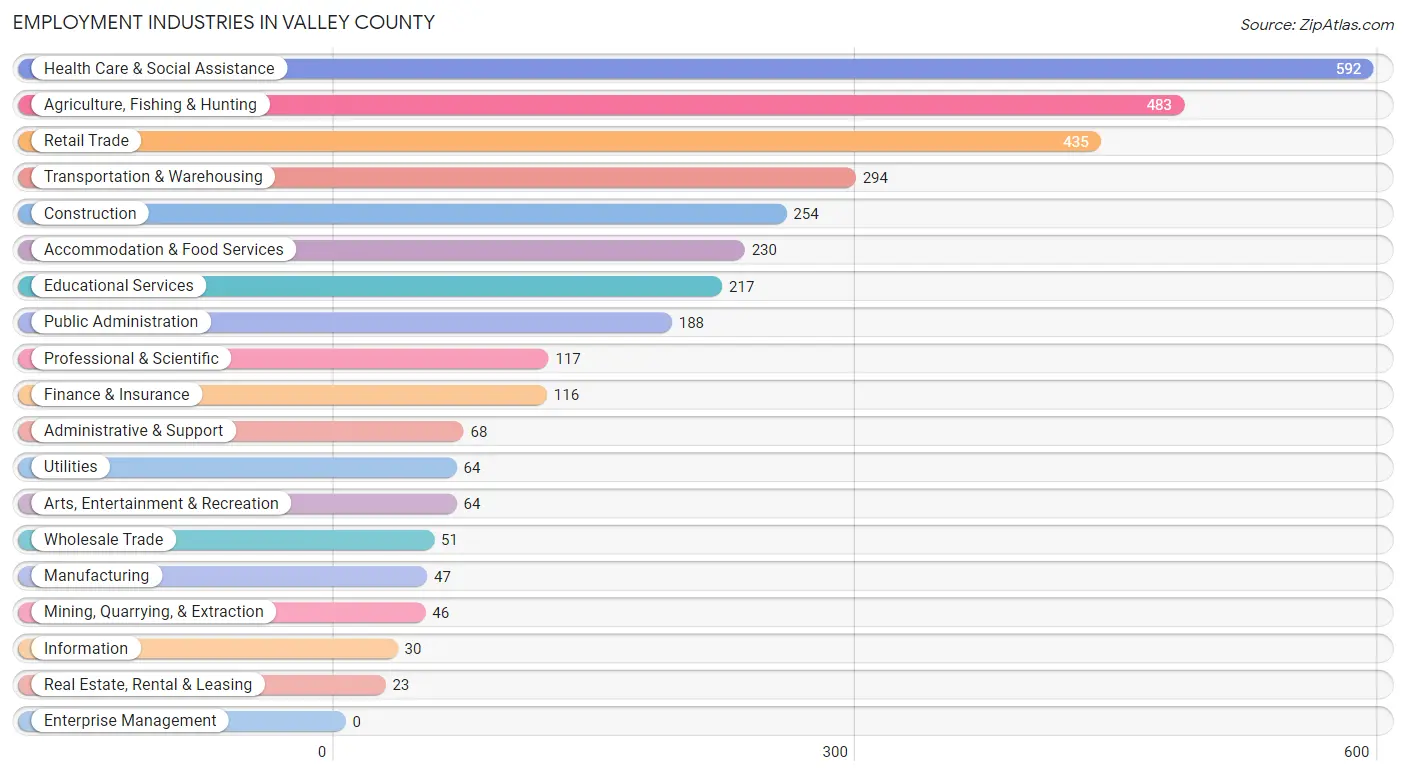
Employment Industries in Valley County
The major employment industries in Valley County include Health Care & Social Assistance (592 | 17.1%), Agriculture, Fishing & Hunting (483 | 13.9%), Retail Trade (435 | 12.5%), Transportation & Warehousing (294 | 8.5%), and Construction (254 | 7.3%).
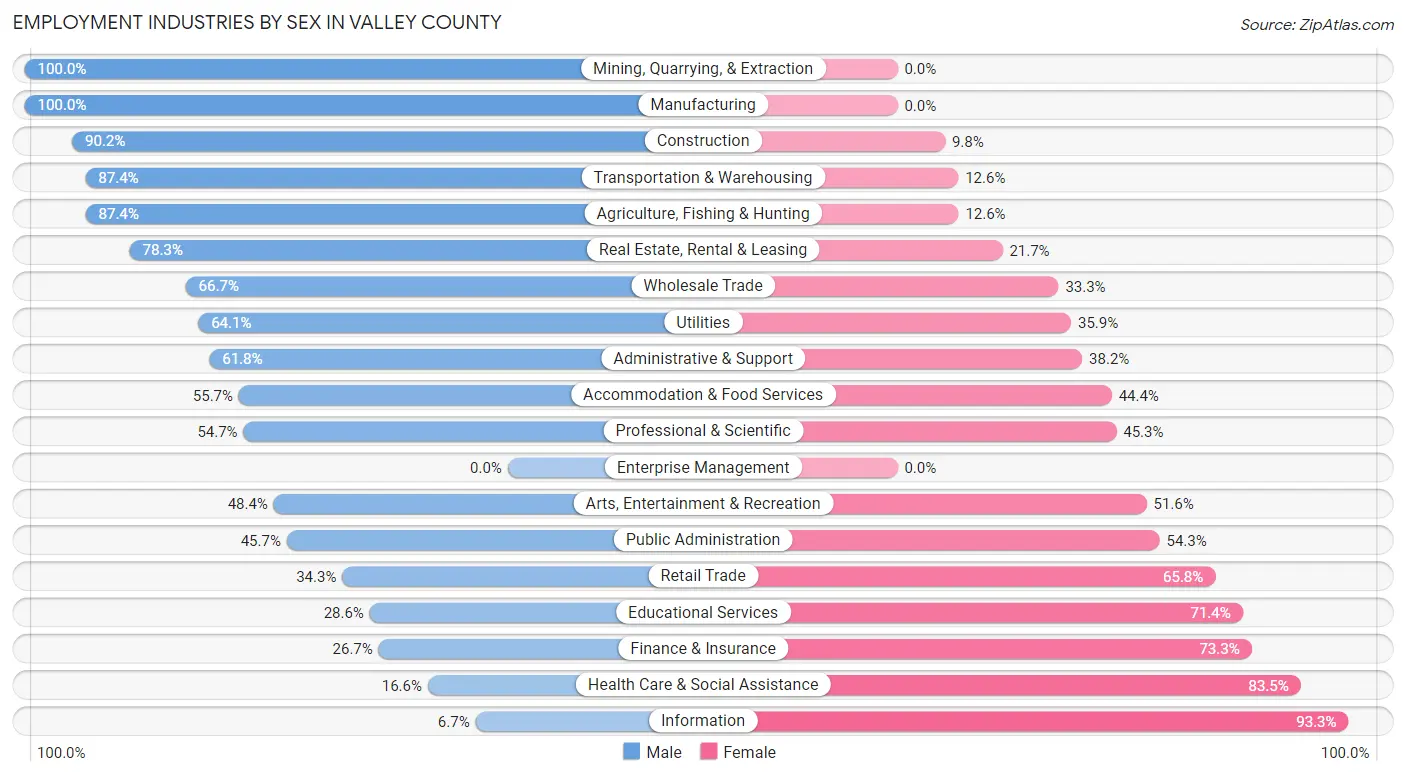
Employment Industries by Sex in Valley County
The Valley County industries that see more men than women are Mining, Quarrying, & Extraction (100.0%), Manufacturing (100.0%), and Construction (90.2%), whereas the industries that tend to have a higher number of women are Information (93.3%), Health Care & Social Assistance (83.5%), and Finance & Insurance (73.3%).
| Industry | Male | Female |
| Agriculture, Fishing & Hunting | 422 (87.4%) | 61 (12.6%) |
| Mining, Quarrying, & Extraction | 46 (100.0%) | 0 (0.0%) |
| Construction | 229 (90.2%) | 25 (9.8%) |
| Manufacturing | 47 (100.0%) | 0 (0.0%) |
| Wholesale Trade | 34 (66.7%) | 17 (33.3%) |
| Retail Trade | 149 (34.3%) | 286 (65.7%) |
| Transportation & Warehousing | 257 (87.4%) | 37 (12.6%) |
| Utilities | 41 (64.1%) | 23 (35.9%) |
| Information | 2 (6.7%) | 28 (93.3%) |
| Finance & Insurance | 31 (26.7%) | 85 (73.3%) |
| Real Estate, Rental & Leasing | 18 (78.3%) | 5 (21.7%) |
| Professional & Scientific | 64 (54.7%) | 53 (45.3%) |
| Enterprise Management | 0 (0.0%) | 0 (0.0%) |
| Administrative & Support | 42 (61.8%) | 26 (38.2%) |
| Educational Services | 62 (28.6%) | 155 (71.4%) |
| Health Care & Social Assistance | 98 (16.6%) | 494 (83.5%) |
| Arts, Entertainment & Recreation | 31 (48.4%) | 33 (51.6%) |
| Accommodation & Food Services | 128 (55.6%) | 102 (44.4%) |
| Public Administration | 86 (45.7%) | 102 (54.3%) |
| Total | 1,851 (53.3%) | 1,620 (46.7%) |
Education in Valley County
School Enrollment in Valley County
The most common levels of schooling among the 1,759 students in Valley County are high school (465 | 26.4%), middle school (419 | 23.8%), and elementary school (322 | 18.3%).
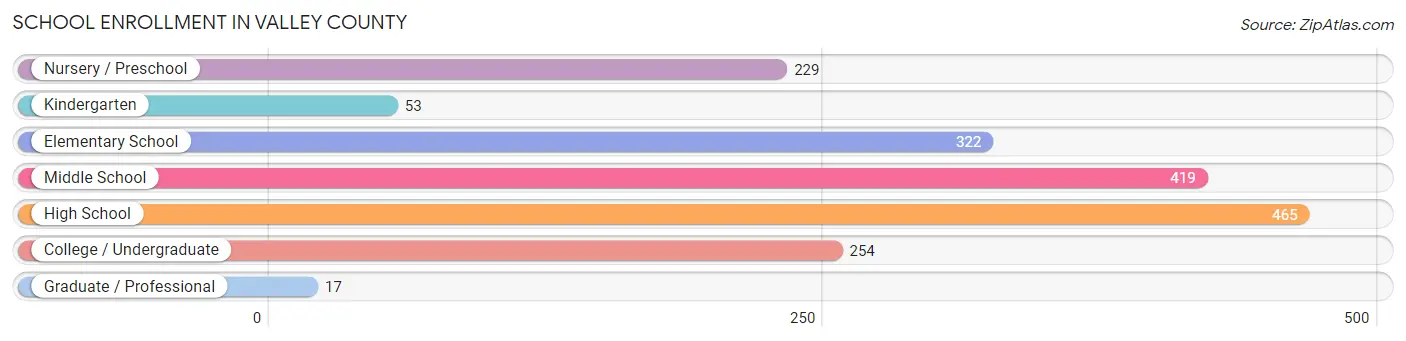
| School Level | # Students | % Students |
| Nursery / Preschool | 229 | 13.0% |
| Kindergarten | 53 | 3.0% |
| Elementary School | 322 | 18.3% |
| Middle School | 419 | 23.8% |
| High School | 465 | 26.4% |
| College / Undergraduate | 254 | 14.4% |
| Graduate / Professional | 17 | 1.0% |
| Total | 1,759 | 100.0% |
School Enrollment by Age by Funding Source in Valley County
Out of a total of 1,759 students who are enrolled in schools in Valley County, 213 (12.1%) attend a private institution, while the remaining 1,546 (87.9%) are enrolled in public schools. The age group of 3 to 4 year olds has the highest likelihood of being enrolled in private schools, with 35 (50.7% in the age bracket) enrolled. Conversely, the age group of 18 to 19 year olds has the lowest likelihood of being enrolled in a private school, with 164 (100.0% in the age bracket) attending a public institution.
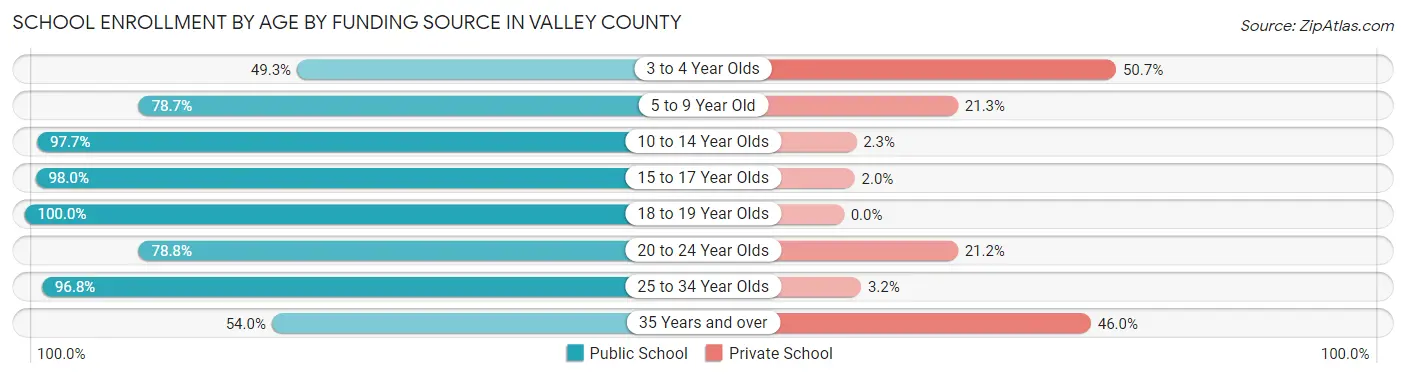
| Age Bracket | Public School | Private School |
| 3 to 4 Year Olds | 34 (49.3%) | 35 (50.7%) |
| 5 to 9 Year Old | 385 (78.7%) | 104 (21.3%) |
| 10 to 14 Year Olds | 461 (97.7%) | 11 (2.3%) |
| 15 to 17 Year Olds | 290 (98.0%) | 6 (2.0%) |
| 18 to 19 Year Olds | 164 (100.0%) | 0 (0.0%) |
| 20 to 24 Year Olds | 89 (78.8%) | 24 (21.2%) |
| 25 to 34 Year Olds | 90 (96.8%) | 3 (3.2%) |
| 35 Years and over | 34 (54.0%) | 29 (46.0%) |
| Total | 1,546 (87.9%) | 213 (12.1%) |
Educational Attainment by Field of Study in Valley County
Business (288 | 25.9%), education (280 | 25.2%), social sciences (106 | 9.5%), bio, nature & agricultural (97 | 8.7%), and science & technology (88 | 7.9%) are the most common fields of study among 1,113 individuals in Valley County who have obtained a bachelor's degree or higher.
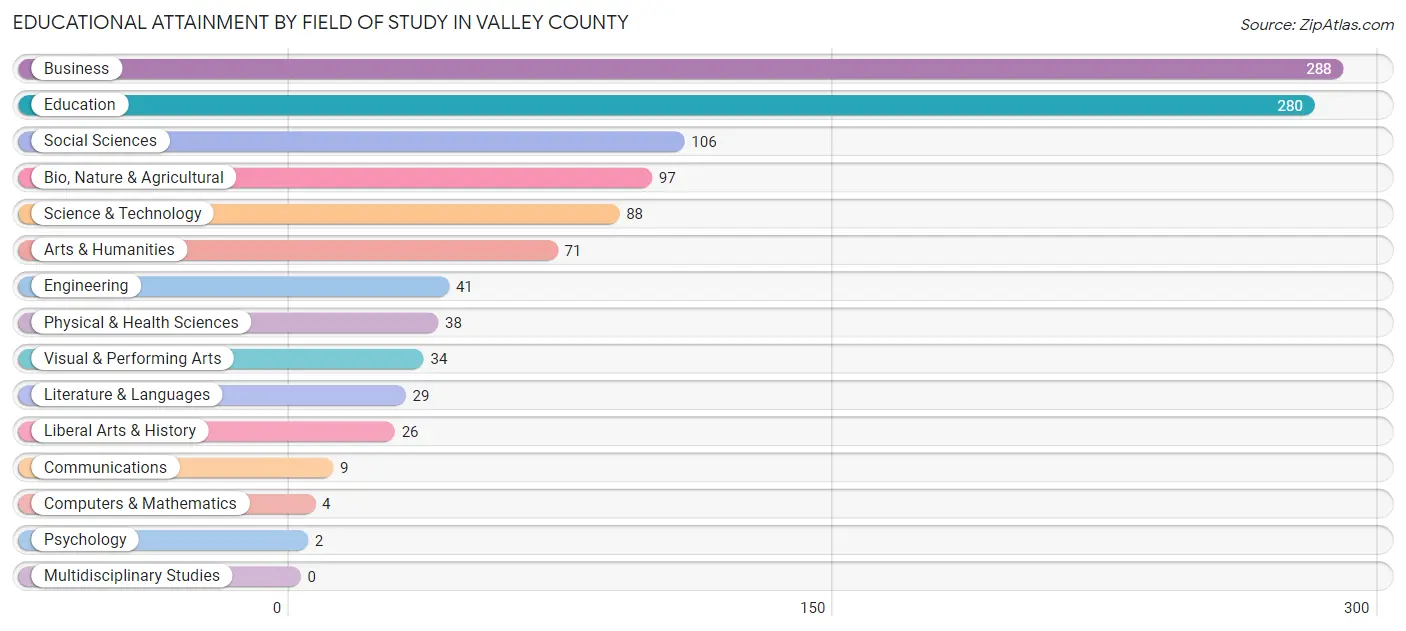
| Field of Study | # Graduates | % Graduates |
| Computers & Mathematics | 4 | 0.4% |
| Bio, Nature & Agricultural | 97 | 8.7% |
| Physical & Health Sciences | 38 | 3.4% |
| Psychology | 2 | 0.2% |
| Social Sciences | 106 | 9.5% |
| Engineering | 41 | 3.7% |
| Multidisciplinary Studies | 0 | 0.0% |
| Science & Technology | 88 | 7.9% |
| Business | 288 | 25.9% |
| Education | 280 | 25.2% |
| Literature & Languages | 29 | 2.6% |
| Liberal Arts & History | 26 | 2.3% |
| Visual & Performing Arts | 34 | 3.0% |
| Communications | 9 | 0.8% |
| Arts & Humanities | 71 | 6.4% |
| Total | 1,113 | 100.0% |
Transportation & Commute in Valley County
Vehicle Availability by Sex in Valley County
The most prevalent vehicle ownership categories in Valley County are males with 3 vehicles (525, accounting for 29.5%) and females with 3 vehicles (593, making up 33.9%).
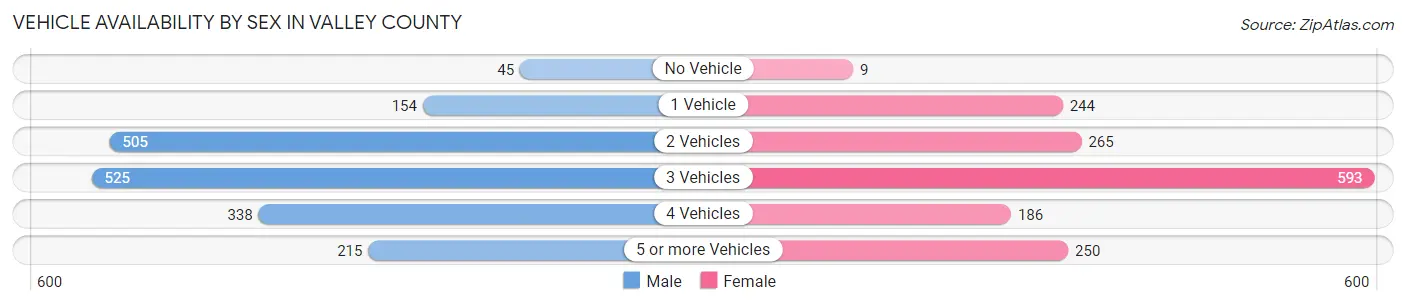
| Vehicles Available | Male | Female |
| No Vehicle | 45 (2.5%) | 9 (0.6%) |
| 1 Vehicle | 154 (8.6%) | 244 (15.8%) |
| 2 Vehicles | 505 (28.3%) | 265 (17.1%) |
| 3 Vehicles | 525 (29.5%) | 593 (38.3%) |
| 4 Vehicles | 338 (19.0%) | 186 (12.0%) |
| 5 or more Vehicles | 215 (12.1%) | 250 (16.2%) |
| Total | 1,782 (100.0%) | 1,547 (100.0%) |
Commute Time in Valley County
The most frequently occuring commute durations in Valley County are 5 to 9 minutes (1,025 commuters, 35.7%), less than 5 minutes (477 commuters, 16.6%), and 10 to 14 minutes (451 commuters, 15.7%).
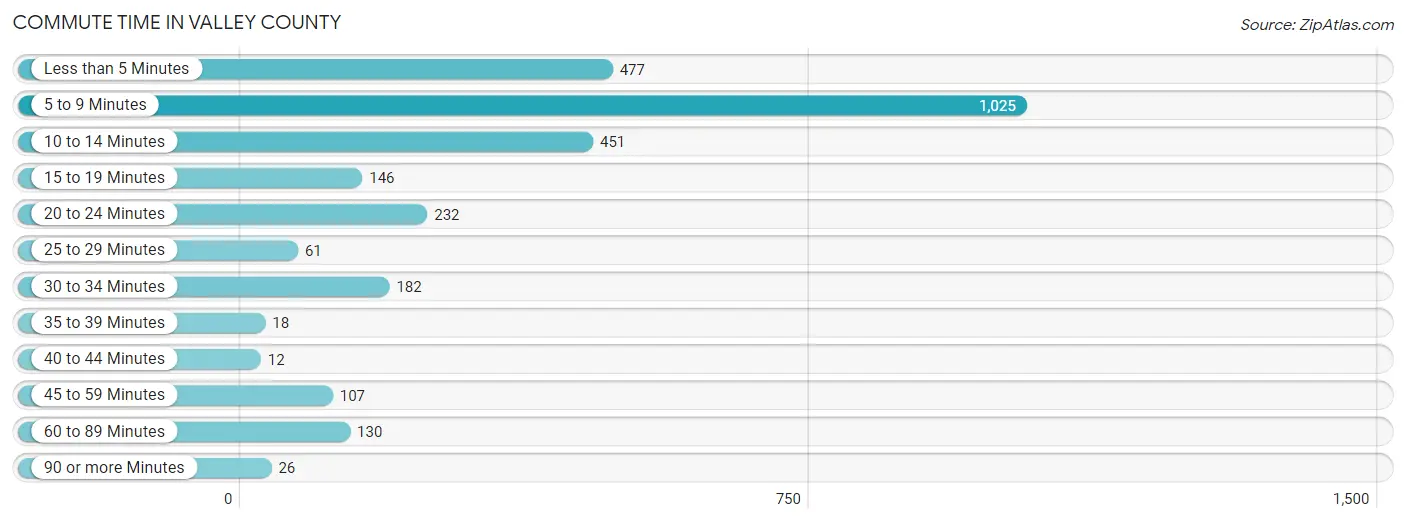
| Commute Time | # Commuters | % Commuters |
| Less than 5 Minutes | 477 | 16.6% |
| 5 to 9 Minutes | 1,025 | 35.7% |
| 10 to 14 Minutes | 451 | 15.7% |
| 15 to 19 Minutes | 146 | 5.1% |
| 20 to 24 Minutes | 232 | 8.1% |
| 25 to 29 Minutes | 61 | 2.1% |
| 30 to 34 Minutes | 182 | 6.4% |
| 35 to 39 Minutes | 18 | 0.6% |
| 40 to 44 Minutes | 12 | 0.4% |
| 45 to 59 Minutes | 107 | 3.7% |
| 60 to 89 Minutes | 130 | 4.5% |
| 90 or more Minutes | 26 | 0.9% |
Commute Time by Sex in Valley County
The most common commute times in Valley County are 5 to 9 minutes (471 commuters, 32.8%) for males and 5 to 9 minutes (554 commuters, 38.8%) for females.
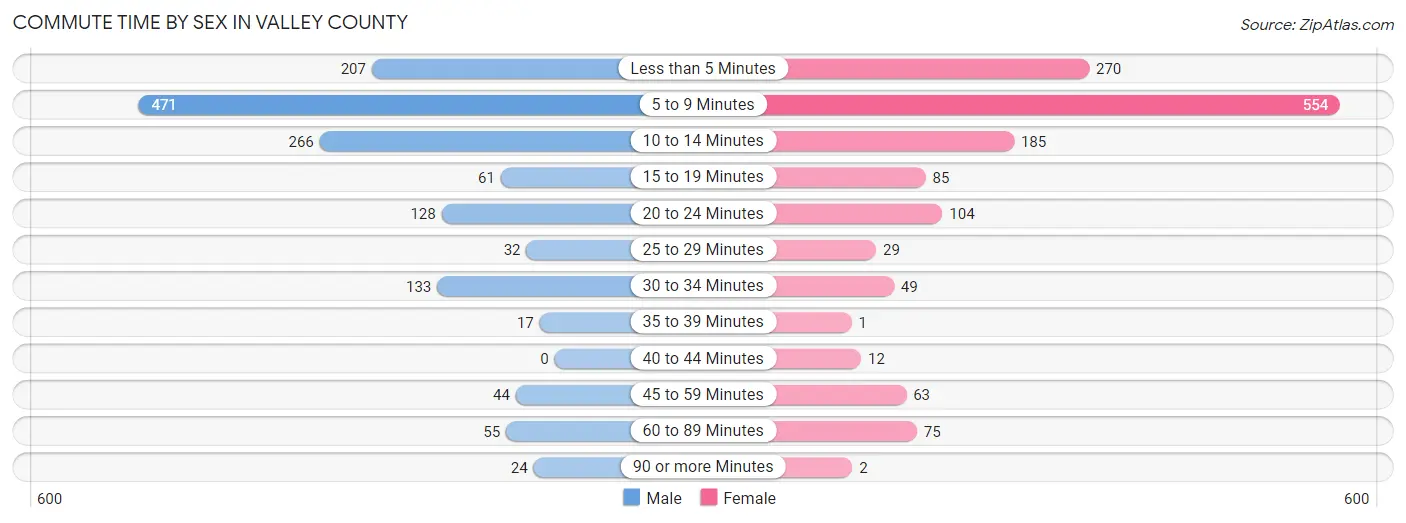
| Commute Time | Male | Female |
| Less than 5 Minutes | 207 (14.4%) | 270 (18.9%) |
| 5 to 9 Minutes | 471 (32.8%) | 554 (38.8%) |
| 10 to 14 Minutes | 266 (18.5%) | 185 (13.0%) |
| 15 to 19 Minutes | 61 (4.2%) | 85 (5.9%) |
| 20 to 24 Minutes | 128 (8.9%) | 104 (7.3%) |
| 25 to 29 Minutes | 32 (2.2%) | 29 (2.0%) |
| 30 to 34 Minutes | 133 (9.2%) | 49 (3.4%) |
| 35 to 39 Minutes | 17 (1.2%) | 1 (0.1%) |
| 40 to 44 Minutes | 0 (0.0%) | 12 (0.8%) |
| 45 to 59 Minutes | 44 (3.1%) | 63 (4.4%) |
| 60 to 89 Minutes | 55 (3.8%) | 75 (5.2%) |
| 90 or more Minutes | 24 (1.7%) | 2 (0.1%) |
Time of Departure to Work by Sex in Valley County
The most frequent times of departure to work in Valley County are 6:30 AM to 6:59 AM (272, 18.9%) for males and 7:30 AM to 7:59 AM (245, 17.1%) for females.
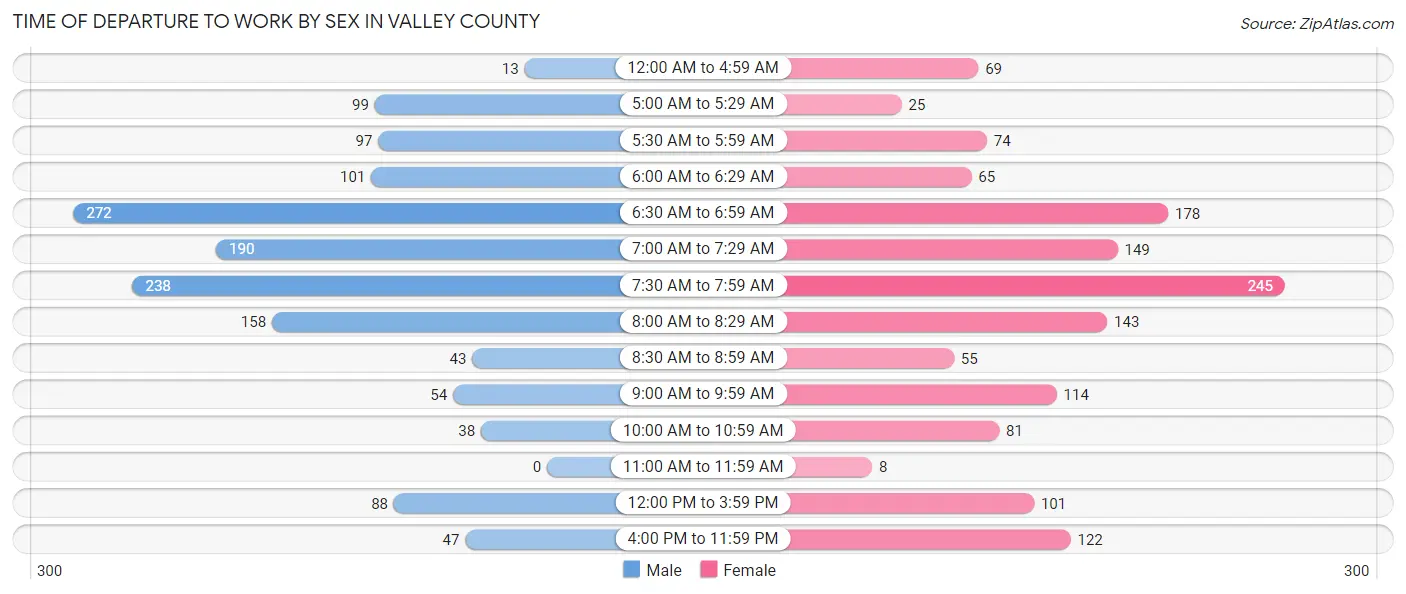
| Time of Departure | Male | Female |
| 12:00 AM to 4:59 AM | 13 (0.9%) | 69 (4.8%) |
| 5:00 AM to 5:29 AM | 99 (6.9%) | 25 (1.8%) |
| 5:30 AM to 5:59 AM | 97 (6.8%) | 74 (5.2%) |
| 6:00 AM to 6:29 AM | 101 (7.0%) | 65 (4.5%) |
| 6:30 AM to 6:59 AM | 272 (18.9%) | 178 (12.5%) |
| 7:00 AM to 7:29 AM | 190 (13.2%) | 149 (10.4%) |
| 7:30 AM to 7:59 AM | 238 (16.6%) | 245 (17.1%) |
| 8:00 AM to 8:29 AM | 158 (11.0%) | 143 (10.0%) |
| 8:30 AM to 8:59 AM | 43 (3.0%) | 55 (3.8%) |
| 9:00 AM to 9:59 AM | 54 (3.8%) | 114 (8.0%) |
| 10:00 AM to 10:59 AM | 38 (2.6%) | 81 (5.7%) |
| 11:00 AM to 11:59 AM | 0 (0.0%) | 8 (0.6%) |
| 12:00 PM to 3:59 PM | 88 (6.1%) | 101 (7.1%) |
| 4:00 PM to 11:59 PM | 47 (3.3%) | 122 (8.5%) |
| Total | 1,438 (100.0%) | 1,429 (100.0%) |
Housing Occupancy in Valley County
Occupancy by Ownership in Valley County
Of the total 2,833 dwellings in Valley County, owner-occupied units account for 2,145 (75.7%), while renter-occupied units make up 688 (24.3%).
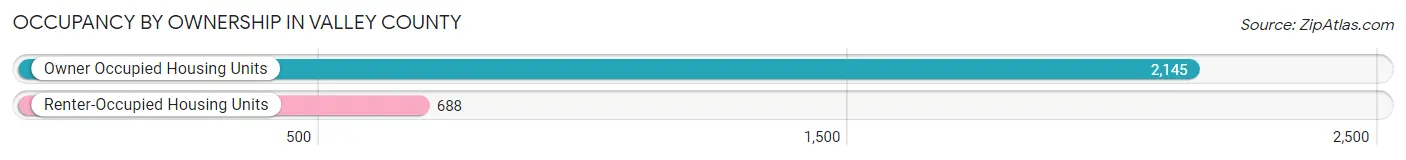
| Occupancy | # Housing Units | % Housing Units |
| Owner Occupied Housing Units | 2,145 | 75.7% |
| Renter-Occupied Housing Units | 688 | 24.3% |
| Total Occupied Housing Units | 2,833 | 100.0% |
Occupancy by Household Size in Valley County
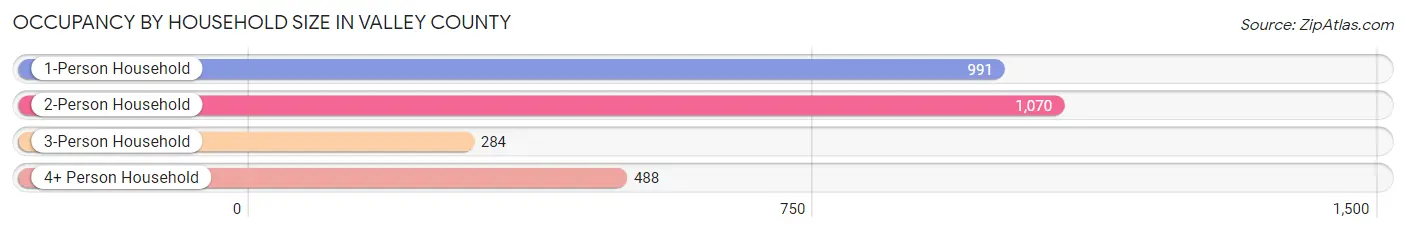
| Household Size | # Housing Units | % Housing Units |
| 1-Person Household | 991 | 35.0% |
| 2-Person Household | 1,070 | 37.8% |
| 3-Person Household | 284 | 10.0% |
| 4+ Person Household | 488 | 17.2% |
| Total Housing Units | 2,833 | 100.0% |
Occupancy by Ownership by Household Size in Valley County
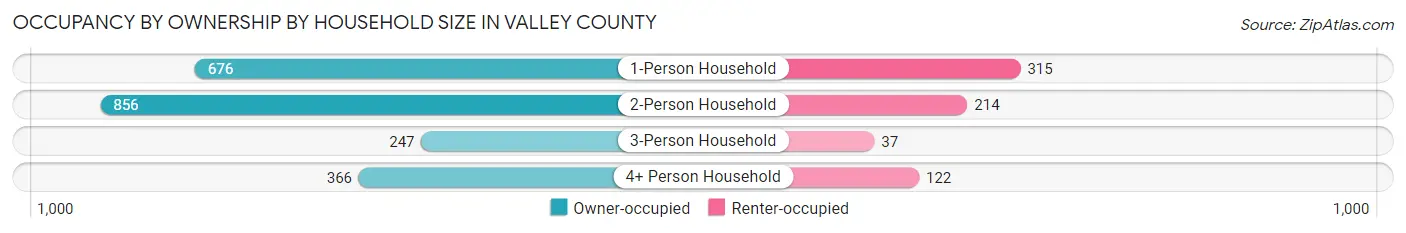
| Household Size | Owner-occupied | Renter-occupied |
| 1-Person Household | 676 (68.2%) | 315 (31.8%) |
| 2-Person Household | 856 (80.0%) | 214 (20.0%) |
| 3-Person Household | 247 (87.0%) | 37 (13.0%) |
| 4+ Person Household | 366 (75.0%) | 122 (25.0%) |
| Total Housing Units | 2,145 (75.7%) | 688 (24.3%) |
Occupancy by Educational Attainment in Valley County
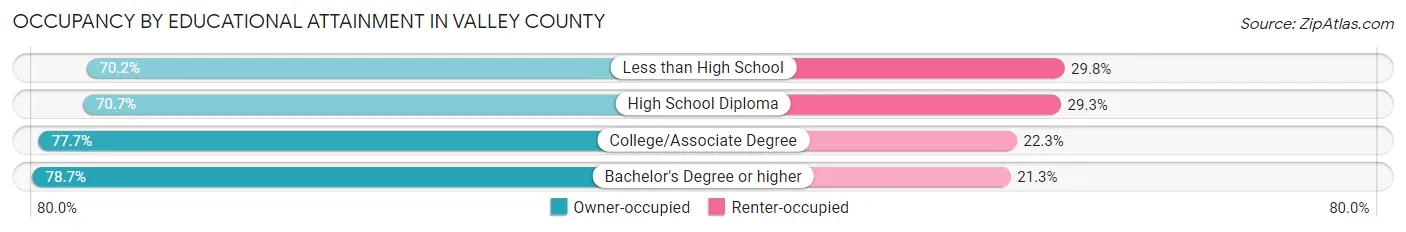
| Household Size | Owner-occupied | Renter-occupied |
| Less than High School | 120 (70.2%) | 51 (29.8%) |
| High School Diploma | 515 (70.7%) | 213 (29.3%) |
| College/Associate Degree | 992 (77.7%) | 284 (22.3%) |
| Bachelor's Degree or higher | 518 (78.7%) | 140 (21.3%) |
Occupancy by Age of Householder in Valley County
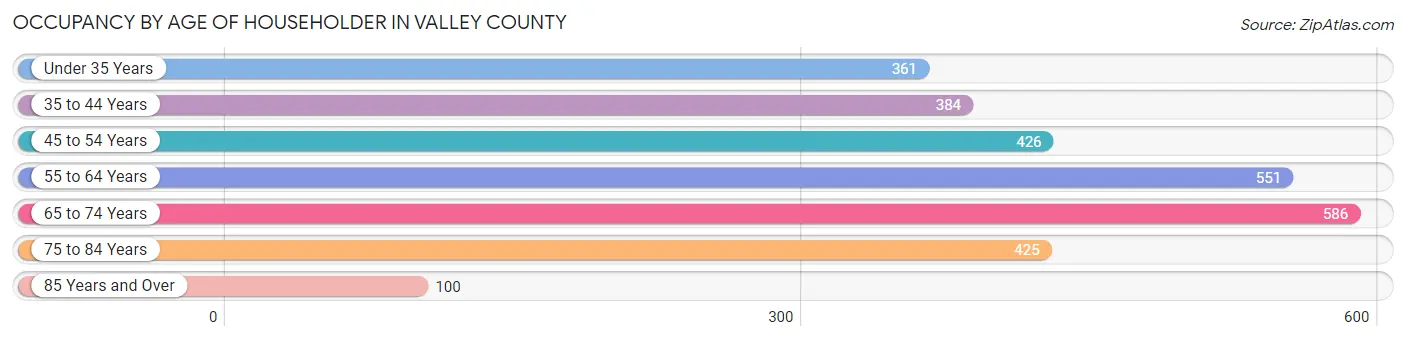
| Age Bracket | # Households | % Households |
| Under 35 Years | 361 | 12.7% |
| 35 to 44 Years | 384 | 13.6% |
| 45 to 54 Years | 426 | 15.0% |
| 55 to 64 Years | 551 | 19.5% |
| 65 to 74 Years | 586 | 20.7% |
| 75 to 84 Years | 425 | 15.0% |
| 85 Years and Over | 100 | 3.5% |
| Total | 2,833 | 100.0% |
Housing Finances in Valley County
Median Income by Occupancy in Valley County
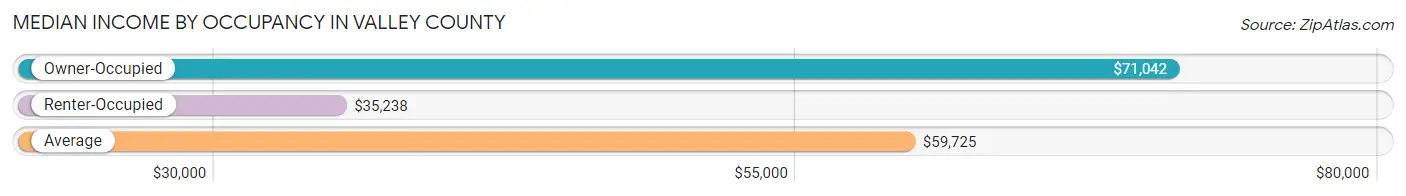
| Occupancy Type | # Households | Median Income |
| Owner-Occupied | 2,145 (75.7%) | $71,042 |
| Renter-Occupied | 688 (24.3%) | $35,238 |
| Average | 2,833 (100.0%) | $59,725 |
Occupancy by Householder Income Bracket in Valley County
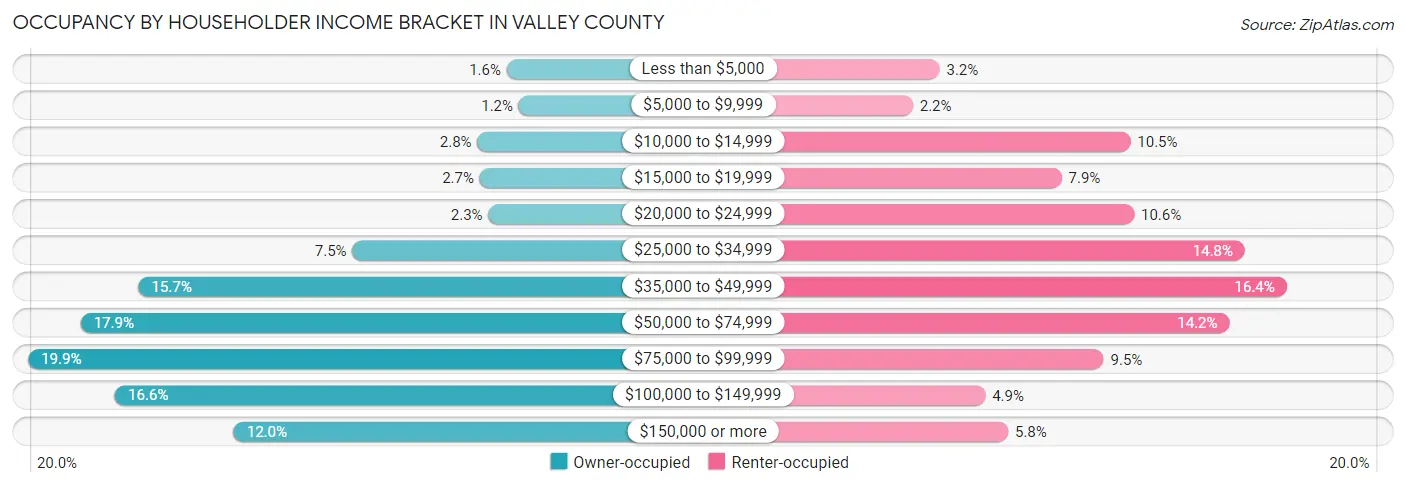
| Income Bracket | Owner-occupied | Renter-occupied |
| Less than $5,000 | 35 (1.6%) | 22 (3.2%) |
| $5,000 to $9,999 | 25 (1.2%) | 15 (2.2%) |
| $10,000 to $14,999 | 59 (2.8%) | 72 (10.5%) |
| $15,000 to $19,999 | 57 (2.7%) | 54 (7.9%) |
| $20,000 to $24,999 | 50 (2.3%) | 73 (10.6%) |
| $25,000 to $34,999 | 161 (7.5%) | 102 (14.8%) |
| $35,000 to $49,999 | 336 (15.7%) | 113 (16.4%) |
| $50,000 to $74,999 | 383 (17.9%) | 98 (14.2%) |
| $75,000 to $99,999 | 426 (19.9%) | 65 (9.5%) |
| $100,000 to $149,999 | 355 (16.6%) | 34 (4.9%) |
| $150,000 or more | 258 (12.0%) | 40 (5.8%) |
| Total | 2,145 (100.0%) | 688 (100.0%) |
Monthly Housing Cost Tiers in Valley County
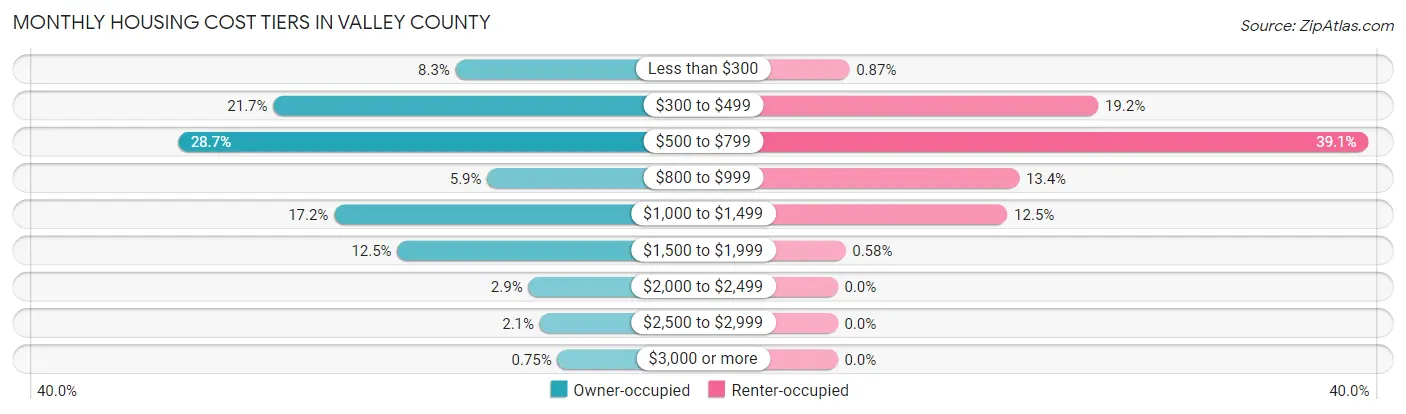
| Monthly Cost | Owner-occupied | Renter-occupied |
| Less than $300 | 177 (8.3%) | 6 (0.9%) |
| $300 to $499 | 465 (21.7%) | 132 (19.2%) |
| $500 to $799 | 616 (28.7%) | 269 (39.1%) |
| $800 to $999 | 127 (5.9%) | 92 (13.4%) |
| $1,000 to $1,499 | 369 (17.2%) | 86 (12.5%) |
| $1,500 to $1,999 | 269 (12.5%) | 4 (0.6%) |
| $2,000 to $2,499 | 62 (2.9%) | 0 (0.0%) |
| $2,500 to $2,999 | 44 (2.1%) | 0 (0.0%) |
| $3,000 or more | 16 (0.7%) | 0 (0.0%) |
| Total | 2,145 (100.0%) | 688 (100.0%) |
Physical Housing Characteristics in Valley County
Housing Structures in Valley County
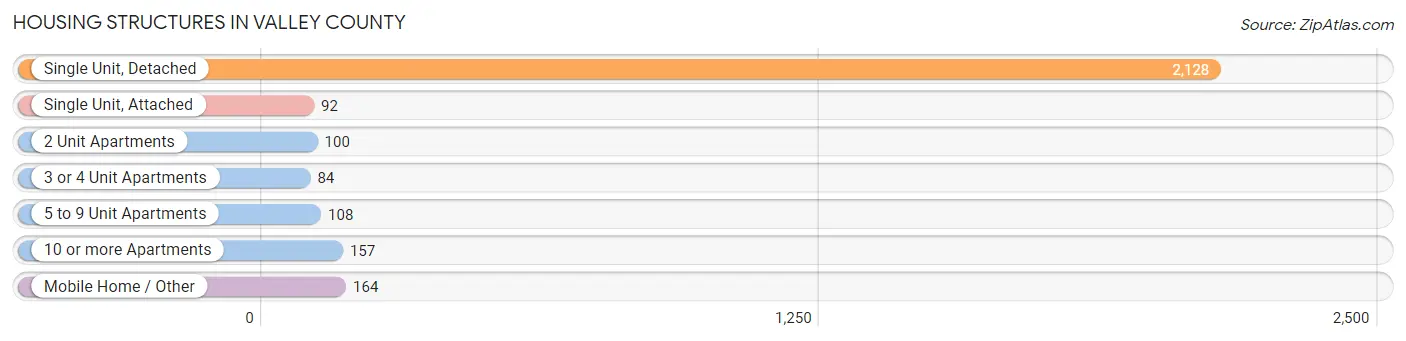
| Structure Type | # Housing Units | % Housing Units |
| Single Unit, Detached | 2,128 | 75.1% |
| Single Unit, Attached | 92 | 3.3% |
| 2 Unit Apartments | 100 | 3.5% |
| 3 or 4 Unit Apartments | 84 | 3.0% |
| 5 to 9 Unit Apartments | 108 | 3.8% |
| 10 or more Apartments | 157 | 5.5% |
| Mobile Home / Other | 164 | 5.8% |
| Total | 2,833 | 100.0% |
Housing Structures by Occupancy in Valley County
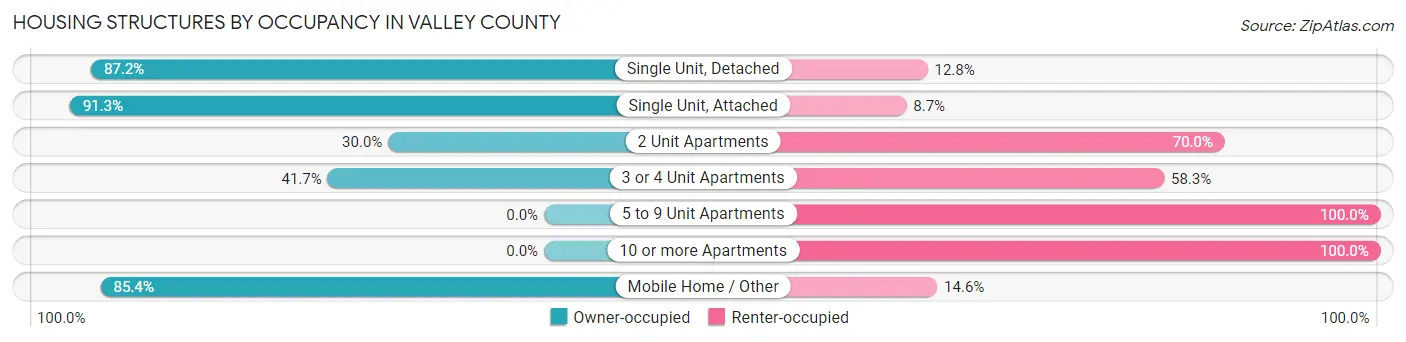
| Structure Type | Owner-occupied | Renter-occupied |
| Single Unit, Detached | 1,856 (87.2%) | 272 (12.8%) |
| Single Unit, Attached | 84 (91.3%) | 8 (8.7%) |
| 2 Unit Apartments | 30 (30.0%) | 70 (70.0%) |
| 3 or 4 Unit Apartments | 35 (41.7%) | 49 (58.3%) |
| 5 to 9 Unit Apartments | 0 (0.0%) | 108 (100.0%) |
| 10 or more Apartments | 0 (0.0%) | 157 (100.0%) |
| Mobile Home / Other | 140 (85.4%) | 24 (14.6%) |
| Total | 2,145 (75.7%) | 688 (24.3%) |
Housing Structures by Number of Rooms in Valley County
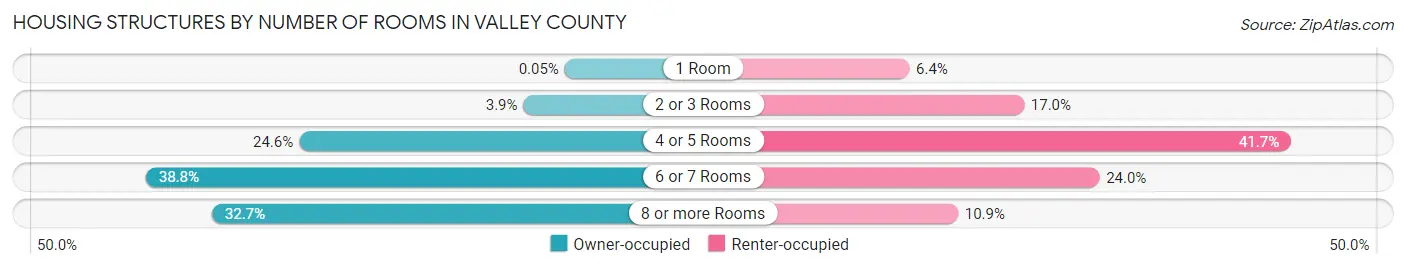
| Number of Rooms | Owner-occupied | Renter-occupied |
| 1 Room | 1 (0.1%) | 44 (6.4%) |
| 2 or 3 Rooms | 83 (3.9%) | 117 (17.0%) |
| 4 or 5 Rooms | 528 (24.6%) | 287 (41.7%) |
| 6 or 7 Rooms | 832 (38.8%) | 165 (24.0%) |
| 8 or more Rooms | 701 (32.7%) | 75 (10.9%) |
| Total | 2,145 (100.0%) | 688 (100.0%) |
Housing Structure by Heating Type in Valley County
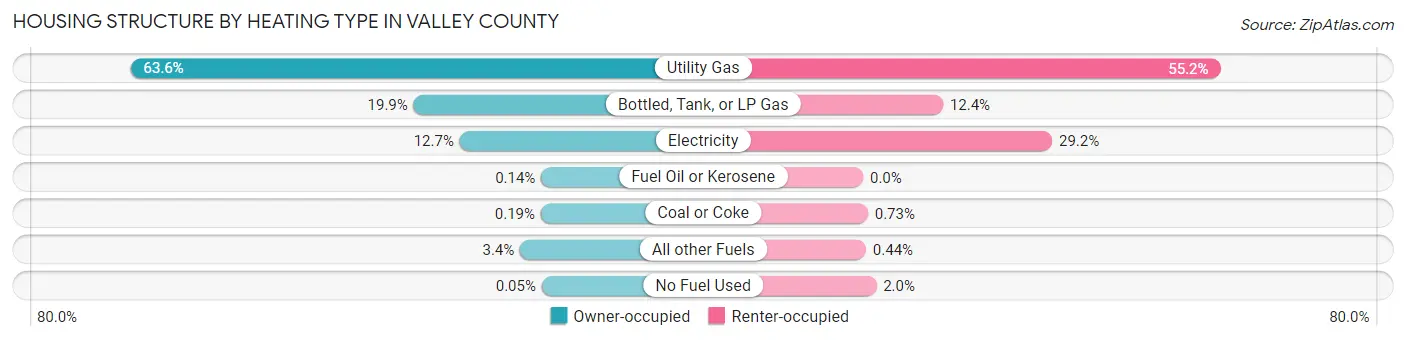
| Heating Type | Owner-occupied | Renter-occupied |
| Utility Gas | 1,365 (63.6%) | 380 (55.2%) |
| Bottled, Tank, or LP Gas | 426 (19.9%) | 85 (12.3%) |
| Electricity | 273 (12.7%) | 201 (29.2%) |
| Fuel Oil or Kerosene | 3 (0.1%) | 0 (0.0%) |
| Coal or Coke | 4 (0.2%) | 5 (0.7%) |
| All other Fuels | 73 (3.4%) | 3 (0.4%) |
| No Fuel Used | 1 (0.1%) | 14 (2.0%) |
| Total | 2,145 (100.0%) | 688 (100.0%) |
Household Vehicle Usage in Valley County
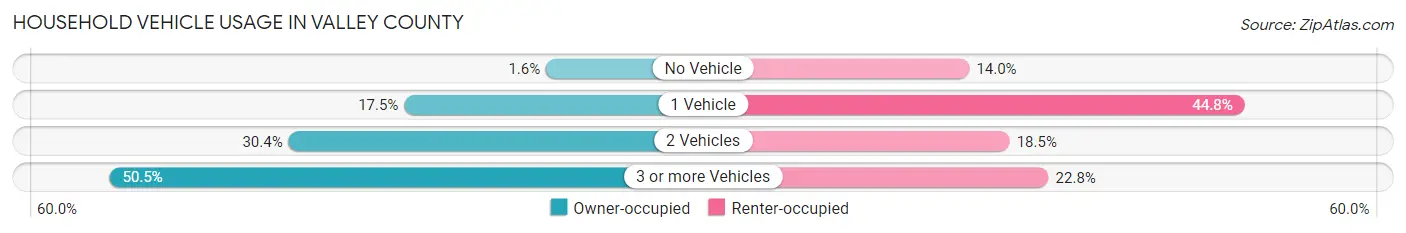
| Vehicles per Household | Owner-occupied | Renter-occupied |
| No Vehicle | 34 (1.6%) | 96 (14.0%) |
| 1 Vehicle | 375 (17.5%) | 308 (44.8%) |
| 2 Vehicles | 653 (30.4%) | 127 (18.5%) |
| 3 or more Vehicles | 1,083 (50.5%) | 157 (22.8%) |
| Total | 2,145 (100.0%) | 688 (100.0%) |
Real Estate & Mortgages in Valley County
Real Estate and Mortgage Overview in Valley County
| Characteristic | Without Mortgage | With Mortgage |
| Housing Units | 1,293 | 852 |
| Median Property Value | $164,000 | $207,700 |
| Median Household Income | $53,794 | $169 |
| Monthly Housing Costs | $503 | $16 |
| Real Estate Taxes | $1,726 | $8 |
Property Value by Mortgage Status in Valley County
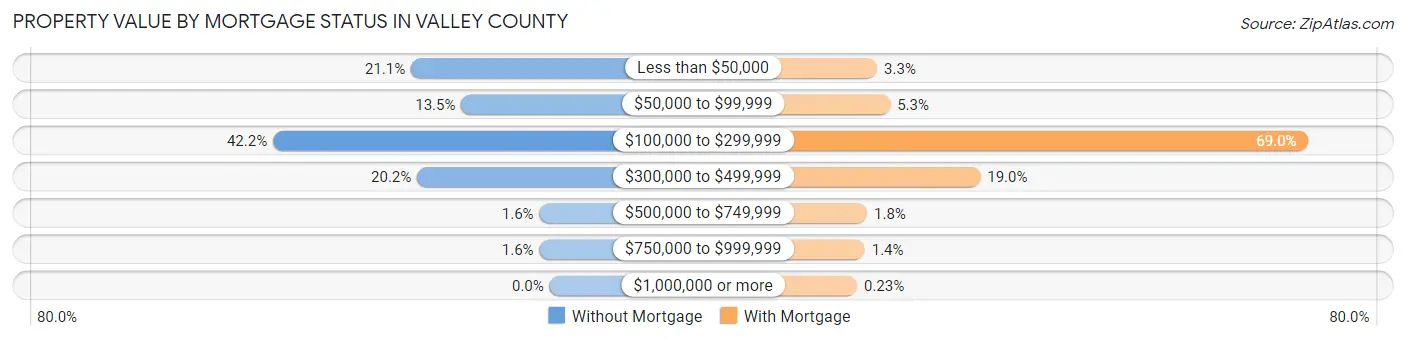
| Property Value | Without Mortgage | With Mortgage |
| Less than $50,000 | 273 (21.1%) | 28 (3.3%) |
| $50,000 to $99,999 | 174 (13.5%) | 45 (5.3%) |
| $100,000 to $299,999 | 545 (42.1%) | 588 (69.0%) |
| $300,000 to $499,999 | 261 (20.2%) | 162 (19.0%) |
| $500,000 to $749,999 | 20 (1.5%) | 15 (1.8%) |
| $750,000 to $999,999 | 20 (1.5%) | 12 (1.4%) |
| $1,000,000 or more | 0 (0.0%) | 2 (0.2%) |
| Total | 1,293 (100.0%) | 852 (100.0%) |
Household Income by Mortgage Status in Valley County
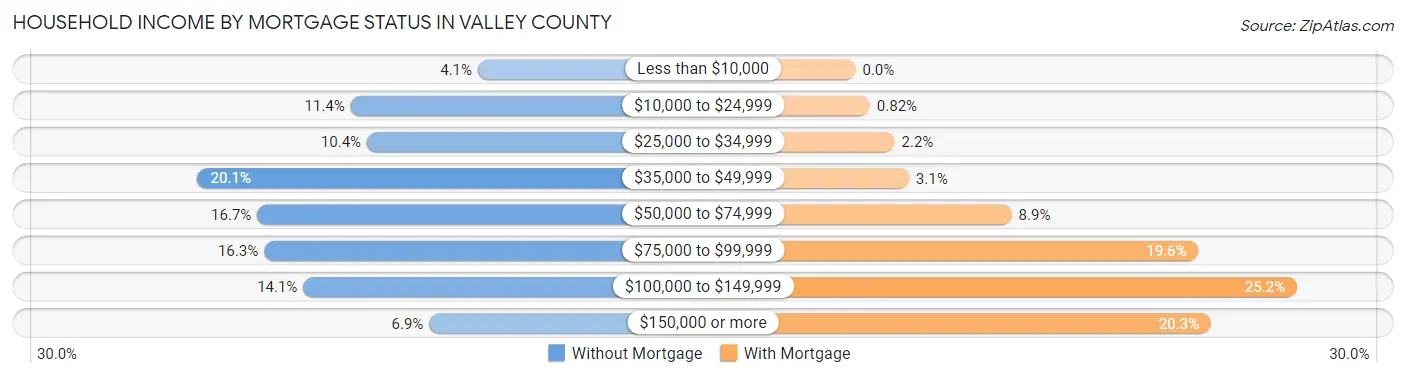
| Household Income | Without Mortgage | With Mortgage |
| Less than $10,000 | 53 (4.1%) | 0 (0.0%) |
| $10,000 to $24,999 | 147 (11.4%) | 7 (0.8%) |
| $25,000 to $34,999 | 135 (10.4%) | 19 (2.2%) |
| $35,000 to $49,999 | 260 (20.1%) | 26 (3.0%) |
| $50,000 to $74,999 | 216 (16.7%) | 76 (8.9%) |
| $75,000 to $99,999 | 211 (16.3%) | 167 (19.6%) |
| $100,000 to $149,999 | 182 (14.1%) | 215 (25.2%) |
| $150,000 or more | 89 (6.9%) | 173 (20.3%) |
| Total | 1,293 (100.0%) | 852 (100.0%) |
Property Value to Household Income Ratio in Valley County
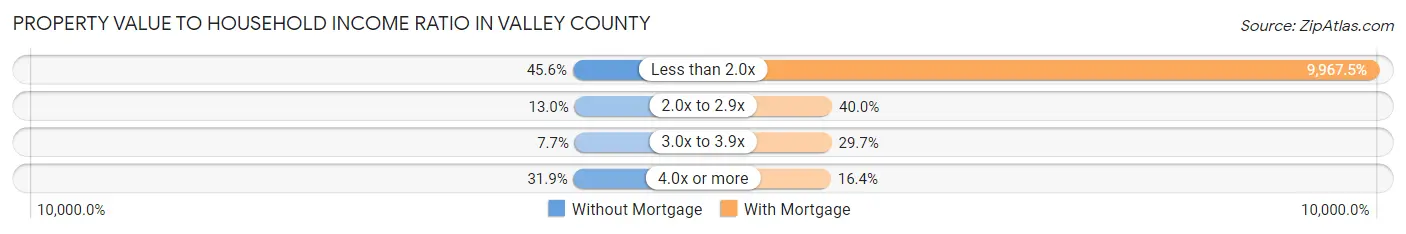
| Value-to-Income Ratio | Without Mortgage | With Mortgage |
| Less than 2.0x | 589 (45.6%) | 84,923 (9,967.5%) |
| 2.0x to 2.9x | 168 (13.0%) | 341 (40.0%) |
| 3.0x to 3.9x | 99 (7.7%) | 253 (29.7%) |
| 4.0x or more | 412 (31.9%) | 140 (16.4%) |
| Total | 1,293 (100.0%) | 852 (100.0%) |
Real Estate Taxes by Mortgage Status in Valley County
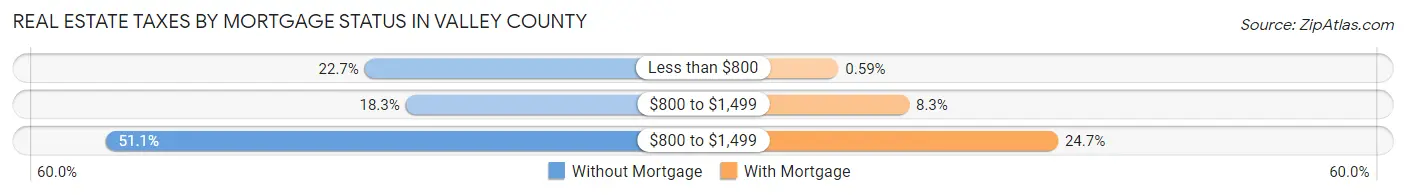
| Property Taxes | Without Mortgage | With Mortgage |
| Less than $800 | 294 (22.7%) | 5 (0.6%) |
| $800 to $1,499 | 236 (18.2%) | 71 (8.3%) |
| $800 to $1,499 | 661 (51.1%) | 210 (24.6%) |
| Total | 1,293 (100.0%) | 852 (100.0%) |
Health & Disability in Valley County
Health Insurance Coverage by Age in Valley County
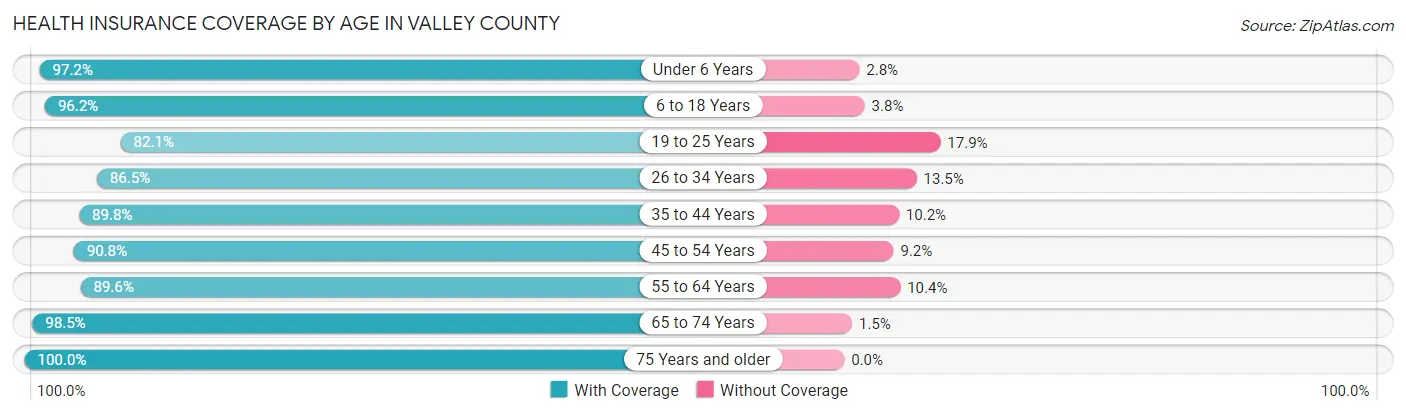
| Age Bracket | With Coverage | Without Coverage |
| Under 6 Years | 623 (97.2%) | 18 (2.8%) |
| 6 to 18 Years | 1,166 (96.2%) | 46 (3.8%) |
| 19 to 25 Years | 339 (82.1%) | 74 (17.9%) |
| 26 to 34 Years | 590 (86.5%) | 92 (13.5%) |
| 35 to 44 Years | 812 (89.8%) | 92 (10.2%) |
| 45 to 54 Years | 702 (90.8%) | 71 (9.2%) |
| 55 to 64 Years | 1,005 (89.6%) | 117 (10.4%) |
| 65 to 74 Years | 942 (98.5%) | 14 (1.5%) |
| 75 Years and older | 744 (100.0%) | 0 (0.0%) |
| Total | 6,923 (93.0%) | 524 (7.0%) |
Health Insurance Coverage by Citizenship Status in Valley County
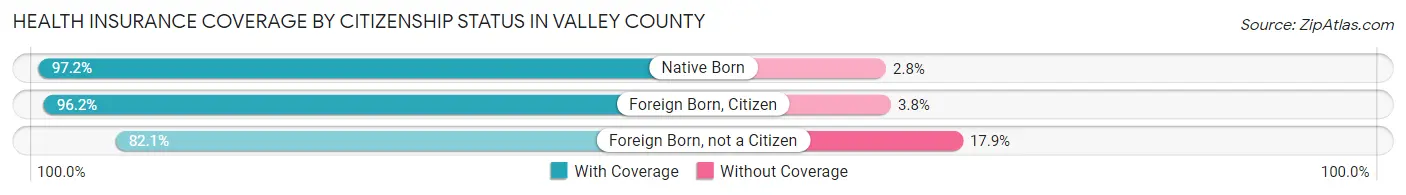
| Citizenship Status | With Coverage | Without Coverage |
| Native Born | 623 (97.2%) | 18 (2.8%) |
| Foreign Born, Citizen | 1,166 (96.2%) | 46 (3.8%) |
| Foreign Born, not a Citizen | 339 (82.1%) | 74 (17.9%) |
Health Insurance Coverage by Household Income in Valley County
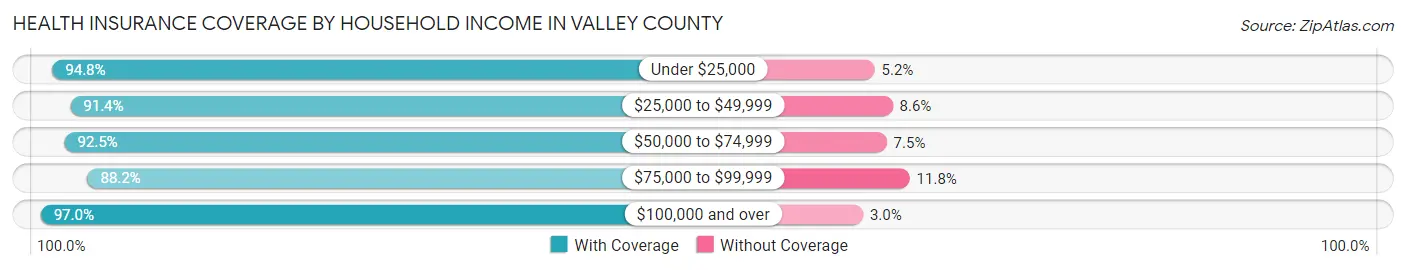
| Household Income | With Coverage | Without Coverage |
| Under $25,000 | 692 (94.8%) | 38 (5.2%) |
| $25,000 to $49,999 | 1,492 (91.4%) | 140 (8.6%) |
| $50,000 to $74,999 | 1,152 (92.5%) | 93 (7.5%) |
| $75,000 to $99,999 | 1,393 (88.2%) | 186 (11.8%) |
| $100,000 and over | 2,144 (97.0%) | 67 (3.0%) |
Public vs Private Health Insurance Coverage by Age in Valley County
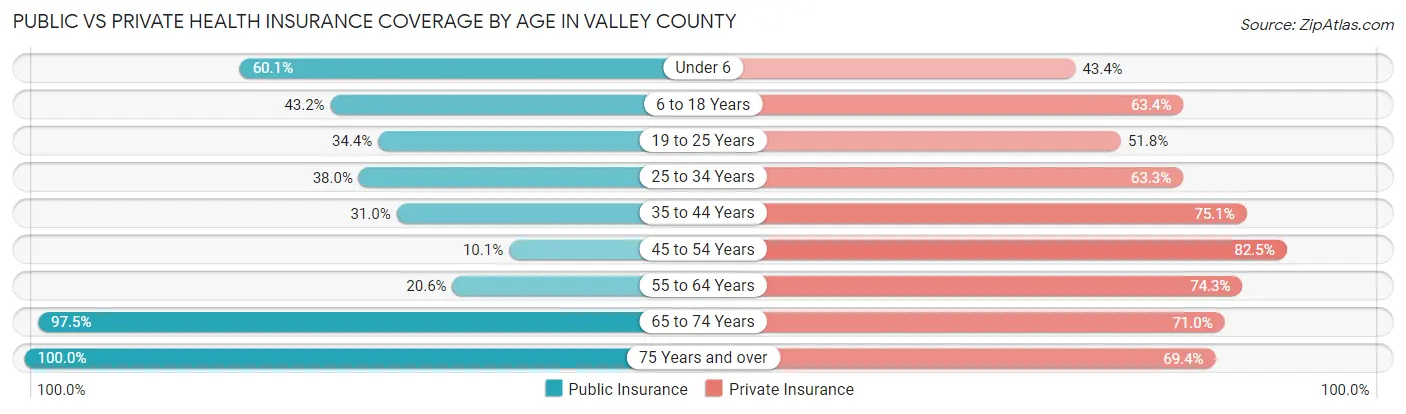
| Age Bracket | Public Insurance | Private Insurance |
| Under 6 | 385 (60.1%) | 278 (43.4%) |
| 6 to 18 Years | 524 (43.2%) | 768 (63.4%) |
| 19 to 25 Years | 142 (34.4%) | 214 (51.8%) |
| 25 to 34 Years | 259 (38.0%) | 432 (63.3%) |
| 35 to 44 Years | 280 (31.0%) | 679 (75.1%) |
| 45 to 54 Years | 78 (10.1%) | 638 (82.5%) |
| 55 to 64 Years | 231 (20.6%) | 834 (74.3%) |
| 65 to 74 Years | 932 (97.5%) | 679 (71.0%) |
| 75 Years and over | 744 (100.0%) | 516 (69.4%) |
| Total | 3,575 (48.0%) | 5,038 (67.6%) |
Disability Status by Sex by Age in Valley County
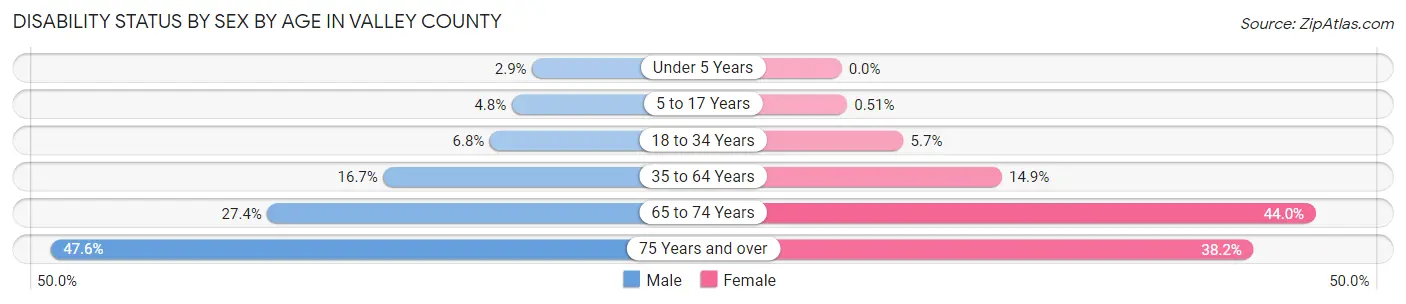
| Age Bracket | Male | Female |
| Under 5 Years | 7 (2.9%) | 0 (0.0%) |
| 5 to 17 Years | 33 (4.8%) | 3 (0.5%) |
| 18 to 34 Years | 42 (6.8%) | 36 (5.7%) |
| 35 to 64 Years | 246 (16.7%) | 197 (14.9%) |
| 65 to 74 Years | 132 (27.4%) | 209 (44.0%) |
| 75 Years and over | 140 (47.6%) | 172 (38.2%) |
Disability Class by Sex by Age in Valley County
Disability Class: Hearing Difficulty
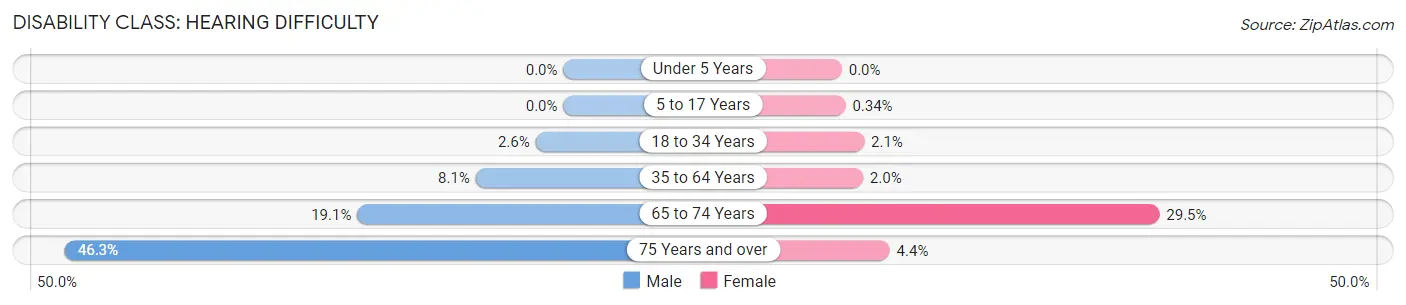
| Age Bracket | Male | Female |
| Under 5 Years | 0 (0.0%) | 0 (0.0%) |
| 5 to 17 Years | 0 (0.0%) | 2 (0.3%) |
| 18 to 34 Years | 16 (2.6%) | 13 (2.1%) |
| 35 to 64 Years | 120 (8.1%) | 26 (2.0%) |
| 65 to 74 Years | 92 (19.1%) | 140 (29.5%) |
| 75 Years and over | 136 (46.3%) | 20 (4.4%) |
Disability Class: Vision Difficulty
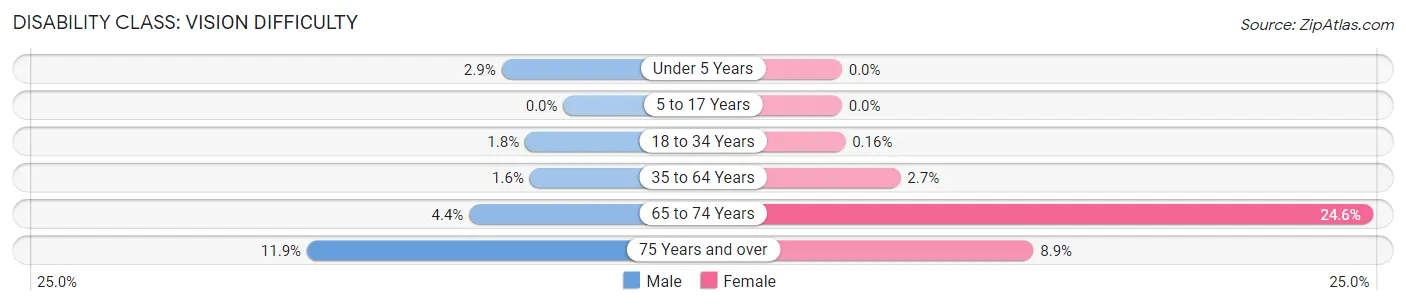
| Age Bracket | Male | Female |
| Under 5 Years | 7 (2.9%) | 0 (0.0%) |
| 5 to 17 Years | 0 (0.0%) | 0 (0.0%) |
| 18 to 34 Years | 11 (1.8%) | 1 (0.2%) |
| 35 to 64 Years | 23 (1.6%) | 36 (2.7%) |
| 65 to 74 Years | 21 (4.4%) | 117 (24.6%) |
| 75 Years and over | 35 (11.9%) | 40 (8.9%) |
Disability Class: Cognitive Difficulty
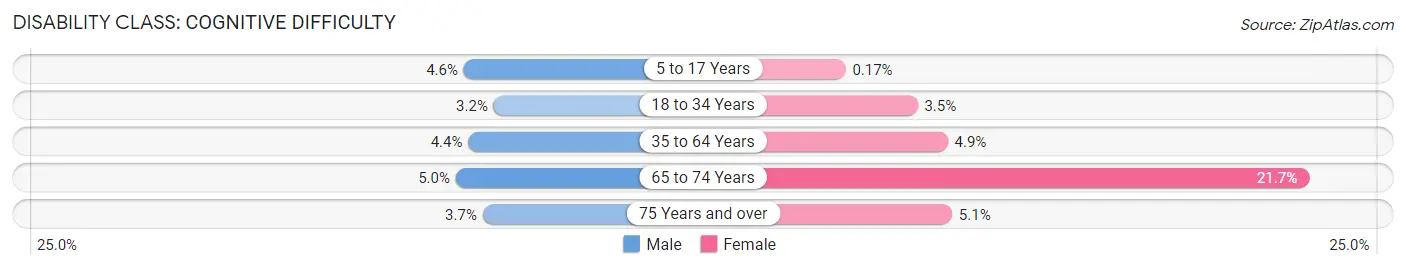
| Age Bracket | Male | Female |
| 5 to 17 Years | 32 (4.6%) | 1 (0.2%) |
| 18 to 34 Years | 20 (3.2%) | 22 (3.5%) |
| 35 to 64 Years | 65 (4.4%) | 65 (4.9%) |
| 65 to 74 Years | 24 (5.0%) | 103 (21.7%) |
| 75 Years and over | 11 (3.7%) | 23 (5.1%) |
Disability Class: Ambulatory Difficulty
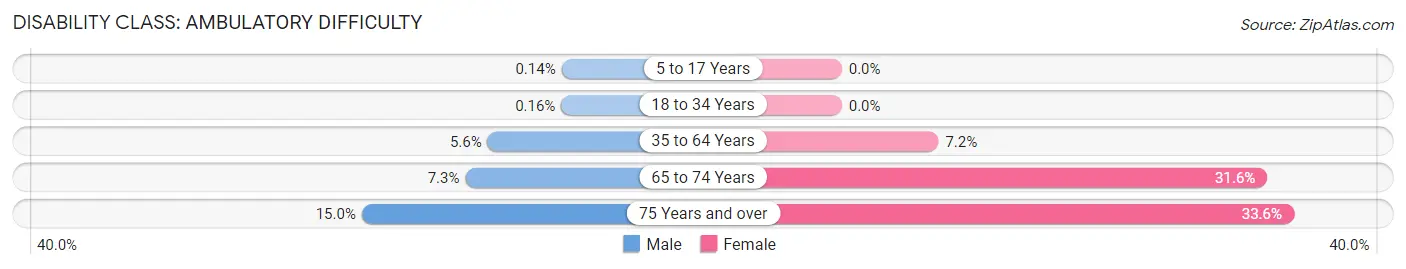
| Age Bracket | Male | Female |
| 5 to 17 Years | 1 (0.1%) | 0 (0.0%) |
| 18 to 34 Years | 1 (0.2%) | 0 (0.0%) |
| 35 to 64 Years | 83 (5.6%) | 95 (7.2%) |
| 65 to 74 Years | 35 (7.3%) | 150 (31.6%) |
| 75 Years and over | 44 (15.0%) | 151 (33.6%) |
Disability Class: Self-Care Difficulty
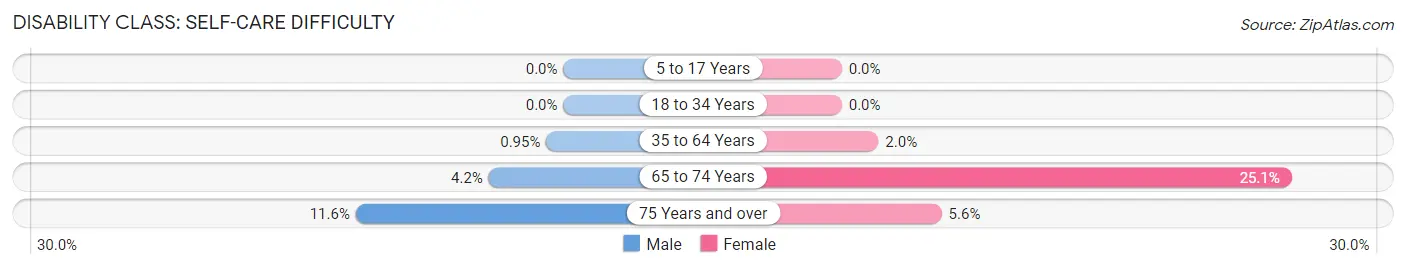
| Age Bracket | Male | Female |
| 5 to 17 Years | 0 (0.0%) | 0 (0.0%) |
| 18 to 34 Years | 0 (0.0%) | 0 (0.0%) |
| 35 to 64 Years | 14 (0.9%) | 27 (2.0%) |
| 65 to 74 Years | 20 (4.2%) | 119 (25.1%) |
| 75 Years and over | 34 (11.6%) | 25 (5.6%) |
Technology Access in Valley County
Computing Device Access in Valley County
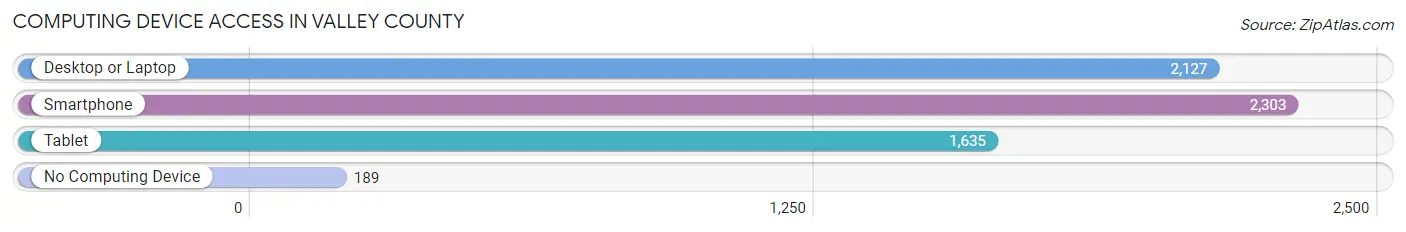
| Device Type | # Households | % Households |
| Desktop or Laptop | 2,127 | 75.1% |
| Smartphone | 2,303 | 81.3% |
| Tablet | 1,635 | 57.7% |
| No Computing Device | 189 | 6.7% |
| Total | 2,833 | 100.0% |
Internet Access in Valley County
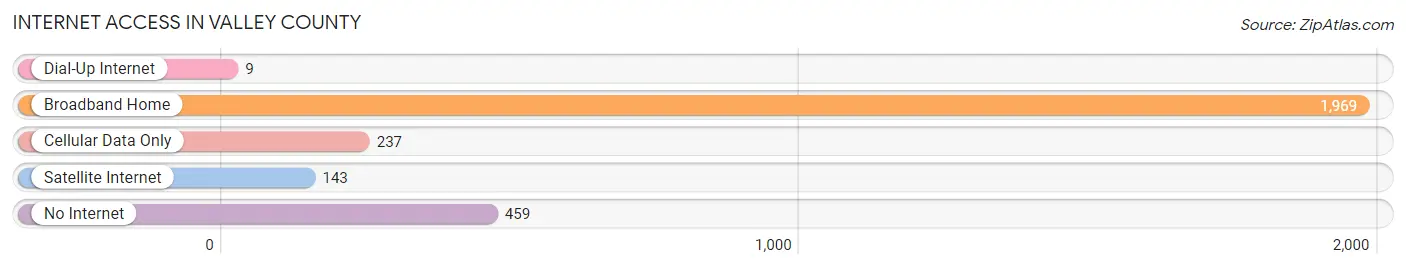
| Internet Type | # Households | % Households |
| Dial-Up Internet | 9 | 0.3% |
| Broadband Home | 1,969 | 69.5% |
| Cellular Data Only | 237 | 8.4% |
| Satellite Internet | 143 | 5.1% |
| No Internet | 459 | 16.2% |
| Total | 2,833 | 100.0% |
Valley County Summary
Valley County, Montana is located in the north-central part of the state, and is bordered by Phillips County to the north, Daniels County to the east, McCone County to the south, and Fergus County to the west. The county seat is Glasgow, and the largest city is Hinsdale. Valley County is part of the Great Plains region of Montana, and is home to a variety of landscapes, including rolling hills, grasslands, and forests.
History
Valley County was established in 1919, and was named for the valley of the Milk River, which runs through the county. The area was originally inhabited by the Assiniboine and Sioux tribes, and was later settled by homesteaders in the late 19th century. The county was primarily an agricultural area, with wheat, barley, and oats being the main crops. The county also had a thriving livestock industry, with cattle, sheep, and horses being raised in the area.
Geography
Valley County covers an area of 1,845 square miles, and is located in the Great Plains region of Montana. The county is bordered by Phillips County to the north, Daniels County to the east, McCone County to the south, and Fergus County to the west. The county is home to a variety of landscapes, including rolling hills, grasslands, and forests. The Milk River runs through the county, and is a major source of water for the area.
Economy
Valley County has a diverse economy, with agriculture, manufacturing, and tourism being the main industries. Agriculture is the largest sector of the economy, with wheat, barley, oats, and hay being the main crops. Livestock production is also important, with cattle, sheep, and horses being raised in the area. Manufacturing is also an important part of the economy, with several companies located in the county. Tourism is also an important part of the economy, with several recreational areas located in the county.
Demographics
As of the 2010 census, Valley County had a population of 9,845. The population is primarily white (94.3%), with Native American (2.3%), Hispanic (1.3%), and Asian (0.7%) being the other major racial groups. The median household income is $41,945, and the median home value is $117,400. The unemployment rate is 4.2%, and the poverty rate is 11.3%.
Valley County is a rural area, with a population that is spread out over a large area. The county is home to a variety of landscapes, and has a diverse economy. Agriculture, manufacturing, and tourism are the main industries in the county, and the population is primarily white. The median household income is slightly below the state average, and the poverty rate is slightly higher than the state average.
Common Questions
What is Per Capita Income in Valley County?
Per Capita income in Valley County is $30,941.
What is the Median Family Income in Valley County?
Median Family Income in Valley County is $83,179.
What is the Median Household income in Valley County?
Median Household Income in Valley County is $59,725.
What is Income or Wage Gap in Valley County?
Income or Wage Gap in Valley County is 25.2%.
Women in Valley County earn 74.8 cents for every dollar earned by a man.
What is Inequality or Gini Index in Valley County?
Inequality or Gini Index in Valley County is 0.41.
What is the Total Population of Valley County?
Total Population of Valley County is 7,552.
What is the Total Male Population of Valley County?
Total Male Population of Valley County is 3,862.
What is the Total Female Population of Valley County?
Total Female Population of Valley County is 3,690.
What is the Ratio of Males per 100 Females in Valley County?
There are 104.66 Males per 100 Females in Valley County.
What is the Ratio of Females per 100 Males in Valley County?
There are 95.55 Females per 100 Males in Valley County.
What is the Median Population Age in Valley County?
Median Population Age in Valley County is 43.2 Years.
What is the Average Family Size in Valley County
Average Family Size in Valley County is 3.5 People.
What is the Average Household Size in Valley County
Average Household Size in Valley County is 2.6 People.
How Large is the Labor Force in Valley County?
There are 3,619 People in the Labor Forcein in Valley County.
What is the Percentage of People in the Labor Force in Valley County?
60.1% of People are in the Labor Force in Valley County.
What is the Unemployment Rate in Valley County?
Unemployment Rate in Valley County is 4.0%.