Glacier County, MT Map & Demographics
Glacier County Map
Glacier County Overview
$21,438
PER CAPITA INCOME
$51,601
AVG FAMILY INCOME
$41,078
AVG HOUSEHOLD INCOME
2.2%
WAGE / INCOME GAP [ % ]
97.8¢/ $1
WAGE / INCOME GAP [ $ ]
$12,332
FAMILY INCOME DEFICIT
0.48
INEQUALITY / GINI INDEX
13,781
TOTAL POPULATION
6,820
MALE POPULATION
6,961
FEMALE POPULATION
97.97
MALES / 100 FEMALES
102.07
FEMALES / 100 MALES
34.2
MEDIAN AGE
3.8
AVG FAMILY SIZE
3.1
AVG HOUSEHOLD SIZE
5,356
LABOR FORCE [ PEOPLE ]
53.3%
PERCENT IN LABOR FORCE
7.9%
UNEMPLOYMENT RATE
Glacier County Area Codes
Income in Glacier County
Income Overview in Glacier County
Per Capita Income in Glacier County is $21,438, while median incomes of families and households are $51,601 and $41,078 respectively.
| Characteristic | Number | Measure |
| Per Capita Income | 13,781 | $21,438 |
| Median Family Income | 2,811 | $51,601 |
| Mean Family Income | 2,811 | $66,103 |
| Median Household Income | 4,175 | $41,078 |
| Mean Household Income | 4,175 | $58,912 |
| Income Deficit | 2,811 | $12,332 |
| Wage / Income Gap (%) | 13,781 | 2.15% |
| Wage / Income Gap ($) | 13,781 | 97.85¢ per $1 |
| Gini / Inequality Index | 13,781 | 0.48 |
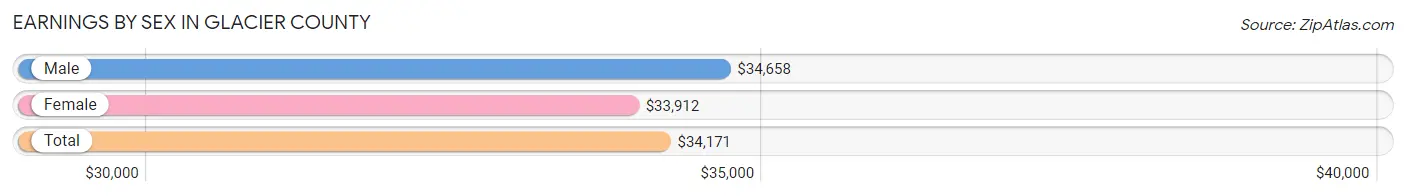
Earnings by Sex in Glacier County
Average Earnings in Glacier County are $34,171, $34,658 for men and $33,912 for women, a difference of 2.1%.
| Sex | Number | Average Earnings |
| Male | 3,016 (53.3%) | $34,658 |
| Female | 2,643 (46.7%) | $33,912 |
| Total | 5,659 (100.0%) | $34,171 |
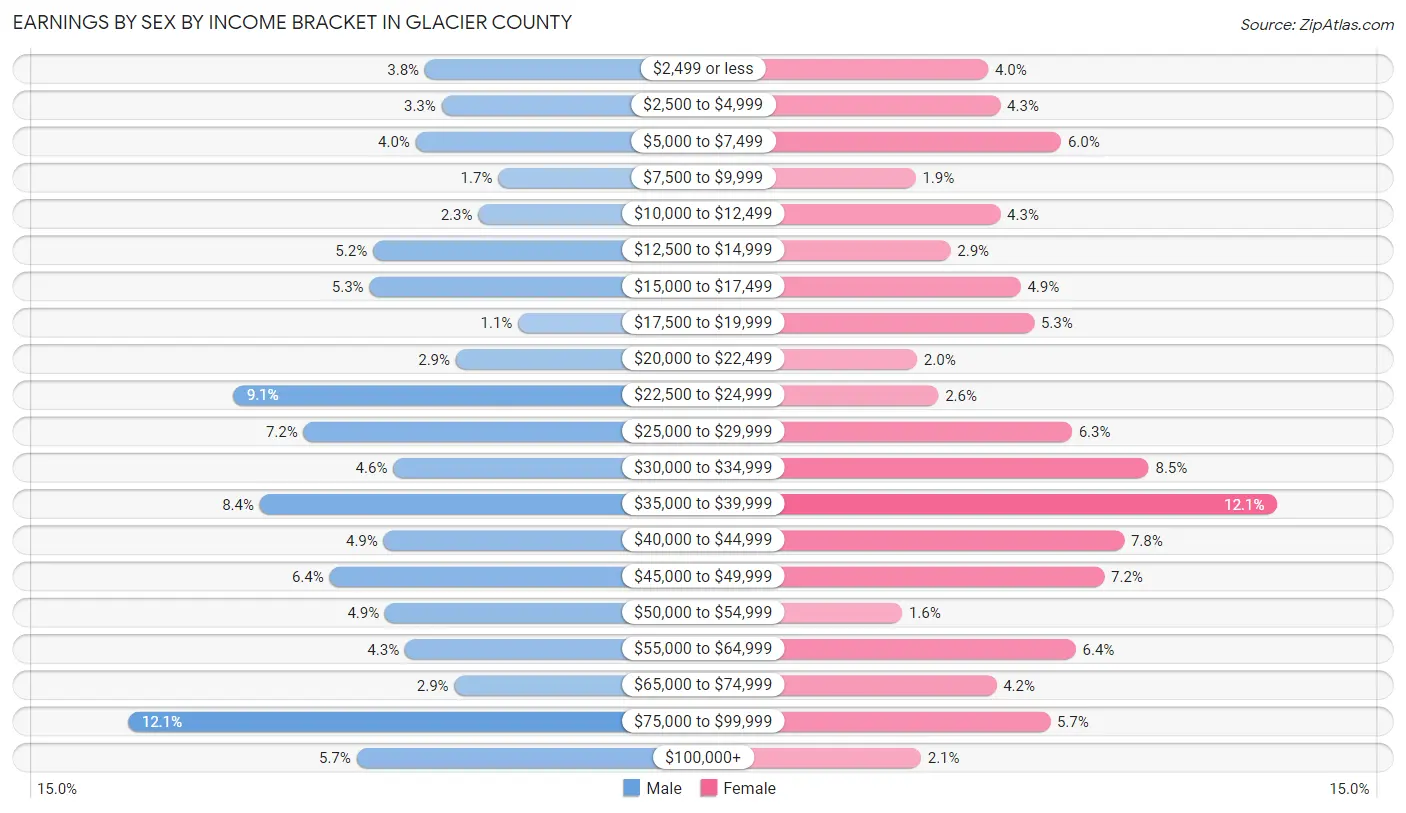
Earnings by Sex by Income Bracket in Glacier County
The most common earnings brackets in Glacier County are $75,000 to $99,999 for men (364 | 12.1%) and $35,000 to $39,999 for women (319 | 12.1%).
| Income | Male | Female |
| $2,499 or less | 113 (3.7%) | 105 (4.0%) |
| $2,500 to $4,999 | 99 (3.3%) | 114 (4.3%) |
| $5,000 to $7,499 | 121 (4.0%) | 159 (6.0%) |
| $7,500 to $9,999 | 51 (1.7%) | 51 (1.9%) |
| $10,000 to $12,499 | 68 (2.2%) | 114 (4.3%) |
| $12,500 to $14,999 | 157 (5.2%) | 77 (2.9%) |
| $15,000 to $17,499 | 160 (5.3%) | 129 (4.9%) |
| $17,500 to $19,999 | 34 (1.1%) | 139 (5.3%) |
| $20,000 to $22,499 | 87 (2.9%) | 52 (2.0%) |
| $22,500 to $24,999 | 275 (9.1%) | 68 (2.6%) |
| $25,000 to $29,999 | 216 (7.2%) | 167 (6.3%) |
| $30,000 to $34,999 | 140 (4.6%) | 224 (8.5%) |
| $35,000 to $39,999 | 253 (8.4%) | 319 (12.1%) |
| $40,000 to $44,999 | 148 (4.9%) | 206 (7.8%) |
| $45,000 to $49,999 | 194 (6.4%) | 191 (7.2%) |
| $50,000 to $54,999 | 147 (4.9%) | 41 (1.5%) |
| $55,000 to $64,999 | 130 (4.3%) | 170 (6.4%) |
| $65,000 to $74,999 | 88 (2.9%) | 111 (4.2%) |
| $75,000 to $99,999 | 364 (12.1%) | 151 (5.7%) |
| $100,000+ | 171 (5.7%) | 55 (2.1%) |
| Total | 3,016 (100.0%) | 2,643 (100.0%) |
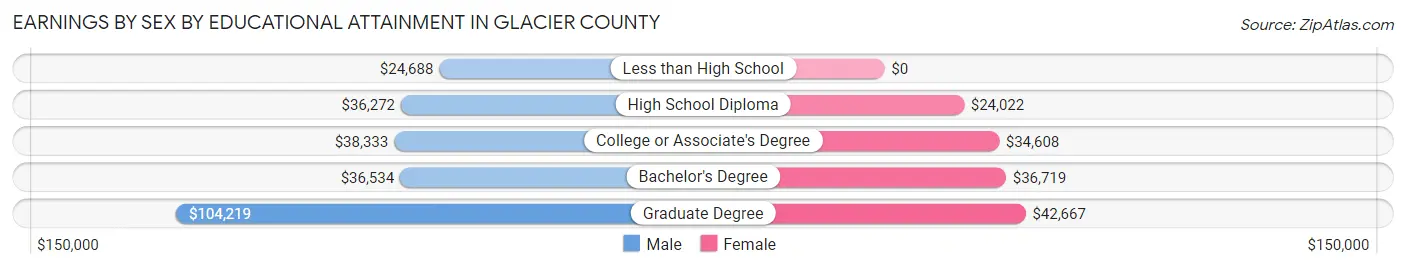
Earnings by Sex by Educational Attainment in Glacier County
Average earnings in Glacier County are $38,214 for men and $34,789 for women, a difference of 9.0%. Men with an educational attainment of graduate degree enjoy the highest average annual earnings of $104,219, while those with less than high school education earn the least with $24,688. Women with an educational attainment of graduate degree earn the most with the average annual earnings of $42,667, while those with high school diploma education have the smallest earnings of $24,022.
| Educational Attainment | Male Income | Female Income |
| Less than High School | $24,688 | $0 |
| High School Diploma | $36,272 | $24,022 |
| College or Associate's Degree | $38,333 | $34,608 |
| Bachelor's Degree | $36,534 | $36,719 |
| Graduate Degree | $104,219 | $42,667 |
| Total | $38,214 | $34,789 |
Family Income in Glacier County
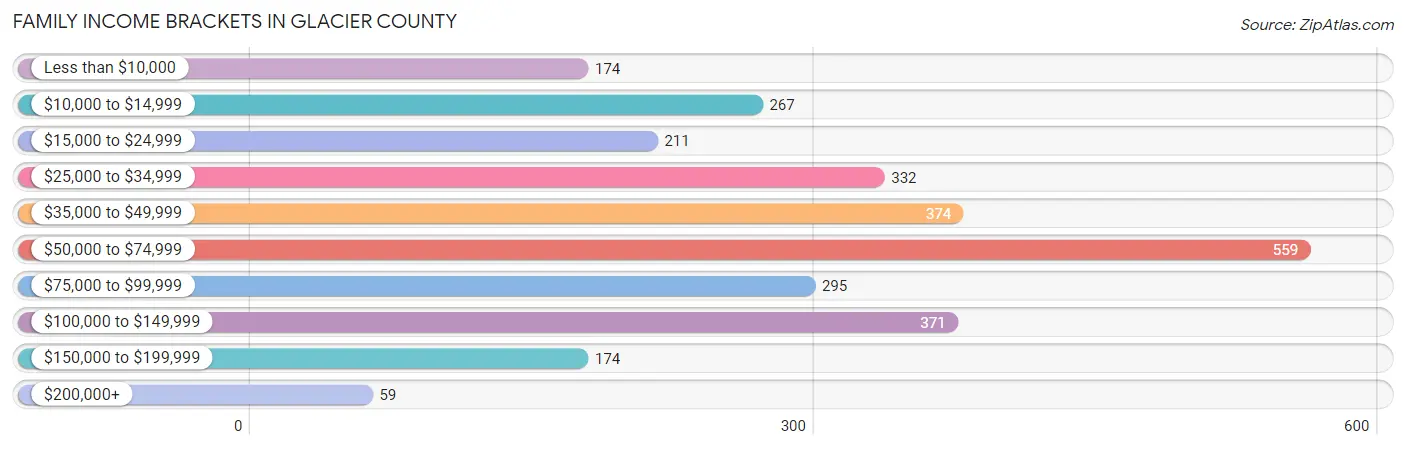
Family Income Brackets in Glacier County
According to the Glacier County family income data, there are 559 families falling into the $50,000 to $74,999 income range, which is the most common income bracket and makes up 19.9% of all families. Conversely, the $200,000+ income bracket is the least frequent group with only 59 families (2.1%) belonging to this category.
| Income Bracket | # Families | % Families |
| Less than $10,000 | 174 | 6.2% |
| $10,000 to $14,999 | 267 | 9.5% |
| $15,000 to $24,999 | 211 | 7.5% |
| $25,000 to $34,999 | 332 | 11.8% |
| $35,000 to $49,999 | 374 | 13.3% |
| $50,000 to $74,999 | 559 | 19.9% |
| $75,000 to $99,999 | 295 | 10.5% |
| $100,000 to $149,999 | 371 | 13.2% |
| $150,000 to $199,999 | 174 | 6.2% |
| $200,000+ | 59 | 2.1% |
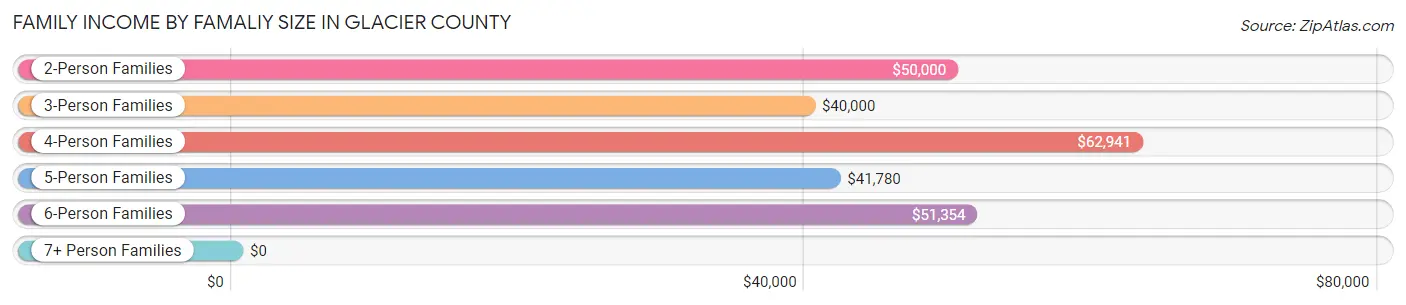
Family Income by Famaliy Size in Glacier County
4-person families (552 | 19.6%) account for the highest median family income in Glacier County with $62,941 per family, while 2-person families (1,304 | 46.4%) have the highest median income of $25,000 per family member.
| Income Bracket | # Families | Median Income |
| 2-Person Families | 1,304 (46.4%) | $50,000 |
| 3-Person Families | 476 (16.9%) | $40,000 |
| 4-Person Families | 552 (19.6%) | $62,941 |
| 5-Person Families | 251 (8.9%) | $41,780 |
| 6-Person Families | 108 (3.8%) | $51,354 |
| 7+ Person Families | 120 (4.3%) | $0 |
| Total | 2,811 (100.0%) | $51,601 |
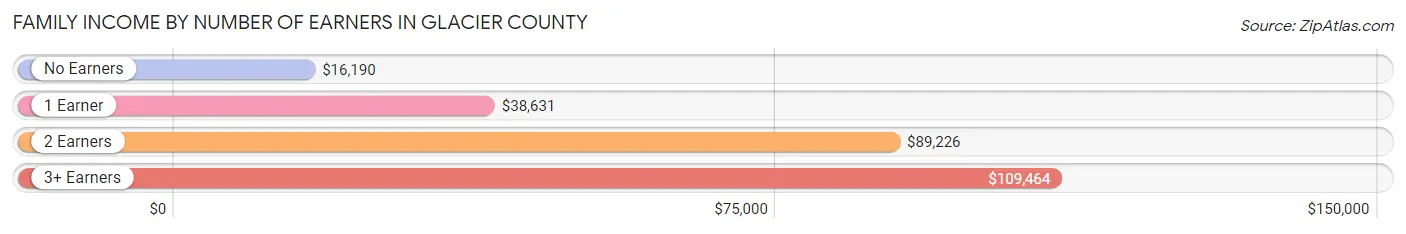
Family Income by Number of Earners in Glacier County
The median family income in Glacier County is $51,601, with families comprising 3+ earners (125) having the highest median family income of $109,464, while families with no earners (600) have the lowest median family income of $16,190, accounting for 4.4% and 21.3% of families, respectively.
| Number of Earners | # Families | Median Income |
| No Earners | 600 (21.3%) | $16,190 |
| 1 Earner | 1,163 (41.4%) | $38,631 |
| 2 Earners | 923 (32.8%) | $89,226 |
| 3+ Earners | 125 (4.4%) | $109,464 |
| Total | 2,811 (100.0%) | $51,601 |
Household Income in Glacier County
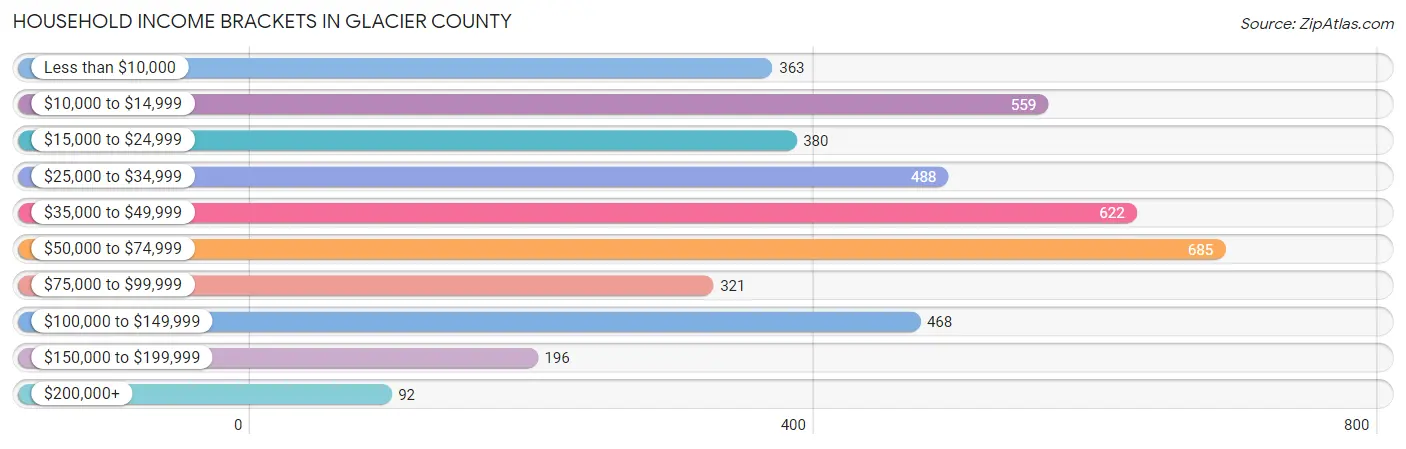
Household Income Brackets in Glacier County
With 685 households falling in the category, the $50,000 to $74,999 income range is the most frequent in Glacier County, accounting for 16.4% of all households. In contrast, only 92 households (2.2%) fall into the $200,000+ income bracket, making it the least populous group.
| Income Bracket | # Households | % Households |
| Less than $10,000 | 363 | 8.7% |
| $10,000 to $14,999 | 559 | 13.4% |
| $15,000 to $24,999 | 380 | 9.1% |
| $25,000 to $34,999 | 488 | 11.7% |
| $35,000 to $49,999 | 622 | 14.9% |
| $50,000 to $74,999 | 685 | 16.4% |
| $75,000 to $99,999 | 321 | 7.7% |
| $100,000 to $149,999 | 468 | 11.2% |
| $150,000 to $199,999 | 196 | 4.7% |
| $200,000+ | 92 | 2.2% |
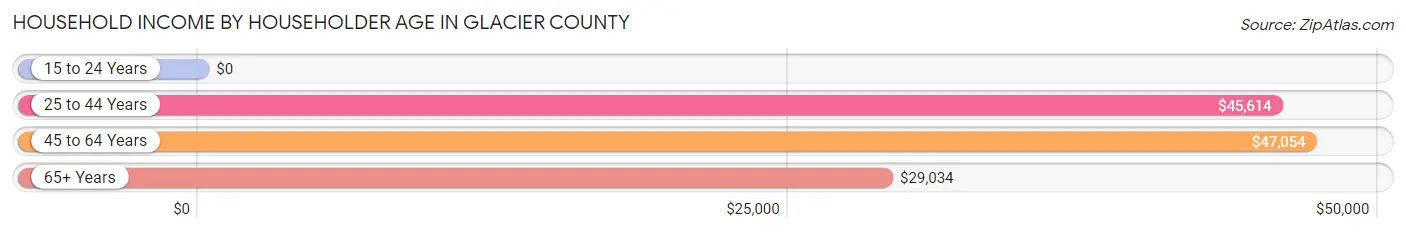
Household Income by Householder Age in Glacier County
The median household income in Glacier County is $41,078, with the highest median household income of $47,054 found in the 45 to 64 years age bracket for the primary householder. A total of 1,612 households (38.6%) fall into this category. Meanwhile, the 15 to 24 years age bracket for the primary householder has the lowest median household income of $0, with 128 households (3.1%) in this group.
| Income Bracket | # Households | Median Income |
| 15 to 24 Years | 128 (3.1%) | $0 |
| 25 to 44 Years | 1,373 (32.9%) | $45,614 |
| 45 to 64 Years | 1,612 (38.6%) | $47,054 |
| 65+ Years | 1,062 (25.4%) | $29,034 |
| Total | 4,175 (100.0%) | $41,078 |
Poverty in Glacier County
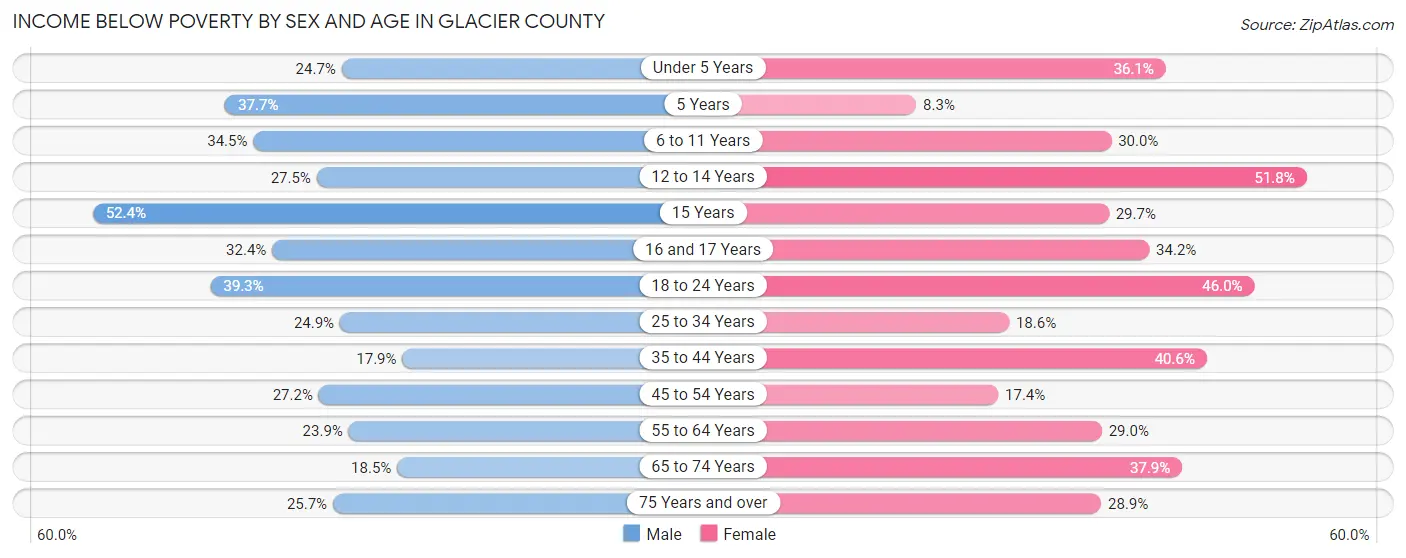
Income Below Poverty by Sex and Age in Glacier County
With 27.2% poverty level for males and 31.5% for females among the residents of Glacier County, 15 year old males and 12 to 14 year old females are the most vulnerable to poverty, with 87 males (52.4%) and 177 females (51.7%) in their respective age groups living below the poverty level.
| Age Bracket | Male | Female |
| Under 5 Years | 141 (24.7%) | 180 (36.1%) |
| 5 Years | 29 (37.7%) | 12 (8.3%) |
| 6 to 11 Years | 222 (34.5%) | 210 (30.0%) |
| 12 to 14 Years | 100 (27.5%) | 177 (51.7%) |
| 15 Years | 87 (52.4%) | 33 (29.7%) |
| 16 and 17 Years | 60 (32.4%) | 51 (34.2%) |
| 18 to 24 Years | 263 (39.3%) | 284 (46.0%) |
| 25 to 34 Years | 206 (24.9%) | 176 (18.6%) |
| 35 to 44 Years | 161 (17.9%) | 341 (40.6%) |
| 45 to 54 Years | 207 (27.2%) | 117 (17.4%) |
| 55 to 64 Years | 187 (23.9%) | 271 (28.9%) |
| 65 to 74 Years | 92 (18.5%) | 205 (37.9%) |
| 75 Years and over | 68 (25.7%) | 106 (28.9%) |
| Total | 1,823 (27.2%) | 2,163 (31.5%) |
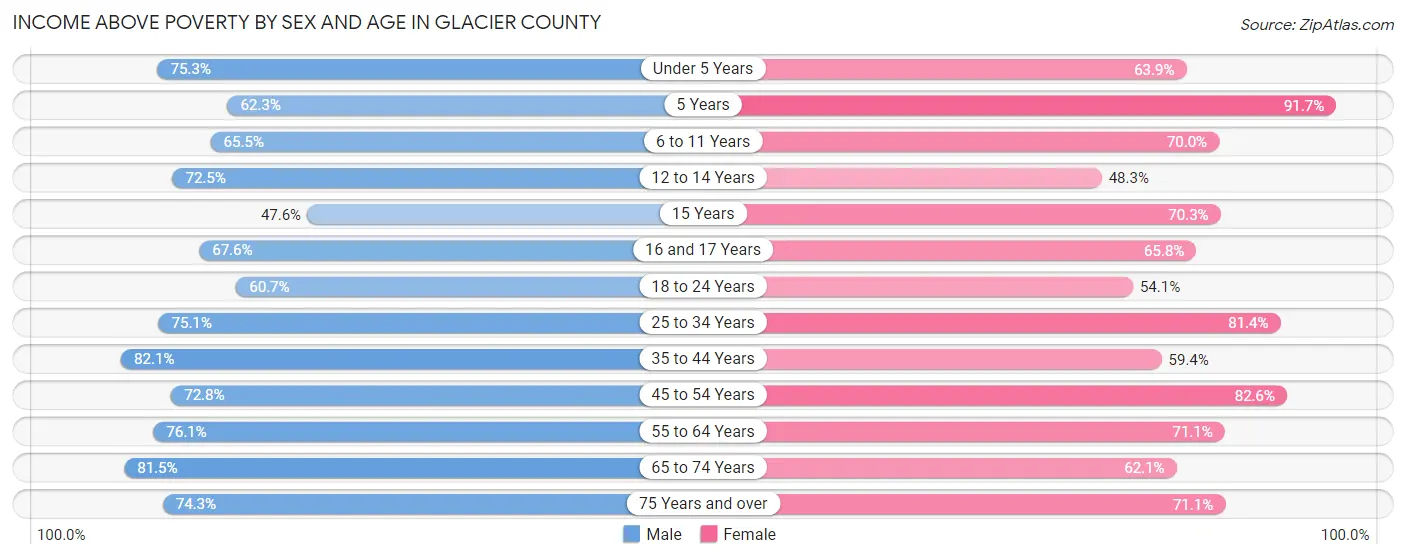
Income Above Poverty by Sex and Age in Glacier County
According to the poverty statistics in Glacier County, males aged 35 to 44 years and females aged 5 years are the age groups that are most secure financially, with 82.1% of males and 91.7% of females in these age groups living above the poverty line.
| Age Bracket | Male | Female |
| Under 5 Years | 430 (75.3%) | 319 (63.9%) |
| 5 Years | 48 (62.3%) | 133 (91.7%) |
| 6 to 11 Years | 421 (65.5%) | 490 (70.0%) |
| 12 to 14 Years | 264 (72.5%) | 165 (48.2%) |
| 15 Years | 79 (47.6%) | 78 (70.3%) |
| 16 and 17 Years | 125 (67.6%) | 98 (65.8%) |
| 18 to 24 Years | 406 (60.7%) | 334 (54.0%) |
| 25 to 34 Years | 622 (75.1%) | 769 (81.4%) |
| 35 to 44 Years | 737 (82.1%) | 498 (59.4%) |
| 45 to 54 Years | 553 (72.8%) | 555 (82.6%) |
| 55 to 64 Years | 595 (76.1%) | 665 (71.1%) |
| 65 to 74 Years | 405 (81.5%) | 336 (62.1%) |
| 75 Years and over | 197 (74.3%) | 261 (71.1%) |
| Total | 4,882 (72.8%) | 4,701 (68.5%) |
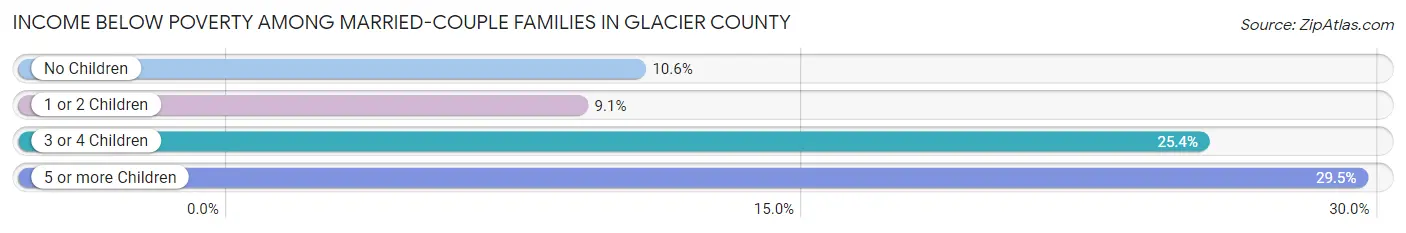
Income Below Poverty Among Married-Couple Families in Glacier County
The poverty statistics for married-couple families in Glacier County show that 12.7% or 208 of the total 1,637 families live below the poverty line. Families with 5 or more children have the highest poverty rate of 29.5%, comprising of 18 families. On the other hand, families with 1 or 2 children have the lowest poverty rate of 9.1%, which includes 44 families.
| Children | Above Poverty | Below Poverty |
| No Children | 798 (89.4%) | 95 (10.6%) |
| 1 or 2 Children | 438 (90.9%) | 44 (9.1%) |
| 3 or 4 Children | 150 (74.6%) | 51 (25.4%) |
| 5 or more Children | 43 (70.5%) | 18 (29.5%) |
| Total | 1,429 (87.3%) | 208 (12.7%) |
Income Below Poverty Among Single-Parent Households in Glacier County
According to the poverty data in Glacier County, 32.5% or 116 single-father households and 43.4% or 355 single-mother households are living below the poverty line. Among single-father households, those with 3 or 4 children have the highest poverty rate, with 25 households (100.0%) experiencing poverty. Likewise, among single-mother households, those with 1 or 2 children have the highest poverty rate, with 264 households (49.1%) falling below the poverty line.
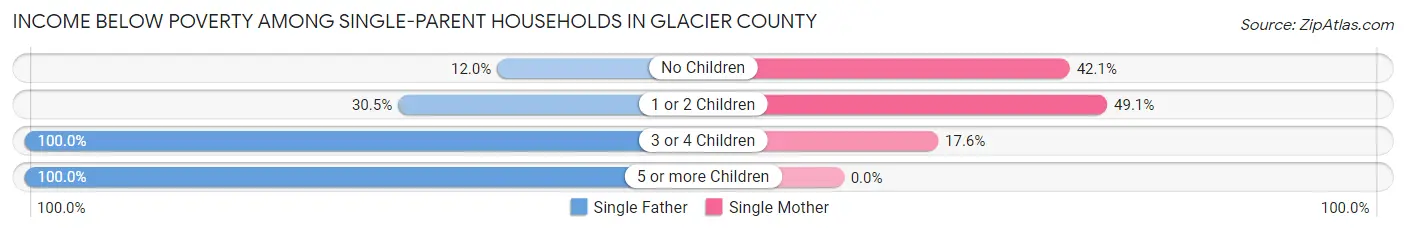
| Children | Single Father | Single Mother |
| No Children | 12 (12.0%) | 72 (42.1%) |
| 1 or 2 Children | 67 (30.4%) | 264 (49.1%) |
| 3 or 4 Children | 25 (100.0%) | 19 (17.6%) |
| 5 or more Children | 12 (100.0%) | 0 (0.0%) |
| Total | 116 (32.5%) | 355 (43.4%) |
Income Below Poverty Among Married-Couple vs Single-Parent Households in Glacier County
The poverty data for Glacier County shows that 208 of the married-couple family households (12.7%) and 471 of the single-parent households (40.1%) are living below the poverty level. Within the married-couple family households, those with 5 or more children have the highest poverty rate, with 18 households (29.5%) falling below the poverty line. Among the single-parent households, those with 5 or more children have the highest poverty rate, with 12 household (100.0%) living below poverty.
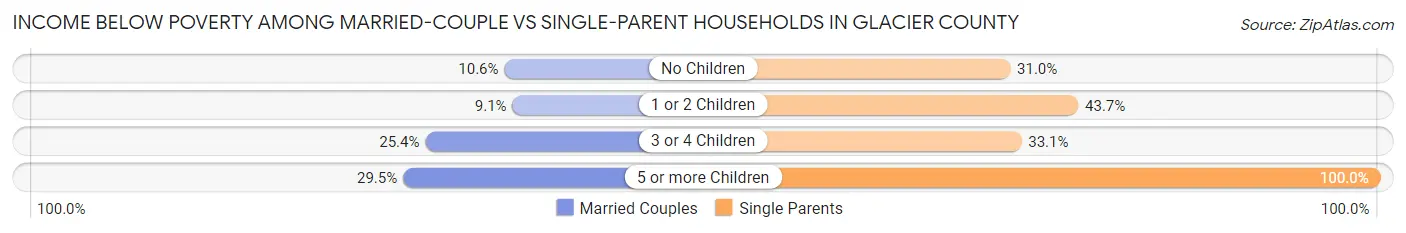
| Children | Married-Couple Families | Single-Parent Households |
| No Children | 95 (10.6%) | 84 (31.0%) |
| 1 or 2 Children | 44 (9.1%) | 331 (43.7%) |
| 3 or 4 Children | 51 (25.4%) | 44 (33.1%) |
| 5 or more Children | 18 (29.5%) | 12 (100.0%) |
| Total | 208 (12.7%) | 471 (40.1%) |
Race in Glacier County
The most populous races in Glacier County are Native / Alaskan (8,841 | 64.1%), White / Caucasian (4,237 | 30.7%), and Hispanic or Latino (492 | 3.6%).
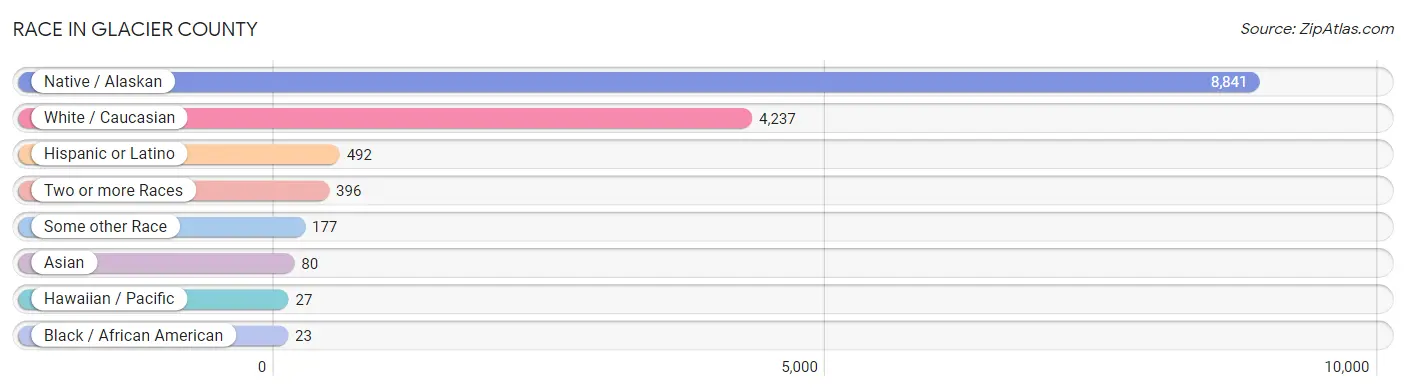
| Race | # Population | % Population |
| Asian | 80 | 0.6% |
| Black / African American | 23 | 0.2% |
| Hawaiian / Pacific | 27 | 0.2% |
| Hispanic or Latino | 492 | 3.6% |
| Native / Alaskan | 8,841 | 64.1% |
| White / Caucasian | 4,237 | 30.7% |
| Two or more Races | 396 | 2.9% |
| Some other Race | 177 | 1.3% |
| Total | 13,781 | 100.0% |
Ancestry in Glacier County
The most populous ancestries reported in Glacier County are Blackfeet (7,946 | 57.7%), German (1,249 | 9.1%), Irish (867 | 6.3%), English (632 | 4.6%), and Norwegian (477 | 3.5%), together accounting for 81.1% of all Glacier County residents.
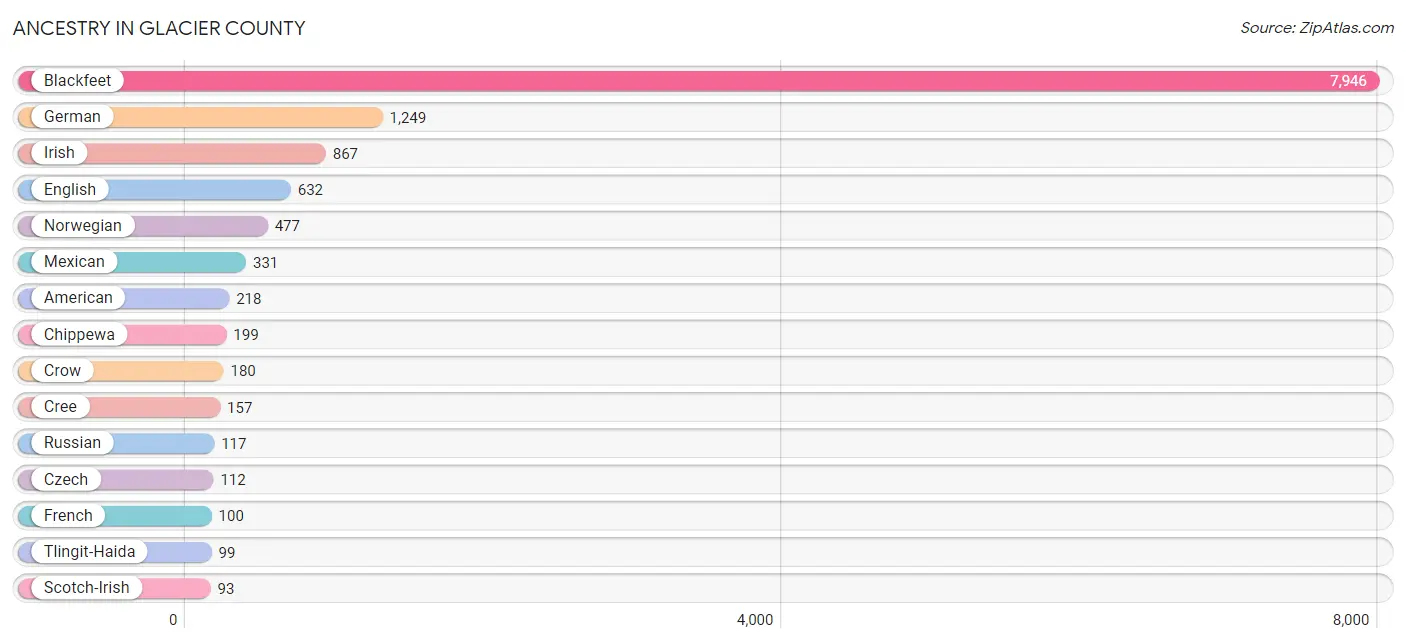
| Ancestry | # Population | % Population |
| African | 17 | 0.1% |
| Alaska Native | 9 | 0.1% |
| American | 218 | 1.6% |
| Apache | 58 | 0.4% |
| Arab | 6 | 0.0% |
| Arapaho | 81 | 0.6% |
| Belgian | 58 | 0.4% |
| Bhutanese | 6 | 0.0% |
| Blackfeet | 7,946 | 57.7% |
| British | 55 | 0.4% |
| Burmese | 16 | 0.1% |
| Cherokee | 37 | 0.3% |
| Cheyenne | 3 | 0.0% |
| Chippewa | 199 | 1.4% |
| Cree | 157 | 1.1% |
| Crow | 180 | 1.3% |
| Cuban | 9 | 0.1% |
| Czech | 112 | 0.8% |
| Danish | 72 | 0.5% |
| Dutch | 34 | 0.3% |
| English | 632 | 4.6% |
| European | 5 | 0.0% |
| French | 100 | 0.7% |
| French Canadian | 16 | 0.1% |
| German | 1,249 | 9.1% |
| Hungarian | 12 | 0.1% |
| Icelander | 13 | 0.1% |
| Irish | 867 | 6.3% |
| Iroquois | 20 | 0.2% |
| Italian | 58 | 0.4% |
| Korean | 52 | 0.4% |
| Lebanese | 3 | 0.0% |
| Mexican | 331 | 2.4% |
| Native Hawaiian | 78 | 0.6% |
| Navajo | 51 | 0.4% |
| Northern European | 12 | 0.1% |
| Norwegian | 477 | 3.5% |
| Pakistani | 7 | 0.1% |
| Polish | 74 | 0.5% |
| Portuguese | 4 | 0.0% |
| Puerto Rican | 26 | 0.2% |
| Russian | 117 | 0.9% |
| Scandinavian | 46 | 0.3% |
| Scotch-Irish | 93 | 0.7% |
| Scottish | 48 | 0.4% |
| Serbian | 3 | 0.0% |
| Shoshone | 5 | 0.0% |
| Sioux | 47 | 0.3% |
| South American Indian | 9 | 0.1% |
| Spaniard | 31 | 0.2% |
| Spanish | 3 | 0.0% |
| Subsaharan African | 21 | 0.2% |
| Swedish | 78 | 0.6% |
| Thai | 5 | 0.0% |
| Tlingit-Haida | 99 | 0.7% |
| Welsh | 40 | 0.3% |
| Yakama | 9 | 0.1% | View All 57 Rows |
Immigrants in Glacier County
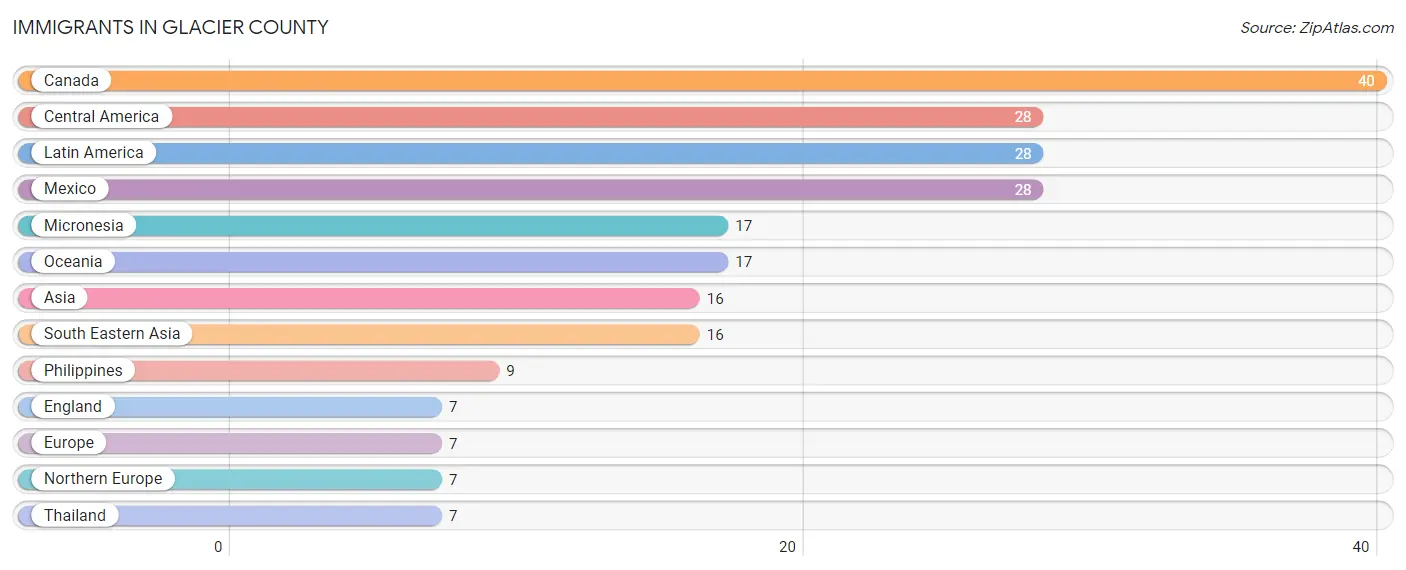
The most numerous immigrant groups reported in Glacier County came from Canada (40 | 0.3%), Central America (28 | 0.2%), Latin America (28 | 0.2%), Mexico (28 | 0.2%), and Micronesia (17 | 0.1%), together accounting for 1.0% of all Glacier County residents.
| Immigration Origin | # Population | % Population |
| Asia | 16 | 0.1% |
| Canada | 40 | 0.3% |
| Central America | 28 | 0.2% |
| England | 7 | 0.1% |
| Europe | 7 | 0.1% |
| Latin America | 28 | 0.2% |
| Mexico | 28 | 0.2% |
| Micronesia | 17 | 0.1% |
| Northern Europe | 7 | 0.1% |
| Oceania | 17 | 0.1% |
| Philippines | 9 | 0.1% |
| South Eastern Asia | 16 | 0.1% |
| Thailand | 7 | 0.1% | View All 13 Rows |
Sex and Age in Glacier County
Sex and Age in Glacier County
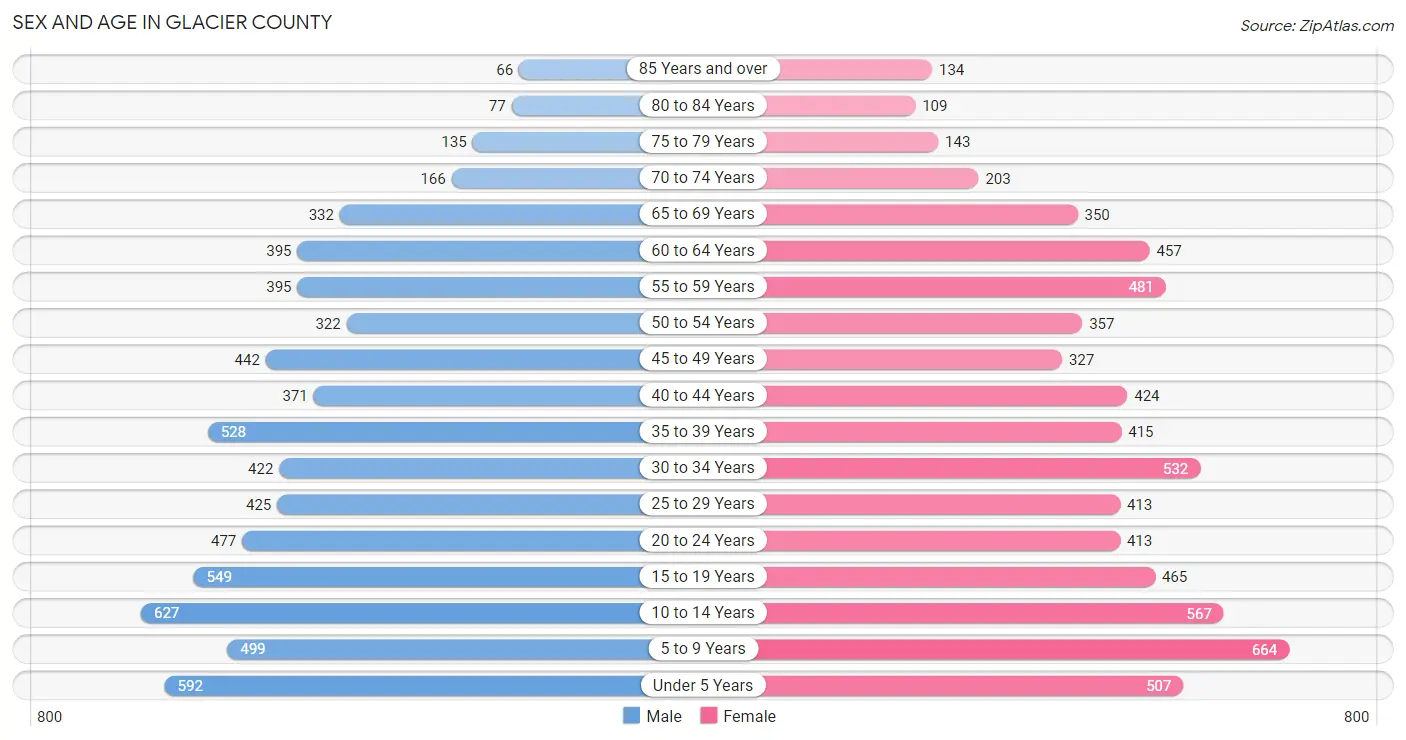
The most populous age groups in Glacier County are 10 to 14 Years (627 | 9.2%) for men and 5 to 9 Years (664 | 9.5%) for women.
| Age Bracket | Male | Female |
| Under 5 Years | 592 (8.7%) | 507 (7.3%) |
| 5 to 9 Years | 499 (7.3%) | 664 (9.5%) |
| 10 to 14 Years | 627 (9.2%) | 567 (8.2%) |
| 15 to 19 Years | 549 (8.1%) | 465 (6.7%) |
| 20 to 24 Years | 477 (7.0%) | 413 (5.9%) |
| 25 to 29 Years | 425 (6.2%) | 413 (5.9%) |
| 30 to 34 Years | 422 (6.2%) | 532 (7.6%) |
| 35 to 39 Years | 528 (7.7%) | 415 (6.0%) |
| 40 to 44 Years | 371 (5.4%) | 424 (6.1%) |
| 45 to 49 Years | 442 (6.5%) | 327 (4.7%) |
| 50 to 54 Years | 322 (4.7%) | 357 (5.1%) |
| 55 to 59 Years | 395 (5.8%) | 481 (6.9%) |
| 60 to 64 Years | 395 (5.8%) | 457 (6.6%) |
| 65 to 69 Years | 332 (4.9%) | 350 (5.0%) |
| 70 to 74 Years | 166 (2.4%) | 203 (2.9%) |
| 75 to 79 Years | 135 (2.0%) | 143 (2.1%) |
| 80 to 84 Years | 77 (1.1%) | 109 (1.6%) |
| 85 Years and over | 66 (1.0%) | 134 (1.9%) |
| Total | 6,820 (100.0%) | 6,961 (100.0%) |
Families and Households in Glacier County
Median Family Size in Glacier County
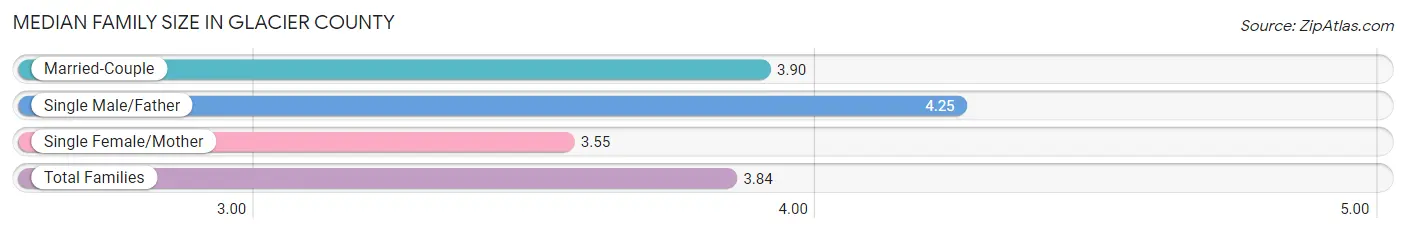
The median family size in Glacier County is 3.84 persons per family, with single male/father families (357 | 12.7%) accounting for the largest median family size of 4.25 persons per family. On the other hand, single female/mother families (817 | 29.1%) represent the smallest median family size with 3.55 persons per family.
| Family Type | # Families | Family Size |
| Married-Couple | 1,637 (58.2%) | 3.90 |
| Single Male/Father | 357 (12.7%) | 4.25 |
| Single Female/Mother | 817 (29.1%) | 3.55 |
| Total Families | 2,811 (100.0%) | 3.84 |
Median Household Size in Glacier County
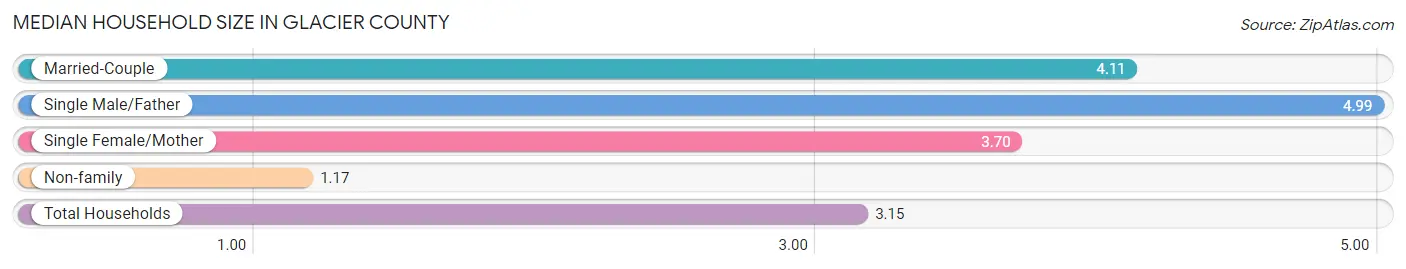
The median household size in Glacier County is 3.15 persons per household, with single male/father households (357 | 8.6%) accounting for the largest median household size of 4.99 persons per household. non-family households (1,364 | 32.7%) represent the smallest median household size with 1.17 persons per household.
| Household Type | # Households | Household Size |
| Married-Couple | 1,637 (39.2%) | 4.11 |
| Single Male/Father | 357 (8.6%) | 4.99 |
| Single Female/Mother | 817 (19.6%) | 3.70 |
| Non-family | 1,364 (32.7%) | 1.17 |
| Total Households | 4,175 (100.0%) | 3.15 |
Household Size by Marriage Status in Glacier County
Out of a total of 4,175 households in Glacier County, 2,811 (67.3%) are family households, while 1,364 (32.7%) are nonfamily households. The most numerous type of family households are 2-person households, comprising 1,147, and the most common type of nonfamily households are 1-person households, comprising 1,140.
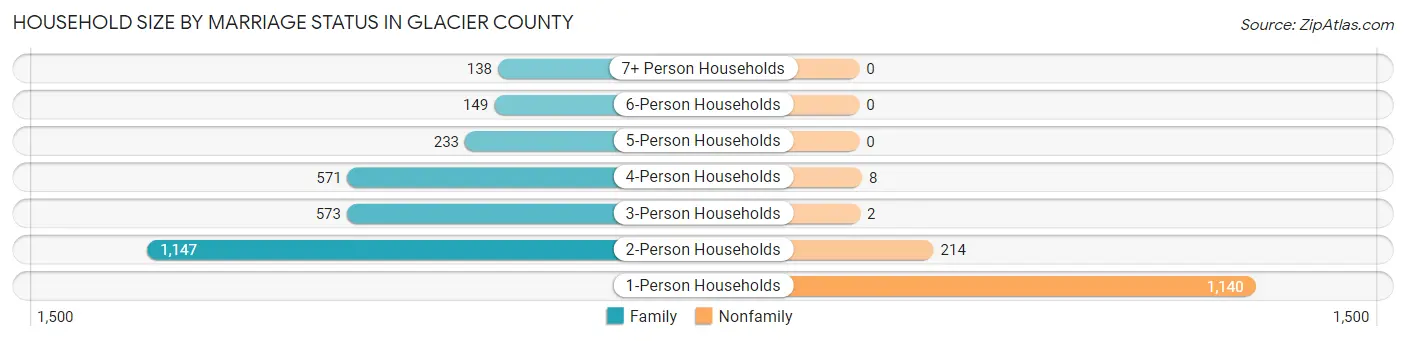
| Household Size | Family Households | Nonfamily Households |
| 1-Person Households | - | 1,140 (27.3%) |
| 2-Person Households | 1,147 (27.5%) | 214 (5.1%) |
| 3-Person Households | 573 (13.7%) | 2 (0.1%) |
| 4-Person Households | 571 (13.7%) | 8 (0.2%) |
| 5-Person Households | 233 (5.6%) | 0 (0.0%) |
| 6-Person Households | 149 (3.6%) | 0 (0.0%) |
| 7+ Person Households | 138 (3.3%) | 0 (0.0%) |
| Total | 2,811 (67.3%) | 1,364 (32.7%) |
Female Fertility in Glacier County
Fertility by Age in Glacier County
Average fertility rate in Glacier County is 23.0 births per 1,000 women. Women in the age bracket of 20 to 34 years have the highest fertility rate with 52.0 births per 1,000 women. Women in the age bracket of 20 to 34 years acount for 100.0% of all women with births.
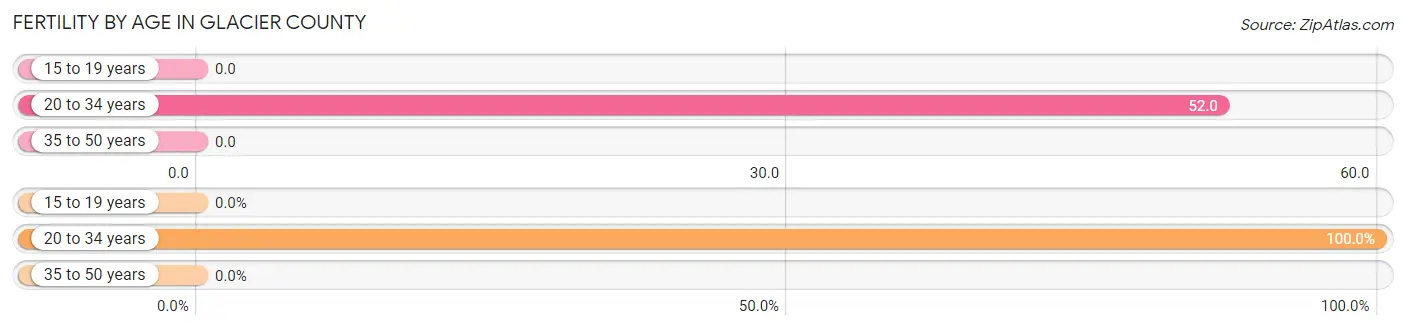
| Age Bracket | Women with Births | Births / 1,000 Women |
| 15 to 19 years | 0 (0.0%) | 0.0 |
| 20 to 34 years | 71 (100.0%) | 52.0 |
| 35 to 50 years | 0 (0.0%) | 0.0 |
| Total | 71 (100.0%) | 23.0 |
Fertility by Age by Marriage Status in Glacier County
47.9% of women with births (71) in Glacier County are married. The highest percentage of unmarried women with births falls into 20 to 34 years age bracket with 52.1% of them unmarried at the time of birth, while the lowest percentage of unmarried women with births belong to 20 to 34 years age bracket with 52.1% of them unmarried.
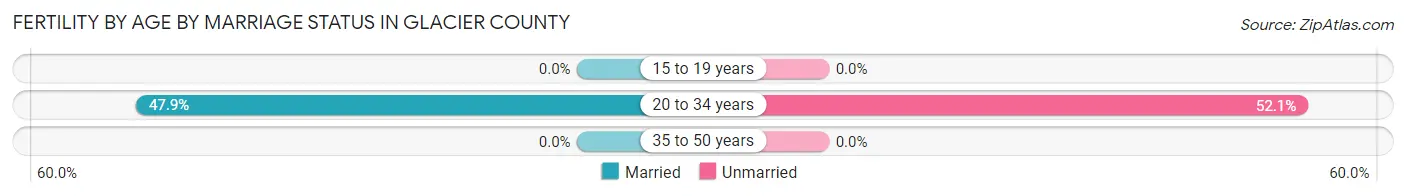
| Age Bracket | Married | Unmarried |
| 15 to 19 years | 0 (0.0%) | 0 (0.0%) |
| 20 to 34 years | 34 (47.9%) | 37 (52.1%) |
| 35 to 50 years | 0 (0.0%) | 0 (0.0%) |
| Total | 34 (47.9%) | 37 (52.1%) |
Fertility by Education in Glacier County
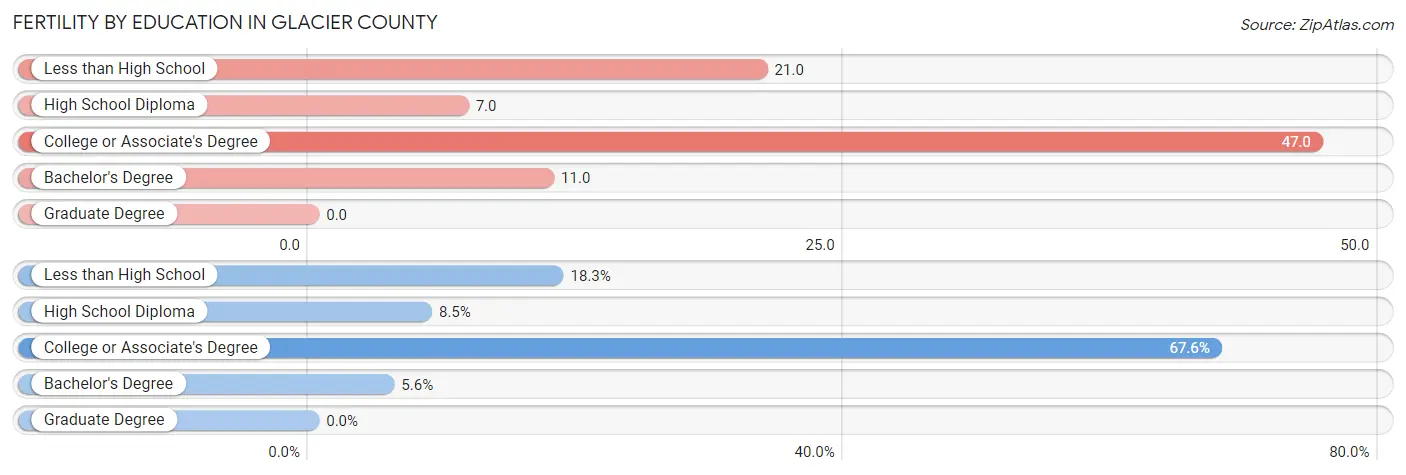
| Educational Attainment | Women with Births | Births / 1,000 Women |
| Less than High School | 13 (18.3%) | 21.0 |
| High School Diploma | 6 (8.5%) | 7.0 |
| College or Associate's Degree | 48 (67.6%) | 47.0 |
| Bachelor's Degree | 4 (5.6%) | 11.0 |
| Graduate Degree | 0 (0.0%) | 0.0 |
| Total | 71 (100.0%) | 23.0 |
Fertility by Education by Marriage Status in Glacier County
52.1% of women with births in Glacier County are unmarried. Women with the educational attainment of bachelor's degree are most likely to be married with 100.0% of them married at childbirth, while women with the educational attainment of less than high school are least likely to be married with 100.0% of them unmarried at childbirth.
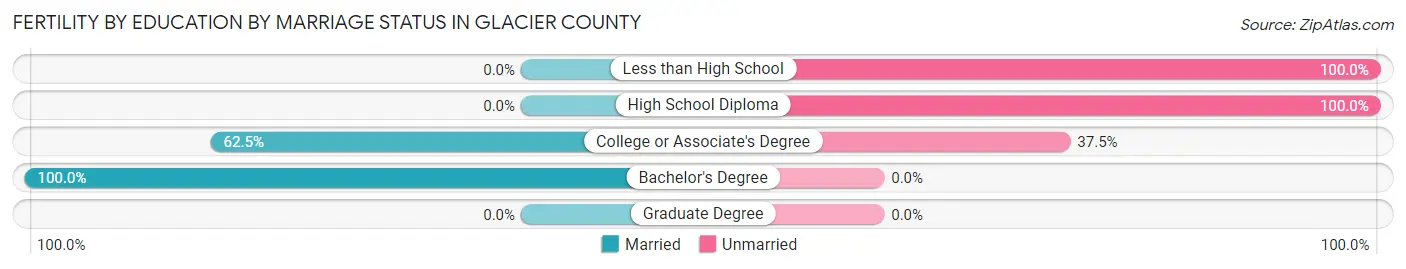
| Educational Attainment | Married | Unmarried |
| Less than High School | 0 (0.0%) | 13 (100.0%) |
| High School Diploma | 0 (0.0%) | 6 (100.0%) |
| College or Associate's Degree | 30 (62.5%) | 18 (37.5%) |
| Bachelor's Degree | 4 (100.0%) | 0 (0.0%) |
| Graduate Degree | 0 (0.0%) | 0 (0.0%) |
| Total | 34 (47.9%) | 37 (52.1%) |
Employment Characteristics in Glacier County
Employment by Class of Employer in Glacier County
Among the 4,830 employed individuals in Glacier County, private company employees (1,744 | 36.1%), federal government employees (1,064 | 22.0%), and local government employees (1,006 | 20.8%) make up the most common classes of employment.
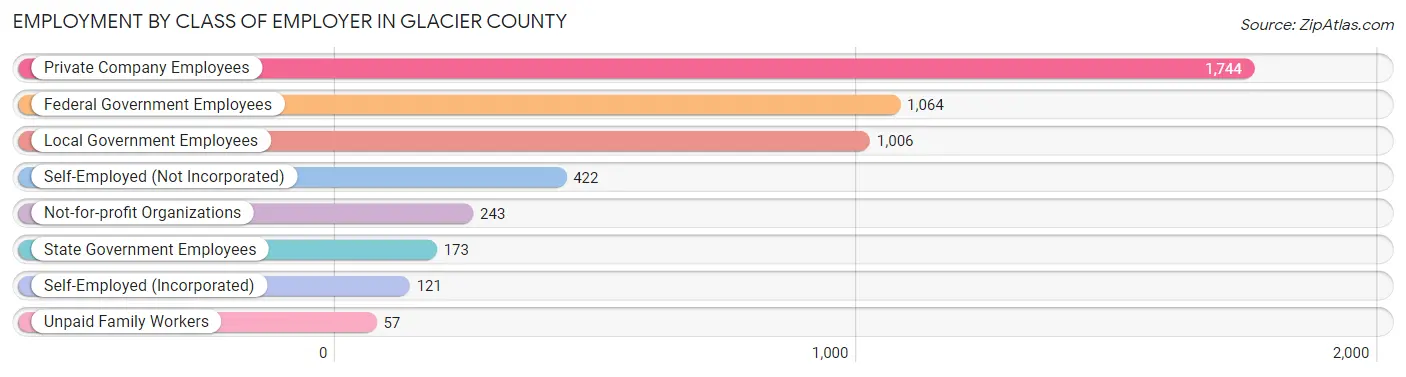
| Employer Class | # Employees | % Employees |
| Private Company Employees | 1,744 | 36.1% |
| Self-Employed (Incorporated) | 121 | 2.5% |
| Self-Employed (Not Incorporated) | 422 | 8.7% |
| Not-for-profit Organizations | 243 | 5.0% |
| Local Government Employees | 1,006 | 20.8% |
| State Government Employees | 173 | 3.6% |
| Federal Government Employees | 1,064 | 22.0% |
| Unpaid Family Workers | 57 | 1.2% |
| Total | 4,830 | 100.0% |
Employment Status by Age in Glacier County
According to the labor force statistics for Glacier County, out of the total population over 16 years of age (10,048), 53.3% or 5,356 individuals are in the labor force, with 7.9% or 423 of them unemployed. The age group with the highest labor force participation rate is 30 to 34 years, with 78.5% or 749 individuals in the labor force. Within the labor force, the 20 to 24 years age range has the highest percentage of unemployed individuals, with 24.6% or 118 of them being unemployed.
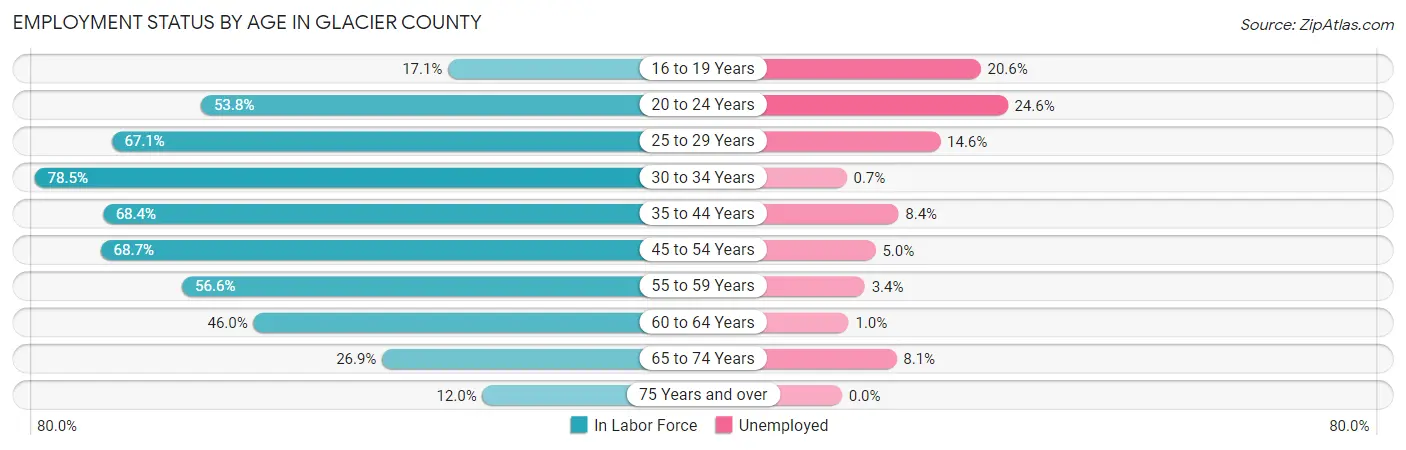
| Age Bracket | In Labor Force | Unemployed |
| 16 to 19 Years | 126 (17.1%) | 26 (20.6%) |
| 20 to 24 Years | 479 (53.8%) | 118 (24.6%) |
| 25 to 29 Years | 562 (67.1%) | 82 (14.6%) |
| 30 to 34 Years | 749 (78.5%) | 5 (0.7%) |
| 35 to 44 Years | 1,189 (68.4%) | 100 (8.4%) |
| 45 to 54 Years | 995 (68.7%) | 50 (5.0%) |
| 55 to 59 Years | 496 (56.6%) | 17 (3.4%) |
| 60 to 64 Years | 392 (46.0%) | 4 (1.0%) |
| 65 to 74 Years | 283 (26.9%) | 23 (8.1%) |
| 75 Years and over | 80 (12.0%) | 0 (0.0%) |
| Total | 5,356 (53.3%) | 423 (7.9%) |
Employment Status by Educational Attainment in Glacier County
According to labor force statistics for Glacier County, 65.4% of individuals (4,386) out of the total population between 25 and 64 years of age (6,706) are in the labor force, with 5.9% or 259 of them being unemployed. The group with the highest labor force participation rate are those with the educational attainment of bachelor's degree or higher, with 85.6% or 1,184 individuals in the labor force. Within the labor force, individuals with less than high school education have the highest percentage of unemployment, with 24.8% or 62 of them being unemployed.
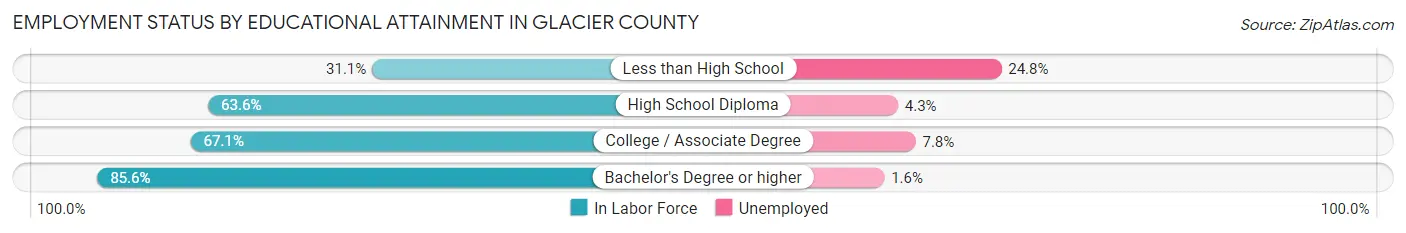
| Educational Attainment | In Labor Force | Unemployed |
| Less than High School | 250 (31.1%) | 199 (24.8%) |
| High School Diploma | 1,520 (63.6%) | 103 (4.3%) |
| College / Associate Degree | 1,429 (67.1%) | 166 (7.8%) |
| Bachelor's Degree or higher | 1,184 (85.6%) | 22 (1.6%) |
| Total | 4,386 (65.4%) | 396 (5.9%) |
Employment Occupations by Sex in Glacier County
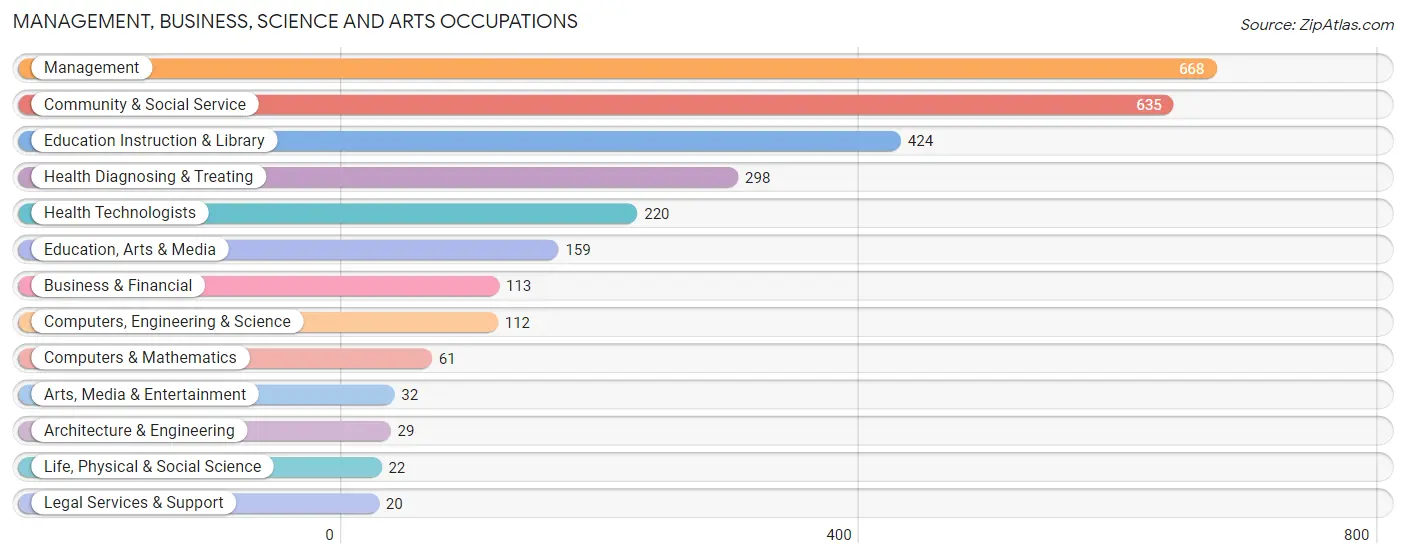
Management, Business, Science and Arts Occupations
The most common Management, Business, Science and Arts occupations in Glacier County are Management (668 | 13.6%), Community & Social Service (635 | 12.9%), Education Instruction & Library (424 | 8.6%), Health Diagnosing & Treating (298 | 6.0%), and Health Technologists (220 | 4.5%).
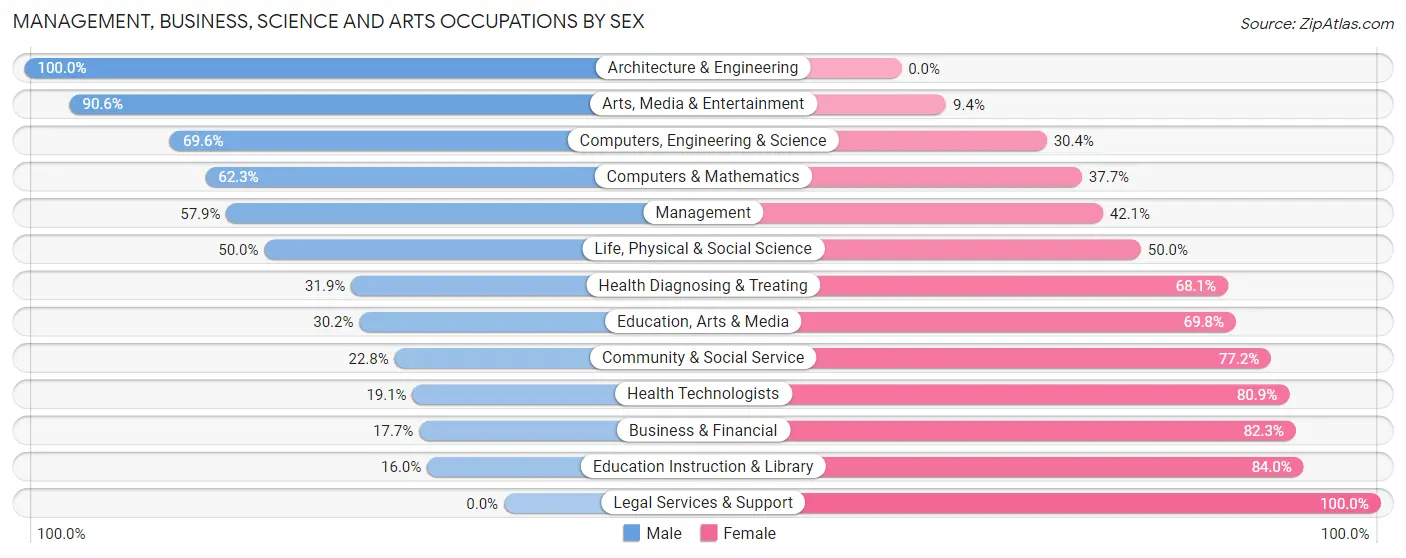
Management, Business, Science and Arts Occupations by Sex
Within the Management, Business, Science and Arts occupations in Glacier County, the most male-oriented occupations are Architecture & Engineering (100.0%), Arts, Media & Entertainment (90.6%), and Computers, Engineering & Science (69.6%), while the most female-oriented occupations are Legal Services & Support (100.0%), Education Instruction & Library (84.0%), and Business & Financial (82.3%).
| Occupation | Male | Female |
| Management | 387 (57.9%) | 281 (42.1%) |
| Business & Financial | 20 (17.7%) | 93 (82.3%) |
| Computers, Engineering & Science | 78 (69.6%) | 34 (30.4%) |
| Computers & Mathematics | 38 (62.3%) | 23 (37.7%) |
| Architecture & Engineering | 29 (100.0%) | 0 (0.0%) |
| Life, Physical & Social Science | 11 (50.0%) | 11 (50.0%) |
| Community & Social Service | 145 (22.8%) | 490 (77.2%) |
| Education, Arts & Media | 48 (30.2%) | 111 (69.8%) |
| Legal Services & Support | 0 (0.0%) | 20 (100.0%) |
| Education Instruction & Library | 68 (16.0%) | 356 (84.0%) |
| Arts, Media & Entertainment | 29 (90.6%) | 3 (9.4%) |
| Health Diagnosing & Treating | 95 (31.9%) | 203 (68.1%) |
| Health Technologists | 42 (19.1%) | 178 (80.9%) |
| Total (Category) | 725 (39.7%) | 1,101 (60.3%) |
| Total (Overall) | 2,612 (53.0%) | 2,314 (47.0%) |
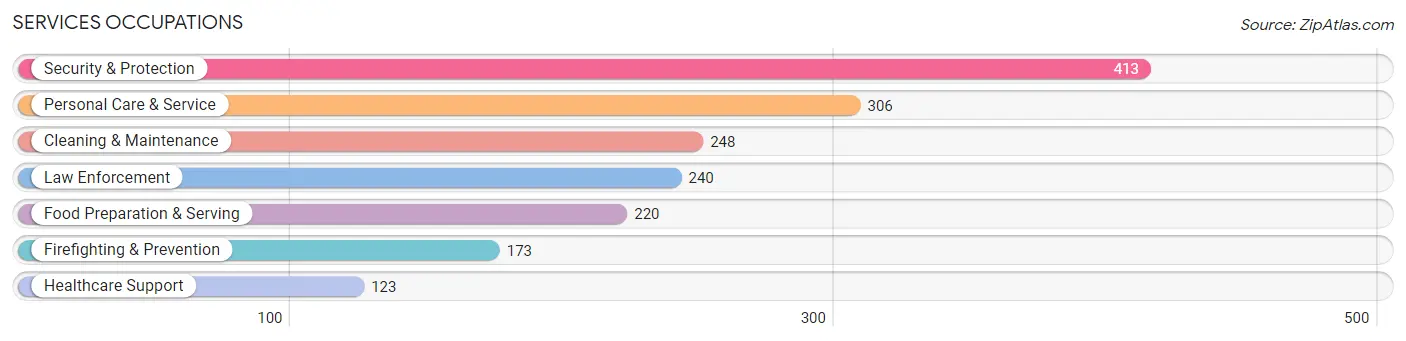
Services Occupations
The most common Services occupations in Glacier County are Security & Protection (413 | 8.4%), Personal Care & Service (306 | 6.2%), Cleaning & Maintenance (248 | 5.0%), Law Enforcement (240 | 4.9%), and Food Preparation & Serving (220 | 4.5%).
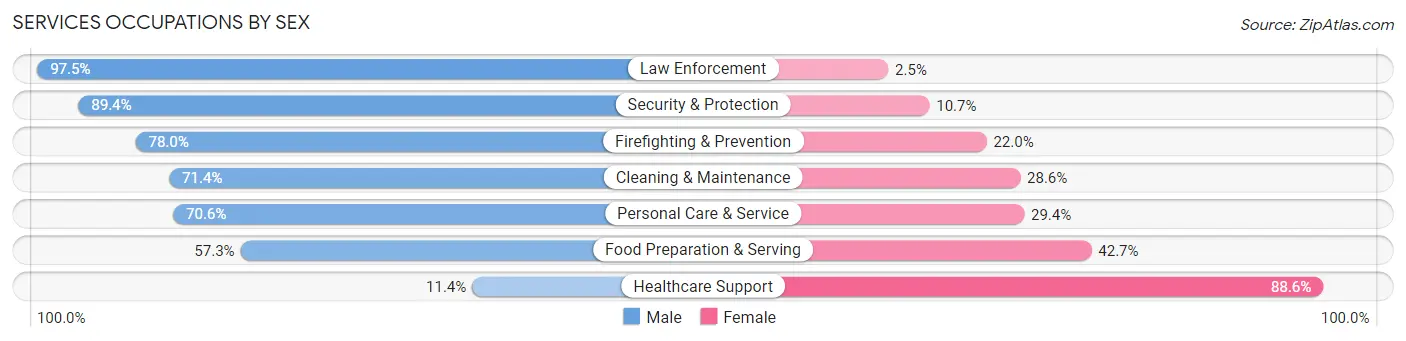
Services Occupations by Sex
Within the Services occupations in Glacier County, the most male-oriented occupations are Law Enforcement (97.5%), Security & Protection (89.3%), and Firefighting & Prevention (78.0%), while the most female-oriented occupations are Healthcare Support (88.6%), Food Preparation & Serving (42.7%), and Personal Care & Service (29.4%).
| Occupation | Male | Female |
| Healthcare Support | 14 (11.4%) | 109 (88.6%) |
| Security & Protection | 369 (89.3%) | 44 (10.6%) |
| Firefighting & Prevention | 135 (78.0%) | 38 (22.0%) |
| Law Enforcement | 234 (97.5%) | 6 (2.5%) |
| Food Preparation & Serving | 126 (57.3%) | 94 (42.7%) |
| Cleaning & Maintenance | 177 (71.4%) | 71 (28.6%) |
| Personal Care & Service | 216 (70.6%) | 90 (29.4%) |
| Total (Category) | 902 (68.9%) | 408 (31.1%) |
| Total (Overall) | 2,612 (53.0%) | 2,314 (47.0%) |
Sales and Office Occupations
The most common Sales and Office occupations in Glacier County are Sales & Related (506 | 10.3%), and Office & Administration (497 | 10.1%).
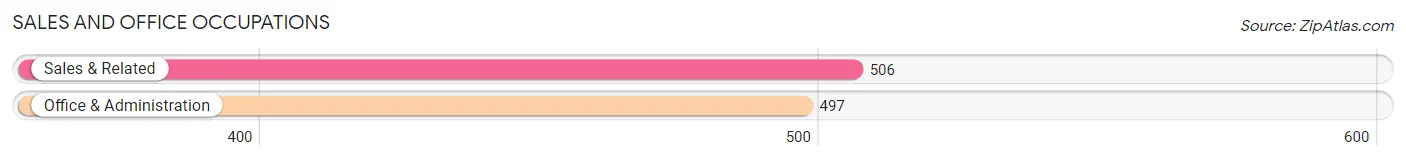
Sales and Office Occupations by Sex
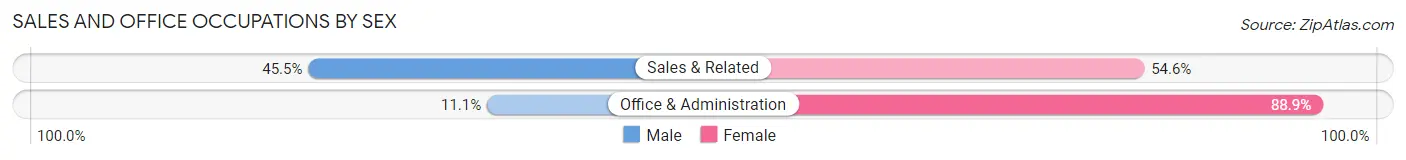
| Occupation | Male | Female |
| Sales & Related | 230 (45.5%) | 276 (54.5%) |
| Office & Administration | 55 (11.1%) | 442 (88.9%) |
| Total (Category) | 285 (28.4%) | 718 (71.6%) |
| Total (Overall) | 2,612 (53.0%) | 2,314 (47.0%) |
Natural Resources, Construction and Maintenance Occupations
The most common Natural Resources, Construction and Maintenance occupations in Glacier County are Construction & Extraction (158 | 3.2%), Farming, Fishing & Forestry (155 | 3.2%), and Installation, Maintenance & Repair (56 | 1.1%).
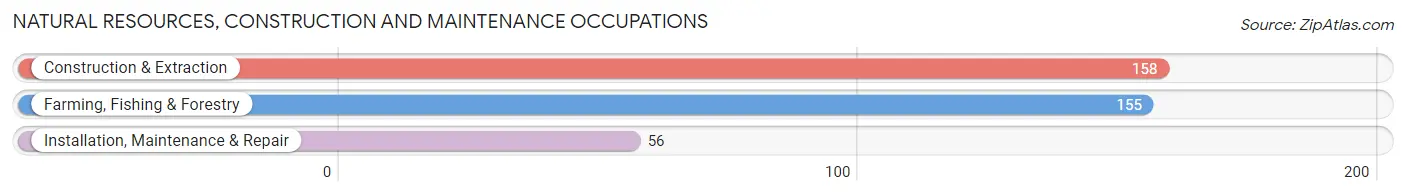
Natural Resources, Construction and Maintenance Occupations by Sex
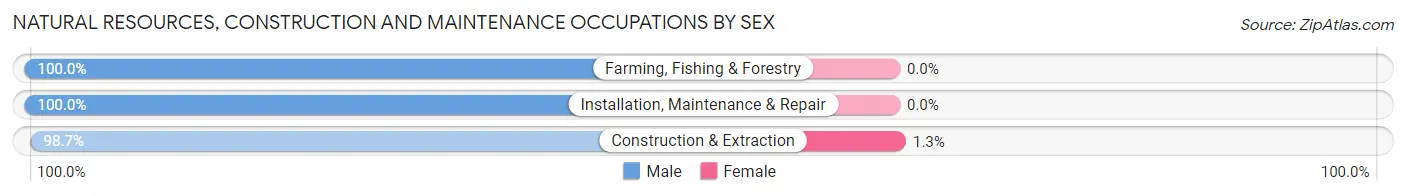
| Occupation | Male | Female |
| Farming, Fishing & Forestry | 155 (100.0%) | 0 (0.0%) |
| Construction & Extraction | 156 (98.7%) | 2 (1.3%) |
| Installation, Maintenance & Repair | 56 (100.0%) | 0 (0.0%) |
| Total (Category) | 367 (99.5%) | 2 (0.5%) |
| Total (Overall) | 2,612 (53.0%) | 2,314 (47.0%) |
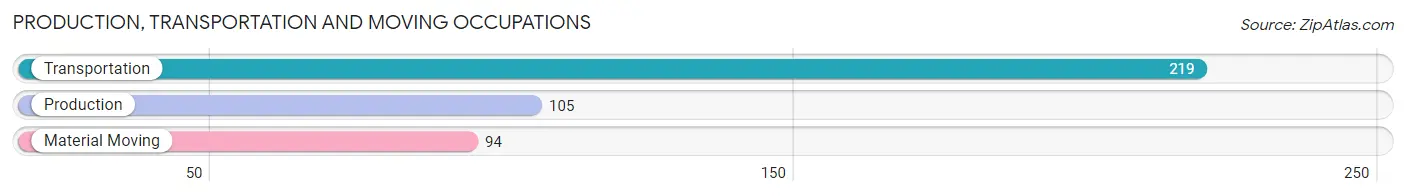
Production, Transportation and Moving Occupations
The most common Production, Transportation and Moving occupations in Glacier County are Transportation (219 | 4.4%), Production (105 | 2.1%), and Material Moving (94 | 1.9%).
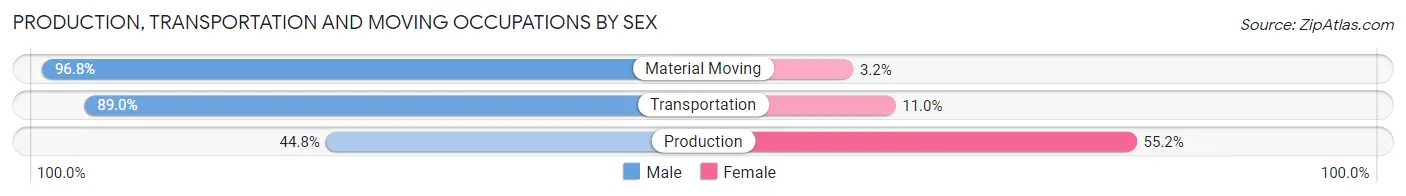
Production, Transportation and Moving Occupations by Sex
| Occupation | Male | Female |
| Production | 47 (44.8%) | 58 (55.2%) |
| Transportation | 195 (89.0%) | 24 (11.0%) |
| Material Moving | 91 (96.8%) | 3 (3.2%) |
| Total (Category) | 333 (79.7%) | 85 (20.3%) |
| Total (Overall) | 2,612 (53.0%) | 2,314 (47.0%) |
Employment Industries by Sex in Glacier County
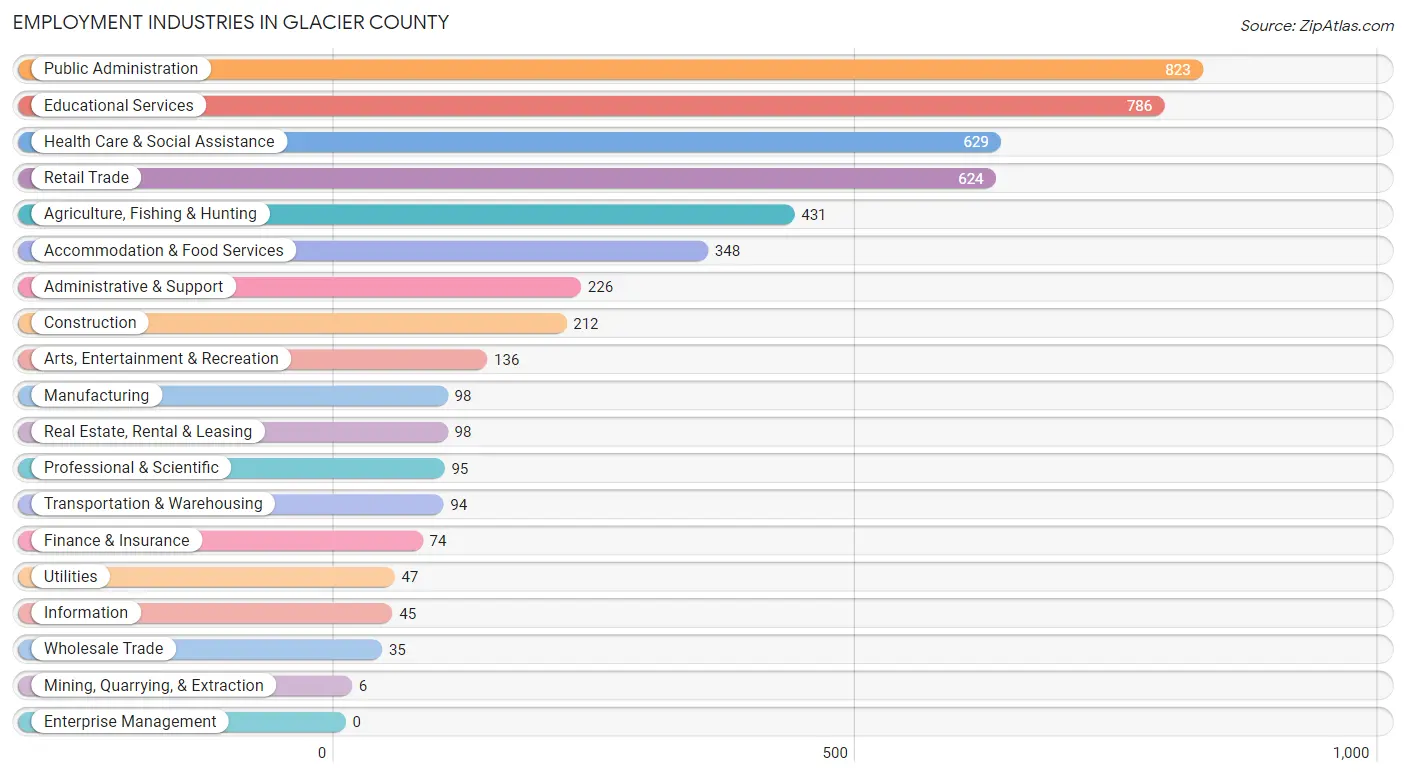
Employment Industries in Glacier County
The major employment industries in Glacier County include Public Administration (823 | 16.7%), Educational Services (786 | 16.0%), Health Care & Social Assistance (629 | 12.8%), Retail Trade (624 | 12.7%), and Agriculture, Fishing & Hunting (431 | 8.7%).
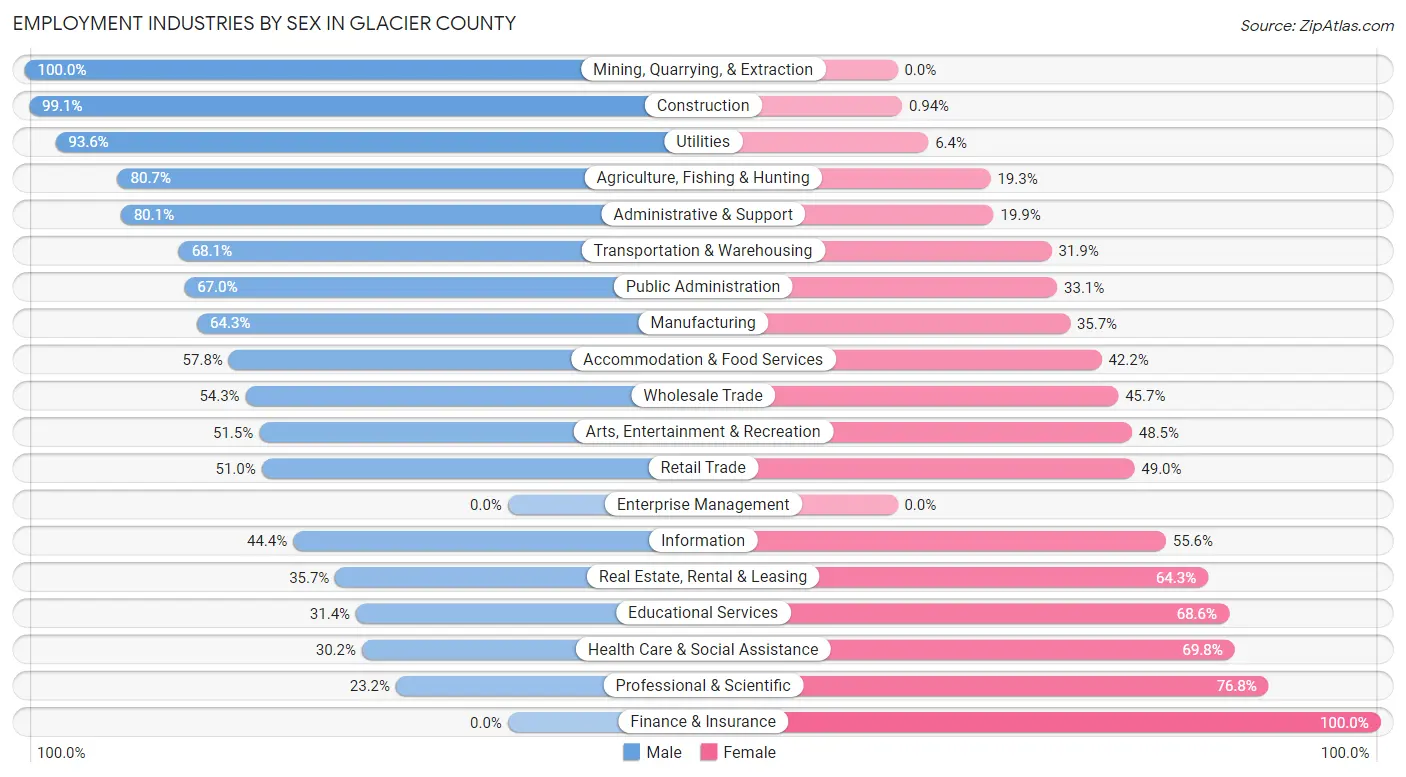
Employment Industries by Sex in Glacier County
The Glacier County industries that see more men than women are Mining, Quarrying, & Extraction (100.0%), Construction (99.1%), and Utilities (93.6%), whereas the industries that tend to have a higher number of women are Finance & Insurance (100.0%), Professional & Scientific (76.8%), and Health Care & Social Assistance (69.8%).
| Industry | Male | Female |
| Agriculture, Fishing & Hunting | 348 (80.7%) | 83 (19.3%) |
| Mining, Quarrying, & Extraction | 6 (100.0%) | 0 (0.0%) |
| Construction | 210 (99.1%) | 2 (0.9%) |
| Manufacturing | 63 (64.3%) | 35 (35.7%) |
| Wholesale Trade | 19 (54.3%) | 16 (45.7%) |
| Retail Trade | 318 (51.0%) | 306 (49.0%) |
| Transportation & Warehousing | 64 (68.1%) | 30 (31.9%) |
| Utilities | 44 (93.6%) | 3 (6.4%) |
| Information | 20 (44.4%) | 25 (55.6%) |
| Finance & Insurance | 0 (0.0%) | 74 (100.0%) |
| Real Estate, Rental & Leasing | 35 (35.7%) | 63 (64.3%) |
| Professional & Scientific | 22 (23.2%) | 73 (76.8%) |
| Enterprise Management | 0 (0.0%) | 0 (0.0%) |
| Administrative & Support | 181 (80.1%) | 45 (19.9%) |
| Educational Services | 247 (31.4%) | 539 (68.6%) |
| Health Care & Social Assistance | 190 (30.2%) | 439 (69.8%) |
| Arts, Entertainment & Recreation | 70 (51.5%) | 66 (48.5%) |
| Accommodation & Food Services | 201 (57.8%) | 147 (42.2%) |
| Public Administration | 551 (66.9%) | 272 (33.1%) |
| Total | 2,612 (53.0%) | 2,314 (47.0%) |
Education in Glacier County
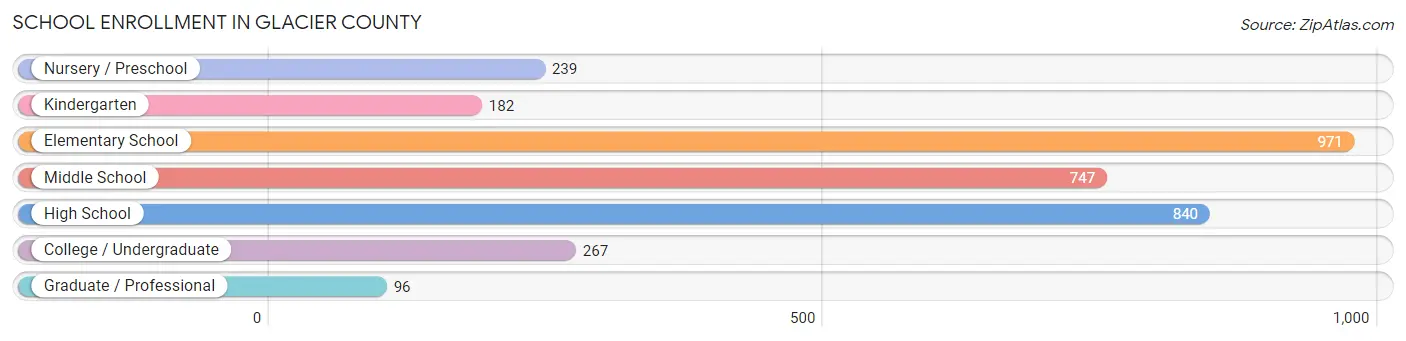
School Enrollment in Glacier County
The most common levels of schooling among the 3,342 students in Glacier County are elementary school (971 | 29.0%), high school (840 | 25.1%), and middle school (747 | 22.4%).
| School Level | # Students | % Students |
| Nursery / Preschool | 239 | 7.1% |
| Kindergarten | 182 | 5.4% |
| Elementary School | 971 | 29.0% |
| Middle School | 747 | 22.4% |
| High School | 840 | 25.1% |
| College / Undergraduate | 267 | 8.0% |
| Graduate / Professional | 96 | 2.9% |
| Total | 3,342 | 100.0% |
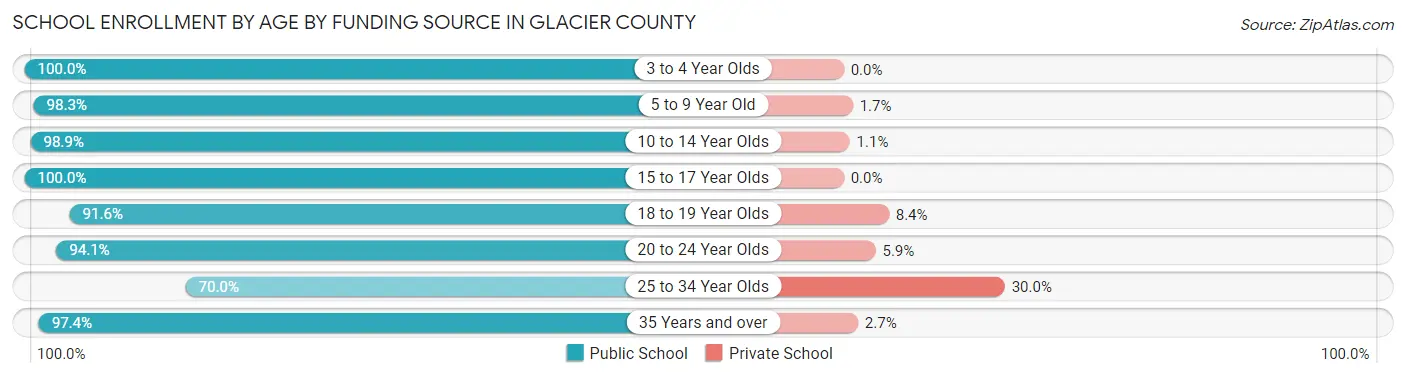
School Enrollment by Age by Funding Source in Glacier County
Out of a total of 3,342 students who are enrolled in schools in Glacier County, 74 (2.2%) attend a private institution, while the remaining 3,268 (97.8%) are enrolled in public schools. The age group of 25 to 34 year olds has the highest likelihood of being enrolled in private schools, with 21 (30.0% in the age bracket) enrolled. Conversely, the age group of 3 to 4 year olds has the lowest likelihood of being enrolled in a private school, with 194 (100.0% in the age bracket) attending a public institution.
| Age Bracket | Public School | Private School |
| 3 to 4 Year Olds | 194 (100.0%) | 0 (0.0%) |
| 5 to 9 Year Old | 1,044 (98.3%) | 18 (1.7%) |
| 10 to 14 Year Olds | 1,072 (98.9%) | 12 (1.1%) |
| 15 to 17 Year Olds | 553 (100.0%) | 0 (0.0%) |
| 18 to 19 Year Olds | 120 (91.6%) | 11 (8.4%) |
| 20 to 24 Year Olds | 127 (94.1%) | 8 (5.9%) |
| 25 to 34 Year Olds | 49 (70.0%) | 21 (30.0%) |
| 35 Years and over | 110 (97.4%) | 3 (2.6%) |
| Total | 3,268 (97.8%) | 74 (2.2%) |
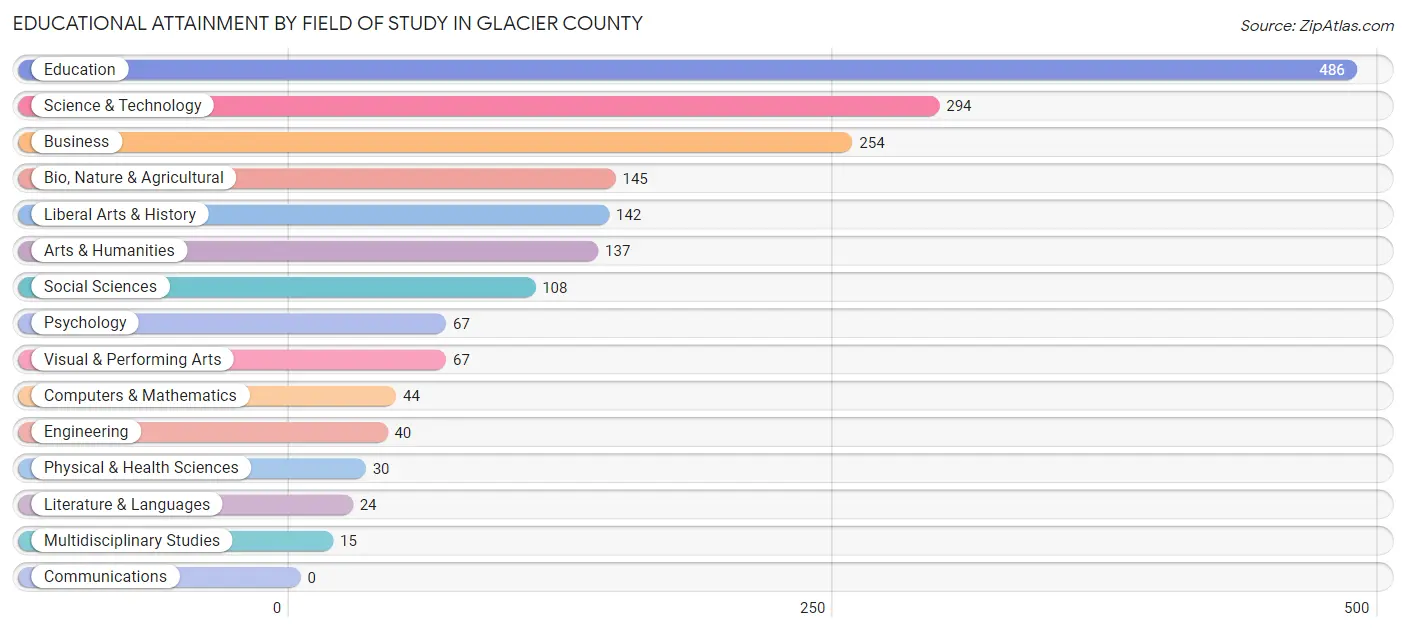
Educational Attainment by Field of Study in Glacier County
Education (486 | 26.2%), science & technology (294 | 15.9%), business (254 | 13.7%), bio, nature & agricultural (145 | 7.8%), and liberal arts & history (142 | 7.7%) are the most common fields of study among 1,853 individuals in Glacier County who have obtained a bachelor's degree or higher.
| Field of Study | # Graduates | % Graduates |
| Computers & Mathematics | 44 | 2.4% |
| Bio, Nature & Agricultural | 145 | 7.8% |
| Physical & Health Sciences | 30 | 1.6% |
| Psychology | 67 | 3.6% |
| Social Sciences | 108 | 5.8% |
| Engineering | 40 | 2.2% |
| Multidisciplinary Studies | 15 | 0.8% |
| Science & Technology | 294 | 15.9% |
| Business | 254 | 13.7% |
| Education | 486 | 26.2% |
| Literature & Languages | 24 | 1.3% |
| Liberal Arts & History | 142 | 7.7% |
| Visual & Performing Arts | 67 | 3.6% |
| Communications | 0 | 0.0% |
| Arts & Humanities | 137 | 7.4% |
| Total | 1,853 | 100.0% |
Transportation & Commute in Glacier County
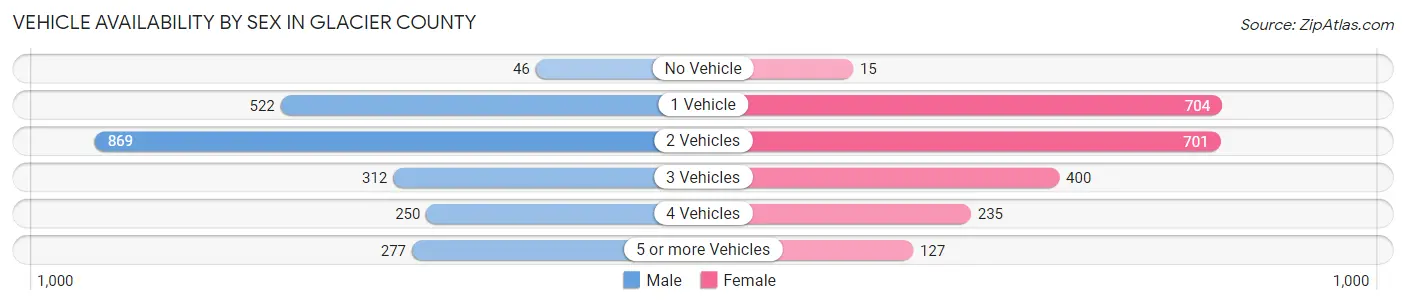
Vehicle Availability by Sex in Glacier County
The most prevalent vehicle ownership categories in Glacier County are males with 2 vehicles (869, accounting for 38.2%) and females with 2 vehicles (701, making up 39.8%).
| Vehicles Available | Male | Female |
| No Vehicle | 46 (2.0%) | 15 (0.7%) |
| 1 Vehicle | 522 (22.9%) | 704 (32.3%) |
| 2 Vehicles | 869 (38.2%) | 701 (32.1%) |
| 3 Vehicles | 312 (13.7%) | 400 (18.3%) |
| 4 Vehicles | 250 (11.0%) | 235 (10.8%) |
| 5 or more Vehicles | 277 (12.2%) | 127 (5.8%) |
| Total | 2,276 (100.0%) | 2,182 (100.0%) |
Commute Time in Glacier County
The most frequently occuring commute durations in Glacier County are 10 to 14 minutes (908 commuters, 22.5%), 5 to 9 minutes (781 commuters, 19.4%), and 15 to 19 minutes (745 commuters, 18.5%).
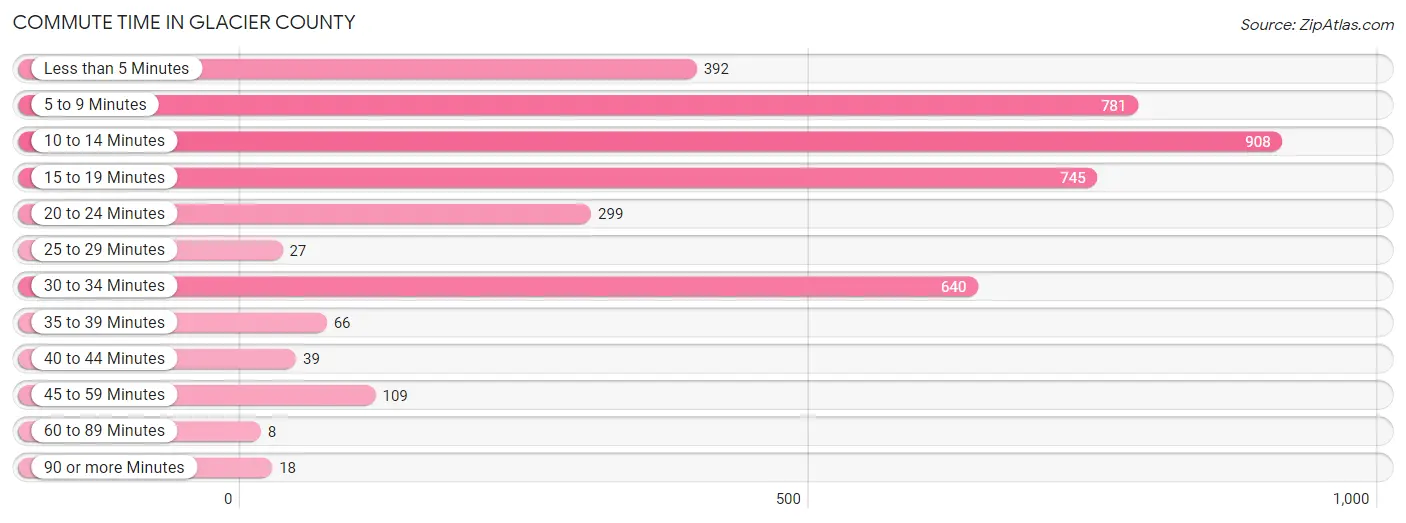
| Commute Time | # Commuters | % Commuters |
| Less than 5 Minutes | 392 | 9.7% |
| 5 to 9 Minutes | 781 | 19.4% |
| 10 to 14 Minutes | 908 | 22.5% |
| 15 to 19 Minutes | 745 | 18.5% |
| 20 to 24 Minutes | 299 | 7.4% |
| 25 to 29 Minutes | 27 | 0.7% |
| 30 to 34 Minutes | 640 | 15.9% |
| 35 to 39 Minutes | 66 | 1.6% |
| 40 to 44 Minutes | 39 | 1.0% |
| 45 to 59 Minutes | 109 | 2.7% |
| 60 to 89 Minutes | 8 | 0.2% |
| 90 or more Minutes | 18 | 0.4% |
Commute Time by Sex in Glacier County
The most common commute times in Glacier County are 10 to 14 minutes (535 commuters, 26.0%) for males and 5 to 9 minutes (473 commuters, 24.0%) for females.
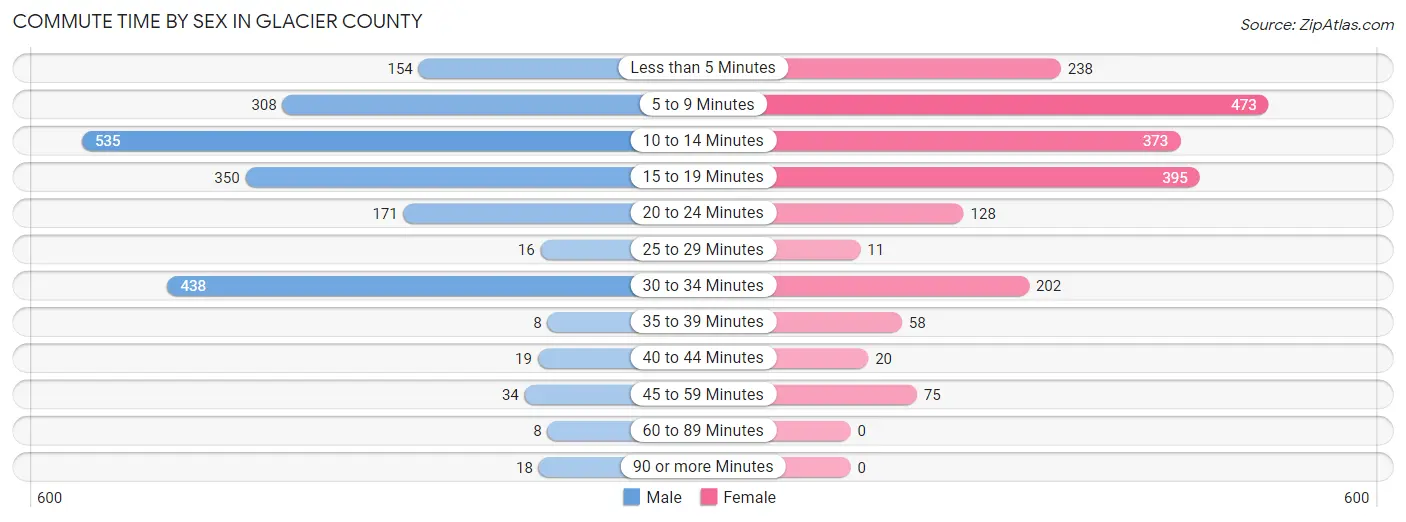
| Commute Time | Male | Female |
| Less than 5 Minutes | 154 (7.5%) | 238 (12.1%) |
| 5 to 9 Minutes | 308 (15.0%) | 473 (24.0%) |
| 10 to 14 Minutes | 535 (26.0%) | 373 (18.9%) |
| 15 to 19 Minutes | 350 (17.0%) | 395 (20.0%) |
| 20 to 24 Minutes | 171 (8.3%) | 128 (6.5%) |
| 25 to 29 Minutes | 16 (0.8%) | 11 (0.6%) |
| 30 to 34 Minutes | 438 (21.3%) | 202 (10.2%) |
| 35 to 39 Minutes | 8 (0.4%) | 58 (2.9%) |
| 40 to 44 Minutes | 19 (0.9%) | 20 (1.0%) |
| 45 to 59 Minutes | 34 (1.7%) | 75 (3.8%) |
| 60 to 89 Minutes | 8 (0.4%) | 0 (0.0%) |
| 90 or more Minutes | 18 (0.9%) | 0 (0.0%) |
Time of Departure to Work by Sex in Glacier County
The most frequent times of departure to work in Glacier County are 7:30 AM to 7:59 AM (450, 21.9%) for males and 7:30 AM to 7:59 AM (578, 29.3%) for females.
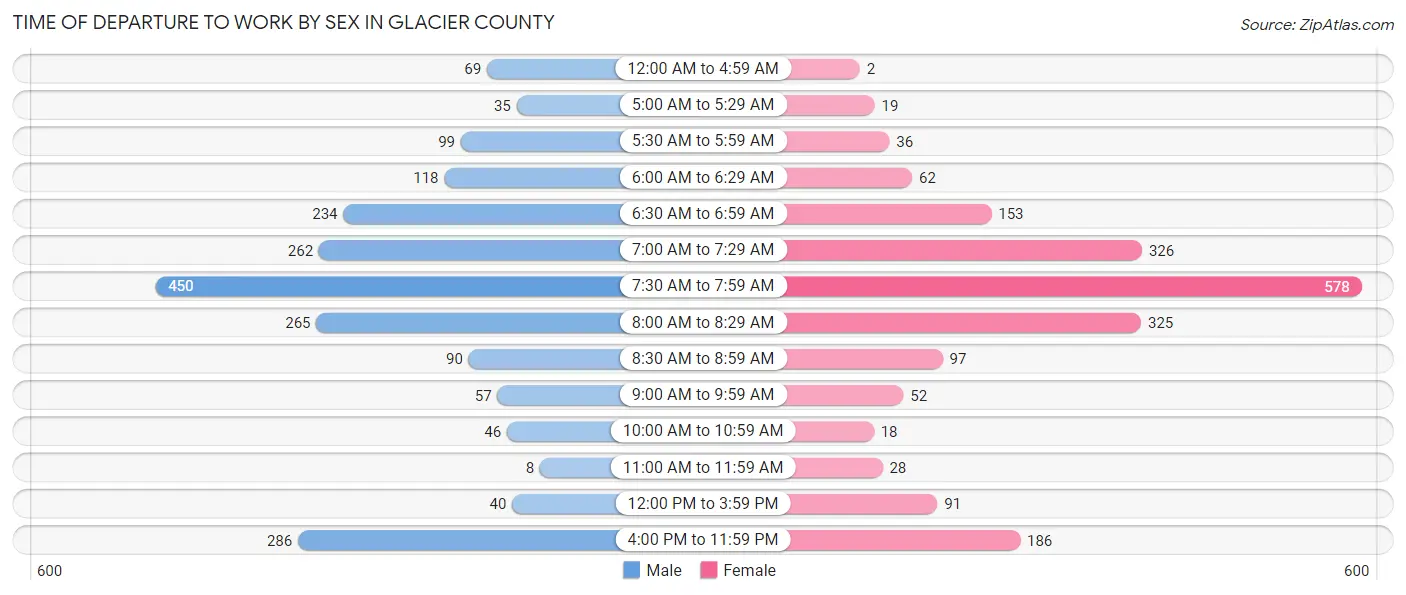
| Time of Departure | Male | Female |
| 12:00 AM to 4:59 AM | 69 (3.4%) | 2 (0.1%) |
| 5:00 AM to 5:29 AM | 35 (1.7%) | 19 (1.0%) |
| 5:30 AM to 5:59 AM | 99 (4.8%) | 36 (1.8%) |
| 6:00 AM to 6:29 AM | 118 (5.7%) | 62 (3.1%) |
| 6:30 AM to 6:59 AM | 234 (11.4%) | 153 (7.7%) |
| 7:00 AM to 7:29 AM | 262 (12.7%) | 326 (16.5%) |
| 7:30 AM to 7:59 AM | 450 (21.9%) | 578 (29.3%) |
| 8:00 AM to 8:29 AM | 265 (12.9%) | 325 (16.5%) |
| 8:30 AM to 8:59 AM | 90 (4.4%) | 97 (4.9%) |
| 9:00 AM to 9:59 AM | 57 (2.8%) | 52 (2.6%) |
| 10:00 AM to 10:59 AM | 46 (2.2%) | 18 (0.9%) |
| 11:00 AM to 11:59 AM | 8 (0.4%) | 28 (1.4%) |
| 12:00 PM to 3:59 PM | 40 (1.9%) | 91 (4.6%) |
| 4:00 PM to 11:59 PM | 286 (13.9%) | 186 (9.4%) |
| Total | 2,059 (100.0%) | 1,973 (100.0%) |
Housing Occupancy in Glacier County
Occupancy by Ownership in Glacier County
Of the total 4,175 dwellings in Glacier County, owner-occupied units account for 2,655 (63.6%), while renter-occupied units make up 1,520 (36.4%).
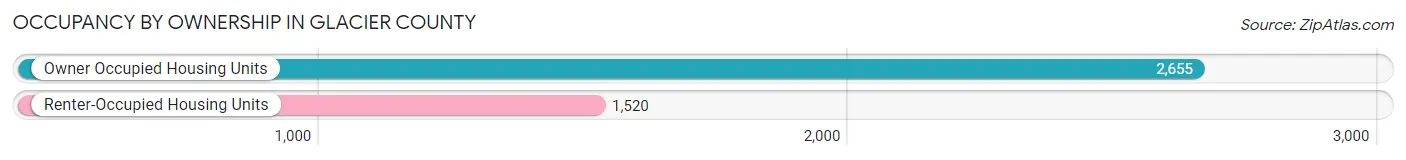
| Occupancy | # Housing Units | % Housing Units |
| Owner Occupied Housing Units | 2,655 | 63.6% |
| Renter-Occupied Housing Units | 1,520 | 36.4% |
| Total Occupied Housing Units | 4,175 | 100.0% |
Occupancy by Household Size in Glacier County
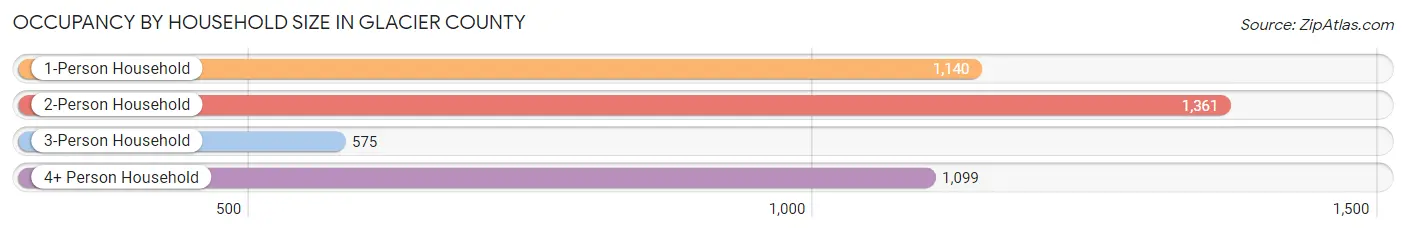
| Household Size | # Housing Units | % Housing Units |
| 1-Person Household | 1,140 | 27.3% |
| 2-Person Household | 1,361 | 32.6% |
| 3-Person Household | 575 | 13.8% |
| 4+ Person Household | 1,099 | 26.3% |
| Total Housing Units | 4,175 | 100.0% |
Occupancy by Ownership by Household Size in Glacier County
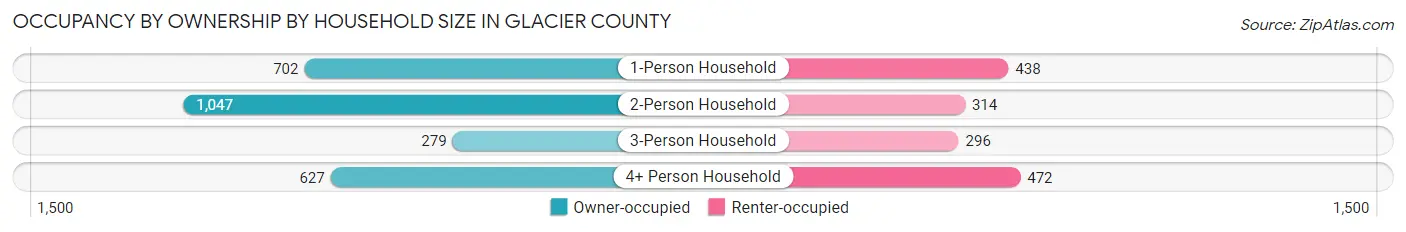
| Household Size | Owner-occupied | Renter-occupied |
| 1-Person Household | 702 (61.6%) | 438 (38.4%) |
| 2-Person Household | 1,047 (76.9%) | 314 (23.1%) |
| 3-Person Household | 279 (48.5%) | 296 (51.5%) |
| 4+ Person Household | 627 (57.1%) | 472 (42.9%) |
| Total Housing Units | 2,655 (63.6%) | 1,520 (36.4%) |
Occupancy by Educational Attainment in Glacier County
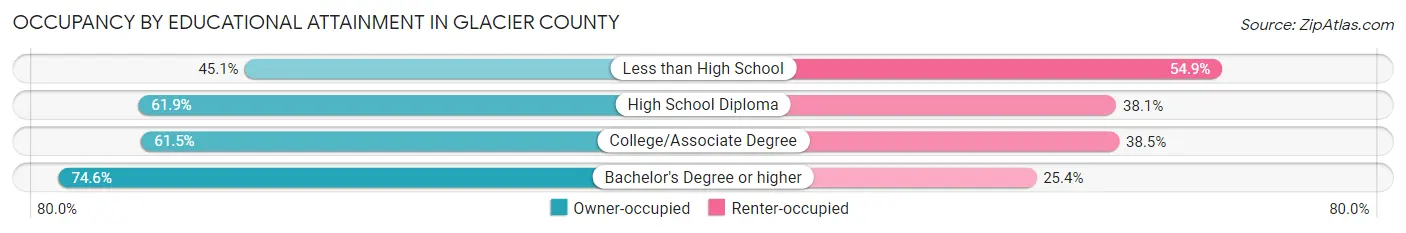
| Household Size | Owner-occupied | Renter-occupied |
| Less than High School | 162 (45.1%) | 197 (54.9%) |
| High School Diploma | 742 (61.9%) | 456 (38.1%) |
| College/Associate Degree | 946 (61.5%) | 593 (38.5%) |
| Bachelor's Degree or higher | 805 (74.6%) | 274 (25.4%) |
Occupancy by Age of Householder in Glacier County
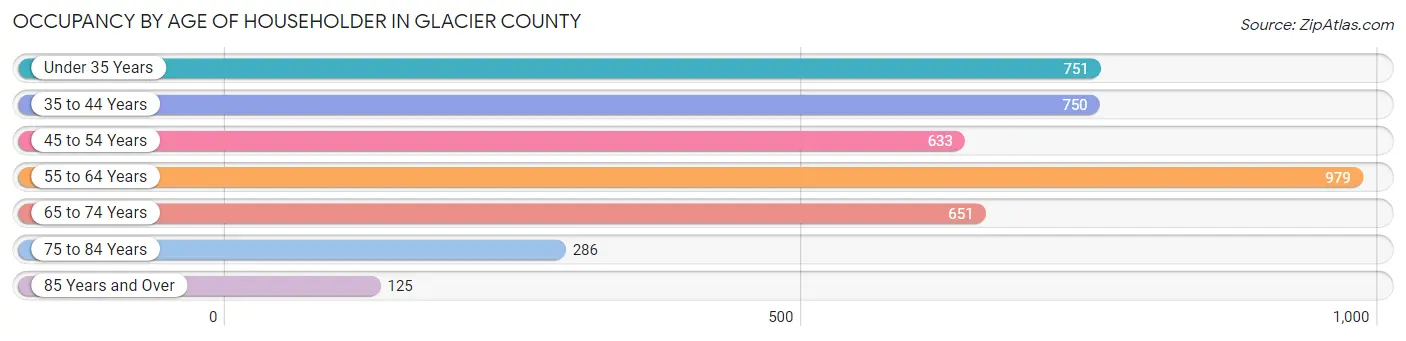
| Age Bracket | # Households | % Households |
| Under 35 Years | 751 | 18.0% |
| 35 to 44 Years | 750 | 18.0% |
| 45 to 54 Years | 633 | 15.2% |
| 55 to 64 Years | 979 | 23.4% |
| 65 to 74 Years | 651 | 15.6% |
| 75 to 84 Years | 286 | 6.9% |
| 85 Years and Over | 125 | 3.0% |
| Total | 4,175 | 100.0% |
Housing Finances in Glacier County
Median Income by Occupancy in Glacier County
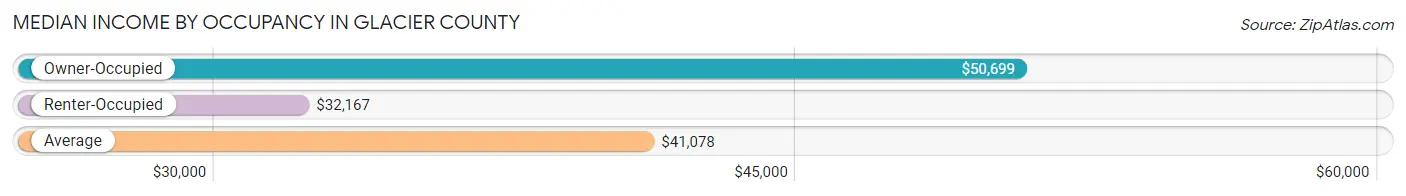
| Occupancy Type | # Households | Median Income |
| Owner-Occupied | 2,655 (63.6%) | $50,699 |
| Renter-Occupied | 1,520 (36.4%) | $32,167 |
| Average | 4,175 (100.0%) | $41,078 |
Occupancy by Householder Income Bracket in Glacier County
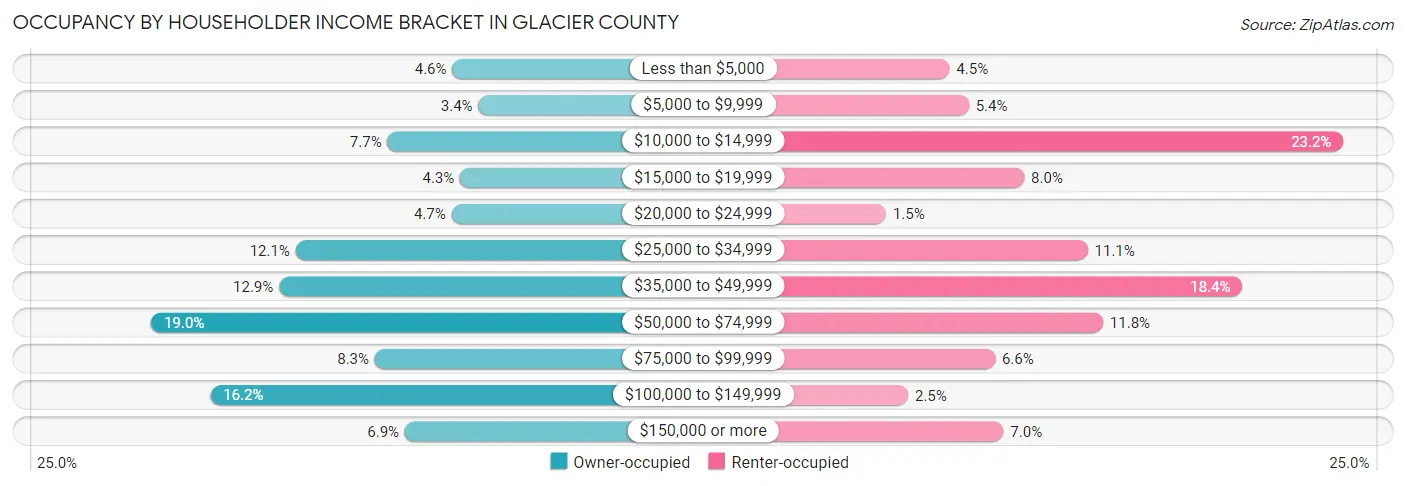
| Income Bracket | Owner-occupied | Renter-occupied |
| Less than $5,000 | 123 (4.6%) | 68 (4.5%) |
| $5,000 to $9,999 | 90 (3.4%) | 82 (5.4%) |
| $10,000 to $14,999 | 205 (7.7%) | 353 (23.2%) |
| $15,000 to $19,999 | 113 (4.3%) | 122 (8.0%) |
| $20,000 to $24,999 | 124 (4.7%) | 22 (1.5%) |
| $25,000 to $34,999 | 321 (12.1%) | 168 (11.1%) |
| $35,000 to $49,999 | 342 (12.9%) | 280 (18.4%) |
| $50,000 to $74,999 | 504 (19.0%) | 179 (11.8%) |
| $75,000 to $99,999 | 221 (8.3%) | 101 (6.6%) |
| $100,000 to $149,999 | 429 (16.2%) | 38 (2.5%) |
| $150,000 or more | 183 (6.9%) | 107 (7.0%) |
| Total | 2,655 (100.0%) | 1,520 (100.0%) |
Monthly Housing Cost Tiers in Glacier County
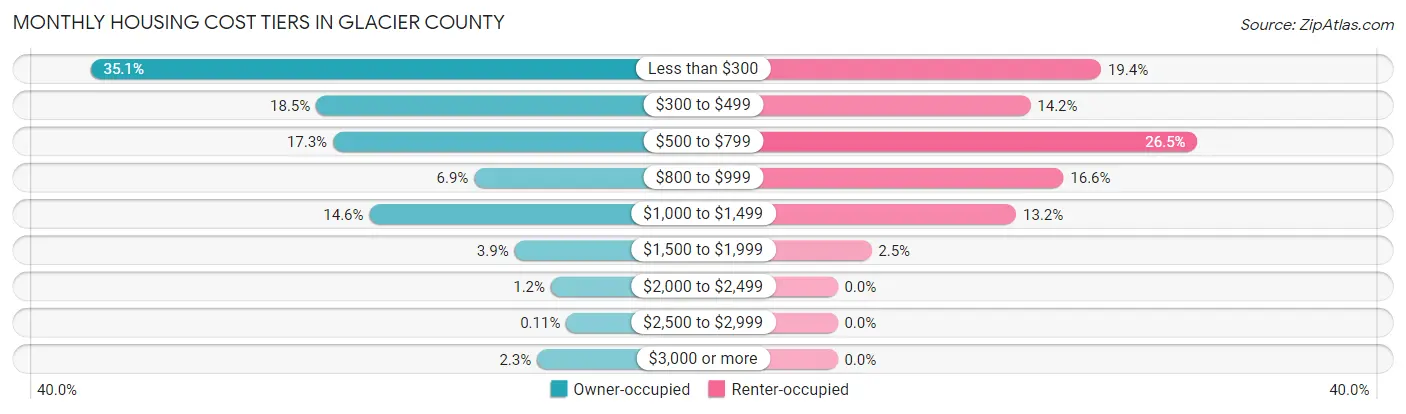
| Monthly Cost | Owner-occupied | Renter-occupied |
| Less than $300 | 933 (35.1%) | 295 (19.4%) |
| $300 to $499 | 492 (18.5%) | 216 (14.2%) |
| $500 to $799 | 459 (17.3%) | 403 (26.5%) |
| $800 to $999 | 183 (6.9%) | 253 (16.6%) |
| $1,000 to $1,499 | 388 (14.6%) | 200 (13.2%) |
| $1,500 to $1,999 | 104 (3.9%) | 38 (2.5%) |
| $2,000 to $2,499 | 33 (1.2%) | 0 (0.0%) |
| $2,500 to $2,999 | 3 (0.1%) | 0 (0.0%) |
| $3,000 or more | 60 (2.3%) | 0 (0.0%) |
| Total | 2,655 (100.0%) | 1,520 (100.0%) |
Physical Housing Characteristics in Glacier County
Housing Structures in Glacier County
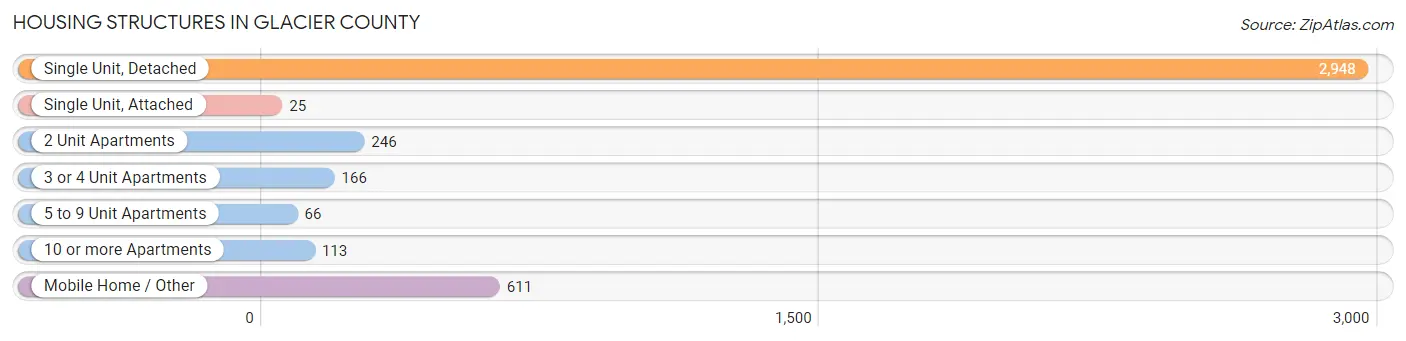
| Structure Type | # Housing Units | % Housing Units |
| Single Unit, Detached | 2,948 | 70.6% |
| Single Unit, Attached | 25 | 0.6% |
| 2 Unit Apartments | 246 | 5.9% |
| 3 or 4 Unit Apartments | 166 | 4.0% |
| 5 to 9 Unit Apartments | 66 | 1.6% |
| 10 or more Apartments | 113 | 2.7% |
| Mobile Home / Other | 611 | 14.6% |
| Total | 4,175 | 100.0% |
Housing Structures by Occupancy in Glacier County
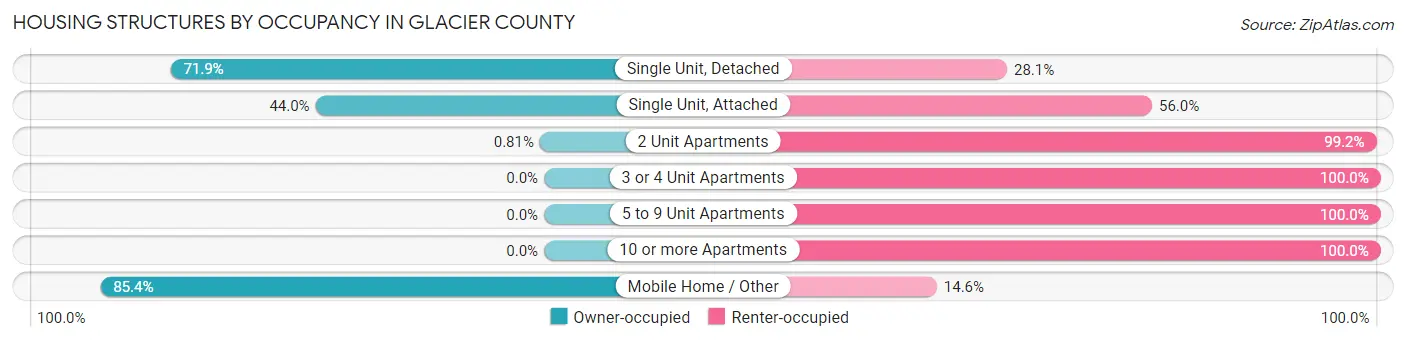
| Structure Type | Owner-occupied | Renter-occupied |
| Single Unit, Detached | 2,120 (71.9%) | 828 (28.1%) |
| Single Unit, Attached | 11 (44.0%) | 14 (56.0%) |
| 2 Unit Apartments | 2 (0.8%) | 244 (99.2%) |
| 3 or 4 Unit Apartments | 0 (0.0%) | 166 (100.0%) |
| 5 to 9 Unit Apartments | 0 (0.0%) | 66 (100.0%) |
| 10 or more Apartments | 0 (0.0%) | 113 (100.0%) |
| Mobile Home / Other | 522 (85.4%) | 89 (14.6%) |
| Total | 2,655 (63.6%) | 1,520 (36.4%) |
Housing Structures by Number of Rooms in Glacier County
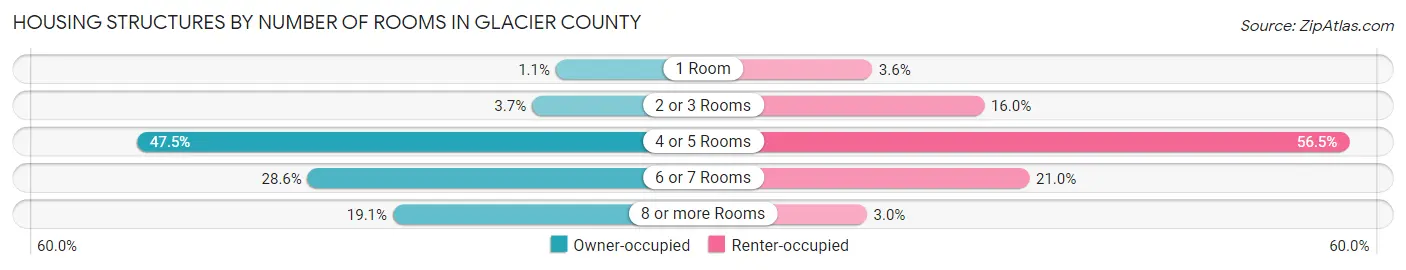
| Number of Rooms | Owner-occupied | Renter-occupied |
| 1 Room | 28 (1.1%) | 54 (3.5%) |
| 2 or 3 Rooms | 98 (3.7%) | 243 (16.0%) |
| 4 or 5 Rooms | 1,262 (47.5%) | 859 (56.5%) |
| 6 or 7 Rooms | 759 (28.6%) | 319 (21.0%) |
| 8 or more Rooms | 508 (19.1%) | 45 (3.0%) |
| Total | 2,655 (100.0%) | 1,520 (100.0%) |
Housing Structure by Heating Type in Glacier County
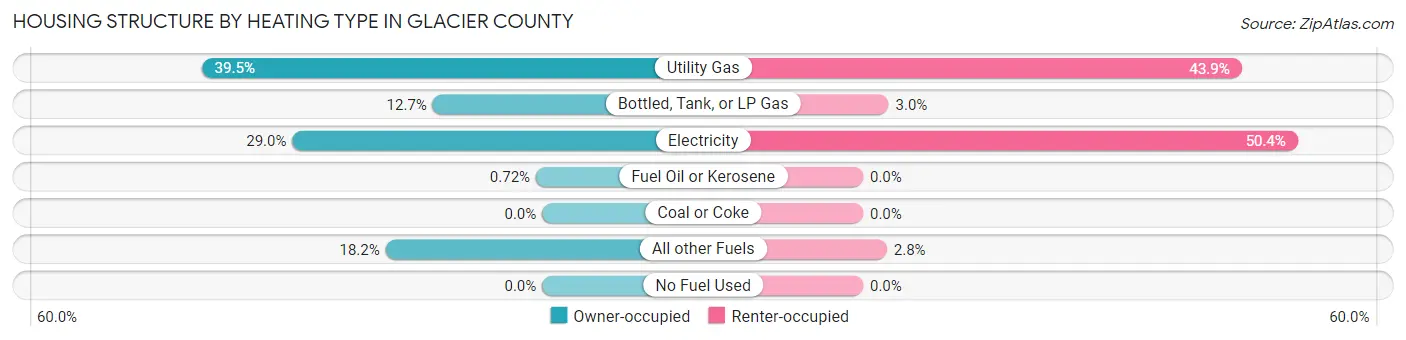
| Heating Type | Owner-occupied | Renter-occupied |
| Utility Gas | 1,048 (39.5%) | 667 (43.9%) |
| Bottled, Tank, or LP Gas | 337 (12.7%) | 45 (3.0%) |
| Electricity | 769 (29.0%) | 766 (50.4%) |
| Fuel Oil or Kerosene | 19 (0.7%) | 0 (0.0%) |
| Coal or Coke | 0 (0.0%) | 0 (0.0%) |
| All other Fuels | 482 (18.1%) | 42 (2.8%) |
| No Fuel Used | 0 (0.0%) | 0 (0.0%) |
| Total | 2,655 (100.0%) | 1,520 (100.0%) |
Household Vehicle Usage in Glacier County
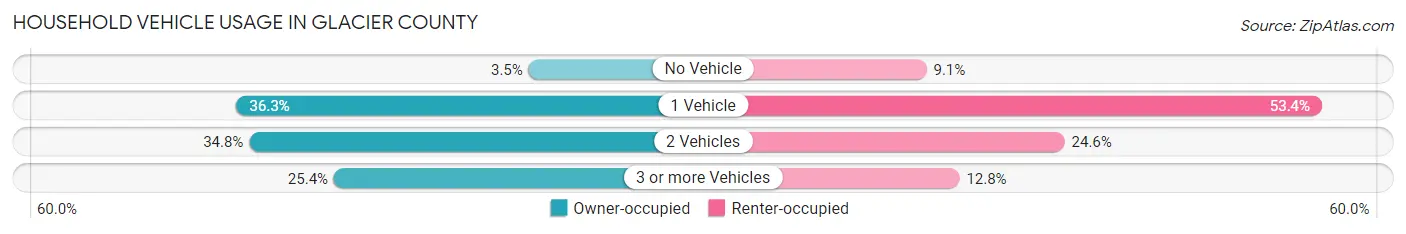
| Vehicles per Household | Owner-occupied | Renter-occupied |
| No Vehicle | 94 (3.5%) | 139 (9.1%) |
| 1 Vehicle | 963 (36.3%) | 812 (53.4%) |
| 2 Vehicles | 925 (34.8%) | 374 (24.6%) |
| 3 or more Vehicles | 673 (25.4%) | 195 (12.8%) |
| Total | 2,655 (100.0%) | 1,520 (100.0%) |
Real Estate & Mortgages in Glacier County
Real Estate and Mortgage Overview in Glacier County
| Characteristic | Without Mortgage | With Mortgage |
| Housing Units | 1,852 | 803 |
| Median Property Value | $126,600 | $153,400 |
| Median Household Income | $39,833 | $45 |
| Monthly Housing Costs | $300 | $31 |
| Real Estate Taxes | $996 | $126 |
Property Value by Mortgage Status in Glacier County
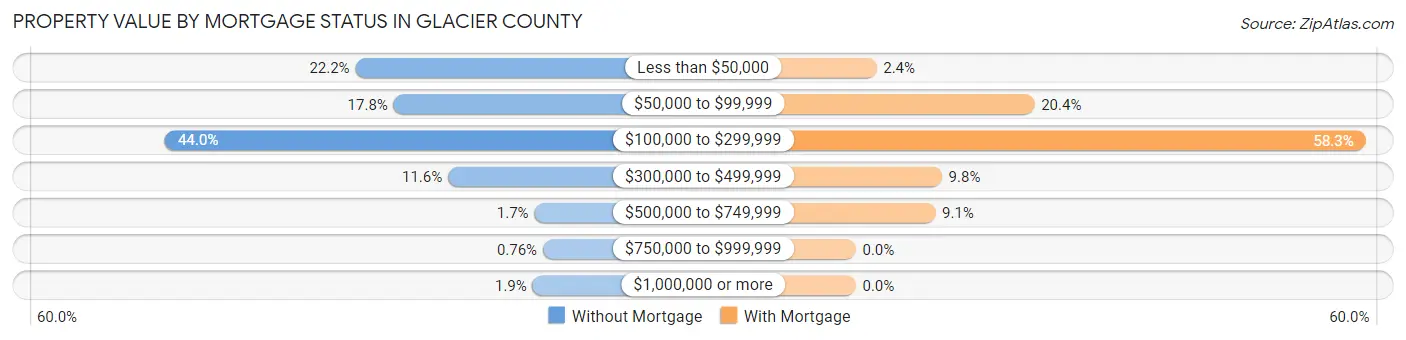
| Property Value | Without Mortgage | With Mortgage |
| Less than $50,000 | 411 (22.2%) | 19 (2.4%) |
| $50,000 to $99,999 | 330 (17.8%) | 164 (20.4%) |
| $100,000 to $299,999 | 814 (44.0%) | 468 (58.3%) |
| $300,000 to $499,999 | 215 (11.6%) | 79 (9.8%) |
| $500,000 to $749,999 | 32 (1.7%) | 73 (9.1%) |
| $750,000 to $999,999 | 14 (0.8%) | 0 (0.0%) |
| $1,000,000 or more | 36 (1.9%) | 0 (0.0%) |
| Total | 1,852 (100.0%) | 803 (100.0%) |
Household Income by Mortgage Status in Glacier County
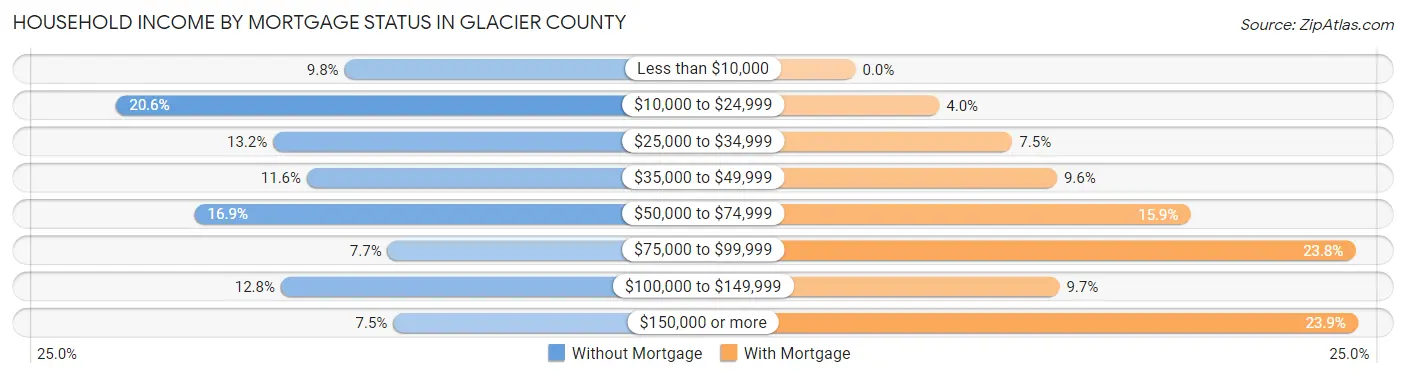
| Household Income | Without Mortgage | With Mortgage |
| Less than $10,000 | 181 (9.8%) | 0 (0.0%) |
| $10,000 to $24,999 | 382 (20.6%) | 32 (4.0%) |
| $25,000 to $34,999 | 244 (13.2%) | 60 (7.5%) |
| $35,000 to $49,999 | 214 (11.6%) | 77 (9.6%) |
| $50,000 to $74,999 | 313 (16.9%) | 128 (15.9%) |
| $75,000 to $99,999 | 143 (7.7%) | 191 (23.8%) |
| $100,000 to $149,999 | 237 (12.8%) | 78 (9.7%) |
| $150,000 or more | 138 (7.4%) | 192 (23.9%) |
| Total | 1,852 (100.0%) | 803 (100.0%) |
Property Value to Household Income Ratio in Glacier County
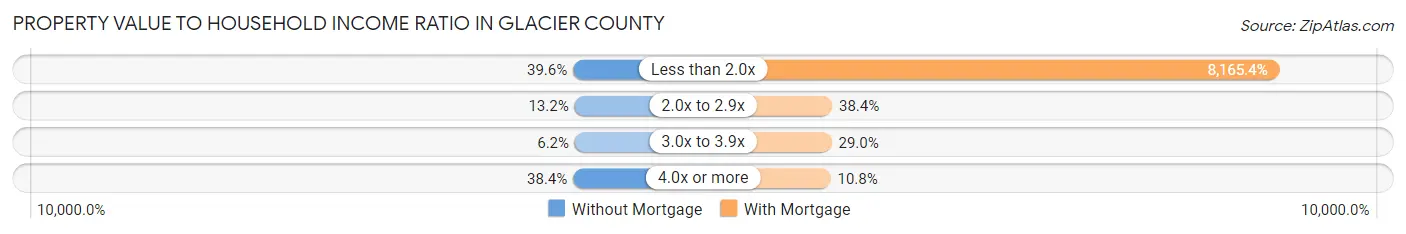
| Value-to-Income Ratio | Without Mortgage | With Mortgage |
| Less than 2.0x | 734 (39.6%) | 65,568 (8,165.4%) |
| 2.0x to 2.9x | 245 (13.2%) | 308 (38.4%) |
| 3.0x to 3.9x | 114 (6.2%) | 233 (29.0%) |
| 4.0x or more | 711 (38.4%) | 87 (10.8%) |
| Total | 1,852 (100.0%) | 803 (100.0%) |
Real Estate Taxes by Mortgage Status in Glacier County
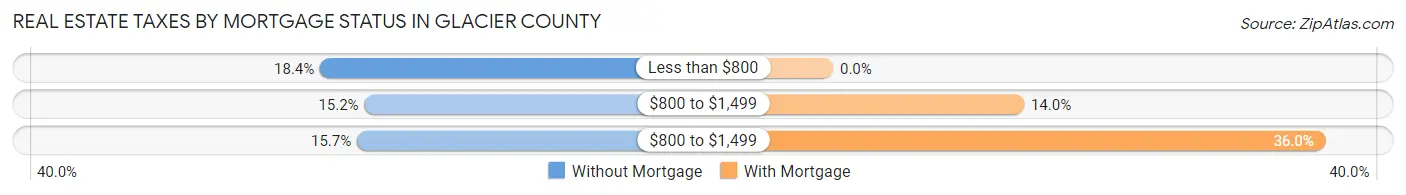
| Property Taxes | Without Mortgage | With Mortgage |
| Less than $800 | 341 (18.4%) | 0 (0.0%) |
| $800 to $1,499 | 281 (15.2%) | 112 (14.0%) |
| $800 to $1,499 | 291 (15.7%) | 289 (36.0%) |
| Total | 1,852 (100.0%) | 803 (100.0%) |
Health & Disability in Glacier County
Health Insurance Coverage by Age in Glacier County
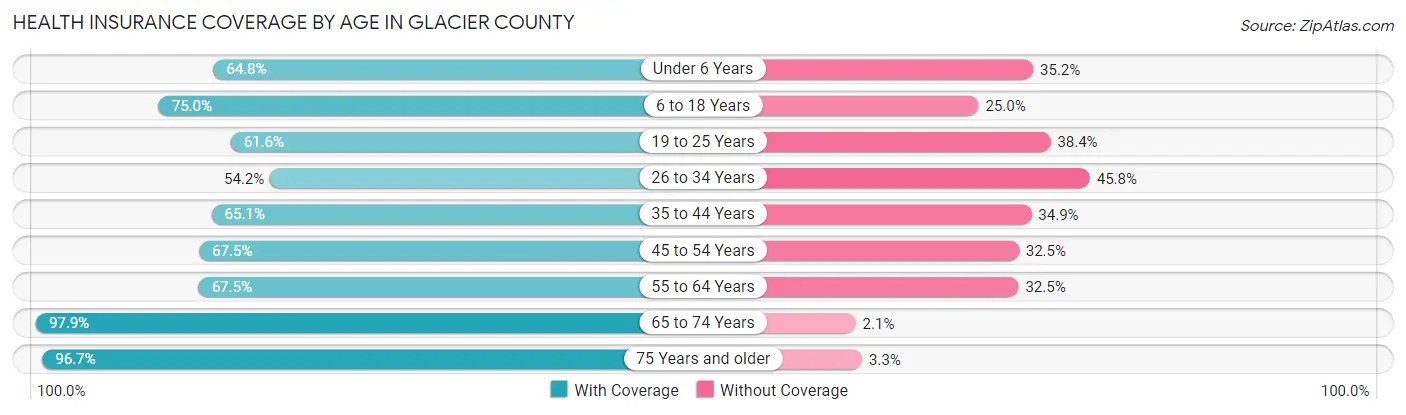
| Age Bracket | With Coverage | Without Coverage |
| Under 6 Years | 865 (64.8%) | 470 (35.2%) |
| 6 to 18 Years | 2,166 (75.0%) | 723 (25.0%) |
| 19 to 25 Years | 788 (61.6%) | 492 (38.4%) |
| 26 to 34 Years | 880 (54.2%) | 743 (45.8%) |
| 35 to 44 Years | 1,131 (65.1%) | 606 (34.9%) |
| 45 to 54 Years | 966 (67.5%) | 466 (32.5%) |
| 55 to 64 Years | 1,160 (67.5%) | 558 (32.5%) |
| 65 to 74 Years | 1,016 (97.9%) | 22 (2.1%) |
| 75 Years and older | 611 (96.7%) | 21 (3.3%) |
| Total | 9,583 (70.0%) | 4,101 (30.0%) |
Health Insurance Coverage by Citizenship Status in Glacier County
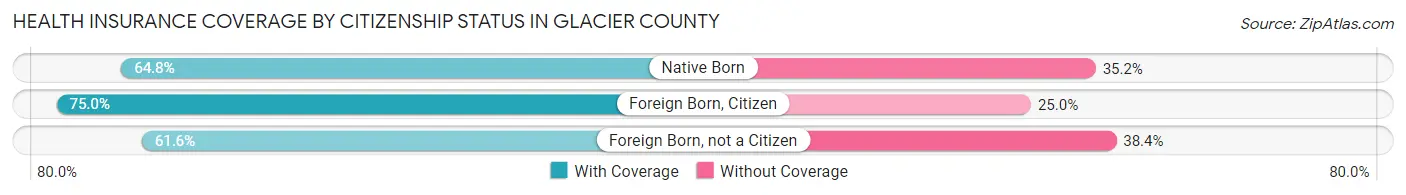
| Citizenship Status | With Coverage | Without Coverage |
| Native Born | 865 (64.8%) | 470 (35.2%) |
| Foreign Born, Citizen | 2,166 (75.0%) | 723 (25.0%) |
| Foreign Born, not a Citizen | 788 (61.6%) | 492 (38.4%) |
Health Insurance Coverage by Household Income in Glacier County
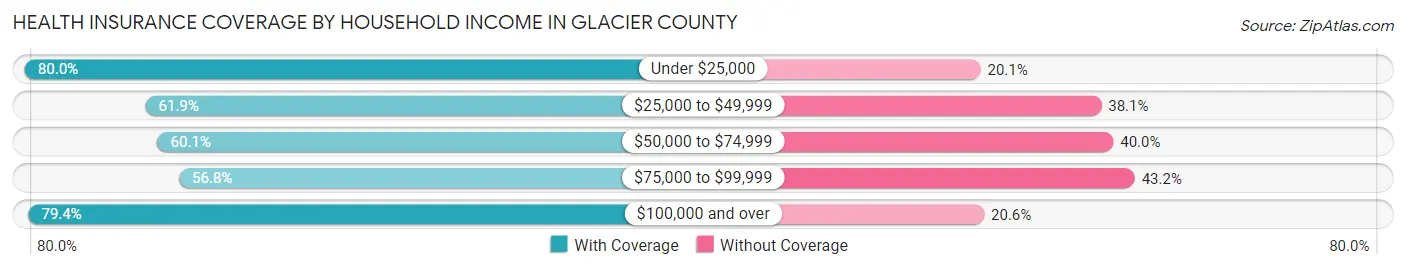
| Household Income | With Coverage | Without Coverage |
| Under $25,000 | 2,461 (79.9%) | 617 (20.1%) |
| $25,000 to $49,999 | 1,938 (61.9%) | 1,195 (38.1%) |
| $50,000 to $74,999 | 1,500 (60.1%) | 998 (40.0%) |
| $75,000 to $99,999 | 677 (56.8%) | 514 (43.2%) |
| $100,000 and over | 2,570 (79.4%) | 666 (20.6%) |
Public vs Private Health Insurance Coverage by Age in Glacier County
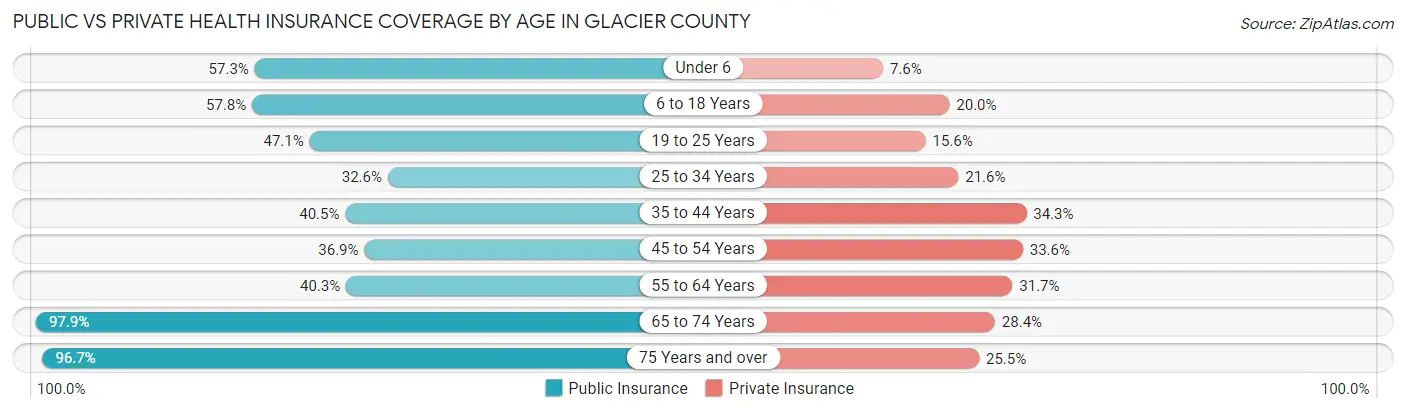
| Age Bracket | Public Insurance | Private Insurance |
| Under 6 | 765 (57.3%) | 102 (7.6%) |
| 6 to 18 Years | 1,669 (57.8%) | 577 (20.0%) |
| 19 to 25 Years | 603 (47.1%) | 199 (15.5%) |
| 25 to 34 Years | 529 (32.6%) | 351 (21.6%) |
| 35 to 44 Years | 703 (40.5%) | 595 (34.3%) |
| 45 to 54 Years | 529 (36.9%) | 481 (33.6%) |
| 55 to 64 Years | 693 (40.3%) | 544 (31.7%) |
| 65 to 74 Years | 1,016 (97.9%) | 295 (28.4%) |
| 75 Years and over | 611 (96.7%) | 161 (25.5%) |
| Total | 7,118 (52.0%) | 3,305 (24.1%) |
Disability Status by Sex by Age in Glacier County
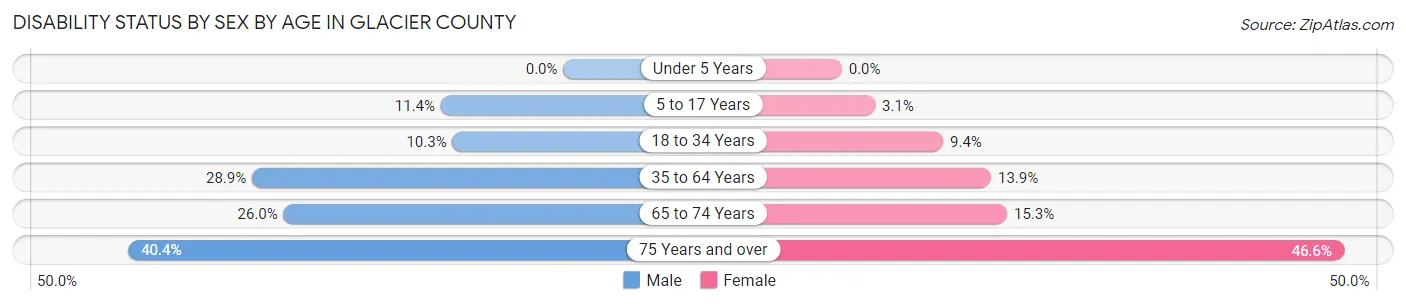
| Age Bracket | Male | Female |
| Under 5 Years | 0 (0.0%) | 0 (0.0%) |
| 5 to 17 Years | 168 (11.4%) | 46 (3.1%) |
| 18 to 34 Years | 154 (10.3%) | 147 (9.4%) |
| 35 to 64 Years | 705 (28.9%) | 339 (13.9%) |
| 65 to 74 Years | 129 (26.0%) | 83 (15.3%) |
| 75 Years and over | 107 (40.4%) | 171 (46.6%) |
Disability Class by Sex by Age in Glacier County
Disability Class: Hearing Difficulty
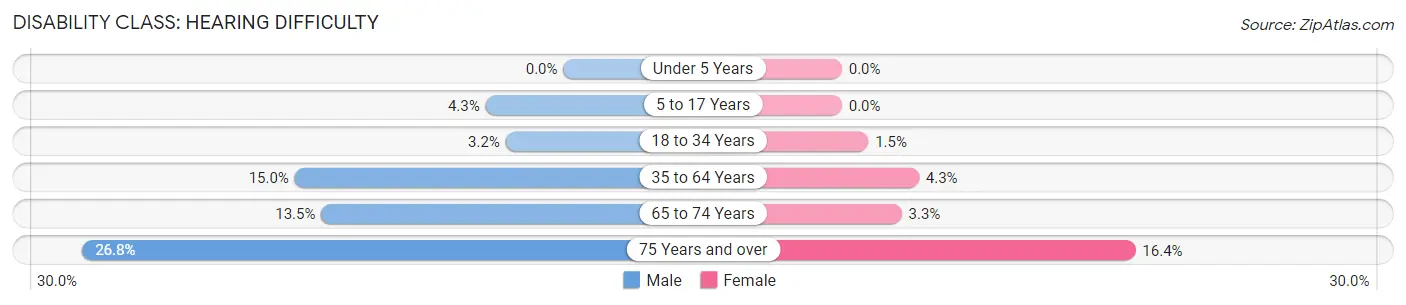
| Age Bracket | Male | Female |
| Under 5 Years | 0 (0.0%) | 0 (0.0%) |
| 5 to 17 Years | 64 (4.3%) | 0 (0.0%) |
| 18 to 34 Years | 48 (3.2%) | 23 (1.5%) |
| 35 to 64 Years | 365 (15.0%) | 105 (4.3%) |
| 65 to 74 Years | 67 (13.5%) | 18 (3.3%) |
| 75 Years and over | 71 (26.8%) | 60 (16.4%) |
Disability Class: Vision Difficulty
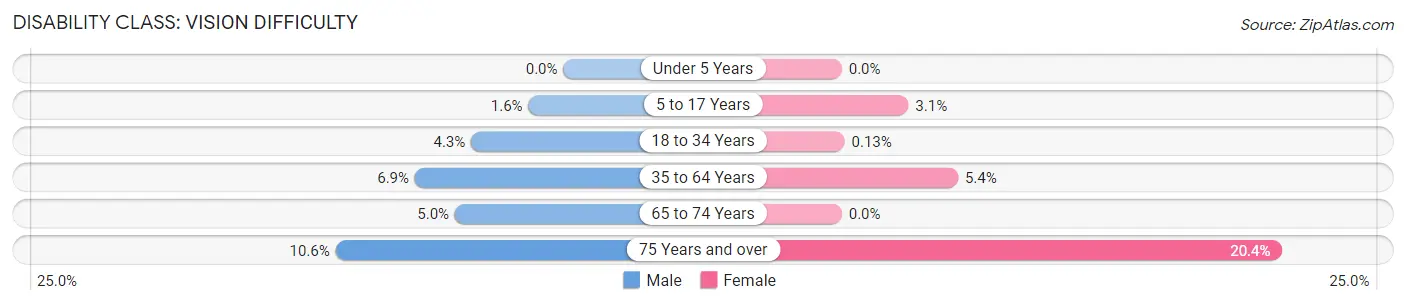
| Age Bracket | Male | Female |
| Under 5 Years | 0 (0.0%) | 0 (0.0%) |
| 5 to 17 Years | 24 (1.6%) | 46 (3.1%) |
| 18 to 34 Years | 64 (4.3%) | 2 (0.1%) |
| 35 to 64 Years | 168 (6.9%) | 132 (5.4%) |
| 65 to 74 Years | 25 (5.0%) | 0 (0.0%) |
| 75 Years and over | 28 (10.6%) | 75 (20.4%) |
Disability Class: Cognitive Difficulty
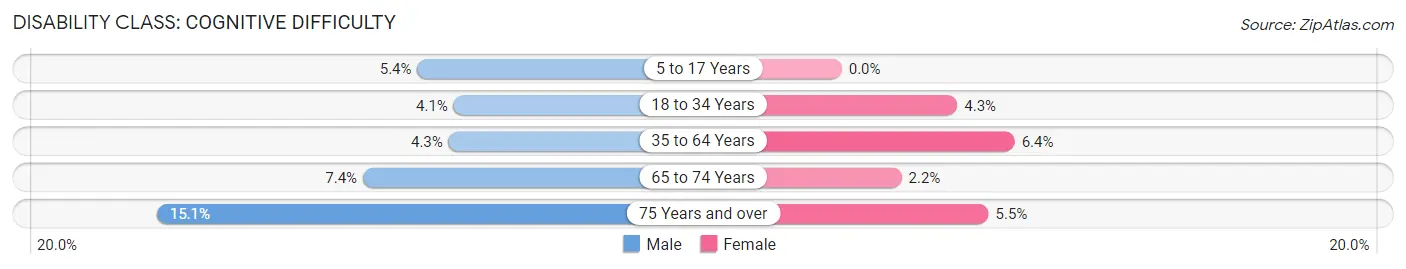
| Age Bracket | Male | Female |
| 5 to 17 Years | 80 (5.4%) | 0 (0.0%) |
| 18 to 34 Years | 61 (4.1%) | 67 (4.3%) |
| 35 to 64 Years | 104 (4.3%) | 157 (6.4%) |
| 65 to 74 Years | 37 (7.4%) | 12 (2.2%) |
| 75 Years and over | 40 (15.1%) | 20 (5.4%) |
Disability Class: Ambulatory Difficulty
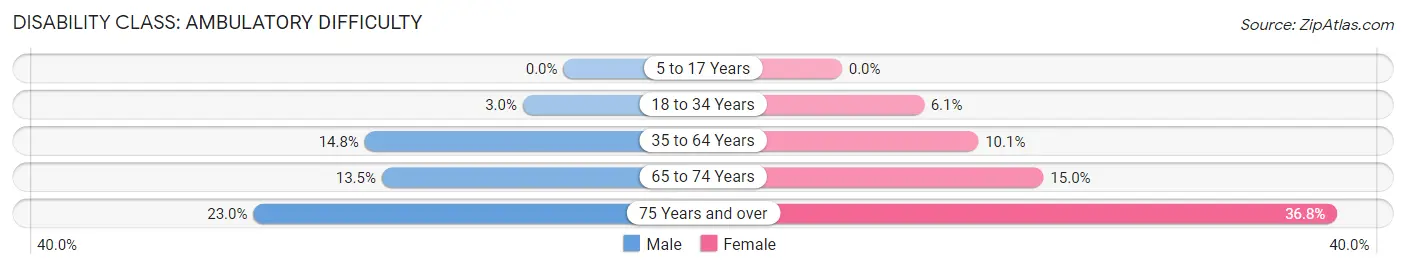
| Age Bracket | Male | Female |
| 5 to 17 Years | 0 (0.0%) | 0 (0.0%) |
| 18 to 34 Years | 45 (3.0%) | 95 (6.1%) |
| 35 to 64 Years | 360 (14.7%) | 248 (10.1%) |
| 65 to 74 Years | 67 (13.5%) | 81 (15.0%) |
| 75 Years and over | 61 (23.0%) | 135 (36.8%) |
Disability Class: Self-Care Difficulty
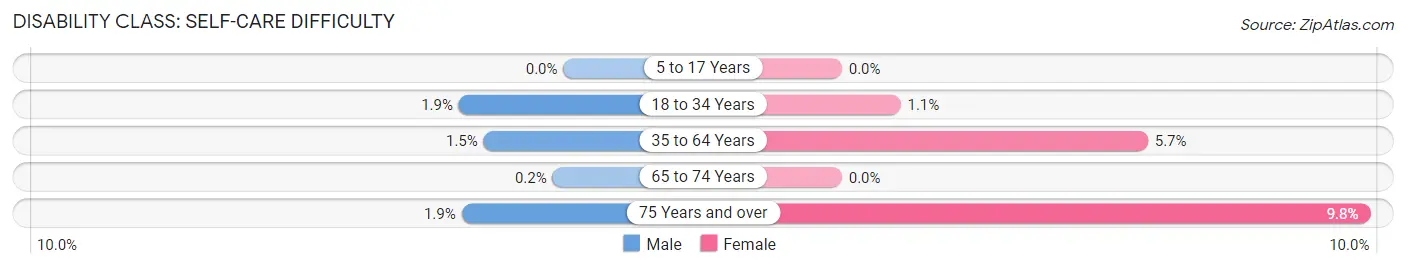
| Age Bracket | Male | Female |
| 5 to 17 Years | 0 (0.0%) | 0 (0.0%) |
| 18 to 34 Years | 29 (1.9%) | 17 (1.1%) |
| 35 to 64 Years | 36 (1.5%) | 139 (5.7%) |
| 65 to 74 Years | 1 (0.2%) | 0 (0.0%) |
| 75 Years and over | 5 (1.9%) | 36 (9.8%) |
Technology Access in Glacier County
Computing Device Access in Glacier County
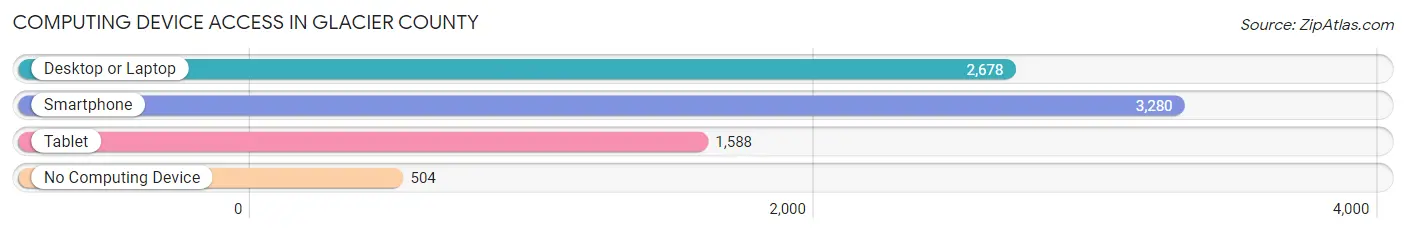
| Device Type | # Households | % Households |
| Desktop or Laptop | 2,678 | 64.1% |
| Smartphone | 3,280 | 78.6% |
| Tablet | 1,588 | 38.0% |
| No Computing Device | 504 | 12.1% |
| Total | 4,175 | 100.0% |
Internet Access in Glacier County
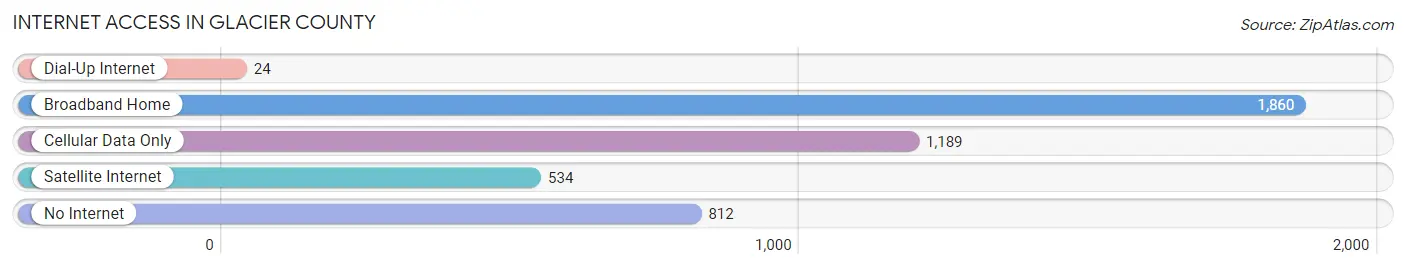
| Internet Type | # Households | % Households |
| Dial-Up Internet | 24 | 0.6% |
| Broadband Home | 1,860 | 44.6% |
| Cellular Data Only | 1,189 | 28.5% |
| Satellite Internet | 534 | 12.8% |
| No Internet | 812 | 19.5% |
| Total | 4,175 | 100.0% |
Glacier County Summary
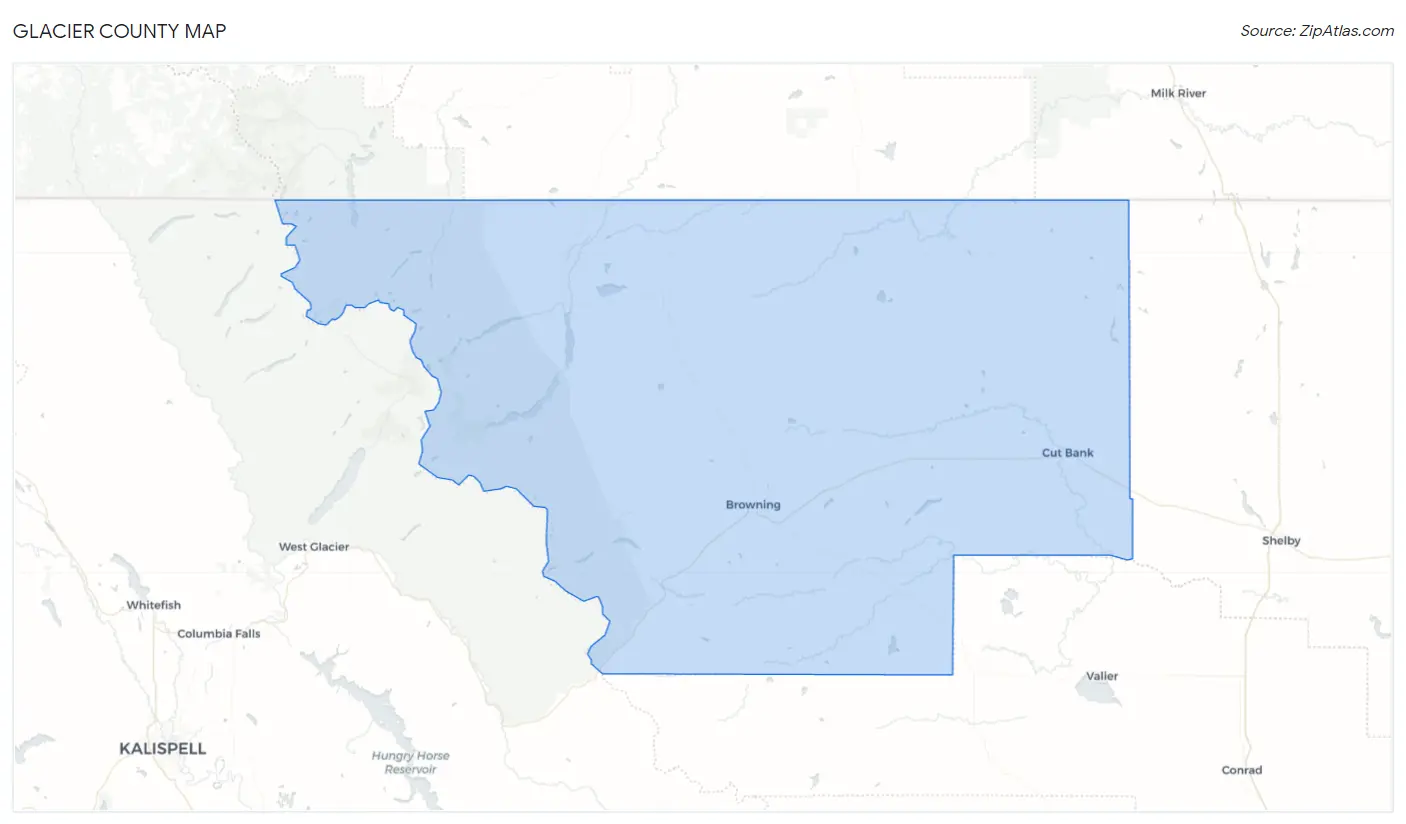
Glacier County is located in the U.S. state of Montana. It is bordered by the Canadian provinces of Alberta and British Columbia to the north, Flathead County to the west, and Toole County to the east. The county seat is Cut Bank, and the largest city is Browning. Glacier County covers an area of 4,741 square miles and has a population of 13,837 as of the 2010 census.
History
Glacier County was created in 1914 from parts of Teton and Chouteau counties. The county was named for the many glaciers in the area, including the Blackfeet Glacier, which is located in the southeastern part of the county.
The Blackfeet Nation has lived in the area for centuries, and the county was part of the Blackfeet Reservation until 1895. The reservation was reduced in size and the remaining land was opened up to homesteaders. The county was officially organized in 1914.
Geography
Glacier County is located in the Rocky Mountains of northwestern Montana. It is bordered by the Canadian provinces of Alberta and British Columbia to the north, Flathead County to the west, and Toole County to the east. The county covers an area of 4,741 square miles and has a population of 13,837 as of the 2010 census.
The landscape of Glacier County is dominated by the Rocky Mountains, with the Lewis and Clark Range to the west and the Rocky Mountain Front to the east. The county is home to several mountain ranges, including the Bear Paw Mountains, the Sweet Grass Hills, and the Little Rockies. The county also contains several rivers, including the Marias River, the Two Medicine River, and the Cut Bank Creek.
Economy
The economy of Glacier County is largely based on agriculture and tourism. The county is home to several large ranches, and the agricultural sector is the largest employer in the county. Cattle ranching is the primary agricultural activity, and the county is also home to several large wheat farms.
Tourism is also an important part of the economy, with Glacier National Park being the main attraction. The park is home to several glaciers, lakes, and mountains, and is a popular destination for hikers, campers, and other outdoor enthusiasts.
Demographics
As of the 2010 census, there were 13,837 people, 4,845 households, and 3,541 families living in Glacier County. The population density was 2.9 people per square mile. The racial makeup of the county was 75.3% White, 0.3% African American, 19.2% Native American, 0.2% Asian, 0.1% Pacific Islander, 0.7% from other races, and 4.2% from two or more races. Hispanic or Latino of any race were 2.7% of the population.
The median income for a household in the county was $35,938, and the median income for a family was $41,944. The per capita income for the county was $17,845. About 17.2% of families and 22.2% of the population were below the poverty line, including 28.3% of those under age 18 and 11.2% of those age 65 or over.
Common Questions
What is Per Capita Income in Glacier County?
Per Capita income in Glacier County is $21,438.
What is the Median Family Income in Glacier County?
Median Family Income in Glacier County is $51,601.
What is the Median Household income in Glacier County?
Median Household Income in Glacier County is $41,078.
What is Income or Wage Gap in Glacier County?
Income or Wage Gap in Glacier County is 2.2%.
Women in Glacier County earn 97.8 cents for every dollar earned by a man.
What is Family Income Deficit in Glacier County?
Family Income Deficit in Glacier County is $12,332.
Families that are below poverty line in Glacier County earn $12,332 less on average than the poverty threshold level.
What is Inequality or Gini Index in Glacier County?
Inequality or Gini Index in Glacier County is 0.48.
What is the Total Population of Glacier County?
Total Population of Glacier County is 13,781.
What is the Total Male Population of Glacier County?
Total Male Population of Glacier County is 6,820.
What is the Total Female Population of Glacier County?
Total Female Population of Glacier County is 6,961.
What is the Ratio of Males per 100 Females in Glacier County?
There are 97.97 Males per 100 Females in Glacier County.
What is the Ratio of Females per 100 Males in Glacier County?
There are 102.07 Females per 100 Males in Glacier County.
What is the Median Population Age in Glacier County?
Median Population Age in Glacier County is 34.2 Years.
What is the Average Family Size in Glacier County
Average Family Size in Glacier County is 3.8 People.
What is the Average Household Size in Glacier County
Average Household Size in Glacier County is 3.1 People.
How Large is the Labor Force in Glacier County?
There are 5,356 People in the Labor Forcein in Glacier County.
What is the Percentage of People in the Labor Force in Glacier County?
53.3% of People are in the Labor Force in Glacier County.
What is the Unemployment Rate in Glacier County?
Unemployment Rate in Glacier County is 7.9%.