Beaverhead County, MT Map & Demographics
Beaverhead County Overview
$34,640
PER CAPITA INCOME
$74,615
AVG FAMILY INCOME
$55,867
AVG HOUSEHOLD INCOME
18.0%
WAGE / INCOME GAP [ % ]
82.0¢/ $1
WAGE / INCOME GAP [ $ ]
$5,285
FAMILY INCOME DEFICIT
0.47
INEQUALITY / GINI INDEX
9,469
TOTAL POPULATION
4,829
MALE POPULATION
4,640
FEMALE POPULATION
104.07
MALES / 100 FEMALES
96.09
FEMALES / 100 MALES
42.3
MEDIAN AGE
2.9
AVG FAMILY SIZE
2.2
AVG HOUSEHOLD SIZE
4,732
LABOR FORCE [ PEOPLE ]
58.2%
PERCENT IN LABOR FORCE
2.8%
UNEMPLOYMENT RATE
Beaverhead County Area Codes
Income in Beaverhead County
Income Overview in Beaverhead County
Per Capita Income in Beaverhead County is $34,640, while median incomes of families and households are $74,615 and $55,867 respectively.
| Characteristic | Number | Measure |
| Per Capita Income | 9,469 | $34,640 |
| Median Family Income | 2,308 | $74,615 |
| Mean Family Income | 2,308 | $97,612 |
| Median Household Income | 4,107 | $55,867 |
| Mean Household Income | 4,107 | $76,551 |
| Income Deficit | 2,308 | $5,285 |
| Wage / Income Gap (%) | 9,469 | 17.99% |
| Wage / Income Gap ($) | 9,469 | 82.01¢ per $1 |
| Gini / Inequality Index | 9,469 | 0.47 |
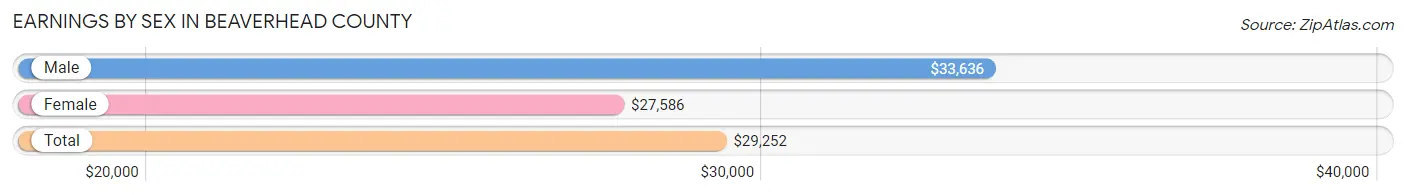
Earnings by Sex in Beaverhead County
Average Earnings in Beaverhead County are $29,252, $33,636 for men and $27,586 for women, a difference of 18.0%.
| Sex | Number | Average Earnings |
| Male | 3,008 (53.6%) | $33,636 |
| Female | 2,605 (46.4%) | $27,586 |
| Total | 5,613 (100.0%) | $29,252 |
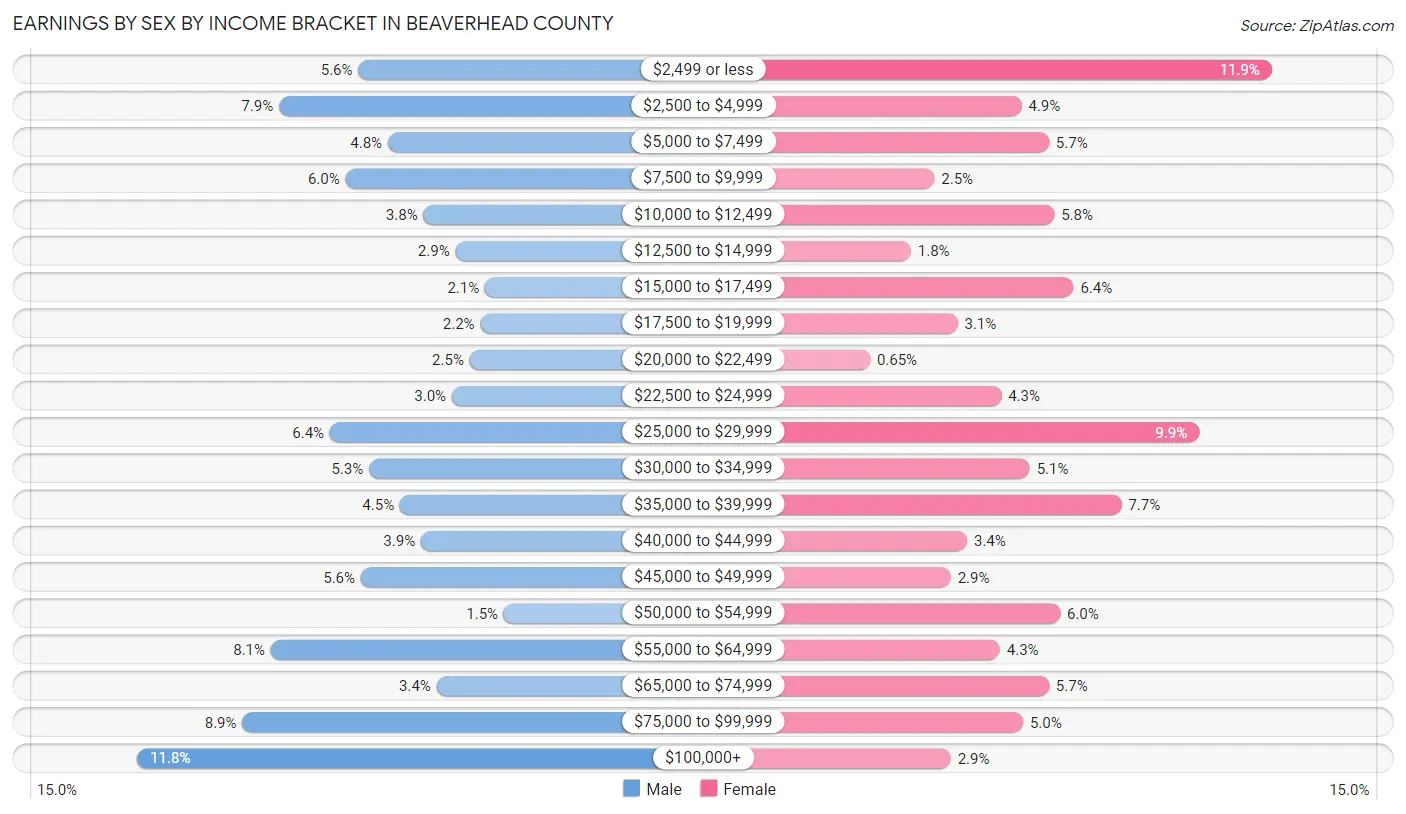
Earnings by Sex by Income Bracket in Beaverhead County
The most common earnings brackets in Beaverhead County are $100,000+ for men (356 | 11.8%) and $2,499 or less for women (311 | 11.9%).
| Income | Male | Female |
| $2,499 or less | 169 (5.6%) | 311 (11.9%) |
| $2,500 to $4,999 | 236 (7.9%) | 128 (4.9%) |
| $5,000 to $7,499 | 144 (4.8%) | 148 (5.7%) |
| $7,500 to $9,999 | 180 (6.0%) | 64 (2.5%) |
| $10,000 to $12,499 | 114 (3.8%) | 152 (5.8%) |
| $12,500 to $14,999 | 87 (2.9%) | 47 (1.8%) |
| $15,000 to $17,499 | 62 (2.1%) | 166 (6.4%) |
| $17,500 to $19,999 | 66 (2.2%) | 81 (3.1%) |
| $20,000 to $22,499 | 75 (2.5%) | 17 (0.6%) |
| $22,500 to $24,999 | 90 (3.0%) | 113 (4.3%) |
| $25,000 to $29,999 | 193 (6.4%) | 258 (9.9%) |
| $30,000 to $34,999 | 160 (5.3%) | 134 (5.1%) |
| $35,000 to $39,999 | 134 (4.4%) | 201 (7.7%) |
| $40,000 to $44,999 | 116 (3.9%) | 88 (3.4%) |
| $45,000 to $49,999 | 167 (5.6%) | 76 (2.9%) |
| $50,000 to $54,999 | 46 (1.5%) | 156 (6.0%) |
| $55,000 to $64,999 | 243 (8.1%) | 112 (4.3%) |
| $65,000 to $74,999 | 103 (3.4%) | 148 (5.7%) |
| $75,000 to $99,999 | 267 (8.9%) | 129 (5.0%) |
| $100,000+ | 356 (11.8%) | 76 (2.9%) |
| Total | 3,008 (100.0%) | 2,605 (100.0%) |
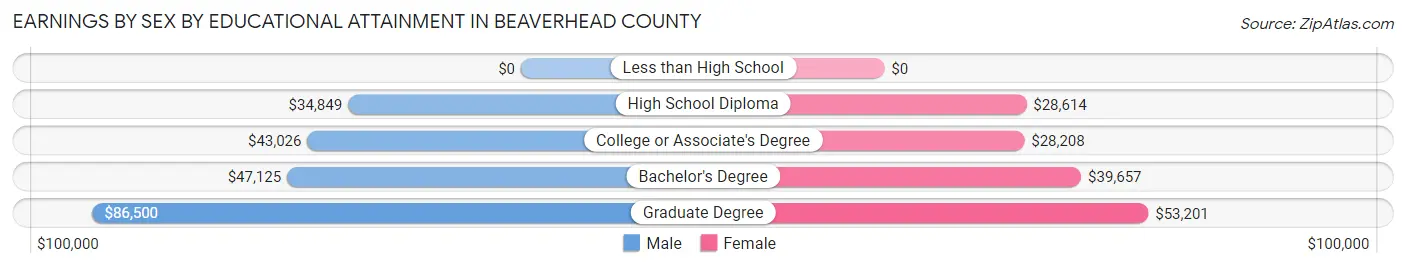
Earnings by Sex by Educational Attainment in Beaverhead County
Average earnings in Beaverhead County are $42,153 for men and $33,299 for women, a difference of 21.0%. Men with an educational attainment of graduate degree enjoy the highest average annual earnings of $86,500, while those with high school diploma education earn the least with $34,849. Women with an educational attainment of graduate degree earn the most with the average annual earnings of $53,201, while those with college or associate's degree education have the smallest earnings of $28,208.
| Educational Attainment | Male Income | Female Income |
| Less than High School | - | - |
| High School Diploma | $34,849 | $28,614 |
| College or Associate's Degree | $43,026 | $28,208 |
| Bachelor's Degree | $47,125 | $39,657 |
| Graduate Degree | $86,500 | $53,201 |
| Total | $42,153 | $33,299 |
Family Income in Beaverhead County
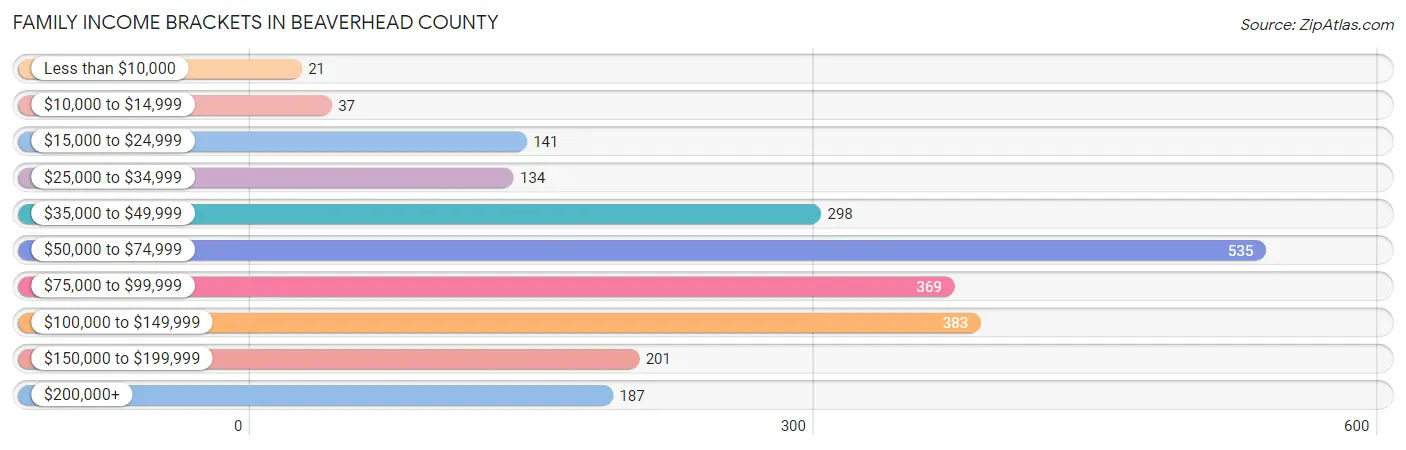
Family Income Brackets in Beaverhead County
According to the Beaverhead County family income data, there are 535 families falling into the $50,000 to $74,999 income range, which is the most common income bracket and makes up 23.2% of all families. Conversely, the less than $10,000 income bracket is the least frequent group with only 21 families (0.9%) belonging to this category.
| Income Bracket | # Families | % Families |
| Less than $10,000 | 21 | 0.9% |
| $10,000 to $14,999 | 37 | 1.6% |
| $15,000 to $24,999 | 141 | 6.1% |
| $25,000 to $34,999 | 134 | 5.8% |
| $35,000 to $49,999 | 298 | 12.9% |
| $50,000 to $74,999 | 535 | 23.2% |
| $75,000 to $99,999 | 369 | 16.0% |
| $100,000 to $149,999 | 383 | 16.6% |
| $150,000 to $199,999 | 201 | 8.7% |
| $200,000+ | 187 | 8.1% |
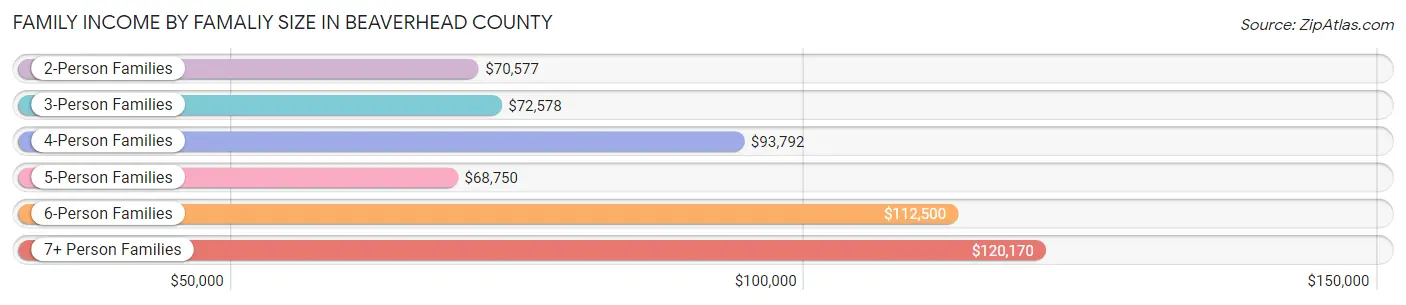
Family Income by Famaliy Size in Beaverhead County
7+ person families (61 | 2.6%) account for the highest median family income in Beaverhead County with $120,170 per family, while 2-person families (1,326 | 57.5%) have the highest median income of $35,288 per family member.
| Income Bracket | # Families | Median Income |
| 2-Person Families | 1,326 (57.5%) | $70,577 |
| 3-Person Families | 339 (14.7%) | $72,578 |
| 4-Person Families | 409 (17.7%) | $93,792 |
| 5-Person Families | 169 (7.3%) | $68,750 |
| 6-Person Families | 4 (0.2%) | $112,500 |
| 7+ Person Families | 61 (2.6%) | $120,170 |
| Total | 2,308 (100.0%) | $74,615 |
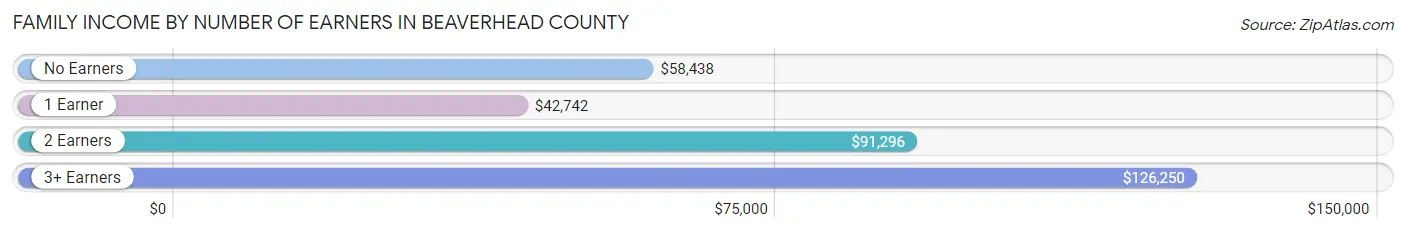
Family Income by Number of Earners in Beaverhead County
The median family income in Beaverhead County is $74,615, with families comprising 3+ earners (108) having the highest median family income of $126,250, while families with 1 earner (480) have the lowest median family income of $42,742, accounting for 4.7% and 20.8% of families, respectively.
| Number of Earners | # Families | Median Income |
| No Earners | 387 (16.8%) | $58,438 |
| 1 Earner | 480 (20.8%) | $42,742 |
| 2 Earners | 1,333 (57.8%) | $91,296 |
| 3+ Earners | 108 (4.7%) | $126,250 |
| Total | 2,308 (100.0%) | $74,615 |
Household Income in Beaverhead County
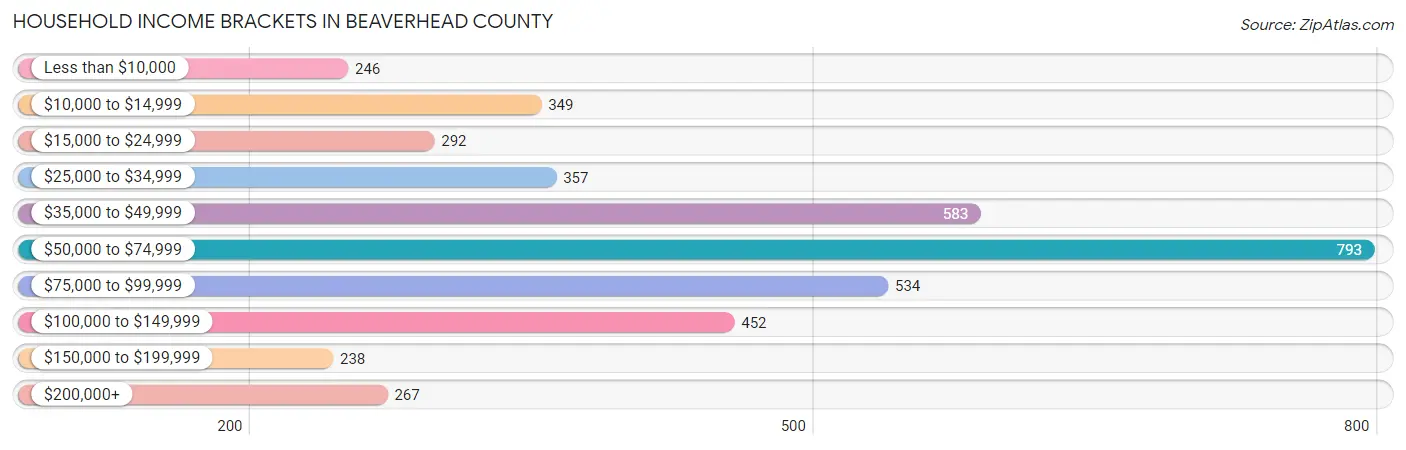
Household Income Brackets in Beaverhead County
With 793 households falling in the category, the $50,000 to $74,999 income range is the most frequent in Beaverhead County, accounting for 19.3% of all households. In contrast, only 238 households (5.8%) fall into the $150,000 to $199,999 income bracket, making it the least populous group.
| Income Bracket | # Households | % Households |
| Less than $10,000 | 246 | 6.0% |
| $10,000 to $14,999 | 349 | 8.5% |
| $15,000 to $24,999 | 292 | 7.1% |
| $25,000 to $34,999 | 357 | 8.7% |
| $35,000 to $49,999 | 583 | 14.2% |
| $50,000 to $74,999 | 793 | 19.3% |
| $75,000 to $99,999 | 534 | 13.0% |
| $100,000 to $149,999 | 452 | 11.0% |
| $150,000 to $199,999 | 238 | 5.8% |
| $200,000+ | 267 | 6.5% |
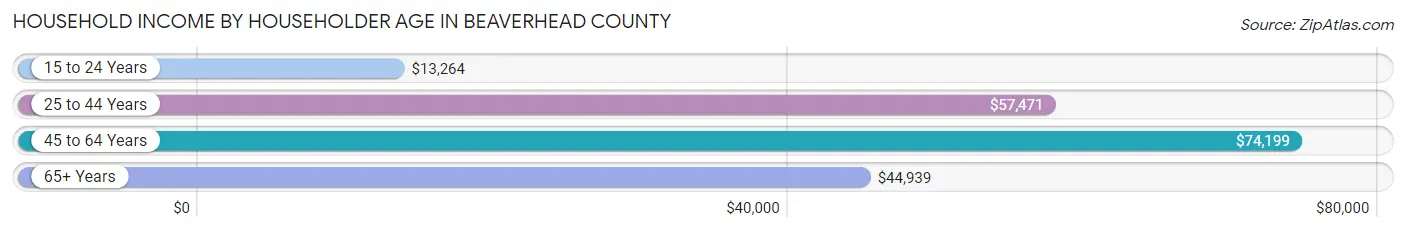
Household Income by Householder Age in Beaverhead County
The median household income in Beaverhead County is $55,867, with the highest median household income of $74,199 found in the 45 to 64 years age bracket for the primary householder. A total of 1,207 households (29.4%) fall into this category. Meanwhile, the 15 to 24 years age bracket for the primary householder has the lowest median household income of $13,264, with 386 households (9.4%) in this group.
| Income Bracket | # Households | Median Income |
| 15 to 24 Years | 386 (9.4%) | $13,264 |
| 25 to 44 Years | 1,188 (28.9%) | $57,471 |
| 45 to 64 Years | 1,207 (29.4%) | $74,199 |
| 65+ Years | 1,326 (32.3%) | $44,939 |
| Total | 4,107 (100.0%) | $55,867 |
Poverty in Beaverhead County
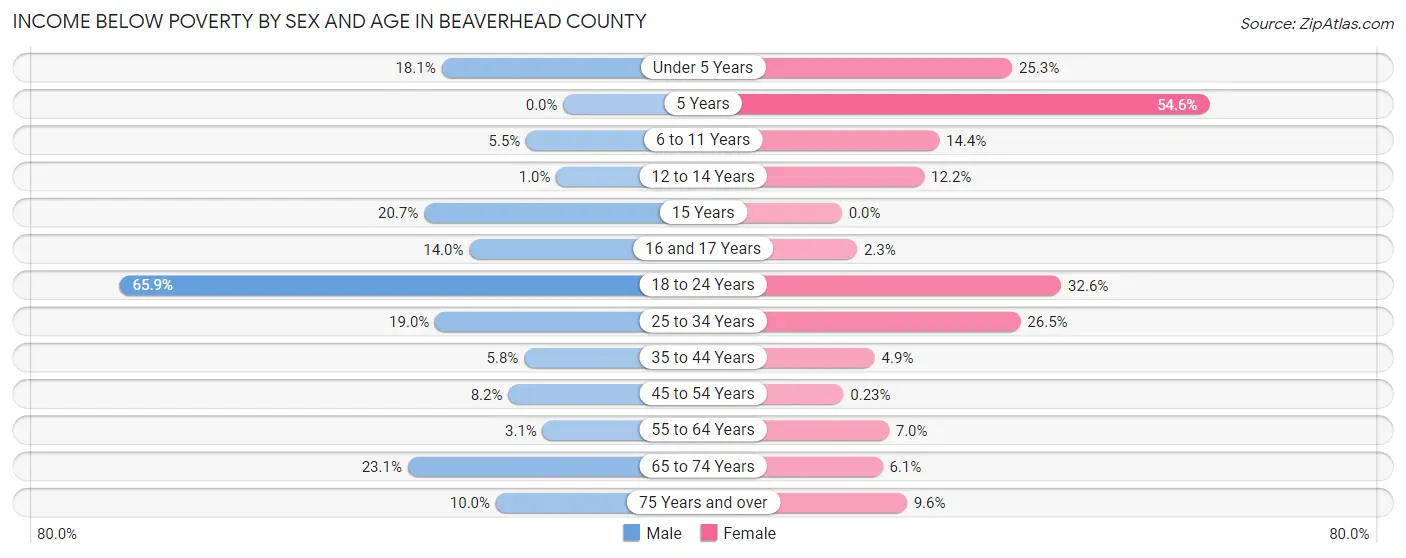
Income Below Poverty by Sex and Age in Beaverhead County
With 18.0% poverty level for males and 12.7% for females among the residents of Beaverhead County, 18 to 24 year old males and 5 year old females are the most vulnerable to poverty, with 363 males (65.9%) and 12 females (54.5%) in their respective age groups living below the poverty level.
| Age Bracket | Male | Female |
| Under 5 Years | 42 (18.1%) | 47 (25.3%) |
| 5 Years | 0 (0.0%) | 12 (54.5%) |
| 6 to 11 Years | 16 (5.5%) | 40 (14.4%) |
| 12 to 14 Years | 1 (1.0%) | 17 (12.2%) |
| 15 Years | 6 (20.7%) | 0 (0.0%) |
| 16 and 17 Years | 19 (14.0%) | 2 (2.2%) |
| 18 to 24 Years | 363 (65.9%) | 156 (32.6%) |
| 25 to 34 Years | 99 (19.0%) | 135 (26.5%) |
| 35 to 44 Years | 31 (5.8%) | 25 (4.9%) |
| 45 to 54 Years | 39 (8.2%) | 1 (0.2%) |
| 55 to 64 Years | 20 (3.1%) | 47 (7.0%) |
| 65 to 74 Years | 147 (23.1%) | 39 (6.0%) |
| 75 Years and over | 43 (10.0%) | 40 (9.6%) |
| Total | 826 (18.0%) | 561 (12.7%) |
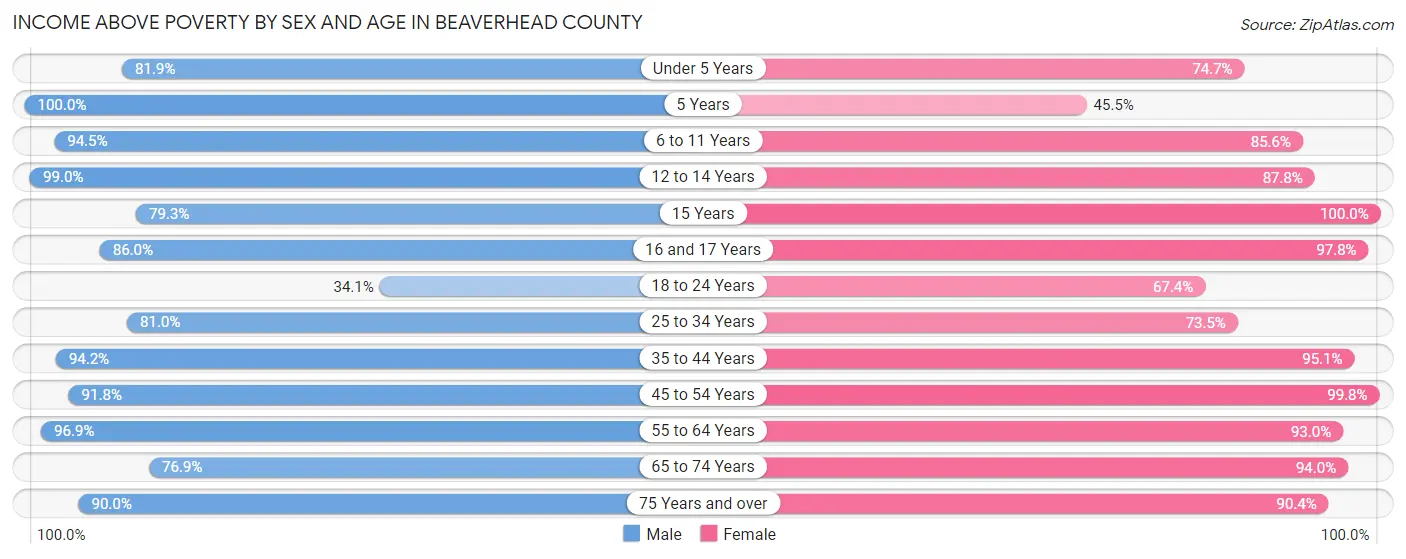
Income Above Poverty by Sex and Age in Beaverhead County
According to the poverty statistics in Beaverhead County, males aged 5 years and females aged 15 years are the age groups that are most secure financially, with 100.0% of males and 100.0% of females in these age groups living above the poverty line.
| Age Bracket | Male | Female |
| Under 5 Years | 190 (81.9%) | 139 (74.7%) |
| 5 Years | 16 (100.0%) | 10 (45.5%) |
| 6 to 11 Years | 274 (94.5%) | 237 (85.6%) |
| 12 to 14 Years | 95 (99.0%) | 122 (87.8%) |
| 15 Years | 23 (79.3%) | 25 (100.0%) |
| 16 and 17 Years | 117 (86.0%) | 87 (97.8%) |
| 18 to 24 Years | 188 (34.1%) | 323 (67.4%) |
| 25 to 34 Years | 421 (81.0%) | 374 (73.5%) |
| 35 to 44 Years | 502 (94.2%) | 487 (95.1%) |
| 45 to 54 Years | 438 (91.8%) | 439 (99.8%) |
| 55 to 64 Years | 631 (96.9%) | 626 (93.0%) |
| 65 to 74 Years | 489 (76.9%) | 606 (94.0%) |
| 75 Years and over | 386 (90.0%) | 375 (90.4%) |
| Total | 3,770 (82.0%) | 3,850 (87.3%) |
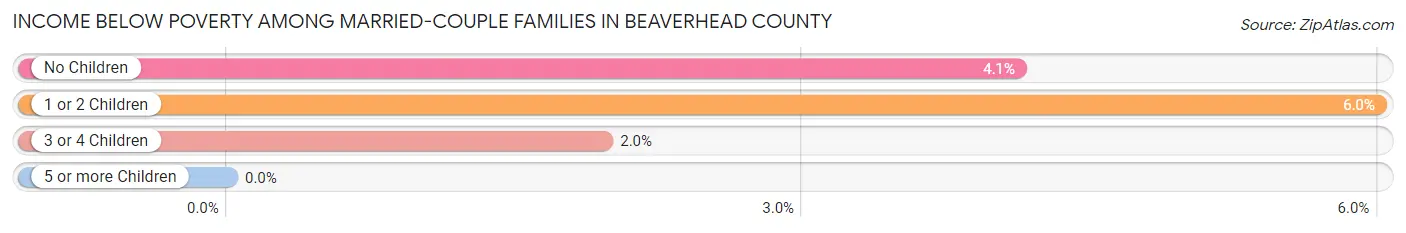
Income Below Poverty Among Married-Couple Families in Beaverhead County
The poverty statistics for married-couple families in Beaverhead County show that 4.5% or 93 of the total 2,059 families live below the poverty line. Families with 1 or 2 children have the highest poverty rate of 6.0%, comprising of 40 families. On the other hand, families with 5 or more children have the lowest poverty rate of 0.0%, which includes 0 families.
| Children | Above Poverty | Below Poverty |
| No Children | 1,187 (95.9%) | 51 (4.1%) |
| 1 or 2 Children | 627 (94.0%) | 40 (6.0%) |
| 3 or 4 Children | 100 (98.0%) | 2 (2.0%) |
| 5 or more Children | 52 (100.0%) | 0 (0.0%) |
| Total | 1,966 (95.5%) | 93 (4.5%) |
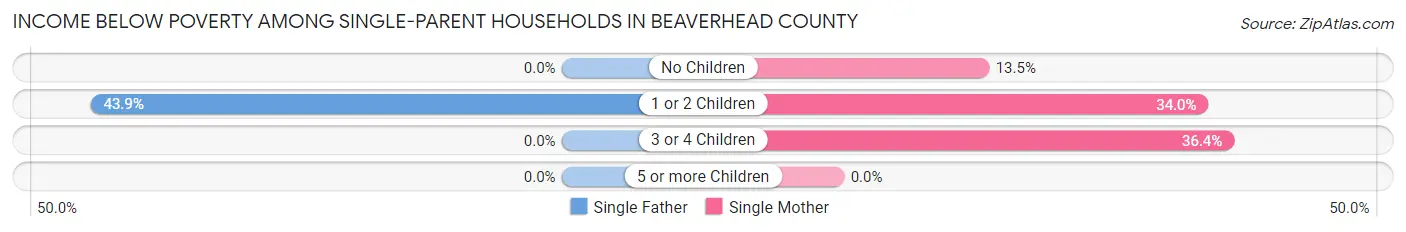
Income Below Poverty Among Single-Parent Households in Beaverhead County
According to the poverty data in Beaverhead County, 30.5% or 25 single-father households and 30.5% or 51 single-mother households are living below the poverty line. Among single-father households, those with 1 or 2 children have the highest poverty rate, with 25 households (43.9%) experiencing poverty. Likewise, among single-mother households, those with 3 or 4 children have the highest poverty rate, with 28 households (36.4%) falling below the poverty line.
| Children | Single Father | Single Mother |
| No Children | 0 (0.0%) | 5 (13.5%) |
| 1 or 2 Children | 25 (43.9%) | 18 (34.0%) |
| 3 or 4 Children | 0 (0.0%) | 28 (36.4%) |
| 5 or more Children | 0 (0.0%) | 0 (0.0%) |
| Total | 25 (30.5%) | 51 (30.5%) |
Income Below Poverty Among Married-Couple vs Single-Parent Households in Beaverhead County
The poverty data for Beaverhead County shows that 93 of the married-couple family households (4.5%) and 76 of the single-parent households (30.5%) are living below the poverty level. Within the married-couple family households, those with 1 or 2 children have the highest poverty rate, with 40 households (6.0%) falling below the poverty line. Among the single-parent households, those with 1 or 2 children have the highest poverty rate, with 43 household (39.1%) living below poverty.
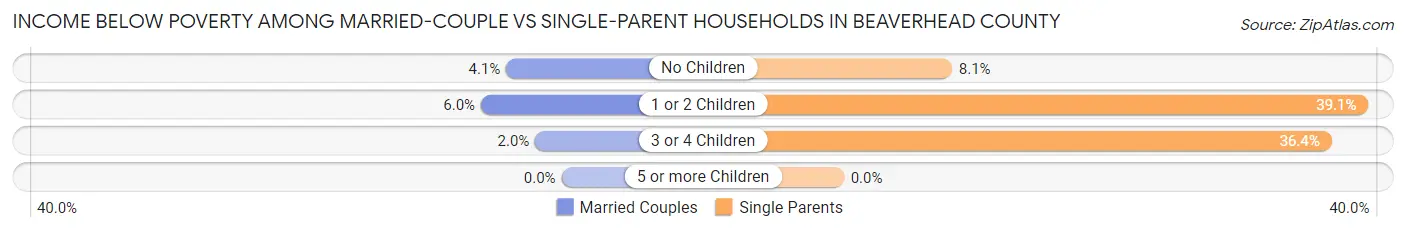
| Children | Married-Couple Families | Single-Parent Households |
| No Children | 51 (4.1%) | 5 (8.1%) |
| 1 or 2 Children | 40 (6.0%) | 43 (39.1%) |
| 3 or 4 Children | 2 (2.0%) | 28 (36.4%) |
| 5 or more Children | 0 (0.0%) | 0 (0.0%) |
| Total | 93 (4.5%) | 76 (30.5%) |
Race in Beaverhead County
The most populous races in Beaverhead County are White / Caucasian (8,759 | 92.5%), Hispanic or Latino (525 | 5.5%), and Two or more Races (364 | 3.8%).
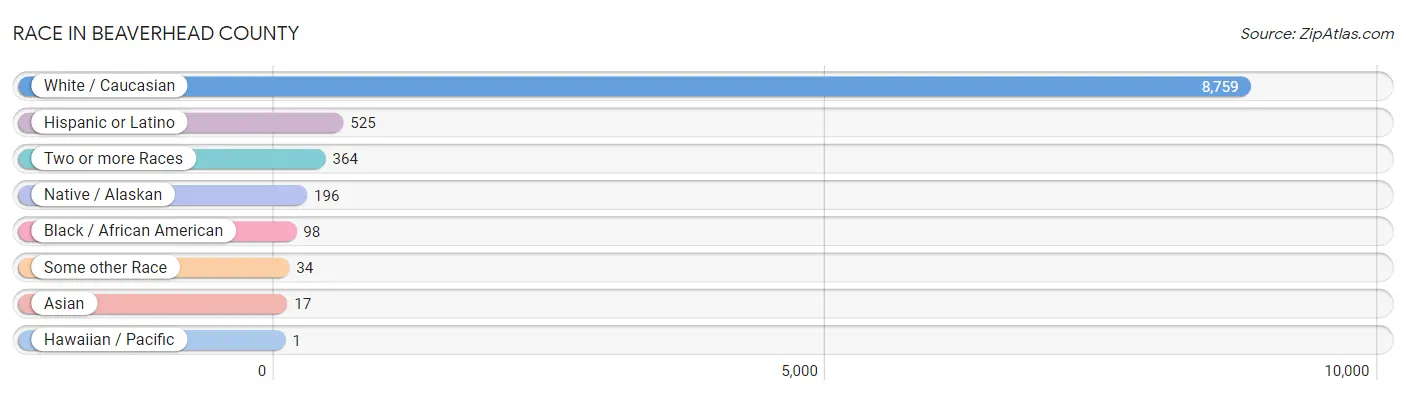
| Race | # Population | % Population |
| Asian | 17 | 0.2% |
| Black / African American | 98 | 1.0% |
| Hawaiian / Pacific | 1 | 0.0% |
| Hispanic or Latino | 525 | 5.5% |
| Native / Alaskan | 196 | 2.1% |
| White / Caucasian | 8,759 | 92.5% |
| Two or more Races | 364 | 3.8% |
| Some other Race | 34 | 0.4% |
| Total | 9,469 | 100.0% |
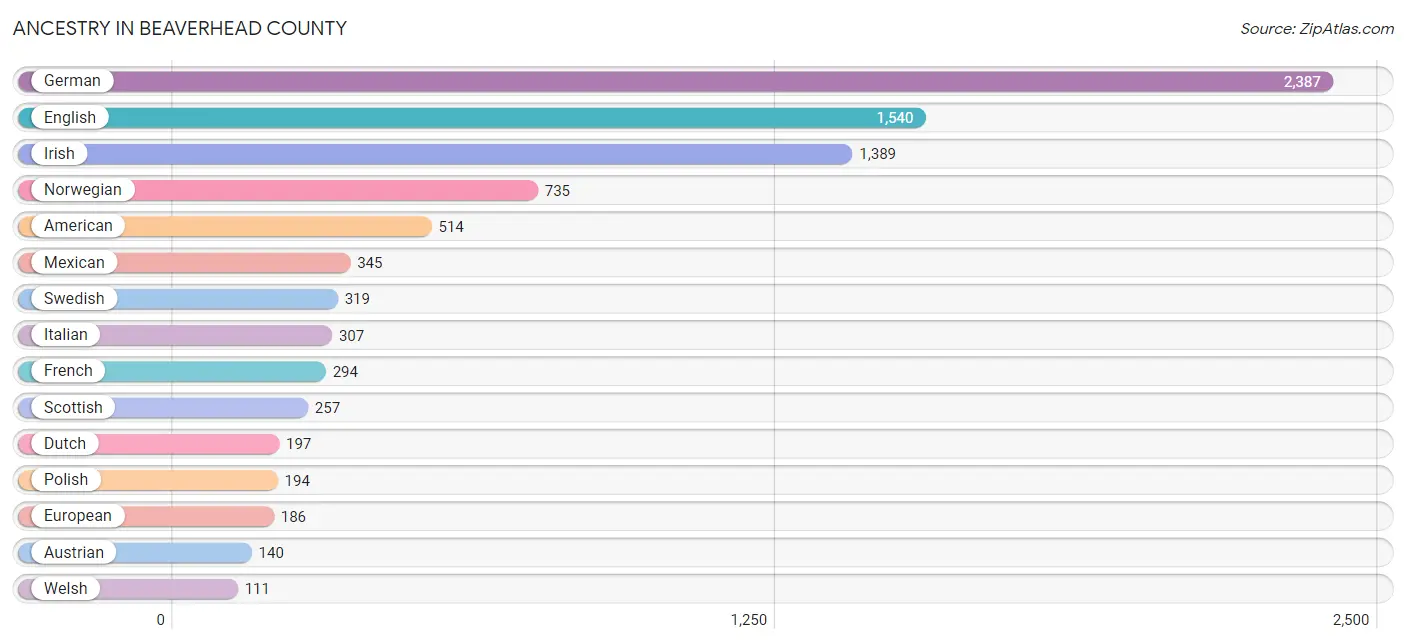
Ancestry in Beaverhead County
The most populous ancestries reported in Beaverhead County are German (2,387 | 25.2%), English (1,540 | 16.3%), Irish (1,389 | 14.7%), Norwegian (735 | 7.8%), and American (514 | 5.4%), together accounting for 69.3% of all Beaverhead County residents.
| Ancestry | # Population | % Population |
| Aleut | 45 | 0.5% |
| American | 514 | 5.4% |
| Arab | 13 | 0.1% |
| Australian | 5 | 0.1% |
| Austrian | 140 | 1.5% |
| Basque | 103 | 1.1% |
| Bhutanese | 16 | 0.2% |
| Blackfeet | 12 | 0.1% |
| British | 39 | 0.4% |
| Canadian | 9 | 0.1% |
| Cheyenne | 1 | 0.0% |
| Chippewa | 44 | 0.5% |
| Croatian | 26 | 0.3% |
| Crow | 4 | 0.0% |
| Cuban | 37 | 0.4% |
| Czech | 22 | 0.2% |
| Czechoslovakian | 25 | 0.3% |
| Danish | 99 | 1.1% |
| Dutch | 197 | 2.1% |
| Eastern European | 88 | 0.9% |
| English | 1,540 | 16.3% |
| European | 186 | 2.0% |
| Finnish | 76 | 0.8% |
| French | 294 | 3.1% |
| French Canadian | 28 | 0.3% |
| German | 2,387 | 25.2% |
| Greek | 5 | 0.1% |
| Hungarian | 19 | 0.2% |
| Icelander | 10 | 0.1% |
| Indian (Asian) | 6 | 0.1% |
| Iranian | 2 | 0.0% |
| Irish | 1,389 | 14.7% |
| Iroquois | 14 | 0.2% |
| Italian | 307 | 3.2% |
| Korean | 66 | 0.7% |
| Lebanese | 13 | 0.1% |
| Mexican | 345 | 3.6% |
| Northern European | 29 | 0.3% |
| Norwegian | 735 | 7.8% |
| Pennsylvania German | 5 | 0.1% |
| Peruvian | 4 | 0.0% |
| Polish | 194 | 2.1% |
| Portuguese | 27 | 0.3% |
| Romanian | 2 | 0.0% |
| Russian | 17 | 0.2% |
| Samoan | 1 | 0.0% |
| Scandinavian | 65 | 0.7% |
| Scotch-Irish | 45 | 0.5% |
| Scottish | 257 | 2.7% |
| Serbian | 4 | 0.0% |
| Sioux | 2 | 0.0% |
| South American | 4 | 0.0% |
| Spaniard | 98 | 1.0% |
| Spanish | 41 | 0.4% |
| Swedish | 319 | 3.4% |
| Swiss | 69 | 0.7% |
| Tlingit-Haida | 8 | 0.1% |
| Ukrainian | 22 | 0.2% |
| Welsh | 111 | 1.2% |
| Yugoslavian | 34 | 0.4% | View All 60 Rows |
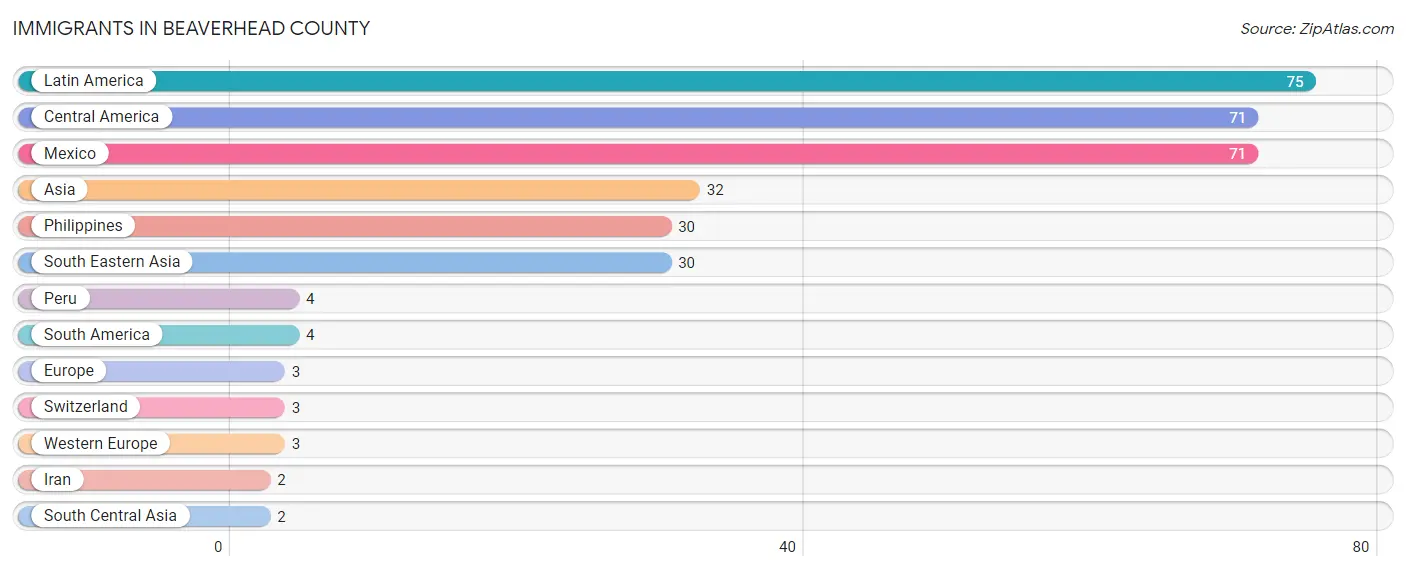
Immigrants in Beaverhead County
The most numerous immigrant groups reported in Beaverhead County came from Latin America (75 | 0.8%), Central America (71 | 0.7%), Mexico (71 | 0.7%), Asia (32 | 0.3%), and Philippines (30 | 0.3%), together accounting for 3.0% of all Beaverhead County residents.
| Immigration Origin | # Population | % Population |
| Asia | 32 | 0.3% |
| Central America | 71 | 0.7% |
| Europe | 3 | 0.0% |
| Iran | 2 | 0.0% |
| Latin America | 75 | 0.8% |
| Mexico | 71 | 0.7% |
| Peru | 4 | 0.0% |
| Philippines | 30 | 0.3% |
| South America | 4 | 0.0% |
| South Central Asia | 2 | 0.0% |
| South Eastern Asia | 30 | 0.3% |
| Switzerland | 3 | 0.0% |
| Western Europe | 3 | 0.0% | View All 13 Rows |
Sex and Age in Beaverhead County
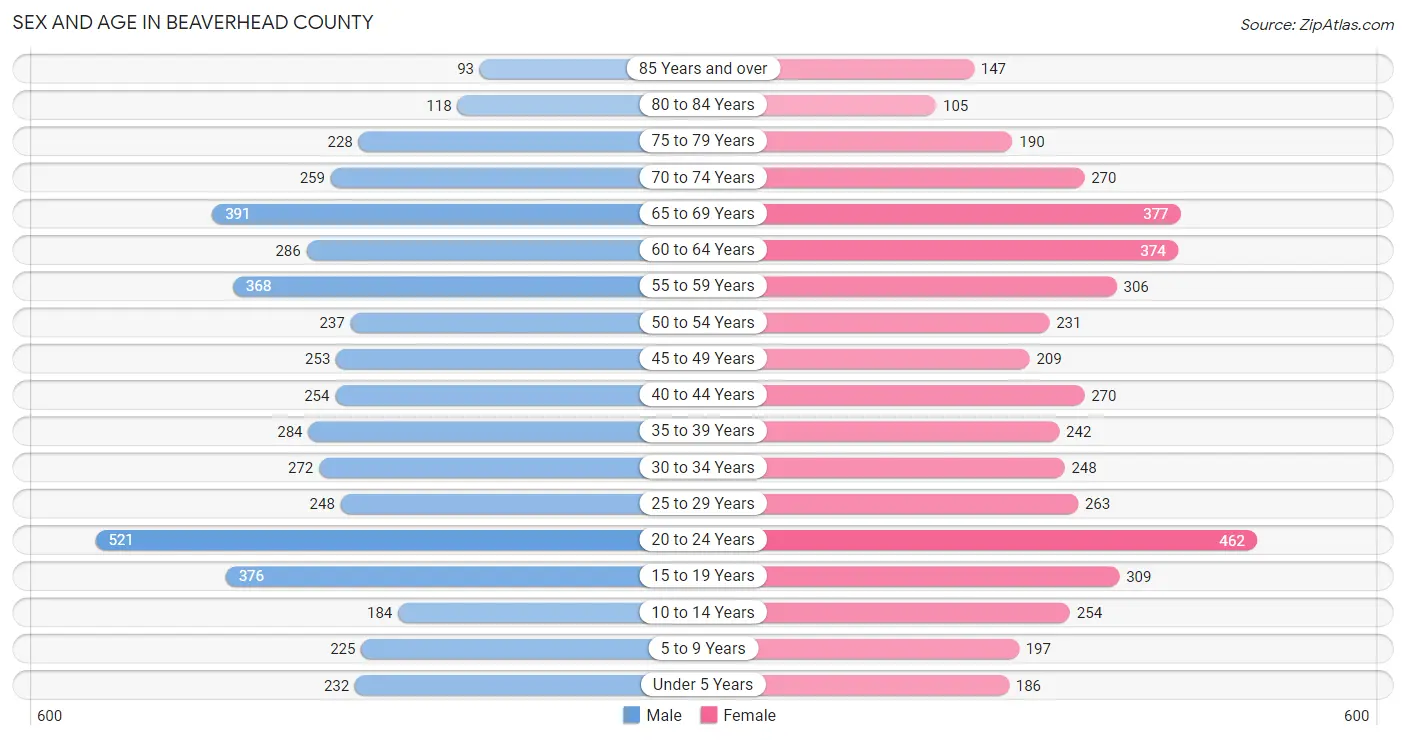
Sex and Age in Beaverhead County
The most populous age groups in Beaverhead County are 20 to 24 Years (521 | 10.8%) for men and 20 to 24 Years (462 | 10.0%) for women.
| Age Bracket | Male | Female |
| Under 5 Years | 232 (4.8%) | 186 (4.0%) |
| 5 to 9 Years | 225 (4.7%) | 197 (4.3%) |
| 10 to 14 Years | 184 (3.8%) | 254 (5.5%) |
| 15 to 19 Years | 376 (7.8%) | 309 (6.7%) |
| 20 to 24 Years | 521 (10.8%) | 462 (10.0%) |
| 25 to 29 Years | 248 (5.1%) | 263 (5.7%) |
| 30 to 34 Years | 272 (5.6%) | 248 (5.3%) |
| 35 to 39 Years | 284 (5.9%) | 242 (5.2%) |
| 40 to 44 Years | 254 (5.3%) | 270 (5.8%) |
| 45 to 49 Years | 253 (5.2%) | 209 (4.5%) |
| 50 to 54 Years | 237 (4.9%) | 231 (5.0%) |
| 55 to 59 Years | 368 (7.6%) | 306 (6.6%) |
| 60 to 64 Years | 286 (5.9%) | 374 (8.1%) |
| 65 to 69 Years | 391 (8.1%) | 377 (8.1%) |
| 70 to 74 Years | 259 (5.4%) | 270 (5.8%) |
| 75 to 79 Years | 228 (4.7%) | 190 (4.1%) |
| 80 to 84 Years | 118 (2.4%) | 105 (2.3%) |
| 85 Years and over | 93 (1.9%) | 147 (3.2%) |
| Total | 4,829 (100.0%) | 4,640 (100.0%) |
Families and Households in Beaverhead County
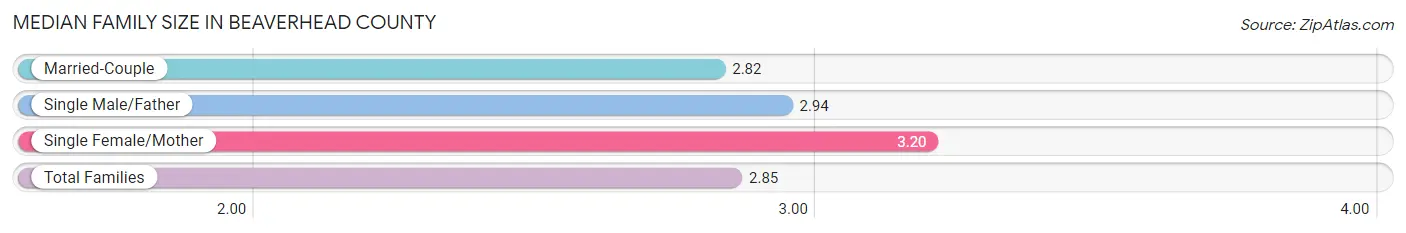
Median Family Size in Beaverhead County
The median family size in Beaverhead County is 2.85 persons per family, with single female/mother families (167 | 7.2%) accounting for the largest median family size of 3.2 persons per family. On the other hand, married-couple families (2,059 | 89.2%) represent the smallest median family size with 2.82 persons per family.
| Family Type | # Families | Family Size |
| Married-Couple | 2,059 (89.2%) | 2.82 |
| Single Male/Father | 82 (3.5%) | 2.94 |
| Single Female/Mother | 167 (7.2%) | 3.20 |
| Total Families | 2,308 (100.0%) | 2.85 |
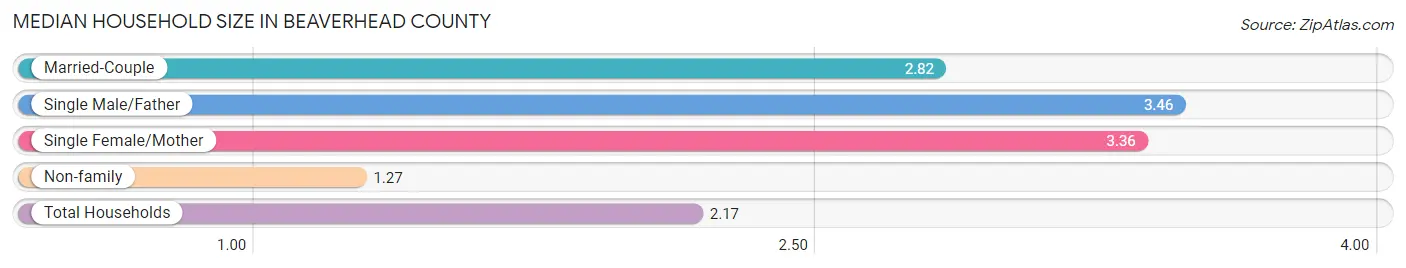
Median Household Size in Beaverhead County
The median household size in Beaverhead County is 2.17 persons per household, with single male/father households (82 | 2.0%) accounting for the largest median household size of 3.46 persons per household. non-family households (1,799 | 43.8%) represent the smallest median household size with 1.27 persons per household.
| Household Type | # Households | Household Size |
| Married-Couple | 2,059 (50.1%) | 2.82 |
| Single Male/Father | 82 (2.0%) | 3.46 |
| Single Female/Mother | 167 (4.1%) | 3.36 |
| Non-family | 1,799 (43.8%) | 1.27 |
| Total Households | 4,107 (100.0%) | 2.17 |
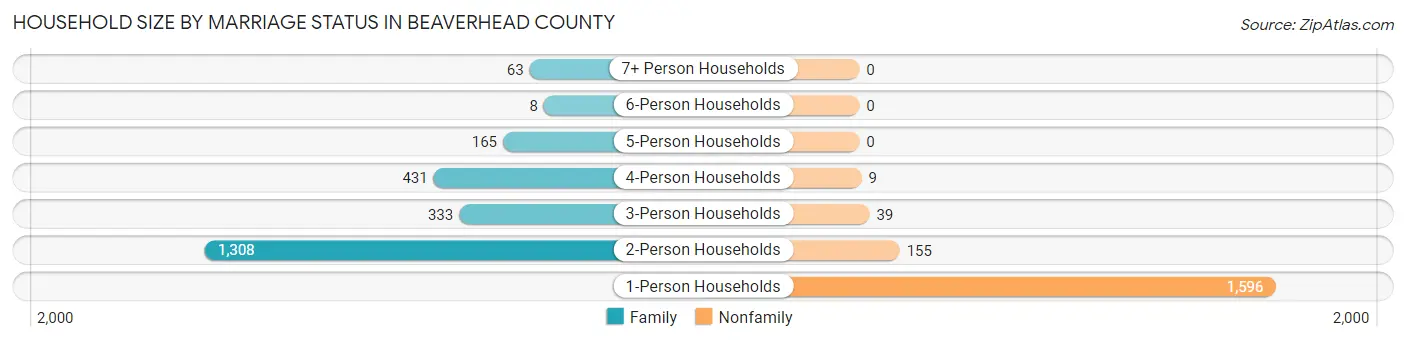
Household Size by Marriage Status in Beaverhead County
Out of a total of 4,107 households in Beaverhead County, 2,308 (56.2%) are family households, while 1,799 (43.8%) are nonfamily households. The most numerous type of family households are 2-person households, comprising 1,308, and the most common type of nonfamily households are 1-person households, comprising 1,596.
| Household Size | Family Households | Nonfamily Households |
| 1-Person Households | - | 1,596 (38.9%) |
| 2-Person Households | 1,308 (31.9%) | 155 (3.8%) |
| 3-Person Households | 333 (8.1%) | 39 (0.9%) |
| 4-Person Households | 431 (10.5%) | 9 (0.2%) |
| 5-Person Households | 165 (4.0%) | 0 (0.0%) |
| 6-Person Households | 8 (0.2%) | 0 (0.0%) |
| 7+ Person Households | 63 (1.5%) | 0 (0.0%) |
| Total | 2,308 (56.2%) | 1,799 (43.8%) |
Female Fertility in Beaverhead County
Fertility by Age in Beaverhead County
Average fertility rate in Beaverhead County is 25.0 births per 1,000 women. Women in the age bracket of 20 to 34 years have the highest fertility rate with 44.0 births per 1,000 women. Women in the age bracket of 20 to 34 years acount for 84.3% of all women with births.
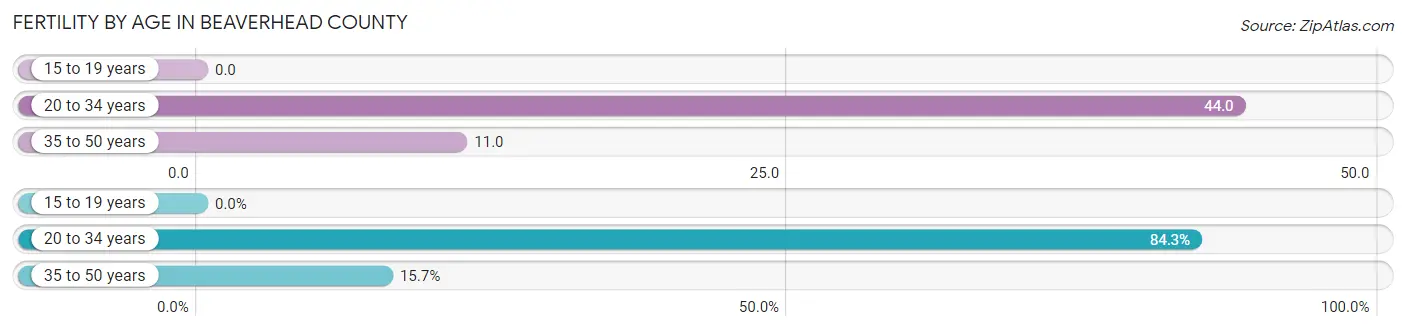
| Age Bracket | Women with Births | Births / 1,000 Women |
| 15 to 19 years | 0 (0.0%) | 0.0 |
| 20 to 34 years | 43 (84.3%) | 44.0 |
| 35 to 50 years | 8 (15.7%) | 11.0 |
| Total | 51 (100.0%) | 25.0 |
Fertility by Age by Marriage Status in Beaverhead County
72.5% of women with births (51) in Beaverhead County are married. The highest percentage of unmarried women with births falls into 20 to 34 years age bracket with 32.6% of them unmarried at the time of birth, while the lowest percentage of unmarried women with births belong to 35 to 50 years age bracket with 0.0% of them unmarried.
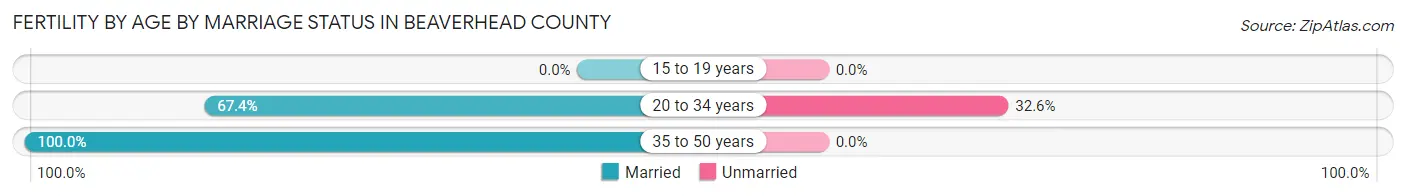
| Age Bracket | Married | Unmarried |
| 15 to 19 years | 0 (0.0%) | 0 (0.0%) |
| 20 to 34 years | 29 (67.4%) | 14 (32.6%) |
| 35 to 50 years | 8 (100.0%) | 0 (0.0%) |
| Total | 37 (72.6%) | 14 (27.5%) |
Fertility by Education in Beaverhead County
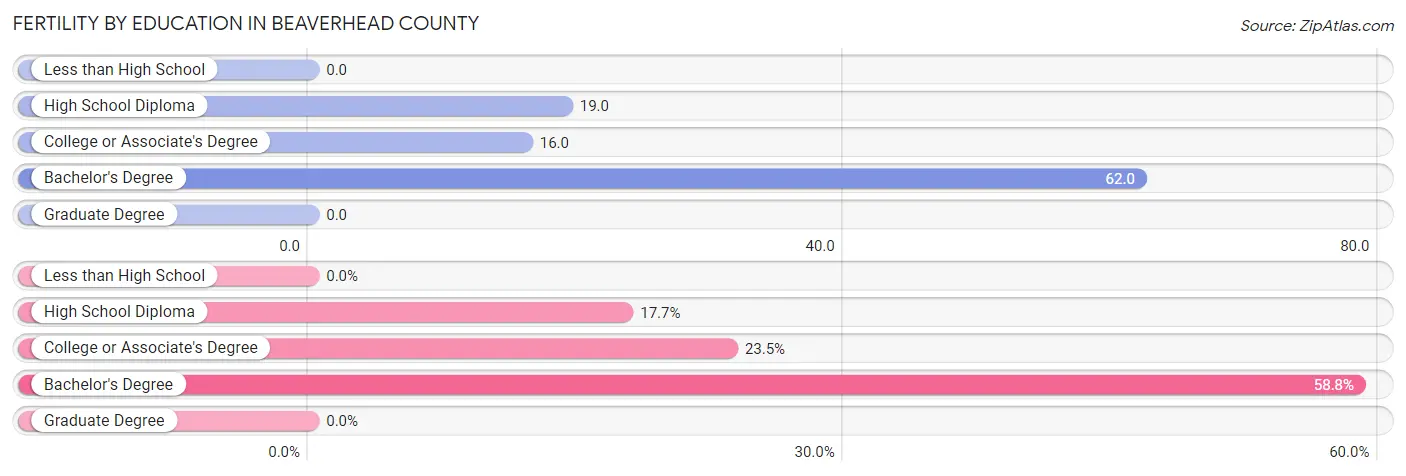
| Educational Attainment | Women with Births | Births / 1,000 Women |
| Less than High School | 0 (0.0%) | 0.0 |
| High School Diploma | 9 (17.6%) | 19.0 |
| College or Associate's Degree | 12 (23.5%) | 16.0 |
| Bachelor's Degree | 30 (58.8%) | 62.0 |
| Graduate Degree | 0 (0.0%) | 0.0 |
| Total | 51 (100.0%) | 25.0 |
Fertility by Education by Marriage Status in Beaverhead County
27.5% of women with births in Beaverhead County are unmarried. Women with the educational attainment of bachelor's degree are most likely to be married with 100.0% of them married at childbirth, while women with the educational attainment of college or associate's degree are least likely to be married with 91.7% of them unmarried at childbirth.
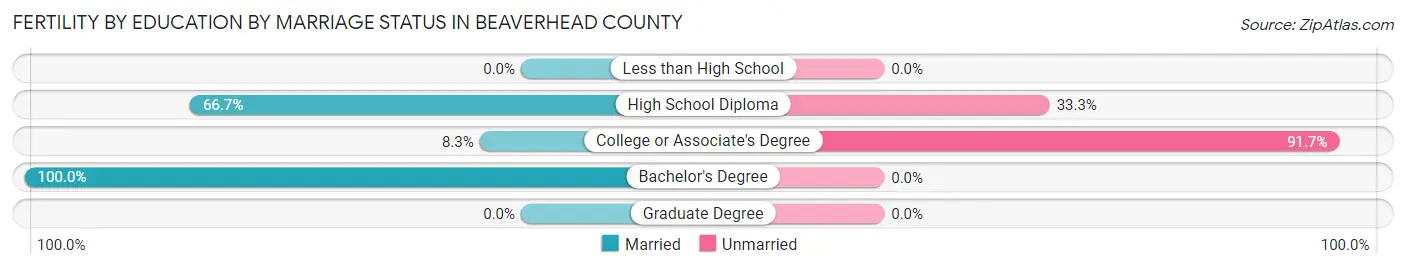
| Educational Attainment | Married | Unmarried |
| Less than High School | 0 (0.0%) | 0 (0.0%) |
| High School Diploma | 6 (66.7%) | 3 (33.3%) |
| College or Associate's Degree | 1 (8.3%) | 11 (91.7%) |
| Bachelor's Degree | 30 (100.0%) | 0 (0.0%) |
| Graduate Degree | 0 (0.0%) | 0 (0.0%) |
| Total | 37 (72.6%) | 14 (27.5%) |
Employment Characteristics in Beaverhead County
Employment by Class of Employer in Beaverhead County
Among the 4,559 employed individuals in Beaverhead County, private company employees (2,603 | 57.1%), not-for-profit organizations (527 | 11.6%), and self-employed (not incorporated) (488 | 10.7%) make up the most common classes of employment.
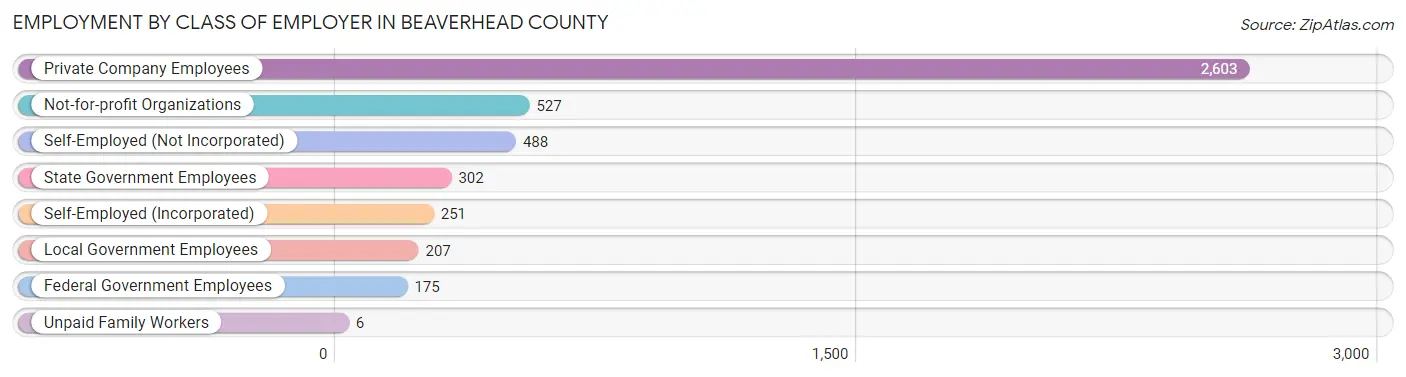
| Employer Class | # Employees | % Employees |
| Private Company Employees | 2,603 | 57.1% |
| Self-Employed (Incorporated) | 251 | 5.5% |
| Self-Employed (Not Incorporated) | 488 | 10.7% |
| Not-for-profit Organizations | 527 | 11.6% |
| Local Government Employees | 207 | 4.5% |
| State Government Employees | 302 | 6.6% |
| Federal Government Employees | 175 | 3.8% |
| Unpaid Family Workers | 6 | 0.1% |
| Total | 4,559 | 100.0% |
Employment Status by Age in Beaverhead County
According to the labor force statistics for Beaverhead County, out of the total population over 16 years of age (8,130), 58.2% or 4,732 individuals are in the labor force, with 2.8% or 132 of them unemployed. The age group with the highest labor force participation rate is 25 to 29 years, with 90.4% or 462 individuals in the labor force. Within the labor force, the 75 years and over age range has the highest percentage of unemployed individuals, with 12.3% or 9 of them being unemployed.
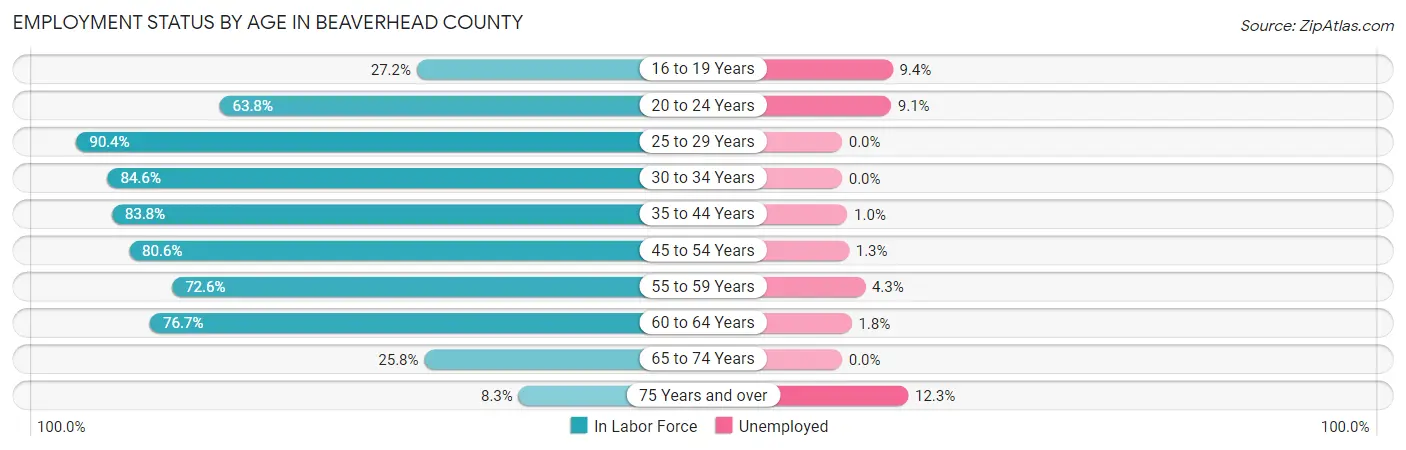
| Age Bracket | In Labor Force | Unemployed |
| 16 to 19 Years | 170 (27.2%) | 16 (9.4%) |
| 20 to 24 Years | 627 (63.8%) | 57 (9.1%) |
| 25 to 29 Years | 462 (90.4%) | 0 (0.0%) |
| 30 to 34 Years | 440 (84.6%) | 0 (0.0%) |
| 35 to 44 Years | 880 (83.8%) | 9 (1.0%) |
| 45 to 54 Years | 750 (80.6%) | 10 (1.3%) |
| 55 to 59 Years | 489 (72.6%) | 21 (4.3%) |
| 60 to 64 Years | 506 (76.7%) | 9 (1.8%) |
| 65 to 74 Years | 335 (25.8%) | 0 (0.0%) |
| 75 Years and over | 73 (8.3%) | 9 (12.3%) |
| Total | 4,732 (58.2%) | 132 (2.8%) |
Employment Status by Educational Attainment in Beaverhead County
According to labor force statistics for Beaverhead County, 81.2% of individuals (3,528) out of the total population between 25 and 64 years of age (4,345) are in the labor force, with 1.4% or 49 of them being unemployed. The group with the highest labor force participation rate are those with the educational attainment of bachelor's degree or higher, with 88.2% or 1,479 individuals in the labor force. Within the labor force, individuals with less than high school education have the highest percentage of unemployment, with 11.5% or 21 of them being unemployed.
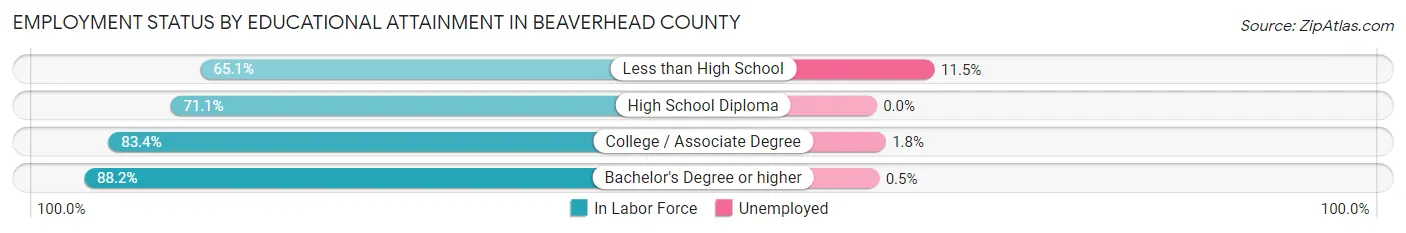
| Educational Attainment | In Labor Force | Unemployed |
| Less than High School | 183 (65.1%) | 32 (11.5%) |
| High School Diploma | 723 (71.1%) | 0 (0.0%) |
| College / Associate Degree | 1,143 (83.4%) | 25 (1.8%) |
| Bachelor's Degree or higher | 1,479 (88.2%) | 8 (0.5%) |
| Total | 3,528 (81.2%) | 61 (1.4%) |
Employment Occupations by Sex in Beaverhead County
Management, Business, Science and Arts Occupations
The most common Management, Business, Science and Arts occupations in Beaverhead County are Management (714 | 15.5%), Community & Social Service (571 | 12.4%), Education Instruction & Library (377 | 8.2%), Health Diagnosing & Treating (334 | 7.3%), and Health Technologists (277 | 6.0%).
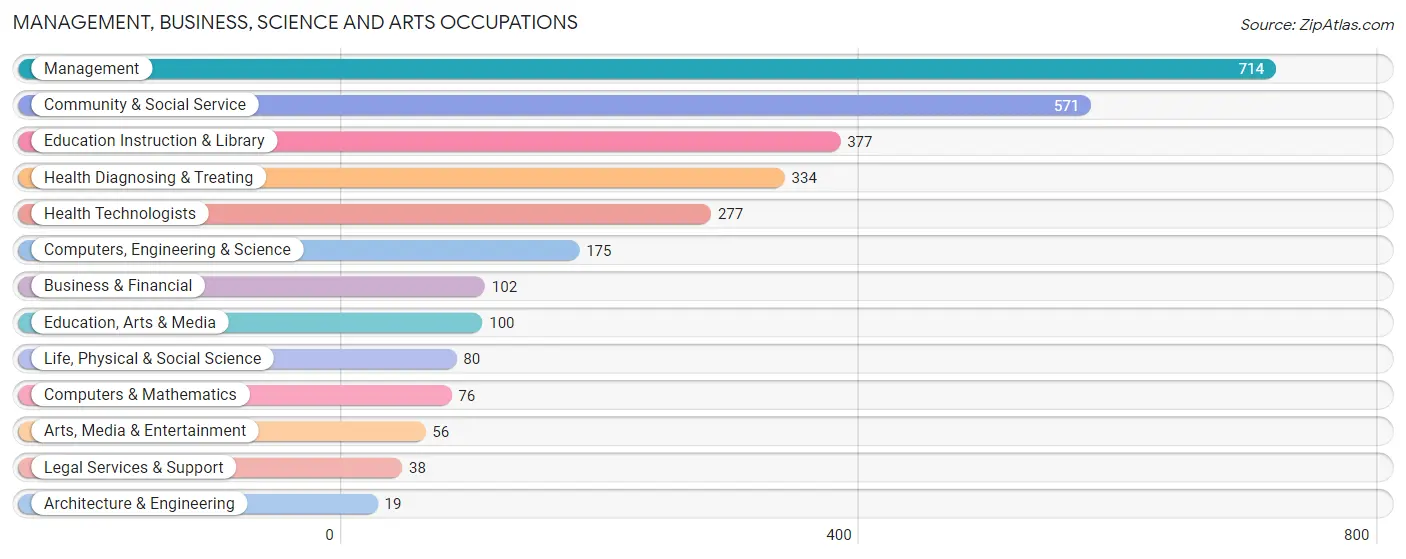
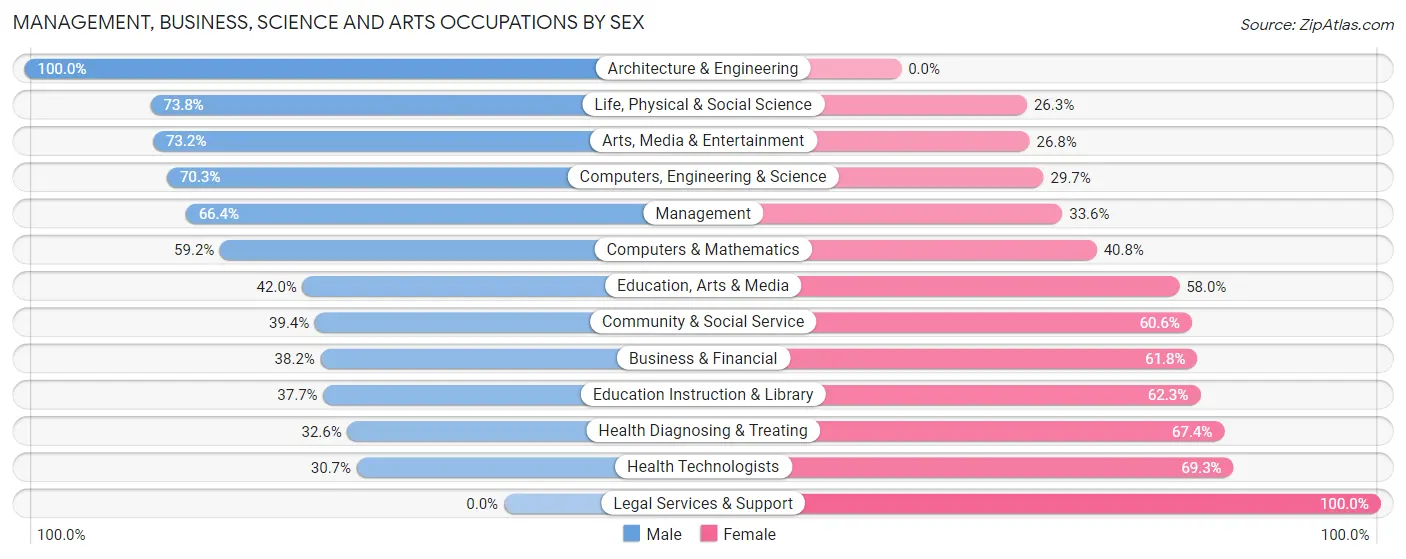
Management, Business, Science and Arts Occupations by Sex
Within the Management, Business, Science and Arts occupations in Beaverhead County, the most male-oriented occupations are Architecture & Engineering (100.0%), Life, Physical & Social Science (73.8%), and Arts, Media & Entertainment (73.2%), while the most female-oriented occupations are Legal Services & Support (100.0%), Health Technologists (69.3%), and Health Diagnosing & Treating (67.4%).
| Occupation | Male | Female |
| Management | 474 (66.4%) | 240 (33.6%) |
| Business & Financial | 39 (38.2%) | 63 (61.8%) |
| Computers, Engineering & Science | 123 (70.3%) | 52 (29.7%) |
| Computers & Mathematics | 45 (59.2%) | 31 (40.8%) |
| Architecture & Engineering | 19 (100.0%) | 0 (0.0%) |
| Life, Physical & Social Science | 59 (73.8%) | 21 (26.3%) |
| Community & Social Service | 225 (39.4%) | 346 (60.6%) |
| Education, Arts & Media | 42 (42.0%) | 58 (58.0%) |
| Legal Services & Support | 0 (0.0%) | 38 (100.0%) |
| Education Instruction & Library | 142 (37.7%) | 235 (62.3%) |
| Arts, Media & Entertainment | 41 (73.2%) | 15 (26.8%) |
| Health Diagnosing & Treating | 109 (32.6%) | 225 (67.4%) |
| Health Technologists | 85 (30.7%) | 192 (69.3%) |
| Total (Category) | 970 (51.2%) | 926 (48.8%) |
| Total (Overall) | 2,376 (51.6%) | 2,224 (48.3%) |
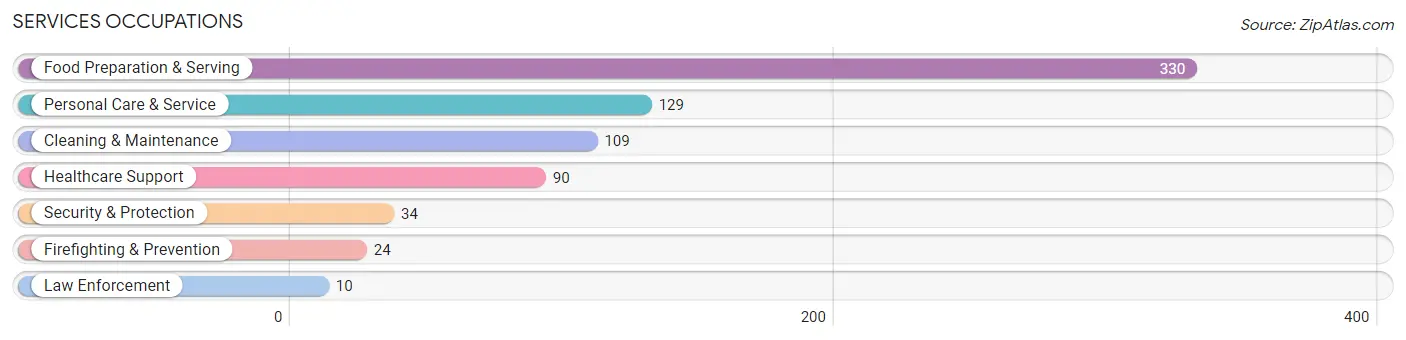
Services Occupations
The most common Services occupations in Beaverhead County are Food Preparation & Serving (330 | 7.2%), Personal Care & Service (129 | 2.8%), Cleaning & Maintenance (109 | 2.4%), Healthcare Support (90 | 2.0%), and Security & Protection (34 | 0.7%).
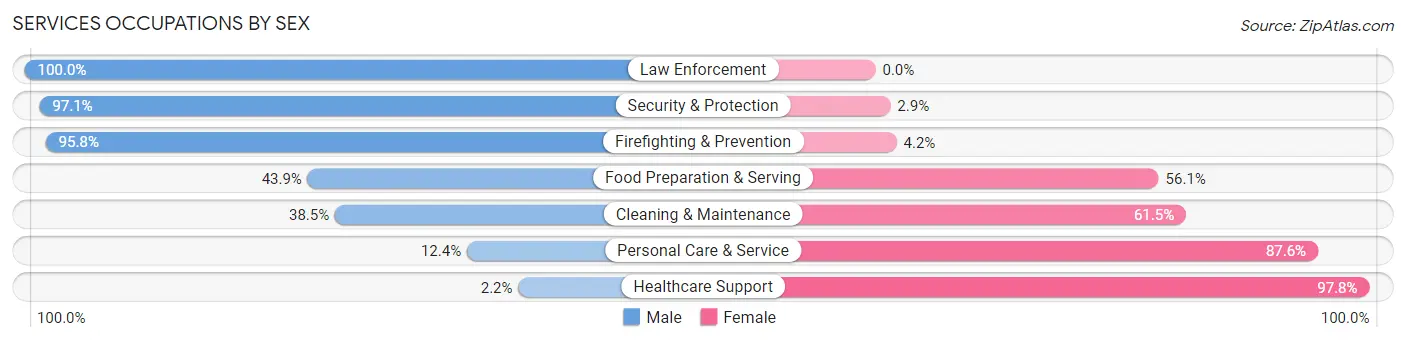
Services Occupations by Sex
Within the Services occupations in Beaverhead County, the most male-oriented occupations are Law Enforcement (100.0%), Security & Protection (97.1%), and Firefighting & Prevention (95.8%), while the most female-oriented occupations are Healthcare Support (97.8%), Personal Care & Service (87.6%), and Cleaning & Maintenance (61.5%).
| Occupation | Male | Female |
| Healthcare Support | 2 (2.2%) | 88 (97.8%) |
| Security & Protection | 33 (97.1%) | 1 (2.9%) |
| Firefighting & Prevention | 23 (95.8%) | 1 (4.2%) |
| Law Enforcement | 10 (100.0%) | 0 (0.0%) |
| Food Preparation & Serving | 145 (43.9%) | 185 (56.1%) |
| Cleaning & Maintenance | 42 (38.5%) | 67 (61.5%) |
| Personal Care & Service | 16 (12.4%) | 113 (87.6%) |
| Total (Category) | 238 (34.4%) | 454 (65.6%) |
| Total (Overall) | 2,376 (51.6%) | 2,224 (48.3%) |
Sales and Office Occupations
The most common Sales and Office occupations in Beaverhead County are Office & Administration (543 | 11.8%), and Sales & Related (402 | 8.7%).

Sales and Office Occupations by Sex
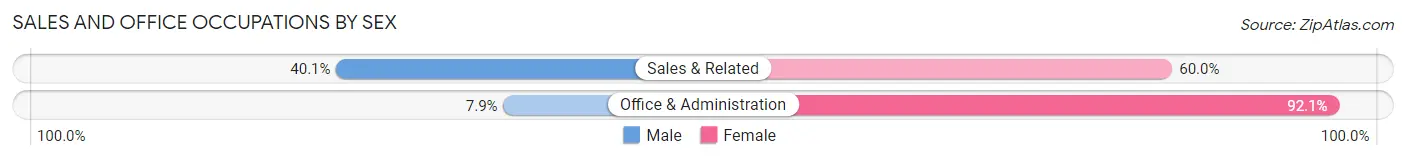
| Occupation | Male | Female |
| Sales & Related | 161 (40.1%) | 241 (60.0%) |
| Office & Administration | 43 (7.9%) | 500 (92.1%) |
| Total (Category) | 204 (21.6%) | 741 (78.4%) |
| Total (Overall) | 2,376 (51.6%) | 2,224 (48.3%) |
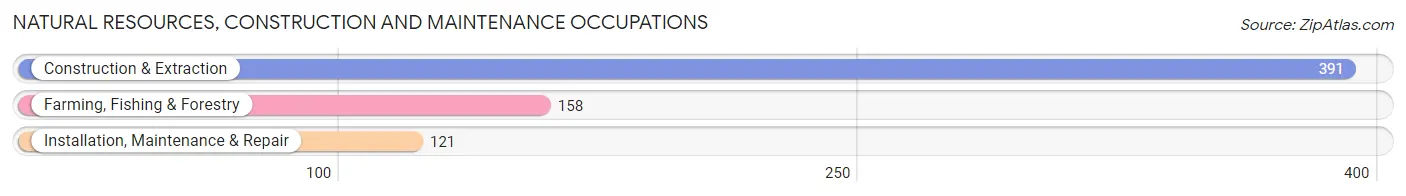
Natural Resources, Construction and Maintenance Occupations
The most common Natural Resources, Construction and Maintenance occupations in Beaverhead County are Construction & Extraction (391 | 8.5%), Farming, Fishing & Forestry (158 | 3.4%), and Installation, Maintenance & Repair (121 | 2.6%).
Natural Resources, Construction and Maintenance Occupations by Sex
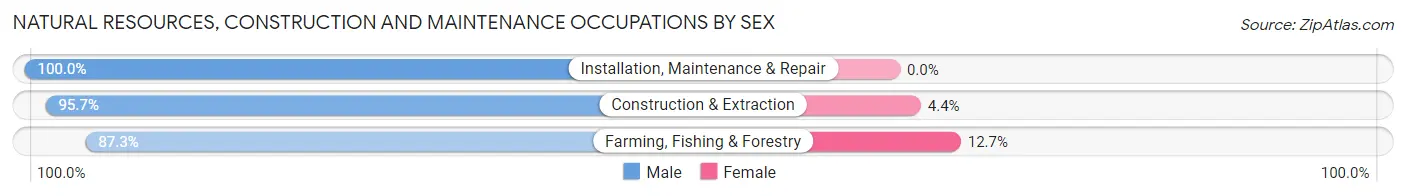
| Occupation | Male | Female |
| Farming, Fishing & Forestry | 138 (87.3%) | 20 (12.7%) |
| Construction & Extraction | 374 (95.7%) | 17 (4.3%) |
| Installation, Maintenance & Repair | 121 (100.0%) | 0 (0.0%) |
| Total (Category) | 633 (94.5%) | 37 (5.5%) |
| Total (Overall) | 2,376 (51.6%) | 2,224 (48.3%) |
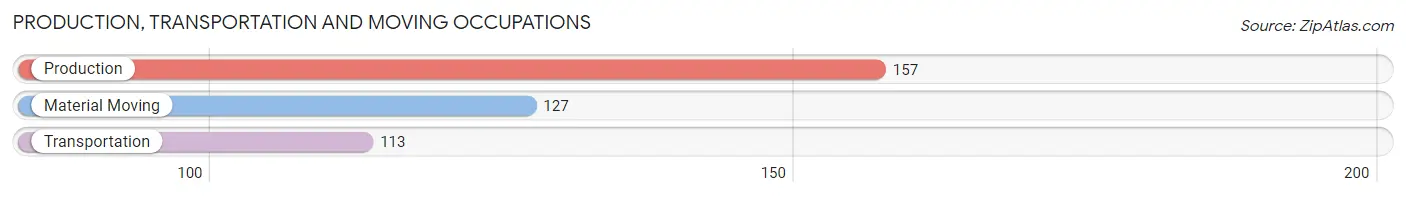
Production, Transportation and Moving Occupations
The most common Production, Transportation and Moving occupations in Beaverhead County are Production (157 | 3.4%), Material Moving (127 | 2.8%), and Transportation (113 | 2.5%).
Production, Transportation and Moving Occupations by Sex
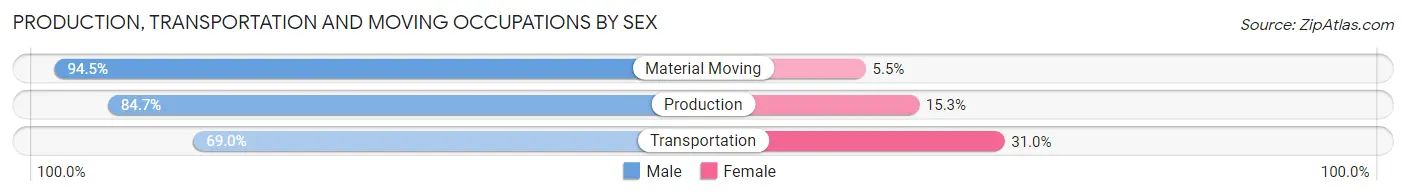
| Occupation | Male | Female |
| Production | 133 (84.7%) | 24 (15.3%) |
| Transportation | 78 (69.0%) | 35 (31.0%) |
| Material Moving | 120 (94.5%) | 7 (5.5%) |
| Total (Category) | 331 (83.4%) | 66 (16.6%) |
| Total (Overall) | 2,376 (51.6%) | 2,224 (48.3%) |
Employment Industries by Sex in Beaverhead County
Employment Industries in Beaverhead County
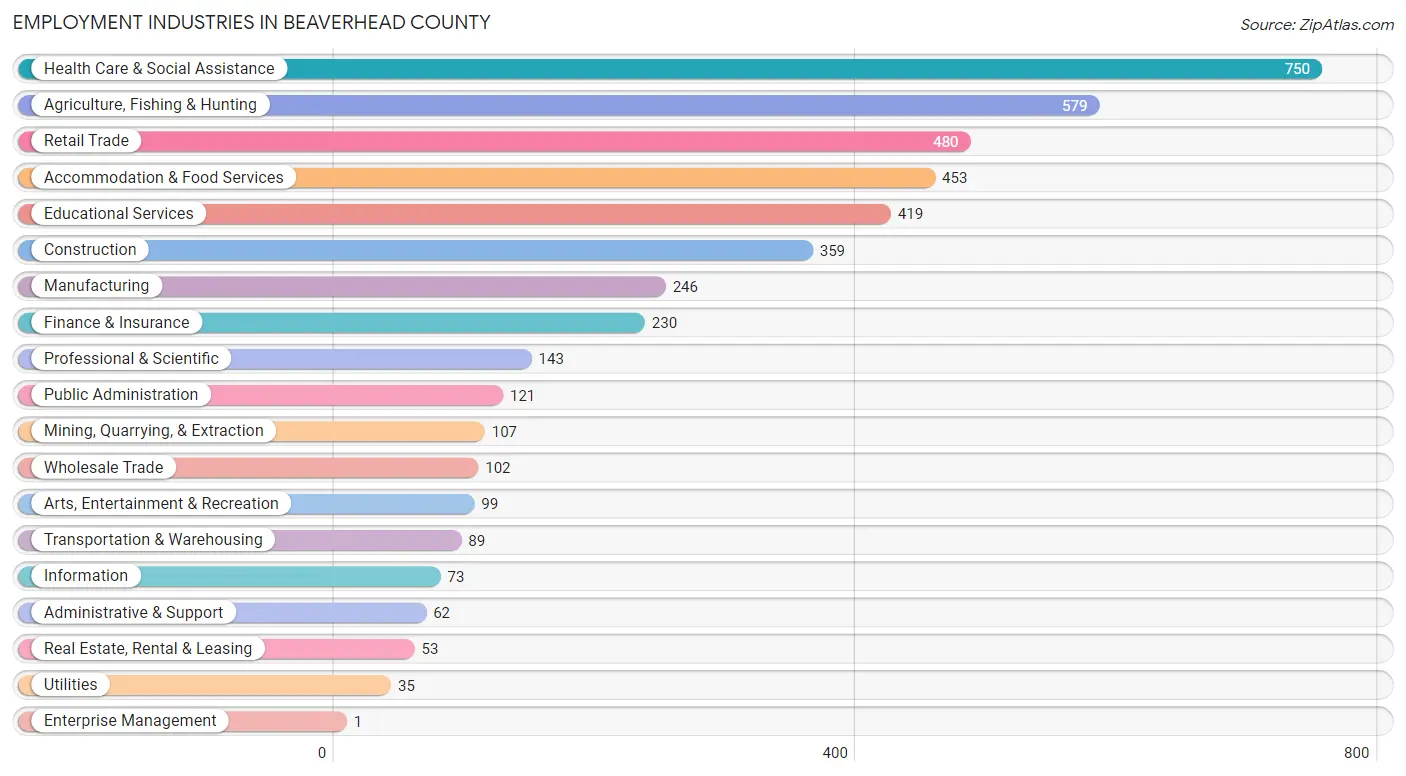
The major employment industries in Beaverhead County include Health Care & Social Assistance (750 | 16.3%), Agriculture, Fishing & Hunting (579 | 12.6%), Retail Trade (480 | 10.4%), Accommodation & Food Services (453 | 9.9%), and Educational Services (419 | 9.1%).
Employment Industries by Sex in Beaverhead County
The Beaverhead County industries that see more men than women are Mining, Quarrying, & Extraction (100.0%), Utilities (100.0%), and Construction (82.2%), whereas the industries that tend to have a higher number of women are Enterprise Management (100.0%), Health Care & Social Assistance (81.3%), and Professional & Scientific (79.7%).
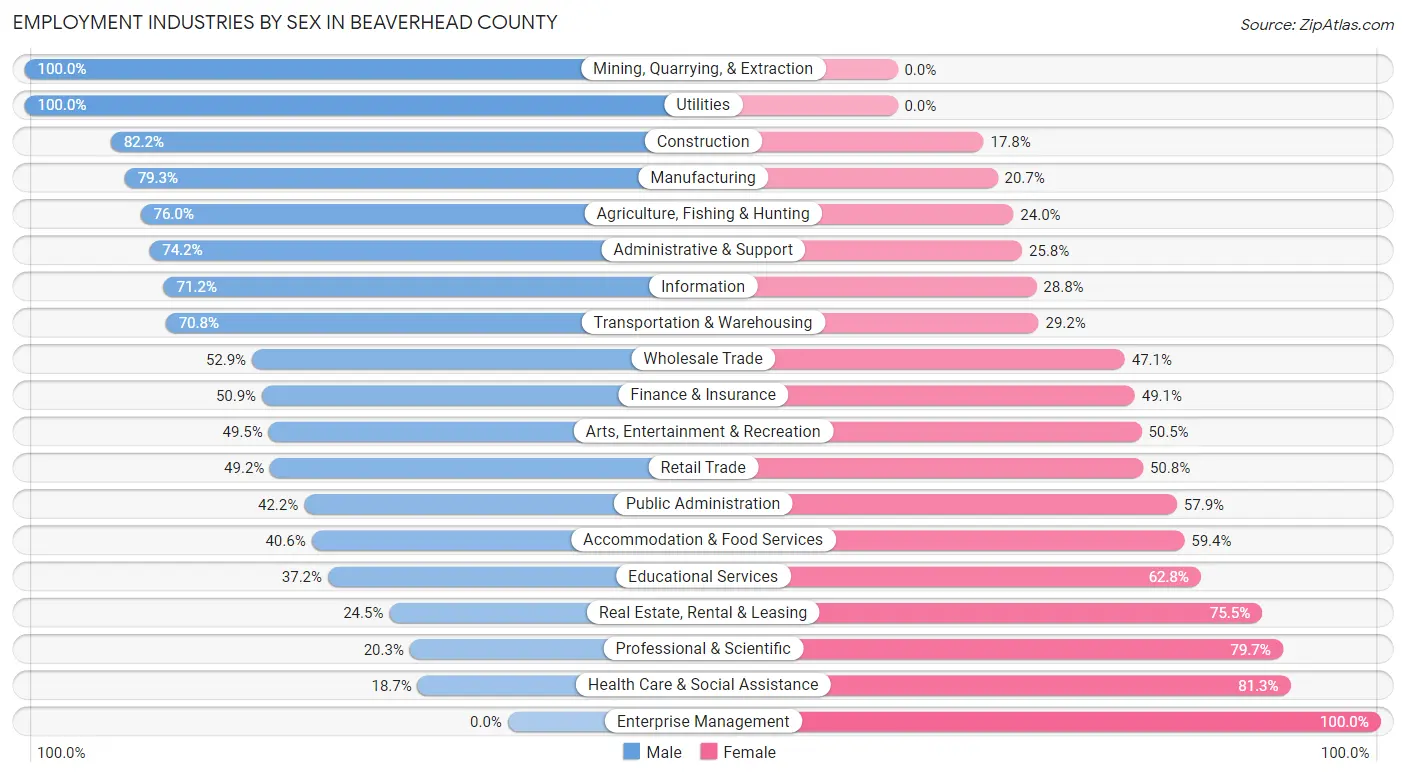
| Industry | Male | Female |
| Agriculture, Fishing & Hunting | 440 (76.0%) | 139 (24.0%) |
| Mining, Quarrying, & Extraction | 107 (100.0%) | 0 (0.0%) |
| Construction | 295 (82.2%) | 64 (17.8%) |
| Manufacturing | 195 (79.3%) | 51 (20.7%) |
| Wholesale Trade | 54 (52.9%) | 48 (47.1%) |
| Retail Trade | 236 (49.2%) | 244 (50.8%) |
| Transportation & Warehousing | 63 (70.8%) | 26 (29.2%) |
| Utilities | 35 (100.0%) | 0 (0.0%) |
| Information | 52 (71.2%) | 21 (28.8%) |
| Finance & Insurance | 117 (50.9%) | 113 (49.1%) |
| Real Estate, Rental & Leasing | 13 (24.5%) | 40 (75.5%) |
| Professional & Scientific | 29 (20.3%) | 114 (79.7%) |
| Enterprise Management | 0 (0.0%) | 1 (100.0%) |
| Administrative & Support | 46 (74.2%) | 16 (25.8%) |
| Educational Services | 156 (37.2%) | 263 (62.8%) |
| Health Care & Social Assistance | 140 (18.7%) | 610 (81.3%) |
| Arts, Entertainment & Recreation | 49 (49.5%) | 50 (50.5%) |
| Accommodation & Food Services | 184 (40.6%) | 269 (59.4%) |
| Public Administration | 51 (42.1%) | 70 (57.9%) |
| Total | 2,376 (51.6%) | 2,224 (48.3%) |
Education in Beaverhead County
School Enrollment in Beaverhead County
The most common levels of schooling among the 2,121 students in Beaverhead County are college / undergraduate (881 | 41.5%), elementary school (358 | 16.9%), and high school (324 | 15.3%).
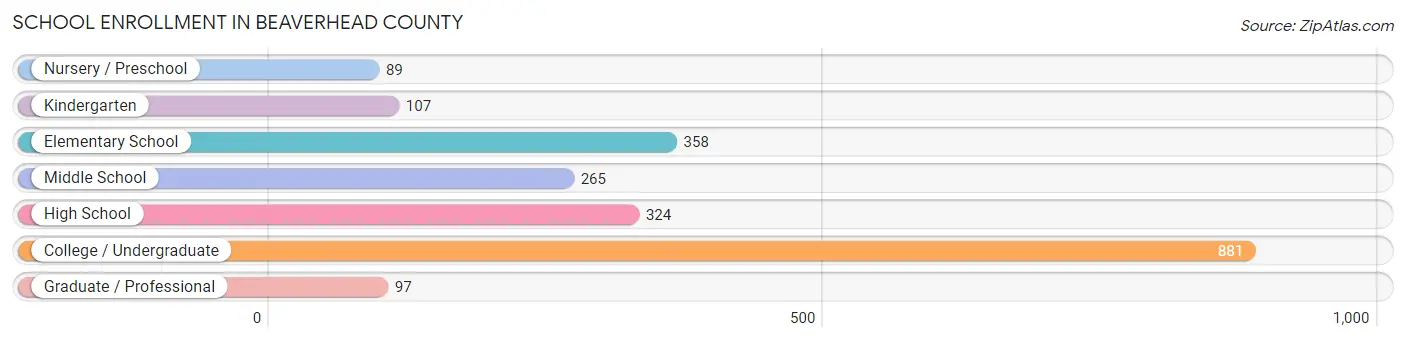
| School Level | # Students | % Students |
| Nursery / Preschool | 89 | 4.2% |
| Kindergarten | 107 | 5.0% |
| Elementary School | 358 | 16.9% |
| Middle School | 265 | 12.5% |
| High School | 324 | 15.3% |
| College / Undergraduate | 881 | 41.5% |
| Graduate / Professional | 97 | 4.6% |
| Total | 2,121 | 100.0% |
School Enrollment by Age by Funding Source in Beaverhead County
Out of a total of 2,121 students who are enrolled in schools in Beaverhead County, 361 (17.0%) attend a private institution, while the remaining 1,760 (83.0%) are enrolled in public schools. The age group of 15 to 17 year olds has the highest likelihood of being enrolled in private schools, with 114 (38.9% in the age bracket) enrolled. Conversely, the age group of 20 to 24 year olds has the lowest likelihood of being enrolled in a private school, with 565 (100.0% in the age bracket) attending a public institution.
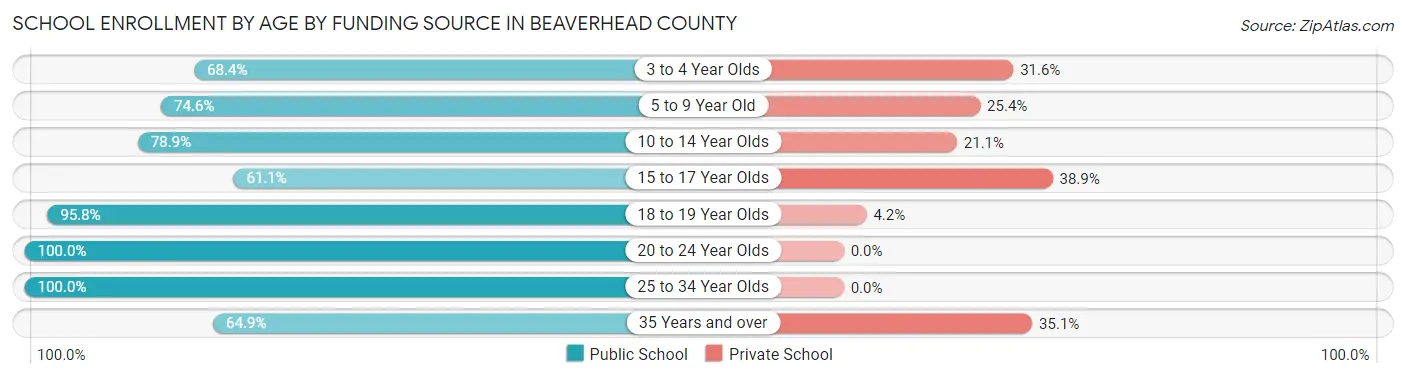
| Age Bracket | Public School | Private School |
| 3 to 4 Year Olds | 52 (68.4%) | 24 (31.6%) |
| 5 to 9 Year Old | 308 (74.6%) | 105 (25.4%) |
| 10 to 14 Year Olds | 277 (78.9%) | 74 (21.1%) |
| 15 to 17 Year Olds | 179 (61.1%) | 114 (38.9%) |
| 18 to 19 Year Olds | 226 (95.8%) | 10 (4.2%) |
| 20 to 24 Year Olds | 565 (100.0%) | 0 (0.0%) |
| 25 to 34 Year Olds | 93 (100.0%) | 0 (0.0%) |
| 35 Years and over | 61 (64.9%) | 33 (35.1%) |
| Total | 1,760 (83.0%) | 361 (17.0%) |
Educational Attainment by Field of Study in Beaverhead County
Business (582 | 21.3%), bio, nature & agricultural (483 | 17.6%), education (431 | 15.8%), science & technology (362 | 13.2%), and social sciences (134 | 4.9%) are the most common fields of study among 2,736 individuals in Beaverhead County who have obtained a bachelor's degree or higher.
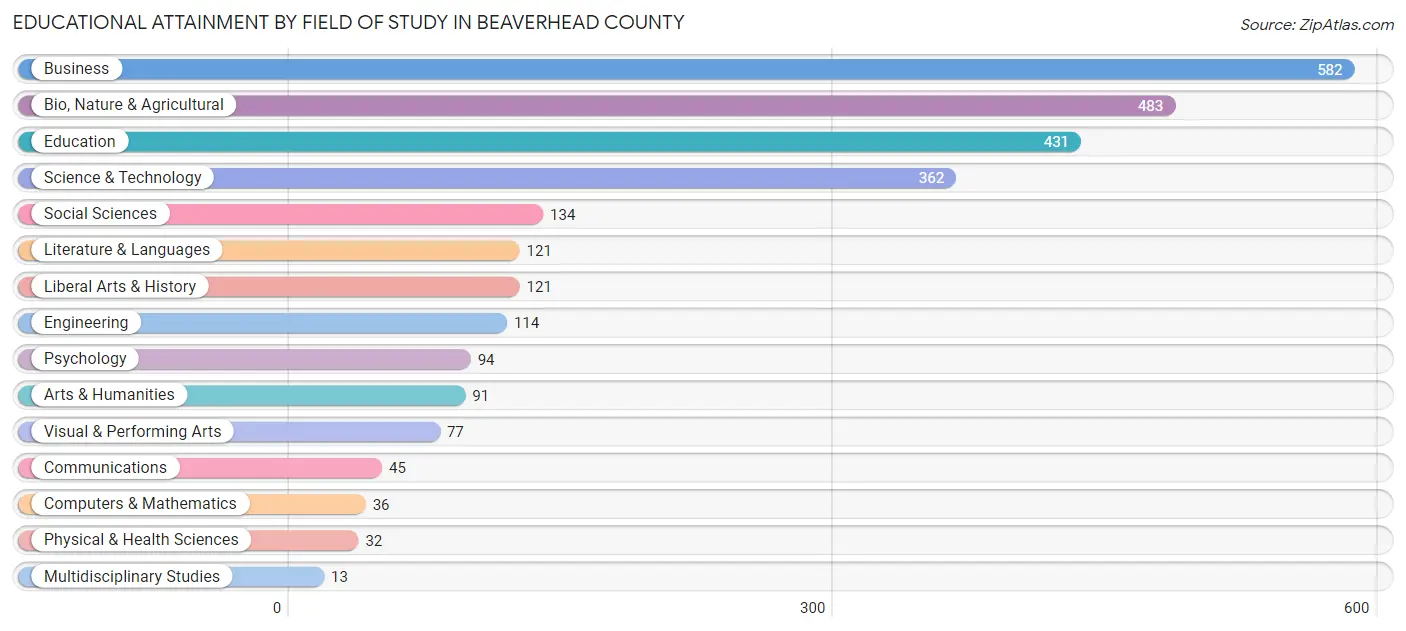
| Field of Study | # Graduates | % Graduates |
| Computers & Mathematics | 36 | 1.3% |
| Bio, Nature & Agricultural | 483 | 17.6% |
| Physical & Health Sciences | 32 | 1.2% |
| Psychology | 94 | 3.4% |
| Social Sciences | 134 | 4.9% |
| Engineering | 114 | 4.2% |
| Multidisciplinary Studies | 13 | 0.5% |
| Science & Technology | 362 | 13.2% |
| Business | 582 | 21.3% |
| Education | 431 | 15.8% |
| Literature & Languages | 121 | 4.4% |
| Liberal Arts & History | 121 | 4.4% |
| Visual & Performing Arts | 77 | 2.8% |
| Communications | 45 | 1.6% |
| Arts & Humanities | 91 | 3.3% |
| Total | 2,736 | 100.0% |
Transportation & Commute in Beaverhead County
Vehicle Availability by Sex in Beaverhead County
The most prevalent vehicle ownership categories in Beaverhead County are males with 2 vehicles (885, accounting for 39.5%) and females with 2 vehicles (777, making up 40.8%).
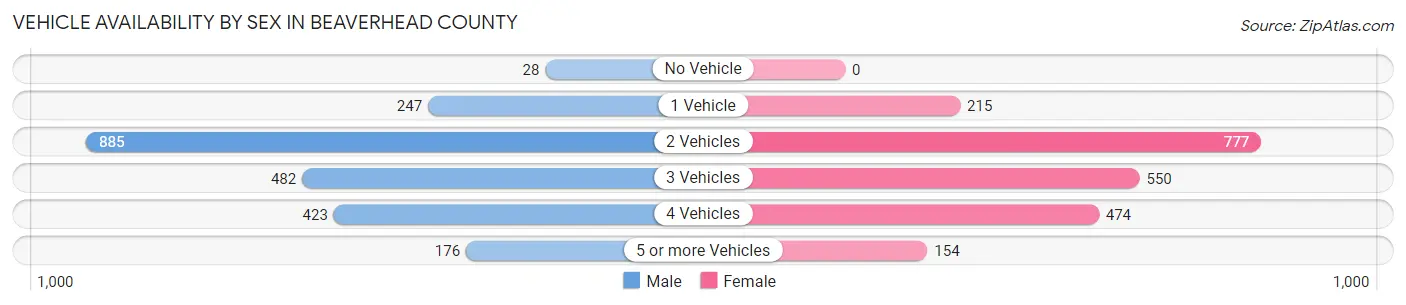
| Vehicles Available | Male | Female |
| No Vehicle | 28 (1.3%) | 0 (0.0%) |
| 1 Vehicle | 247 (11.0%) | 215 (9.9%) |
| 2 Vehicles | 885 (39.5%) | 777 (35.8%) |
| 3 Vehicles | 482 (21.5%) | 550 (25.4%) |
| 4 Vehicles | 423 (18.9%) | 474 (21.8%) |
| 5 or more Vehicles | 176 (7.9%) | 154 (7.1%) |
| Total | 2,241 (100.0%) | 2,170 (100.0%) |
Commute Time in Beaverhead County
The most frequently occuring commute durations in Beaverhead County are 5 to 9 minutes (1,038 commuters, 24.7%), 10 to 14 minutes (860 commuters, 20.4%), and less than 5 minutes (782 commuters, 18.6%).
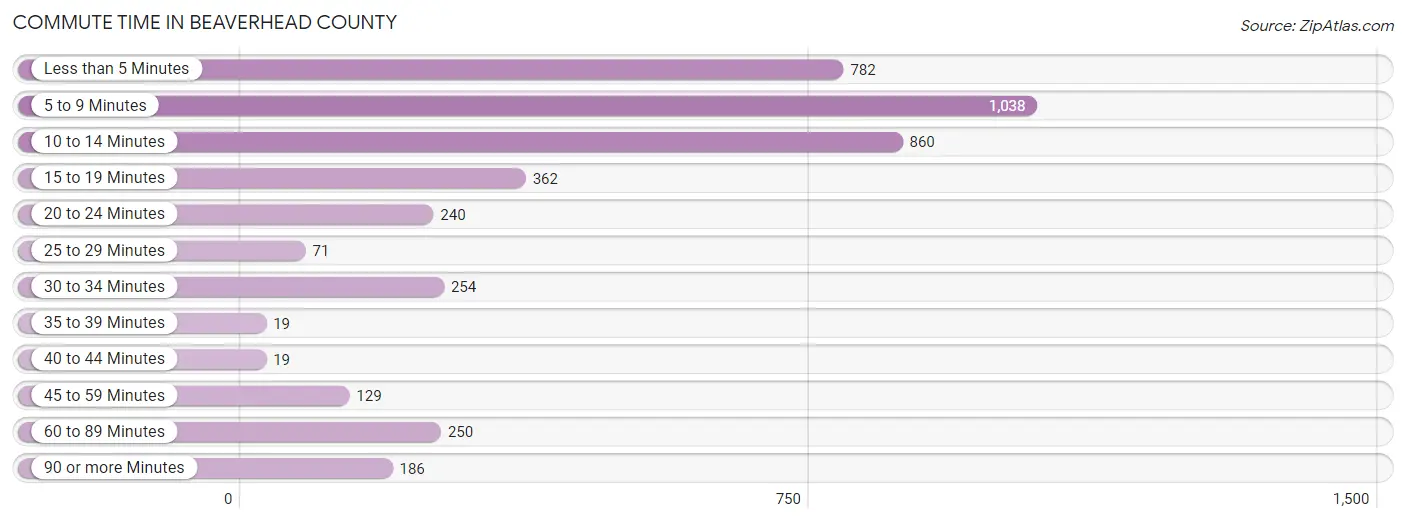
| Commute Time | # Commuters | % Commuters |
| Less than 5 Minutes | 782 | 18.6% |
| 5 to 9 Minutes | 1,038 | 24.7% |
| 10 to 14 Minutes | 860 | 20.4% |
| 15 to 19 Minutes | 362 | 8.6% |
| 20 to 24 Minutes | 240 | 5.7% |
| 25 to 29 Minutes | 71 | 1.7% |
| 30 to 34 Minutes | 254 | 6.0% |
| 35 to 39 Minutes | 19 | 0.4% |
| 40 to 44 Minutes | 19 | 0.4% |
| 45 to 59 Minutes | 129 | 3.1% |
| 60 to 89 Minutes | 250 | 5.9% |
| 90 or more Minutes | 186 | 4.4% |
Commute Time by Sex in Beaverhead County
The most common commute times in Beaverhead County are 5 to 9 minutes (503 commuters, 23.2%) for males and 5 to 9 minutes (535 commuters, 26.3%) for females.
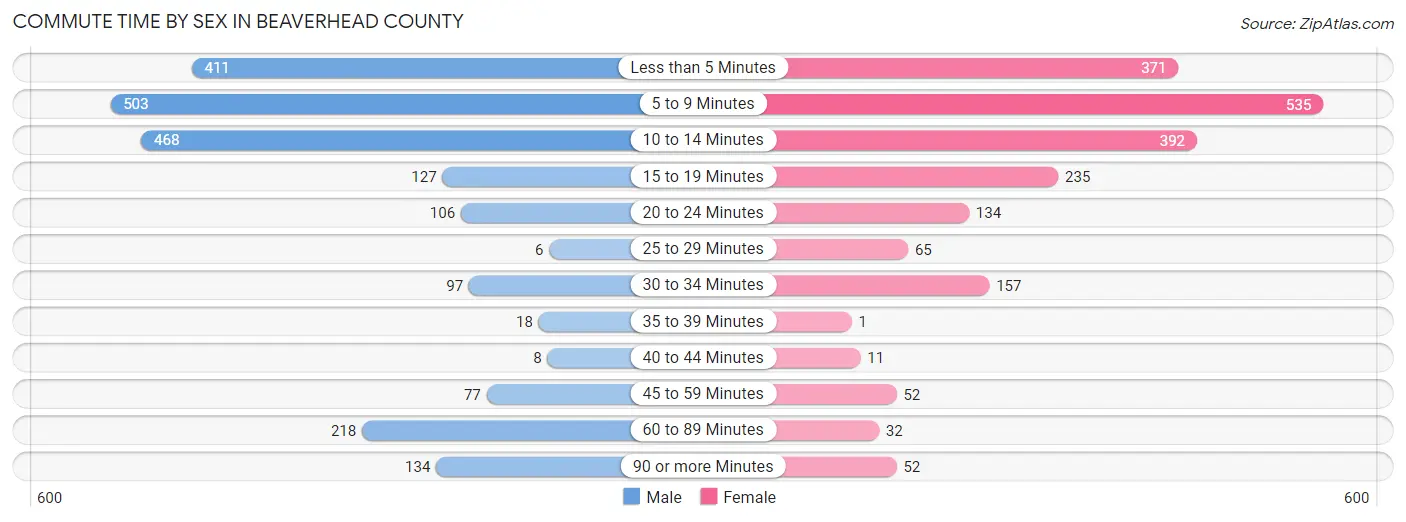
| Commute Time | Male | Female |
| Less than 5 Minutes | 411 (18.9%) | 371 (18.2%) |
| 5 to 9 Minutes | 503 (23.2%) | 535 (26.3%) |
| 10 to 14 Minutes | 468 (21.5%) | 392 (19.2%) |
| 15 to 19 Minutes | 127 (5.8%) | 235 (11.5%) |
| 20 to 24 Minutes | 106 (4.9%) | 134 (6.6%) |
| 25 to 29 Minutes | 6 (0.3%) | 65 (3.2%) |
| 30 to 34 Minutes | 97 (4.5%) | 157 (7.7%) |
| 35 to 39 Minutes | 18 (0.8%) | 1 (0.1%) |
| 40 to 44 Minutes | 8 (0.4%) | 11 (0.5%) |
| 45 to 59 Minutes | 77 (3.5%) | 52 (2.5%) |
| 60 to 89 Minutes | 218 (10.0%) | 32 (1.6%) |
| 90 or more Minutes | 134 (6.2%) | 52 (2.5%) |
Time of Departure to Work by Sex in Beaverhead County
The most frequent times of departure to work in Beaverhead County are 7:00 AM to 7:29 AM (365, 16.8%) for males and 7:30 AM to 7:59 AM (443, 21.7%) for females.
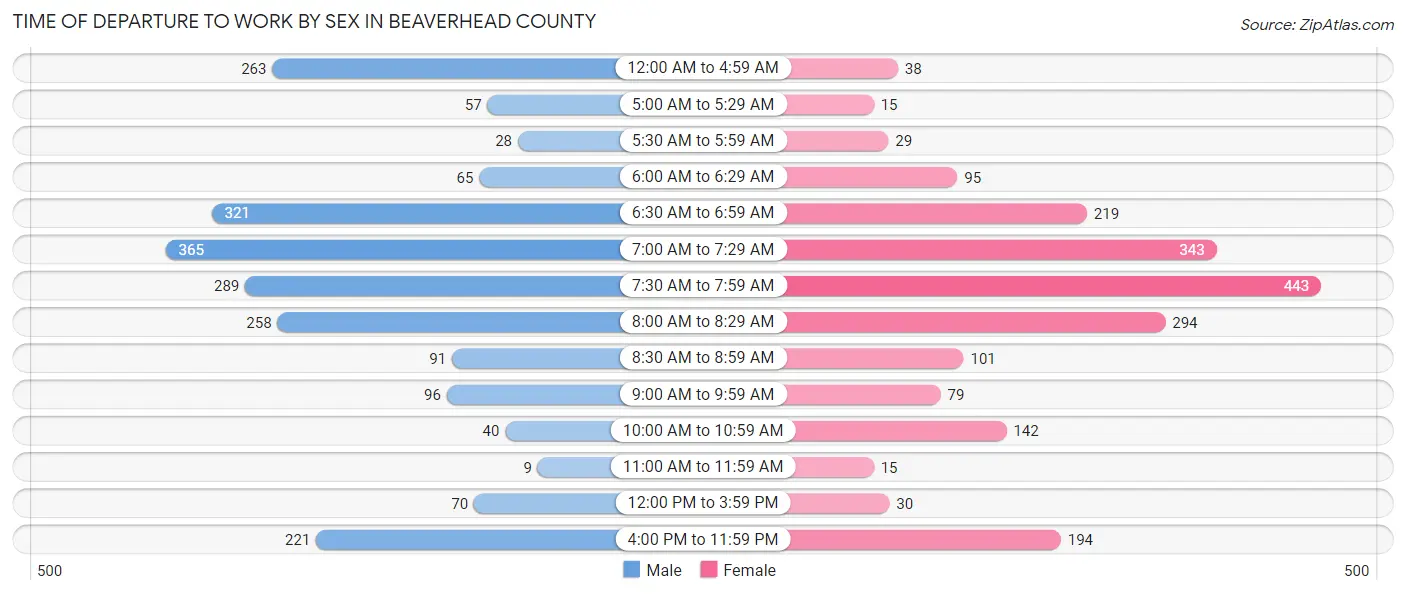
| Time of Departure | Male | Female |
| 12:00 AM to 4:59 AM | 263 (12.1%) | 38 (1.9%) |
| 5:00 AM to 5:29 AM | 57 (2.6%) | 15 (0.7%) |
| 5:30 AM to 5:59 AM | 28 (1.3%) | 29 (1.4%) |
| 6:00 AM to 6:29 AM | 65 (3.0%) | 95 (4.7%) |
| 6:30 AM to 6:59 AM | 321 (14.8%) | 219 (10.7%) |
| 7:00 AM to 7:29 AM | 365 (16.8%) | 343 (16.8%) |
| 7:30 AM to 7:59 AM | 289 (13.3%) | 443 (21.7%) |
| 8:00 AM to 8:29 AM | 258 (11.9%) | 294 (14.4%) |
| 8:30 AM to 8:59 AM | 91 (4.2%) | 101 (5.0%) |
| 9:00 AM to 9:59 AM | 96 (4.4%) | 79 (3.9%) |
| 10:00 AM to 10:59 AM | 40 (1.8%) | 142 (7.0%) |
| 11:00 AM to 11:59 AM | 9 (0.4%) | 15 (0.7%) |
| 12:00 PM to 3:59 PM | 70 (3.2%) | 30 (1.5%) |
| 4:00 PM to 11:59 PM | 221 (10.2%) | 194 (9.5%) |
| Total | 2,173 (100.0%) | 2,037 (100.0%) |
Housing Occupancy in Beaverhead County
Occupancy by Ownership in Beaverhead County
Of the total 4,107 dwellings in Beaverhead County, owner-occupied units account for 2,728 (66.4%), while renter-occupied units make up 1,379 (33.6%).
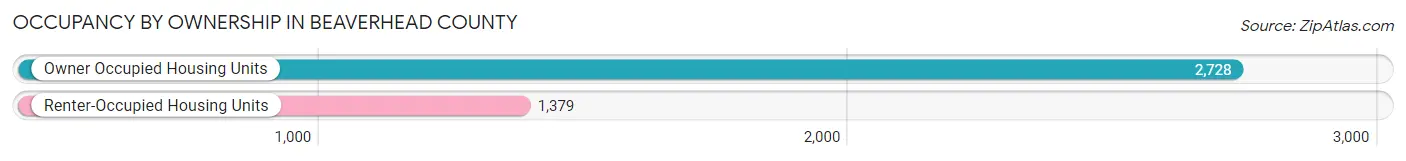
| Occupancy | # Housing Units | % Housing Units |
| Owner Occupied Housing Units | 2,728 | 66.4% |
| Renter-Occupied Housing Units | 1,379 | 33.6% |
| Total Occupied Housing Units | 4,107 | 100.0% |
Occupancy by Household Size in Beaverhead County
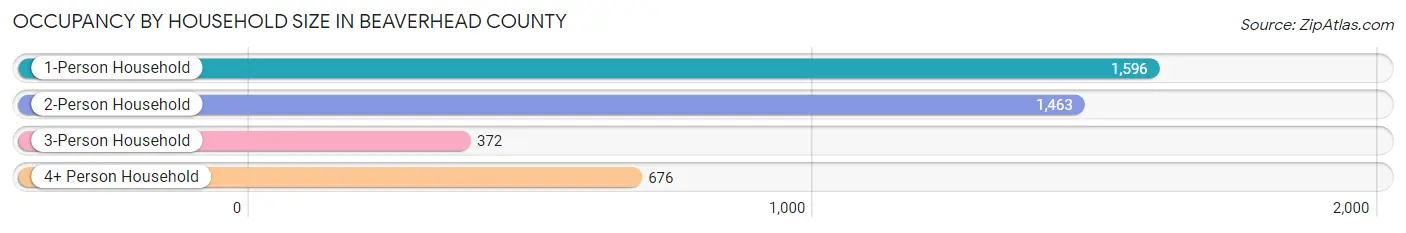
| Household Size | # Housing Units | % Housing Units |
| 1-Person Household | 1,596 | 38.9% |
| 2-Person Household | 1,463 | 35.6% |
| 3-Person Household | 372 | 9.1% |
| 4+ Person Household | 676 | 16.5% |
| Total Housing Units | 4,107 | 100.0% |
Occupancy by Ownership by Household Size in Beaverhead County
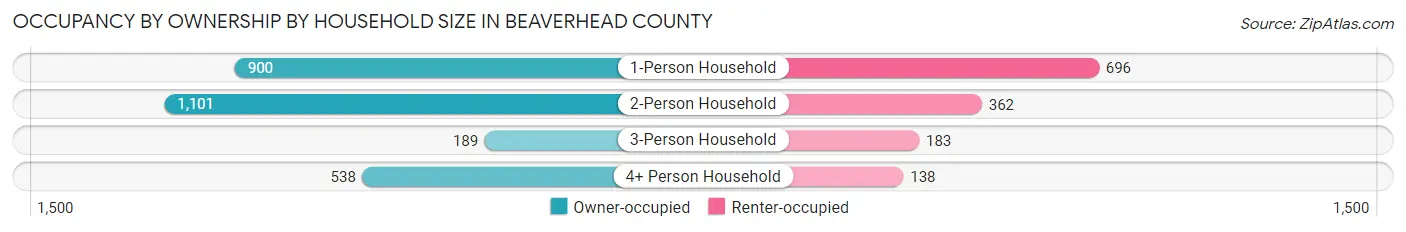
| Household Size | Owner-occupied | Renter-occupied |
| 1-Person Household | 900 (56.4%) | 696 (43.6%) |
| 2-Person Household | 1,101 (75.3%) | 362 (24.7%) |
| 3-Person Household | 189 (50.8%) | 183 (49.2%) |
| 4+ Person Household | 538 (79.6%) | 138 (20.4%) |
| Total Housing Units | 2,728 (66.4%) | 1,379 (33.6%) |
Occupancy by Educational Attainment in Beaverhead County
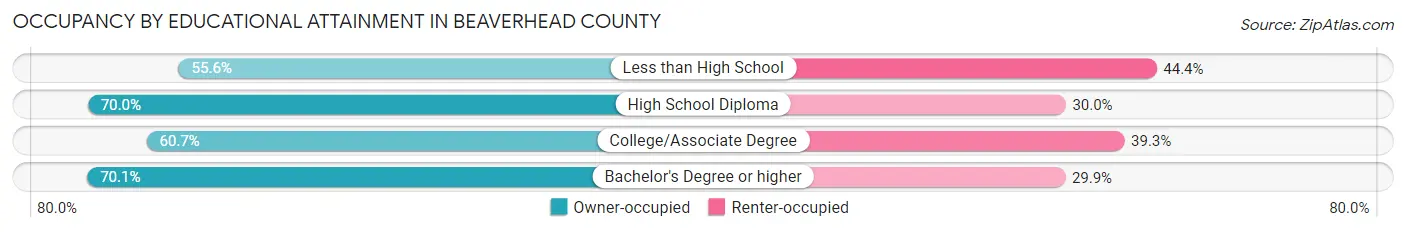
| Household Size | Owner-occupied | Renter-occupied |
| Less than High School | 105 (55.6%) | 84 (44.4%) |
| High School Diploma | 767 (70.0%) | 329 (30.0%) |
| College/Associate Degree | 782 (60.7%) | 507 (39.3%) |
| Bachelor's Degree or higher | 1,074 (70.1%) | 459 (29.9%) |
Occupancy by Age of Householder in Beaverhead County
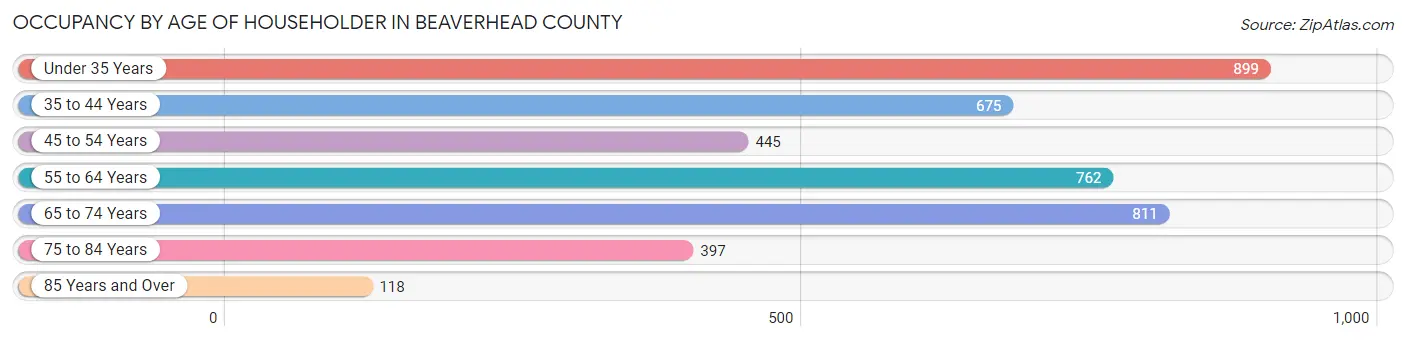
| Age Bracket | # Households | % Households |
| Under 35 Years | 899 | 21.9% |
| 35 to 44 Years | 675 | 16.4% |
| 45 to 54 Years | 445 | 10.8% |
| 55 to 64 Years | 762 | 18.5% |
| 65 to 74 Years | 811 | 19.8% |
| 75 to 84 Years | 397 | 9.7% |
| 85 Years and Over | 118 | 2.9% |
| Total | 4,107 | 100.0% |
Housing Finances in Beaverhead County
Median Income by Occupancy in Beaverhead County
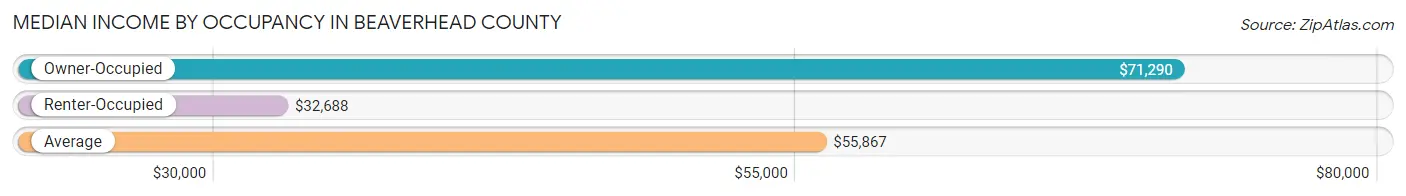
| Occupancy Type | # Households | Median Income |
| Owner-Occupied | 2,728 (66.4%) | $71,290 |
| Renter-Occupied | 1,379 (33.6%) | $32,688 |
| Average | 4,107 (100.0%) | $55,867 |
Occupancy by Householder Income Bracket in Beaverhead County
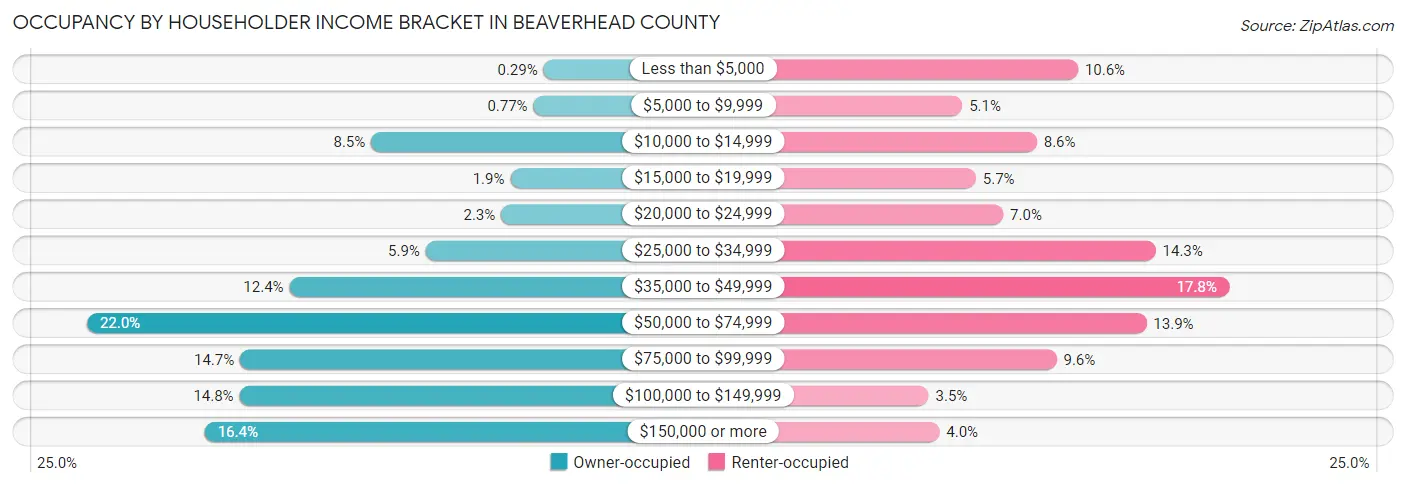
| Income Bracket | Owner-occupied | Renter-occupied |
| Less than $5,000 | 8 (0.3%) | 146 (10.6%) |
| $5,000 to $9,999 | 21 (0.8%) | 70 (5.1%) |
| $10,000 to $14,999 | 232 (8.5%) | 119 (8.6%) |
| $15,000 to $19,999 | 51 (1.9%) | 79 (5.7%) |
| $20,000 to $24,999 | 63 (2.3%) | 97 (7.0%) |
| $25,000 to $34,999 | 161 (5.9%) | 197 (14.3%) |
| $35,000 to $49,999 | 338 (12.4%) | 245 (17.8%) |
| $50,000 to $74,999 | 601 (22.0%) | 191 (13.9%) |
| $75,000 to $99,999 | 402 (14.7%) | 132 (9.6%) |
| $100,000 to $149,999 | 403 (14.8%) | 48 (3.5%) |
| $150,000 or more | 448 (16.4%) | 55 (4.0%) |
| Total | 2,728 (100.0%) | 1,379 (100.0%) |
Monthly Housing Cost Tiers in Beaverhead County
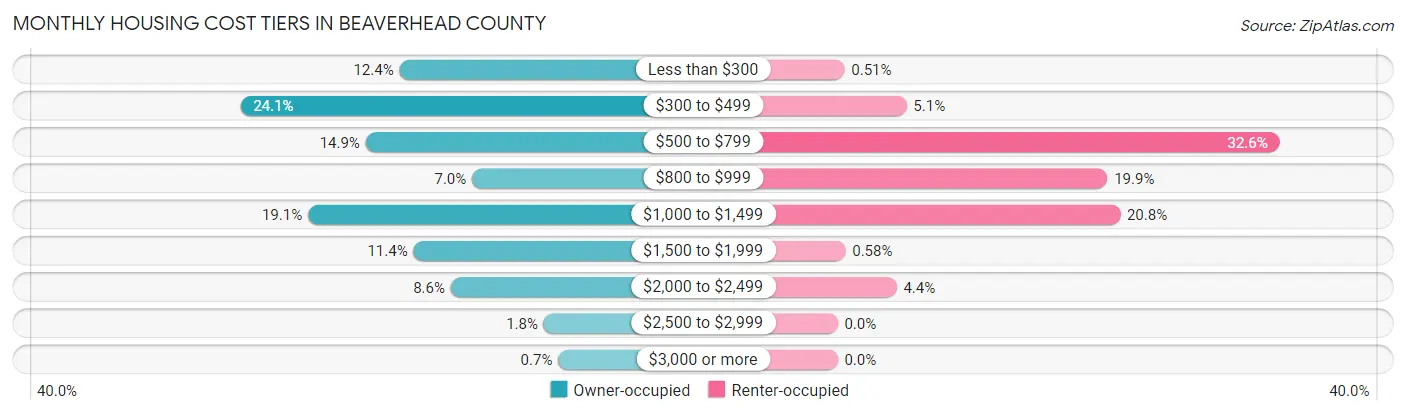
| Monthly Cost | Owner-occupied | Renter-occupied |
| Less than $300 | 338 (12.4%) | 7 (0.5%) |
| $300 to $499 | 658 (24.1%) | 70 (5.1%) |
| $500 to $799 | 406 (14.9%) | 449 (32.6%) |
| $800 to $999 | 192 (7.0%) | 274 (19.9%) |
| $1,000 to $1,499 | 522 (19.1%) | 287 (20.8%) |
| $1,500 to $1,999 | 310 (11.4%) | 8 (0.6%) |
| $2,000 to $2,499 | 235 (8.6%) | 60 (4.3%) |
| $2,500 to $2,999 | 48 (1.8%) | 0 (0.0%) |
| $3,000 or more | 19 (0.7%) | 0 (0.0%) |
| Total | 2,728 (100.0%) | 1,379 (100.0%) |
Physical Housing Characteristics in Beaverhead County
Housing Structures in Beaverhead County
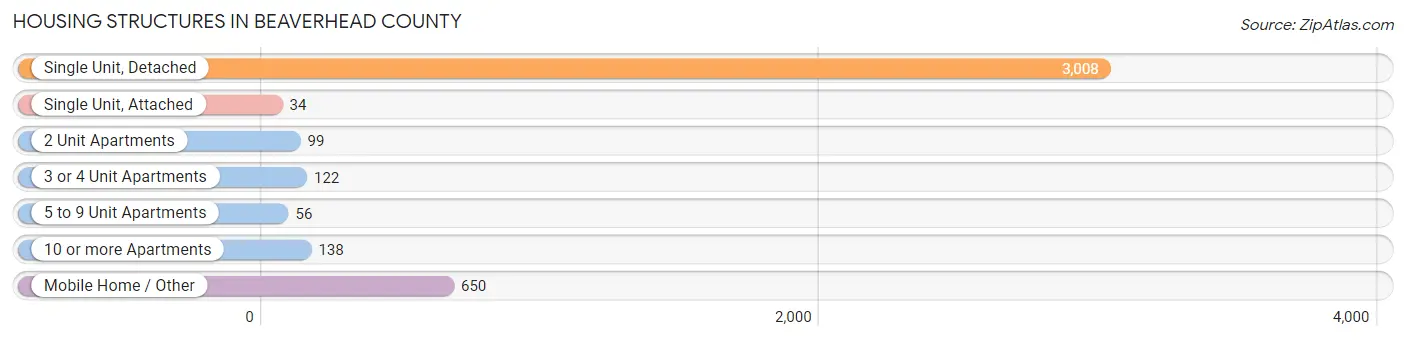
| Structure Type | # Housing Units | % Housing Units |
| Single Unit, Detached | 3,008 | 73.2% |
| Single Unit, Attached | 34 | 0.8% |
| 2 Unit Apartments | 99 | 2.4% |
| 3 or 4 Unit Apartments | 122 | 3.0% |
| 5 to 9 Unit Apartments | 56 | 1.4% |
| 10 or more Apartments | 138 | 3.4% |
| Mobile Home / Other | 650 | 15.8% |
| Total | 4,107 | 100.0% |
Housing Structures by Occupancy in Beaverhead County
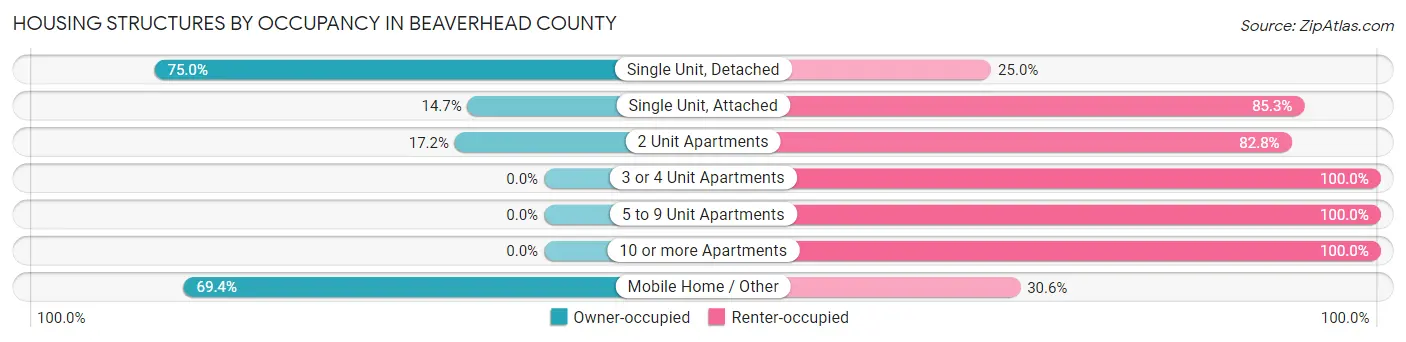
| Structure Type | Owner-occupied | Renter-occupied |
| Single Unit, Detached | 2,255 (75.0%) | 753 (25.0%) |
| Single Unit, Attached | 5 (14.7%) | 29 (85.3%) |
| 2 Unit Apartments | 17 (17.2%) | 82 (82.8%) |
| 3 or 4 Unit Apartments | 0 (0.0%) | 122 (100.0%) |
| 5 to 9 Unit Apartments | 0 (0.0%) | 56 (100.0%) |
| 10 or more Apartments | 0 (0.0%) | 138 (100.0%) |
| Mobile Home / Other | 451 (69.4%) | 199 (30.6%) |
| Total | 2,728 (66.4%) | 1,379 (33.6%) |
Housing Structures by Number of Rooms in Beaverhead County
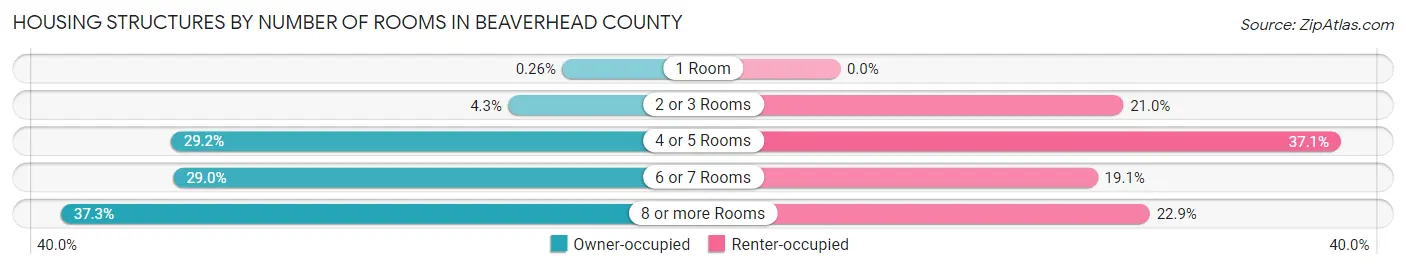
| Number of Rooms | Owner-occupied | Renter-occupied |
| 1 Room | 7 (0.3%) | 0 (0.0%) |
| 2 or 3 Rooms | 116 (4.3%) | 289 (21.0%) |
| 4 or 5 Rooms | 796 (29.2%) | 511 (37.1%) |
| 6 or 7 Rooms | 791 (29.0%) | 263 (19.1%) |
| 8 or more Rooms | 1,018 (37.3%) | 316 (22.9%) |
| Total | 2,728 (100.0%) | 1,379 (100.0%) |
Housing Structure by Heating Type in Beaverhead County
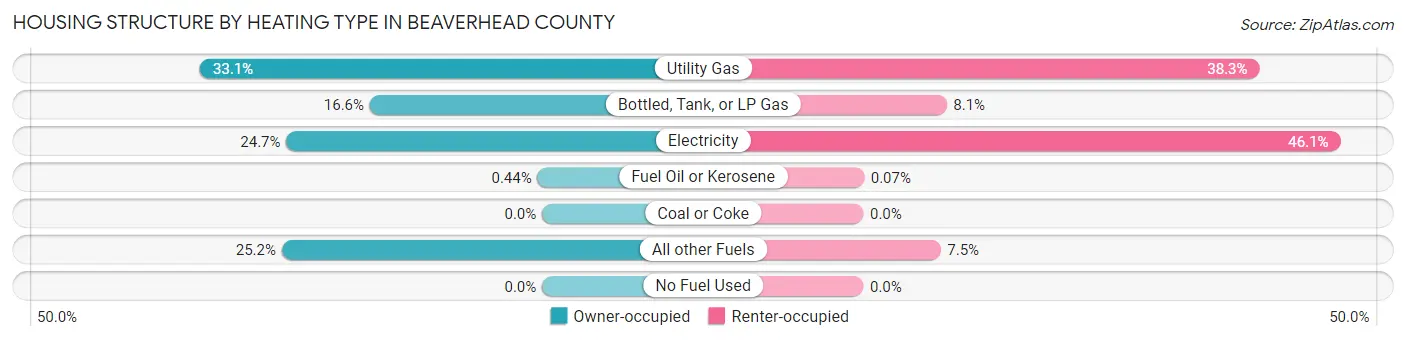
| Heating Type | Owner-occupied | Renter-occupied |
| Utility Gas | 902 (33.1%) | 528 (38.3%) |
| Bottled, Tank, or LP Gas | 454 (16.6%) | 111 (8.1%) |
| Electricity | 674 (24.7%) | 636 (46.1%) |
| Fuel Oil or Kerosene | 12 (0.4%) | 1 (0.1%) |
| Coal or Coke | 0 (0.0%) | 0 (0.0%) |
| All other Fuels | 686 (25.2%) | 103 (7.5%) |
| No Fuel Used | 0 (0.0%) | 0 (0.0%) |
| Total | 2,728 (100.0%) | 1,379 (100.0%) |
Household Vehicle Usage in Beaverhead County
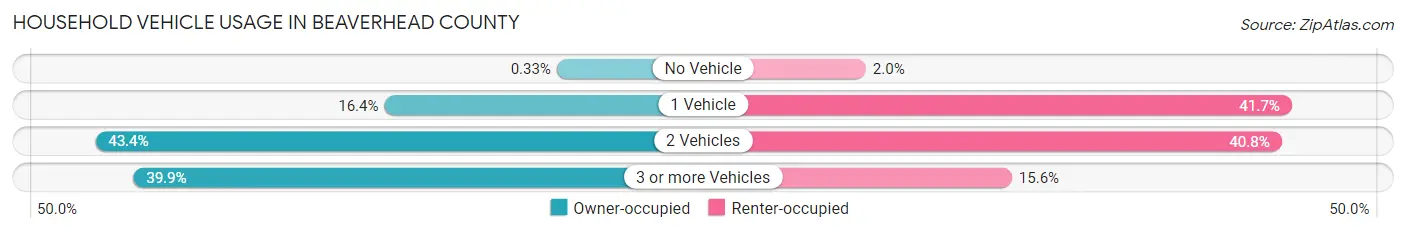
| Vehicles per Household | Owner-occupied | Renter-occupied |
| No Vehicle | 9 (0.3%) | 27 (2.0%) |
| 1 Vehicle | 448 (16.4%) | 575 (41.7%) |
| 2 Vehicles | 1,184 (43.4%) | 562 (40.7%) |
| 3 or more Vehicles | 1,087 (39.9%) | 215 (15.6%) |
| Total | 2,728 (100.0%) | 1,379 (100.0%) |
Real Estate & Mortgages in Beaverhead County
Real Estate and Mortgage Overview in Beaverhead County
| Characteristic | Without Mortgage | With Mortgage |
| Housing Units | 1,435 | 1,293 |
| Median Property Value | $260,800 | $298,200 |
| Median Household Income | $52,788 | $343 |
| Monthly Housing Costs | $435 | $19 |
| Real Estate Taxes | $1,654 | $35 |
Property Value by Mortgage Status in Beaverhead County
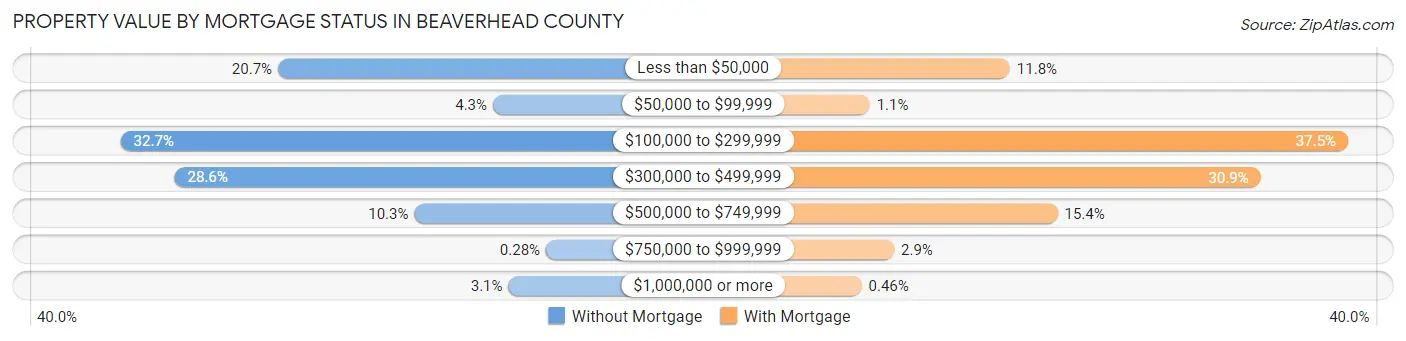
| Property Value | Without Mortgage | With Mortgage |
| Less than $50,000 | 297 (20.7%) | 152 (11.8%) |
| $50,000 to $99,999 | 62 (4.3%) | 14 (1.1%) |
| $100,000 to $299,999 | 469 (32.7%) | 485 (37.5%) |
| $300,000 to $499,999 | 410 (28.6%) | 399 (30.9%) |
| $500,000 to $749,999 | 148 (10.3%) | 199 (15.4%) |
| $750,000 to $999,999 | 4 (0.3%) | 38 (2.9%) |
| $1,000,000 or more | 45 (3.1%) | 6 (0.5%) |
| Total | 1,435 (100.0%) | 1,293 (100.0%) |
Household Income by Mortgage Status in Beaverhead County
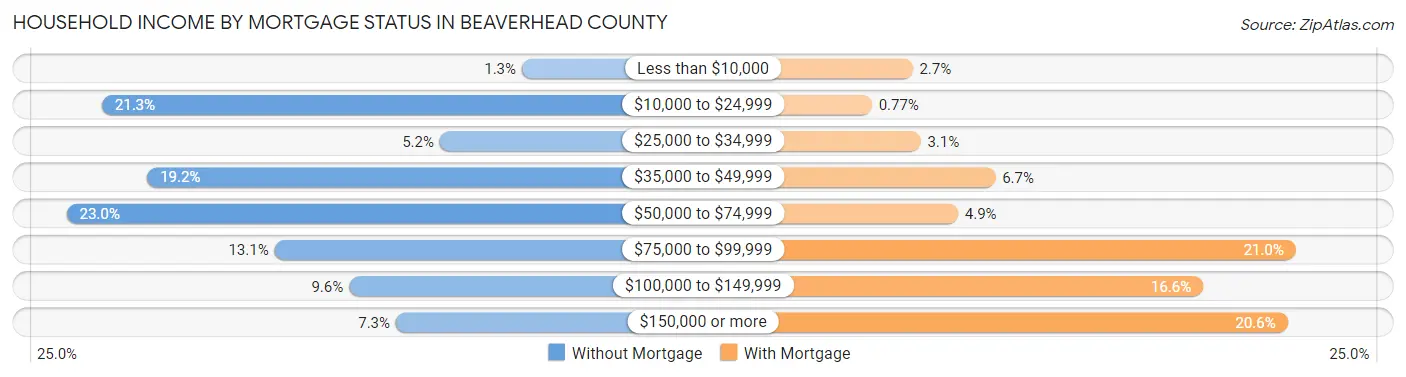
| Household Income | Without Mortgage | With Mortgage |
| Less than $10,000 | 19 (1.3%) | 35 (2.7%) |
| $10,000 to $24,999 | 306 (21.3%) | 10 (0.8%) |
| $25,000 to $34,999 | 75 (5.2%) | 40 (3.1%) |
| $35,000 to $49,999 | 275 (19.2%) | 86 (6.7%) |
| $50,000 to $74,999 | 330 (23.0%) | 63 (4.9%) |
| $75,000 to $99,999 | 188 (13.1%) | 271 (21.0%) |
| $100,000 to $149,999 | 137 (9.6%) | 214 (16.6%) |
| $150,000 or more | 105 (7.3%) | 266 (20.6%) |
| Total | 1,435 (100.0%) | 1,293 (100.0%) |
Property Value to Household Income Ratio in Beaverhead County
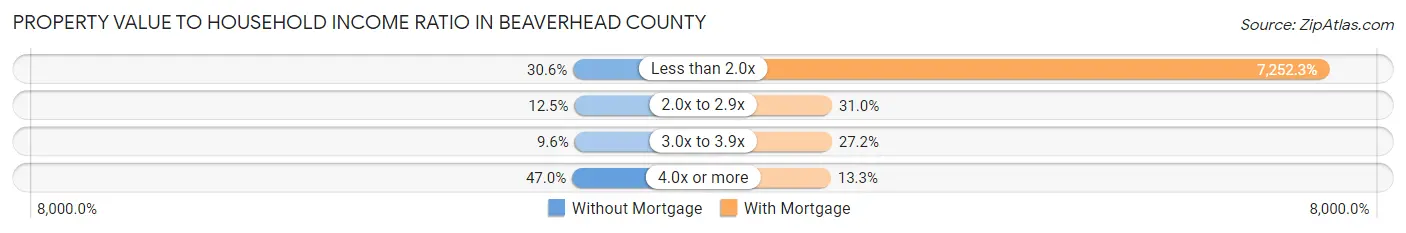
| Value-to-Income Ratio | Without Mortgage | With Mortgage |
| Less than 2.0x | 439 (30.6%) | 93,772 (7,252.3%) |
| 2.0x to 2.9x | 179 (12.5%) | 401 (31.0%) |
| 3.0x to 3.9x | 137 (9.6%) | 352 (27.2%) |
| 4.0x or more | 675 (47.0%) | 172 (13.3%) |
| Total | 1,435 (100.0%) | 1,293 (100.0%) |
Real Estate Taxes by Mortgage Status in Beaverhead County
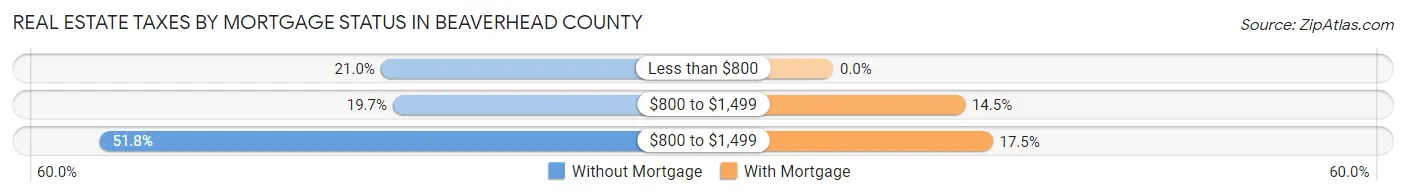
| Property Taxes | Without Mortgage | With Mortgage |
| Less than $800 | 301 (21.0%) | 0 (0.0%) |
| $800 to $1,499 | 282 (19.7%) | 187 (14.5%) |
| $800 to $1,499 | 743 (51.8%) | 226 (17.5%) |
| Total | 1,435 (100.0%) | 1,293 (100.0%) |
Health & Disability in Beaverhead County
Health Insurance Coverage by Age in Beaverhead County
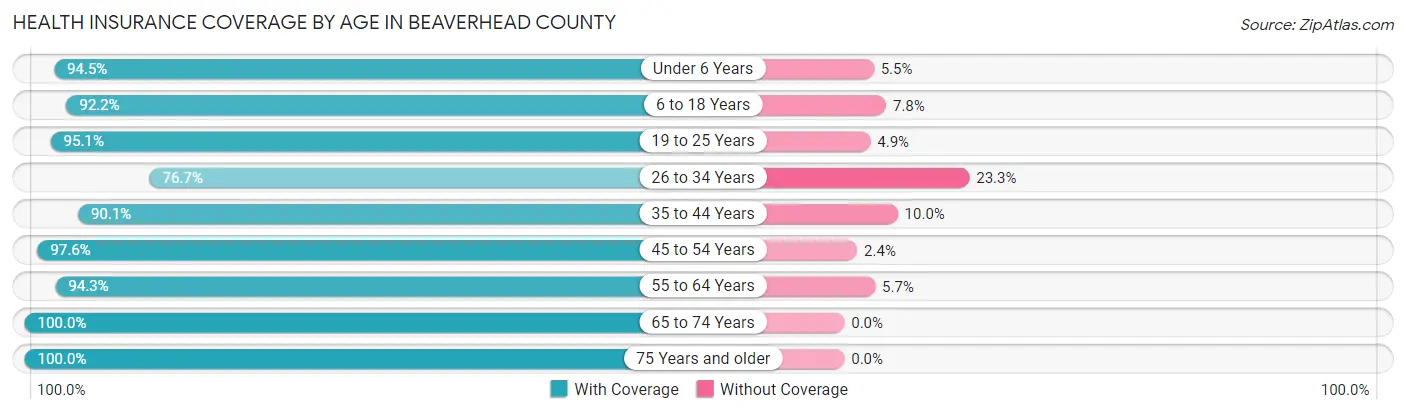
| Age Bracket | With Coverage | Without Coverage |
| Under 6 Years | 431 (94.5%) | 25 (5.5%) |
| 6 to 18 Years | 1,090 (92.2%) | 92 (7.8%) |
| 19 to 25 Years | 1,195 (95.1%) | 61 (4.9%) |
| 26 to 34 Years | 750 (76.7%) | 228 (23.3%) |
| 35 to 44 Years | 941 (90.0%) | 104 (10.0%) |
| 45 to 54 Years | 895 (97.6%) | 22 (2.4%) |
| 55 to 64 Years | 1,248 (94.3%) | 76 (5.7%) |
| 65 to 74 Years | 1,281 (100.0%) | 0 (0.0%) |
| 75 Years and older | 844 (100.0%) | 0 (0.0%) |
| Total | 8,675 (93.4%) | 608 (6.6%) |
Health Insurance Coverage by Citizenship Status in Beaverhead County
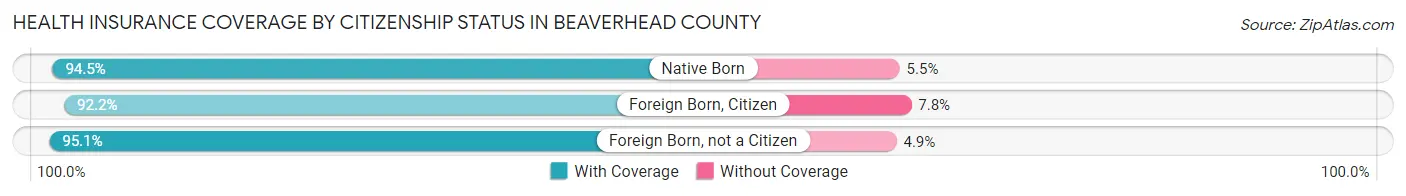
| Citizenship Status | With Coverage | Without Coverage |
| Native Born | 431 (94.5%) | 25 (5.5%) |
| Foreign Born, Citizen | 1,090 (92.2%) | 92 (7.8%) |
| Foreign Born, not a Citizen | 1,195 (95.1%) | 61 (4.9%) |
Health Insurance Coverage by Household Income in Beaverhead County
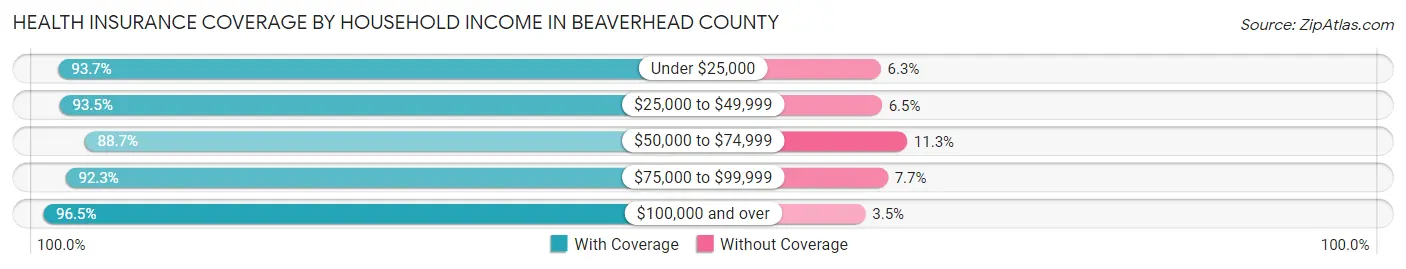
| Household Income | With Coverage | Without Coverage |
| Under $25,000 | 1,242 (93.7%) | 84 (6.3%) |
| $25,000 to $49,999 | 1,800 (93.5%) | 126 (6.5%) |
| $50,000 to $74,999 | 1,426 (88.7%) | 181 (11.3%) |
| $75,000 to $99,999 | 1,254 (92.3%) | 104 (7.7%) |
| $100,000 and over | 2,613 (96.5%) | 94 (3.5%) |
Public vs Private Health Insurance Coverage by Age in Beaverhead County
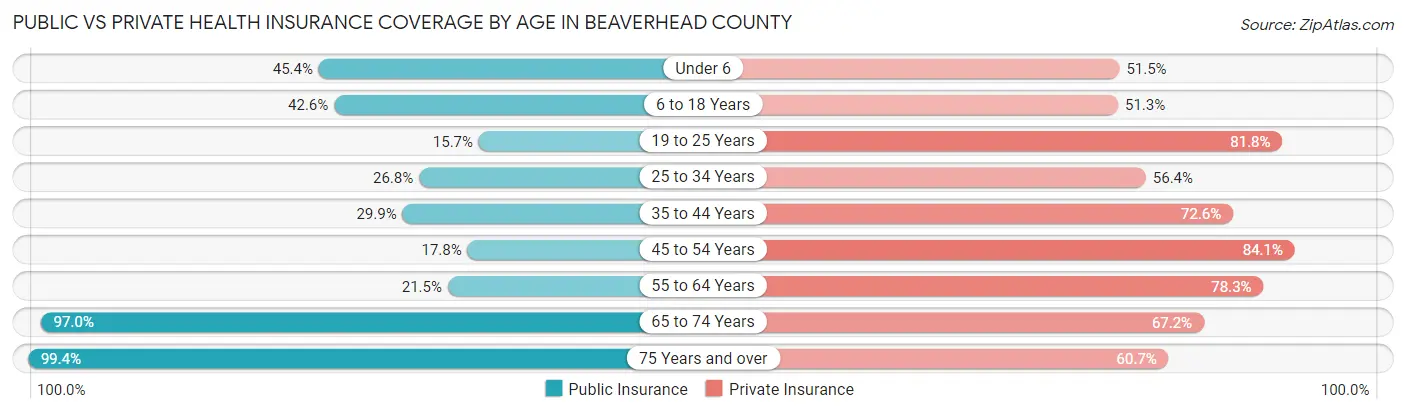
| Age Bracket | Public Insurance | Private Insurance |
| Under 6 | 207 (45.4%) | 235 (51.5%) |
| 6 to 18 Years | 503 (42.5%) | 606 (51.3%) |
| 19 to 25 Years | 197 (15.7%) | 1,027 (81.8%) |
| 25 to 34 Years | 262 (26.8%) | 552 (56.4%) |
| 35 to 44 Years | 312 (29.9%) | 759 (72.6%) |
| 45 to 54 Years | 163 (17.8%) | 771 (84.1%) |
| 55 to 64 Years | 284 (21.4%) | 1,036 (78.2%) |
| 65 to 74 Years | 1,243 (97.0%) | 861 (67.2%) |
| 75 Years and over | 839 (99.4%) | 512 (60.7%) |
| Total | 4,010 (43.2%) | 6,359 (68.5%) |
Disability Status by Sex by Age in Beaverhead County
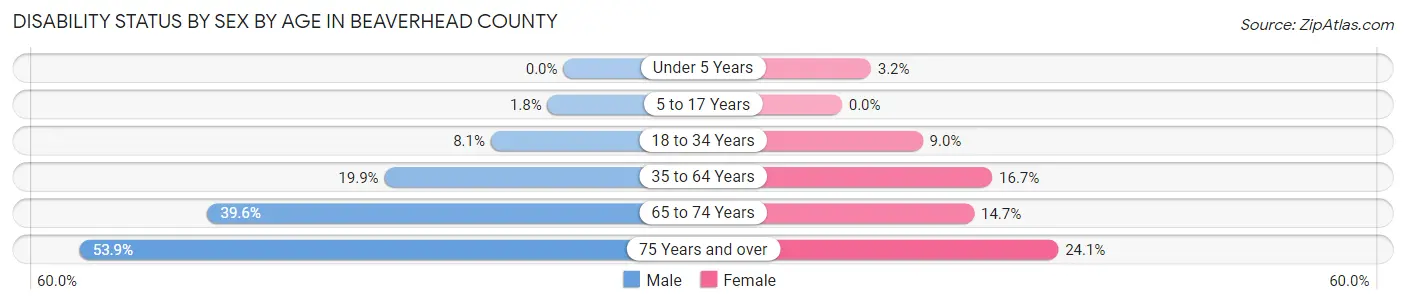
| Age Bracket | Male | Female |
| Under 5 Years | 0 (0.0%) | 6 (3.2%) |
| 5 to 17 Years | 10 (1.8%) | 0 (0.0%) |
| 18 to 34 Years | 98 (8.1%) | 101 (9.0%) |
| 35 to 64 Years | 331 (19.9%) | 272 (16.7%) |
| 65 to 74 Years | 252 (39.6%) | 95 (14.7%) |
| 75 Years and over | 231 (53.8%) | 100 (24.1%) |
Disability Class by Sex by Age in Beaverhead County
Disability Class: Hearing Difficulty
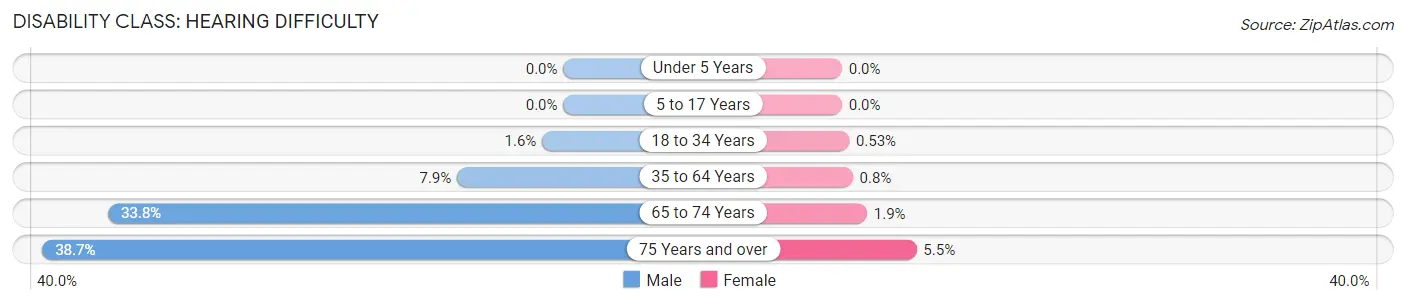
| Age Bracket | Male | Female |
| Under 5 Years | 0 (0.0%) | 0 (0.0%) |
| 5 to 17 Years | 0 (0.0%) | 0 (0.0%) |
| 18 to 34 Years | 19 (1.6%) | 6 (0.5%) |
| 35 to 64 Years | 131 (7.9%) | 13 (0.8%) |
| 65 to 74 Years | 215 (33.8%) | 12 (1.9%) |
| 75 Years and over | 166 (38.7%) | 23 (5.5%) |
Disability Class: Vision Difficulty
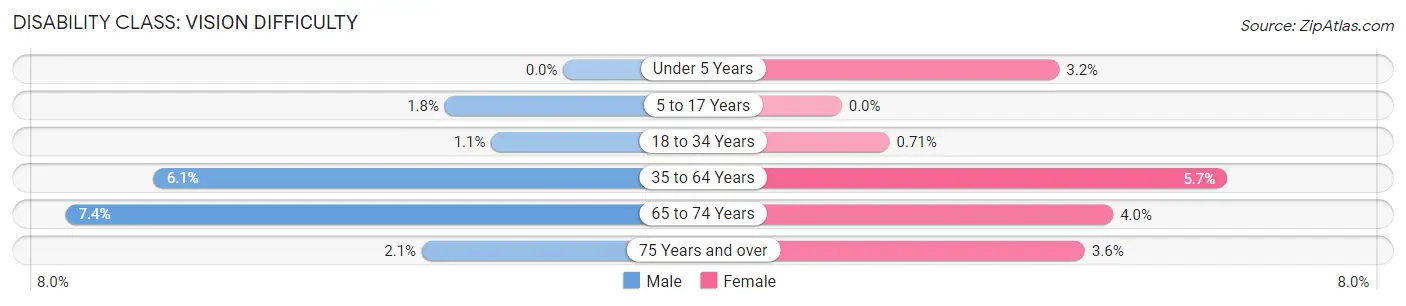
| Age Bracket | Male | Female |
| Under 5 Years | 0 (0.0%) | 6 (3.2%) |
| 5 to 17 Years | 10 (1.8%) | 0 (0.0%) |
| 18 to 34 Years | 13 (1.1%) | 8 (0.7%) |
| 35 to 64 Years | 101 (6.1%) | 93 (5.7%) |
| 65 to 74 Years | 47 (7.4%) | 26 (4.0%) |
| 75 Years and over | 9 (2.1%) | 15 (3.6%) |
Disability Class: Cognitive Difficulty
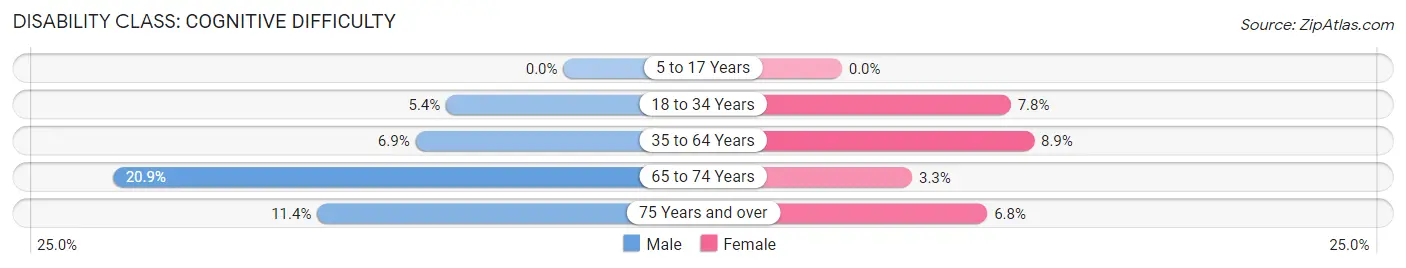
| Age Bracket | Male | Female |
| 5 to 17 Years | 0 (0.0%) | 0 (0.0%) |
| 18 to 34 Years | 66 (5.4%) | 88 (7.8%) |
| 35 to 64 Years | 114 (6.9%) | 145 (8.9%) |
| 65 to 74 Years | 133 (20.9%) | 21 (3.3%) |
| 75 Years and over | 49 (11.4%) | 28 (6.8%) |
Disability Class: Ambulatory Difficulty
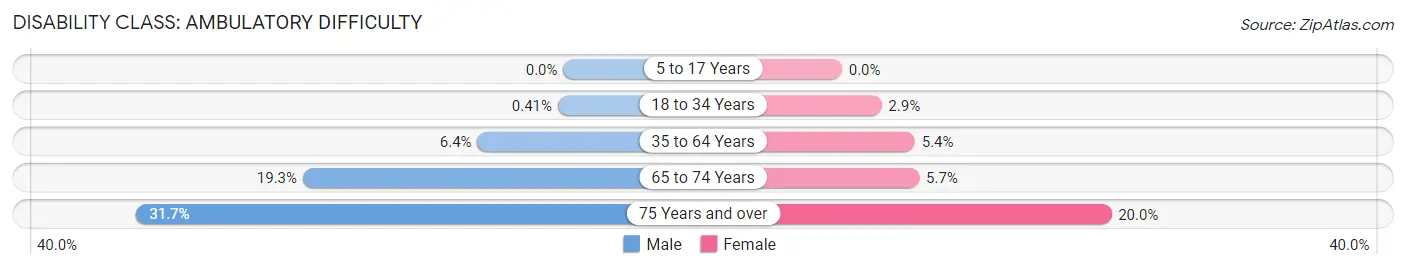
| Age Bracket | Male | Female |
| 5 to 17 Years | 0 (0.0%) | 0 (0.0%) |
| 18 to 34 Years | 5 (0.4%) | 33 (2.9%) |
| 35 to 64 Years | 106 (6.4%) | 88 (5.4%) |
| 65 to 74 Years | 123 (19.3%) | 37 (5.7%) |
| 75 Years and over | 136 (31.7%) | 83 (20.0%) |
Disability Class: Self-Care Difficulty
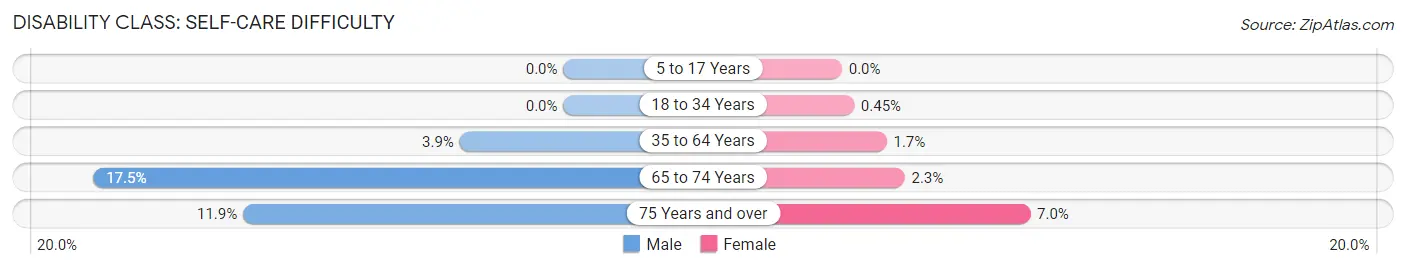
| Age Bracket | Male | Female |
| 5 to 17 Years | 0 (0.0%) | 0 (0.0%) |
| 18 to 34 Years | 0 (0.0%) | 5 (0.4%) |
| 35 to 64 Years | 64 (3.8%) | 27 (1.7%) |
| 65 to 74 Years | 111 (17.4%) | 15 (2.3%) |
| 75 Years and over | 51 (11.9%) | 29 (7.0%) |
Technology Access in Beaverhead County
Computing Device Access in Beaverhead County
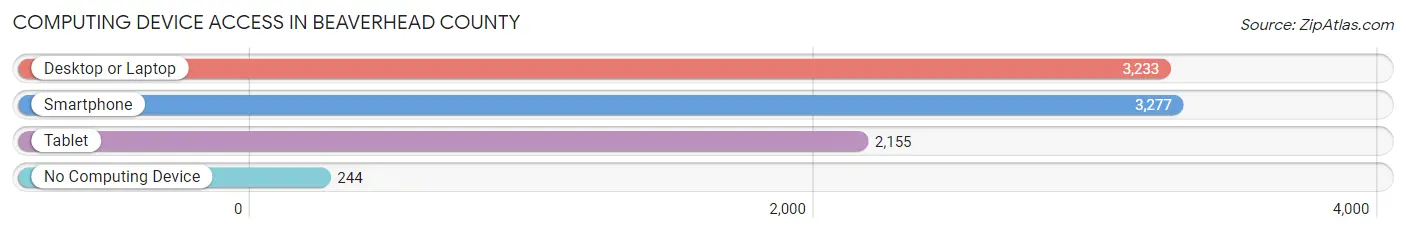
| Device Type | # Households | % Households |
| Desktop or Laptop | 3,233 | 78.7% |
| Smartphone | 3,277 | 79.8% |
| Tablet | 2,155 | 52.5% |
| No Computing Device | 244 | 5.9% |
| Total | 4,107 | 100.0% |
Internet Access in Beaverhead County
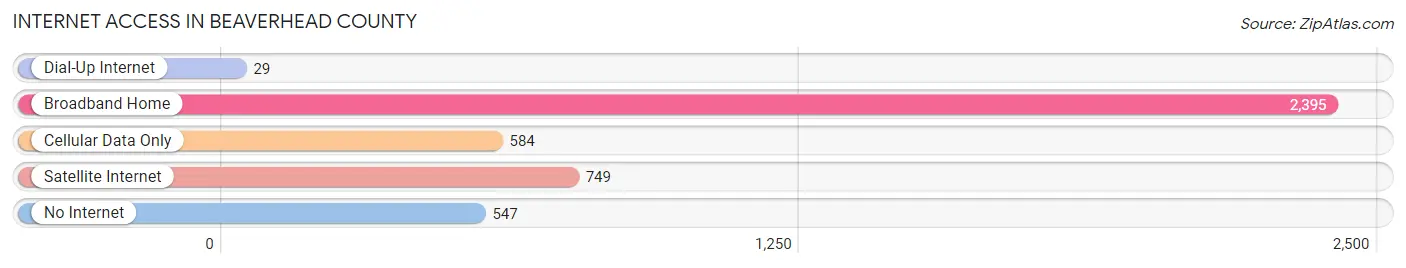
| Internet Type | # Households | % Households |
| Dial-Up Internet | 29 | 0.7% |
| Broadband Home | 2,395 | 58.3% |
| Cellular Data Only | 584 | 14.2% |
| Satellite Internet | 749 | 18.2% |
| No Internet | 547 | 13.3% |
| Total | 4,107 | 100.0% |
Beaverhead County Summary
Beaverhead County is located in the southwestern corner of Montana, and is the largest county in the state. It is bordered by Madison County to the north, Gallatin County to the east, and Idaho to the west. The county seat is Dillon, and the county is named after the Beaverhead River, which flows through the county.
Geography
Beaverhead County covers an area of 5,539 square miles, making it the largest county in Montana. The county is located in the Rocky Mountains, and is home to several mountain ranges, including the Beaverhead, Big Hole, and Pioneer Mountains. The highest point in the county is Mount Jefferson, which has an elevation of 10,154 feet. The county is also home to several rivers, including the Beaverhead, Big Hole, and Jefferson Rivers.
The county is mostly rural, with the majority of the population living in small towns and rural areas. The largest city in the county is Dillon, which has a population of 4,200. Other towns in the county include Lima, Wisdom, and Melrose.
Economy
Beaverhead County has a diverse economy, with the largest industries being agriculture, tourism, and mining. Agriculture is the largest industry in the county, with the majority of the land being used for cattle and sheep ranching. Tourism is also an important part of the economy, with many people visiting the area for its outdoor recreation opportunities. Mining is also an important industry in the county, with copper, gold, and silver being mined in the area.
Demographics
As of the 2010 census, Beaverhead County had a population of 9,246. The population is mostly white, with 91.3% of the population being white, 4.2% being Native American, and 2.2% being Hispanic or Latino. The median household income in the county is $41,945, and the median home value is $164,400.
The county is home to several higher education institutions, including Montana State University-Dillon, which is located in Dillon. The county also has several public schools, including Beaverhead County High School, which is located in Dillon.
Beaverhead County is a rural county with a diverse economy and a population that is mostly white. The county is home to several higher education institutions and public schools, and is a popular destination for outdoor recreation. The county is also home to several mining operations, and is an important part of the Montana economy.
Common Questions
What is Per Capita Income in Beaverhead County?
Per Capita income in Beaverhead County is $34,640.
What is the Median Family Income in Beaverhead County?
Median Family Income in Beaverhead County is $74,615.
What is the Median Household income in Beaverhead County?
Median Household Income in Beaverhead County is $55,867.
What is Income or Wage Gap in Beaverhead County?
Income or Wage Gap in Beaverhead County is 18.0%.
Women in Beaverhead County earn 82.0 cents for every dollar earned by a man.
What is Family Income Deficit in Beaverhead County?
Family Income Deficit in Beaverhead County is $5,285.
Families that are below poverty line in Beaverhead County earn $5,285 less on average than the poverty threshold level.
What is Inequality or Gini Index in Beaverhead County?
Inequality or Gini Index in Beaverhead County is 0.47.
What is the Total Population of Beaverhead County?
Total Population of Beaverhead County is 9,469.
What is the Total Male Population of Beaverhead County?
Total Male Population of Beaverhead County is 4,829.
What is the Total Female Population of Beaverhead County?
Total Female Population of Beaverhead County is 4,640.
What is the Ratio of Males per 100 Females in Beaverhead County?
There are 104.07 Males per 100 Females in Beaverhead County.
What is the Ratio of Females per 100 Males in Beaverhead County?
There are 96.09 Females per 100 Males in Beaverhead County.
What is the Median Population Age in Beaverhead County?
Median Population Age in Beaverhead County is 42.3 Years.
What is the Average Family Size in Beaverhead County
Average Family Size in Beaverhead County is 2.9 People.
What is the Average Household Size in Beaverhead County
Average Household Size in Beaverhead County is 2.2 People.
How Large is the Labor Force in Beaverhead County?
There are 4,732 People in the Labor Forcein in Beaverhead County.
What is the Percentage of People in the Labor Force in Beaverhead County?
58.2% of People are in the Labor Force in Beaverhead County.
What is the Unemployment Rate in Beaverhead County?
Unemployment Rate in Beaverhead County is 2.8%.