Yellowstone County, MT Map & Demographics
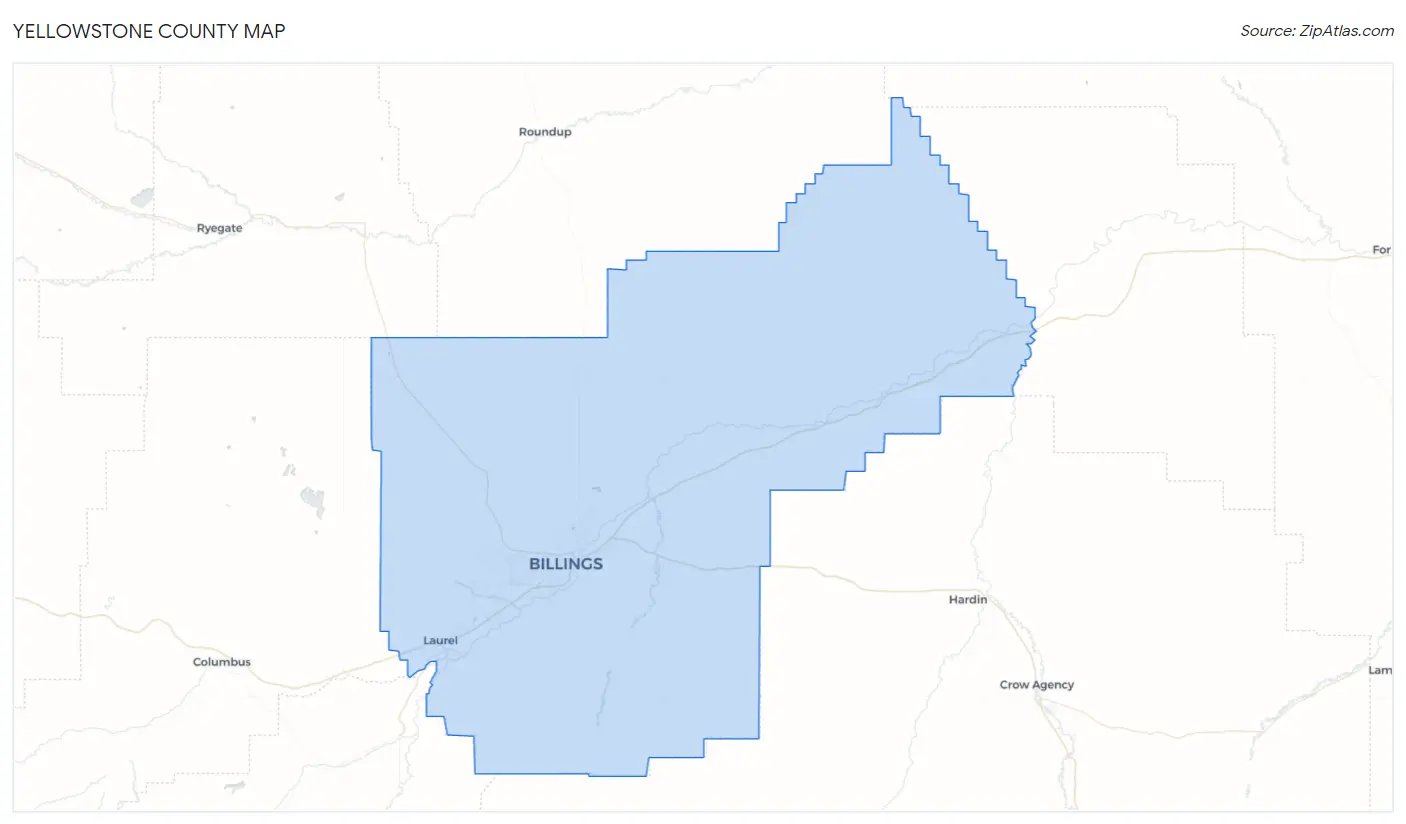
Yellowstone County Map
Yellowstone County Overview
$40,978
PER CAPITA INCOME
$92,083
AVG FAMILY INCOME
$72,300
AVG HOUSEHOLD INCOME
31.6%
WAGE / INCOME GAP [ % ]
68.4¢/ $1
WAGE / INCOME GAP [ $ ]
$9,603
FAMILY INCOME DEFICIT
0.46
INEQUALITY / GINI INDEX
165,524
TOTAL POPULATION
82,077
MALE POPULATION
83,447
FEMALE POPULATION
98.36
MALES / 100 FEMALES
101.67
FEMALES / 100 MALES
38.4
MEDIAN AGE
3.0
AVG FAMILY SIZE
2.4
AVG HOUSEHOLD SIZE
87,209
LABOR FORCE [ PEOPLE ]
66.2%
PERCENT IN LABOR FORCE
3.5%
UNEMPLOYMENT RATE
Yellowstone County Area Codes
Income in Yellowstone County
Income Overview in Yellowstone County
Per Capita Income in Yellowstone County is $40,978, while median incomes of families and households are $92,083 and $72,300 respectively.
| Characteristic | Number | Measure |
| Per Capita Income | 165,524 | $40,978 |
| Median Family Income | 41,672 | $92,083 |
| Mean Family Income | 41,672 | $120,745 |
| Median Household Income | 67,897 | $72,300 |
| Mean Household Income | 67,897 | $98,192 |
| Income Deficit | 41,672 | $9,603 |
| Wage / Income Gap (%) | 165,524 | 31.56% |
| Wage / Income Gap ($) | 165,524 | 68.44¢ per $1 |
| Gini / Inequality Index | 165,524 | 0.46 |
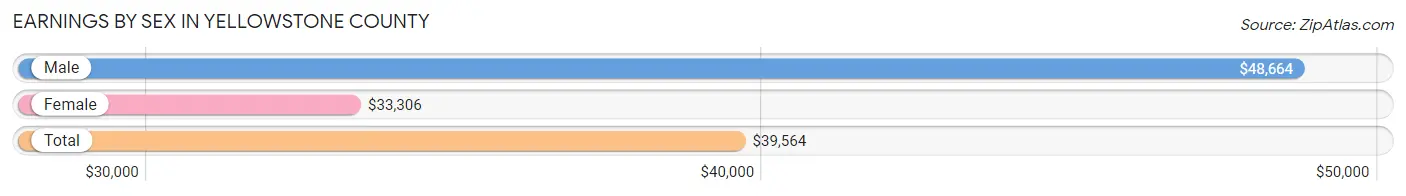
Earnings by Sex in Yellowstone County
Average Earnings in Yellowstone County are $39,564, $48,664 for men and $33,306 for women, a difference of 31.6%.
| Sex | Number | Average Earnings |
| Male | 48,632 (52.2%) | $48,664 |
| Female | 44,558 (47.8%) | $33,306 |
| Total | 93,190 (100.0%) | $39,564 |
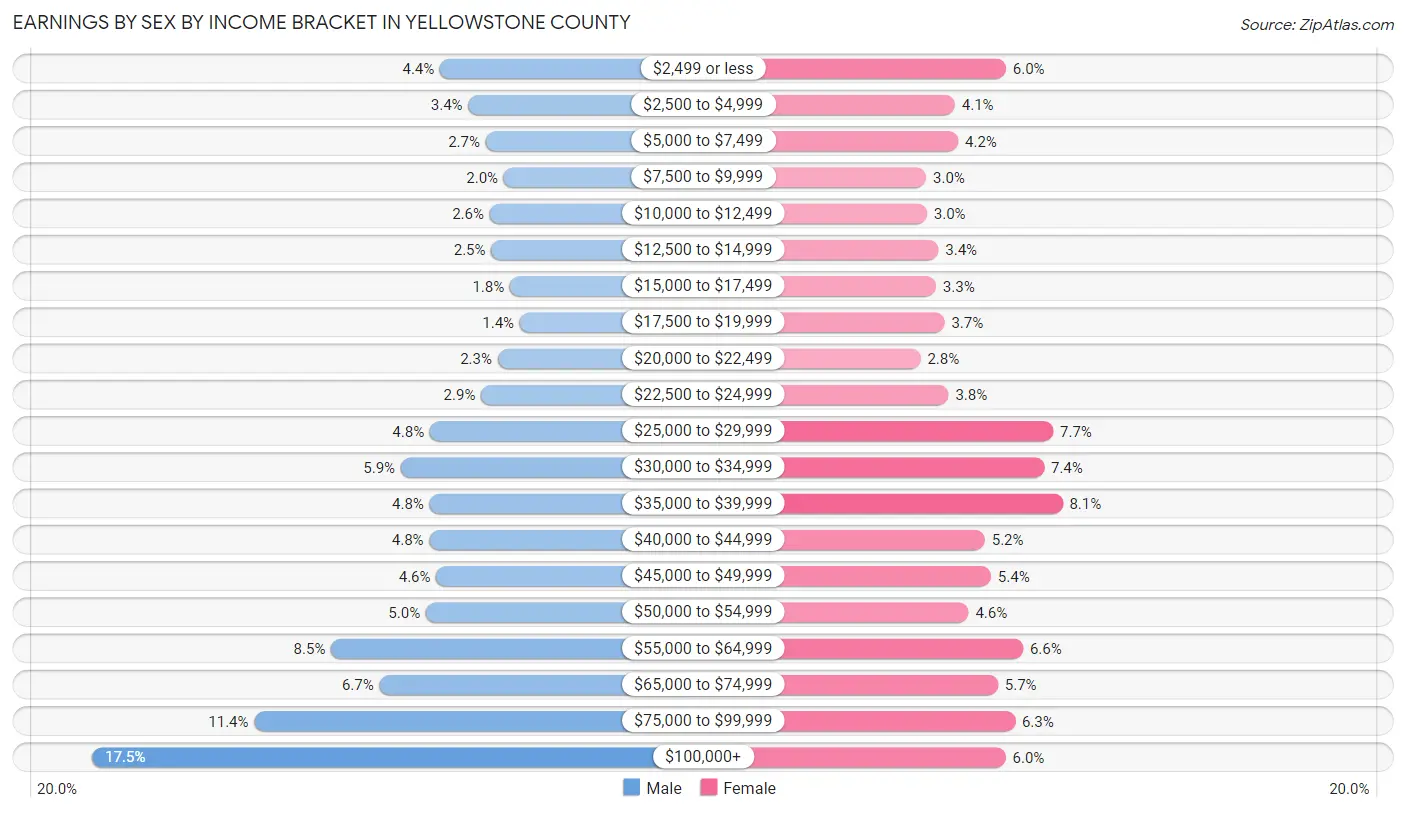
Earnings by Sex by Income Bracket in Yellowstone County
The most common earnings brackets in Yellowstone County are $100,000+ for men (8,495 | 17.5%) and $35,000 to $39,999 for women (3,601 | 8.1%).
| Income | Male | Female |
| $2,499 or less | 2,154 (4.4%) | 2,657 (6.0%) |
| $2,500 to $4,999 | 1,638 (3.4%) | 1,806 (4.1%) |
| $5,000 to $7,499 | 1,322 (2.7%) | 1,859 (4.2%) |
| $7,500 to $9,999 | 991 (2.0%) | 1,322 (3.0%) |
| $10,000 to $12,499 | 1,249 (2.6%) | 1,338 (3.0%) |
| $12,500 to $14,999 | 1,222 (2.5%) | 1,530 (3.4%) |
| $15,000 to $17,499 | 880 (1.8%) | 1,489 (3.3%) |
| $17,500 to $19,999 | 701 (1.4%) | 1,630 (3.7%) |
| $20,000 to $22,499 | 1,105 (2.3%) | 1,232 (2.8%) |
| $22,500 to $24,999 | 1,406 (2.9%) | 1,699 (3.8%) |
| $25,000 to $29,999 | 2,338 (4.8%) | 3,444 (7.7%) |
| $30,000 to $34,999 | 2,867 (5.9%) | 3,292 (7.4%) |
| $35,000 to $39,999 | 2,346 (4.8%) | 3,601 (8.1%) |
| $40,000 to $44,999 | 2,349 (4.8%) | 2,305 (5.2%) |
| $45,000 to $49,999 | 2,222 (4.6%) | 2,407 (5.4%) |
| $50,000 to $54,999 | 2,410 (5.0%) | 2,031 (4.6%) |
| $55,000 to $64,999 | 4,140 (8.5%) | 2,940 (6.6%) |
| $65,000 to $74,999 | 3,256 (6.7%) | 2,520 (5.7%) |
| $75,000 to $99,999 | 5,541 (11.4%) | 2,807 (6.3%) |
| $100,000+ | 8,495 (17.5%) | 2,649 (5.9%) |
| Total | 48,632 (100.0%) | 44,558 (100.0%) |
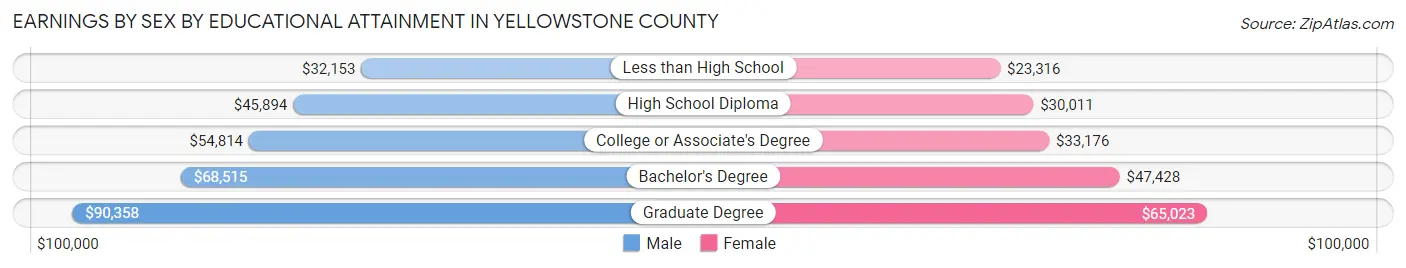
Earnings by Sex by Educational Attainment in Yellowstone County
Average earnings in Yellowstone County are $55,672 for men and $37,500 for women, a difference of 32.6%. Men with an educational attainment of graduate degree enjoy the highest average annual earnings of $90,358, while those with less than high school education earn the least with $32,153. Women with an educational attainment of graduate degree earn the most with the average annual earnings of $65,023, while those with less than high school education have the smallest earnings of $23,316.
| Educational Attainment | Male Income | Female Income |
| Less than High School | $32,153 | $23,316 |
| High School Diploma | $45,894 | $30,011 |
| College or Associate's Degree | $54,814 | $33,176 |
| Bachelor's Degree | $68,515 | $47,428 |
| Graduate Degree | $90,358 | $65,023 |
| Total | $55,672 | $37,500 |
Family Income in Yellowstone County
Family Income Brackets in Yellowstone County
According to the Yellowstone County family income data, there are 9,293 families falling into the $100,000 to $149,999 income range, which is the most common income bracket and makes up 22.3% of all families. Conversely, the $10,000 to $14,999 income bracket is the least frequent group with only 750 families (1.8%) belonging to this category.
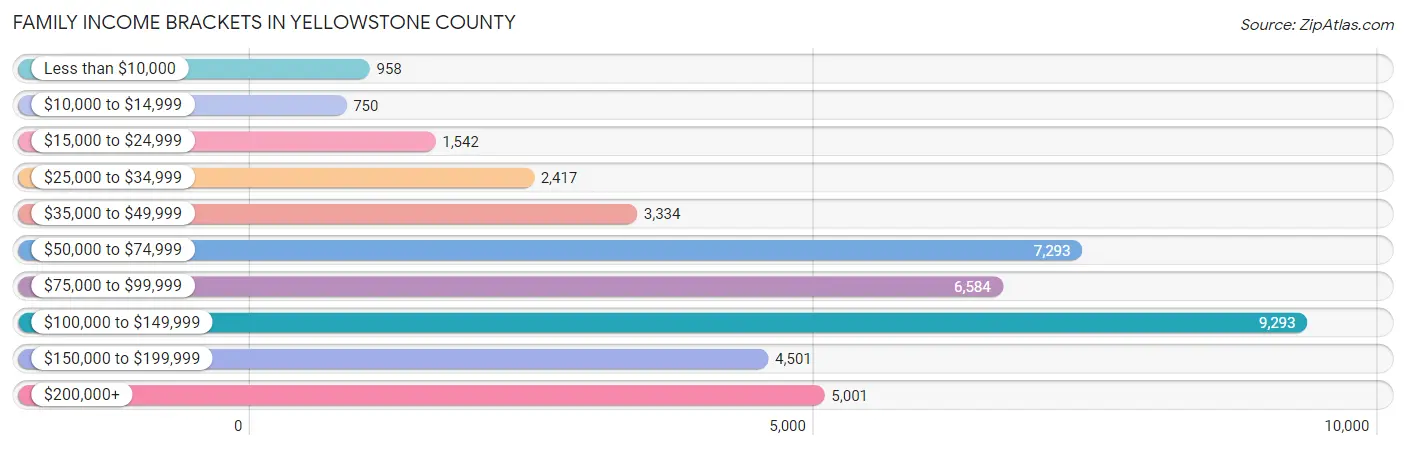
| Income Bracket | # Families | % Families |
| Less than $10,000 | 958 | 2.3% |
| $10,000 to $14,999 | 750 | 1.8% |
| $15,000 to $24,999 | 1,542 | 3.7% |
| $25,000 to $34,999 | 2,417 | 5.8% |
| $35,000 to $49,999 | 3,334 | 8.0% |
| $50,000 to $74,999 | 7,293 | 17.5% |
| $75,000 to $99,999 | 6,584 | 15.8% |
| $100,000 to $149,999 | 9,293 | 22.3% |
| $150,000 to $199,999 | 4,501 | 10.8% |
| $200,000+ | 5,001 | 12.0% |
Family Income by Famaliy Size in Yellowstone County
6-person families (983 | 2.4%) account for the highest median family income in Yellowstone County with $132,375 per family, while 2-person families (21,191 | 50.8%) have the highest median income of $41,605 per family member.
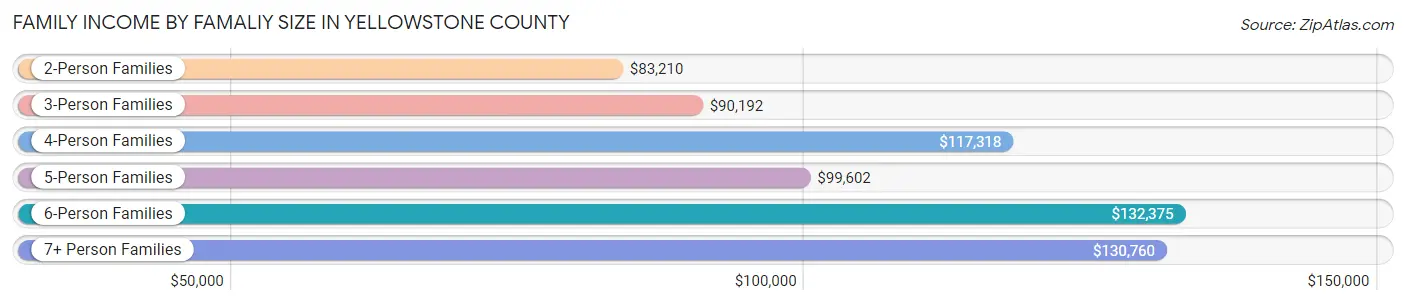
| Income Bracket | # Families | Median Income |
| 2-Person Families | 21,191 (50.8%) | $83,210 |
| 3-Person Families | 8,144 (19.5%) | $90,192 |
| 4-Person Families | 7,300 (17.5%) | $117,318 |
| 5-Person Families | 3,197 (7.7%) | $99,602 |
| 6-Person Families | 983 (2.4%) | $132,375 |
| 7+ Person Families | 857 (2.1%) | $130,760 |
| Total | 41,672 (100.0%) | $92,083 |
Family Income by Number of Earners in Yellowstone County
The median family income in Yellowstone County is $92,083, with families comprising 3+ earners (4,092) having the highest median family income of $129,856, while families with no earners (5,834) have the lowest median family income of $56,542, accounting for 9.8% and 14.0% of families, respectively.
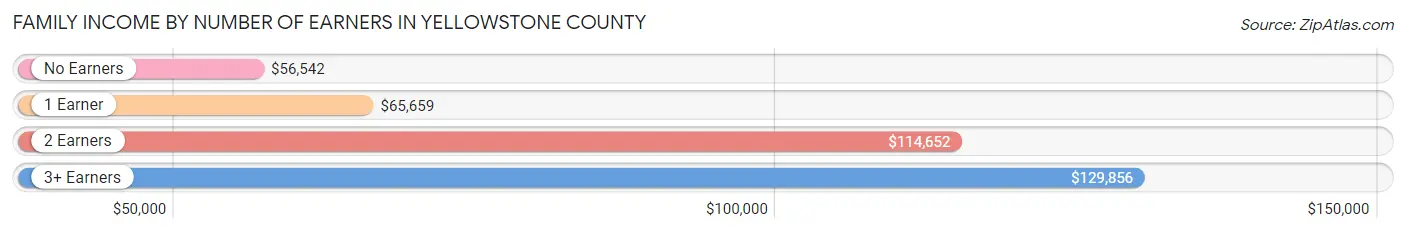
| Number of Earners | # Families | Median Income |
| No Earners | 5,834 (14.0%) | $56,542 |
| 1 Earner | 12,629 (30.3%) | $65,659 |
| 2 Earners | 19,117 (45.9%) | $114,652 |
| 3+ Earners | 4,092 (9.8%) | $129,856 |
| Total | 41,672 (100.0%) | $92,083 |
Household Income in Yellowstone County
Household Income Brackets in Yellowstone County
With 11,950 households falling in the category, the $50,000 to $74,999 income range is the most frequent in Yellowstone County, accounting for 17.6% of all households. In contrast, only 2,308 households (3.4%) fall into the $10,000 to $14,999 income bracket, making it the least populous group.
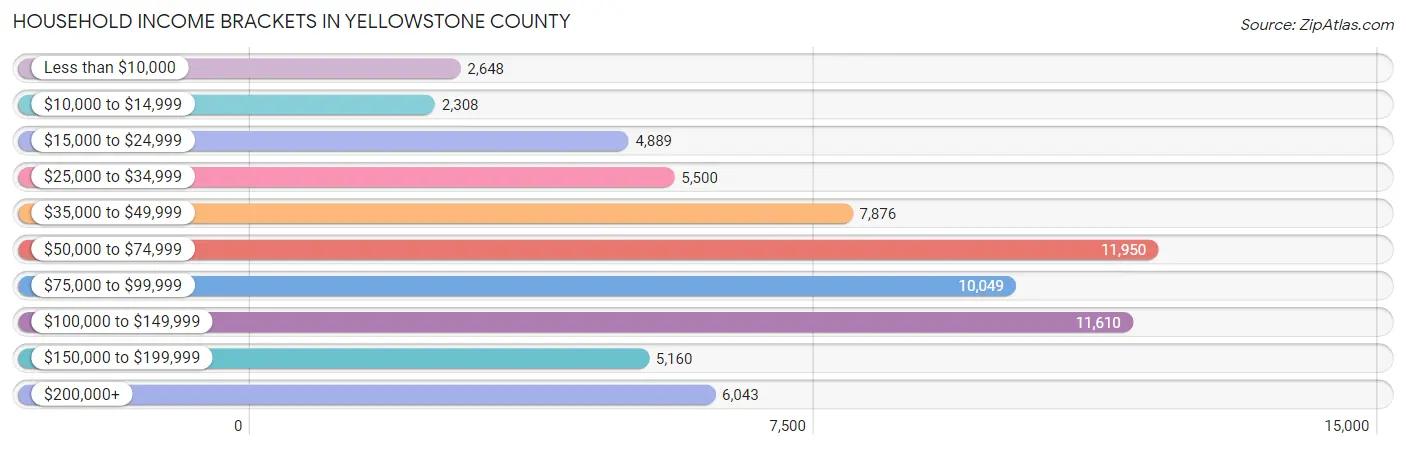
| Income Bracket | # Households | % Households |
| Less than $10,000 | 2,648 | 3.9% |
| $10,000 to $14,999 | 2,308 | 3.4% |
| $15,000 to $24,999 | 4,889 | 7.2% |
| $25,000 to $34,999 | 5,500 | 8.1% |
| $35,000 to $49,999 | 7,876 | 11.6% |
| $50,000 to $74,999 | 11,950 | 17.6% |
| $75,000 to $99,999 | 10,049 | 14.8% |
| $100,000 to $149,999 | 11,610 | 17.1% |
| $150,000 to $199,999 | 5,160 | 7.6% |
| $200,000+ | 6,043 | 8.9% |
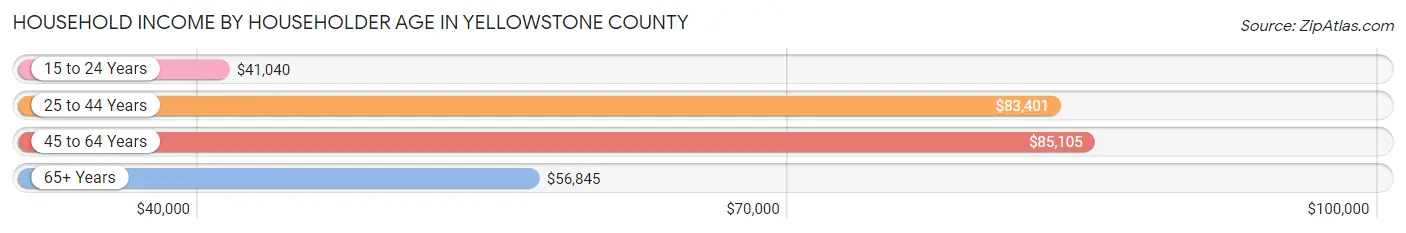
Household Income by Householder Age in Yellowstone County
The median household income in Yellowstone County is $72,300, with the highest median household income of $85,105 found in the 45 to 64 years age bracket for the primary householder. A total of 23,164 households (34.1%) fall into this category. Meanwhile, the 15 to 24 years age bracket for the primary householder has the lowest median household income of $41,040, with 3,125 households (4.6%) in this group.
| Income Bracket | # Households | Median Income |
| 15 to 24 Years | 3,125 (4.6%) | $41,040 |
| 25 to 44 Years | 22,985 (33.9%) | $83,401 |
| 45 to 64 Years | 23,164 (34.1%) | $85,105 |
| 65+ Years | 18,623 (27.4%) | $56,845 |
| Total | 67,897 (100.0%) | $72,300 |
Poverty in Yellowstone County
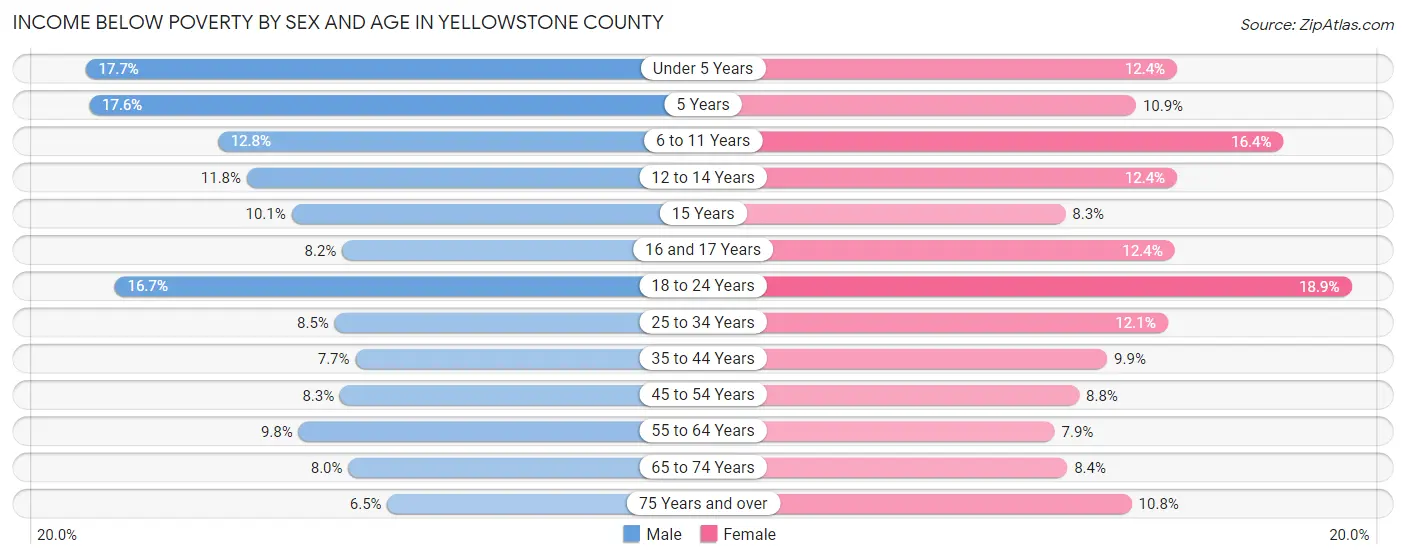
Income Below Poverty by Sex and Age in Yellowstone County
With 10.2% poverty level for males and 11.2% for females among the residents of Yellowstone County, under 5 year old males and 18 to 24 year old females are the most vulnerable to poverty, with 868 males (17.7%) and 1,207 females (18.9%) in their respective age groups living below the poverty level.
| Age Bracket | Male | Female |
| Under 5 Years | 868 (17.7%) | 559 (12.4%) |
| 5 Years | 149 (17.6%) | 163 (10.9%) |
| 6 to 11 Years | 902 (12.8%) | 1,036 (16.4%) |
| 12 to 14 Years | 373 (11.7%) | 355 (12.4%) |
| 15 Years | 90 (10.1%) | 88 (8.3%) |
| 16 and 17 Years | 193 (8.2%) | 260 (12.3%) |
| 18 to 24 Years | 1,096 (16.7%) | 1,207 (18.9%) |
| 25 to 34 Years | 948 (8.5%) | 1,342 (12.1%) |
| 35 to 44 Years | 840 (7.7%) | 1,044 (9.9%) |
| 45 to 54 Years | 787 (8.3%) | 802 (8.8%) |
| 55 to 64 Years | 1,011 (9.8%) | 846 (7.9%) |
| 65 to 74 Years | 648 (8.0%) | 741 (8.4%) |
| 75 Years and over | 311 (6.5%) | 697 (10.8%) |
| Total | 8,216 (10.2%) | 9,140 (11.2%) |
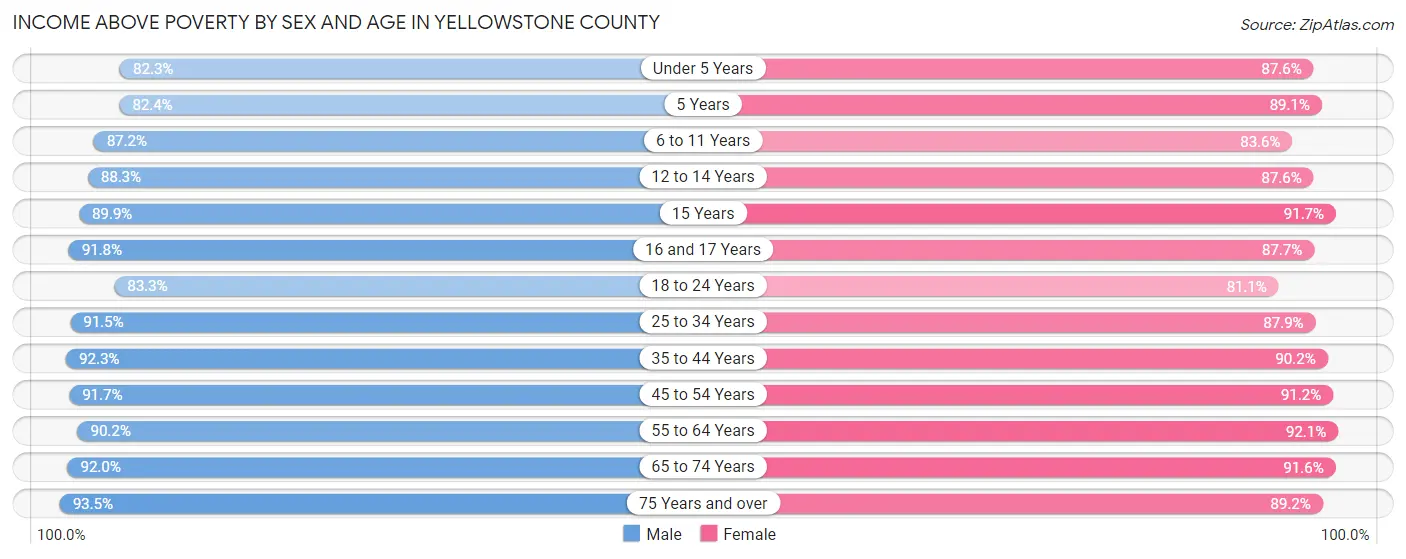
Income Above Poverty by Sex and Age in Yellowstone County
According to the poverty statistics in Yellowstone County, males aged 75 years and over and females aged 55 to 64 years are the age groups that are most secure financially, with 93.5% of males and 92.1% of females in these age groups living above the poverty line.
| Age Bracket | Male | Female |
| Under 5 Years | 4,026 (82.3%) | 3,935 (87.6%) |
| 5 Years | 697 (82.4%) | 1,329 (89.1%) |
| 6 to 11 Years | 6,128 (87.2%) | 5,285 (83.6%) |
| 12 to 14 Years | 2,801 (88.2%) | 2,498 (87.6%) |
| 15 Years | 802 (89.9%) | 972 (91.7%) |
| 16 and 17 Years | 2,159 (91.8%) | 1,845 (87.6%) |
| 18 to 24 Years | 5,483 (83.3%) | 5,177 (81.1%) |
| 25 to 34 Years | 10,215 (91.5%) | 9,755 (87.9%) |
| 35 to 44 Years | 10,037 (92.3%) | 9,550 (90.1%) |
| 45 to 54 Years | 8,711 (91.7%) | 8,306 (91.2%) |
| 55 to 64 Years | 9,275 (90.2%) | 9,861 (92.1%) |
| 65 to 74 Years | 7,472 (92.0%) | 8,113 (91.6%) |
| 75 Years and over | 4,455 (93.5%) | 5,780 (89.2%) |
| Total | 72,261 (89.8%) | 72,406 (88.8%) |
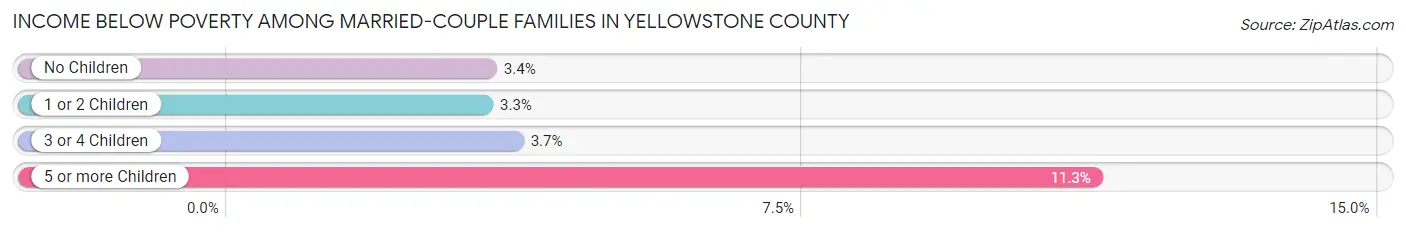
Income Below Poverty Among Married-Couple Families in Yellowstone County
The poverty statistics for married-couple families in Yellowstone County show that 3.5% or 1,122 of the total 32,239 families live below the poverty line. Families with 5 or more children have the highest poverty rate of 11.3%, comprising of 36 families. On the other hand, families with 1 or 2 children have the lowest poverty rate of 3.3%, which includes 324 families.
| Children | Above Poverty | Below Poverty |
| No Children | 18,127 (96.6%) | 634 (3.4%) |
| 1 or 2 Children | 9,401 (96.7%) | 324 (3.3%) |
| 3 or 4 Children | 3,306 (96.3%) | 128 (3.7%) |
| 5 or more Children | 283 (88.7%) | 36 (11.3%) |
| Total | 31,117 (96.5%) | 1,122 (3.5%) |
Income Below Poverty Among Single-Parent Households in Yellowstone County
According to the poverty data in Yellowstone County, 14.9% or 544 single-father households and 25.1% or 1,451 single-mother households are living below the poverty line. Among single-father households, those with 5 or more children have the highest poverty rate, with 70 households (94.6%) experiencing poverty. Likewise, among single-mother households, those with 5 or more children have the highest poverty rate, with 101 households (92.7%) falling below the poverty line.
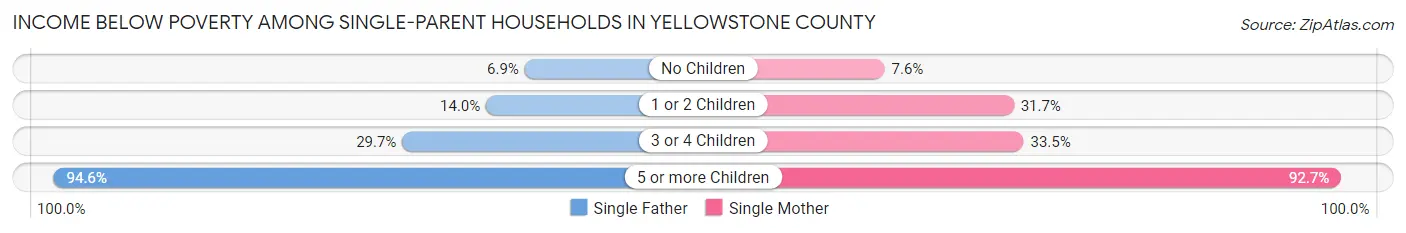
| Children | Single Father | Single Mother |
| No Children | 78 (6.9%) | 144 (7.6%) |
| 1 or 2 Children | 296 (14.0%) | 1,020 (31.7%) |
| 3 or 4 Children | 100 (29.7%) | 186 (33.5%) |
| 5 or more Children | 70 (94.6%) | 101 (92.7%) |
| Total | 544 (14.9%) | 1,451 (25.1%) |
Income Below Poverty Among Married-Couple vs Single-Parent Households in Yellowstone County
The poverty data for Yellowstone County shows that 1,122 of the married-couple family households (3.5%) and 1,995 of the single-parent households (21.1%) are living below the poverty level. Within the married-couple family households, those with 5 or more children have the highest poverty rate, with 36 households (11.3%) falling below the poverty line. Among the single-parent households, those with 5 or more children have the highest poverty rate, with 171 household (93.4%) living below poverty.
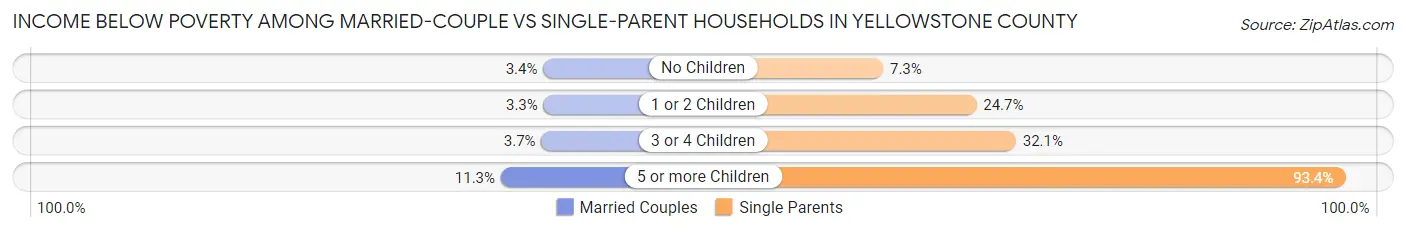
| Children | Married-Couple Families | Single-Parent Households |
| No Children | 634 (3.4%) | 222 (7.3%) |
| 1 or 2 Children | 324 (3.3%) | 1,316 (24.7%) |
| 3 or 4 Children | 128 (3.7%) | 286 (32.1%) |
| 5 or more Children | 36 (11.3%) | 171 (93.4%) |
| Total | 1,122 (3.5%) | 1,995 (21.1%) |
Race in Yellowstone County
The most populous races in Yellowstone County are White / Caucasian (144,877 | 87.5%), Hispanic or Latino (10,268 | 6.2%), and Two or more Races (8,795 | 5.3%).
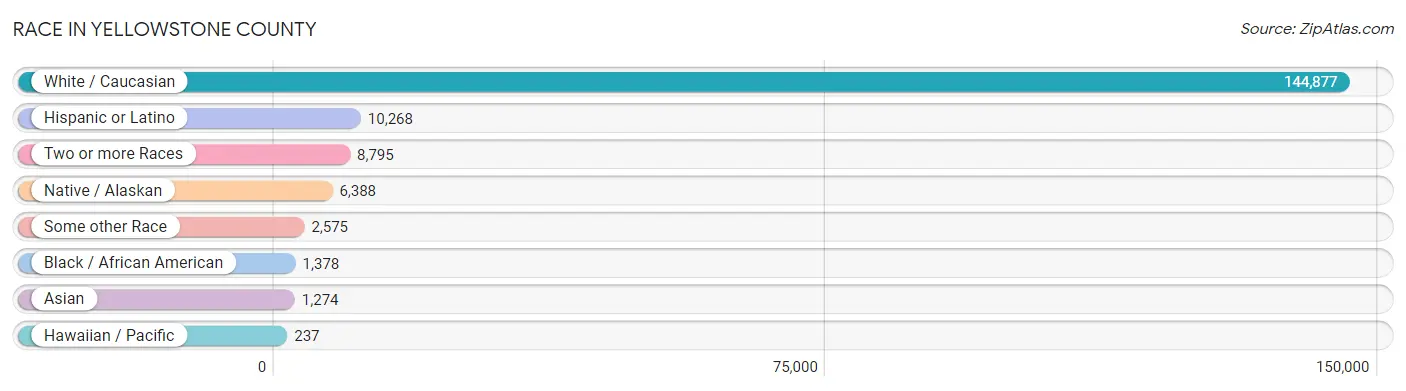
| Race | # Population | % Population |
| Asian | 1,274 | 0.8% |
| Black / African American | 1,378 | 0.8% |
| Hawaiian / Pacific | 237 | 0.1% |
| Hispanic or Latino | 10,268 | 6.2% |
| Native / Alaskan | 6,388 | 3.9% |
| White / Caucasian | 144,877 | 87.5% |
| Two or more Races | 8,795 | 5.3% |
| Some other Race | 2,575 | 1.6% |
| Total | 165,524 | 100.0% |
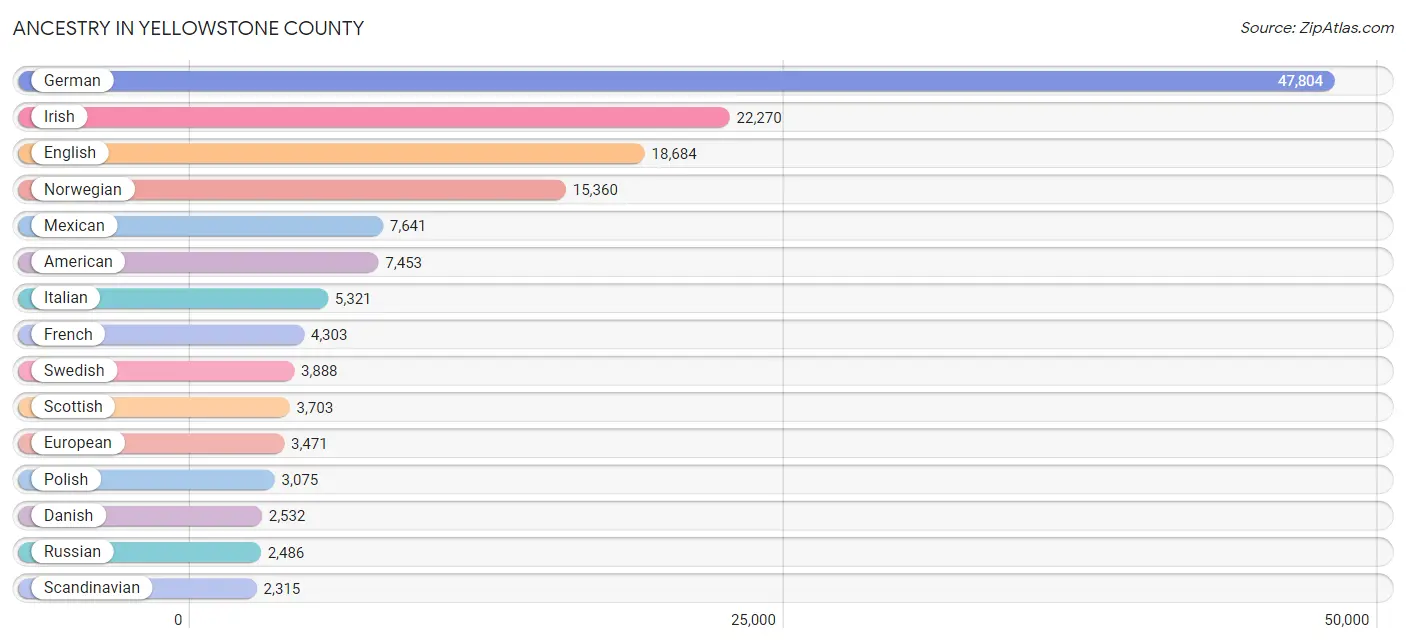
Ancestry in Yellowstone County
The most populous ancestries reported in Yellowstone County are German (47,804 | 28.9%), Irish (22,270 | 13.5%), English (18,684 | 11.3%), Norwegian (15,360 | 9.3%), and Mexican (7,641 | 4.6%), together accounting for 67.5% of all Yellowstone County residents.
| Ancestry | # Population | % Population |
| Afghan | 5 | 0.0% |
| African | 422 | 0.3% |
| Alaska Native | 34 | 0.0% |
| Alaskan Athabascan | 13 | 0.0% |
| Albanian | 3 | 0.0% |
| Alsatian | 19 | 0.0% |
| American | 7,453 | 4.5% |
| Apache | 124 | 0.1% |
| Arab | 182 | 0.1% |
| Arapaho | 70 | 0.0% |
| Argentinean | 138 | 0.1% |
| Armenian | 1 | 0.0% |
| Australian | 25 | 0.0% |
| Austrian | 314 | 0.2% |
| Basque | 67 | 0.0% |
| Belgian | 348 | 0.2% |
| Bhutanese | 551 | 0.3% |
| Blackfeet | 512 | 0.3% |
| Bolivian | 7 | 0.0% |
| Brazilian | 17 | 0.0% |
| British | 775 | 0.5% |
| Bulgarian | 64 | 0.0% |
| Burmese | 255 | 0.2% |
| Canadian | 502 | 0.3% |
| Central American | 77 | 0.1% |
| Central American Indian | 17 | 0.0% |
| Cherokee | 432 | 0.3% |
| Cheyenne | 1,195 | 0.7% |
| Chickasaw | 6 | 0.0% |
| Chilean | 71 | 0.0% |
| Chippewa | 546 | 0.3% |
| Choctaw | 62 | 0.0% |
| Colombian | 94 | 0.1% |
| Colville | 23 | 0.0% |
| Cree | 286 | 0.2% |
| Creek | 6 | 0.0% |
| Croatian | 225 | 0.1% |
| Crow | 1,953 | 1.2% |
| Cuban | 128 | 0.1% |
| Czech | 952 | 0.6% |
| Czechoslovakian | 174 | 0.1% |
| Danish | 2,532 | 1.5% |
| Dominican | 72 | 0.0% |
| Dutch | 2,158 | 1.3% |
| Eastern European | 211 | 0.1% |
| Egyptian | 65 | 0.0% |
| English | 18,684 | 11.3% |
| Ethiopian | 9 | 0.0% |
| European | 3,471 | 2.1% |
| Fijian | 186 | 0.1% |
| Finnish | 979 | 0.6% |
| French | 4,303 | 2.6% |
| French Canadian | 963 | 0.6% |
| German | 47,804 | 28.9% |
| Greek | 464 | 0.3% |
| Guamanian / Chamorro | 6 | 0.0% |
| Guatemalan | 17 | 0.0% |
| Guyanese | 39 | 0.0% |
| Haitian | 76 | 0.1% |
| Honduran | 9 | 0.0% |
| Hungarian | 507 | 0.3% |
| Icelander | 24 | 0.0% |
| Indian (Asian) | 422 | 0.3% |
| Inupiat | 67 | 0.0% |
| Iranian | 40 | 0.0% |
| Irish | 22,270 | 13.5% |
| Iroquois | 30 | 0.0% |
| Italian | 5,321 | 3.2% |
| Jamaican | 44 | 0.0% |
| Japanese | 3 | 0.0% |
| Korean | 559 | 0.3% |
| Latvian | 4 | 0.0% |
| Lebanese | 27 | 0.0% |
| Lithuanian | 131 | 0.1% |
| Lumbee | 13 | 0.0% |
| Luxembourger | 29 | 0.0% |
| Malaysian | 87 | 0.1% |
| Mexican | 7,641 | 4.6% |
| Mexican American Indian | 74 | 0.0% |
| Mongolian | 15 | 0.0% |
| Moroccan | 4 | 0.0% |
| Native Hawaiian | 164 | 0.1% |
| Navajo | 221 | 0.1% |
| New Zealander | 16 | 0.0% |
| Nigerian | 26 | 0.0% |
| Northern European | 559 | 0.3% |
| Norwegian | 15,360 | 9.3% |
| Panamanian | 46 | 0.0% |
| Paraguayan | 34 | 0.0% |
| Pennsylvania German | 73 | 0.0% |
| Peruvian | 98 | 0.1% |
| Polish | 3,075 | 1.9% |
| Portuguese | 357 | 0.2% |
| Potawatomi | 78 | 0.1% |
| Puerto Rican | 288 | 0.2% |
| Puget Sound Salish | 7 | 0.0% |
| Romanian | 23 | 0.0% |
| Russian | 2,486 | 1.5% |
| Salvadoran | 5 | 0.0% |
| Samoan | 342 | 0.2% |
| Scandinavian | 2,315 | 1.4% |
| Scotch-Irish | 1,767 | 1.1% |
| Scottish | 3,703 | 2.2% |
| Serbian | 363 | 0.2% |
| Shoshone | 71 | 0.0% |
| Sioux | 520 | 0.3% |
| Slavic | 125 | 0.1% |
| Slovak | 102 | 0.1% |
| Slovene | 126 | 0.1% |
| South American | 442 | 0.3% |
| Spaniard | 828 | 0.5% |
| Spanish | 451 | 0.3% |
| Spanish American | 7 | 0.0% |
| Sri Lankan | 494 | 0.3% |
| Subsaharan African | 579 | 0.4% |
| Swedish | 3,888 | 2.4% |
| Swiss | 581 | 0.4% |
| Thai | 59 | 0.0% |
| Tohono O'Odham | 4 | 0.0% |
| Tongan | 119 | 0.1% |
| Turkish | 9 | 0.0% |
| Ukrainian | 420 | 0.3% |
| Ute | 30 | 0.0% |
| Welsh | 1,213 | 0.7% |
| West Indian | 47 | 0.0% |
| Yugoslavian | 342 | 0.2% |
| Yup'ik | 3 | 0.0% | View All 127 Rows |
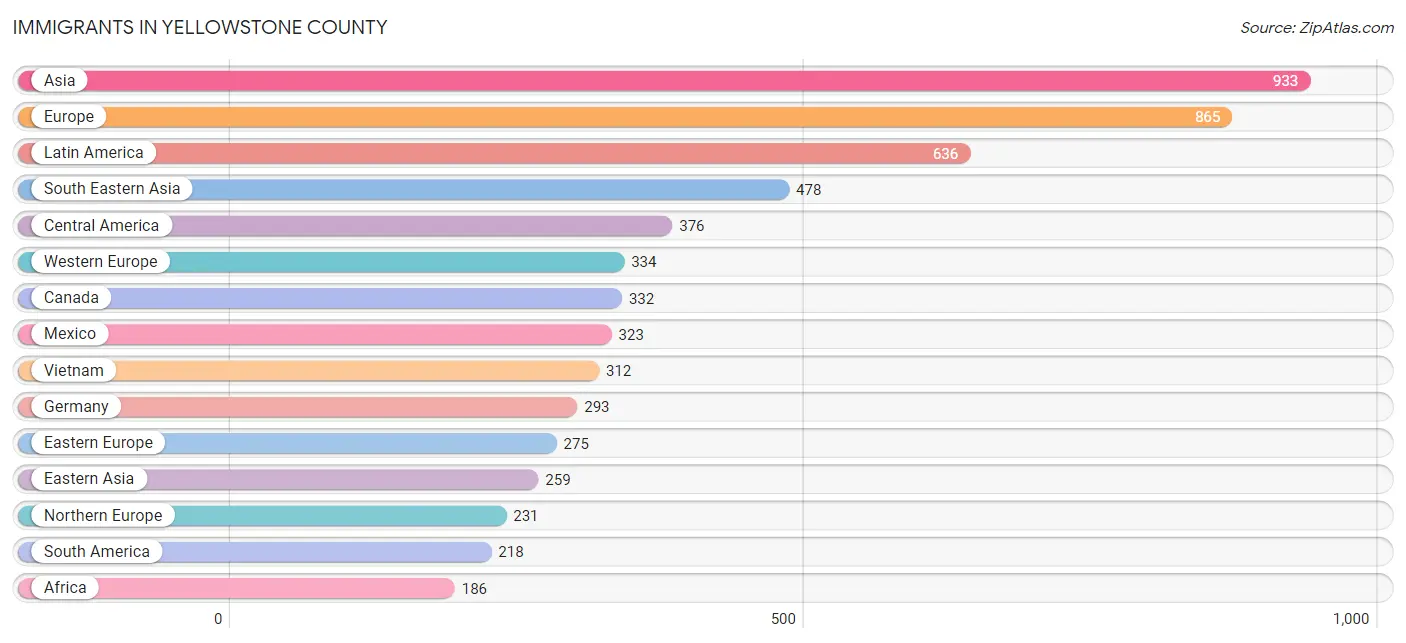
Immigrants in Yellowstone County
The most numerous immigrant groups reported in Yellowstone County came from Asia (933 | 0.6%), Europe (865 | 0.5%), Latin America (636 | 0.4%), South Eastern Asia (478 | 0.3%), and Central America (376 | 0.2%), together accounting for 2.0% of all Yellowstone County residents.
| Immigration Origin | # Population | % Population |
| Africa | 186 | 0.1% |
| Albania | 3 | 0.0% |
| Asia | 933 | 0.6% |
| Australia | 60 | 0.0% |
| Bolivia | 7 | 0.0% |
| Brazil | 30 | 0.0% |
| Bulgaria | 20 | 0.0% |
| Canada | 332 | 0.2% |
| Caribbean | 42 | 0.0% |
| Central America | 376 | 0.2% |
| Chile | 25 | 0.0% |
| China | 120 | 0.1% |
| Colombia | 29 | 0.0% |
| Cuba | 1 | 0.0% |
| Czechoslovakia | 10 | 0.0% |
| Denmark | 12 | 0.0% |
| Dominican Republic | 41 | 0.0% |
| Eastern Africa | 166 | 0.1% |
| Eastern Asia | 259 | 0.2% |
| Eastern Europe | 275 | 0.2% |
| England | 27 | 0.0% |
| Ethiopia | 9 | 0.0% |
| Europe | 865 | 0.5% |
| France | 11 | 0.0% |
| Germany | 293 | 0.2% |
| Guatemala | 17 | 0.0% |
| Guyana | 12 | 0.0% |
| Honduras | 4 | 0.0% |
| Hong Kong | 53 | 0.0% |
| India | 39 | 0.0% |
| Indonesia | 4 | 0.0% |
| Iran | 3 | 0.0% |
| Iraq | 41 | 0.0% |
| Ireland | 53 | 0.0% |
| Italy | 25 | 0.0% |
| Japan | 53 | 0.0% |
| Korea | 86 | 0.1% |
| Latin America | 636 | 0.4% |
| Malaysia | 4 | 0.0% |
| Mexico | 323 | 0.2% |
| Netherlands | 9 | 0.0% |
| Northern Europe | 231 | 0.1% |
| Norway | 21 | 0.0% |
| Oceania | 152 | 0.1% |
| Panama | 32 | 0.0% |
| Peru | 81 | 0.1% |
| Philippines | 158 | 0.1% |
| Poland | 15 | 0.0% |
| Romania | 37 | 0.0% |
| Russia | 127 | 0.1% |
| Saudi Arabia | 79 | 0.1% |
| South America | 218 | 0.1% |
| South Central Asia | 76 | 0.1% |
| South Eastern Asia | 478 | 0.3% |
| Southern Europe | 25 | 0.0% |
| Sweden | 7 | 0.0% |
| Switzerland | 21 | 0.0% |
| Ukraine | 41 | 0.0% |
| Vietnam | 312 | 0.2% |
| Western Asia | 120 | 0.1% |
| Western Europe | 334 | 0.2% | View All 61 Rows |
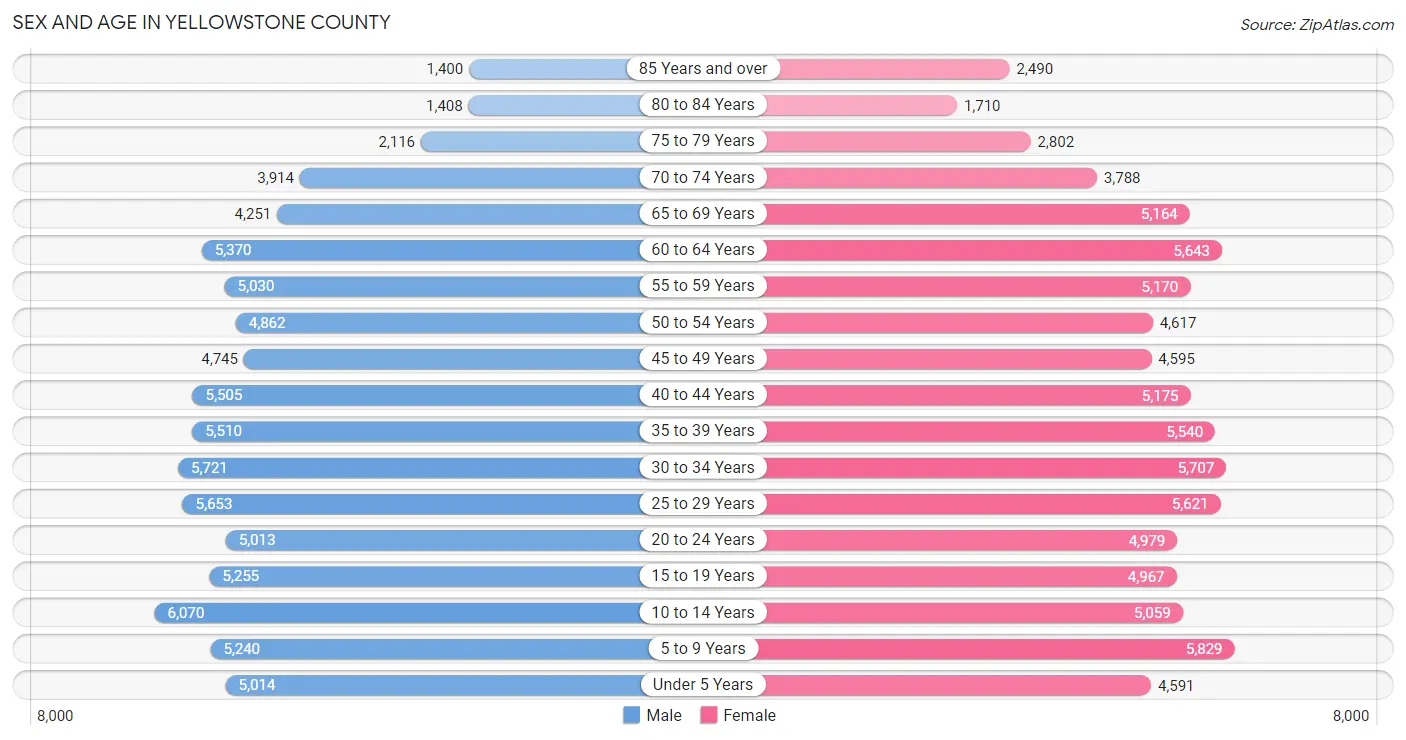
Sex and Age in Yellowstone County
Sex and Age in Yellowstone County
The most populous age groups in Yellowstone County are 10 to 14 Years (6,070 | 7.4%) for men and 5 to 9 Years (5,829 | 7.0%) for women.
| Age Bracket | Male | Female |
| Under 5 Years | 5,014 (6.1%) | 4,591 (5.5%) |
| 5 to 9 Years | 5,240 (6.4%) | 5,829 (7.0%) |
| 10 to 14 Years | 6,070 (7.4%) | 5,059 (6.1%) |
| 15 to 19 Years | 5,255 (6.4%) | 4,967 (5.9%) |
| 20 to 24 Years | 5,013 (6.1%) | 4,979 (6.0%) |
| 25 to 29 Years | 5,653 (6.9%) | 5,621 (6.7%) |
| 30 to 34 Years | 5,721 (7.0%) | 5,707 (6.8%) |
| 35 to 39 Years | 5,510 (6.7%) | 5,540 (6.6%) |
| 40 to 44 Years | 5,505 (6.7%) | 5,175 (6.2%) |
| 45 to 49 Years | 4,745 (5.8%) | 4,595 (5.5%) |
| 50 to 54 Years | 4,862 (5.9%) | 4,617 (5.5%) |
| 55 to 59 Years | 5,030 (6.1%) | 5,170 (6.2%) |
| 60 to 64 Years | 5,370 (6.5%) | 5,643 (6.8%) |
| 65 to 69 Years | 4,251 (5.2%) | 5,164 (6.2%) |
| 70 to 74 Years | 3,914 (4.8%) | 3,788 (4.5%) |
| 75 to 79 Years | 2,116 (2.6%) | 2,802 (3.4%) |
| 80 to 84 Years | 1,408 (1.7%) | 1,710 (2.1%) |
| 85 Years and over | 1,400 (1.7%) | 2,490 (3.0%) |
| Total | 82,077 (100.0%) | 83,447 (100.0%) |
Families and Households in Yellowstone County
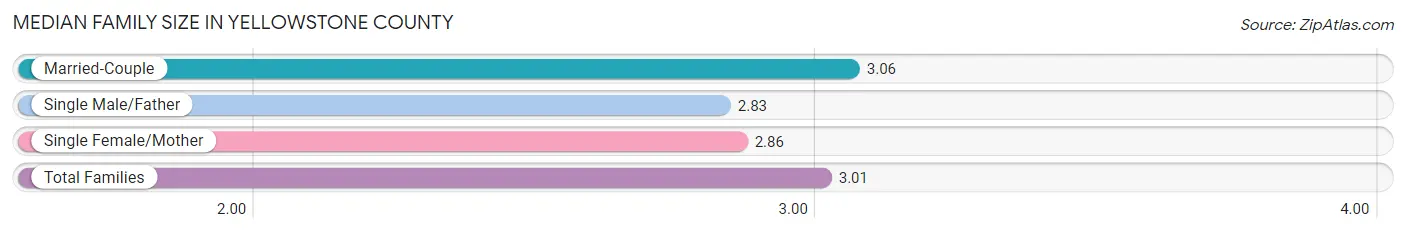
Median Family Size in Yellowstone County
The median family size in Yellowstone County is 3.01 persons per family, with married-couple families (32,239 | 77.4%) accounting for the largest median family size of 3.06 persons per family. On the other hand, single male/father families (3,658 | 8.8%) represent the smallest median family size with 2.83 persons per family.
| Family Type | # Families | Family Size |
| Married-Couple | 32,239 (77.4%) | 3.06 |
| Single Male/Father | 3,658 (8.8%) | 2.83 |
| Single Female/Mother | 5,775 (13.9%) | 2.86 |
| Total Families | 41,672 (100.0%) | 3.01 |
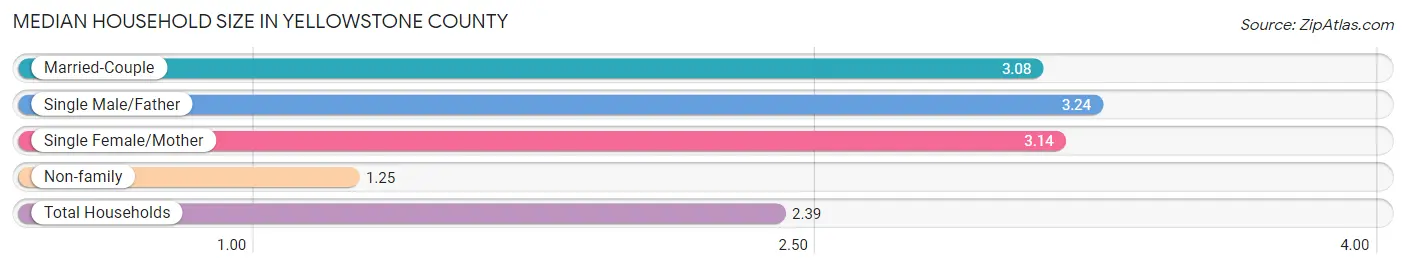
Median Household Size in Yellowstone County
The median household size in Yellowstone County is 2.39 persons per household, with single male/father households (3,658 | 5.4%) accounting for the largest median household size of 3.24 persons per household. non-family households (26,225 | 38.6%) represent the smallest median household size with 1.25 persons per household.
| Household Type | # Households | Household Size |
| Married-Couple | 32,239 (47.5%) | 3.08 |
| Single Male/Father | 3,658 (5.4%) | 3.24 |
| Single Female/Mother | 5,775 (8.5%) | 3.14 |
| Non-family | 26,225 (38.6%) | 1.25 |
| Total Households | 67,897 (100.0%) | 2.39 |
Household Size by Marriage Status in Yellowstone County
Out of a total of 67,897 households in Yellowstone County, 41,672 (61.4%) are family households, while 26,225 (38.6%) are nonfamily households. The most numerous type of family households are 2-person households, comprising 19,746, and the most common type of nonfamily households are 1-person households, comprising 21,205.
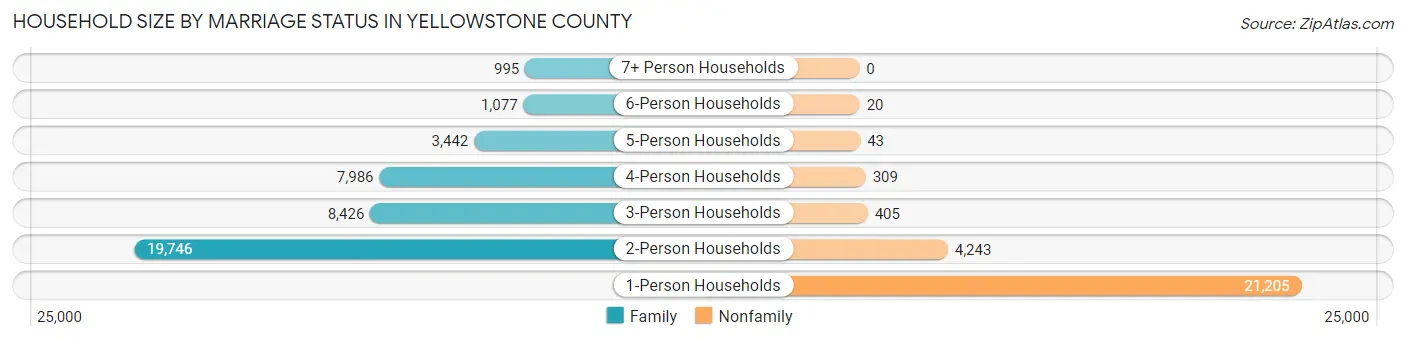
| Household Size | Family Households | Nonfamily Households |
| 1-Person Households | - | 21,205 (31.2%) |
| 2-Person Households | 19,746 (29.1%) | 4,243 (6.2%) |
| 3-Person Households | 8,426 (12.4%) | 405 (0.6%) |
| 4-Person Households | 7,986 (11.8%) | 309 (0.5%) |
| 5-Person Households | 3,442 (5.1%) | 43 (0.1%) |
| 6-Person Households | 1,077 (1.6%) | 20 (0.0%) |
| 7+ Person Households | 995 (1.5%) | 0 (0.0%) |
| Total | 41,672 (61.4%) | 26,225 (38.6%) |
Female Fertility in Yellowstone County
Fertility by Age in Yellowstone County
Average fertility rate in Yellowstone County is 64.0 births per 1,000 women. Women in the age bracket of 20 to 34 years have the highest fertility rate with 104.0 births per 1,000 women. Women in the age bracket of 20 to 34 years acount for 70.2% of all women with births.
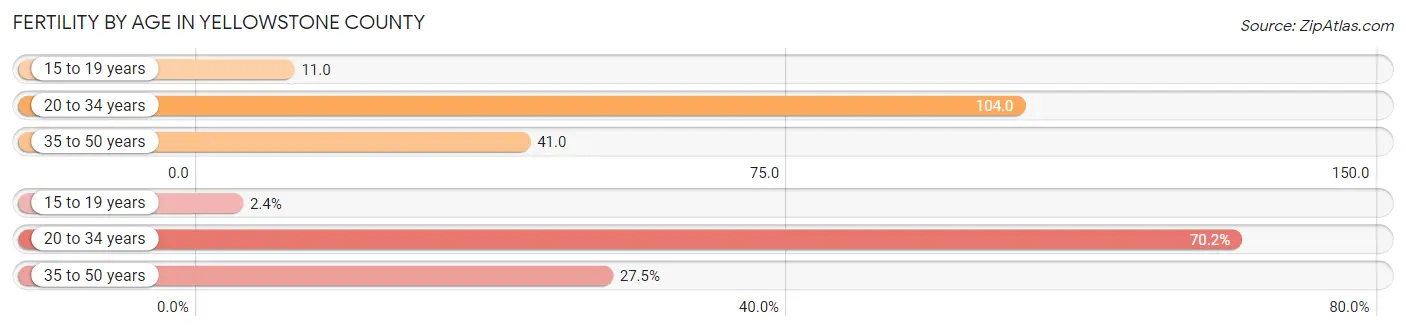
| Age Bracket | Women with Births | Births / 1,000 Women |
| 15 to 19 years | 57 (2.4%) | 11.0 |
| 20 to 34 years | 1,691 (70.2%) | 104.0 |
| 35 to 50 years | 662 (27.5%) | 41.0 |
| Total | 2,410 (100.0%) | 64.0 |
Fertility by Age by Marriage Status in Yellowstone County
71.8% of women with births (2,410) in Yellowstone County are married. The highest percentage of unmarried women with births falls into 15 to 19 years age bracket with 100.0% of them unmarried at the time of birth, while the lowest percentage of unmarried women with births belong to 35 to 50 years age bracket with 16.3% of them unmarried.
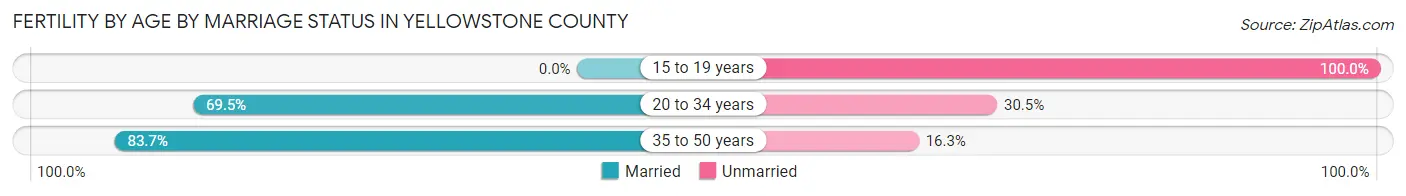
| Age Bracket | Married | Unmarried |
| 15 to 19 years | 0 (0.0%) | 57 (100.0%) |
| 20 to 34 years | 1,175 (69.5%) | 516 (30.5%) |
| 35 to 50 years | 554 (83.7%) | 108 (16.3%) |
| Total | 1,730 (71.8%) | 680 (28.2%) |
Fertility by Education in Yellowstone County
Average fertility rate in Yellowstone County is 64.0 births per 1,000 women. Women with the education attainment of high school diploma have the highest fertility rate of 88.0 births per 1,000 women, while women with the education attainment of less than high school have the lowest fertility at 29.0 births per 1,000 women. Women with the education attainment of college or associate's degree represent 31.5% of all women with births.
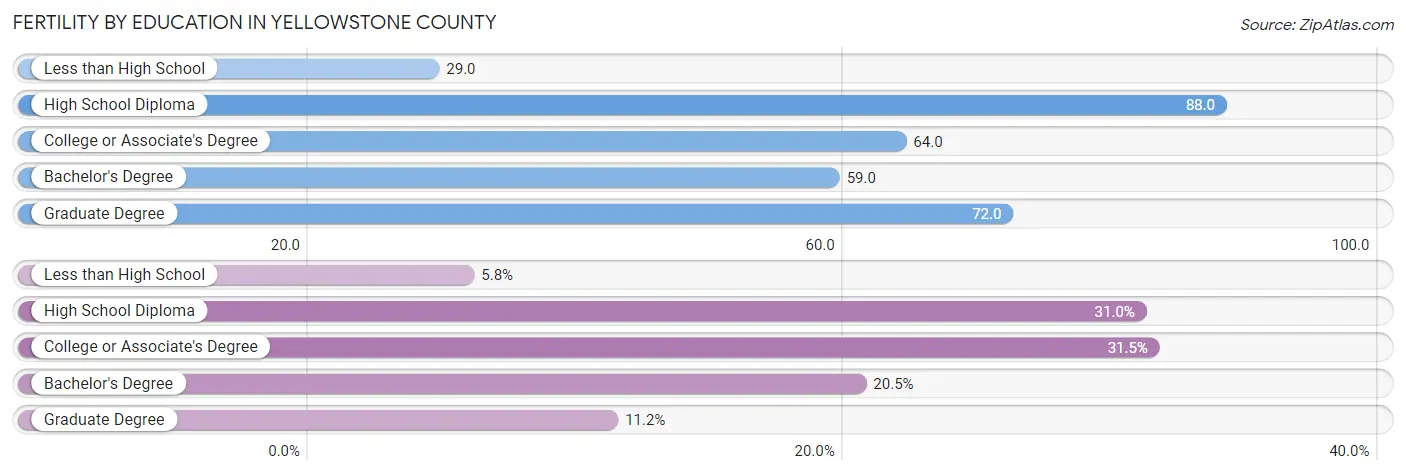
| Educational Attainment | Women with Births | Births / 1,000 Women |
| Less than High School | 140 (5.8%) | 29.0 |
| High School Diploma | 747 (31.0%) | 88.0 |
| College or Associate's Degree | 759 (31.5%) | 64.0 |
| Bachelor's Degree | 494 (20.5%) | 59.0 |
| Graduate Degree | 270 (11.2%) | 72.0 |
| Total | 2,410 (100.0%) | 64.0 |
Fertility by Education by Marriage Status in Yellowstone County
28.2% of women with births in Yellowstone County are unmarried. Women with the educational attainment of graduate degree are most likely to be married with 94.1% of them married at childbirth, while women with the educational attainment of less than high school are least likely to be married with 56.4% of them unmarried at childbirth.
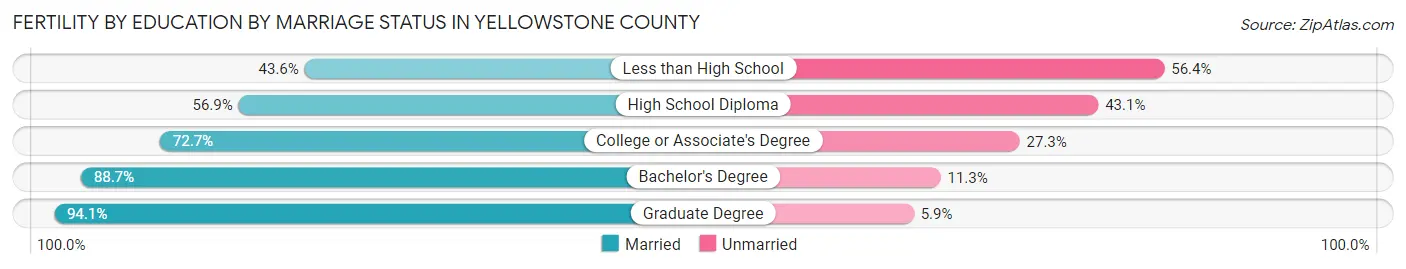
| Educational Attainment | Married | Unmarried |
| Less than High School | 61 (43.6%) | 79 (56.4%) |
| High School Diploma | 425 (56.9%) | 322 (43.1%) |
| College or Associate's Degree | 552 (72.7%) | 207 (27.3%) |
| Bachelor's Degree | 438 (88.7%) | 56 (11.3%) |
| Graduate Degree | 254 (94.1%) | 16 (5.9%) |
| Total | 1,730 (71.8%) | 680 (28.2%) |
Employment Characteristics in Yellowstone County
Employment by Class of Employer in Yellowstone County
Among the 82,869 employed individuals in Yellowstone County, private company employees (53,298 | 64.3%), not-for-profit organizations (9,699 | 11.7%), and self-employed (not incorporated) (5,613 | 6.8%) make up the most common classes of employment.
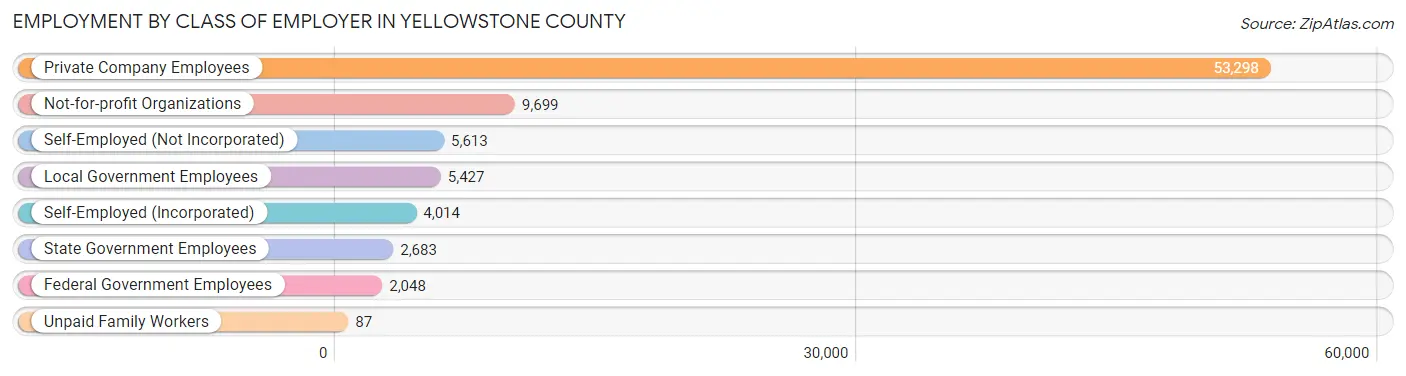
| Employer Class | # Employees | % Employees |
| Private Company Employees | 53,298 | 64.3% |
| Self-Employed (Incorporated) | 4,014 | 4.8% |
| Self-Employed (Not Incorporated) | 5,613 | 6.8% |
| Not-for-profit Organizations | 9,699 | 11.7% |
| Local Government Employees | 5,427 | 6.6% |
| State Government Employees | 2,683 | 3.2% |
| Federal Government Employees | 2,048 | 2.5% |
| Unpaid Family Workers | 87 | 0.1% |
| Total | 82,869 | 100.0% |
Employment Status by Age in Yellowstone County
According to the labor force statistics for Yellowstone County, out of the total population over 16 years of age (131,735), 66.2% or 87,209 individuals are in the labor force, with 3.5% or 3,052 of them unemployed. The age group with the highest labor force participation rate is 30 to 34 years, with 88.3% or 10,091 individuals in the labor force. Within the labor force, the 20 to 24 years age range has the highest percentage of unemployed individuals, with 8.6% or 705 of them being unemployed.
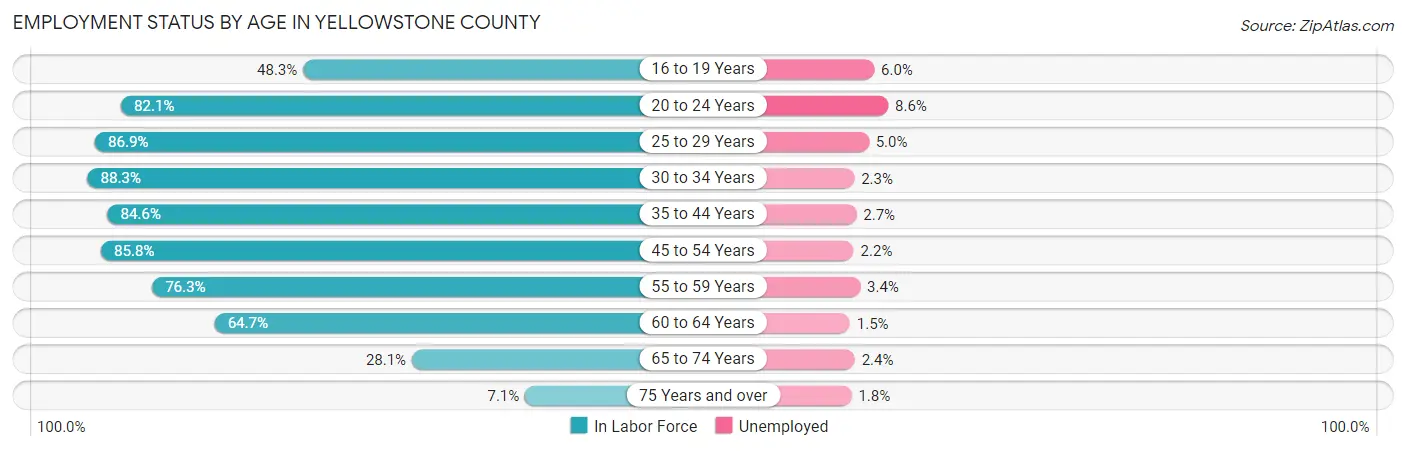
| Age Bracket | In Labor Force | Unemployed |
| 16 to 19 Years | 3,978 (48.3%) | 239 (6.0%) |
| 20 to 24 Years | 8,203 (82.1%) | 705 (8.6%) |
| 25 to 29 Years | 9,797 (86.9%) | 490 (5.0%) |
| 30 to 34 Years | 10,091 (88.3%) | 232 (2.3%) |
| 35 to 44 Years | 18,384 (84.6%) | 496 (2.7%) |
| 45 to 54 Years | 16,147 (85.8%) | 355 (2.2%) |
| 55 to 59 Years | 7,783 (76.3%) | 265 (3.4%) |
| 60 to 64 Years | 7,125 (64.7%) | 107 (1.5%) |
| 65 to 74 Years | 4,810 (28.1%) | 115 (2.4%) |
| 75 Years and over | 847 (7.1%) | 15 (1.8%) |
| Total | 87,209 (66.2%) | 3,052 (3.5%) |
Employment Status by Educational Attainment in Yellowstone County
According to labor force statistics for Yellowstone County, 82.1% of individuals (69,345) out of the total population between 25 and 64 years of age (84,464) are in the labor force, with 2.8% or 1,942 of them being unemployed. The group with the highest labor force participation rate are those with the educational attainment of bachelor's degree or higher, with 87.6% or 25,740 individuals in the labor force. Within the labor force, individuals with less than high school education have the highest percentage of unemployment, with 13.4% or 312 of them being unemployed.
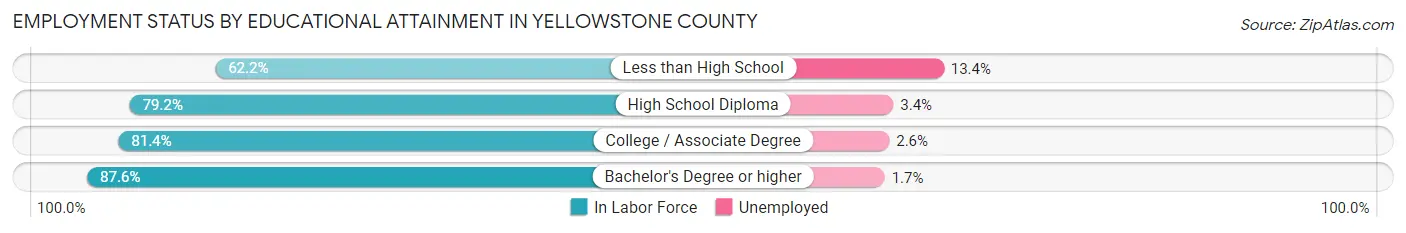
| Educational Attainment | In Labor Force | Unemployed |
| Less than High School | 2,329 (62.2%) | 502 (13.4%) |
| High School Diploma | 18,808 (79.2%) | 807 (3.4%) |
| College / Associate Degree | 22,457 (81.4%) | 717 (2.6%) |
| Bachelor's Degree or higher | 25,740 (87.6%) | 500 (1.7%) |
| Total | 69,345 (82.1%) | 2,365 (2.8%) |
Employment Occupations by Sex in Yellowstone County
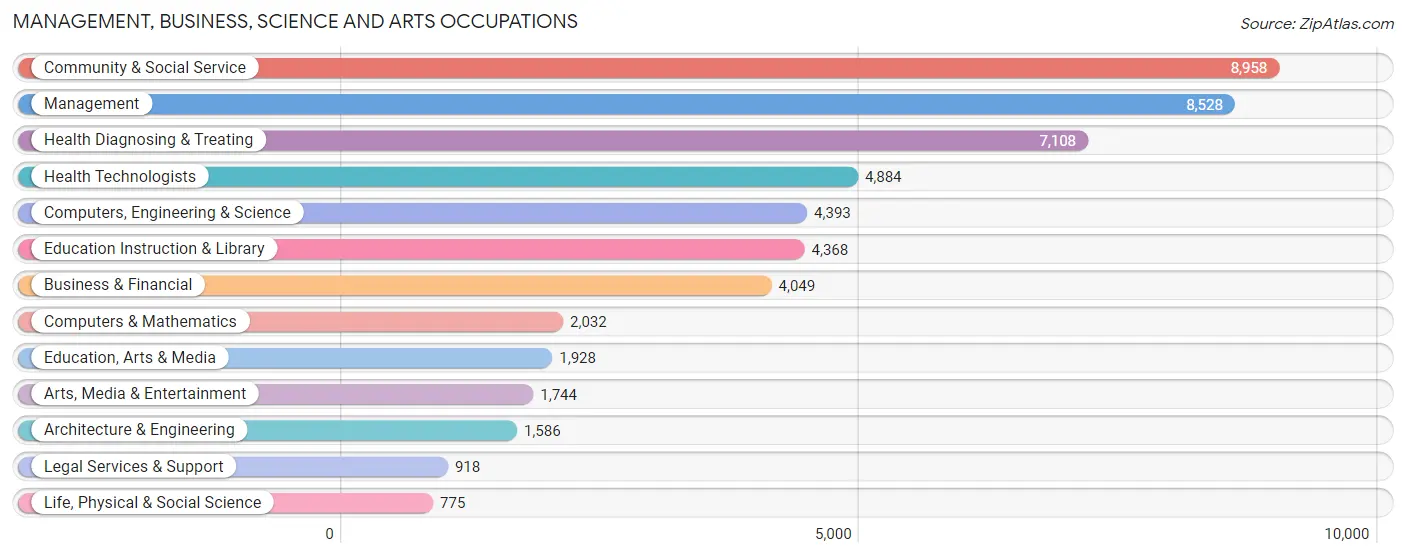
Management, Business, Science and Arts Occupations
The most common Management, Business, Science and Arts occupations in Yellowstone County are Community & Social Service (8,958 | 10.6%), Management (8,528 | 10.1%), Health Diagnosing & Treating (7,108 | 8.5%), Health Technologists (4,884 | 5.8%), and Computers, Engineering & Science (4,393 | 5.2%).
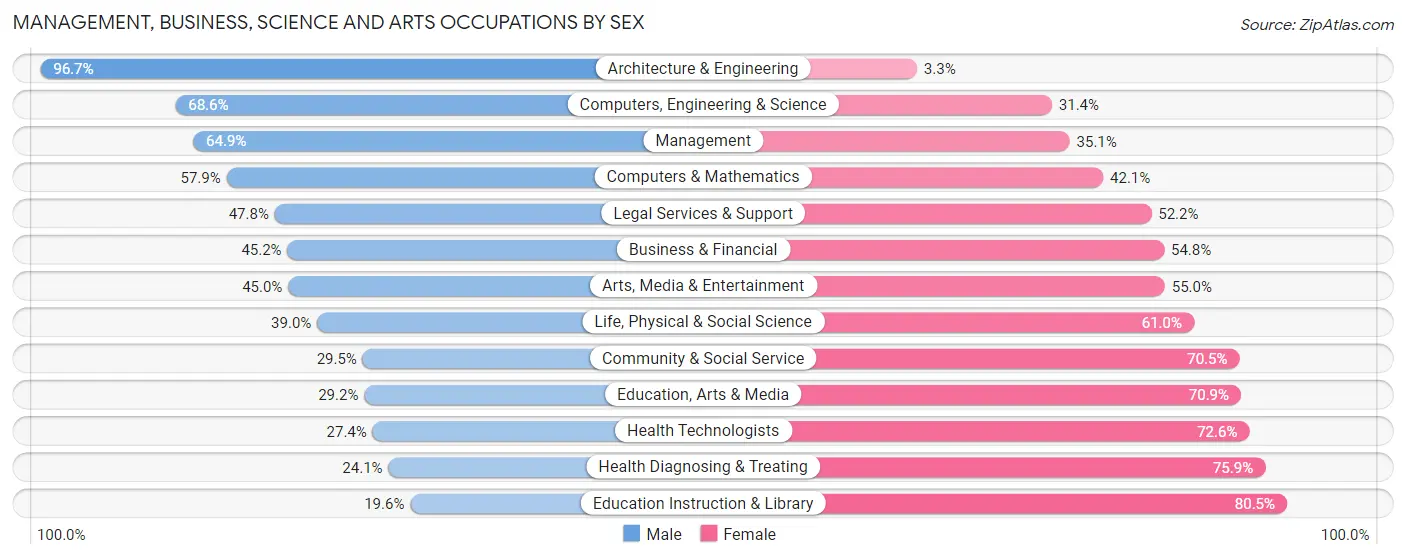
Management, Business, Science and Arts Occupations by Sex
Within the Management, Business, Science and Arts occupations in Yellowstone County, the most male-oriented occupations are Architecture & Engineering (96.7%), Computers, Engineering & Science (68.6%), and Management (64.9%), while the most female-oriented occupations are Education Instruction & Library (80.4%), Health Diagnosing & Treating (75.9%), and Health Technologists (72.6%).
| Occupation | Male | Female |
| Management | 5,531 (64.9%) | 2,997 (35.1%) |
| Business & Financial | 1,829 (45.2%) | 2,220 (54.8%) |
| Computers, Engineering & Science | 3,012 (68.6%) | 1,381 (31.4%) |
| Computers & Mathematics | 1,176 (57.9%) | 856 (42.1%) |
| Architecture & Engineering | 1,534 (96.7%) | 52 (3.3%) |
| Life, Physical & Social Science | 302 (39.0%) | 473 (61.0%) |
| Community & Social Service | 2,640 (29.5%) | 6,318 (70.5%) |
| Education, Arts & Media | 562 (29.1%) | 1,366 (70.9%) |
| Legal Services & Support | 439 (47.8%) | 479 (52.2%) |
| Education Instruction & Library | 854 (19.6%) | 3,514 (80.4%) |
| Arts, Media & Entertainment | 785 (45.0%) | 959 (55.0%) |
| Health Diagnosing & Treating | 1,714 (24.1%) | 5,394 (75.9%) |
| Health Technologists | 1,338 (27.4%) | 3,546 (72.6%) |
| Total (Category) | 14,726 (44.6%) | 18,310 (55.4%) |
| Total (Overall) | 43,693 (51.9%) | 40,429 (48.1%) |
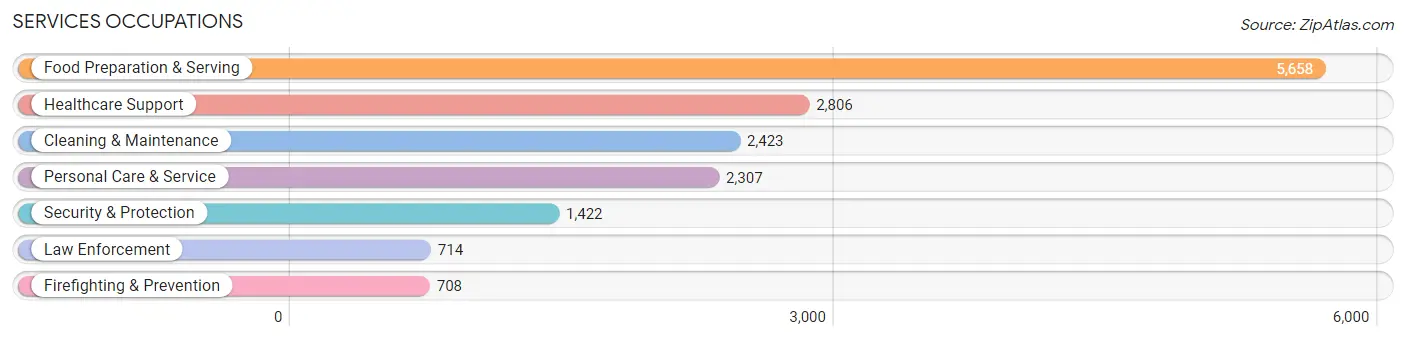
Services Occupations
The most common Services occupations in Yellowstone County are Food Preparation & Serving (5,658 | 6.7%), Healthcare Support (2,806 | 3.3%), Cleaning & Maintenance (2,423 | 2.9%), Personal Care & Service (2,307 | 2.7%), and Security & Protection (1,422 | 1.7%).
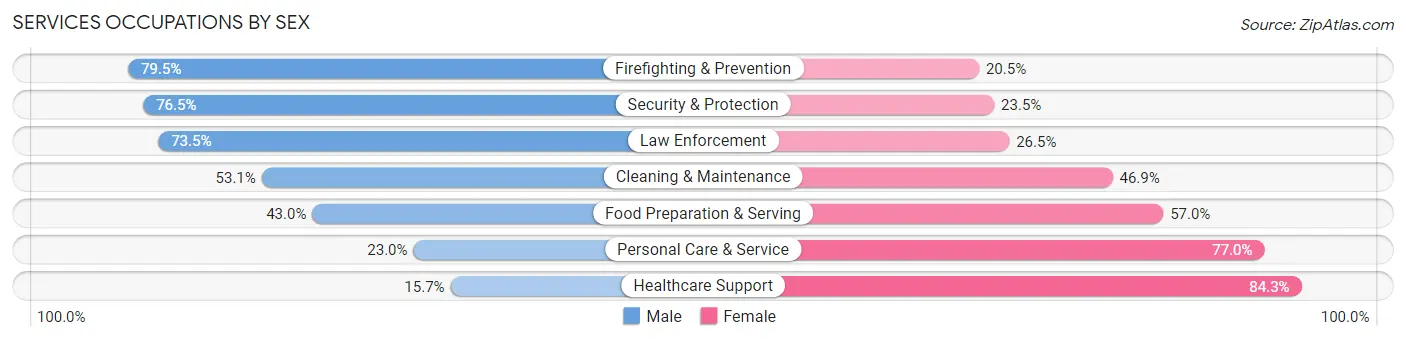
Services Occupations by Sex
Within the Services occupations in Yellowstone County, the most male-oriented occupations are Firefighting & Prevention (79.5%), Security & Protection (76.5%), and Law Enforcement (73.5%), while the most female-oriented occupations are Healthcare Support (84.3%), Personal Care & Service (77.0%), and Food Preparation & Serving (57.0%).
| Occupation | Male | Female |
| Healthcare Support | 440 (15.7%) | 2,366 (84.3%) |
| Security & Protection | 1,088 (76.5%) | 334 (23.5%) |
| Firefighting & Prevention | 563 (79.5%) | 145 (20.5%) |
| Law Enforcement | 525 (73.5%) | 189 (26.5%) |
| Food Preparation & Serving | 2,435 (43.0%) | 3,223 (57.0%) |
| Cleaning & Maintenance | 1,286 (53.1%) | 1,137 (46.9%) |
| Personal Care & Service | 531 (23.0%) | 1,776 (77.0%) |
| Total (Category) | 5,780 (39.6%) | 8,836 (60.5%) |
| Total (Overall) | 43,693 (51.9%) | 40,429 (48.1%) |
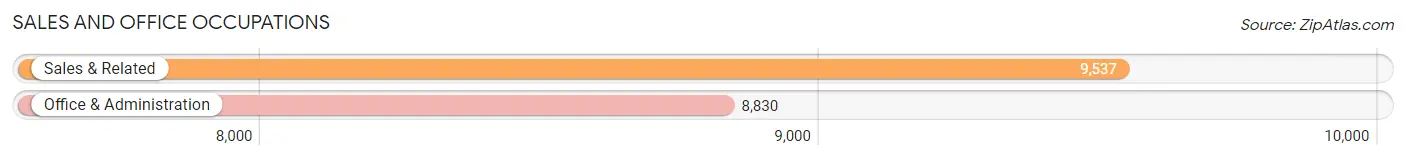
Sales and Office Occupations
The most common Sales and Office occupations in Yellowstone County are Sales & Related (9,537 | 11.3%), and Office & Administration (8,830 | 10.5%).
Sales and Office Occupations by Sex
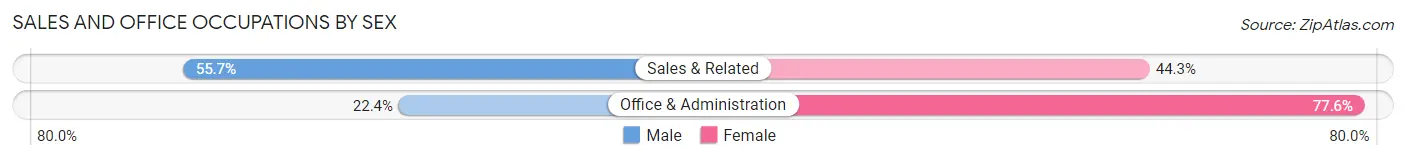
| Occupation | Male | Female |
| Sales & Related | 5,308 (55.7%) | 4,229 (44.3%) |
| Office & Administration | 1,980 (22.4%) | 6,850 (77.6%) |
| Total (Category) | 7,288 (39.7%) | 11,079 (60.3%) |
| Total (Overall) | 43,693 (51.9%) | 40,429 (48.1%) |
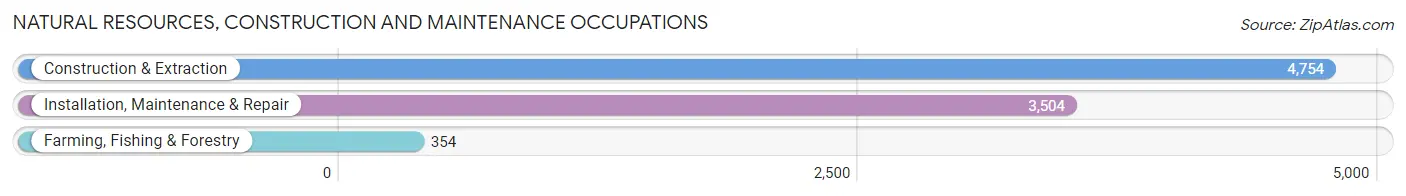
Natural Resources, Construction and Maintenance Occupations
The most common Natural Resources, Construction and Maintenance occupations in Yellowstone County are Construction & Extraction (4,754 | 5.7%), Installation, Maintenance & Repair (3,504 | 4.2%), and Farming, Fishing & Forestry (354 | 0.4%).
Natural Resources, Construction and Maintenance Occupations by Sex
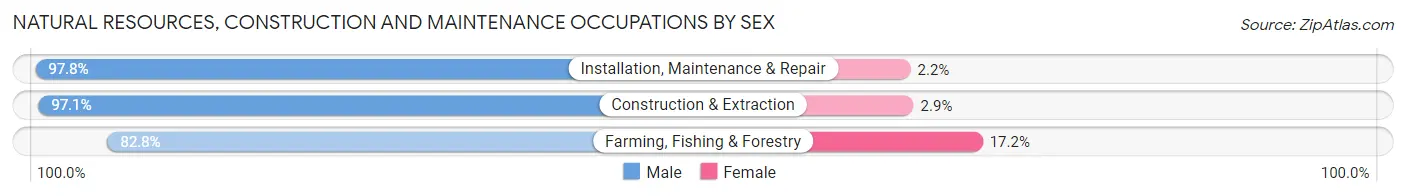
| Occupation | Male | Female |
| Farming, Fishing & Forestry | 293 (82.8%) | 61 (17.2%) |
| Construction & Extraction | 4,618 (97.1%) | 136 (2.9%) |
| Installation, Maintenance & Repair | 3,426 (97.8%) | 78 (2.2%) |
| Total (Category) | 8,337 (96.8%) | 275 (3.2%) |
| Total (Overall) | 43,693 (51.9%) | 40,429 (48.1%) |
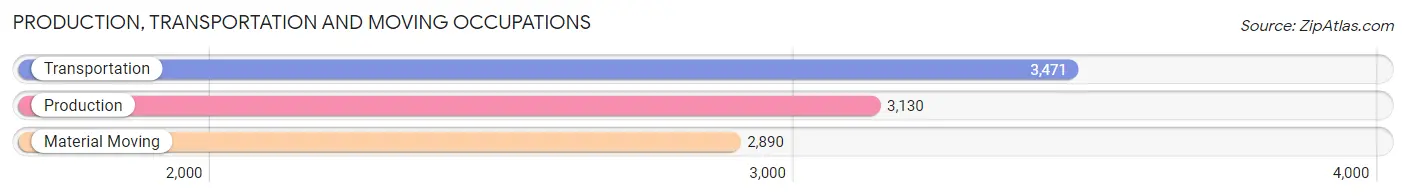
Production, Transportation and Moving Occupations
The most common Production, Transportation and Moving occupations in Yellowstone County are Transportation (3,471 | 4.1%), Production (3,130 | 3.7%), and Material Moving (2,890 | 3.4%).
Production, Transportation and Moving Occupations by Sex
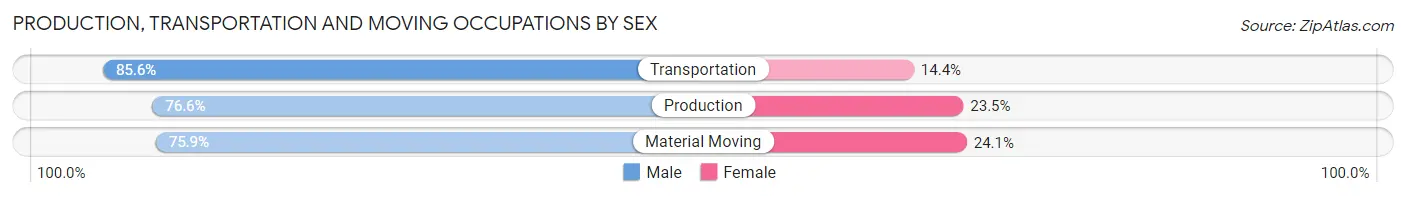
| Occupation | Male | Female |
| Production | 2,396 (76.5%) | 734 (23.4%) |
| Transportation | 2,972 (85.6%) | 499 (14.4%) |
| Material Moving | 2,194 (75.9%) | 696 (24.1%) |
| Total (Category) | 7,562 (79.7%) | 1,929 (20.3%) |
| Total (Overall) | 43,693 (51.9%) | 40,429 (48.1%) |
Employment Industries by Sex in Yellowstone County
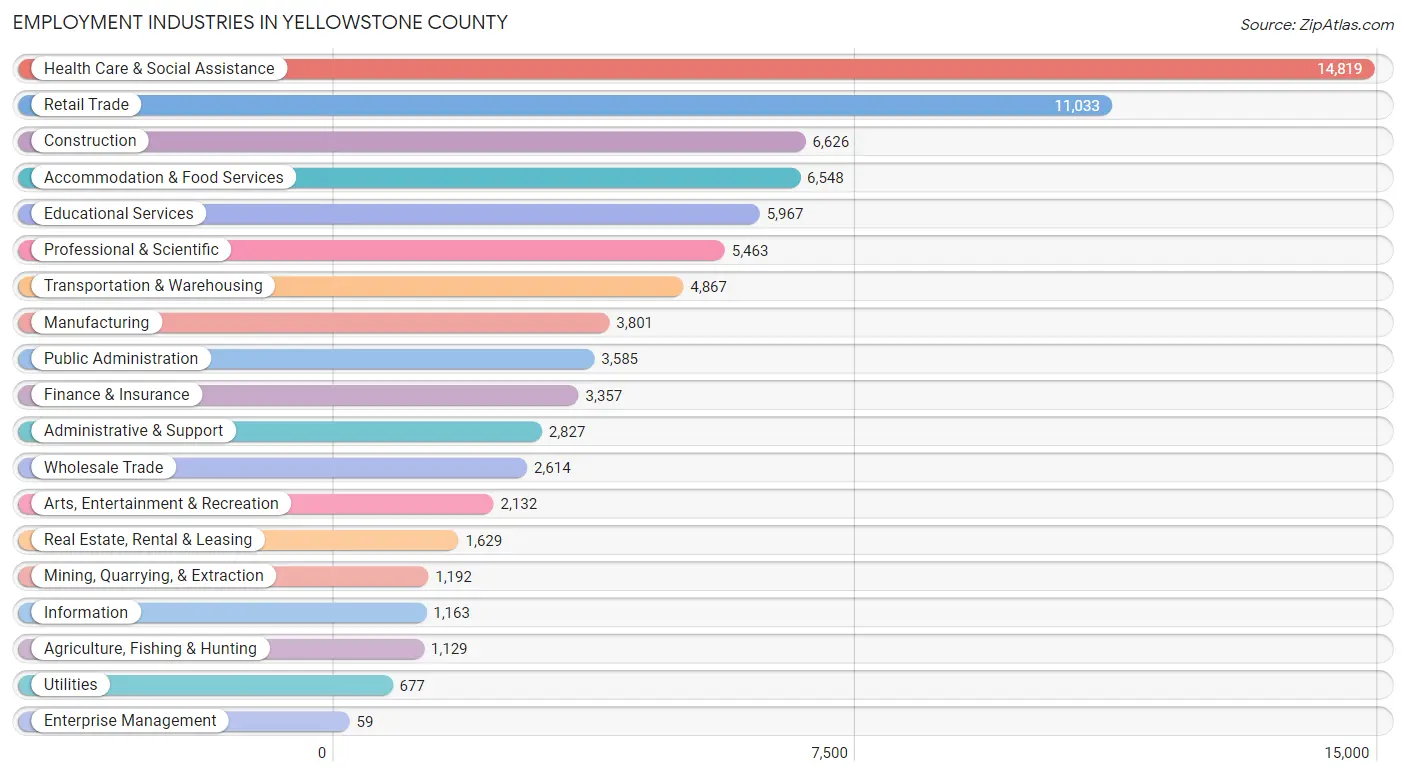
Employment Industries in Yellowstone County
The major employment industries in Yellowstone County include Health Care & Social Assistance (14,819 | 17.6%), Retail Trade (11,033 | 13.1%), Construction (6,626 | 7.9%), Accommodation & Food Services (6,548 | 7.8%), and Educational Services (5,967 | 7.1%).
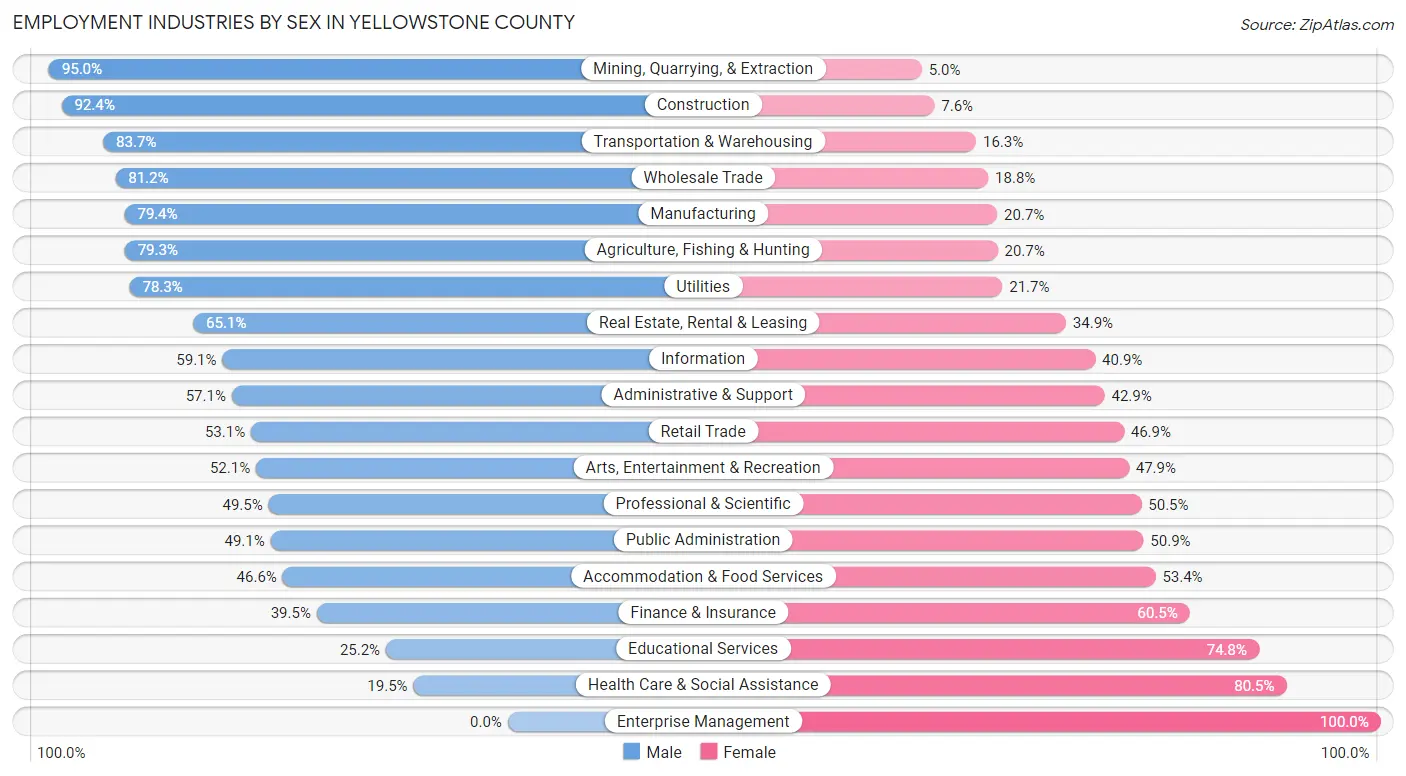
Employment Industries by Sex in Yellowstone County
The Yellowstone County industries that see more men than women are Mining, Quarrying, & Extraction (95.0%), Construction (92.4%), and Transportation & Warehousing (83.7%), whereas the industries that tend to have a higher number of women are Enterprise Management (100.0%), Health Care & Social Assistance (80.5%), and Educational Services (74.8%).
| Industry | Male | Female |
| Agriculture, Fishing & Hunting | 895 (79.3%) | 234 (20.7%) |
| Mining, Quarrying, & Extraction | 1,132 (95.0%) | 60 (5.0%) |
| Construction | 6,120 (92.4%) | 506 (7.6%) |
| Manufacturing | 3,016 (79.3%) | 785 (20.6%) |
| Wholesale Trade | 2,123 (81.2%) | 491 (18.8%) |
| Retail Trade | 5,863 (53.1%) | 5,170 (46.9%) |
| Transportation & Warehousing | 4,075 (83.7%) | 792 (16.3%) |
| Utilities | 530 (78.3%) | 147 (21.7%) |
| Information | 687 (59.1%) | 476 (40.9%) |
| Finance & Insurance | 1,327 (39.5%) | 2,030 (60.5%) |
| Real Estate, Rental & Leasing | 1,061 (65.1%) | 568 (34.9%) |
| Professional & Scientific | 2,705 (49.5%) | 2,758 (50.5%) |
| Enterprise Management | 0 (0.0%) | 59 (100.0%) |
| Administrative & Support | 1,615 (57.1%) | 1,212 (42.9%) |
| Educational Services | 1,504 (25.2%) | 4,463 (74.8%) |
| Health Care & Social Assistance | 2,893 (19.5%) | 11,926 (80.5%) |
| Arts, Entertainment & Recreation | 1,111 (52.1%) | 1,021 (47.9%) |
| Accommodation & Food Services | 3,051 (46.6%) | 3,497 (53.4%) |
| Public Administration | 1,760 (49.1%) | 1,825 (50.9%) |
| Total | 43,693 (51.9%) | 40,429 (48.1%) |
Education in Yellowstone County
School Enrollment in Yellowstone County
The most common levels of schooling among the 37,627 students in Yellowstone County are elementary school (9,113 | 24.2%), high school (8,632 | 22.9%), and middle school (8,134 | 21.6%).
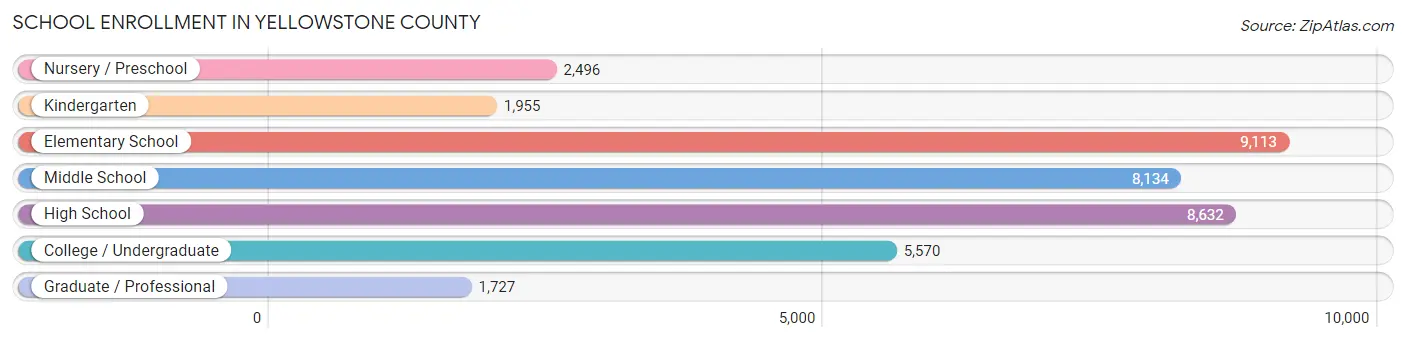
| School Level | # Students | % Students |
| Nursery / Preschool | 2,496 | 6.6% |
| Kindergarten | 1,955 | 5.2% |
| Elementary School | 9,113 | 24.2% |
| Middle School | 8,134 | 21.6% |
| High School | 8,632 | 22.9% |
| College / Undergraduate | 5,570 | 14.8% |
| Graduate / Professional | 1,727 | 4.6% |
| Total | 37,627 | 100.0% |
School Enrollment by Age by Funding Source in Yellowstone County
Out of a total of 37,627 students who are enrolled in schools in Yellowstone County, 6,923 (18.4%) attend a private institution, while the remaining 30,704 (81.6%) are enrolled in public schools. The age group of 3 to 4 year olds has the highest likelihood of being enrolled in private schools, with 838 (50.0% in the age bracket) enrolled. Conversely, the age group of 15 to 17 year olds has the lowest likelihood of being enrolled in a private school, with 5,517 (87.2% in the age bracket) attending a public institution.
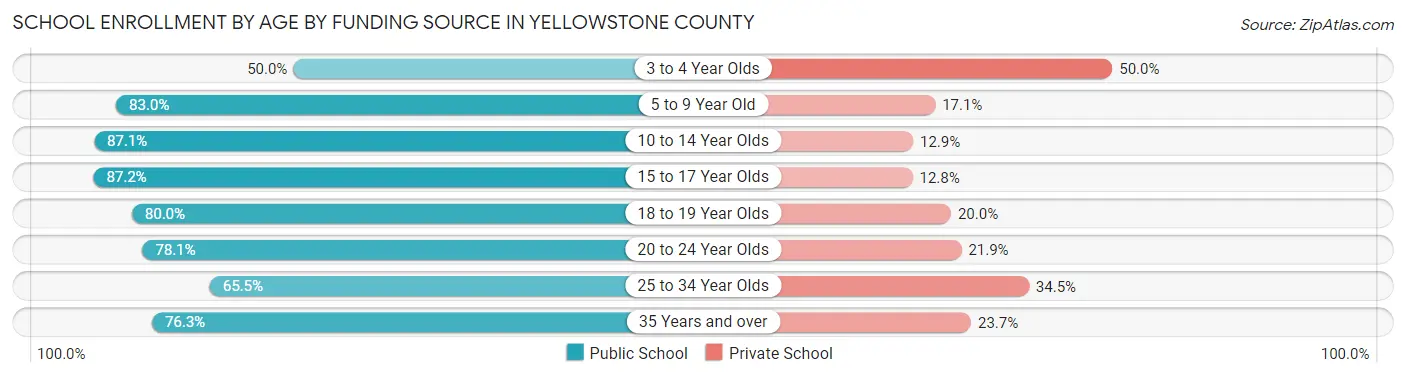
| Age Bracket | Public School | Private School |
| 3 to 4 Year Olds | 837 (50.0%) | 838 (50.0%) |
| 5 to 9 Year Old | 8,481 (83.0%) | 1,743 (17.1%) |
| 10 to 14 Year Olds | 9,539 (87.1%) | 1,415 (12.9%) |
| 15 to 17 Year Olds | 5,517 (87.2%) | 812 (12.8%) |
| 18 to 19 Year Olds | 1,797 (80.0%) | 449 (20.0%) |
| 20 to 24 Year Olds | 2,178 (78.1%) | 612 (21.9%) |
| 25 to 34 Year Olds | 1,435 (65.5%) | 756 (34.5%) |
| 35 Years and over | 929 (76.3%) | 289 (23.7%) |
| Total | 30,704 (81.6%) | 6,923 (18.4%) |
Educational Attainment by Field of Study in Yellowstone County
Business (8,249 | 19.2%), education (6,821 | 15.9%), science & technology (5,903 | 13.8%), bio, nature & agricultural (3,072 | 7.2%), and engineering (2,799 | 6.5%) are the most common fields of study among 42,912 individuals in Yellowstone County who have obtained a bachelor's degree or higher.
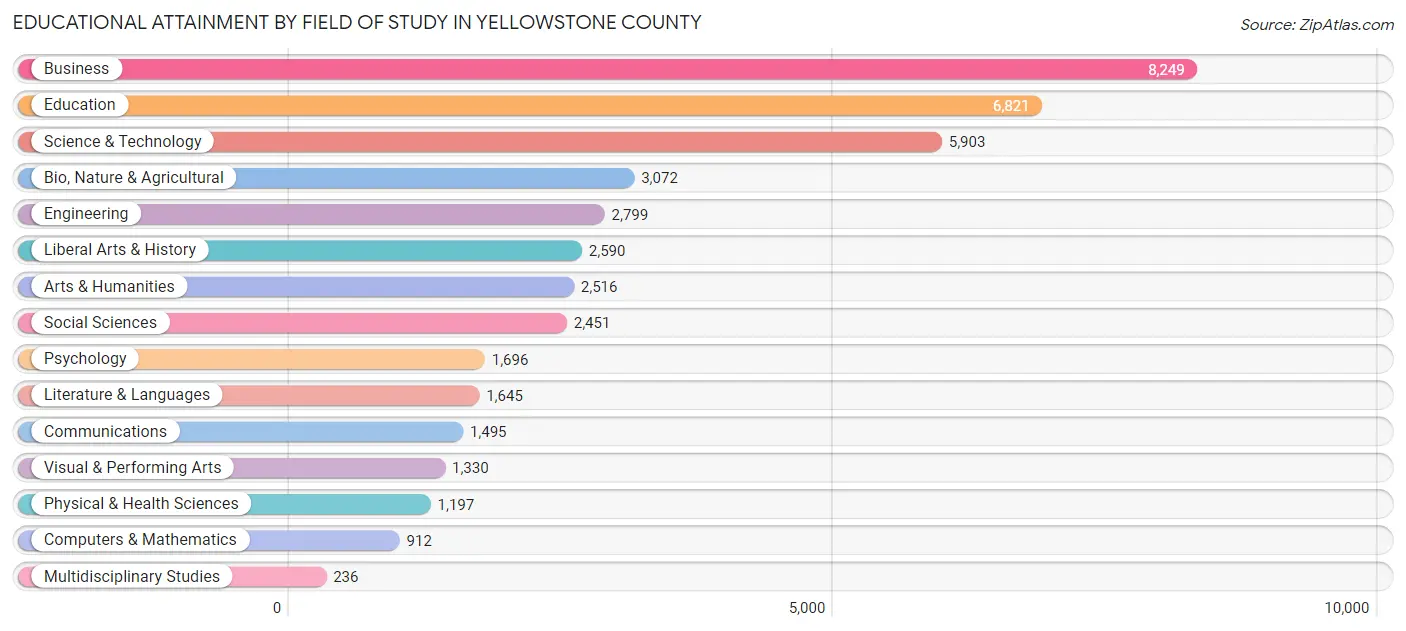
| Field of Study | # Graduates | % Graduates |
| Computers & Mathematics | 912 | 2.1% |
| Bio, Nature & Agricultural | 3,072 | 7.2% |
| Physical & Health Sciences | 1,197 | 2.8% |
| Psychology | 1,696 | 4.0% |
| Social Sciences | 2,451 | 5.7% |
| Engineering | 2,799 | 6.5% |
| Multidisciplinary Studies | 236 | 0.5% |
| Science & Technology | 5,903 | 13.8% |
| Business | 8,249 | 19.2% |
| Education | 6,821 | 15.9% |
| Literature & Languages | 1,645 | 3.8% |
| Liberal Arts & History | 2,590 | 6.0% |
| Visual & Performing Arts | 1,330 | 3.1% |
| Communications | 1,495 | 3.5% |
| Arts & Humanities | 2,516 | 5.9% |
| Total | 42,912 | 100.0% |
Transportation & Commute in Yellowstone County
Vehicle Availability by Sex in Yellowstone County
The most prevalent vehicle ownership categories in Yellowstone County are males with 2 vehicles (16,573, accounting for 38.6%) and females with 2 vehicles (15,298, making up 41.9%).
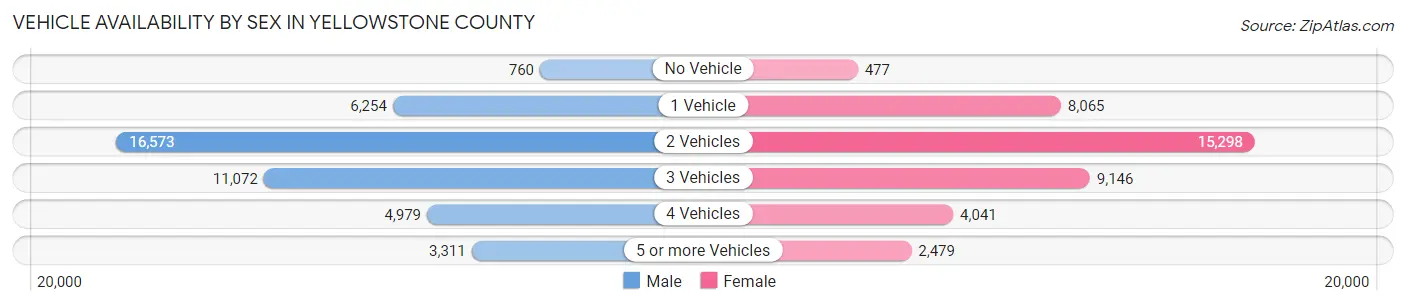
| Vehicles Available | Male | Female |
| No Vehicle | 760 (1.8%) | 477 (1.2%) |
| 1 Vehicle | 6,254 (14.6%) | 8,065 (20.4%) |
| 2 Vehicles | 16,573 (38.6%) | 15,298 (38.7%) |
| 3 Vehicles | 11,072 (25.8%) | 9,146 (23.2%) |
| 4 Vehicles | 4,979 (11.6%) | 4,041 (10.2%) |
| 5 or more Vehicles | 3,311 (7.7%) | 2,479 (6.3%) |
| Total | 42,949 (100.0%) | 39,506 (100.0%) |
Commute Time in Yellowstone County
The most frequently occuring commute durations in Yellowstone County are 15 to 19 minutes (19,109 commuters, 24.8%), 10 to 14 minutes (15,404 commuters, 20.0%), and 20 to 24 minutes (12,773 commuters, 16.6%).
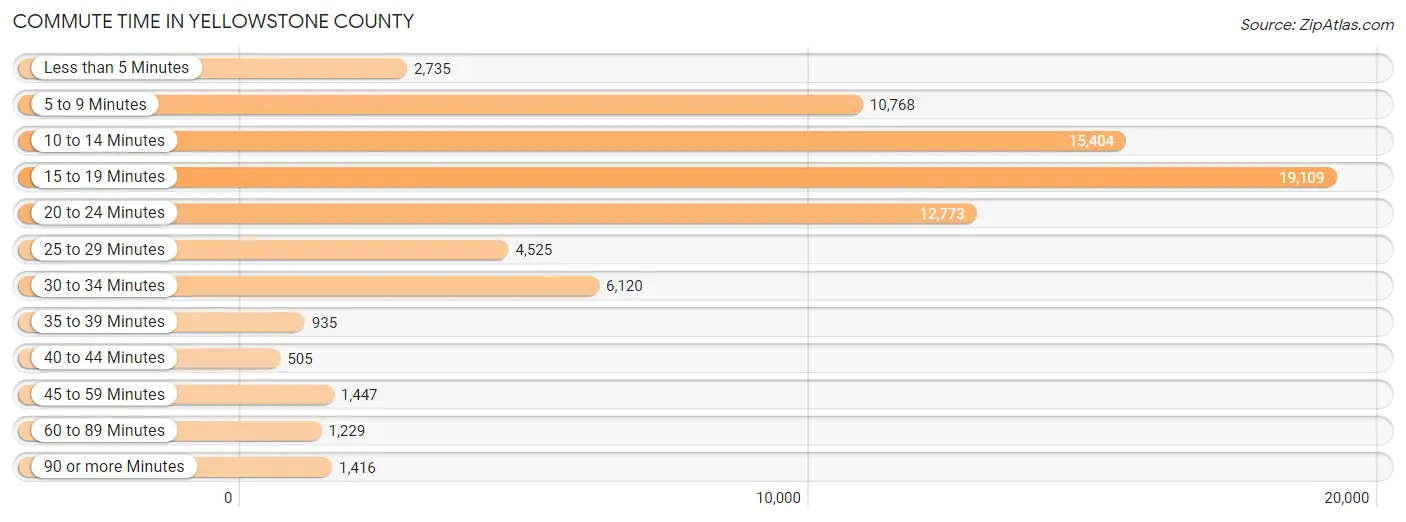
| Commute Time | # Commuters | % Commuters |
| Less than 5 Minutes | 2,735 | 3.5% |
| 5 to 9 Minutes | 10,768 | 14.0% |
| 10 to 14 Minutes | 15,404 | 20.0% |
| 15 to 19 Minutes | 19,109 | 24.8% |
| 20 to 24 Minutes | 12,773 | 16.6% |
| 25 to 29 Minutes | 4,525 | 5.9% |
| 30 to 34 Minutes | 6,120 | 8.0% |
| 35 to 39 Minutes | 935 | 1.2% |
| 40 to 44 Minutes | 505 | 0.7% |
| 45 to 59 Minutes | 1,447 | 1.9% |
| 60 to 89 Minutes | 1,229 | 1.6% |
| 90 or more Minutes | 1,416 | 1.8% |
Commute Time by Sex in Yellowstone County
The most common commute times in Yellowstone County are 15 to 19 minutes (9,823 commuters, 24.1%) for males and 15 to 19 minutes (9,286 commuters, 25.6%) for females.
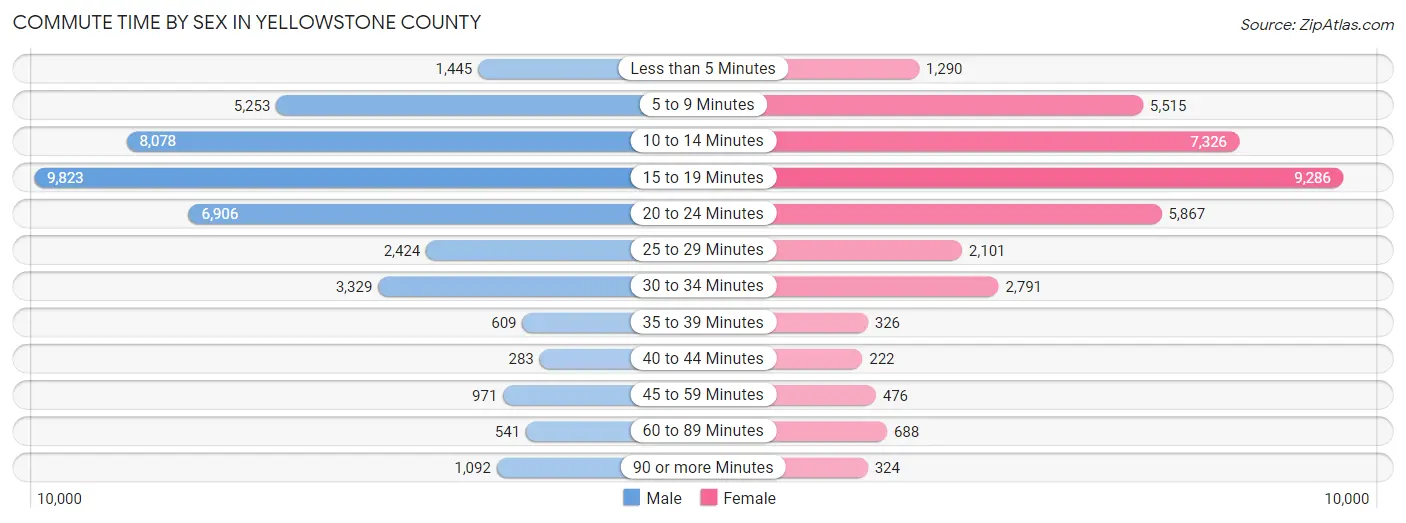
| Commute Time | Male | Female |
| Less than 5 Minutes | 1,445 (3.5%) | 1,290 (3.6%) |
| 5 to 9 Minutes | 5,253 (12.9%) | 5,515 (15.2%) |
| 10 to 14 Minutes | 8,078 (19.8%) | 7,326 (20.2%) |
| 15 to 19 Minutes | 9,823 (24.1%) | 9,286 (25.6%) |
| 20 to 24 Minutes | 6,906 (17.0%) | 5,867 (16.2%) |
| 25 to 29 Minutes | 2,424 (5.9%) | 2,101 (5.8%) |
| 30 to 34 Minutes | 3,329 (8.2%) | 2,791 (7.7%) |
| 35 to 39 Minutes | 609 (1.5%) | 326 (0.9%) |
| 40 to 44 Minutes | 283 (0.7%) | 222 (0.6%) |
| 45 to 59 Minutes | 971 (2.4%) | 476 (1.3%) |
| 60 to 89 Minutes | 541 (1.3%) | 688 (1.9%) |
| 90 or more Minutes | 1,092 (2.7%) | 324 (0.9%) |
Time of Departure to Work by Sex in Yellowstone County
The most frequent times of departure to work in Yellowstone County are 7:30 AM to 7:59 AM (6,463, 15.9%) for males and 7:30 AM to 7:59 AM (7,412, 20.5%) for females.
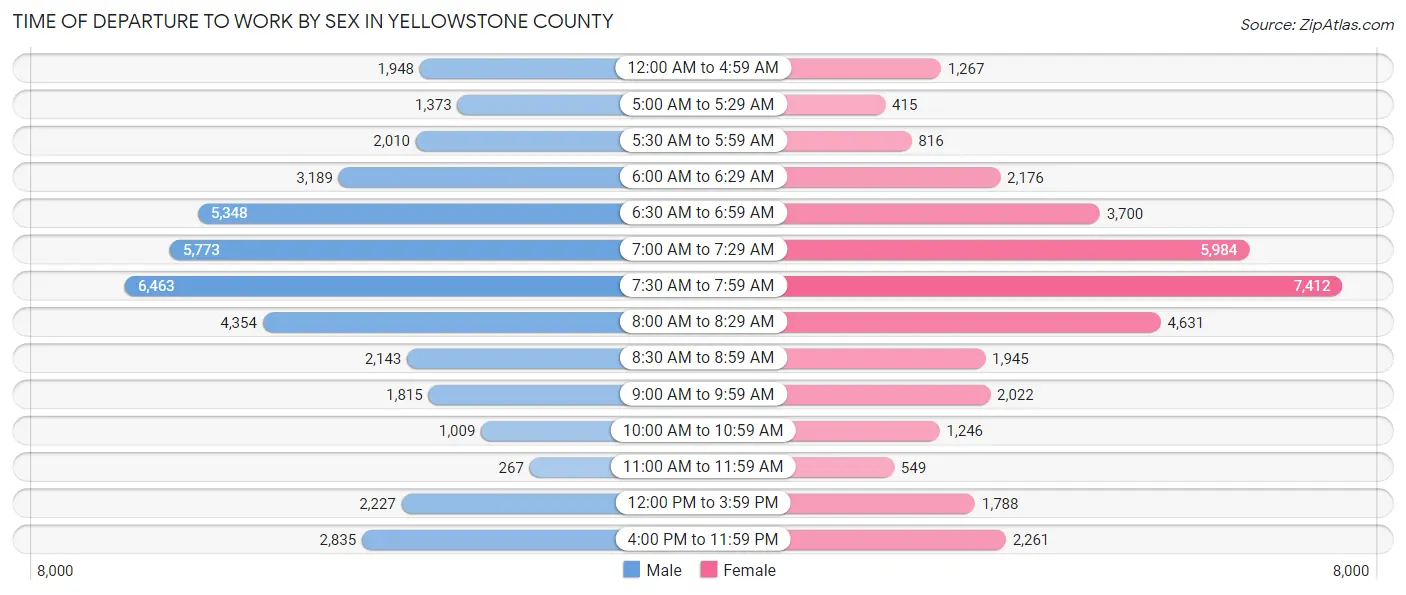
| Time of Departure | Male | Female |
| 12:00 AM to 4:59 AM | 1,948 (4.8%) | 1,267 (3.5%) |
| 5:00 AM to 5:29 AM | 1,373 (3.4%) | 415 (1.1%) |
| 5:30 AM to 5:59 AM | 2,010 (4.9%) | 816 (2.2%) |
| 6:00 AM to 6:29 AM | 3,189 (7.8%) | 2,176 (6.0%) |
| 6:30 AM to 6:59 AM | 5,348 (13.1%) | 3,700 (10.2%) |
| 7:00 AM to 7:29 AM | 5,773 (14.2%) | 5,984 (16.5%) |
| 7:30 AM to 7:59 AM | 6,463 (15.9%) | 7,412 (20.5%) |
| 8:00 AM to 8:29 AM | 4,354 (10.7%) | 4,631 (12.8%) |
| 8:30 AM to 8:59 AM | 2,143 (5.3%) | 1,945 (5.4%) |
| 9:00 AM to 9:59 AM | 1,815 (4.4%) | 2,022 (5.6%) |
| 10:00 AM to 10:59 AM | 1,009 (2.5%) | 1,246 (3.4%) |
| 11:00 AM to 11:59 AM | 267 (0.7%) | 549 (1.5%) |
| 12:00 PM to 3:59 PM | 2,227 (5.5%) | 1,788 (4.9%) |
| 4:00 PM to 11:59 PM | 2,835 (7.0%) | 2,261 (6.2%) |
| Total | 40,754 (100.0%) | 36,212 (100.0%) |
Housing Occupancy in Yellowstone County
Occupancy by Ownership in Yellowstone County
Of the total 67,897 dwellings in Yellowstone County, owner-occupied units account for 47,210 (69.5%), while renter-occupied units make up 20,687 (30.5%).
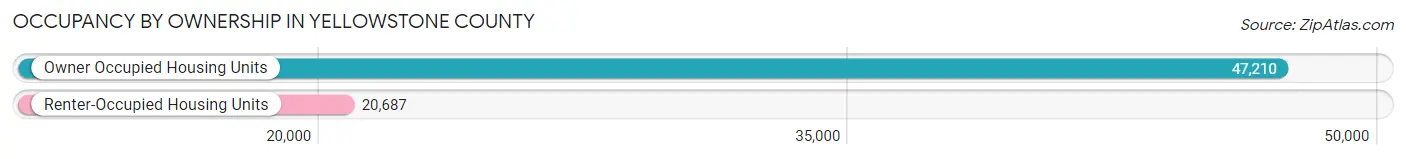
| Occupancy | # Housing Units | % Housing Units |
| Owner Occupied Housing Units | 47,210 | 69.5% |
| Renter-Occupied Housing Units | 20,687 | 30.5% |
| Total Occupied Housing Units | 67,897 | 100.0% |
Occupancy by Household Size in Yellowstone County
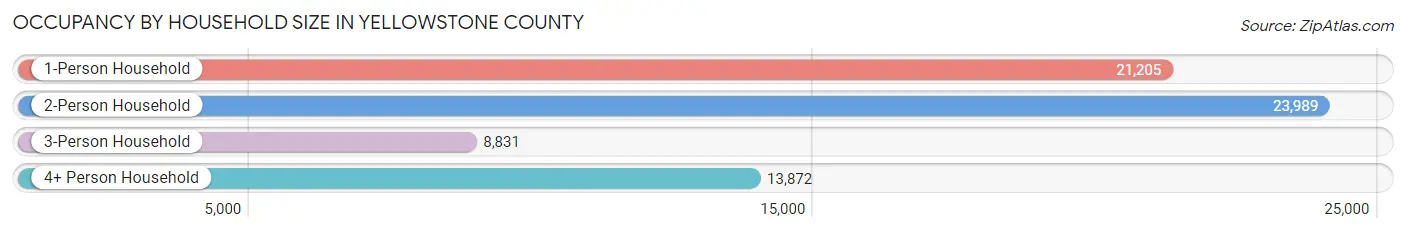
| Household Size | # Housing Units | % Housing Units |
| 1-Person Household | 21,205 | 31.2% |
| 2-Person Household | 23,989 | 35.3% |
| 3-Person Household | 8,831 | 13.0% |
| 4+ Person Household | 13,872 | 20.4% |
| Total Housing Units | 67,897 | 100.0% |
Occupancy by Ownership by Household Size in Yellowstone County
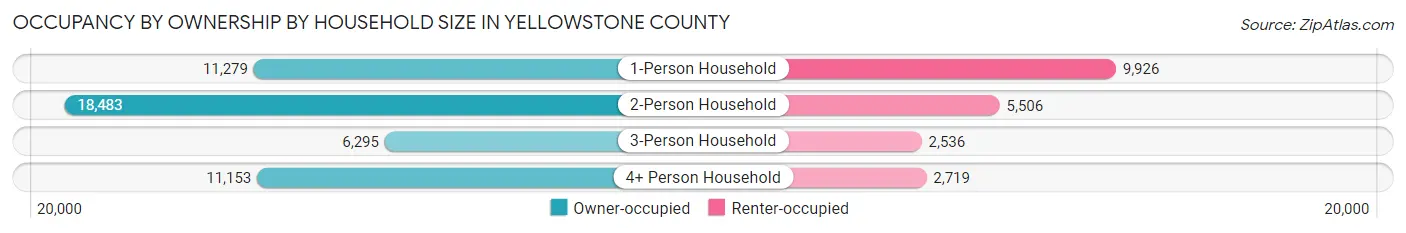
| Household Size | Owner-occupied | Renter-occupied |
| 1-Person Household | 11,279 (53.2%) | 9,926 (46.8%) |
| 2-Person Household | 18,483 (77.0%) | 5,506 (23.0%) |
| 3-Person Household | 6,295 (71.3%) | 2,536 (28.7%) |
| 4+ Person Household | 11,153 (80.4%) | 2,719 (19.6%) |
| Total Housing Units | 47,210 (69.5%) | 20,687 (30.5%) |
Occupancy by Educational Attainment in Yellowstone County
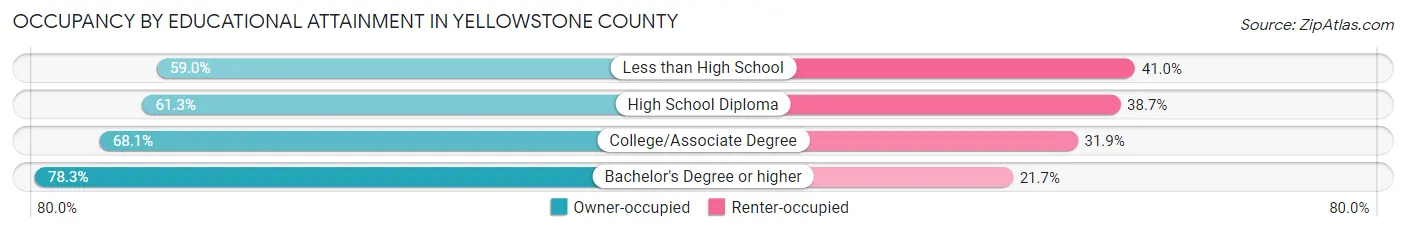
| Household Size | Owner-occupied | Renter-occupied |
| Less than High School | 1,560 (59.0%) | 1,085 (41.0%) |
| High School Diploma | 11,250 (61.3%) | 7,102 (38.7%) |
| College/Associate Degree | 15,502 (68.1%) | 7,276 (31.9%) |
| Bachelor's Degree or higher | 18,898 (78.3%) | 5,224 (21.7%) |
Occupancy by Age of Householder in Yellowstone County
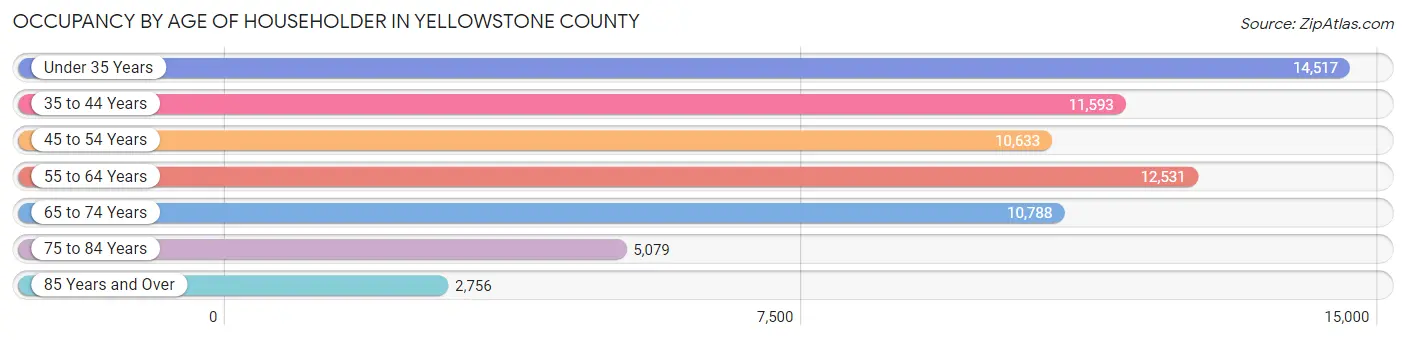
| Age Bracket | # Households | % Households |
| Under 35 Years | 14,517 | 21.4% |
| 35 to 44 Years | 11,593 | 17.1% |
| 45 to 54 Years | 10,633 | 15.7% |
| 55 to 64 Years | 12,531 | 18.5% |
| 65 to 74 Years | 10,788 | 15.9% |
| 75 to 84 Years | 5,079 | 7.5% |
| 85 Years and Over | 2,756 | 4.1% |
| Total | 67,897 | 100.0% |
Housing Finances in Yellowstone County
Median Income by Occupancy in Yellowstone County
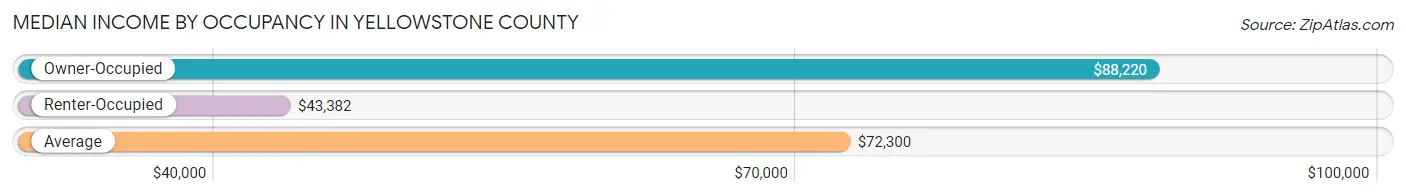
| Occupancy Type | # Households | Median Income |
| Owner-Occupied | 47,210 (69.5%) | $88,220 |
| Renter-Occupied | 20,687 (30.5%) | $43,382 |
| Average | 67,897 (100.0%) | $72,300 |
Occupancy by Householder Income Bracket in Yellowstone County
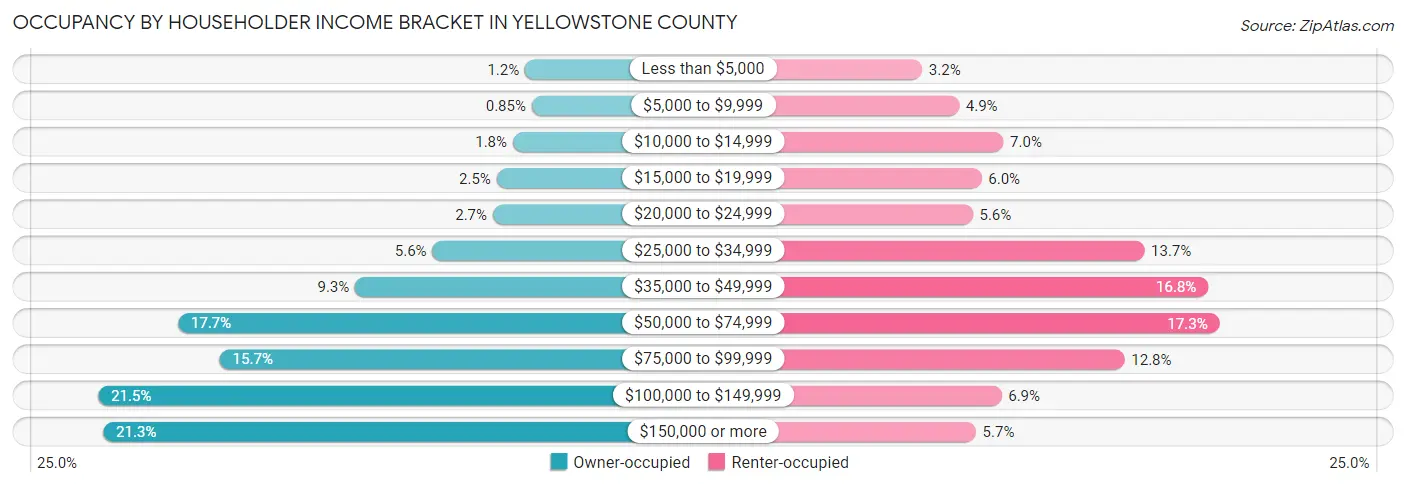
| Income Bracket | Owner-occupied | Renter-occupied |
| Less than $5,000 | 551 (1.2%) | 653 (3.2%) |
| $5,000 to $9,999 | 399 (0.9%) | 1,018 (4.9%) |
| $10,000 to $14,999 | 827 (1.8%) | 1,455 (7.0%) |
| $15,000 to $19,999 | 1,189 (2.5%) | 1,239 (6.0%) |
| $20,000 to $24,999 | 1,277 (2.7%) | 1,153 (5.6%) |
| $25,000 to $34,999 | 2,636 (5.6%) | 2,843 (13.7%) |
| $35,000 to $49,999 | 4,372 (9.3%) | 3,474 (16.8%) |
| $50,000 to $74,999 | 8,357 (17.7%) | 3,585 (17.3%) |
| $75,000 to $99,999 | 7,419 (15.7%) | 2,647 (12.8%) |
| $100,000 to $149,999 | 10,148 (21.5%) | 1,436 (6.9%) |
| $150,000 or more | 10,035 (21.3%) | 1,184 (5.7%) |
| Total | 47,210 (100.0%) | 20,687 (100.0%) |
Monthly Housing Cost Tiers in Yellowstone County
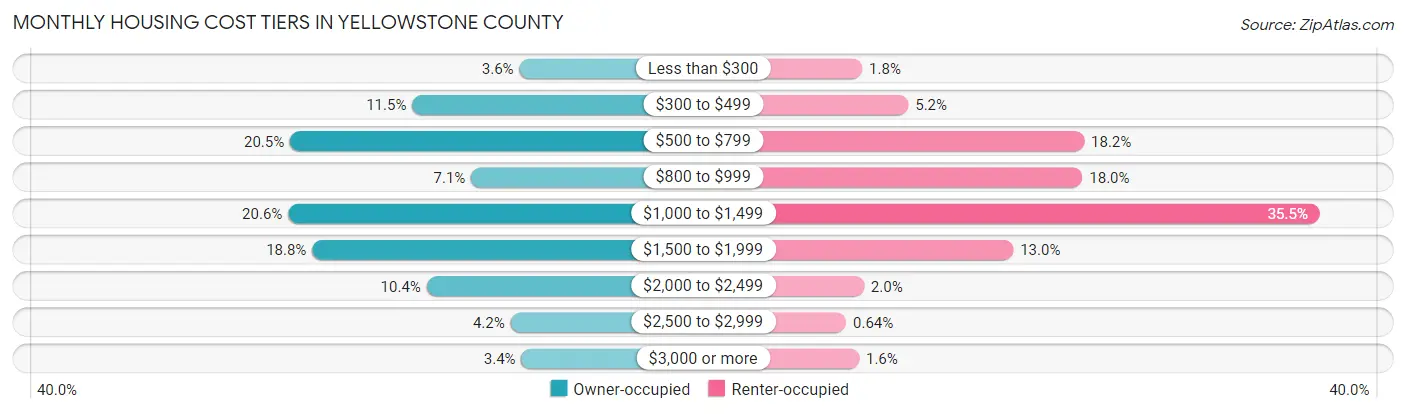
| Monthly Cost | Owner-occupied | Renter-occupied |
| Less than $300 | 1,679 (3.6%) | 377 (1.8%) |
| $300 to $499 | 5,407 (11.5%) | 1,080 (5.2%) |
| $500 to $799 | 9,653 (20.4%) | 3,758 (18.2%) |
| $800 to $999 | 3,355 (7.1%) | 3,731 (18.0%) |
| $1,000 to $1,499 | 9,722 (20.6%) | 7,348 (35.5%) |
| $1,500 to $1,999 | 8,887 (18.8%) | 2,679 (13.0%) |
| $2,000 to $2,499 | 4,907 (10.4%) | 403 (1.9%) |
| $2,500 to $2,999 | 1,988 (4.2%) | 133 (0.6%) |
| $3,000 or more | 1,612 (3.4%) | 328 (1.6%) |
| Total | 47,210 (100.0%) | 20,687 (100.0%) |
Physical Housing Characteristics in Yellowstone County
Housing Structures in Yellowstone County
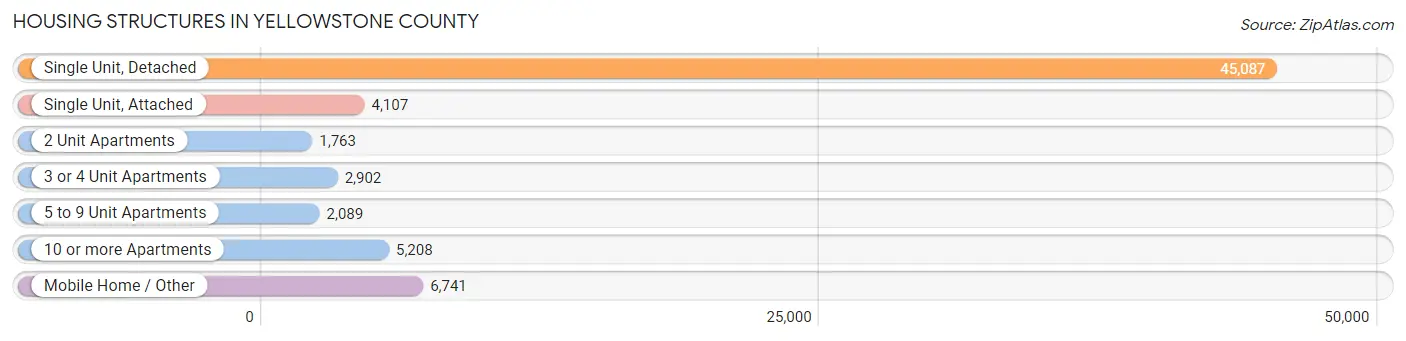
| Structure Type | # Housing Units | % Housing Units |
| Single Unit, Detached | 45,087 | 66.4% |
| Single Unit, Attached | 4,107 | 6.0% |
| 2 Unit Apartments | 1,763 | 2.6% |
| 3 or 4 Unit Apartments | 2,902 | 4.3% |
| 5 to 9 Unit Apartments | 2,089 | 3.1% |
| 10 or more Apartments | 5,208 | 7.7% |
| Mobile Home / Other | 6,741 | 9.9% |
| Total | 67,897 | 100.0% |
Housing Structures by Occupancy in Yellowstone County
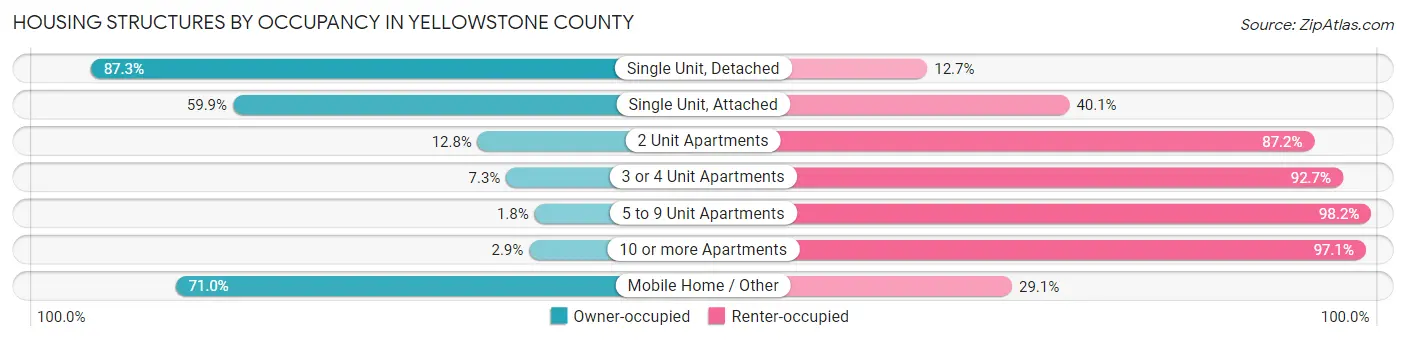
| Structure Type | Owner-occupied | Renter-occupied |
| Single Unit, Detached | 39,344 (87.3%) | 5,743 (12.7%) |
| Single Unit, Attached | 2,460 (59.9%) | 1,647 (40.1%) |
| 2 Unit Apartments | 225 (12.8%) | 1,538 (87.2%) |
| 3 or 4 Unit Apartments | 211 (7.3%) | 2,691 (92.7%) |
| 5 to 9 Unit Apartments | 38 (1.8%) | 2,051 (98.2%) |
| 10 or more Apartments | 149 (2.9%) | 5,059 (97.1%) |
| Mobile Home / Other | 4,783 (71.0%) | 1,958 (29.0%) |
| Total | 47,210 (69.5%) | 20,687 (30.5%) |
Housing Structures by Number of Rooms in Yellowstone County
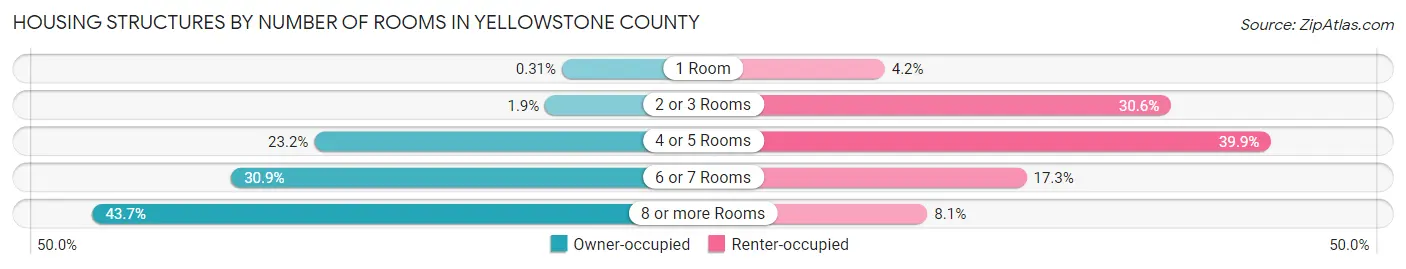
| Number of Rooms | Owner-occupied | Renter-occupied |
| 1 Room | 145 (0.3%) | 858 (4.2%) |
| 2 or 3 Rooms | 880 (1.9%) | 6,334 (30.6%) |
| 4 or 5 Rooms | 10,962 (23.2%) | 8,251 (39.9%) |
| 6 or 7 Rooms | 14,581 (30.9%) | 3,571 (17.3%) |
| 8 or more Rooms | 20,642 (43.7%) | 1,673 (8.1%) |
| Total | 47,210 (100.0%) | 20,687 (100.0%) |
Housing Structure by Heating Type in Yellowstone County
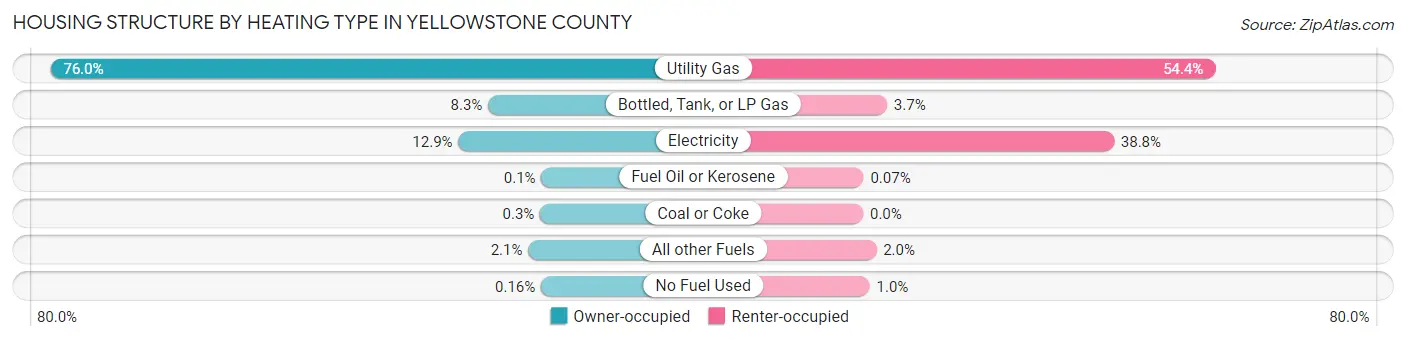
| Heating Type | Owner-occupied | Renter-occupied |
| Utility Gas | 35,890 (76.0%) | 11,259 (54.4%) |
| Bottled, Tank, or LP Gas | 3,938 (8.3%) | 763 (3.7%) |
| Electricity | 6,109 (12.9%) | 8,021 (38.8%) |
| Fuel Oil or Kerosene | 46 (0.1%) | 14 (0.1%) |
| Coal or Coke | 141 (0.3%) | 0 (0.0%) |
| All other Fuels | 1,011 (2.1%) | 421 (2.0%) |
| No Fuel Used | 75 (0.2%) | 209 (1.0%) |
| Total | 47,210 (100.0%) | 20,687 (100.0%) |
Household Vehicle Usage in Yellowstone County
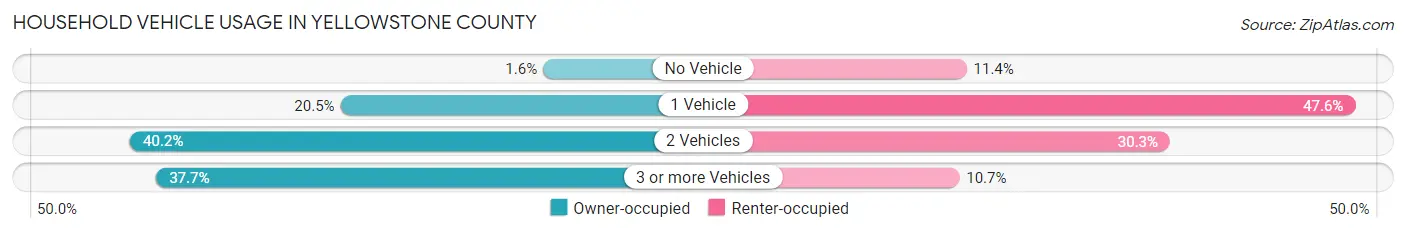
| Vehicles per Household | Owner-occupied | Renter-occupied |
| No Vehicle | 762 (1.6%) | 2,350 (11.4%) |
| 1 Vehicle | 9,687 (20.5%) | 9,854 (47.6%) |
| 2 Vehicles | 18,959 (40.2%) | 6,274 (30.3%) |
| 3 or more Vehicles | 17,802 (37.7%) | 2,209 (10.7%) |
| Total | 47,210 (100.0%) | 20,687 (100.0%) |
Real Estate & Mortgages in Yellowstone County
Real Estate and Mortgage Overview in Yellowstone County
| Characteristic | Without Mortgage | With Mortgage |
| Housing Units | 19,192 | 28,018 |
| Median Property Value | $273,300 | $300,000 |
| Median Household Income | $69,079 | $6,699 |
| Monthly Housing Costs | $570 | $1,612 |
| Real Estate Taxes | $2,487 | $427 |
Property Value by Mortgage Status in Yellowstone County
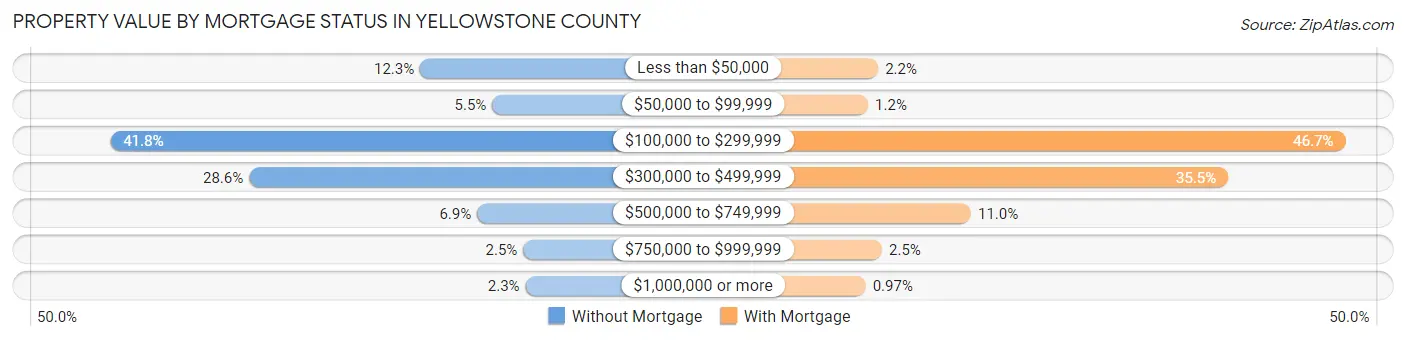
| Property Value | Without Mortgage | With Mortgage |
| Less than $50,000 | 2,368 (12.3%) | 605 (2.2%) |
| $50,000 to $99,999 | 1,049 (5.5%) | 337 (1.2%) |
| $100,000 to $299,999 | 8,030 (41.8%) | 13,071 (46.7%) |
| $300,000 to $499,999 | 5,493 (28.6%) | 9,940 (35.5%) |
| $500,000 to $749,999 | 1,327 (6.9%) | 3,083 (11.0%) |
| $750,000 to $999,999 | 483 (2.5%) | 710 (2.5%) |
| $1,000,000 or more | 442 (2.3%) | 272 (1.0%) |
| Total | 19,192 (100.0%) | 28,018 (100.0%) |
Household Income by Mortgage Status in Yellowstone County
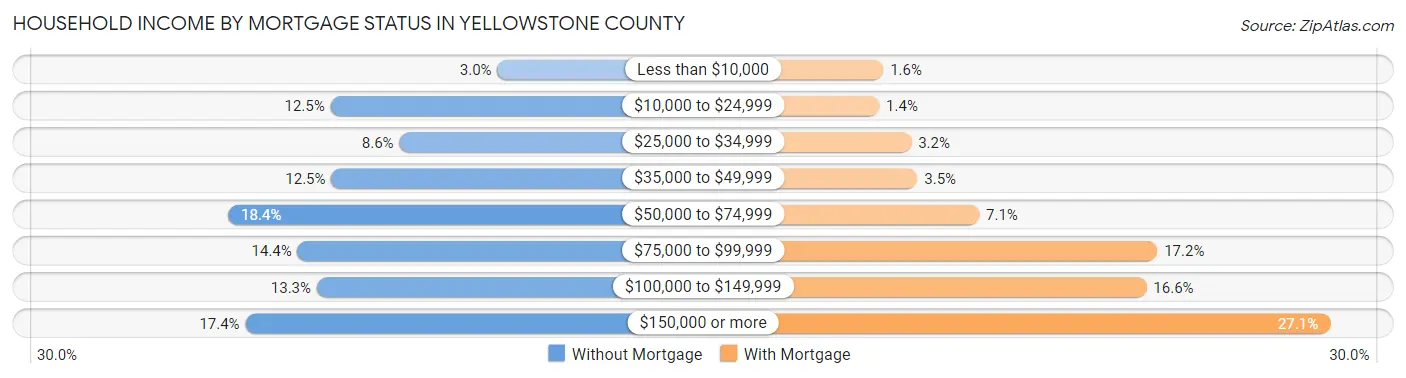
| Household Income | Without Mortgage | With Mortgage |
| Less than $10,000 | 572 (3.0%) | 442 (1.6%) |
| $10,000 to $24,999 | 2,403 (12.5%) | 378 (1.3%) |
| $25,000 to $34,999 | 1,646 (8.6%) | 890 (3.2%) |
| $35,000 to $49,999 | 2,393 (12.5%) | 990 (3.5%) |
| $50,000 to $74,999 | 3,526 (18.4%) | 1,979 (7.1%) |
| $75,000 to $99,999 | 2,763 (14.4%) | 4,831 (17.2%) |
| $100,000 to $149,999 | 2,553 (13.3%) | 4,656 (16.6%) |
| $150,000 or more | 3,336 (17.4%) | 7,595 (27.1%) |
| Total | 19,192 (100.0%) | 28,018 (100.0%) |
Property Value to Household Income Ratio in Yellowstone County
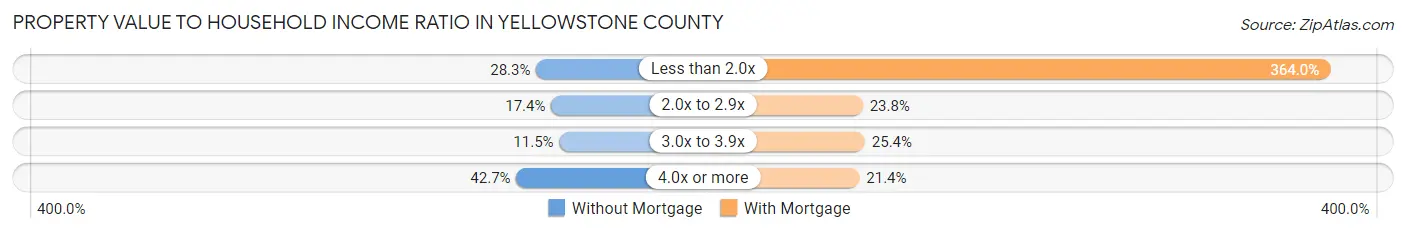
| Value-to-Income Ratio | Without Mortgage | With Mortgage |
| Less than 2.0x | 5,422 (28.2%) | 101,990 (364.0%) |
| 2.0x to 2.9x | 3,333 (17.4%) | 6,672 (23.8%) |
| 3.0x to 3.9x | 2,203 (11.5%) | 7,113 (25.4%) |
| 4.0x or more | 8,199 (42.7%) | 5,994 (21.4%) |
| Total | 19,192 (100.0%) | 28,018 (100.0%) |
Real Estate Taxes by Mortgage Status in Yellowstone County
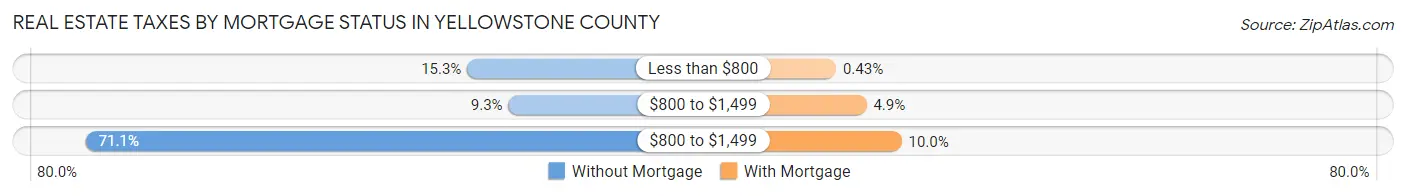
| Property Taxes | Without Mortgage | With Mortgage |
| Less than $800 | 2,943 (15.3%) | 120 (0.4%) |
| $800 to $1,499 | 1,784 (9.3%) | 1,368 (4.9%) |
| $800 to $1,499 | 13,642 (71.1%) | 2,804 (10.0%) |
| Total | 19,192 (100.0%) | 28,018 (100.0%) |
Health & Disability in Yellowstone County
Health Insurance Coverage by Age in Yellowstone County
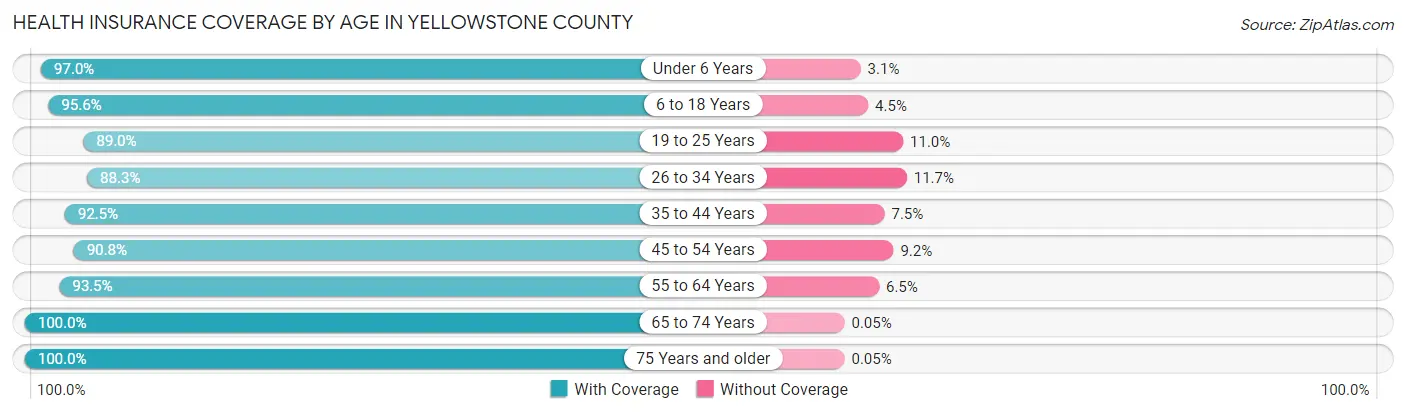
| Age Bracket | With Coverage | Without Coverage |
| Under 6 Years | 11,579 (97.0%) | 364 (3.0%) |
| 6 to 18 Years | 27,072 (95.6%) | 1,261 (4.4%) |
| 19 to 25 Years | 12,146 (89.0%) | 1,496 (11.0%) |
| 26 to 34 Years | 17,825 (88.3%) | 2,352 (11.7%) |
| 35 to 44 Years | 19,841 (92.5%) | 1,610 (7.5%) |
| 45 to 54 Years | 16,899 (90.8%) | 1,707 (9.2%) |
| 55 to 64 Years | 19,632 (93.5%) | 1,361 (6.5%) |
| 65 to 74 Years | 16,966 (100.0%) | 8 (0.1%) |
| 75 Years and older | 11,237 (100.0%) | 6 (0.1%) |
| Total | 153,197 (93.8%) | 10,165 (6.2%) |
Health Insurance Coverage by Citizenship Status in Yellowstone County
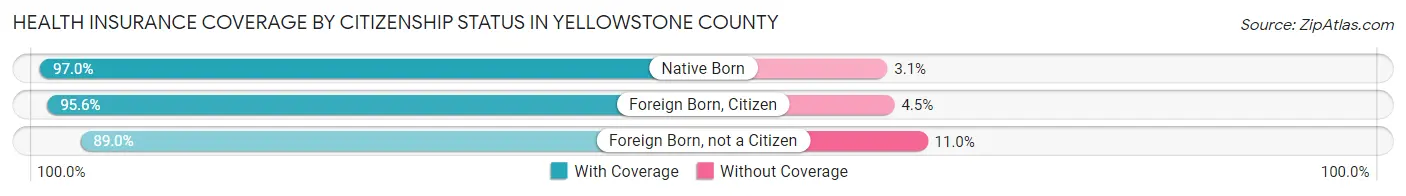
| Citizenship Status | With Coverage | Without Coverage |
| Native Born | 11,579 (97.0%) | 364 (3.0%) |
| Foreign Born, Citizen | 27,072 (95.6%) | 1,261 (4.4%) |
| Foreign Born, not a Citizen | 12,146 (89.0%) | 1,496 (11.0%) |
Health Insurance Coverage by Household Income in Yellowstone County
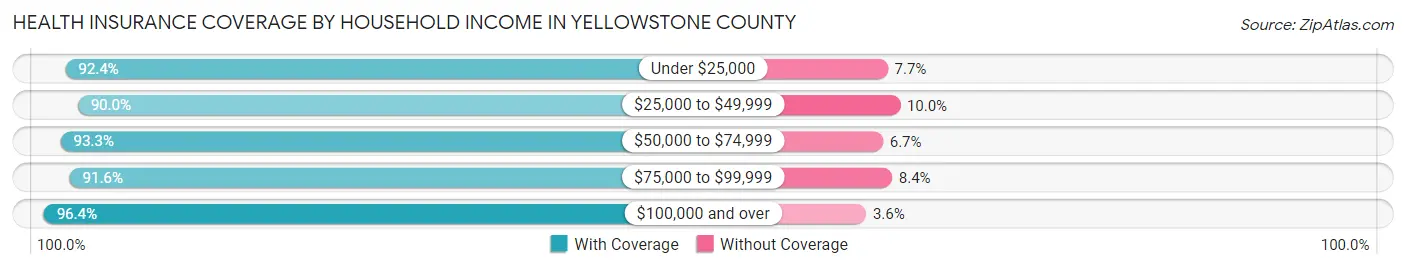
| Household Income | With Coverage | Without Coverage |
| Under $25,000 | 14,372 (92.3%) | 1,190 (7.6%) |
| $25,000 to $49,999 | 21,987 (90.0%) | 2,432 (10.0%) |
| $50,000 to $74,999 | 25,542 (93.3%) | 1,845 (6.7%) |
| $75,000 to $99,999 | 23,881 (91.6%) | 2,201 (8.4%) |
| $100,000 and over | 66,139 (96.4%) | 2,462 (3.6%) |
Public vs Private Health Insurance Coverage by Age in Yellowstone County
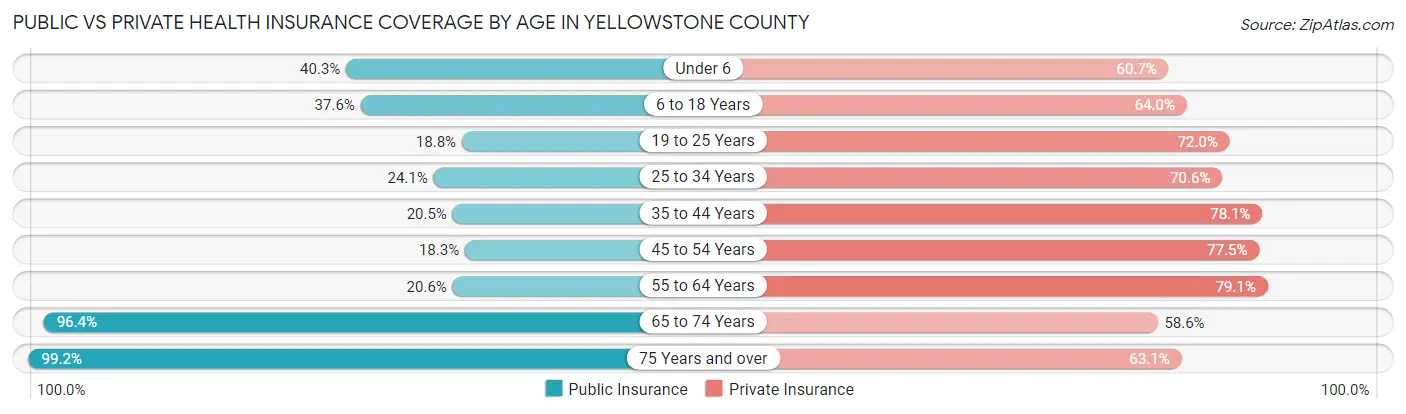
| Age Bracket | Public Insurance | Private Insurance |
| Under 6 | 4,814 (40.3%) | 7,245 (60.7%) |
| 6 to 18 Years | 10,658 (37.6%) | 18,141 (64.0%) |
| 19 to 25 Years | 2,569 (18.8%) | 9,822 (72.0%) |
| 25 to 34 Years | 4,862 (24.1%) | 14,246 (70.6%) |
| 35 to 44 Years | 4,406 (20.5%) | 16,746 (78.1%) |
| 45 to 54 Years | 3,397 (18.3%) | 14,415 (77.5%) |
| 55 to 64 Years | 4,314 (20.5%) | 16,596 (79.0%) |
| 65 to 74 Years | 16,370 (96.4%) | 9,945 (58.6%) |
| 75 Years and over | 11,157 (99.2%) | 7,092 (63.1%) |
| Total | 62,547 (38.3%) | 114,248 (69.9%) |
Disability Status by Sex by Age in Yellowstone County
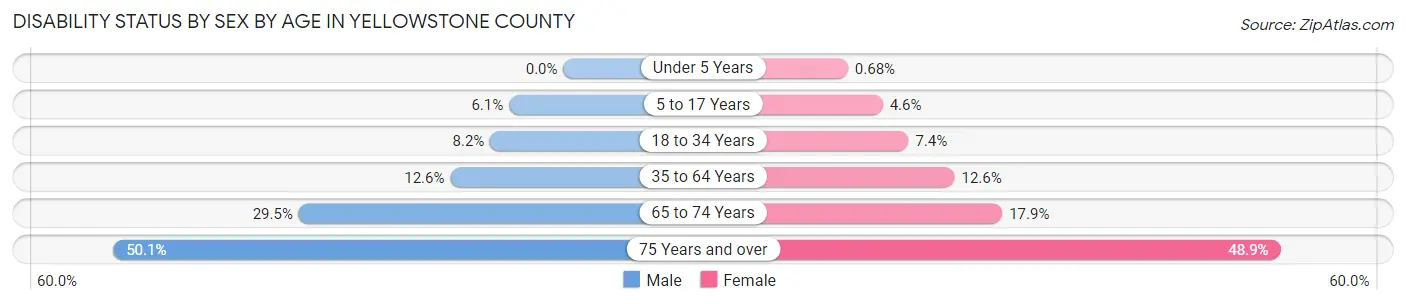
| Age Bracket | Male | Female |
| Under 5 Years | 0 (0.0%) | 31 (0.7%) |
| 5 to 17 Years | 879 (6.0%) | 640 (4.6%) |
| 18 to 34 Years | 1,476 (8.2%) | 1,323 (7.4%) |
| 35 to 64 Years | 3,858 (12.6%) | 3,819 (12.6%) |
| 65 to 74 Years | 2,393 (29.5%) | 1,582 (17.9%) |
| 75 Years and over | 2,389 (50.1%) | 3,164 (48.8%) |
Disability Class by Sex by Age in Yellowstone County
Disability Class: Hearing Difficulty
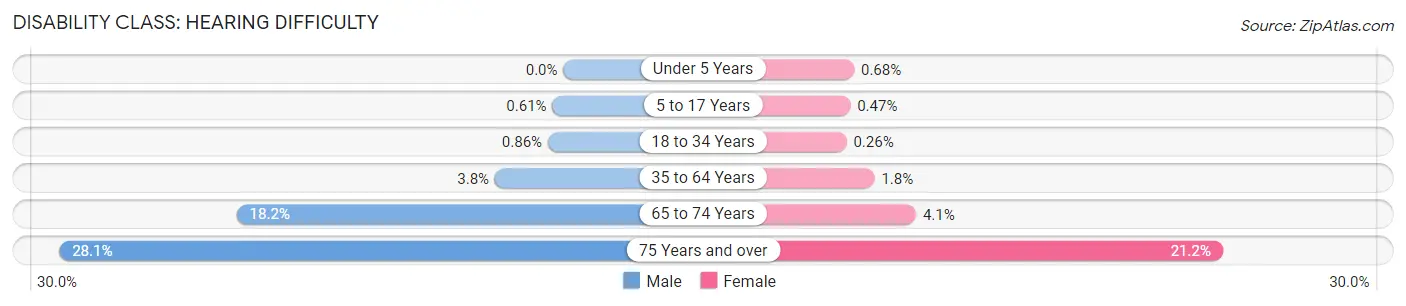
| Age Bracket | Male | Female |
| Under 5 Years | 0 (0.0%) | 31 (0.7%) |
| 5 to 17 Years | 88 (0.6%) | 66 (0.5%) |
| 18 to 34 Years | 156 (0.9%) | 47 (0.3%) |
| 35 to 64 Years | 1,168 (3.8%) | 553 (1.8%) |
| 65 to 74 Years | 1,477 (18.2%) | 366 (4.1%) |
| 75 Years and over | 1,338 (28.1%) | 1,374 (21.2%) |
Disability Class: Vision Difficulty
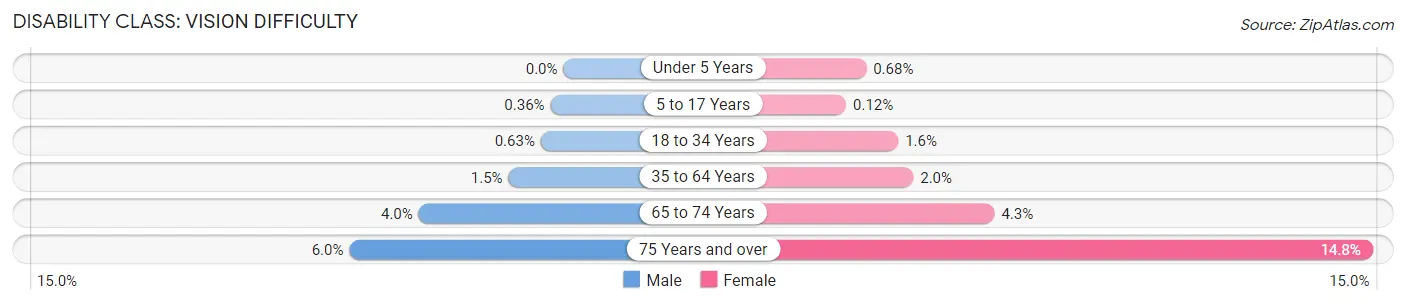
| Age Bracket | Male | Female |
| Under 5 Years | 0 (0.0%) | 31 (0.7%) |
| 5 to 17 Years | 53 (0.4%) | 17 (0.1%) |
| 18 to 34 Years | 115 (0.6%) | 279 (1.6%) |
| 35 to 64 Years | 470 (1.5%) | 604 (2.0%) |
| 65 to 74 Years | 327 (4.0%) | 376 (4.3%) |
| 75 Years and over | 284 (6.0%) | 957 (14.8%) |
Disability Class: Cognitive Difficulty
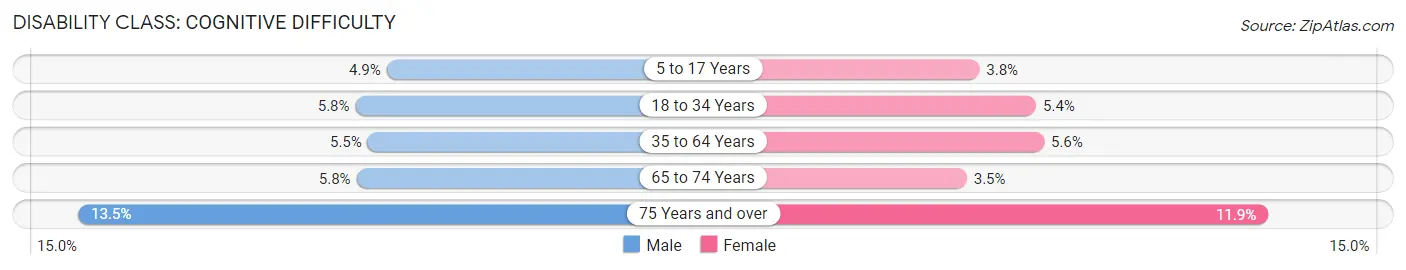
| Age Bracket | Male | Female |
| 5 to 17 Years | 715 (4.9%) | 538 (3.8%) |
| 18 to 34 Years | 1,048 (5.8%) | 963 (5.4%) |
| 35 to 64 Years | 1,670 (5.4%) | 1,711 (5.6%) |
| 65 to 74 Years | 468 (5.8%) | 308 (3.5%) |
| 75 Years and over | 644 (13.5%) | 769 (11.9%) |
Disability Class: Ambulatory Difficulty
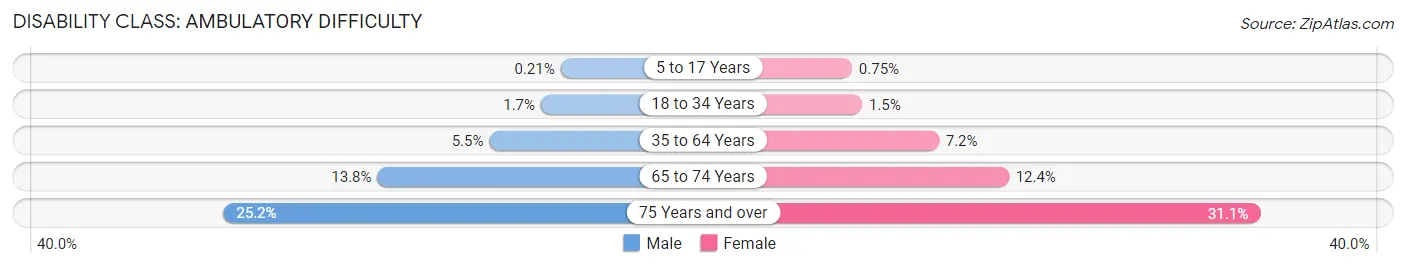
| Age Bracket | Male | Female |
| 5 to 17 Years | 31 (0.2%) | 105 (0.7%) |
| 18 to 34 Years | 302 (1.7%) | 267 (1.5%) |
| 35 to 64 Years | 1,684 (5.5%) | 2,191 (7.2%) |
| 65 to 74 Years | 1,121 (13.8%) | 1,097 (12.4%) |
| 75 Years and over | 1,203 (25.2%) | 2,012 (31.1%) |
Disability Class: Self-Care Difficulty
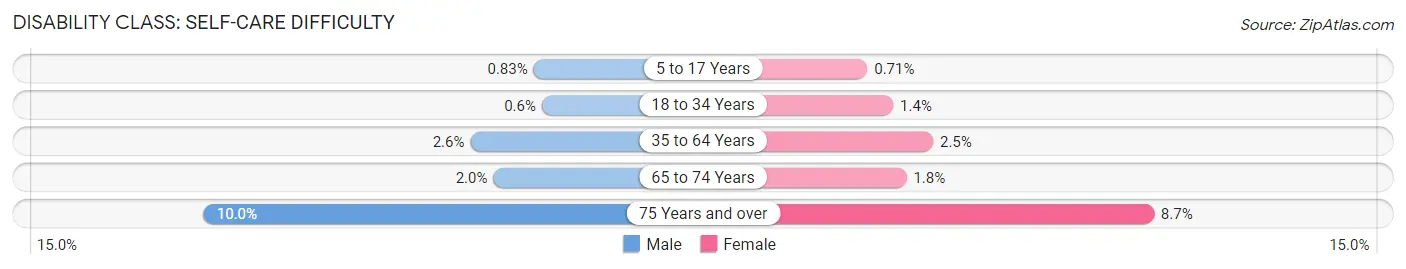
| Age Bracket | Male | Female |
| 5 to 17 Years | 120 (0.8%) | 100 (0.7%) |
| 18 to 34 Years | 108 (0.6%) | 255 (1.4%) |
| 35 to 64 Years | 795 (2.6%) | 772 (2.5%) |
| 65 to 74 Years | 158 (1.9%) | 159 (1.8%) |
| 75 Years and over | 477 (10.0%) | 563 (8.7%) |
Technology Access in Yellowstone County
Computing Device Access in Yellowstone County
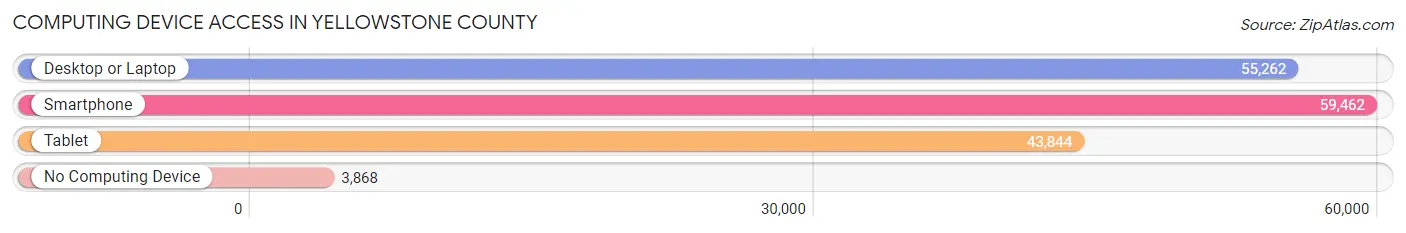
| Device Type | # Households | % Households |
| Desktop or Laptop | 55,262 | 81.4% |
| Smartphone | 59,462 | 87.6% |
| Tablet | 43,844 | 64.6% |
| No Computing Device | 3,868 | 5.7% |
| Total | 67,897 | 100.0% |
Internet Access in Yellowstone County
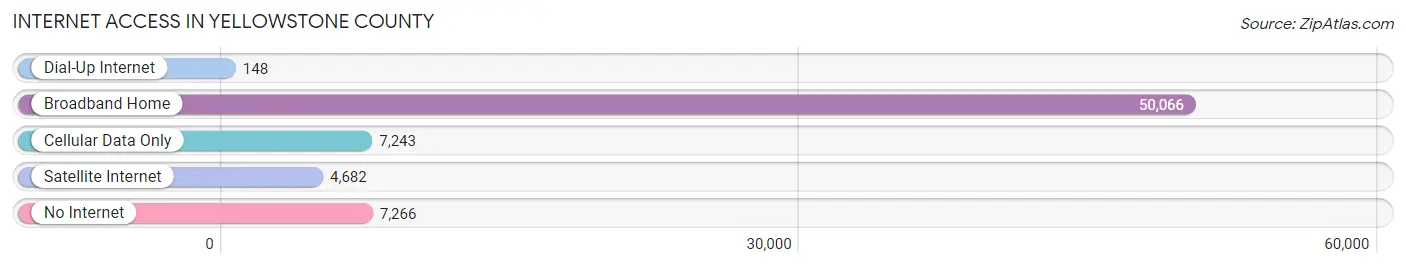
| Internet Type | # Households | % Households |
| Dial-Up Internet | 148 | 0.2% |
| Broadband Home | 50,066 | 73.7% |
| Cellular Data Only | 7,243 | 10.7% |
| Satellite Internet | 4,682 | 6.9% |
| No Internet | 7,266 | 10.7% |
| Total | 67,897 | 100.0% |
Yellowstone County Summary
Yellowstone County is located in the state of Montana, in the northwestern United States. It is the most populous county in the state, with a population of 159,352 as of the 2019 census. The county seat is Billings, the largest city in the state. Yellowstone County is bordered by Carbon County to the north, Big Horn County to the east, Musselshell County to the south, and Stillwater County to the west.
History
Yellowstone County was established in 1883, when the Montana Territory was divided into seven counties. It was named after the Yellowstone River, which flows through the county. The county was originally much larger than it is today, encompassing much of what is now Carbon, Big Horn, Musselshell, and Stillwater counties.
The county was home to the Crow Nation, a Native American tribe, until the late 19th century. The Crow Nation was forced to cede much of their land to the United States government in the late 1800s, and the land was opened up for settlement.
The county was largely rural until the early 20th century, when the city of Billings was established. Billings quickly became the largest city in the state, and the county seat. The city has since become the economic and cultural center of the region.
Geography
Yellowstone County covers an area of 5,269 square miles, making it the largest county in Montana. The county is located in the northern part of the state, and is bordered by Carbon County to the north, Big Horn County to the east, Musselshell County to the south, and Stillwater County to the west.
The county is mostly flat, with rolling hills in the east and south. The Yellowstone River flows through the county, and is the main source of water for the region. The county is home to several lakes, including Lake Elmo, Lake Yellowstone, and Lake Hebgen.
The county is home to several protected areas, including the Custer National Forest, the Pryor Mountains Wild Horse Range, and the Yellowstone National Park.
Economy
The economy of Yellowstone County is largely based on agriculture, tourism, and energy production. Agriculture is the largest sector of the economy, with the county producing wheat, barley, hay, and other crops.
Tourism is also an important part of the economy, with Yellowstone National Park being the main attraction. The park attracts millions of visitors each year, and is a major source of revenue for the county.
Energy production is also an important part of the economy, with the county producing coal, natural gas, and oil.
Demographics
As of the 2019 census, the population of Yellowstone County was 159,352. The population is largely white (90.2%), with small percentages of Native American (3.2%), African American (2.2%), Asian (1.2%), and other races (3.2%).
The median household income in the county is $54,845, and the median home value is $212,400. The unemployment rate is 3.7%.
The largest city in the county is Billings, with a population of 109,059. Other cities in the county include Laurel (7,845), Lockwood (7,717), and Shepherd (2,845).
Common Questions
What is Per Capita Income in Yellowstone County?
Per Capita income in Yellowstone County is $40,978.
What is the Median Family Income in Yellowstone County?
Median Family Income in Yellowstone County is $92,083.
What is the Median Household income in Yellowstone County?
Median Household Income in Yellowstone County is $72,300.
What is Income or Wage Gap in Yellowstone County?
Income or Wage Gap in Yellowstone County is 31.6%.
Women in Yellowstone County earn 68.4 cents for every dollar earned by a man.
What is Family Income Deficit in Yellowstone County?
Family Income Deficit in Yellowstone County is $9,603.
Families that are below poverty line in Yellowstone County earn $9,603 less on average than the poverty threshold level.
What is Inequality or Gini Index in Yellowstone County?
Inequality or Gini Index in Yellowstone County is 0.46.
What is the Total Population of Yellowstone County?
Total Population of Yellowstone County is 165,524.
What is the Total Male Population of Yellowstone County?
Total Male Population of Yellowstone County is 82,077.
What is the Total Female Population of Yellowstone County?
Total Female Population of Yellowstone County is 83,447.
What is the Ratio of Males per 100 Females in Yellowstone County?
There are 98.36 Males per 100 Females in Yellowstone County.
What is the Ratio of Females per 100 Males in Yellowstone County?
There are 101.67 Females per 100 Males in Yellowstone County.
What is the Median Population Age in Yellowstone County?
Median Population Age in Yellowstone County is 38.4 Years.
What is the Average Family Size in Yellowstone County
Average Family Size in Yellowstone County is 3.0 People.
What is the Average Household Size in Yellowstone County
Average Household Size in Yellowstone County is 2.4 People.
How Large is the Labor Force in Yellowstone County?
There are 87,209 People in the Labor Forcein in Yellowstone County.
What is the Percentage of People in the Labor Force in Yellowstone County?
66.2% of People are in the Labor Force in Yellowstone County.
What is the Unemployment Rate in Yellowstone County?
Unemployment Rate in Yellowstone County is 3.5%.