Cascade County, MT Map & Demographics
Cascade County Map
Cascade County Overview
$34,481
PER CAPITA INCOME
$79,780
AVG FAMILY INCOME
$61,351
AVG HOUSEHOLD INCOME
30.9%
WAGE / INCOME GAP [ % ]
69.1¢/ $1
WAGE / INCOME GAP [ $ ]
$9,797
FAMILY INCOME DEFICIT
0.45
INEQUALITY / GINI INDEX
84,423
TOTAL POPULATION
43,002
MALE POPULATION
41,421
FEMALE POPULATION
103.82
MALES / 100 FEMALES
96.32
FEMALES / 100 MALES
37.9
MEDIAN AGE
3.0
AVG FAMILY SIZE
2.4
AVG HOUSEHOLD SIZE
42,464
LABOR FORCE [ PEOPLE ]
62.8%
PERCENT IN LABOR FORCE
3.3%
UNEMPLOYMENT RATE
Cascade County Area Codes
Income in Cascade County
Income Overview in Cascade County
Per Capita Income in Cascade County is $34,481, while median incomes of families and households are $79,780 and $61,351 respectively.
| Characteristic | Number | Measure |
| Per Capita Income | 84,423 | $34,481 |
| Median Family Income | 21,155 | $79,780 |
| Mean Family Income | 21,155 | $98,392 |
| Median Household Income | 34,577 | $61,351 |
| Mean Household Income | 34,577 | $81,299 |
| Income Deficit | 21,155 | $9,797 |
| Wage / Income Gap (%) | 84,423 | 30.93% |
| Wage / Income Gap ($) | 84,423 | 69.07¢ per $1 |
| Gini / Inequality Index | 84,423 | 0.45 |
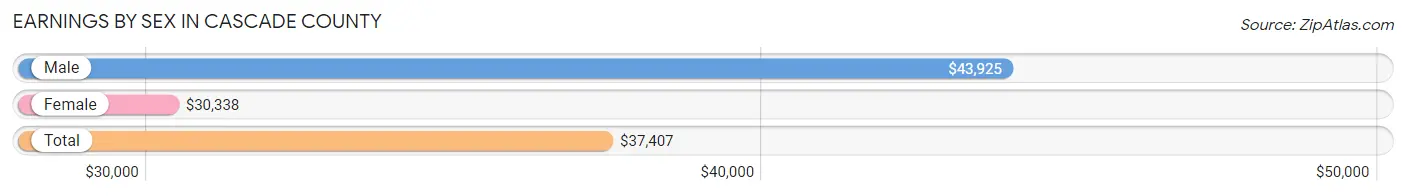
Earnings by Sex in Cascade County
Average Earnings in Cascade County are $37,407, $43,925 for men and $30,338 for women, a difference of 30.9%.
| Sex | Number | Average Earnings |
| Male | 23,868 (53.3%) | $43,925 |
| Female | 20,881 (46.7%) | $30,338 |
| Total | 44,749 (100.0%) | $37,407 |
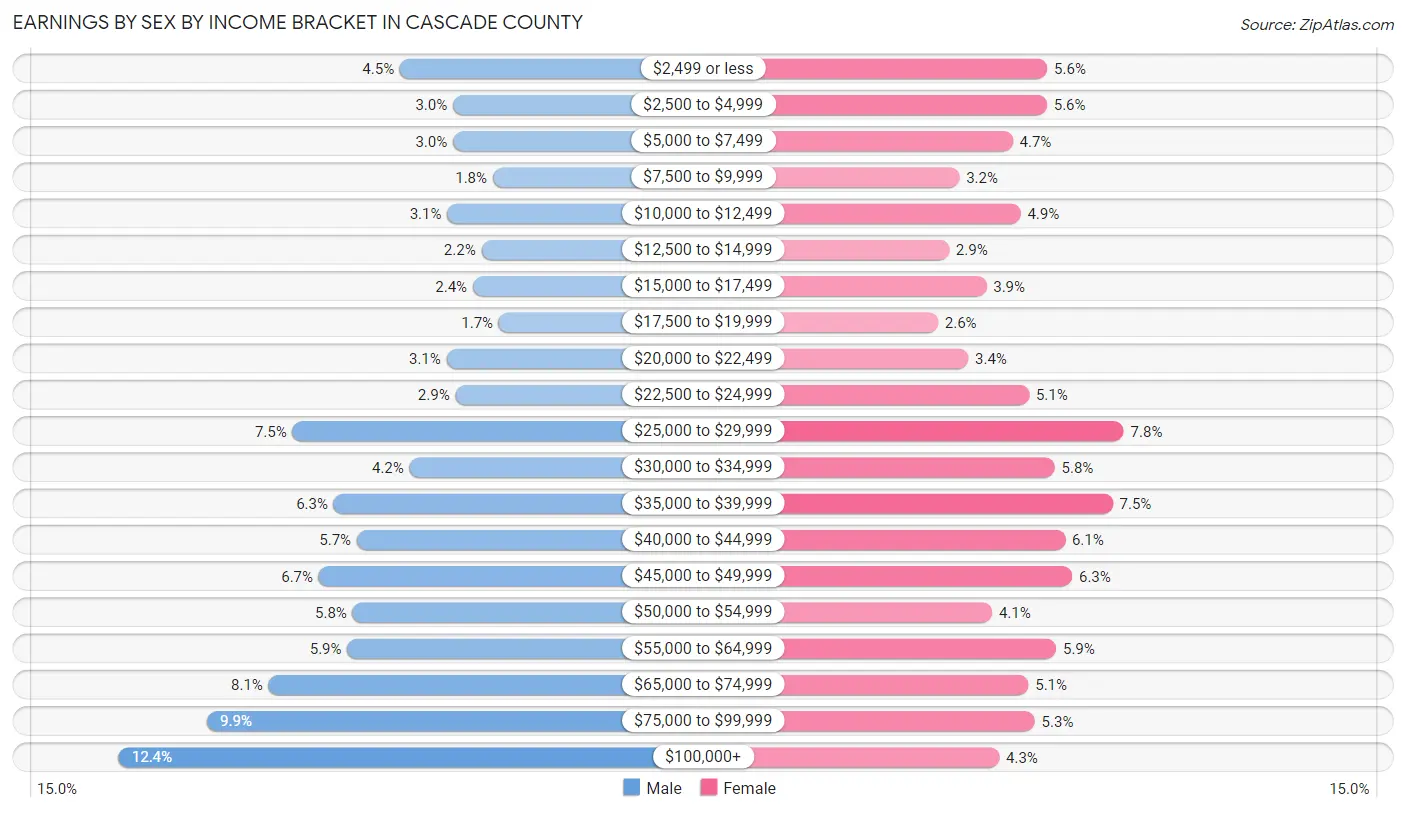
Earnings by Sex by Income Bracket in Cascade County
The most common earnings brackets in Cascade County are $100,000+ for men (2,947 | 12.3%) and $25,000 to $29,999 for women (1,625 | 7.8%).
| Income | Male | Female |
| $2,499 or less | 1,062 (4.4%) | 1,176 (5.6%) |
| $2,500 to $4,999 | 706 (3.0%) | 1,174 (5.6%) |
| $5,000 to $7,499 | 706 (3.0%) | 974 (4.7%) |
| $7,500 to $9,999 | 438 (1.8%) | 659 (3.2%) |
| $10,000 to $12,499 | 744 (3.1%) | 1,018 (4.9%) |
| $12,500 to $14,999 | 516 (2.2%) | 600 (2.9%) |
| $15,000 to $17,499 | 572 (2.4%) | 818 (3.9%) |
| $17,500 to $19,999 | 399 (1.7%) | 534 (2.6%) |
| $20,000 to $22,499 | 749 (3.1%) | 712 (3.4%) |
| $22,500 to $24,999 | 690 (2.9%) | 1,070 (5.1%) |
| $25,000 to $29,999 | 1,783 (7.5%) | 1,625 (7.8%) |
| $30,000 to $34,999 | 997 (4.2%) | 1,220 (5.8%) |
| $35,000 to $39,999 | 1,507 (6.3%) | 1,560 (7.5%) |
| $40,000 to $44,999 | 1,350 (5.7%) | 1,280 (6.1%) |
| $45,000 to $49,999 | 1,607 (6.7%) | 1,321 (6.3%) |
| $50,000 to $54,999 | 1,380 (5.8%) | 852 (4.1%) |
| $55,000 to $64,999 | 1,416 (5.9%) | 1,228 (5.9%) |
| $65,000 to $74,999 | 1,944 (8.1%) | 1,064 (5.1%) |
| $75,000 to $99,999 | 2,355 (9.9%) | 1,103 (5.3%) |
| $100,000+ | 2,947 (12.3%) | 893 (4.3%) |
| Total | 23,868 (100.0%) | 20,881 (100.0%) |
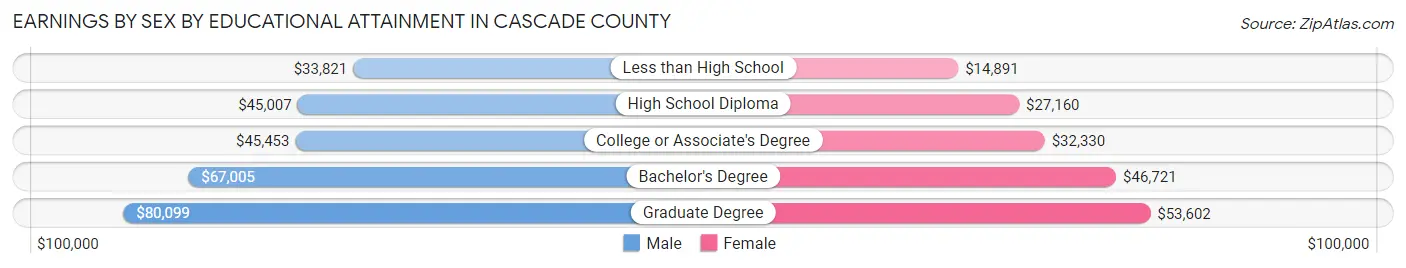
Earnings by Sex by Educational Attainment in Cascade County
Average earnings in Cascade County are $49,075 for men and $36,042 for women, a difference of 26.6%. Men with an educational attainment of graduate degree enjoy the highest average annual earnings of $80,099, while those with less than high school education earn the least with $33,821. Women with an educational attainment of graduate degree earn the most with the average annual earnings of $53,602, while those with less than high school education have the smallest earnings of $14,891.
| Educational Attainment | Male Income | Female Income |
| Less than High School | $33,821 | $14,891 |
| High School Diploma | $45,007 | $27,160 |
| College or Associate's Degree | $45,453 | $32,330 |
| Bachelor's Degree | $67,005 | $46,721 |
| Graduate Degree | $80,099 | $53,602 |
| Total | $49,075 | $36,042 |
Family Income in Cascade County
Family Income Brackets in Cascade County
According to the Cascade County family income data, there are 4,379 families falling into the $100,000 to $149,999 income range, which is the most common income bracket and makes up 20.7% of all families. Conversely, the less than $10,000 income bracket is the least frequent group with only 444 families (2.1%) belonging to this category.
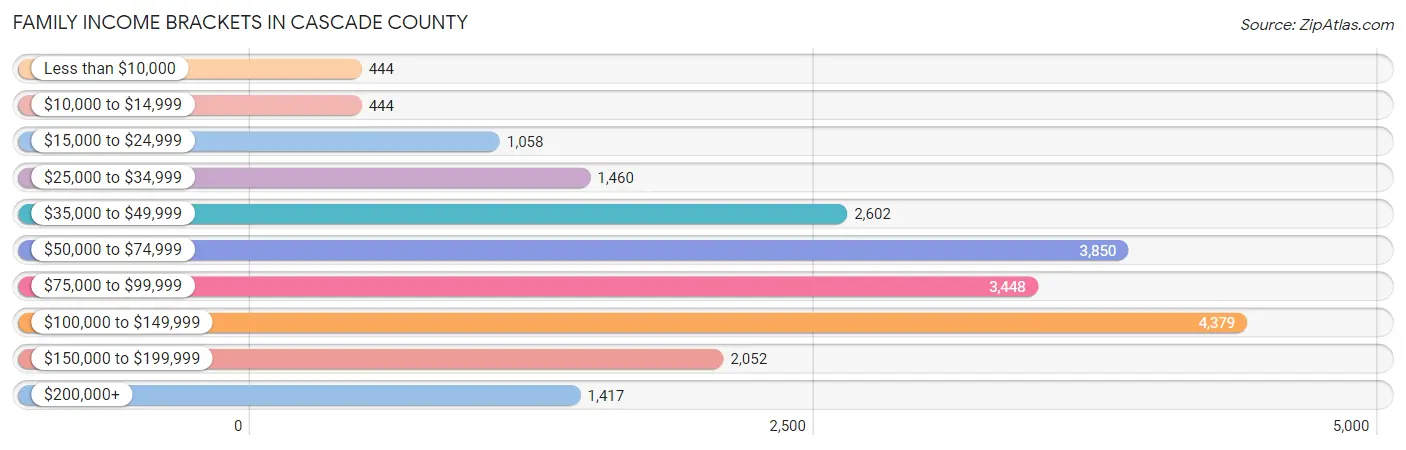
| Income Bracket | # Families | % Families |
| Less than $10,000 | 444 | 2.1% |
| $10,000 to $14,999 | 444 | 2.1% |
| $15,000 to $24,999 | 1,058 | 5.0% |
| $25,000 to $34,999 | 1,460 | 6.9% |
| $35,000 to $49,999 | 2,602 | 12.3% |
| $50,000 to $74,999 | 3,850 | 18.2% |
| $75,000 to $99,999 | 3,448 | 16.3% |
| $100,000 to $149,999 | 4,379 | 20.7% |
| $150,000 to $199,999 | 2,052 | 9.7% |
| $200,000+ | 1,417 | 6.7% |
Family Income by Famaliy Size in Cascade County
6-person families (570 | 2.7%) account for the highest median family income in Cascade County with $108,000 per family, while 2-person families (11,728 | 55.4%) have the highest median income of $37,820 per family member.
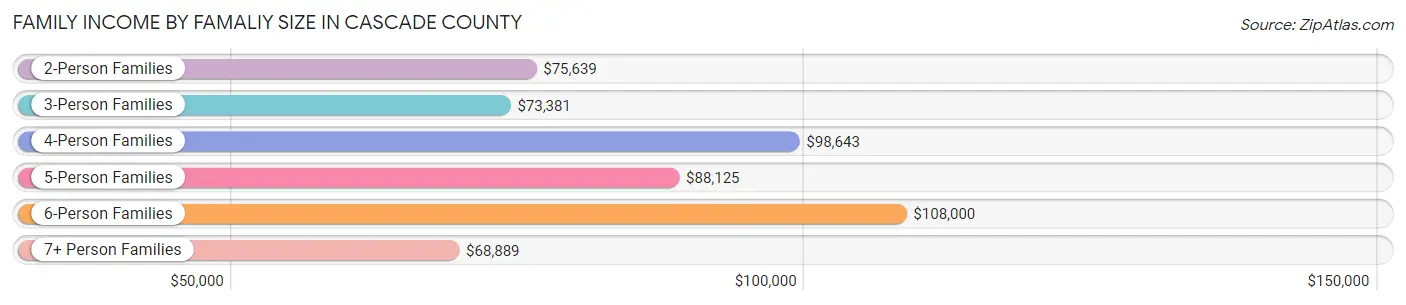
| Income Bracket | # Families | Median Income |
| 2-Person Families | 11,728 (55.4%) | $75,639 |
| 3-Person Families | 4,391 (20.8%) | $73,381 |
| 4-Person Families | 3,081 (14.6%) | $98,643 |
| 5-Person Families | 1,055 (5.0%) | $88,125 |
| 6-Person Families | 570 (2.7%) | $108,000 |
| 7+ Person Families | 330 (1.6%) | $68,889 |
| Total | 21,155 (100.0%) | $79,780 |
Family Income by Number of Earners in Cascade County
The median family income in Cascade County is $79,780, with families comprising 3+ earners (1,575) having the highest median family income of $142,946, while families with no earners (3,442) have the lowest median family income of $49,610, accounting for 7.4% and 16.3% of families, respectively.
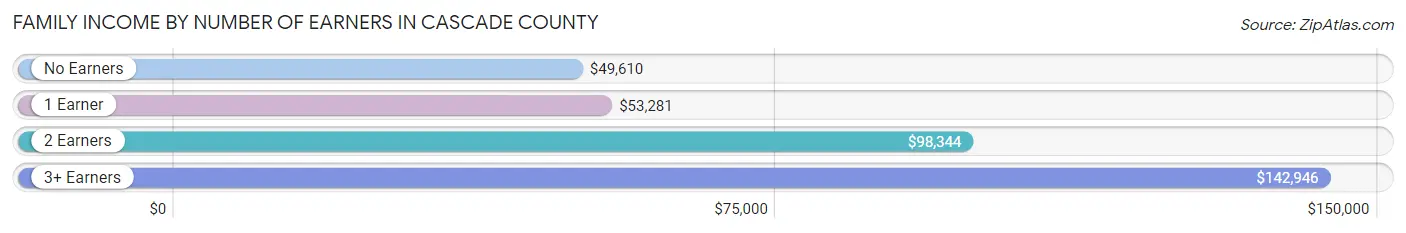
| Number of Earners | # Families | Median Income |
| No Earners | 3,442 (16.3%) | $49,610 |
| 1 Earner | 6,834 (32.3%) | $53,281 |
| 2 Earners | 9,304 (44.0%) | $98,344 |
| 3+ Earners | 1,575 (7.4%) | $142,946 |
| Total | 21,155 (100.0%) | $79,780 |
Household Income in Cascade County
Household Income Brackets in Cascade County
With 6,743 households falling in the category, the $50,000 to $74,999 income range is the most frequent in Cascade County, accounting for 19.5% of all households. In contrast, only 1,660 households (4.8%) fall into the less than $10,000 income bracket, making it the least populous group.
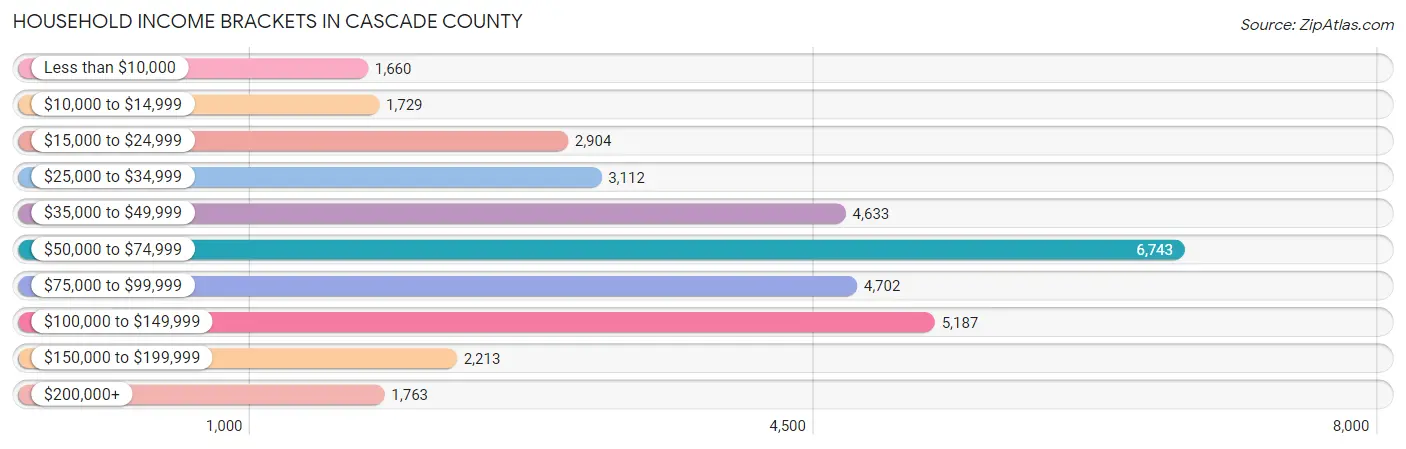
| Income Bracket | # Households | % Households |
| Less than $10,000 | 1,660 | 4.8% |
| $10,000 to $14,999 | 1,729 | 5.0% |
| $15,000 to $24,999 | 2,904 | 8.4% |
| $25,000 to $34,999 | 3,112 | 9.0% |
| $35,000 to $49,999 | 4,633 | 13.4% |
| $50,000 to $74,999 | 6,743 | 19.5% |
| $75,000 to $99,999 | 4,702 | 13.6% |
| $100,000 to $149,999 | 5,187 | 15.0% |
| $150,000 to $199,999 | 2,213 | 6.4% |
| $200,000+ | 1,763 | 5.1% |
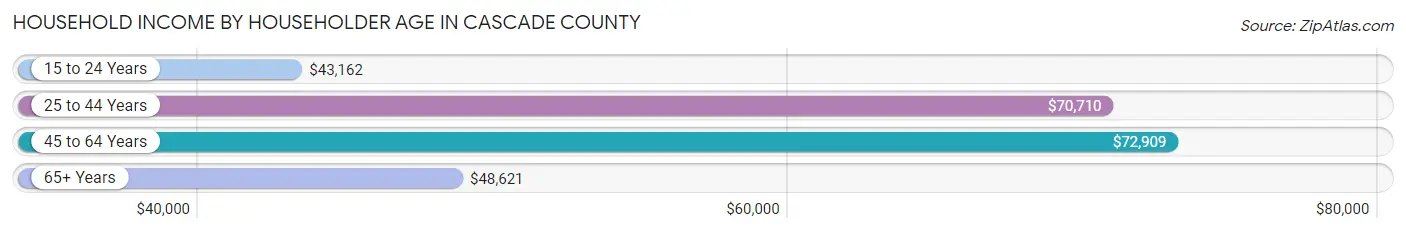
Household Income by Householder Age in Cascade County
The median household income in Cascade County is $61,351, with the highest median household income of $72,909 found in the 45 to 64 years age bracket for the primary householder. A total of 11,027 households (31.9%) fall into this category. Meanwhile, the 15 to 24 years age bracket for the primary householder has the lowest median household income of $43,162, with 1,790 households (5.2%) in this group.
| Income Bracket | # Households | Median Income |
| 15 to 24 Years | 1,790 (5.2%) | $43,162 |
| 25 to 44 Years | 11,173 (32.3%) | $70,710 |
| 45 to 64 Years | 11,027 (31.9%) | $72,909 |
| 65+ Years | 10,587 (30.6%) | $48,621 |
| Total | 34,577 (100.0%) | $61,351 |
Poverty in Cascade County
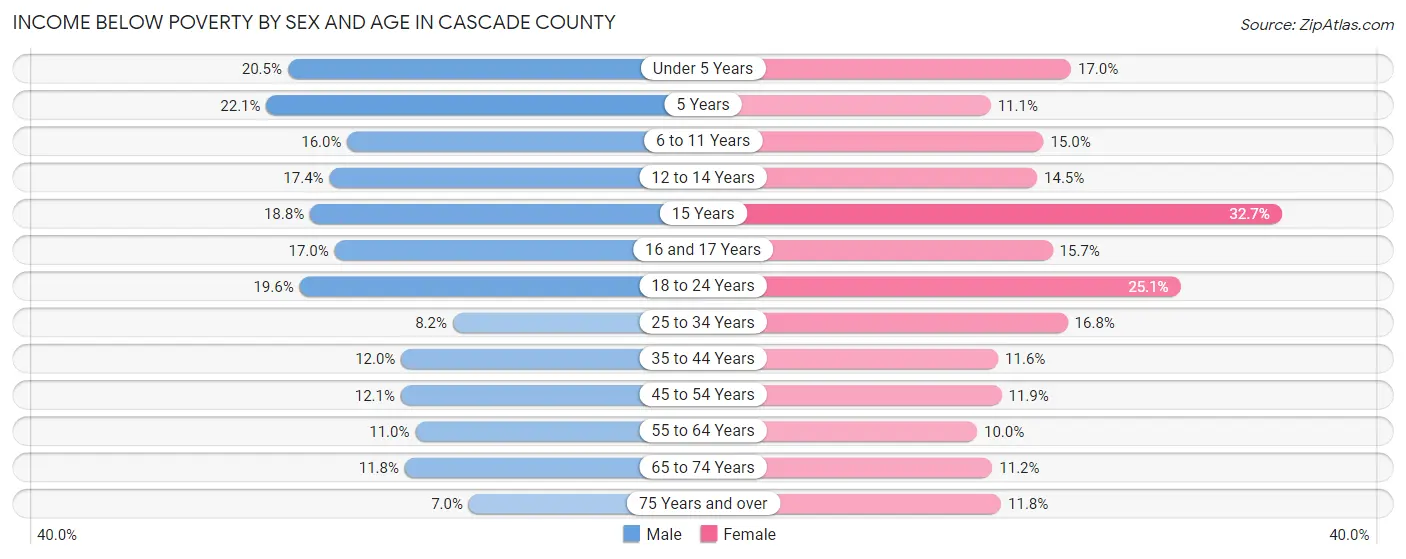
Income Below Poverty by Sex and Age in Cascade County
With 13.0% poverty level for males and 14.2% for females among the residents of Cascade County, 5 year old males and 15 year old females are the most vulnerable to poverty, with 99 males (22.1%) and 128 females (32.7%) in their respective age groups living below the poverty level.
| Age Bracket | Male | Female |
| Under 5 Years | 538 (20.5%) | 425 (17.0%) |
| 5 Years | 99 (22.1%) | 47 (11.1%) |
| 6 to 11 Years | 519 (16.0%) | 485 (15.0%) |
| 12 to 14 Years | 287 (17.4%) | 196 (14.5%) |
| 15 Years | 101 (18.8%) | 128 (32.7%) |
| 16 and 17 Years | 174 (17.0%) | 156 (15.7%) |
| 18 to 24 Years | 729 (19.6%) | 824 (25.1%) |
| 25 to 34 Years | 503 (8.2%) | 958 (16.8%) |
| 35 to 44 Years | 625 (12.0%) | 538 (11.6%) |
| 45 to 54 Years | 520 (12.1%) | 508 (11.9%) |
| 55 to 64 Years | 581 (11.0%) | 560 (10.0%) |
| 65 to 74 Years | 504 (11.8%) | 526 (11.2%) |
| 75 Years and over | 202 (7.0%) | 439 (11.8%) |
| Total | 5,382 (13.0%) | 5,790 (14.2%) |
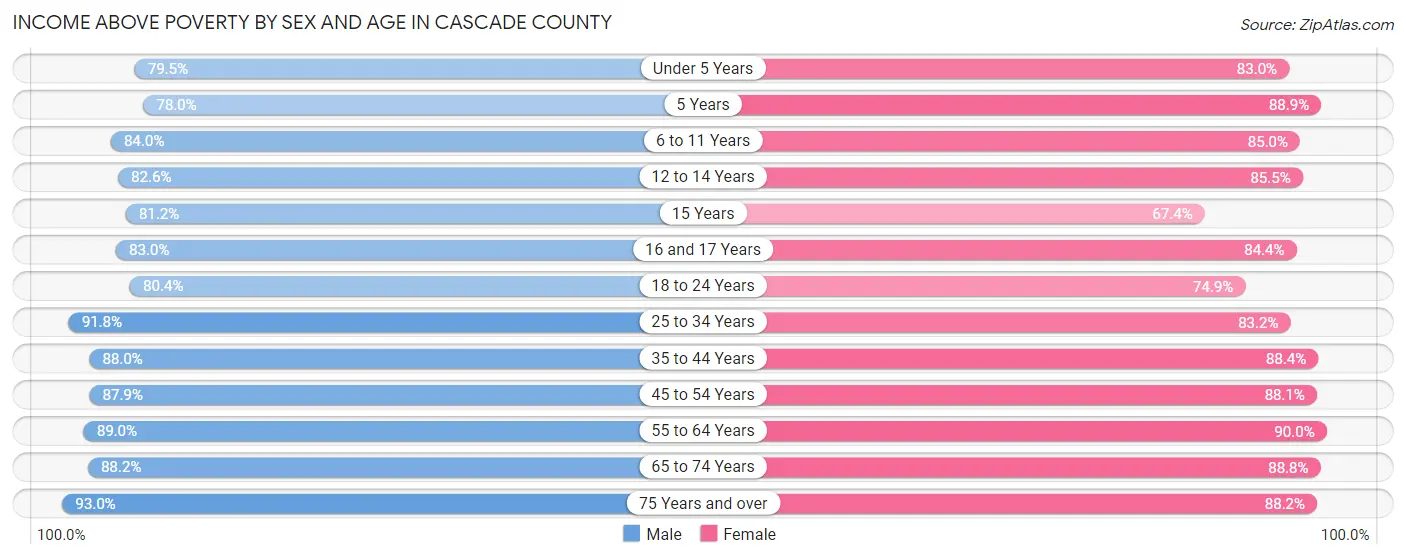
Income Above Poverty by Sex and Age in Cascade County
According to the poverty statistics in Cascade County, males aged 75 years and over and females aged 55 to 64 years are the age groups that are most secure financially, with 93.0% of males and 90.0% of females in these age groups living above the poverty line.
| Age Bracket | Male | Female |
| Under 5 Years | 2,091 (79.5%) | 2,072 (83.0%) |
| 5 Years | 350 (77.9%) | 378 (88.9%) |
| 6 to 11 Years | 2,717 (84.0%) | 2,753 (85.0%) |
| 12 to 14 Years | 1,365 (82.6%) | 1,156 (85.5%) |
| 15 Years | 436 (81.2%) | 264 (67.3%) |
| 16 and 17 Years | 850 (83.0%) | 841 (84.4%) |
| 18 to 24 Years | 2,993 (80.4%) | 2,453 (74.9%) |
| 25 to 34 Years | 5,626 (91.8%) | 4,755 (83.2%) |
| 35 to 44 Years | 4,564 (88.0%) | 4,095 (88.4%) |
| 45 to 54 Years | 3,787 (87.9%) | 3,777 (88.1%) |
| 55 to 64 Years | 4,708 (89.0%) | 5,017 (90.0%) |
| 65 to 74 Years | 3,777 (88.2%) | 4,177 (88.8%) |
| 75 Years and over | 2,674 (93.0%) | 3,273 (88.2%) |
| Total | 35,938 (87.0%) | 35,011 (85.8%) |
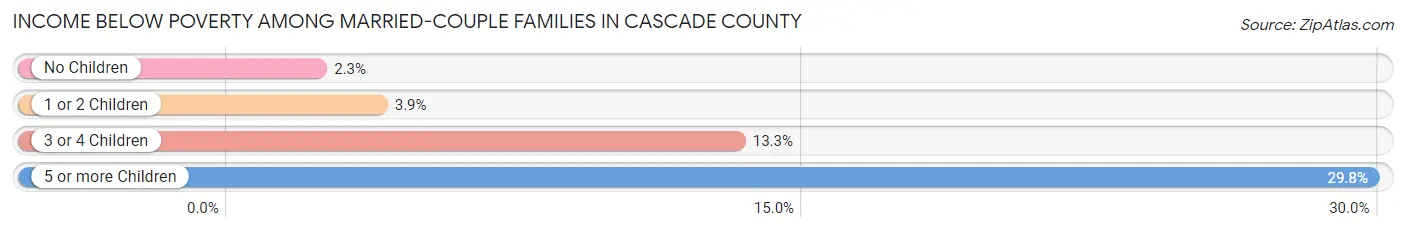
Income Below Poverty Among Married-Couple Families in Cascade County
The poverty statistics for married-couple families in Cascade County show that 4.0% or 654 of the total 16,194 families live below the poverty line. Families with 5 or more children have the highest poverty rate of 29.8%, comprising of 62 families. On the other hand, families with no children have the lowest poverty rate of 2.3%, which includes 242 families.
| Children | Above Poverty | Below Poverty |
| No Children | 10,147 (97.7%) | 242 (2.3%) |
| 1 or 2 Children | 4,030 (96.1%) | 164 (3.9%) |
| 3 or 4 Children | 1,217 (86.7%) | 186 (13.3%) |
| 5 or more Children | 146 (70.2%) | 62 (29.8%) |
| Total | 15,540 (96.0%) | 654 (4.0%) |
Income Below Poverty Among Single-Parent Households in Cascade County
According to the poverty data in Cascade County, 11.8% or 189 single-father households and 25.8% or 866 single-mother households are living below the poverty line. Among single-father households, those with 3 or 4 children have the highest poverty rate, with 34 households (33.7%) experiencing poverty. Likewise, among single-mother households, those with 3 or 4 children have the highest poverty rate, with 138 households (51.7%) falling below the poverty line.
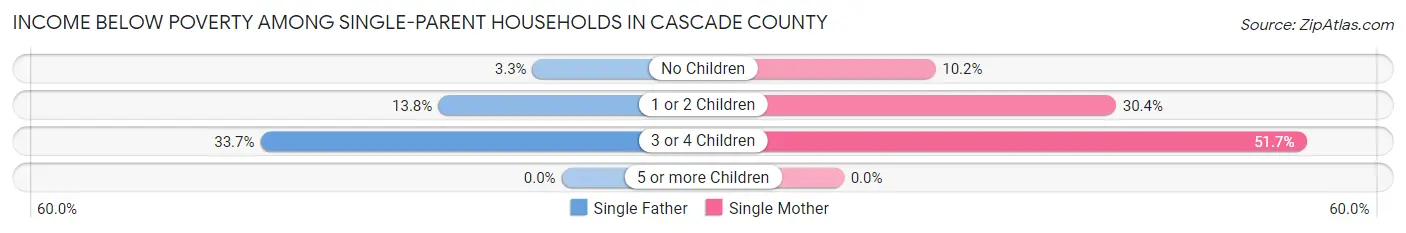
| Children | Single Father | Single Mother |
| No Children | 16 (3.3%) | 104 (10.2%) |
| 1 or 2 Children | 139 (13.8%) | 624 (30.4%) |
| 3 or 4 Children | 34 (33.7%) | 138 (51.7%) |
| 5 or more Children | 0 (0.0%) | 0 (0.0%) |
| Total | 189 (11.8%) | 866 (25.8%) |
Income Below Poverty Among Married-Couple vs Single-Parent Households in Cascade County
The poverty data for Cascade County shows that 654 of the married-couple family households (4.0%) and 1,055 of the single-parent households (21.3%) are living below the poverty level. Within the married-couple family households, those with 5 or more children have the highest poverty rate, with 62 households (29.8%) falling below the poverty line. Among the single-parent households, those with 3 or 4 children have the highest poverty rate, with 172 household (46.7%) living below poverty.
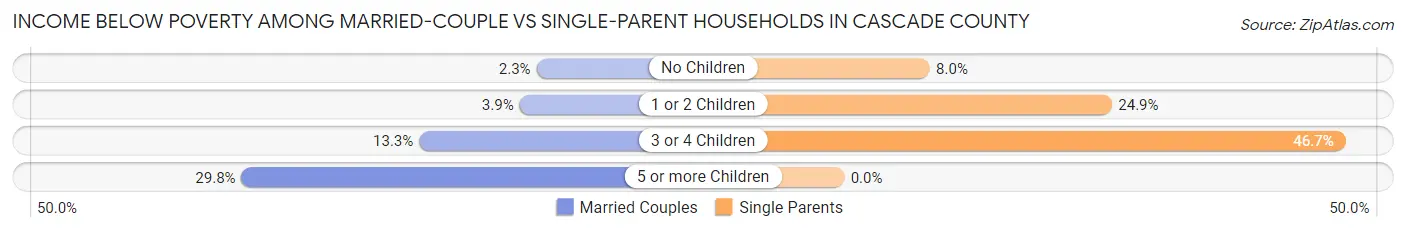
| Children | Married-Couple Families | Single-Parent Households |
| No Children | 242 (2.3%) | 120 (8.0%) |
| 1 or 2 Children | 164 (3.9%) | 763 (24.9%) |
| 3 or 4 Children | 186 (13.3%) | 172 (46.7%) |
| 5 or more Children | 62 (29.8%) | 0 (0.0%) |
| Total | 654 (4.0%) | 1,055 (21.3%) |
Race in Cascade County
The most populous races in Cascade County are White / Caucasian (72,122 | 85.4%), Two or more Races (5,580 | 6.6%), and Hispanic or Latino (4,261 | 5.1%).
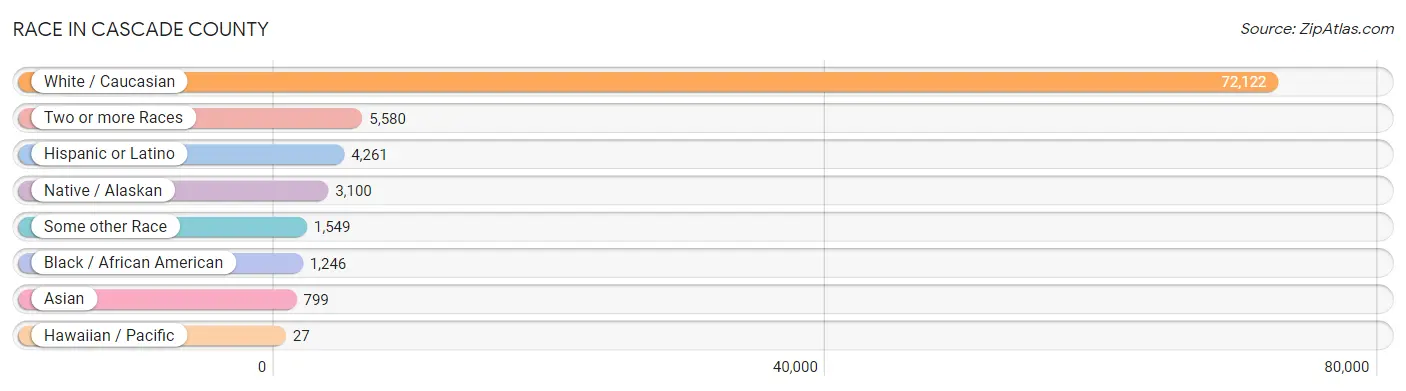
| Race | # Population | % Population |
| Asian | 799 | 0.9% |
| Black / African American | 1,246 | 1.5% |
| Hawaiian / Pacific | 27 | 0.0% |
| Hispanic or Latino | 4,261 | 5.1% |
| Native / Alaskan | 3,100 | 3.7% |
| White / Caucasian | 72,122 | 85.4% |
| Two or more Races | 5,580 | 6.6% |
| Some other Race | 1,549 | 1.8% |
| Total | 84,423 | 100.0% |
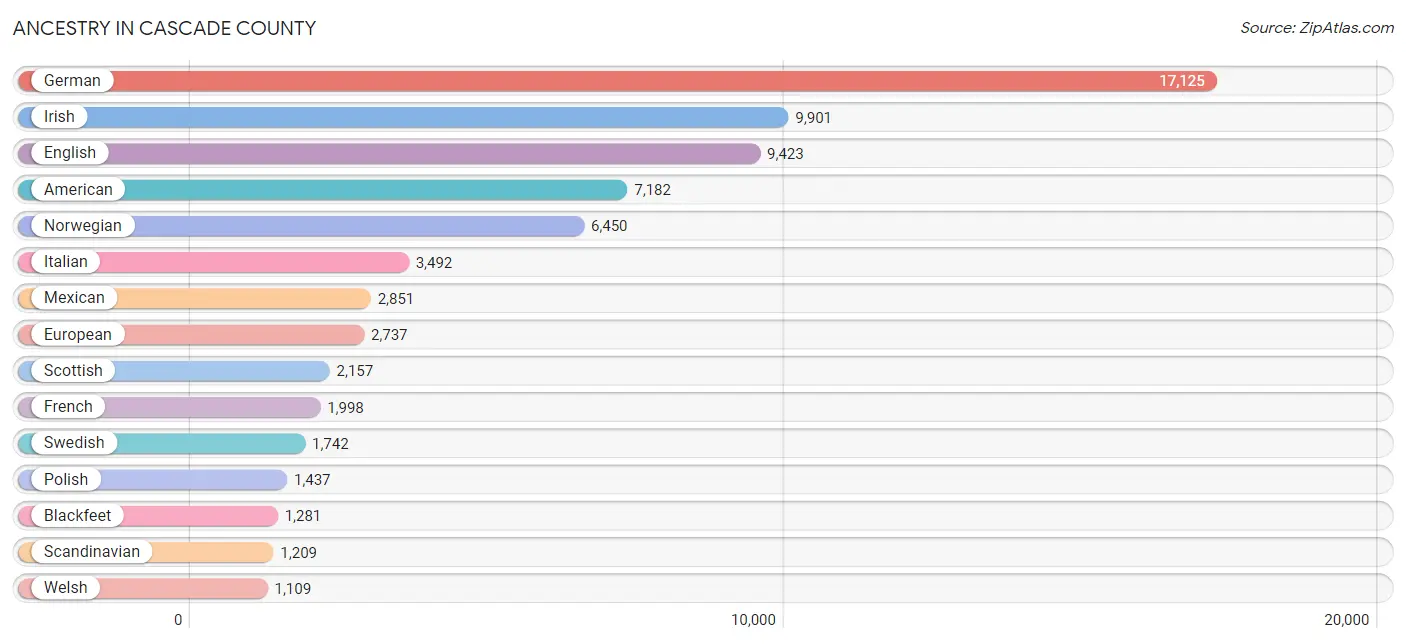
Ancestry in Cascade County
The most populous ancestries reported in Cascade County are German (17,125 | 20.3%), Irish (9,901 | 11.7%), English (9,423 | 11.2%), American (7,182 | 8.5%), and Norwegian (6,450 | 7.6%), together accounting for 59.3% of all Cascade County residents.
| Ancestry | # Population | % Population |
| African | 4 | 0.0% |
| Alaska Native | 163 | 0.2% |
| Aleut | 5 | 0.0% |
| American | 7,182 | 8.5% |
| Apache | 12 | 0.0% |
| Arab | 122 | 0.1% |
| Argentinean | 7 | 0.0% |
| Armenian | 70 | 0.1% |
| Australian | 21 | 0.0% |
| Austrian | 313 | 0.4% |
| Bahamian | 28 | 0.0% |
| Basque | 40 | 0.1% |
| Belgian | 177 | 0.2% |
| Bhutanese | 370 | 0.4% |
| Blackfeet | 1,281 | 1.5% |
| British | 470 | 0.6% |
| Bulgarian | 10 | 0.0% |
| Burmese | 50 | 0.1% |
| Cajun | 15 | 0.0% |
| Canadian | 195 | 0.2% |
| Central American | 318 | 0.4% |
| Cherokee | 146 | 0.2% |
| Cheyenne | 1 | 0.0% |
| Chippewa | 887 | 1.1% |
| Choctaw | 39 | 0.1% |
| Colombian | 39 | 0.1% |
| Colville | 14 | 0.0% |
| Costa Rican | 31 | 0.0% |
| Cree | 377 | 0.4% |
| Croatian | 338 | 0.4% |
| Crow | 43 | 0.1% |
| Cuban | 225 | 0.3% |
| Czech | 397 | 0.5% |
| Czechoslovakian | 232 | 0.3% |
| Danish | 586 | 0.7% |
| Delaware | 24 | 0.0% |
| Dutch | 956 | 1.1% |
| Eastern European | 137 | 0.2% |
| Ecuadorian | 5 | 0.0% |
| Egyptian | 10 | 0.0% |
| English | 9,423 | 11.2% |
| Estonian | 28 | 0.0% |
| Ethiopian | 2 | 0.0% |
| European | 2,737 | 3.2% |
| Finnish | 874 | 1.0% |
| French | 1,998 | 2.4% |
| French American Indian | 80 | 0.1% |
| French Canadian | 584 | 0.7% |
| German | 17,125 | 20.3% |
| German Russian | 56 | 0.1% |
| Greek | 403 | 0.5% |
| Guamanian / Chamorro | 8 | 0.0% |
| Haitian | 9 | 0.0% |
| Honduran | 172 | 0.2% |
| Hungarian | 324 | 0.4% |
| Indian (Asian) | 322 | 0.4% |
| Inupiat | 26 | 0.0% |
| Iranian | 80 | 0.1% |
| Irish | 9,901 | 11.7% |
| Iroquois | 45 | 0.1% |
| Italian | 3,492 | 4.1% |
| Jamaican | 47 | 0.1% |
| Kiowa | 6 | 0.0% |
| Korean | 559 | 0.7% |
| Laotian | 10 | 0.0% |
| Latvian | 16 | 0.0% |
| Lebanese | 44 | 0.1% |
| Lithuanian | 118 | 0.1% |
| Luxembourger | 8 | 0.0% |
| Mexican | 2,851 | 3.4% |
| Native Hawaiian | 111 | 0.1% |
| Navajo | 22 | 0.0% |
| Nicaraguan | 65 | 0.1% |
| Nigerian | 11 | 0.0% |
| Northern European | 307 | 0.4% |
| Norwegian | 6,450 | 7.6% |
| Pennsylvania German | 92 | 0.1% |
| Polish | 1,437 | 1.7% |
| Portuguese | 211 | 0.3% |
| Puerto Rican | 485 | 0.6% |
| Romanian | 71 | 0.1% |
| Russian | 541 | 0.6% |
| Salvadoran | 50 | 0.1% |
| Scandinavian | 1,209 | 1.4% |
| Scotch-Irish | 1,071 | 1.3% |
| Scottish | 2,157 | 2.5% |
| Seminole | 5 | 0.0% |
| Serbian | 4 | 0.0% |
| Shoshone | 20 | 0.0% |
| Sioux | 135 | 0.2% |
| Slavic | 213 | 0.3% |
| Slovak | 115 | 0.1% |
| Slovene | 111 | 0.1% |
| South American | 51 | 0.1% |
| Spaniard | 61 | 0.1% |
| Spanish | 126 | 0.2% |
| Spanish American | 14 | 0.0% |
| Sri Lankan | 45 | 0.1% |
| Subsaharan African | 17 | 0.0% |
| Swedish | 1,742 | 2.1% |
| Swiss | 327 | 0.4% |
| Thai | 228 | 0.3% |
| Tlingit-Haida | 5 | 0.0% |
| Turkish | 15 | 0.0% |
| Ukrainian | 119 | 0.1% |
| Welsh | 1,109 | 1.3% |
| West Indian | 20 | 0.0% |
| Yugoslavian | 115 | 0.1% | View All 108 Rows |
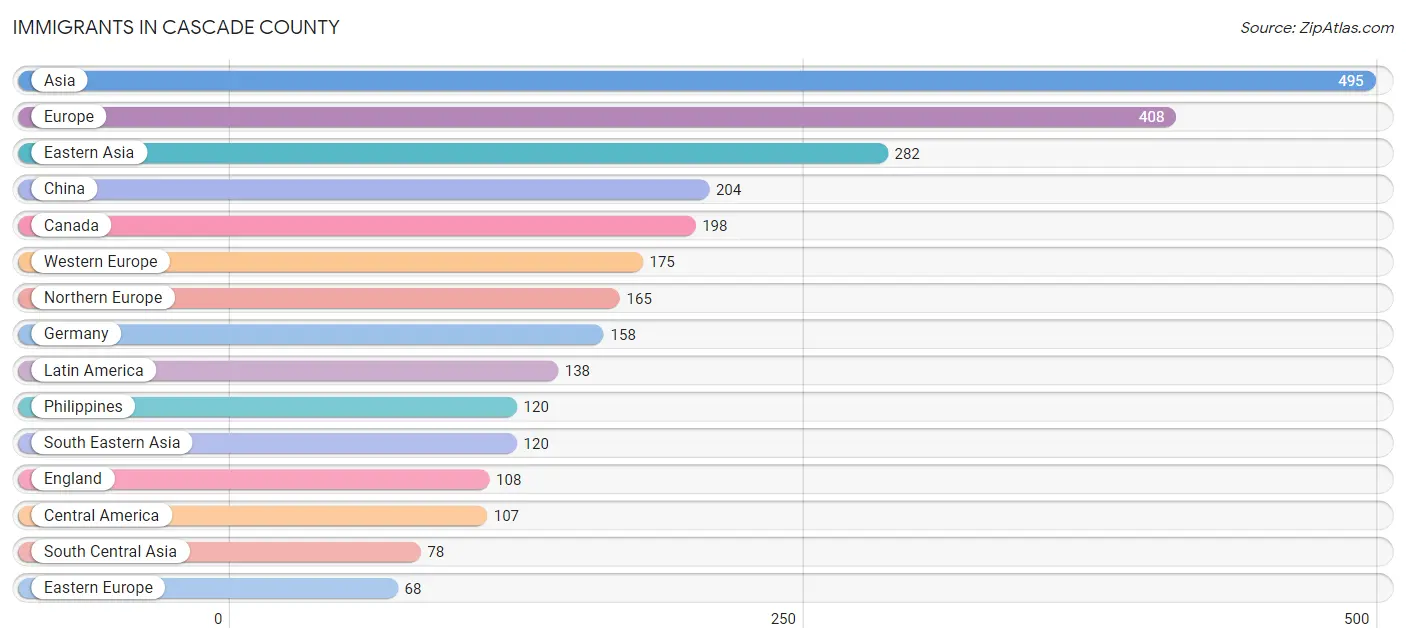
Immigrants in Cascade County
The most numerous immigrant groups reported in Cascade County came from Asia (495 | 0.6%), Europe (408 | 0.5%), Eastern Asia (282 | 0.3%), China (204 | 0.2%), and Canada (198 | 0.2%), together accounting for 1.9% of all Cascade County residents.
| Immigration Origin | # Population | % Population |
| Africa | 16 | 0.0% |
| Argentina | 7 | 0.0% |
| Asia | 495 | 0.6% |
| Australia | 10 | 0.0% |
| Bulgaria | 5 | 0.0% |
| Canada | 198 | 0.2% |
| Caribbean | 10 | 0.0% |
| Central America | 107 | 0.1% |
| China | 204 | 0.2% |
| Colombia | 14 | 0.0% |
| Costa Rica | 31 | 0.0% |
| Cuba | 10 | 0.0% |
| Denmark | 10 | 0.0% |
| Eastern Africa | 2 | 0.0% |
| Eastern Asia | 282 | 0.3% |
| Eastern Europe | 68 | 0.1% |
| England | 108 | 0.1% |
| Ethiopia | 2 | 0.0% |
| Europe | 408 | 0.5% |
| Germany | 158 | 0.2% |
| Hong Kong | 24 | 0.0% |
| India | 61 | 0.1% |
| Iran | 17 | 0.0% |
| Ireland | 9 | 0.0% |
| Japan | 58 | 0.1% |
| Korea | 20 | 0.0% |
| Latin America | 138 | 0.2% |
| Latvia | 6 | 0.0% |
| Lebanon | 10 | 0.0% |
| Liberia | 1 | 0.0% |
| Mexico | 31 | 0.0% |
| Netherlands | 17 | 0.0% |
| Nicaragua | 45 | 0.1% |
| Northern Europe | 165 | 0.2% |
| Norway | 1 | 0.0% |
| Oceania | 10 | 0.0% |
| Philippines | 120 | 0.1% |
| Poland | 6 | 0.0% |
| Romania | 22 | 0.0% |
| Russia | 29 | 0.0% |
| Scotland | 3 | 0.0% |
| South Africa | 13 | 0.0% |
| South America | 21 | 0.0% |
| South Central Asia | 78 | 0.1% |
| South Eastern Asia | 120 | 0.1% |
| Taiwan | 33 | 0.0% |
| Turkey | 5 | 0.0% |
| Western Africa | 1 | 0.0% |
| Western Asia | 15 | 0.0% |
| Western Europe | 175 | 0.2% | View All 50 Rows |
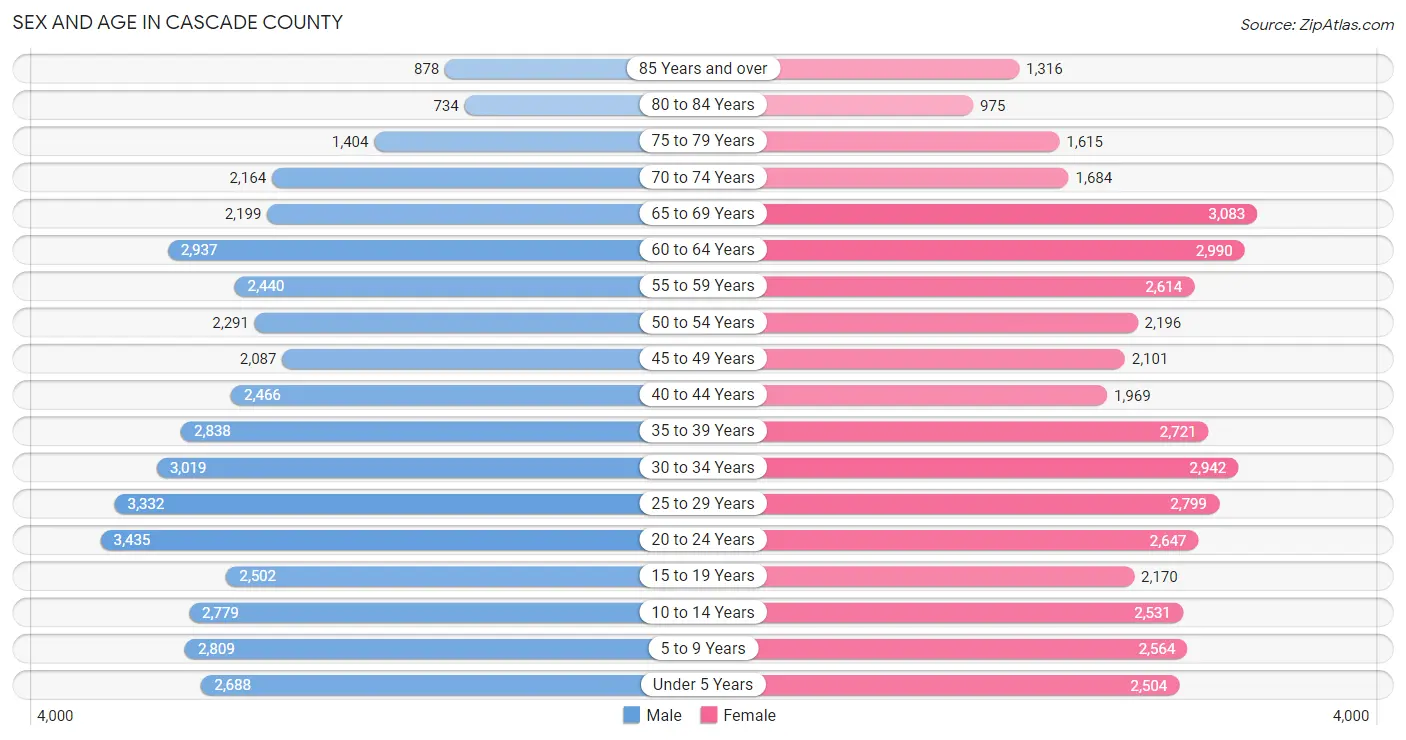
Sex and Age in Cascade County
Sex and Age in Cascade County
The most populous age groups in Cascade County are 20 to 24 Years (3,435 | 8.0%) for men and 65 to 69 Years (3,083 | 7.4%) for women.
| Age Bracket | Male | Female |
| Under 5 Years | 2,688 (6.2%) | 2,504 (6.0%) |
| 5 to 9 Years | 2,809 (6.5%) | 2,564 (6.2%) |
| 10 to 14 Years | 2,779 (6.5%) | 2,531 (6.1%) |
| 15 to 19 Years | 2,502 (5.8%) | 2,170 (5.2%) |
| 20 to 24 Years | 3,435 (8.0%) | 2,647 (6.4%) |
| 25 to 29 Years | 3,332 (7.7%) | 2,799 (6.8%) |
| 30 to 34 Years | 3,019 (7.0%) | 2,942 (7.1%) |
| 35 to 39 Years | 2,838 (6.6%) | 2,721 (6.6%) |
| 40 to 44 Years | 2,466 (5.7%) | 1,969 (4.8%) |
| 45 to 49 Years | 2,087 (4.9%) | 2,101 (5.1%) |
| 50 to 54 Years | 2,291 (5.3%) | 2,196 (5.3%) |
| 55 to 59 Years | 2,440 (5.7%) | 2,614 (6.3%) |
| 60 to 64 Years | 2,937 (6.8%) | 2,990 (7.2%) |
| 65 to 69 Years | 2,199 (5.1%) | 3,083 (7.4%) |
| 70 to 74 Years | 2,164 (5.0%) | 1,684 (4.1%) |
| 75 to 79 Years | 1,404 (3.3%) | 1,615 (3.9%) |
| 80 to 84 Years | 734 (1.7%) | 975 (2.4%) |
| 85 Years and over | 878 (2.0%) | 1,316 (3.2%) |
| Total | 43,002 (100.0%) | 41,421 (100.0%) |
Families and Households in Cascade County
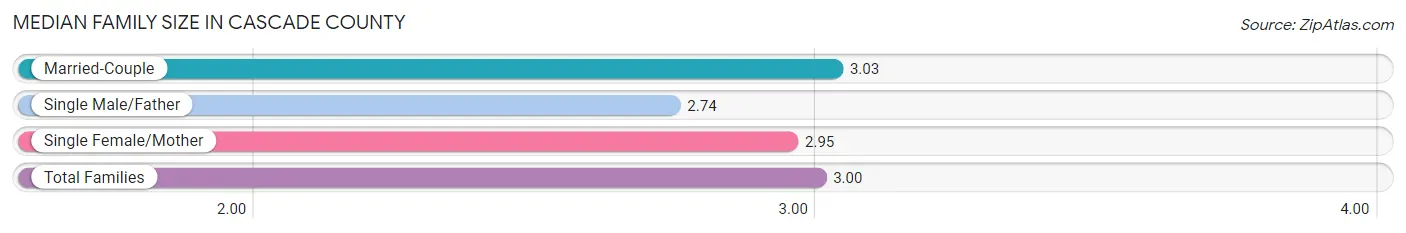
Median Family Size in Cascade County
The median family size in Cascade County is 3.00 persons per family, with married-couple families (16,194 | 76.5%) accounting for the largest median family size of 3.03 persons per family. On the other hand, single male/father families (1,601 | 7.6%) represent the smallest median family size with 2.74 persons per family.
| Family Type | # Families | Family Size |
| Married-Couple | 16,194 (76.5%) | 3.03 |
| Single Male/Father | 1,601 (7.6%) | 2.74 |
| Single Female/Mother | 3,360 (15.9%) | 2.95 |
| Total Families | 21,155 (100.0%) | 3.00 |
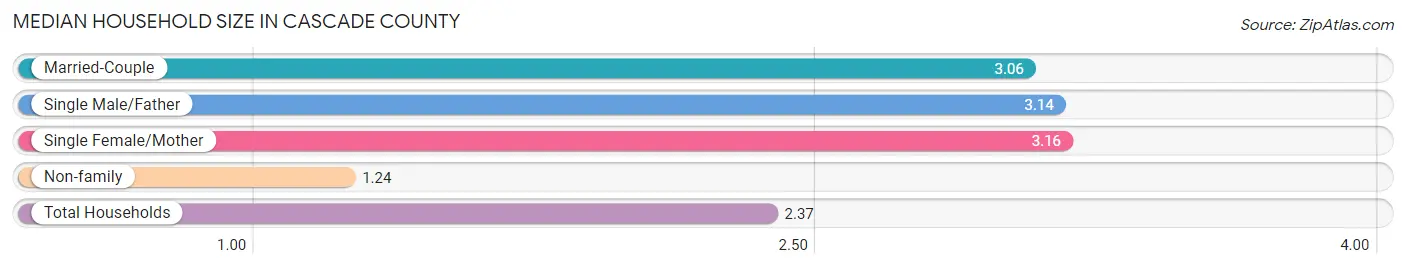
Median Household Size in Cascade County
The median household size in Cascade County is 2.37 persons per household, with single female/mother households (3,360 | 9.7%) accounting for the largest median household size of 3.16 persons per household. non-family households (13,422 | 38.8%) represent the smallest median household size with 1.24 persons per household.
| Household Type | # Households | Household Size |
| Married-Couple | 16,194 (46.8%) | 3.06 |
| Single Male/Father | 1,601 (4.6%) | 3.14 |
| Single Female/Mother | 3,360 (9.7%) | 3.16 |
| Non-family | 13,422 (38.8%) | 1.24 |
| Total Households | 34,577 (100.0%) | 2.37 |
Household Size by Marriage Status in Cascade County
Out of a total of 34,577 households in Cascade County, 21,155 (61.2%) are family households, while 13,422 (38.8%) are nonfamily households. The most numerous type of family households are 2-person households, comprising 11,198, and the most common type of nonfamily households are 1-person households, comprising 11,465.
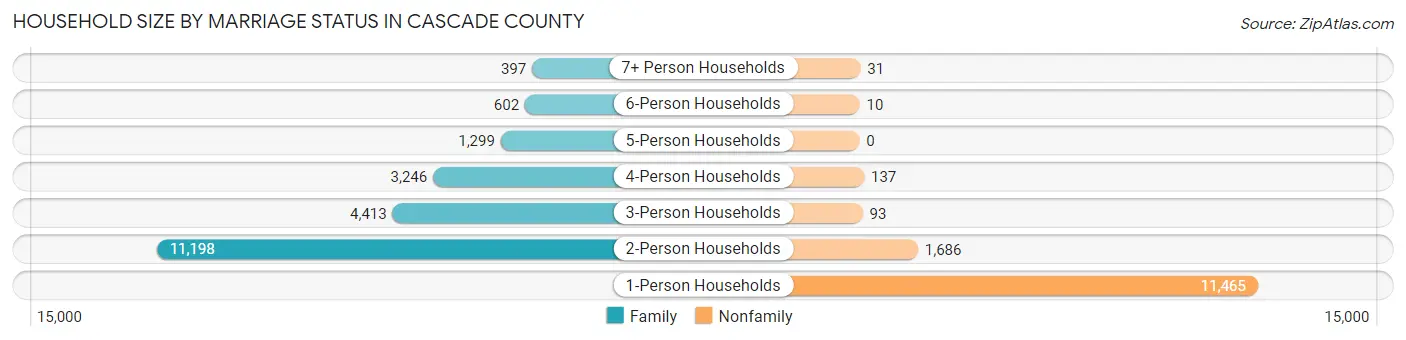
| Household Size | Family Households | Nonfamily Households |
| 1-Person Households | - | 11,465 (33.2%) |
| 2-Person Households | 11,198 (32.4%) | 1,686 (4.9%) |
| 3-Person Households | 4,413 (12.8%) | 93 (0.3%) |
| 4-Person Households | 3,246 (9.4%) | 137 (0.4%) |
| 5-Person Households | 1,299 (3.8%) | 0 (0.0%) |
| 6-Person Households | 602 (1.7%) | 10 (0.0%) |
| 7+ Person Households | 397 (1.1%) | 31 (0.1%) |
| Total | 21,155 (61.2%) | 13,422 (38.8%) |
Female Fertility in Cascade County
Fertility by Age in Cascade County
Average fertility rate in Cascade County is 109.0 births per 1,000 women. Women in the age bracket of 20 to 34 years have the highest fertility rate with 165.0 births per 1,000 women. Women in the age bracket of 20 to 34 years acount for 71.7% of all women with births.
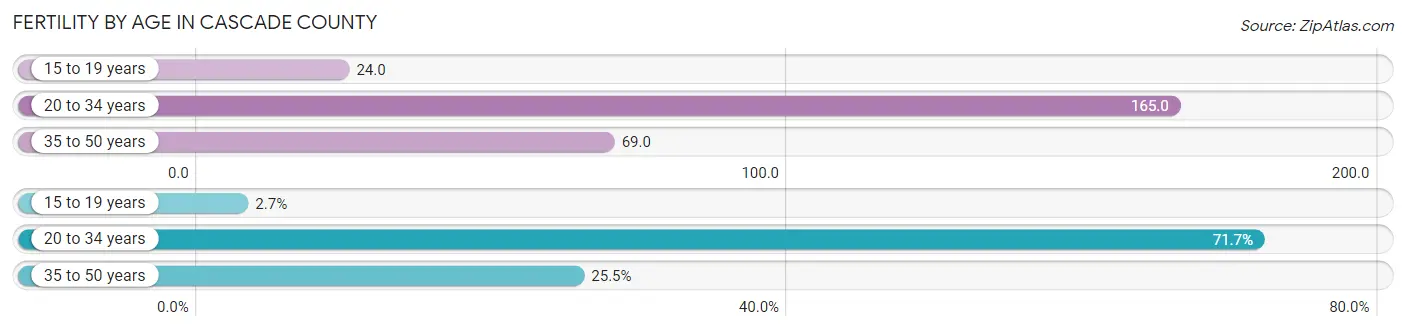
| Age Bracket | Women with Births | Births / 1,000 Women |
| 15 to 19 years | 53 (2.7%) | 24.0 |
| 20 to 34 years | 1,387 (71.7%) | 165.0 |
| 35 to 50 years | 494 (25.5%) | 69.0 |
| Total | 1,934 (100.0%) | 109.0 |
Fertility by Age by Marriage Status in Cascade County
61.0% of women with births (1,934) in Cascade County are married. The highest percentage of unmarried women with births falls into 15 to 19 years age bracket with 100.0% of them unmarried at the time of birth, while the lowest percentage of unmarried women with births belong to 20 to 34 years age bracket with 34.8% of them unmarried.
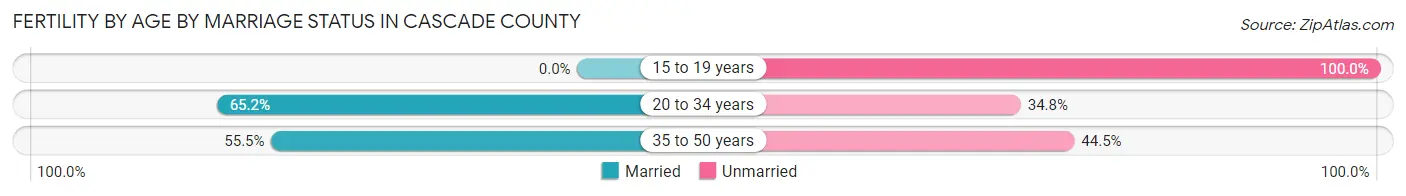
| Age Bracket | Married | Unmarried |
| 15 to 19 years | 0 (0.0%) | 53 (100.0%) |
| 20 to 34 years | 904 (65.2%) | 483 (34.8%) |
| 35 to 50 years | 274 (55.5%) | 220 (44.5%) |
| Total | 1,180 (61.0%) | 754 (39.0%) |
Fertility by Education in Cascade County
Average fertility rate in Cascade County is 109.0 births per 1,000 women. Women with the education attainment of high school diploma have the highest fertility rate of 131.0 births per 1,000 women, while women with the education attainment of bachelor's degree have the lowest fertility at 89.0 births per 1,000 women. Women with the education attainment of college or associate's degree represent 32.0% of all women with births.
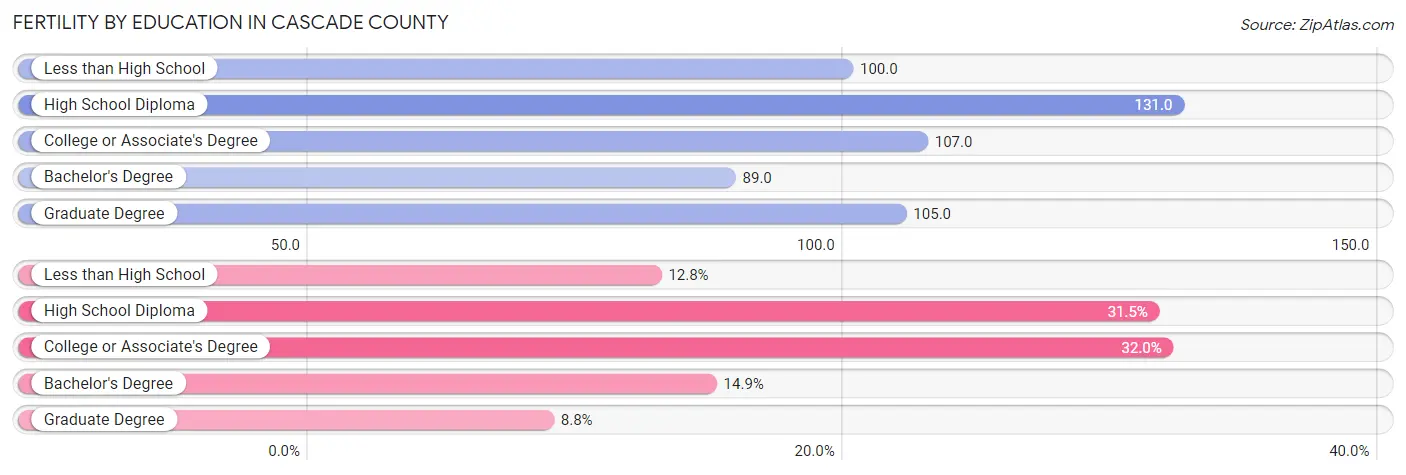
| Educational Attainment | Women with Births | Births / 1,000 Women |
| Less than High School | 248 (12.8%) | 100.0 |
| High School Diploma | 609 (31.5%) | 131.0 |
| College or Associate's Degree | 619 (32.0%) | 107.0 |
| Bachelor's Degree | 288 (14.9%) | 89.0 |
| Graduate Degree | 170 (8.8%) | 105.0 |
| Total | 1,934 (100.0%) | 109.0 |
Fertility by Education by Marriage Status in Cascade County
39.0% of women with births in Cascade County are unmarried. Women with the educational attainment of graduate degree are most likely to be married with 100.0% of them married at childbirth, while women with the educational attainment of less than high school are least likely to be married with 69.0% of them unmarried at childbirth.
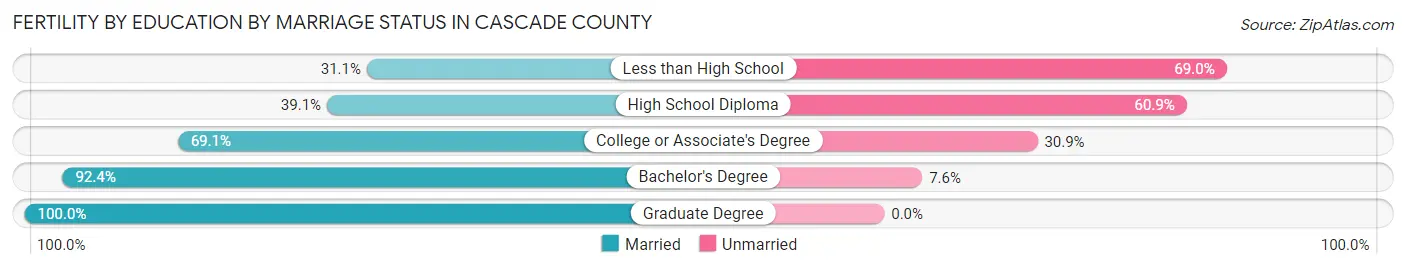
| Educational Attainment | Married | Unmarried |
| Less than High School | 77 (31.0%) | 171 (69.0%) |
| High School Diploma | 238 (39.1%) | 371 (60.9%) |
| College or Associate's Degree | 428 (69.1%) | 191 (30.9%) |
| Bachelor's Degree | 266 (92.4%) | 22 (7.6%) |
| Graduate Degree | 170 (100.0%) | 0 (0.0%) |
| Total | 1,180 (61.0%) | 754 (39.0%) |
Employment Characteristics in Cascade County
Employment by Class of Employer in Cascade County
Among the 40,313 employed individuals in Cascade County, private company employees (22,223 | 55.1%), not-for-profit organizations (4,907 | 12.2%), and federal government employees (4,739 | 11.8%) make up the most common classes of employment.
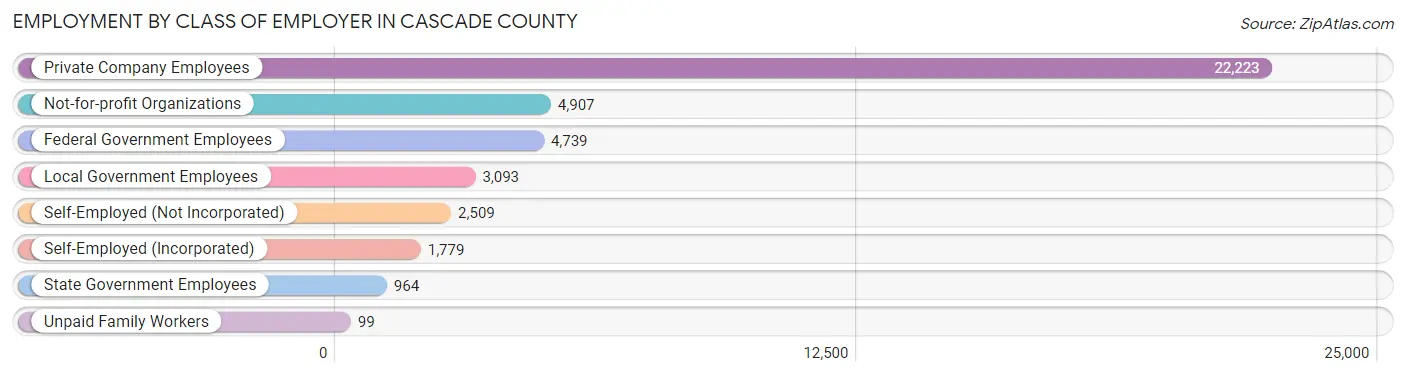
| Employer Class | # Employees | % Employees |
| Private Company Employees | 22,223 | 55.1% |
| Self-Employed (Incorporated) | 1,779 | 4.4% |
| Self-Employed (Not Incorporated) | 2,509 | 6.2% |
| Not-for-profit Organizations | 4,907 | 12.2% |
| Local Government Employees | 3,093 | 7.7% |
| State Government Employees | 964 | 2.4% |
| Federal Government Employees | 4,739 | 11.8% |
| Unpaid Family Workers | 99 | 0.3% |
| Total | 40,313 | 100.0% |
Employment Status by Age in Cascade County
According to the labor force statistics for Cascade County, out of the total population over 16 years of age (67,618), 62.8% or 42,464 individuals are in the labor force, with 3.3% or 1,401 of them unemployed. The age group with the highest labor force participation rate is 20 to 24 years, with 85.8% or 5,218 individuals in the labor force. Within the labor force, the 16 to 19 years age range has the highest percentage of unemployed individuals, with 6.3% or 110 of them being unemployed.
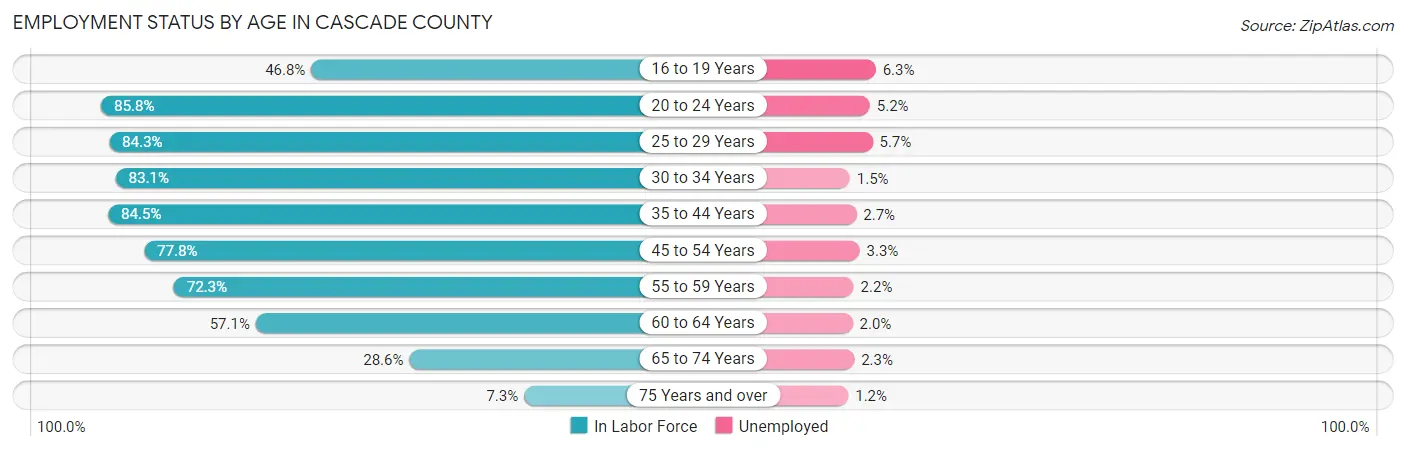
| Age Bracket | In Labor Force | Unemployed |
| 16 to 19 Years | 1,751 (46.8%) | 110 (6.3%) |
| 20 to 24 Years | 5,218 (85.8%) | 271 (5.2%) |
| 25 to 29 Years | 5,168 (84.3%) | 295 (5.7%) |
| 30 to 34 Years | 4,954 (83.1%) | 74 (1.5%) |
| 35 to 44 Years | 8,445 (84.5%) | 228 (2.7%) |
| 45 to 54 Years | 6,749 (77.8%) | 223 (3.3%) |
| 55 to 59 Years | 3,654 (72.3%) | 80 (2.2%) |
| 60 to 64 Years | 3,384 (57.1%) | 68 (2.0%) |
| 65 to 74 Years | 2,611 (28.6%) | 60 (2.3%) |
| 75 Years and over | 505 (7.3%) | 6 (1.2%) |
| Total | 42,464 (62.8%) | 1,401 (3.3%) |
Employment Status by Educational Attainment in Cascade County
According to labor force statistics for Cascade County, 77.5% of individuals (32,350) out of the total population between 25 and 64 years of age (41,742) are in the labor force, with 2.9% or 938 of them being unemployed. The group with the highest labor force participation rate are those with the educational attainment of bachelor's degree or higher, with 85.2% or 9,954 individuals in the labor force. Within the labor force, individuals with less than high school education have the highest percentage of unemployment, with 7.3% or 117 of them being unemployed.
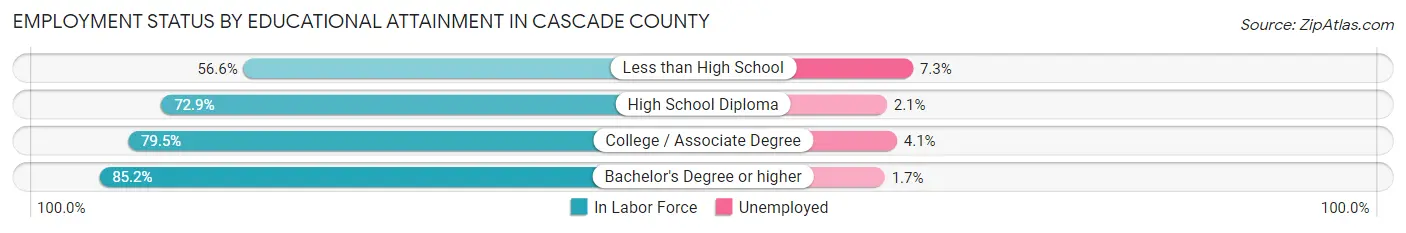
| Educational Attainment | In Labor Force | Unemployed |
| Less than High School | 1,608 (56.6%) | 207 (7.3%) |
| High School Diploma | 9,241 (72.9%) | 266 (2.1%) |
| College / Associate Degree | 11,561 (79.5%) | 596 (4.1%) |
| Bachelor's Degree or higher | 9,954 (85.2%) | 199 (1.7%) |
| Total | 32,350 (77.5%) | 1,211 (2.9%) |
Employment Occupations by Sex in Cascade County
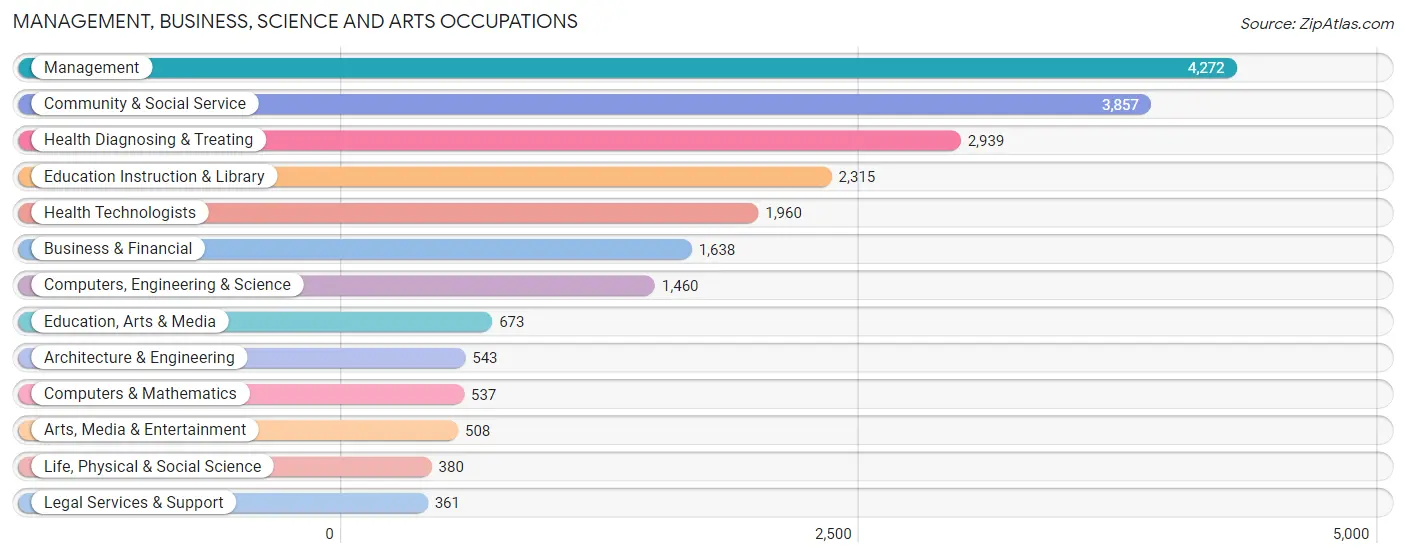
Management, Business, Science and Arts Occupations
The most common Management, Business, Science and Arts occupations in Cascade County are Management (4,272 | 11.2%), Community & Social Service (3,857 | 10.1%), Health Diagnosing & Treating (2,939 | 7.7%), Education Instruction & Library (2,315 | 6.0%), and Health Technologists (1,960 | 5.1%).
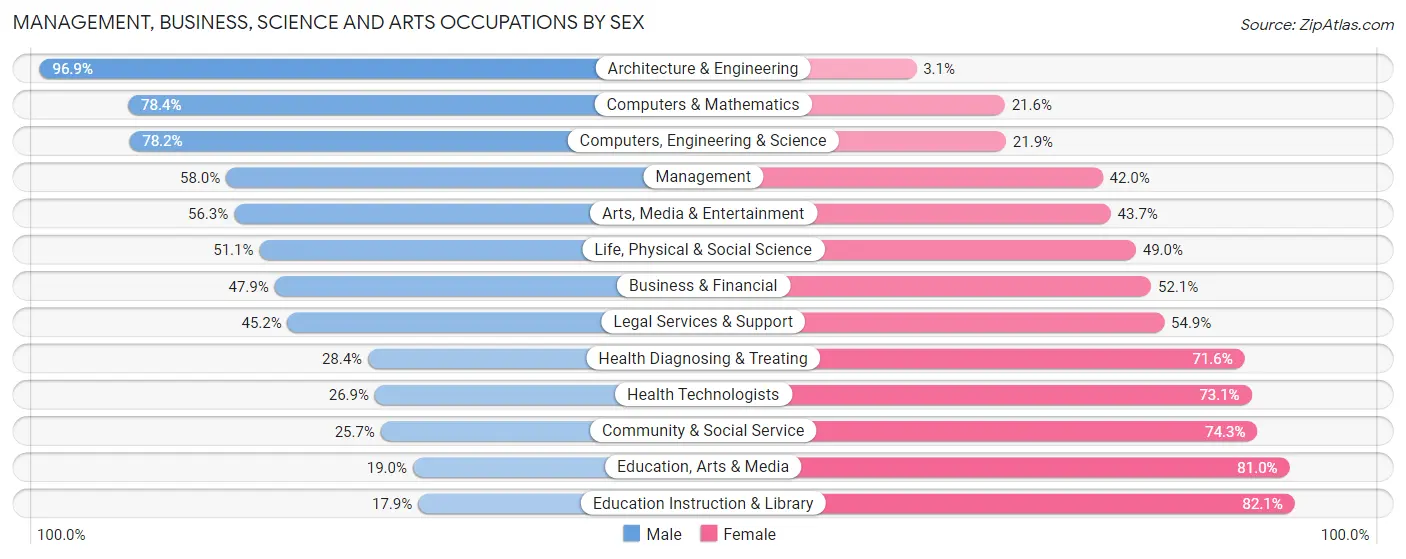
Management, Business, Science and Arts Occupations by Sex
Within the Management, Business, Science and Arts occupations in Cascade County, the most male-oriented occupations are Architecture & Engineering (96.9%), Computers & Mathematics (78.4%), and Computers, Engineering & Science (78.1%), while the most female-oriented occupations are Education Instruction & Library (82.1%), Education, Arts & Media (81.0%), and Community & Social Service (74.3%).
| Occupation | Male | Female |
| Management | 2,477 (58.0%) | 1,795 (42.0%) |
| Business & Financial | 784 (47.9%) | 854 (52.1%) |
| Computers, Engineering & Science | 1,141 (78.1%) | 319 (21.8%) |
| Computers & Mathematics | 421 (78.4%) | 116 (21.6%) |
| Architecture & Engineering | 526 (96.9%) | 17 (3.1%) |
| Life, Physical & Social Science | 194 (51.0%) | 186 (48.9%) |
| Community & Social Service | 992 (25.7%) | 2,865 (74.3%) |
| Education, Arts & Media | 128 (19.0%) | 545 (81.0%) |
| Legal Services & Support | 163 (45.2%) | 198 (54.8%) |
| Education Instruction & Library | 415 (17.9%) | 1,900 (82.1%) |
| Arts, Media & Entertainment | 286 (56.3%) | 222 (43.7%) |
| Health Diagnosing & Treating | 834 (28.4%) | 2,105 (71.6%) |
| Health Technologists | 528 (26.9%) | 1,432 (73.1%) |
| Total (Category) | 6,228 (44.0%) | 7,938 (56.0%) |
| Total (Overall) | 19,671 (51.3%) | 18,639 (48.6%) |
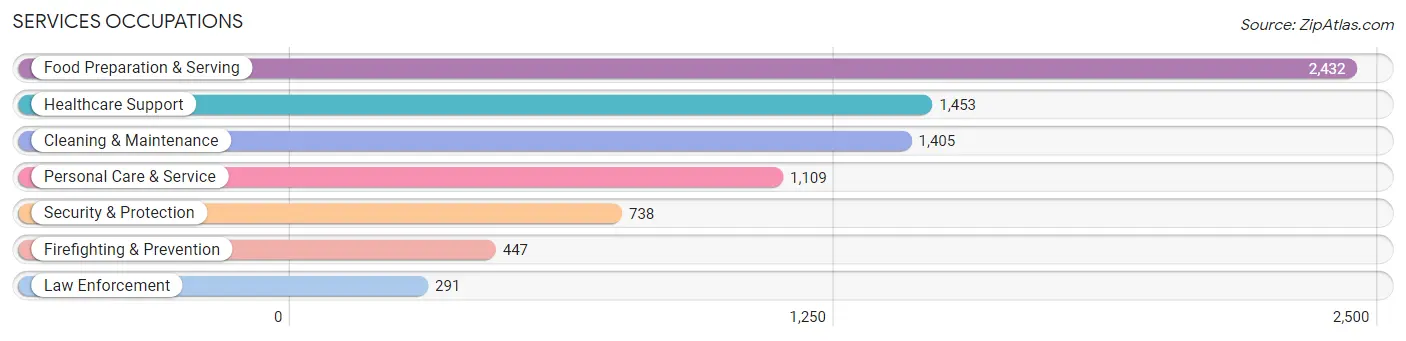
Services Occupations
The most common Services occupations in Cascade County are Food Preparation & Serving (2,432 | 6.4%), Healthcare Support (1,453 | 3.8%), Cleaning & Maintenance (1,405 | 3.7%), Personal Care & Service (1,109 | 2.9%), and Security & Protection (738 | 1.9%).
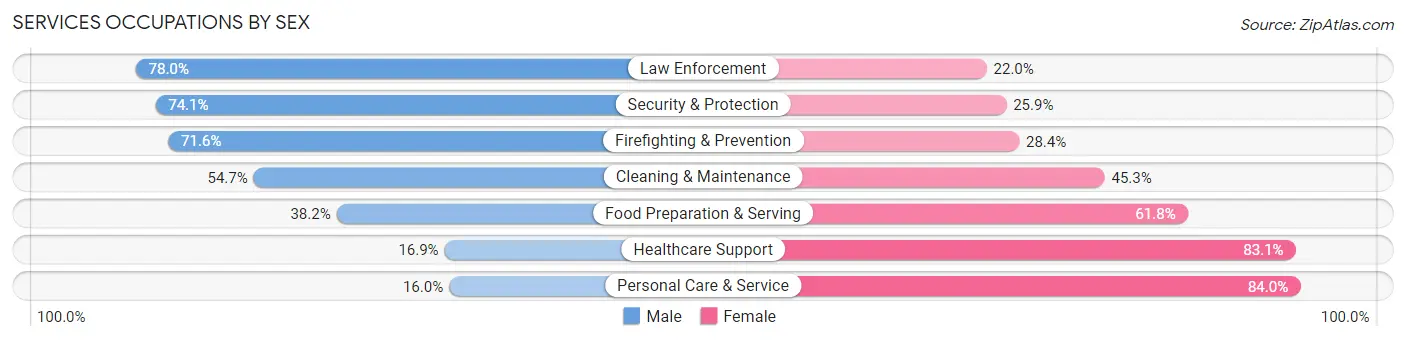
Services Occupations by Sex
Within the Services occupations in Cascade County, the most male-oriented occupations are Law Enforcement (78.0%), Security & Protection (74.1%), and Firefighting & Prevention (71.6%), while the most female-oriented occupations are Personal Care & Service (84.0%), Healthcare Support (83.1%), and Food Preparation & Serving (61.8%).
| Occupation | Male | Female |
| Healthcare Support | 245 (16.9%) | 1,208 (83.1%) |
| Security & Protection | 547 (74.1%) | 191 (25.9%) |
| Firefighting & Prevention | 320 (71.6%) | 127 (28.4%) |
| Law Enforcement | 227 (78.0%) | 64 (22.0%) |
| Food Preparation & Serving | 930 (38.2%) | 1,502 (61.8%) |
| Cleaning & Maintenance | 768 (54.7%) | 637 (45.3%) |
| Personal Care & Service | 177 (16.0%) | 932 (84.0%) |
| Total (Category) | 2,667 (37.4%) | 4,470 (62.6%) |
| Total (Overall) | 19,671 (51.3%) | 18,639 (48.6%) |
Sales and Office Occupations
The most common Sales and Office occupations in Cascade County are Sales & Related (4,334 | 11.3%), and Office & Administration (4,107 | 10.7%).

Sales and Office Occupations by Sex
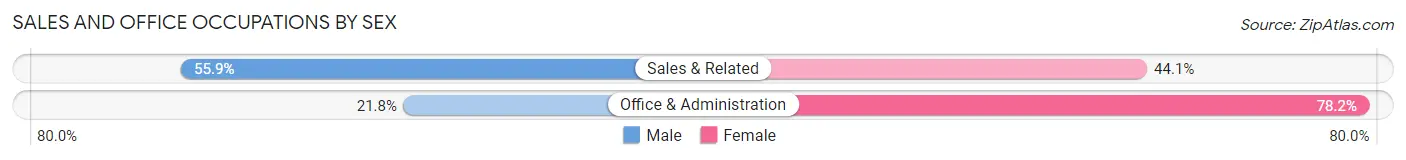
| Occupation | Male | Female |
| Sales & Related | 2,423 (55.9%) | 1,911 (44.1%) |
| Office & Administration | 896 (21.8%) | 3,211 (78.2%) |
| Total (Category) | 3,319 (39.3%) | 5,122 (60.7%) |
| Total (Overall) | 19,671 (51.3%) | 18,639 (48.6%) |
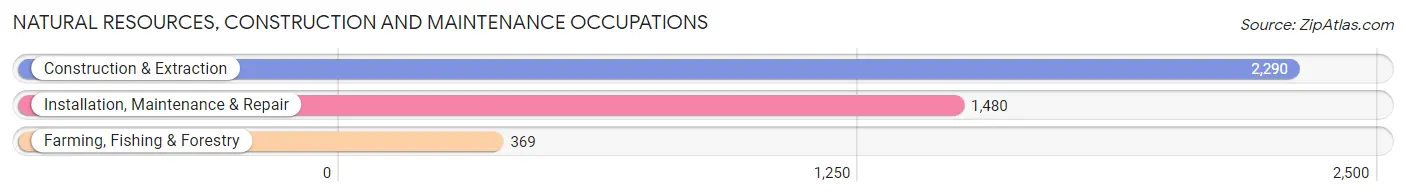
Natural Resources, Construction and Maintenance Occupations
The most common Natural Resources, Construction and Maintenance occupations in Cascade County are Construction & Extraction (2,290 | 6.0%), Installation, Maintenance & Repair (1,480 | 3.9%), and Farming, Fishing & Forestry (369 | 1.0%).
Natural Resources, Construction and Maintenance Occupations by Sex
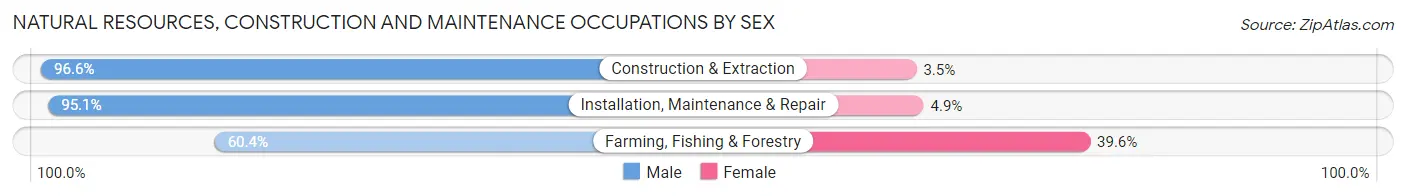
| Occupation | Male | Female |
| Farming, Fishing & Forestry | 223 (60.4%) | 146 (39.6%) |
| Construction & Extraction | 2,211 (96.6%) | 79 (3.5%) |
| Installation, Maintenance & Repair | 1,407 (95.1%) | 73 (4.9%) |
| Total (Category) | 3,841 (92.8%) | 298 (7.2%) |
| Total (Overall) | 19,671 (51.3%) | 18,639 (48.6%) |
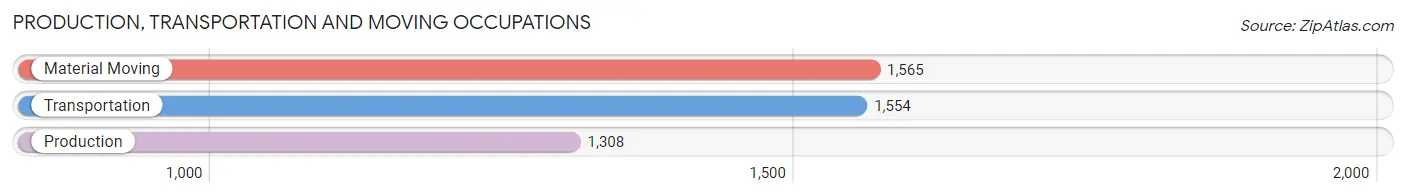
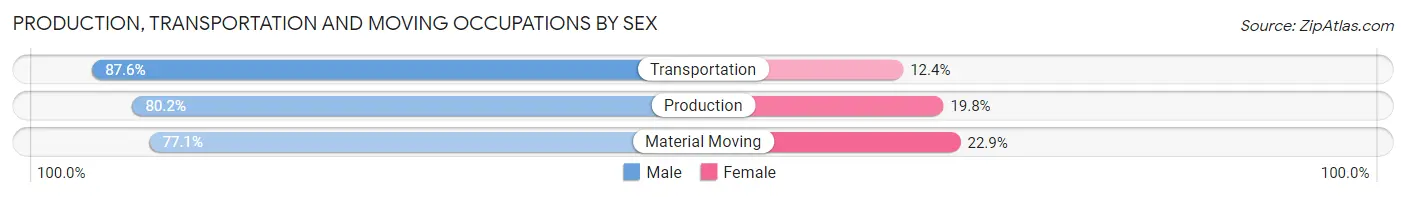
Production, Transportation and Moving Occupations
The most common Production, Transportation and Moving occupations in Cascade County are Material Moving (1,565 | 4.1%), Transportation (1,554 | 4.1%), and Production (1,308 | 3.4%).
Production, Transportation and Moving Occupations by Sex
| Occupation | Male | Female |
| Production | 1,049 (80.2%) | 259 (19.8%) |
| Transportation | 1,361 (87.6%) | 193 (12.4%) |
| Material Moving | 1,206 (77.1%) | 359 (22.9%) |
| Total (Category) | 3,616 (81.7%) | 811 (18.3%) |
| Total (Overall) | 19,671 (51.3%) | 18,639 (48.6%) |
Employment Industries by Sex in Cascade County
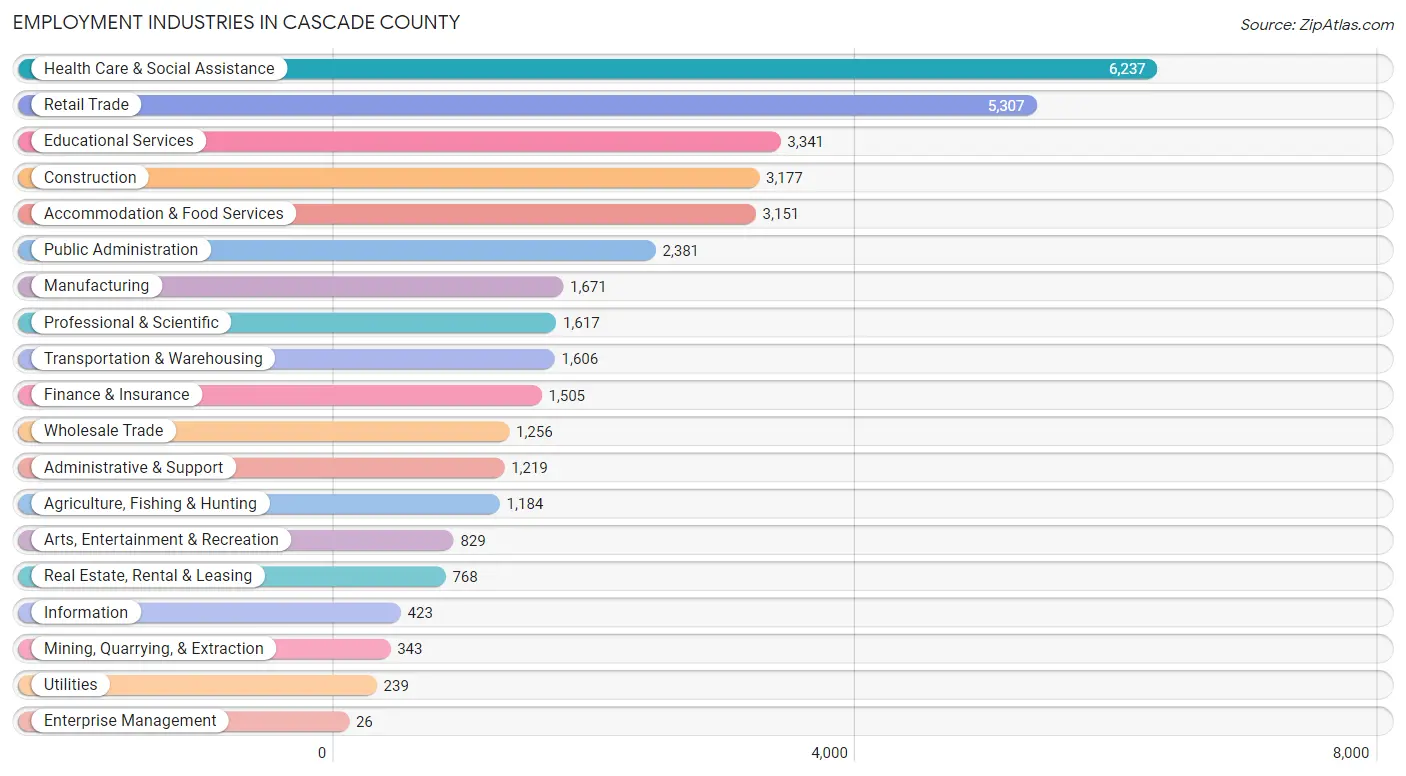
Employment Industries in Cascade County
The major employment industries in Cascade County include Health Care & Social Assistance (6,237 | 16.3%), Retail Trade (5,307 | 13.9%), Educational Services (3,341 | 8.7%), Construction (3,177 | 8.3%), and Accommodation & Food Services (3,151 | 8.2%).
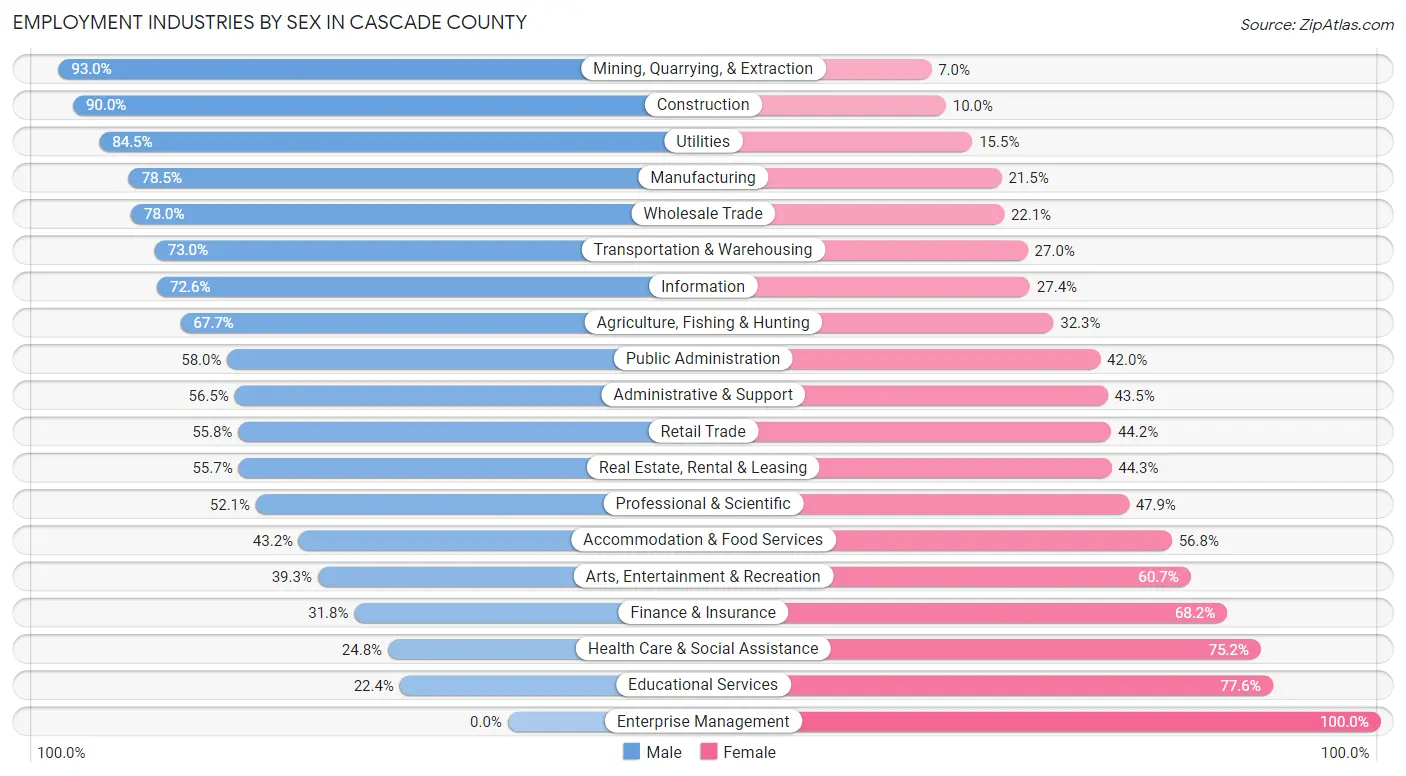
Employment Industries by Sex in Cascade County
The Cascade County industries that see more men than women are Mining, Quarrying, & Extraction (93.0%), Construction (90.0%), and Utilities (84.5%), whereas the industries that tend to have a higher number of women are Enterprise Management (100.0%), Educational Services (77.6%), and Health Care & Social Assistance (75.2%).
| Industry | Male | Female |
| Agriculture, Fishing & Hunting | 802 (67.7%) | 382 (32.3%) |
| Mining, Quarrying, & Extraction | 319 (93.0%) | 24 (7.0%) |
| Construction | 2,859 (90.0%) | 318 (10.0%) |
| Manufacturing | 1,311 (78.5%) | 360 (21.5%) |
| Wholesale Trade | 979 (77.9%) | 277 (22.1%) |
| Retail Trade | 2,961 (55.8%) | 2,346 (44.2%) |
| Transportation & Warehousing | 1,173 (73.0%) | 433 (27.0%) |
| Utilities | 202 (84.5%) | 37 (15.5%) |
| Information | 307 (72.6%) | 116 (27.4%) |
| Finance & Insurance | 478 (31.8%) | 1,027 (68.2%) |
| Real Estate, Rental & Leasing | 428 (55.7%) | 340 (44.3%) |
| Professional & Scientific | 843 (52.1%) | 774 (47.9%) |
| Enterprise Management | 0 (0.0%) | 26 (100.0%) |
| Administrative & Support | 689 (56.5%) | 530 (43.5%) |
| Educational Services | 747 (22.4%) | 2,594 (77.6%) |
| Health Care & Social Assistance | 1,547 (24.8%) | 4,690 (75.2%) |
| Arts, Entertainment & Recreation | 326 (39.3%) | 503 (60.7%) |
| Accommodation & Food Services | 1,362 (43.2%) | 1,789 (56.8%) |
| Public Administration | 1,382 (58.0%) | 999 (42.0%) |
| Total | 19,671 (51.3%) | 18,639 (48.6%) |
Education in Cascade County
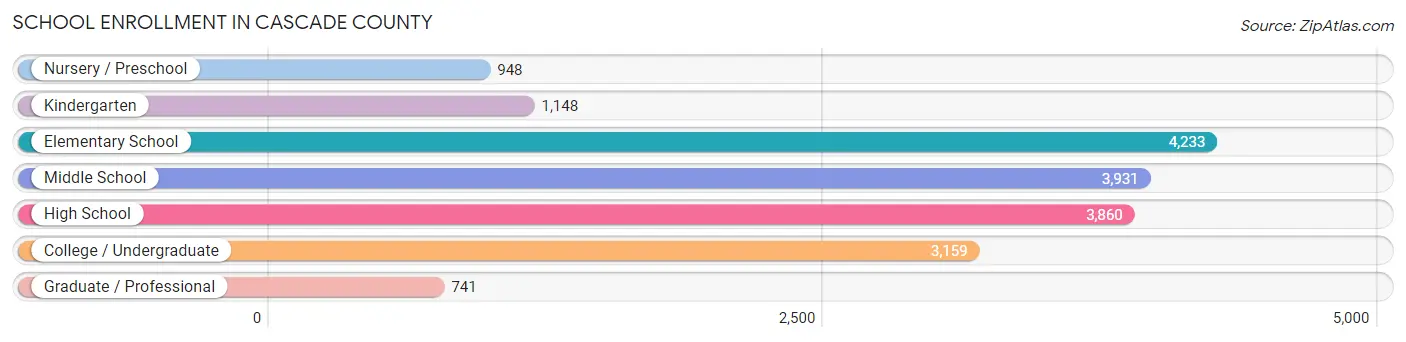
School Enrollment in Cascade County
The most common levels of schooling among the 18,020 students in Cascade County are elementary school (4,233 | 23.5%), middle school (3,931 | 21.8%), and high school (3,860 | 21.4%).
| School Level | # Students | % Students |
| Nursery / Preschool | 948 | 5.3% |
| Kindergarten | 1,148 | 6.4% |
| Elementary School | 4,233 | 23.5% |
| Middle School | 3,931 | 21.8% |
| High School | 3,860 | 21.4% |
| College / Undergraduate | 3,159 | 17.5% |
| Graduate / Professional | 741 | 4.1% |
| Total | 18,020 | 100.0% |
School Enrollment by Age by Funding Source in Cascade County
Out of a total of 18,020 students who are enrolled in schools in Cascade County, 2,649 (14.7%) attend a private institution, while the remaining 15,371 (85.3%) are enrolled in public schools. The age group of 3 to 4 year olds has the highest likelihood of being enrolled in private schools, with 352 (47.3% in the age bracket) enrolled. Conversely, the age group of 15 to 17 year olds has the lowest likelihood of being enrolled in a private school, with 2,529 (92.3% in the age bracket) attending a public institution.
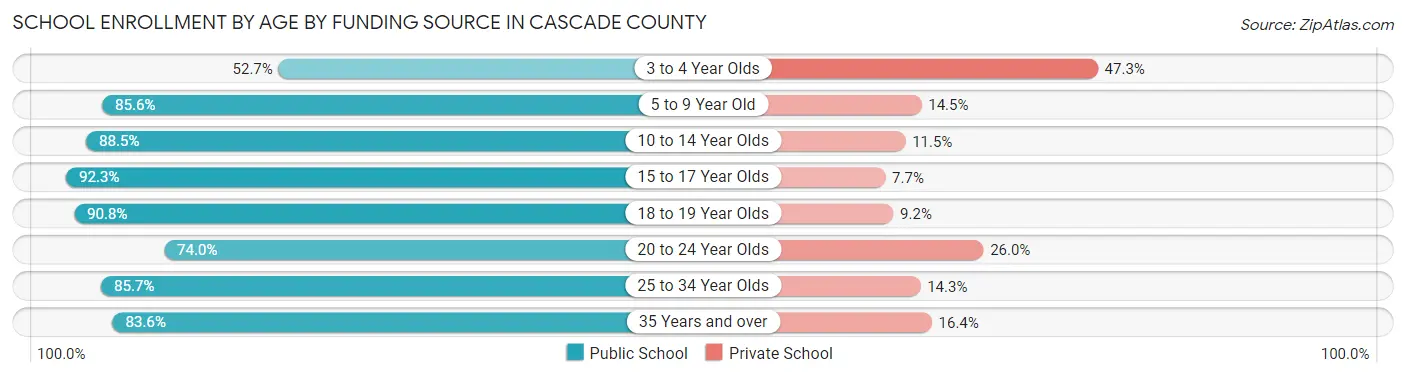
| Age Bracket | Public School | Private School |
| 3 to 4 Year Olds | 392 (52.7%) | 352 (47.3%) |
| 5 to 9 Year Old | 4,352 (85.6%) | 735 (14.4%) |
| 10 to 14 Year Olds | 4,436 (88.5%) | 574 (11.5%) |
| 15 to 17 Year Olds | 2,529 (92.3%) | 212 (7.7%) |
| 18 to 19 Year Olds | 896 (90.8%) | 91 (9.2%) |
| 20 to 24 Year Olds | 1,136 (74.0%) | 399 (26.0%) |
| 25 to 34 Year Olds | 884 (85.7%) | 147 (14.3%) |
| 35 Years and over | 740 (83.6%) | 145 (16.4%) |
| Total | 15,371 (85.3%) | 2,649 (14.7%) |
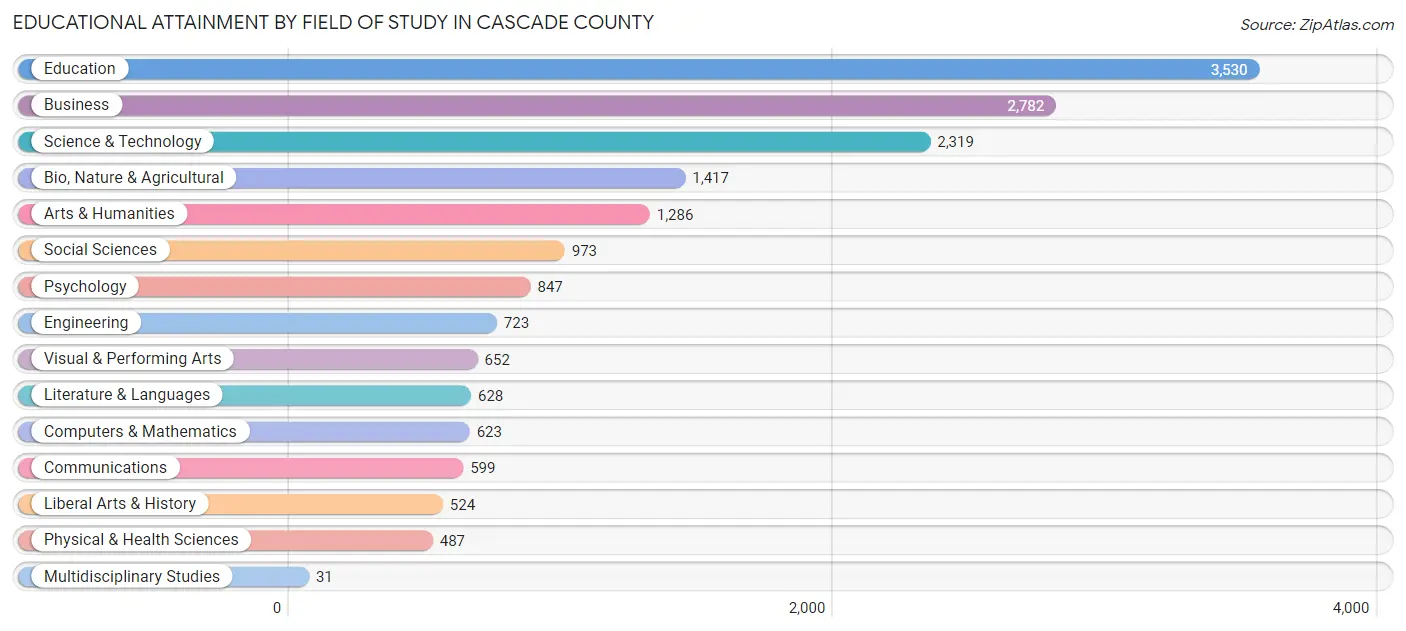
Educational Attainment by Field of Study in Cascade County
Education (3,530 | 20.3%), business (2,782 | 16.0%), science & technology (2,319 | 13.3%), bio, nature & agricultural (1,417 | 8.1%), and arts & humanities (1,286 | 7.4%) are the most common fields of study among 17,421 individuals in Cascade County who have obtained a bachelor's degree or higher.
| Field of Study | # Graduates | % Graduates |
| Computers & Mathematics | 623 | 3.6% |
| Bio, Nature & Agricultural | 1,417 | 8.1% |
| Physical & Health Sciences | 487 | 2.8% |
| Psychology | 847 | 4.9% |
| Social Sciences | 973 | 5.6% |
| Engineering | 723 | 4.2% |
| Multidisciplinary Studies | 31 | 0.2% |
| Science & Technology | 2,319 | 13.3% |
| Business | 2,782 | 16.0% |
| Education | 3,530 | 20.3% |
| Literature & Languages | 628 | 3.6% |
| Liberal Arts & History | 524 | 3.0% |
| Visual & Performing Arts | 652 | 3.7% |
| Communications | 599 | 3.4% |
| Arts & Humanities | 1,286 | 7.4% |
| Total | 17,421 | 100.0% |
Transportation & Commute in Cascade County
Vehicle Availability by Sex in Cascade County
The most prevalent vehicle ownership categories in Cascade County are males with 2 vehicles (8,258, accounting for 39.2%) and females with 2 vehicles (7,348, making up 45.2%).
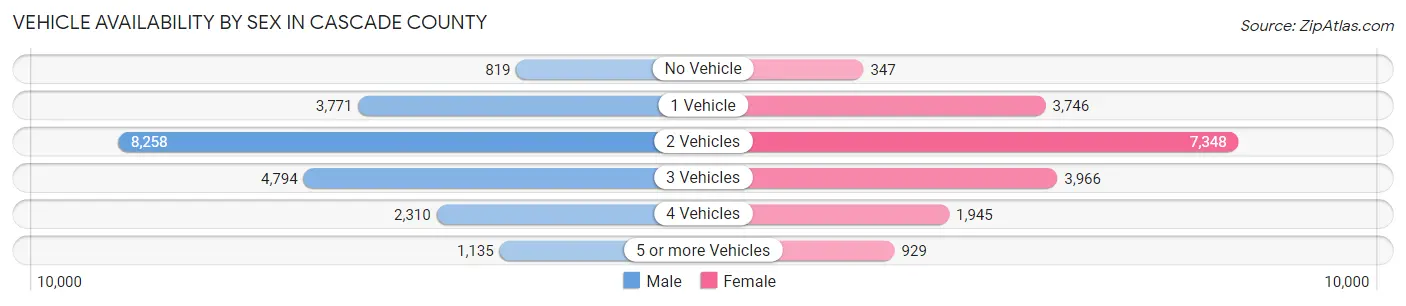
| Vehicles Available | Male | Female |
| No Vehicle | 819 (3.9%) | 347 (1.9%) |
| 1 Vehicle | 3,771 (17.9%) | 3,746 (20.5%) |
| 2 Vehicles | 8,258 (39.2%) | 7,348 (40.2%) |
| 3 Vehicles | 4,794 (22.7%) | 3,966 (21.7%) |
| 4 Vehicles | 2,310 (11.0%) | 1,945 (10.6%) |
| 5 or more Vehicles | 1,135 (5.4%) | 929 (5.1%) |
| Total | 21,087 (100.0%) | 18,281 (100.0%) |
Commute Time in Cascade County
The most frequently occuring commute durations in Cascade County are 10 to 14 minutes (8,961 commuters, 23.7%), 15 to 19 minutes (8,779 commuters, 23.2%), and 5 to 9 minutes (7,488 commuters, 19.8%).
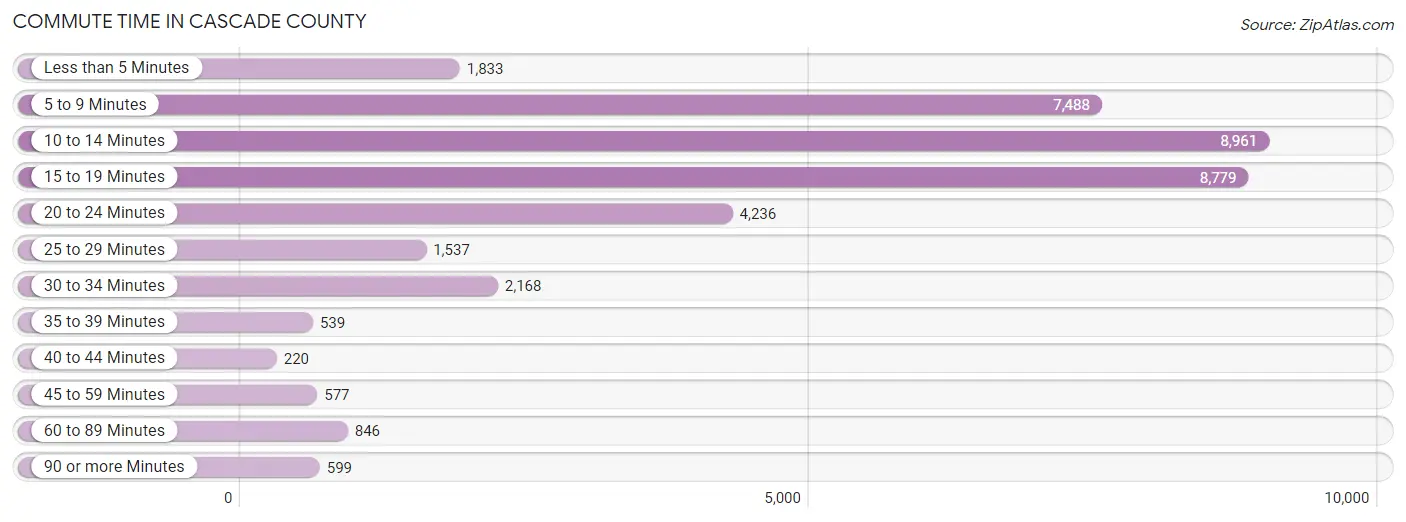
| Commute Time | # Commuters | % Commuters |
| Less than 5 Minutes | 1,833 | 4.9% |
| 5 to 9 Minutes | 7,488 | 19.8% |
| 10 to 14 Minutes | 8,961 | 23.7% |
| 15 to 19 Minutes | 8,779 | 23.2% |
| 20 to 24 Minutes | 4,236 | 11.2% |
| 25 to 29 Minutes | 1,537 | 4.1% |
| 30 to 34 Minutes | 2,168 | 5.7% |
| 35 to 39 Minutes | 539 | 1.4% |
| 40 to 44 Minutes | 220 | 0.6% |
| 45 to 59 Minutes | 577 | 1.5% |
| 60 to 89 Minutes | 846 | 2.2% |
| 90 or more Minutes | 599 | 1.6% |
Commute Time by Sex in Cascade County
The most common commute times in Cascade County are 10 to 14 minutes (4,935 commuters, 24.0%) for males and 15 to 19 minutes (4,212 commuters, 24.5%) for females.
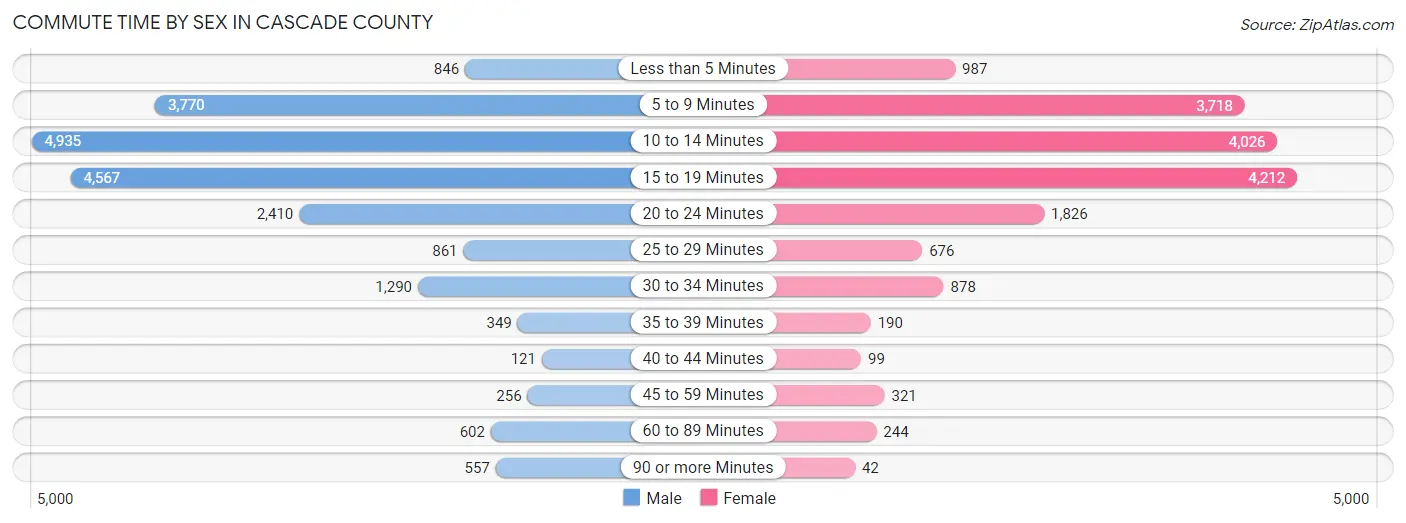
| Commute Time | Male | Female |
| Less than 5 Minutes | 846 (4.1%) | 987 (5.7%) |
| 5 to 9 Minutes | 3,770 (18.3%) | 3,718 (21.6%) |
| 10 to 14 Minutes | 4,935 (24.0%) | 4,026 (23.4%) |
| 15 to 19 Minutes | 4,567 (22.2%) | 4,212 (24.5%) |
| 20 to 24 Minutes | 2,410 (11.7%) | 1,826 (10.6%) |
| 25 to 29 Minutes | 861 (4.2%) | 676 (3.9%) |
| 30 to 34 Minutes | 1,290 (6.3%) | 878 (5.1%) |
| 35 to 39 Minutes | 349 (1.7%) | 190 (1.1%) |
| 40 to 44 Minutes | 121 (0.6%) | 99 (0.6%) |
| 45 to 59 Minutes | 256 (1.2%) | 321 (1.9%) |
| 60 to 89 Minutes | 602 (2.9%) | 244 (1.4%) |
| 90 or more Minutes | 557 (2.7%) | 42 (0.2%) |
Time of Departure to Work by Sex in Cascade County
The most frequent times of departure to work in Cascade County are 6:30 AM to 6:59 AM (3,384, 16.5%) for males and 7:30 AM to 7:59 AM (3,877, 22.5%) for females.
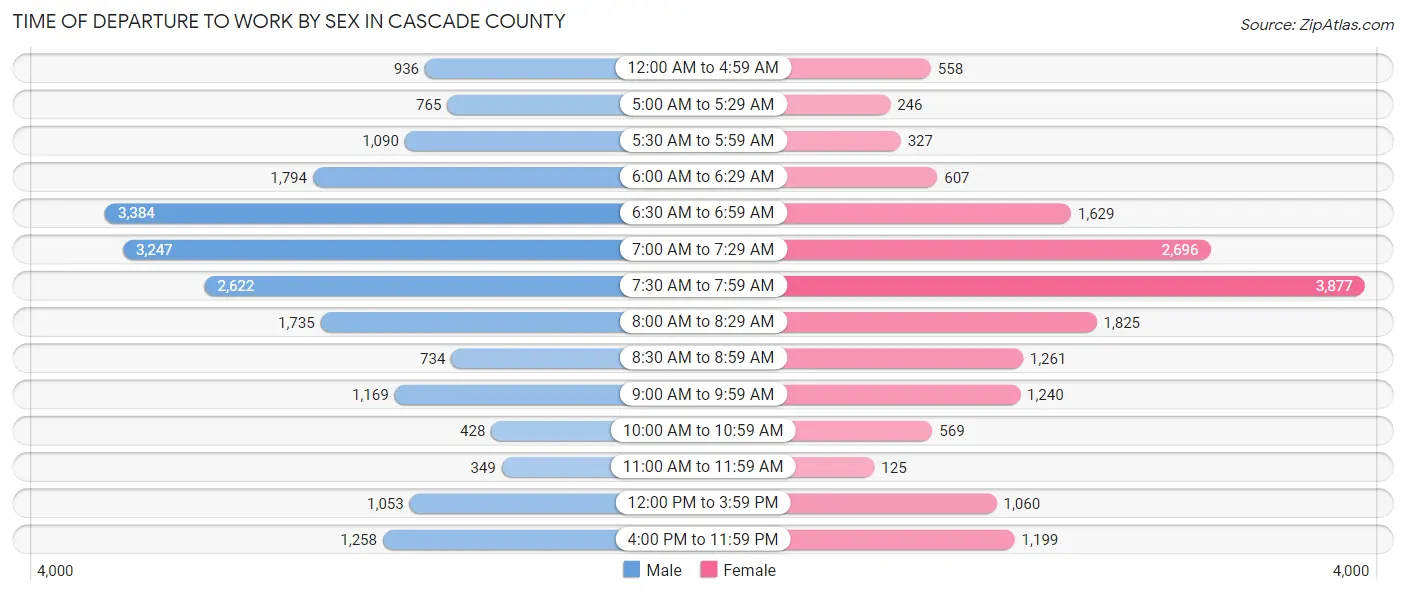
| Time of Departure | Male | Female |
| 12:00 AM to 4:59 AM | 936 (4.5%) | 558 (3.2%) |
| 5:00 AM to 5:29 AM | 765 (3.7%) | 246 (1.4%) |
| 5:30 AM to 5:59 AM | 1,090 (5.3%) | 327 (1.9%) |
| 6:00 AM to 6:29 AM | 1,794 (8.7%) | 607 (3.5%) |
| 6:30 AM to 6:59 AM | 3,384 (16.5%) | 1,629 (9.5%) |
| 7:00 AM to 7:29 AM | 3,247 (15.8%) | 2,696 (15.7%) |
| 7:30 AM to 7:59 AM | 2,622 (12.8%) | 3,877 (22.5%) |
| 8:00 AM to 8:29 AM | 1,735 (8.4%) | 1,825 (10.6%) |
| 8:30 AM to 8:59 AM | 734 (3.6%) | 1,261 (7.3%) |
| 9:00 AM to 9:59 AM | 1,169 (5.7%) | 1,240 (7.2%) |
| 10:00 AM to 10:59 AM | 428 (2.1%) | 569 (3.3%) |
| 11:00 AM to 11:59 AM | 349 (1.7%) | 125 (0.7%) |
| 12:00 PM to 3:59 PM | 1,053 (5.1%) | 1,060 (6.2%) |
| 4:00 PM to 11:59 PM | 1,258 (6.1%) | 1,199 (7.0%) |
| Total | 20,564 (100.0%) | 17,219 (100.0%) |
Housing Occupancy in Cascade County
Occupancy by Ownership in Cascade County
Of the total 34,577 dwellings in Cascade County, owner-occupied units account for 23,517 (68.0%), while renter-occupied units make up 11,060 (32.0%).
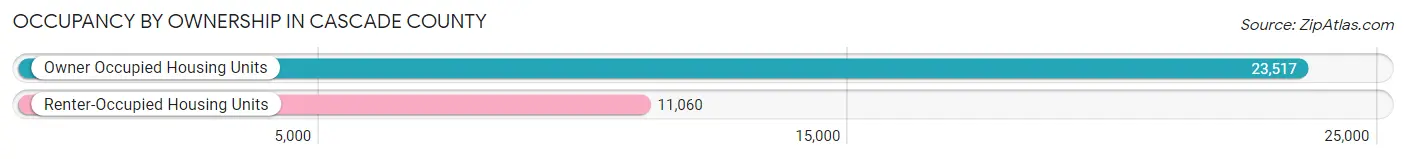
| Occupancy | # Housing Units | % Housing Units |
| Owner Occupied Housing Units | 23,517 | 68.0% |
| Renter-Occupied Housing Units | 11,060 | 32.0% |
| Total Occupied Housing Units | 34,577 | 100.0% |
Occupancy by Household Size in Cascade County
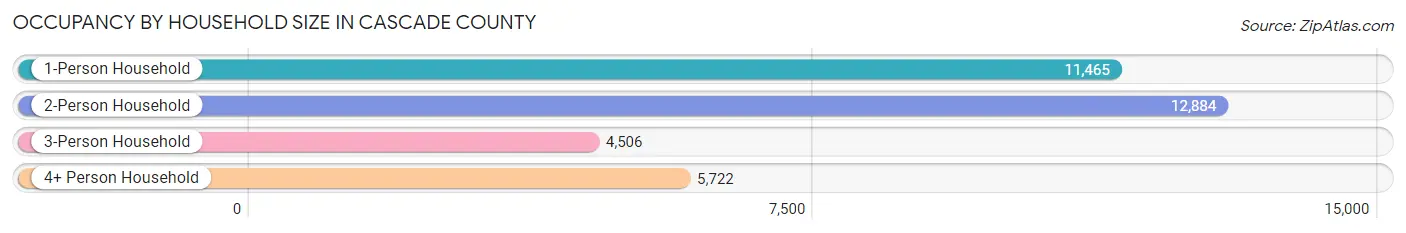
| Household Size | # Housing Units | % Housing Units |
| 1-Person Household | 11,465 | 33.2% |
| 2-Person Household | 12,884 | 37.3% |
| 3-Person Household | 4,506 | 13.0% |
| 4+ Person Household | 5,722 | 16.6% |
| Total Housing Units | 34,577 | 100.0% |
Occupancy by Ownership by Household Size in Cascade County
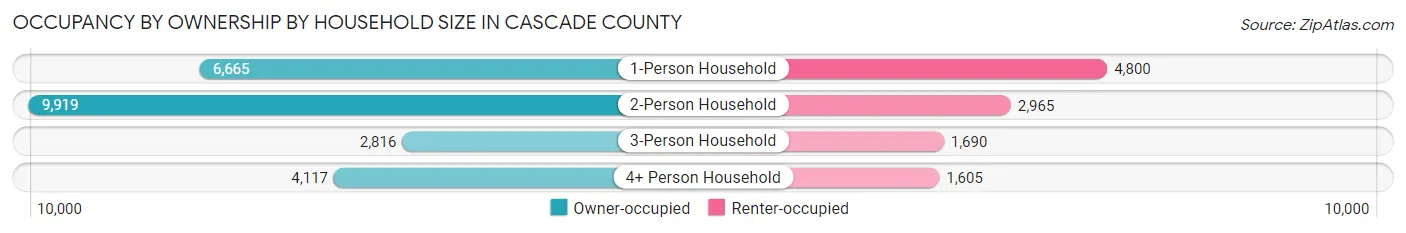
| Household Size | Owner-occupied | Renter-occupied |
| 1-Person Household | 6,665 (58.1%) | 4,800 (41.9%) |
| 2-Person Household | 9,919 (77.0%) | 2,965 (23.0%) |
| 3-Person Household | 2,816 (62.5%) | 1,690 (37.5%) |
| 4+ Person Household | 4,117 (72.0%) | 1,605 (28.1%) |
| Total Housing Units | 23,517 (68.0%) | 11,060 (32.0%) |
Occupancy by Educational Attainment in Cascade County
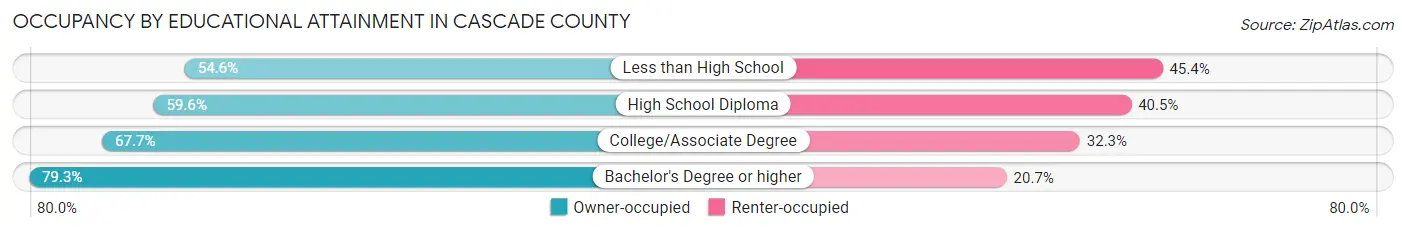
| Household Size | Owner-occupied | Renter-occupied |
| Less than High School | 951 (54.6%) | 791 (45.4%) |
| High School Diploma | 6,073 (59.6%) | 4,125 (40.5%) |
| College/Associate Degree | 8,500 (67.7%) | 4,057 (32.3%) |
| Bachelor's Degree or higher | 7,993 (79.3%) | 2,087 (20.7%) |
Occupancy by Age of Householder in Cascade County
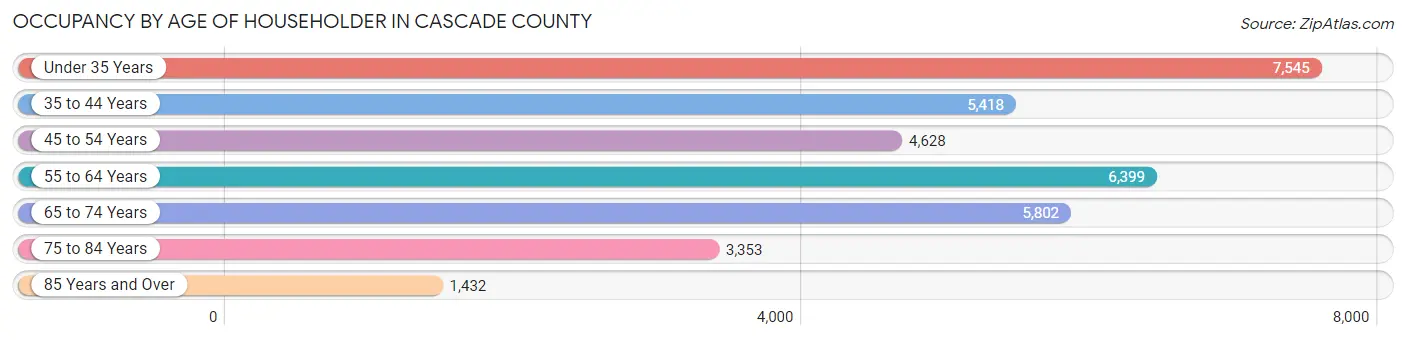
| Age Bracket | # Households | % Households |
| Under 35 Years | 7,545 | 21.8% |
| 35 to 44 Years | 5,418 | 15.7% |
| 45 to 54 Years | 4,628 | 13.4% |
| 55 to 64 Years | 6,399 | 18.5% |
| 65 to 74 Years | 5,802 | 16.8% |
| 75 to 84 Years | 3,353 | 9.7% |
| 85 Years and Over | 1,432 | 4.1% |
| Total | 34,577 | 100.0% |
Housing Finances in Cascade County
Median Income by Occupancy in Cascade County
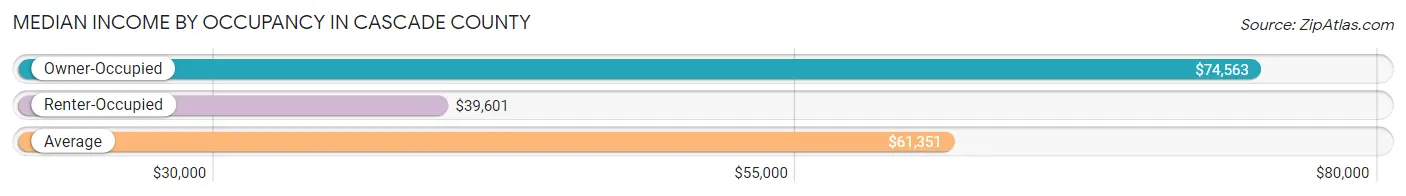
| Occupancy Type | # Households | Median Income |
| Owner-Occupied | 23,517 (68.0%) | $74,563 |
| Renter-Occupied | 11,060 (32.0%) | $39,601 |
| Average | 34,577 (100.0%) | $61,351 |
Occupancy by Householder Income Bracket in Cascade County
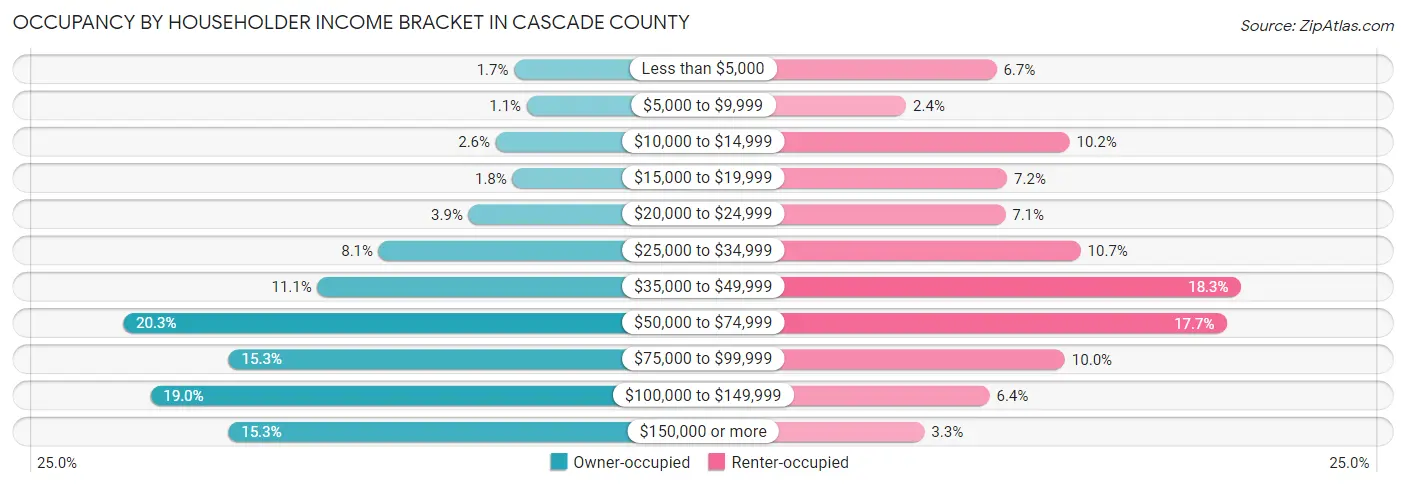
| Income Bracket | Owner-occupied | Renter-occupied |
| Less than $5,000 | 396 (1.7%) | 742 (6.7%) |
| $5,000 to $9,999 | 255 (1.1%) | 267 (2.4%) |
| $10,000 to $14,999 | 601 (2.6%) | 1,127 (10.2%) |
| $15,000 to $19,999 | 413 (1.8%) | 799 (7.2%) |
| $20,000 to $24,999 | 905 (3.8%) | 789 (7.1%) |
| $25,000 to $34,999 | 1,911 (8.1%) | 1,186 (10.7%) |
| $35,000 to $49,999 | 2,598 (11.1%) | 2,026 (18.3%) |
| $50,000 to $74,999 | 4,777 (20.3%) | 1,952 (17.6%) |
| $75,000 to $99,999 | 3,593 (15.3%) | 1,103 (10.0%) |
| $100,000 to $149,999 | 4,471 (19.0%) | 706 (6.4%) |
| $150,000 or more | 3,597 (15.3%) | 363 (3.3%) |
| Total | 23,517 (100.0%) | 11,060 (100.0%) |
Monthly Housing Cost Tiers in Cascade County
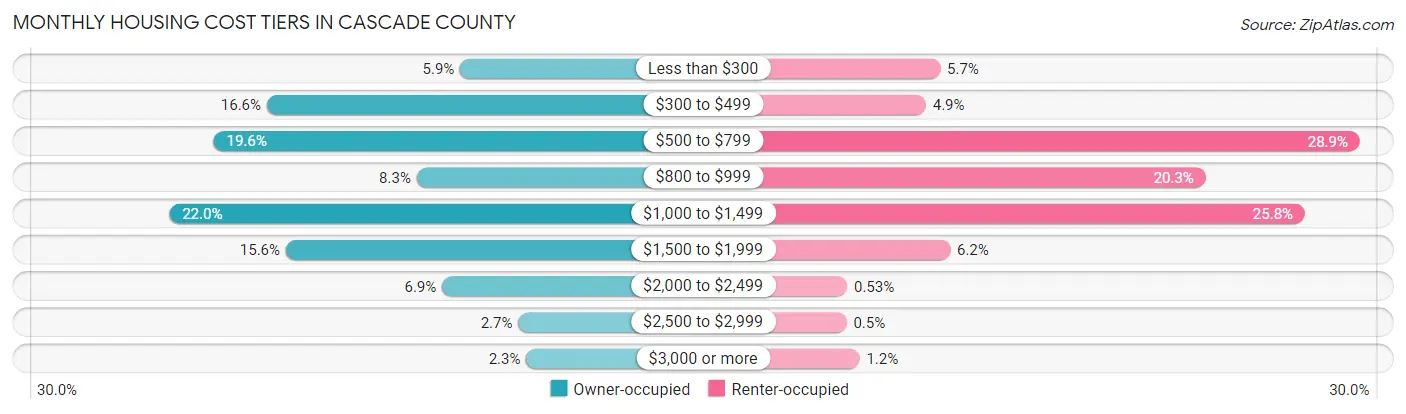
| Monthly Cost | Owner-occupied | Renter-occupied |
| Less than $300 | 1,397 (5.9%) | 627 (5.7%) |
| $300 to $499 | 3,909 (16.6%) | 540 (4.9%) |
| $500 to $799 | 4,601 (19.6%) | 3,191 (28.8%) |
| $800 to $999 | 1,961 (8.3%) | 2,250 (20.3%) |
| $1,000 to $1,499 | 5,177 (22.0%) | 2,856 (25.8%) |
| $1,500 to $1,999 | 3,662 (15.6%) | 688 (6.2%) |
| $2,000 to $2,499 | 1,631 (6.9%) | 59 (0.5%) |
| $2,500 to $2,999 | 641 (2.7%) | 55 (0.5%) |
| $3,000 or more | 538 (2.3%) | 135 (1.2%) |
| Total | 23,517 (100.0%) | 11,060 (100.0%) |
Physical Housing Characteristics in Cascade County
Housing Structures in Cascade County
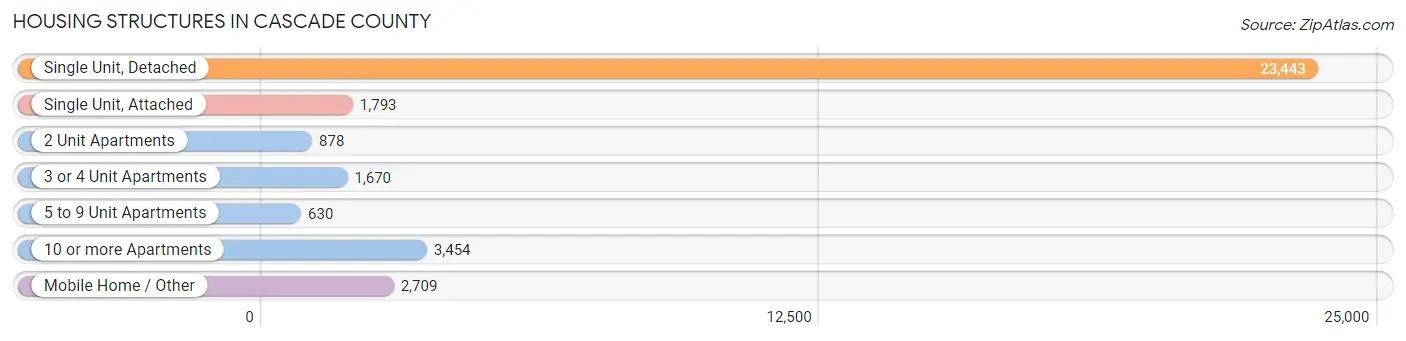
| Structure Type | # Housing Units | % Housing Units |
| Single Unit, Detached | 23,443 | 67.8% |
| Single Unit, Attached | 1,793 | 5.2% |
| 2 Unit Apartments | 878 | 2.5% |
| 3 or 4 Unit Apartments | 1,670 | 4.8% |
| 5 to 9 Unit Apartments | 630 | 1.8% |
| 10 or more Apartments | 3,454 | 10.0% |
| Mobile Home / Other | 2,709 | 7.8% |
| Total | 34,577 | 100.0% |
Housing Structures by Occupancy in Cascade County
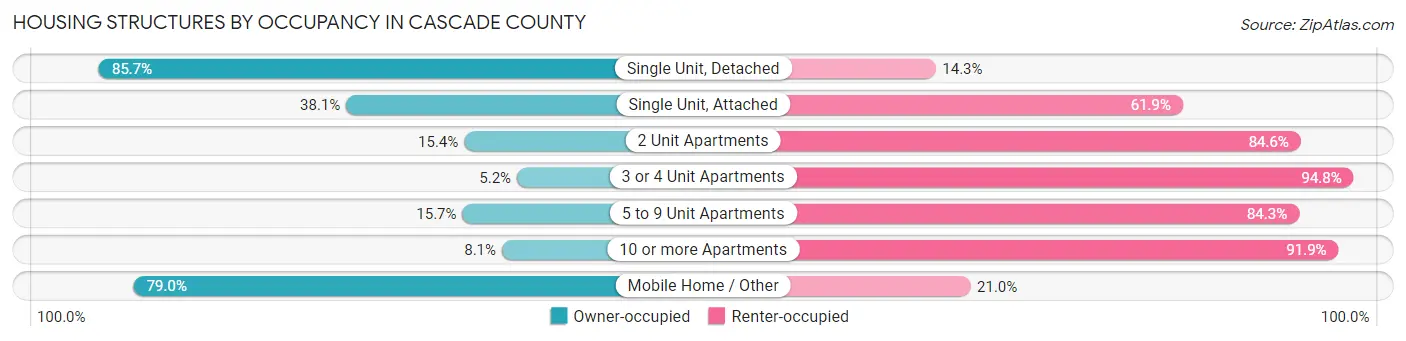
| Structure Type | Owner-occupied | Renter-occupied |
| Single Unit, Detached | 20,092 (85.7%) | 3,351 (14.3%) |
| Single Unit, Attached | 683 (38.1%) | 1,110 (61.9%) |
| 2 Unit Apartments | 135 (15.4%) | 743 (84.6%) |
| 3 or 4 Unit Apartments | 87 (5.2%) | 1,583 (94.8%) |
| 5 to 9 Unit Apartments | 99 (15.7%) | 531 (84.3%) |
| 10 or more Apartments | 280 (8.1%) | 3,174 (91.9%) |
| Mobile Home / Other | 2,141 (79.0%) | 568 (21.0%) |
| Total | 23,517 (68.0%) | 11,060 (32.0%) |
Housing Structures by Number of Rooms in Cascade County
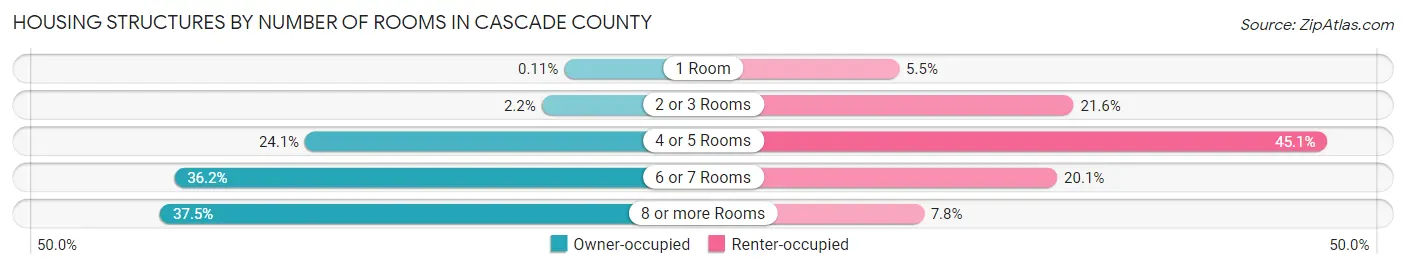
| Number of Rooms | Owner-occupied | Renter-occupied |
| 1 Room | 26 (0.1%) | 606 (5.5%) |
| 2 or 3 Rooms | 515 (2.2%) | 2,390 (21.6%) |
| 4 or 5 Rooms | 5,660 (24.1%) | 4,985 (45.1%) |
| 6 or 7 Rooms | 8,503 (36.2%) | 2,222 (20.1%) |
| 8 or more Rooms | 8,813 (37.5%) | 857 (7.7%) |
| Total | 23,517 (100.0%) | 11,060 (100.0%) |
Housing Structure by Heating Type in Cascade County
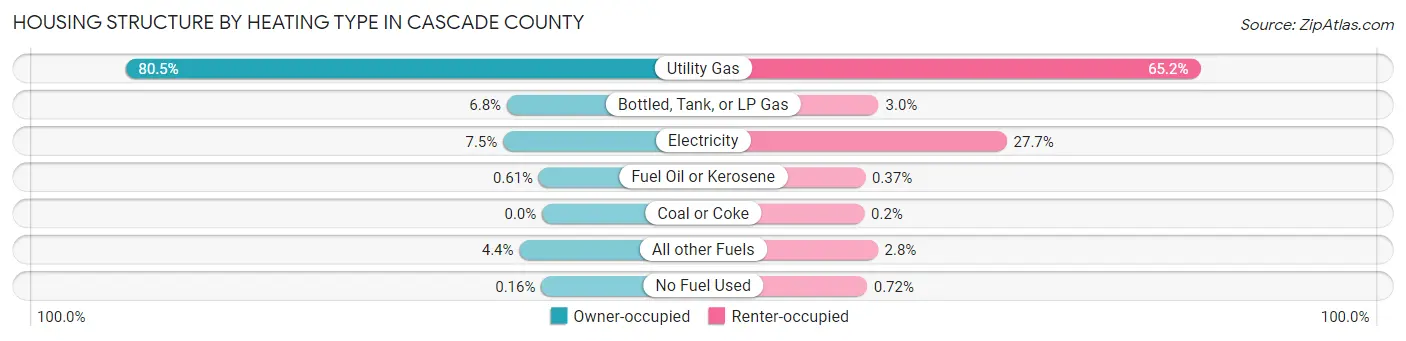
| Heating Type | Owner-occupied | Renter-occupied |
| Utility Gas | 18,935 (80.5%) | 7,206 (65.1%) |
| Bottled, Tank, or LP Gas | 1,598 (6.8%) | 332 (3.0%) |
| Electricity | 1,771 (7.5%) | 3,068 (27.7%) |
| Fuel Oil or Kerosene | 143 (0.6%) | 41 (0.4%) |
| Coal or Coke | 0 (0.0%) | 22 (0.2%) |
| All other Fuels | 1,032 (4.4%) | 311 (2.8%) |
| No Fuel Used | 38 (0.2%) | 80 (0.7%) |
| Total | 23,517 (100.0%) | 11,060 (100.0%) |
Household Vehicle Usage in Cascade County
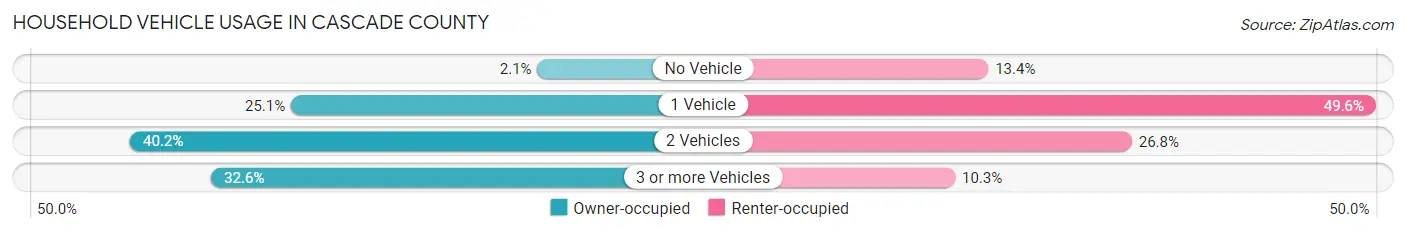
| Vehicles per Household | Owner-occupied | Renter-occupied |
| No Vehicle | 500 (2.1%) | 1,480 (13.4%) |
| 1 Vehicle | 5,910 (25.1%) | 5,481 (49.6%) |
| 2 Vehicles | 9,442 (40.2%) | 2,962 (26.8%) |
| 3 or more Vehicles | 7,665 (32.6%) | 1,137 (10.3%) |
| Total | 23,517 (100.0%) | 11,060 (100.0%) |
Real Estate & Mortgages in Cascade County
Real Estate and Mortgage Overview in Cascade County
| Characteristic | Without Mortgage | With Mortgage |
| Housing Units | 9,782 | 13,735 |
| Median Property Value | $217,800 | $233,900 |
| Median Household Income | $59,745 | $2,468 |
| Monthly Housing Costs | $484 | $495 |
| Real Estate Taxes | $2,045 | $252 |
Property Value by Mortgage Status in Cascade County
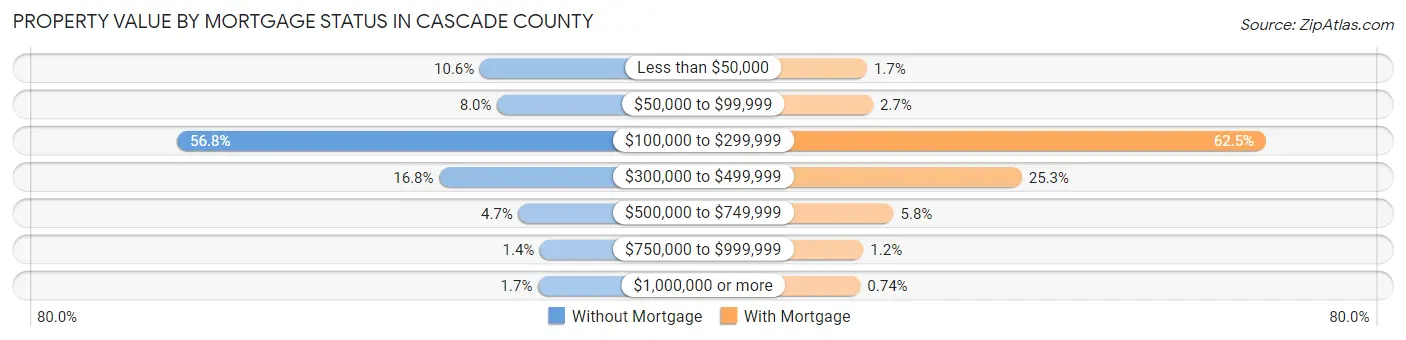
| Property Value | Without Mortgage | With Mortgage |
| Less than $50,000 | 1,036 (10.6%) | 239 (1.7%) |
| $50,000 to $99,999 | 779 (8.0%) | 366 (2.7%) |
| $100,000 to $299,999 | 5,552 (56.8%) | 8,588 (62.5%) |
| $300,000 to $499,999 | 1,643 (16.8%) | 3,480 (25.3%) |
| $500,000 to $749,999 | 462 (4.7%) | 796 (5.8%) |
| $750,000 to $999,999 | 141 (1.4%) | 165 (1.2%) |
| $1,000,000 or more | 169 (1.7%) | 101 (0.7%) |
| Total | 9,782 (100.0%) | 13,735 (100.0%) |
Household Income by Mortgage Status in Cascade County
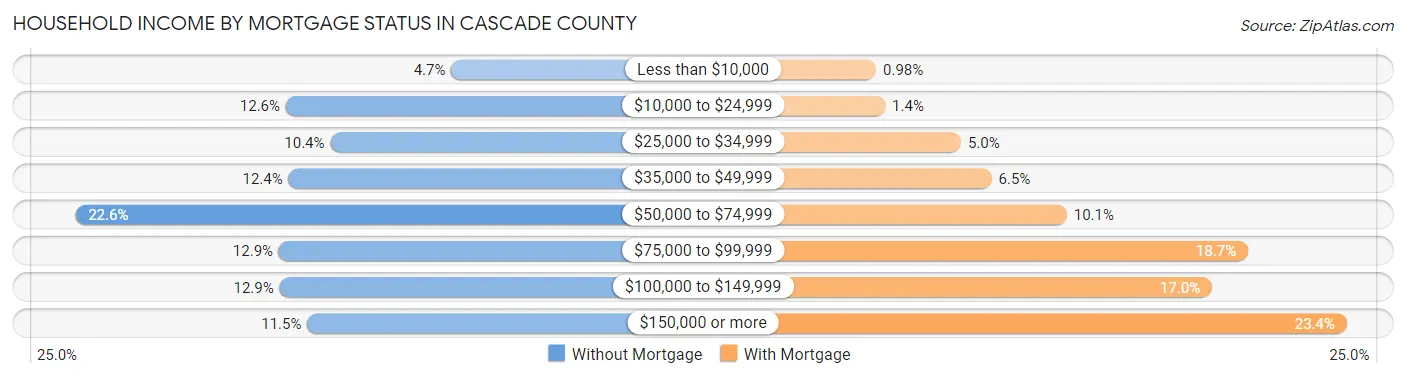
| Household Income | Without Mortgage | With Mortgage |
| Less than $10,000 | 458 (4.7%) | 135 (1.0%) |
| $10,000 to $24,999 | 1,229 (12.6%) | 193 (1.4%) |
| $25,000 to $34,999 | 1,021 (10.4%) | 690 (5.0%) |
| $35,000 to $49,999 | 1,216 (12.4%) | 890 (6.5%) |
| $50,000 to $74,999 | 2,210 (22.6%) | 1,382 (10.1%) |
| $75,000 to $99,999 | 1,261 (12.9%) | 2,567 (18.7%) |
| $100,000 to $149,999 | 1,258 (12.9%) | 2,332 (17.0%) |
| $150,000 or more | 1,129 (11.5%) | 3,213 (23.4%) |
| Total | 9,782 (100.0%) | 13,735 (100.0%) |
Property Value to Household Income Ratio in Cascade County
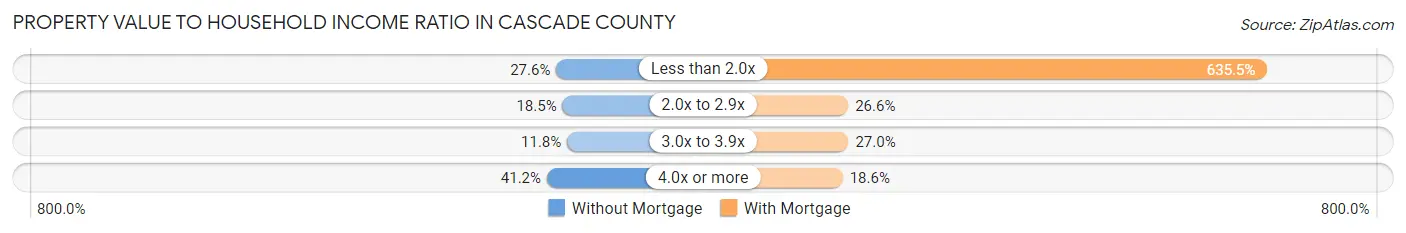
| Value-to-Income Ratio | Without Mortgage | With Mortgage |
| Less than 2.0x | 2,699 (27.6%) | 87,279 (635.4%) |
| 2.0x to 2.9x | 1,813 (18.5%) | 3,658 (26.6%) |
| 3.0x to 3.9x | 1,156 (11.8%) | 3,710 (27.0%) |
| 4.0x or more | 4,028 (41.2%) | 2,559 (18.6%) |
| Total | 9,782 (100.0%) | 13,735 (100.0%) |
Real Estate Taxes by Mortgage Status in Cascade County

| Property Taxes | Without Mortgage | With Mortgage |
| Less than $800 | 1,903 (19.5%) | 75 (0.5%) |
| $800 to $1,499 | 1,588 (16.2%) | 795 (5.8%) |
| $800 to $1,499 | 5,898 (60.3%) | 2,286 (16.6%) |
| Total | 9,782 (100.0%) | 13,735 (100.0%) |
Health & Disability in Cascade County
Health Insurance Coverage by Age in Cascade County
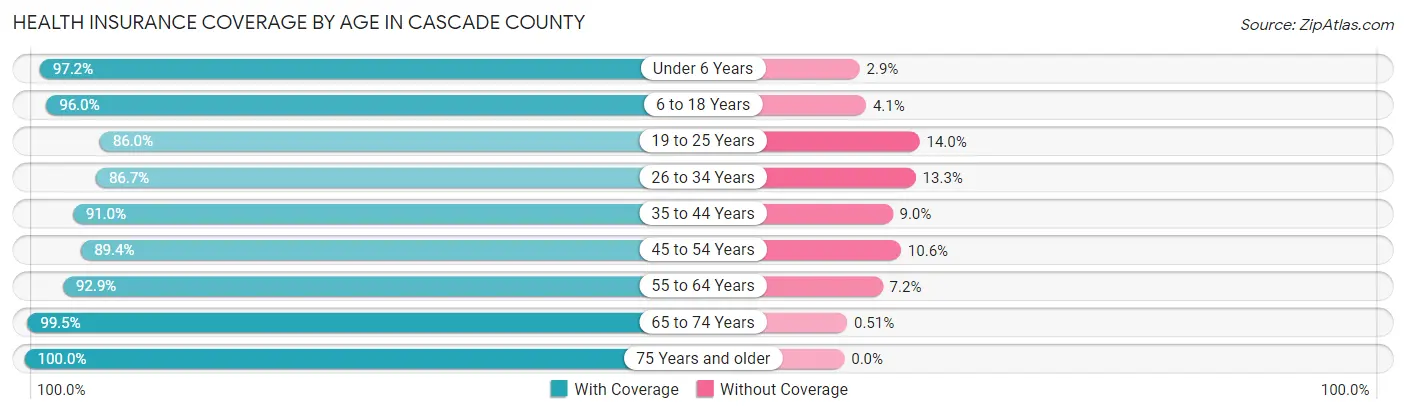
| Age Bracket | With Coverage | Without Coverage |
| Under 6 Years | 5,923 (97.2%) | 174 (2.9%) |
| 6 to 18 Years | 13,140 (96.0%) | 554 (4.1%) |
| 19 to 25 Years | 5,691 (86.0%) | 929 (14.0%) |
| 26 to 34 Years | 8,433 (86.7%) | 1,295 (13.3%) |
| 35 to 44 Years | 8,594 (91.0%) | 849 (9.0%) |
| 45 to 54 Years | 7,585 (89.4%) | 896 (10.6%) |
| 55 to 64 Years | 10,058 (92.8%) | 775 (7.1%) |
| 65 to 74 Years | 8,938 (99.5%) | 46 (0.5%) |
| 75 Years and older | 6,588 (100.0%) | 0 (0.0%) |
| Total | 74,950 (93.1%) | 5,518 (6.9%) |
Health Insurance Coverage by Citizenship Status in Cascade County

| Citizenship Status | With Coverage | Without Coverage |
| Native Born | 5,923 (97.2%) | 174 (2.9%) |
| Foreign Born, Citizen | 13,140 (96.0%) | 554 (4.1%) |
| Foreign Born, not a Citizen | 5,691 (86.0%) | 929 (14.0%) |
Health Insurance Coverage by Household Income in Cascade County
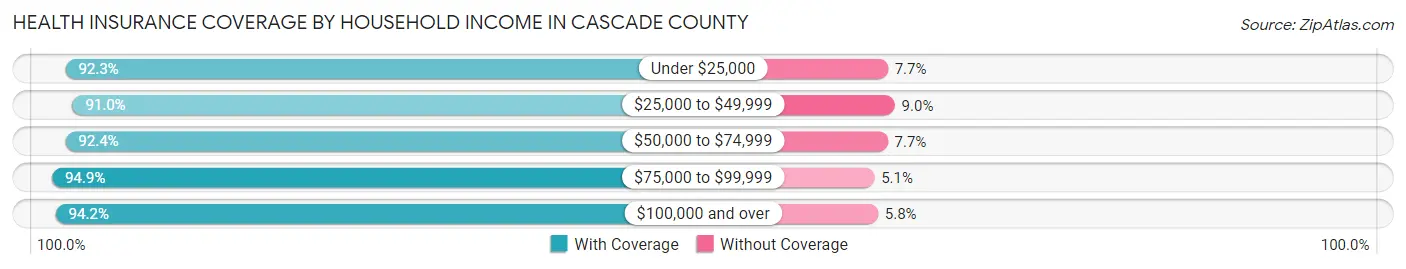
| Household Income | With Coverage | Without Coverage |
| Under $25,000 | 9,044 (92.3%) | 750 (7.7%) |
| $25,000 to $49,999 | 13,738 (91.0%) | 1,353 (9.0%) |
| $50,000 to $74,999 | 14,181 (92.3%) | 1,175 (7.6%) |
| $75,000 to $99,999 | 11,334 (94.9%) | 614 (5.1%) |
| $100,000 and over | 25,786 (94.2%) | 1,594 (5.8%) |
Public vs Private Health Insurance Coverage by Age in Cascade County
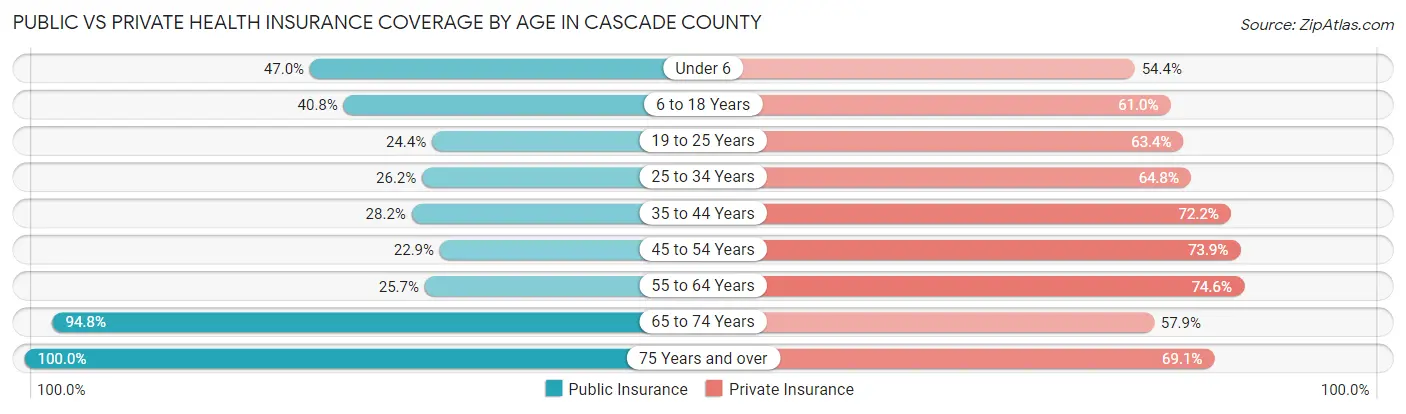
| Age Bracket | Public Insurance | Private Insurance |
| Under 6 | 2,868 (47.0%) | 3,315 (54.4%) |
| 6 to 18 Years | 5,586 (40.8%) | 8,349 (61.0%) |
| 19 to 25 Years | 1,614 (24.4%) | 4,196 (63.4%) |
| 25 to 34 Years | 2,551 (26.2%) | 6,301 (64.8%) |
| 35 to 44 Years | 2,659 (28.2%) | 6,815 (72.2%) |
| 45 to 54 Years | 1,944 (22.9%) | 6,271 (73.9%) |
| 55 to 64 Years | 2,786 (25.7%) | 8,081 (74.6%) |
| 65 to 74 Years | 8,518 (94.8%) | 5,203 (57.9%) |
| 75 Years and over | 6,588 (100.0%) | 4,553 (69.1%) |
| Total | 35,114 (43.6%) | 53,084 (66.0%) |
Disability Status by Sex by Age in Cascade County
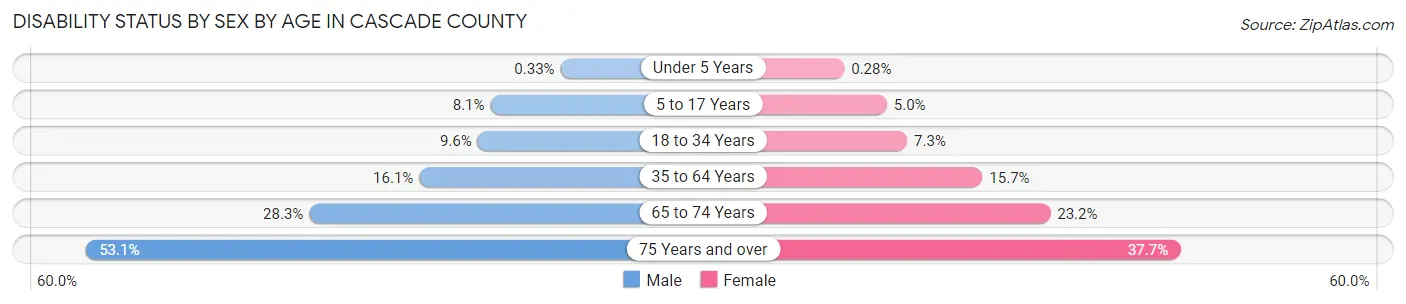
| Age Bracket | Male | Female |
| Under 5 Years | 9 (0.3%) | 7 (0.3%) |
| 5 to 17 Years | 581 (8.1%) | 325 (5.0%) |
| 18 to 34 Years | 826 (9.6%) | 632 (7.3%) |
| 35 to 64 Years | 2,300 (16.1%) | 2,261 (15.7%) |
| 65 to 74 Years | 1,212 (28.3%) | 1,092 (23.2%) |
| 75 Years and over | 1,528 (53.1%) | 1,398 (37.7%) |
Disability Class by Sex by Age in Cascade County
Disability Class: Hearing Difficulty
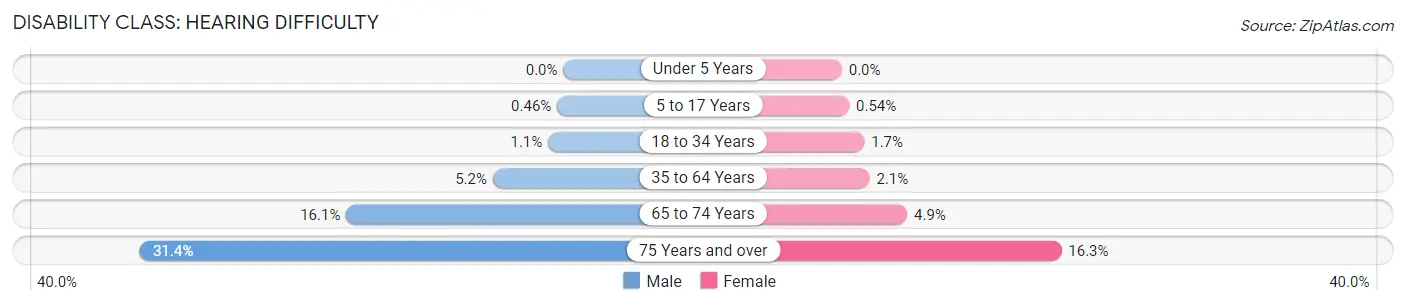
| Age Bracket | Male | Female |
| Under 5 Years | 0 (0.0%) | 0 (0.0%) |
| 5 to 17 Years | 33 (0.5%) | 35 (0.5%) |
| 18 to 34 Years | 98 (1.1%) | 145 (1.7%) |
| 35 to 64 Years | 750 (5.2%) | 297 (2.1%) |
| 65 to 74 Years | 690 (16.1%) | 228 (4.9%) |
| 75 Years and over | 904 (31.4%) | 605 (16.3%) |
Disability Class: Vision Difficulty
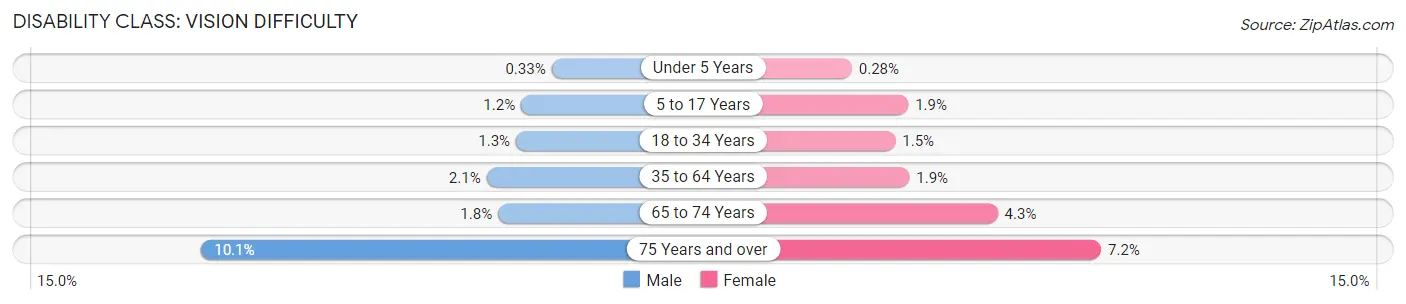
| Age Bracket | Male | Female |
| Under 5 Years | 9 (0.3%) | 7 (0.3%) |
| 5 to 17 Years | 84 (1.2%) | 120 (1.8%) |
| 18 to 34 Years | 114 (1.3%) | 129 (1.5%) |
| 35 to 64 Years | 307 (2.1%) | 271 (1.9%) |
| 65 to 74 Years | 78 (1.8%) | 204 (4.3%) |
| 75 Years and over | 290 (10.1%) | 268 (7.2%) |
Disability Class: Cognitive Difficulty
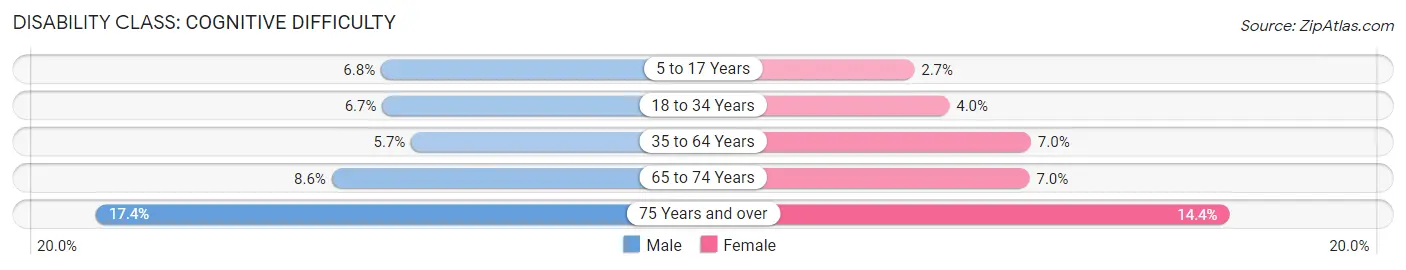
| Age Bracket | Male | Female |
| 5 to 17 Years | 484 (6.8%) | 174 (2.7%) |
| 18 to 34 Years | 581 (6.7%) | 346 (4.0%) |
| 35 to 64 Years | 809 (5.7%) | 1,014 (7.0%) |
| 65 to 74 Years | 368 (8.6%) | 328 (7.0%) |
| 75 Years and over | 499 (17.3%) | 534 (14.4%) |
Disability Class: Ambulatory Difficulty
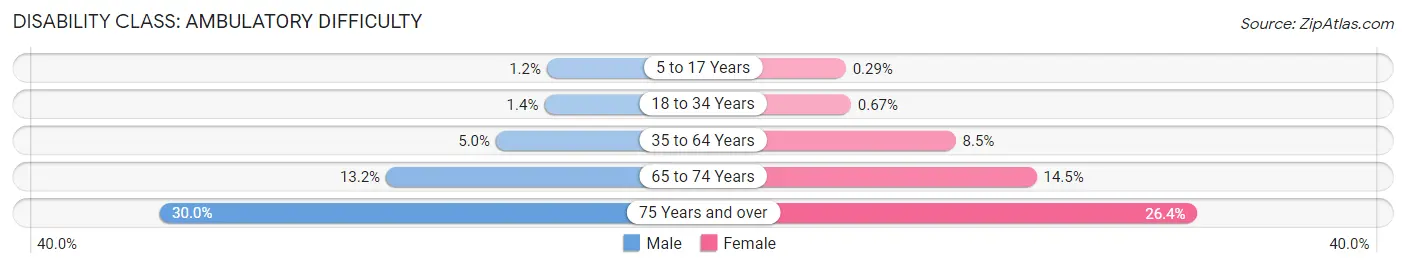
| Age Bracket | Male | Female |
| 5 to 17 Years | 88 (1.2%) | 19 (0.3%) |
| 18 to 34 Years | 123 (1.4%) | 58 (0.7%) |
| 35 to 64 Years | 717 (5.0%) | 1,220 (8.5%) |
| 65 to 74 Years | 564 (13.2%) | 680 (14.5%) |
| 75 Years and over | 863 (30.0%) | 980 (26.4%) |
Disability Class: Self-Care Difficulty
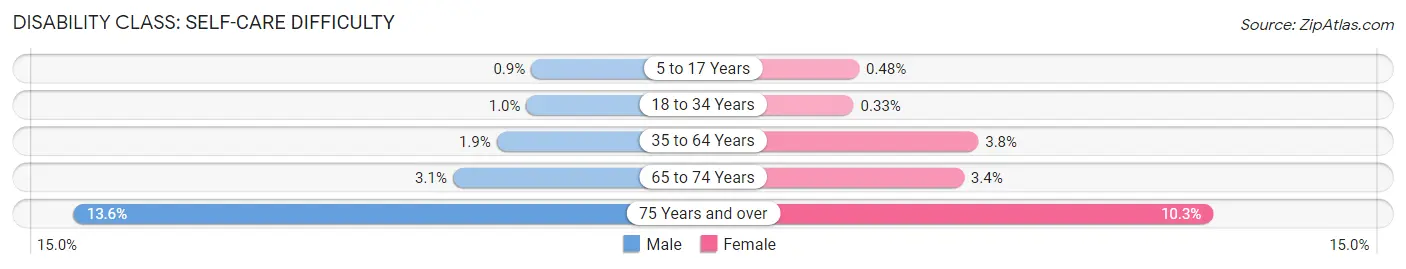
| Age Bracket | Male | Female |
| 5 to 17 Years | 64 (0.9%) | 31 (0.5%) |
| 18 to 34 Years | 89 (1.0%) | 29 (0.3%) |
| 35 to 64 Years | 267 (1.9%) | 549 (3.8%) |
| 65 to 74 Years | 132 (3.1%) | 160 (3.4%) |
| 75 Years and over | 392 (13.6%) | 384 (10.3%) |
Technology Access in Cascade County
Computing Device Access in Cascade County
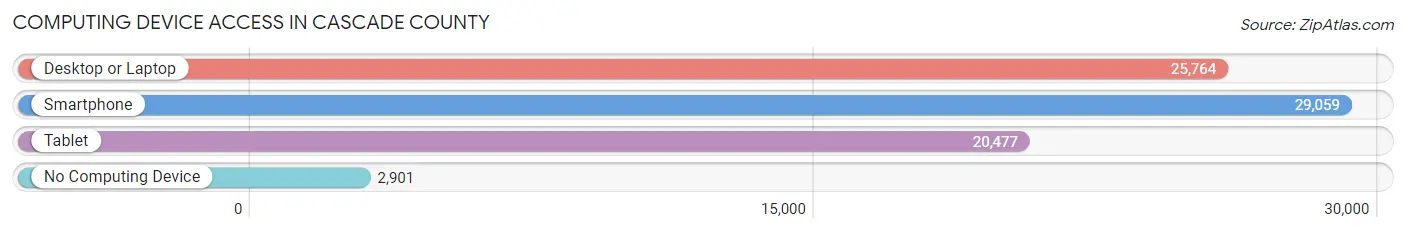
| Device Type | # Households | % Households |
| Desktop or Laptop | 25,764 | 74.5% |
| Smartphone | 29,059 | 84.0% |
| Tablet | 20,477 | 59.2% |
| No Computing Device | 2,901 | 8.4% |
| Total | 34,577 | 100.0% |
Internet Access in Cascade County
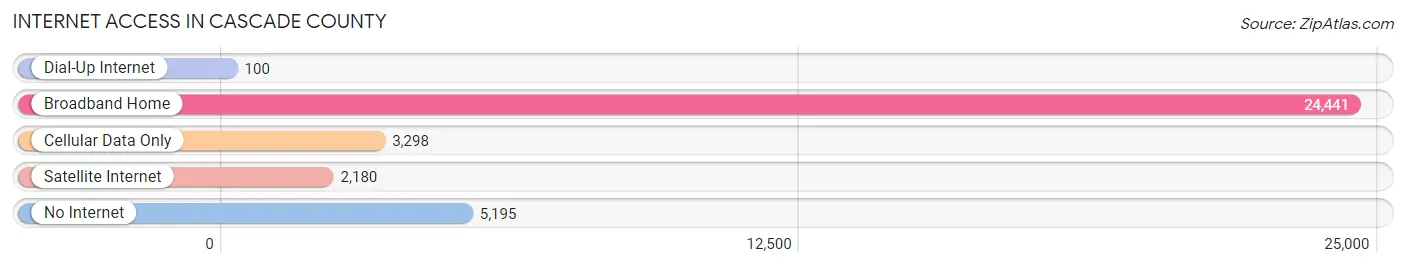
| Internet Type | # Households | % Households |
| Dial-Up Internet | 100 | 0.3% |
| Broadband Home | 24,441 | 70.7% |
| Cellular Data Only | 3,298 | 9.5% |
| Satellite Internet | 2,180 | 6.3% |
| No Internet | 5,195 | 15.0% |
| Total | 34,577 | 100.0% |
Cascade County Summary
Cascade County is located in the north-central region of Montana, and is bordered by Chouteau County to the north, Teton County to the east, Lewis and Clark County to the south, and Meagher County to the west. The county seat is Great Falls, which is the third-largest city in the state. The county was established in 1887 and named for the five waterfalls on the Missouri River, which is the county’s main waterway.
Geography
Cascade County covers an area of 2,717 square miles, making it the fourth-largest county in Montana. The county is located in the Rocky Mountain Front, and is characterized by rolling hills, grasslands, and river valleys. The Missouri River flows through the county, and is the main waterway. The county is also home to several smaller rivers, including the Sun River, Dearborn River, and Belt Creek. The county is home to several mountain ranges, including the Little Belt Mountains, Highwood Mountains, and the Big Snowy Mountains.
The county has a semi-arid climate, with hot summers and cold winters. The average annual precipitation is 13.5 inches, and the average annual temperature is 48.3 degrees Fahrenheit.
Economy
Cascade County has a diverse economy, with a mix of agriculture, manufacturing, and services. Agriculture is the largest sector of the economy, and the county is home to several large farms and ranches. The county is also home to several manufacturing companies, including a paper mill, a steel mill, and a food processing plant. The service sector is also important to the economy, and the county is home to several hospitals, universities, and government offices.
Demographics
As of the 2010 census, Cascade County had a population of 81,327. The population is spread out, with the largest city, Great Falls, accounting for nearly half of the population. The county is predominantly white, with a small Native American population. The median household income is $45,845, and the median home value is $164,400.
Conclusion
Cascade County is located in the north-central region of Montana, and is bordered by Chouteau County to the north, Teton County to the east, Lewis and Clark County to the south, and Meagher County to the west. The county is characterized by rolling hills, grasslands, and river valleys, and is home to several mountain ranges. The county has a diverse economy, with a mix of agriculture, manufacturing, and services. As of the 2010 census, Cascade County had a population of 81,327, and the median household income is $45,845.
Common Questions
What is Per Capita Income in Cascade County?
Per Capita income in Cascade County is $34,481.
What is the Median Family Income in Cascade County?
Median Family Income in Cascade County is $79,780.
What is the Median Household income in Cascade County?
Median Household Income in Cascade County is $61,351.
What is Income or Wage Gap in Cascade County?
Income or Wage Gap in Cascade County is 30.9%.
Women in Cascade County earn 69.1 cents for every dollar earned by a man.
What is Family Income Deficit in Cascade County?
Family Income Deficit in Cascade County is $9,797.
Families that are below poverty line in Cascade County earn $9,797 less on average than the poverty threshold level.
What is Inequality or Gini Index in Cascade County?
Inequality or Gini Index in Cascade County is 0.45.
What is the Total Population of Cascade County?
Total Population of Cascade County is 84,423.
What is the Total Male Population of Cascade County?
Total Male Population of Cascade County is 43,002.
What is the Total Female Population of Cascade County?
Total Female Population of Cascade County is 41,421.
What is the Ratio of Males per 100 Females in Cascade County?
There are 103.82 Males per 100 Females in Cascade County.
What is the Ratio of Females per 100 Males in Cascade County?
There are 96.32 Females per 100 Males in Cascade County.
What is the Median Population Age in Cascade County?
Median Population Age in Cascade County is 37.9 Years.
What is the Average Family Size in Cascade County
Average Family Size in Cascade County is 3.0 People.
What is the Average Household Size in Cascade County
Average Household Size in Cascade County is 2.4 People.
How Large is the Labor Force in Cascade County?
There are 42,464 People in the Labor Forcein in Cascade County.
What is the Percentage of People in the Labor Force in Cascade County?
62.8% of People are in the Labor Force in Cascade County.
What is the Unemployment Rate in Cascade County?
Unemployment Rate in Cascade County is 3.3%.