Lewis and Clark County, MT Map & Demographics
Lewis and Clark County Map
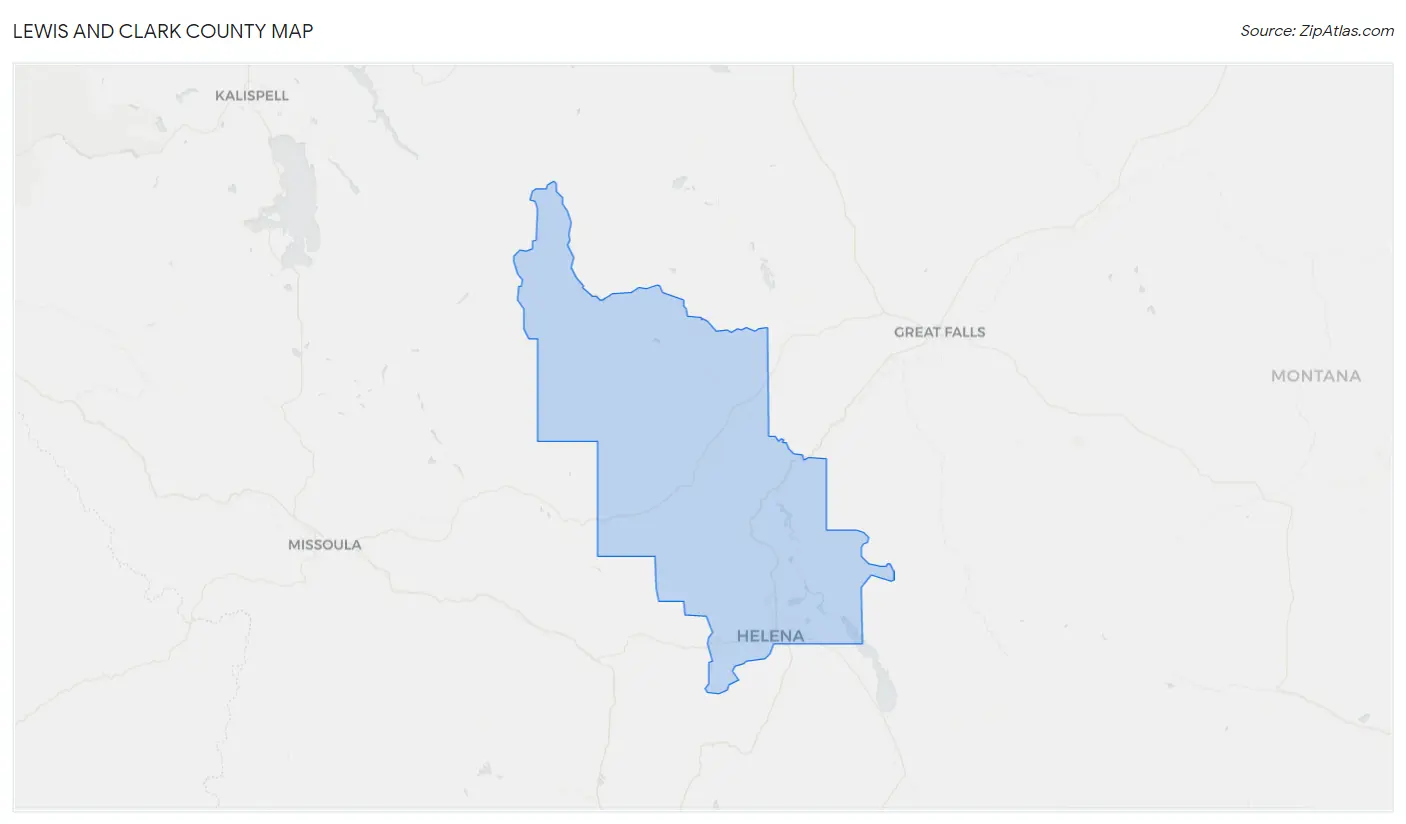
Lewis and Clark County Overview
$41,274
PER CAPITA INCOME
$97,500
AVG FAMILY INCOME
$71,967
AVG HOUSEHOLD INCOME
24.5%
WAGE / INCOME GAP [ % ]
75.5¢/ $1
WAGE / INCOME GAP [ $ ]
$10,146
FAMILY INCOME DEFICIT
0.44
INEQUALITY / GINI INDEX
71,487
TOTAL POPULATION
35,738
MALE POPULATION
35,749
FEMALE POPULATION
99.97
MALES / 100 FEMALES
100.03
FEMALES / 100 MALES
41.2
MEDIAN AGE
2.9
AVG FAMILY SIZE
2.3
AVG HOUSEHOLD SIZE
37,667
LABOR FORCE [ PEOPLE ]
65.1%
PERCENT IN LABOR FORCE
3.5%
UNEMPLOYMENT RATE
Lewis and Clark County Area Codes
Income in Lewis and Clark County
Income Overview in Lewis and Clark County
Per Capita Income in Lewis and Clark County is $41,274, while median incomes of families and households are $97,500 and $71,967 respectively.
| Characteristic | Number | Measure |
| Per Capita Income | 71,487 | $41,274 |
| Median Family Income | 18,102 | $97,500 |
| Mean Family Income | 18,102 | $117,704 |
| Median Household Income | 30,281 | $71,967 |
| Mean Household Income | 30,281 | $95,857 |
| Income Deficit | 18,102 | $10,146 |
| Wage / Income Gap (%) | 71,487 | 24.49% |
| Wage / Income Gap ($) | 71,487 | 75.51¢ per $1 |
| Gini / Inequality Index | 71,487 | 0.44 |
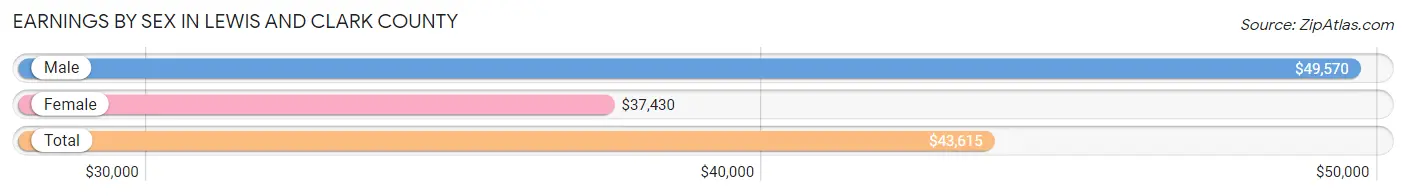
Earnings by Sex in Lewis and Clark County
Average Earnings in Lewis and Clark County are $43,615, $49,570 for men and $37,430 for women, a difference of 24.5%.
| Sex | Number | Average Earnings |
| Male | 20,671 (52.4%) | $49,570 |
| Female | 18,791 (47.6%) | $37,430 |
| Total | 39,462 (100.0%) | $43,615 |
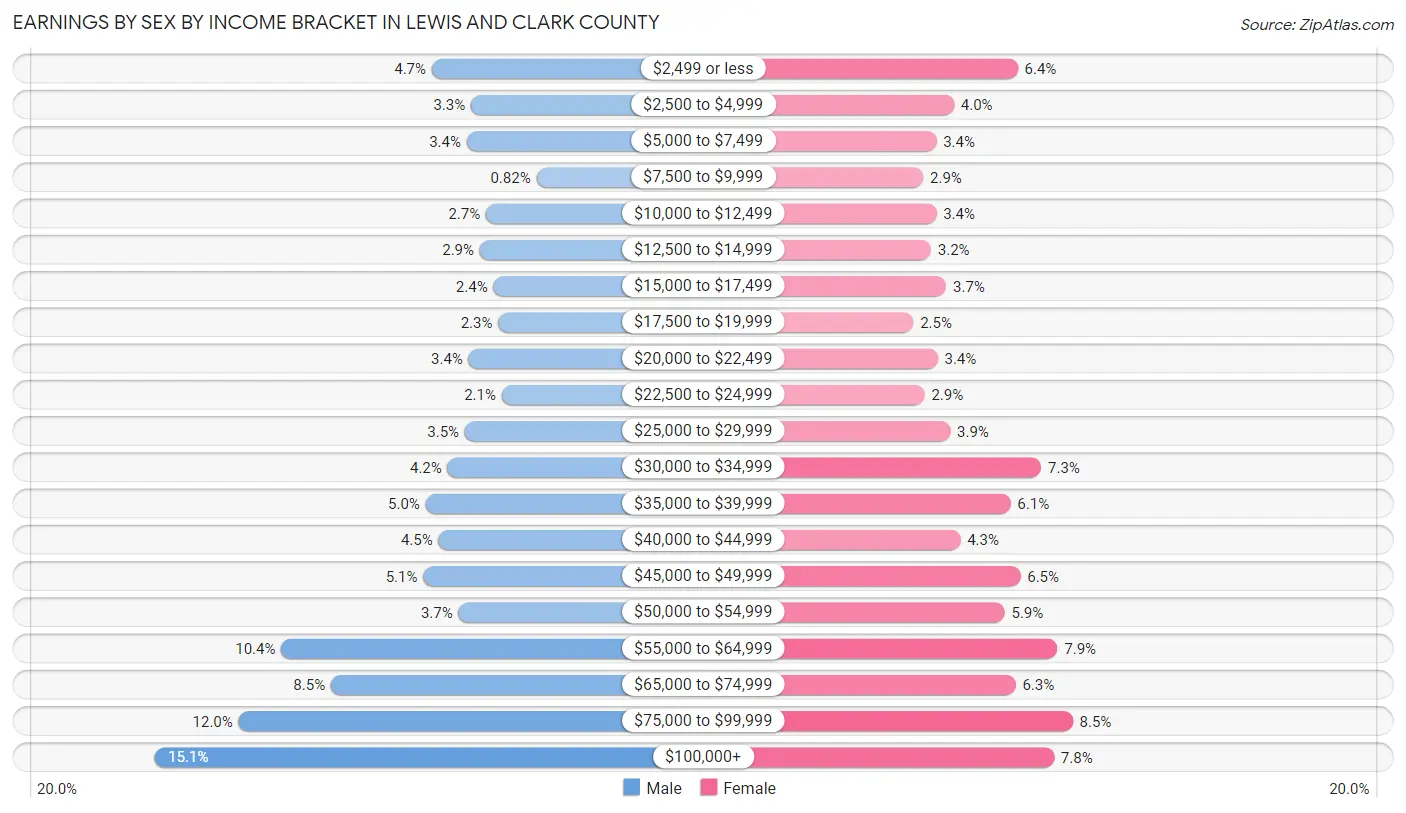
Earnings by Sex by Income Bracket in Lewis and Clark County
The most common earnings brackets in Lewis and Clark County are $100,000+ for men (3,124 | 15.1%) and $75,000 to $99,999 for women (1,589 | 8.5%).
| Income | Male | Female |
| $2,499 or less | 980 (4.7%) | 1,203 (6.4%) |
| $2,500 to $4,999 | 676 (3.3%) | 754 (4.0%) |
| $5,000 to $7,499 | 710 (3.4%) | 630 (3.4%) |
| $7,500 to $9,999 | 169 (0.8%) | 537 (2.9%) |
| $10,000 to $12,499 | 560 (2.7%) | 630 (3.4%) |
| $12,500 to $14,999 | 607 (2.9%) | 592 (3.2%) |
| $15,000 to $17,499 | 503 (2.4%) | 699 (3.7%) |
| $17,500 to $19,999 | 466 (2.2%) | 467 (2.5%) |
| $20,000 to $22,499 | 695 (3.4%) | 639 (3.4%) |
| $22,500 to $24,999 | 439 (2.1%) | 546 (2.9%) |
| $25,000 to $29,999 | 724 (3.5%) | 727 (3.9%) |
| $30,000 to $34,999 | 858 (4.2%) | 1,368 (7.3%) |
| $35,000 to $39,999 | 1,027 (5.0%) | 1,151 (6.1%) |
| $40,000 to $44,999 | 929 (4.5%) | 798 (4.3%) |
| $45,000 to $49,999 | 1,045 (5.1%) | 1,221 (6.5%) |
| $50,000 to $54,999 | 774 (3.7%) | 1,111 (5.9%) |
| $55,000 to $64,999 | 2,146 (10.4%) | 1,482 (7.9%) |
| $65,000 to $74,999 | 1,762 (8.5%) | 1,188 (6.3%) |
| $75,000 to $99,999 | 2,477 (12.0%) | 1,589 (8.5%) |
| $100,000+ | 3,124 (15.1%) | 1,459 (7.8%) |
| Total | 20,671 (100.0%) | 18,791 (100.0%) |
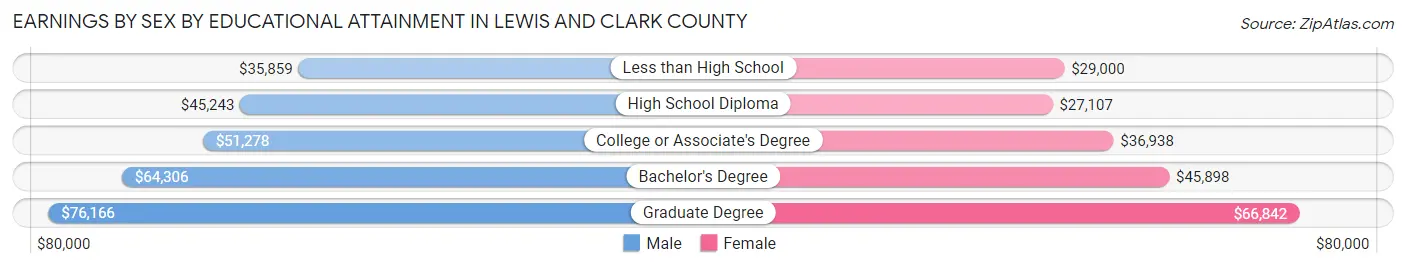
Earnings by Sex by Educational Attainment in Lewis and Clark County
Average earnings in Lewis and Clark County are $56,695 for men and $42,740 for women, a difference of 24.6%. Men with an educational attainment of graduate degree enjoy the highest average annual earnings of $76,166, while those with less than high school education earn the least with $35,859. Women with an educational attainment of graduate degree earn the most with the average annual earnings of $66,842, while those with high school diploma education have the smallest earnings of $27,107.
| Educational Attainment | Male Income | Female Income |
| Less than High School | $35,859 | $29,000 |
| High School Diploma | $45,243 | $27,107 |
| College or Associate's Degree | $51,278 | $36,938 |
| Bachelor's Degree | $64,306 | $45,898 |
| Graduate Degree | $76,166 | $66,842 |
| Total | $56,695 | $42,740 |
Family Income in Lewis and Clark County
Family Income Brackets in Lewis and Clark County
According to the Lewis and Clark County family income data, there are 4,634 families falling into the $100,000 to $149,999 income range, which is the most common income bracket and makes up 25.6% of all families. Conversely, the $10,000 to $14,999 income bracket is the least frequent group with only 199 families (1.1%) belonging to this category.
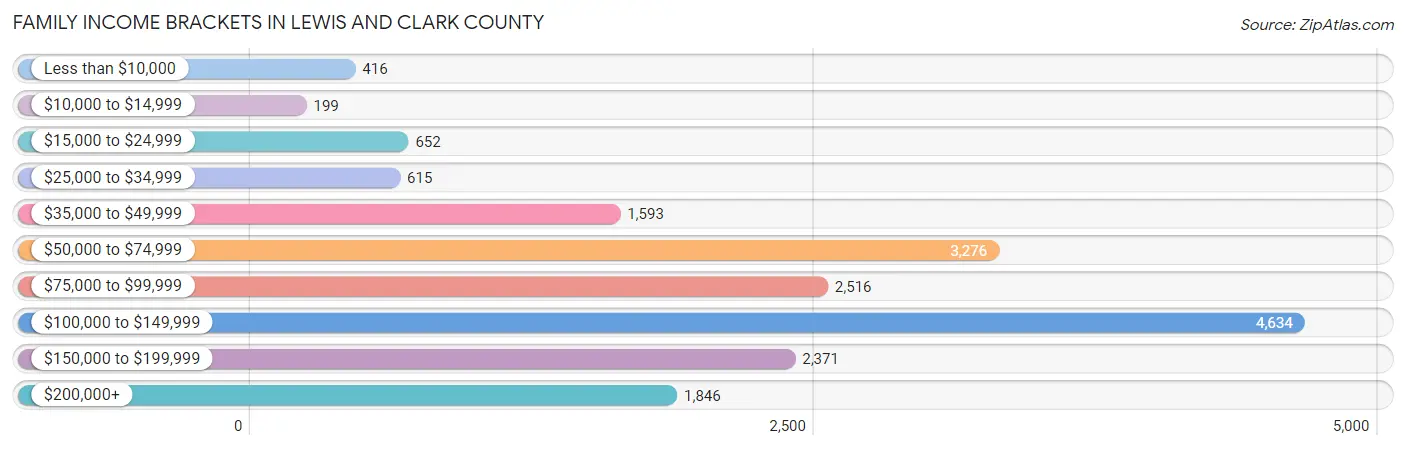
| Income Bracket | # Families | % Families |
| Less than $10,000 | 416 | 2.3% |
| $10,000 to $14,999 | 199 | 1.1% |
| $15,000 to $24,999 | 652 | 3.6% |
| $25,000 to $34,999 | 615 | 3.4% |
| $35,000 to $49,999 | 1,593 | 8.8% |
| $50,000 to $74,999 | 3,276 | 18.1% |
| $75,000 to $99,999 | 2,516 | 13.9% |
| $100,000 to $149,999 | 4,634 | 25.6% |
| $150,000 to $199,999 | 2,371 | 13.1% |
| $200,000+ | 1,846 | 10.2% |
Family Income by Famaliy Size in Lewis and Clark County
4-person families (2,942 | 16.3%) account for the highest median family income in Lewis and Clark County with $121,000 per family, while 2-person families (9,863 | 54.5%) have the highest median income of $42,410 per family member.
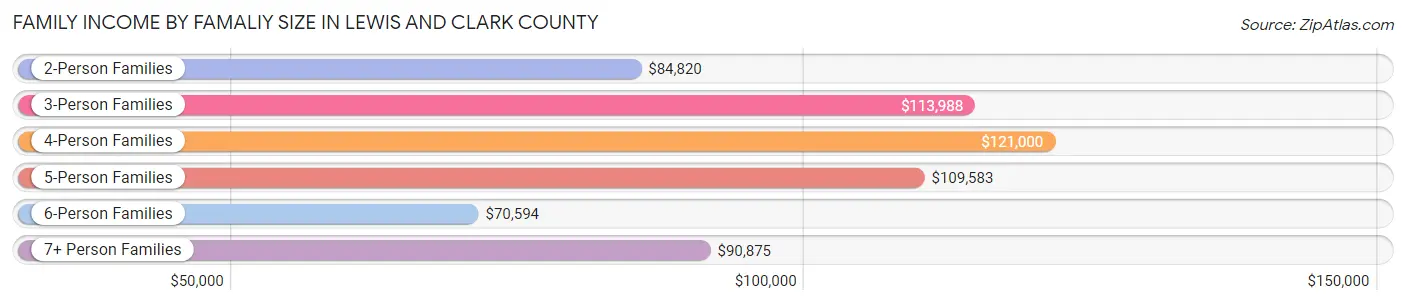
| Income Bracket | # Families | Median Income |
| 2-Person Families | 9,863 (54.5%) | $84,820 |
| 3-Person Families | 3,594 (19.9%) | $113,988 |
| 4-Person Families | 2,942 (16.3%) | $121,000 |
| 5-Person Families | 1,097 (6.1%) | $109,583 |
| 6-Person Families | 427 (2.4%) | $70,594 |
| 7+ Person Families | 179 (1.0%) | $90,875 |
| Total | 18,102 (100.0%) | $97,500 |
Family Income by Number of Earners in Lewis and Clark County
The median family income in Lewis and Clark County is $97,500, with families comprising 3+ earners (1,377) having the highest median family income of $140,911, while families with no earners (2,852) have the lowest median family income of $62,471, accounting for 7.6% and 15.8% of families, respectively.
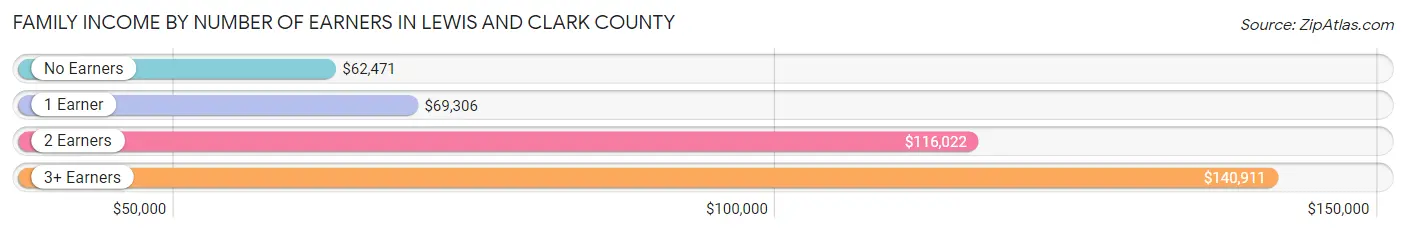
| Number of Earners | # Families | Median Income |
| No Earners | 2,852 (15.8%) | $62,471 |
| 1 Earner | 5,148 (28.4%) | $69,306 |
| 2 Earners | 8,725 (48.2%) | $116,022 |
| 3+ Earners | 1,377 (7.6%) | $140,911 |
| Total | 18,102 (100.0%) | $97,500 |
Household Income in Lewis and Clark County
Household Income Brackets in Lewis and Clark County
With 5,784 households falling in the category, the $50,000 to $74,999 income range is the most frequent in Lewis and Clark County, accounting for 19.1% of all households. In contrast, only 878 households (2.9%) fall into the $10,000 to $14,999 income bracket, making it the least populous group.
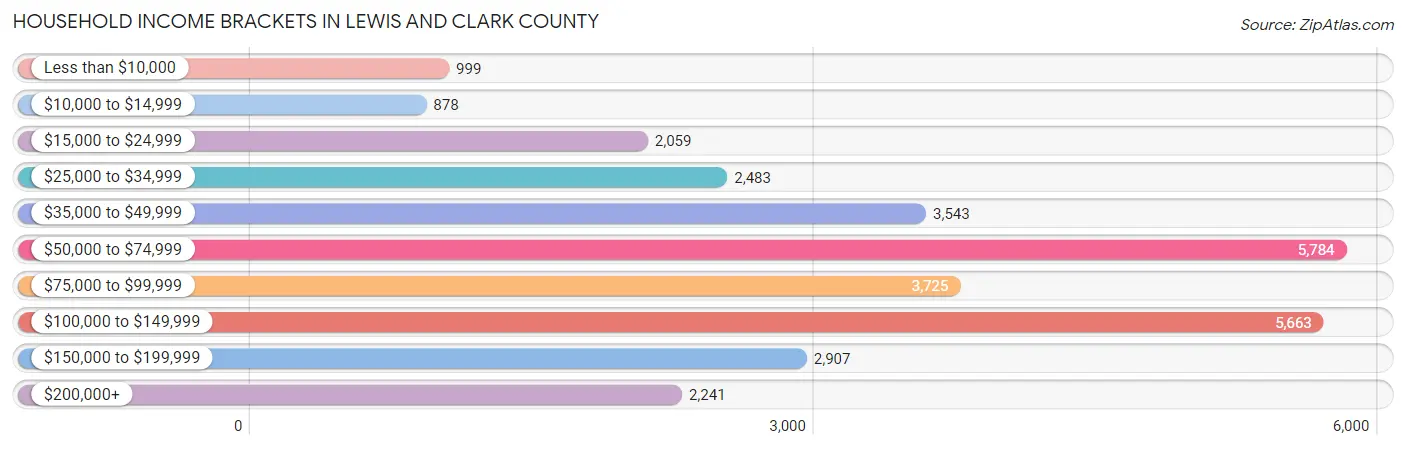
| Income Bracket | # Households | % Households |
| Less than $10,000 | 999 | 3.3% |
| $10,000 to $14,999 | 878 | 2.9% |
| $15,000 to $24,999 | 2,059 | 6.8% |
| $25,000 to $34,999 | 2,483 | 8.2% |
| $35,000 to $49,999 | 3,543 | 11.7% |
| $50,000 to $74,999 | 5,784 | 19.1% |
| $75,000 to $99,999 | 3,725 | 12.3% |
| $100,000 to $149,999 | 5,663 | 18.7% |
| $150,000 to $199,999 | 2,907 | 9.6% |
| $200,000+ | 2,241 | 7.4% |
Household Income by Householder Age in Lewis and Clark County
The median household income in Lewis and Clark County is $71,967, with the highest median household income of $87,715 found in the 45 to 64 years age bracket for the primary householder. A total of 11,252 households (37.2%) fall into this category. Meanwhile, the 15 to 24 years age bracket for the primary householder has the lowest median household income of $41,403, with 1,181 households (3.9%) in this group.
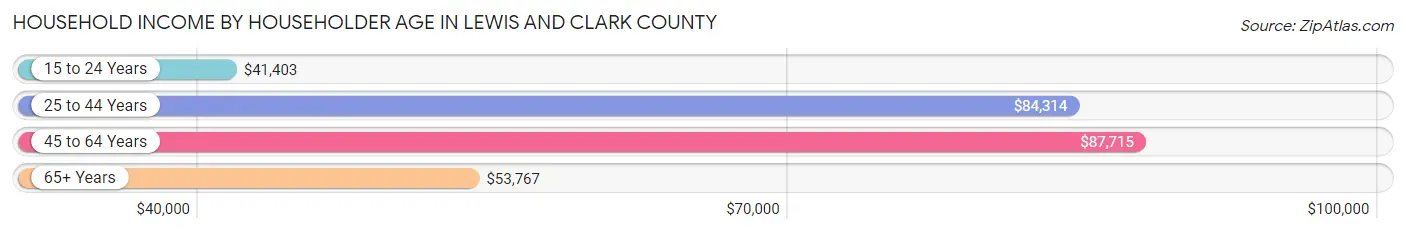
| Income Bracket | # Households | Median Income |
| 15 to 24 Years | 1,181 (3.9%) | $41,403 |
| 25 to 44 Years | 9,230 (30.5%) | $84,314 |
| 45 to 64 Years | 11,252 (37.2%) | $87,715 |
| 65+ Years | 8,618 (28.5%) | $53,767 |
| Total | 30,281 (100.0%) | $71,967 |
Poverty in Lewis and Clark County
Income Below Poverty by Sex and Age in Lewis and Clark County
With 8.9% poverty level for males and 9.9% for females among the residents of Lewis and Clark County, under 5 year old males and 15 year old females are the most vulnerable to poverty, with 384 males (18.6%) and 191 females (39.6%) in their respective age groups living below the poverty level.
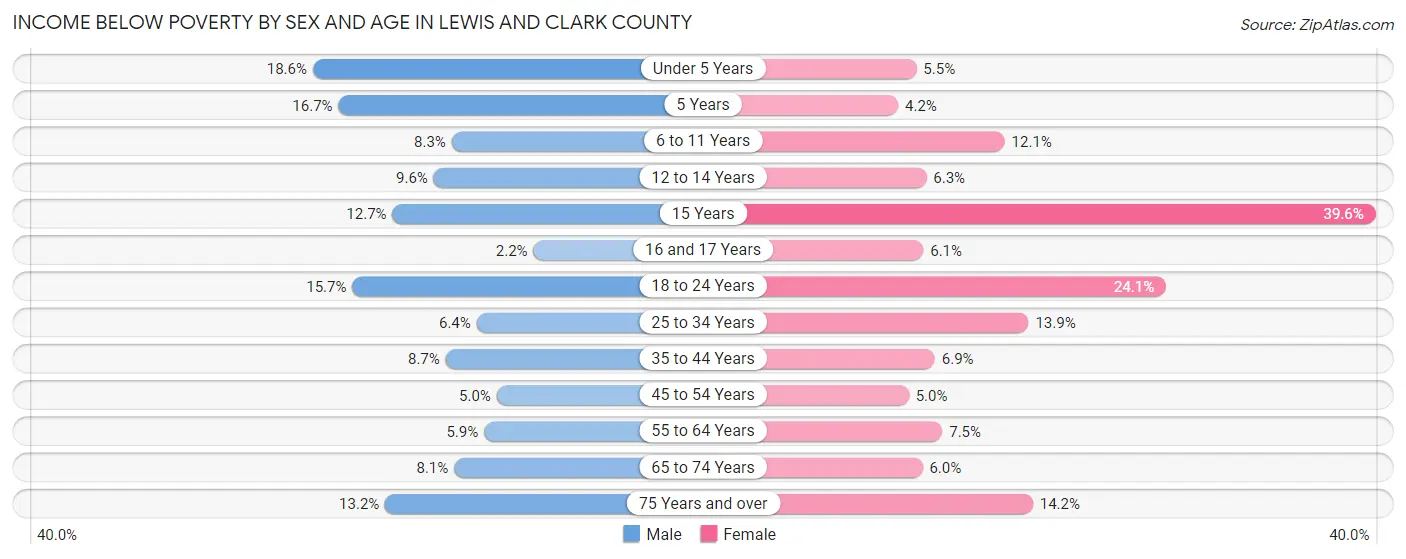
| Age Bracket | Male | Female |
| Under 5 Years | 384 (18.6%) | 100 (5.5%) |
| 5 Years | 74 (16.7%) | 14 (4.2%) |
| 6 to 11 Years | 210 (8.3%) | 300 (12.1%) |
| 12 to 14 Years | 131 (9.6%) | 93 (6.3%) |
| 15 Years | 58 (12.7%) | 191 (39.6%) |
| 16 and 17 Years | 20 (2.2%) | 42 (6.0%) |
| 18 to 24 Years | 396 (15.7%) | 558 (24.1%) |
| 25 to 34 Years | 275 (6.4%) | 585 (13.9%) |
| 35 to 44 Years | 423 (8.7%) | 306 (6.9%) |
| 45 to 54 Years | 206 (5.0%) | 213 (5.0%) |
| 55 to 64 Years | 294 (5.9%) | 400 (7.5%) |
| 65 to 74 Years | 351 (8.1%) | 262 (6.0%) |
| 75 Years and over | 294 (13.2%) | 388 (14.2%) |
| Total | 3,116 (8.9%) | 3,452 (9.9%) |
Income Above Poverty by Sex and Age in Lewis and Clark County
According to the poverty statistics in Lewis and Clark County, males aged 16 and 17 years and females aged 5 years are the age groups that are most secure financially, with 97.8% of males and 95.8% of females in these age groups living above the poverty line.
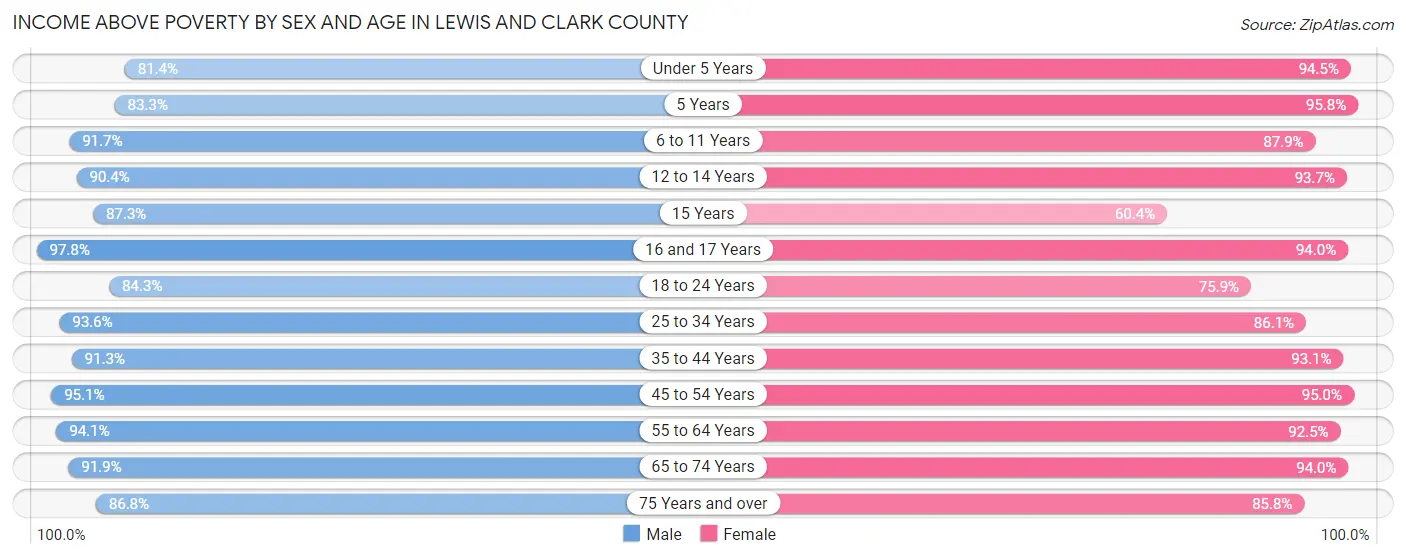
| Age Bracket | Male | Female |
| Under 5 Years | 1,680 (81.4%) | 1,706 (94.5%) |
| 5 Years | 369 (83.3%) | 321 (95.8%) |
| 6 to 11 Years | 2,322 (91.7%) | 2,181 (87.9%) |
| 12 to 14 Years | 1,230 (90.4%) | 1,387 (93.7%) |
| 15 Years | 399 (87.3%) | 291 (60.4%) |
| 16 and 17 Years | 879 (97.8%) | 652 (94.0%) |
| 18 to 24 Years | 2,131 (84.3%) | 1,760 (75.9%) |
| 25 to 34 Years | 3,996 (93.6%) | 3,637 (86.1%) |
| 35 to 44 Years | 4,419 (91.3%) | 4,120 (93.1%) |
| 45 to 54 Years | 3,956 (95.1%) | 4,069 (95.0%) |
| 55 to 64 Years | 4,697 (94.1%) | 4,959 (92.5%) |
| 65 to 74 Years | 3,977 (91.9%) | 4,115 (94.0%) |
| 75 Years and over | 1,928 (86.8%) | 2,349 (85.8%) |
| Total | 31,983 (91.1%) | 31,547 (90.1%) |
Income Below Poverty Among Married-Couple Families in Lewis and Clark County
The poverty statistics for married-couple families in Lewis and Clark County show that 2.6% or 373 of the total 14,445 families live below the poverty line. Families with 5 or more children have the highest poverty rate of 20.2%, comprising of 22 families. On the other hand, families with 1 or 2 children have the lowest poverty rate of 1.8%, which includes 74 families.
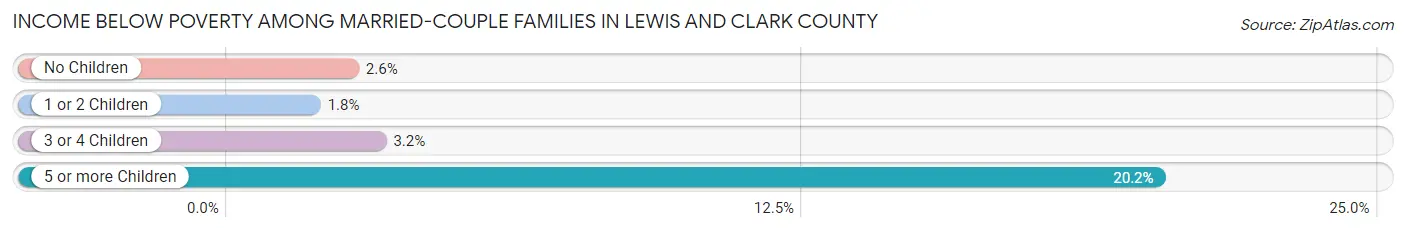
| Children | Above Poverty | Below Poverty |
| No Children | 8,698 (97.4%) | 235 (2.6%) |
| 1 or 2 Children | 4,028 (98.2%) | 74 (1.8%) |
| 3 or 4 Children | 1,259 (96.8%) | 42 (3.2%) |
| 5 or more Children | 87 (79.8%) | 22 (20.2%) |
| Total | 14,072 (97.4%) | 373 (2.6%) |
Income Below Poverty Among Single-Parent Households in Lewis and Clark County
According to the poverty data in Lewis and Clark County, 17.1% or 224 single-father households and 19.4% or 455 single-mother households are living below the poverty line. Among single-father households, those with 1 or 2 children have the highest poverty rate, with 209 households (29.1%) experiencing poverty. Likewise, among single-mother households, those with 3 or 4 children have the highest poverty rate, with 136 households (36.1%) falling below the poverty line.
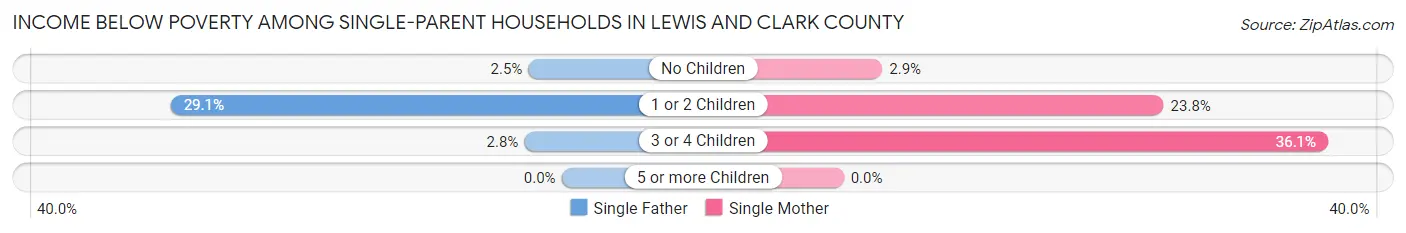
| Children | Single Father | Single Mother |
| No Children | 13 (2.5%) | 20 (2.9%) |
| 1 or 2 Children | 209 (29.1%) | 299 (23.8%) |
| 3 or 4 Children | 2 (2.8%) | 136 (36.1%) |
| 5 or more Children | 0 (0.0%) | 0 (0.0%) |
| Total | 224 (17.1%) | 455 (19.4%) |
Income Below Poverty Among Married-Couple vs Single-Parent Households in Lewis and Clark County
The poverty data for Lewis and Clark County shows that 373 of the married-couple family households (2.6%) and 679 of the single-parent households (18.6%) are living below the poverty level. Within the married-couple family households, those with 5 or more children have the highest poverty rate, with 22 households (20.2%) falling below the poverty line. Among the single-parent households, those with 3 or 4 children have the highest poverty rate, with 138 household (30.7%) living below poverty.
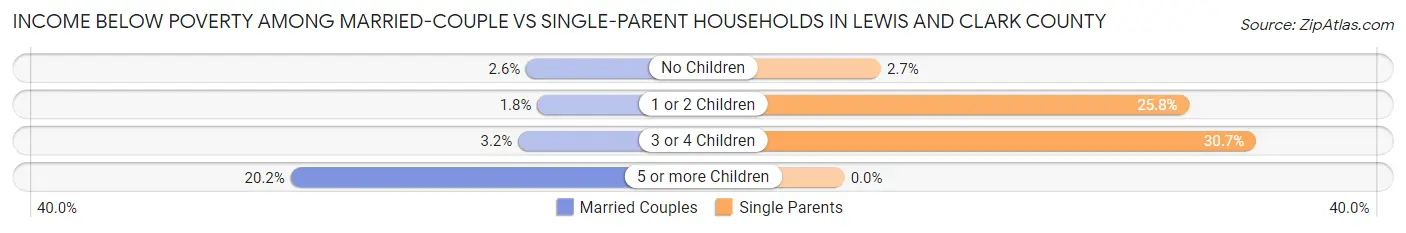
| Children | Married-Couple Families | Single-Parent Households |
| No Children | 235 (2.6%) | 33 (2.7%) |
| 1 or 2 Children | 74 (1.8%) | 508 (25.8%) |
| 3 or 4 Children | 42 (3.2%) | 138 (30.7%) |
| 5 or more Children | 22 (20.2%) | 0 (0.0%) |
| Total | 373 (2.6%) | 679 (18.6%) |
Race in Lewis and Clark County
The most populous races in Lewis and Clark County are White / Caucasian (65,856 | 92.1%), Two or more Races (3,388 | 4.7%), and Hispanic or Latino (2,638 | 3.7%).
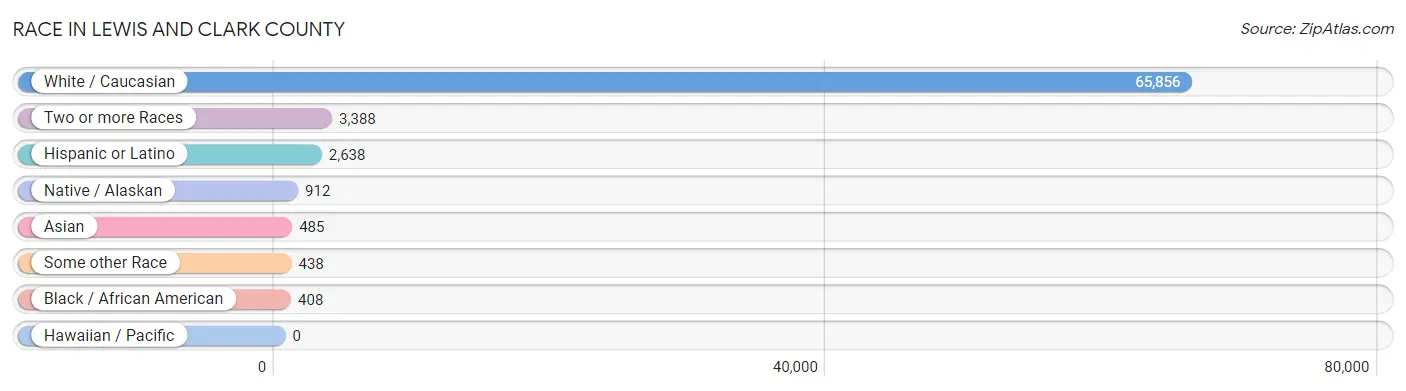
| Race | # Population | % Population |
| Asian | 485 | 0.7% |
| Black / African American | 408 | 0.6% |
| Hawaiian / Pacific | 0 | 0.0% |
| Hispanic or Latino | 2,638 | 3.7% |
| Native / Alaskan | 912 | 1.3% |
| White / Caucasian | 65,856 | 92.1% |
| Two or more Races | 3,388 | 4.7% |
| Some other Race | 438 | 0.6% |
| Total | 71,487 | 100.0% |
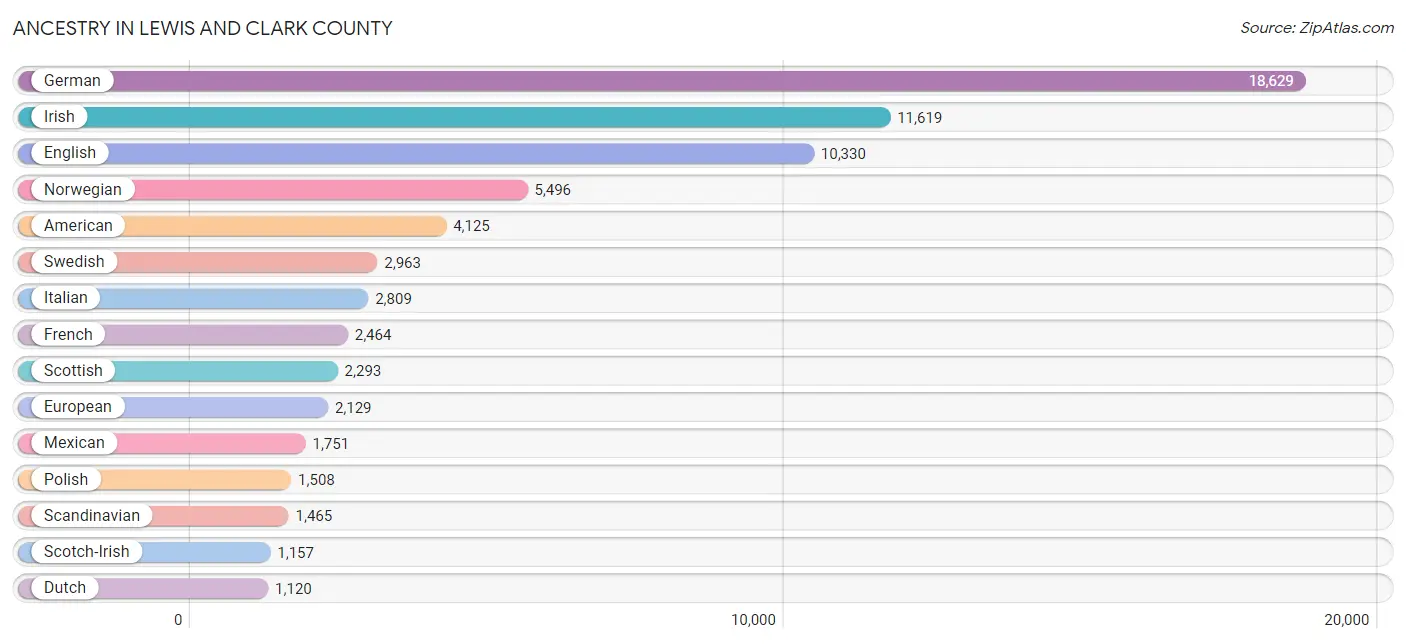
Ancestry in Lewis and Clark County
The most populous ancestries reported in Lewis and Clark County are German (18,629 | 26.1%), Irish (11,619 | 16.3%), English (10,330 | 14.4%), Norwegian (5,496 | 7.7%), and American (4,125 | 5.8%), together accounting for 70.2% of all Lewis and Clark County residents.
| Ancestry | # Population | % Population |
| African | 7 | 0.0% |
| Alaskan Athabascan | 2 | 0.0% |
| Aleut | 75 | 0.1% |
| American | 4,125 | 5.8% |
| Apache | 13 | 0.0% |
| Arab | 113 | 0.2% |
| Armenian | 66 | 0.1% |
| Australian | 3 | 0.0% |
| Austrian | 398 | 0.6% |
| Basque | 113 | 0.2% |
| Belgian | 143 | 0.2% |
| Bhutanese | 193 | 0.3% |
| Blackfeet | 335 | 0.5% |
| Brazilian | 43 | 0.1% |
| British | 670 | 0.9% |
| Bulgarian | 14 | 0.0% |
| Burmese | 175 | 0.2% |
| Canadian | 93 | 0.1% |
| Celtic | 34 | 0.1% |
| Central American | 26 | 0.0% |
| Central American Indian | 28 | 0.0% |
| Cherokee | 305 | 0.4% |
| Cheyenne | 160 | 0.2% |
| Chippewa | 269 | 0.4% |
| Choctaw | 12 | 0.0% |
| Colombian | 91 | 0.1% |
| Cree | 106 | 0.2% |
| Creek | 54 | 0.1% |
| Croatian | 312 | 0.4% |
| Crow | 11 | 0.0% |
| Cuban | 98 | 0.1% |
| Czech | 291 | 0.4% |
| Czechoslovakian | 162 | 0.2% |
| Danish | 445 | 0.6% |
| Dominican | 9 | 0.0% |
| Dutch | 1,120 | 1.6% |
| Dutch West Indian | 11 | 0.0% |
| Eastern European | 304 | 0.4% |
| Ecuadorian | 13 | 0.0% |
| English | 10,330 | 14.4% |
| Estonian | 10 | 0.0% |
| Ethiopian | 7 | 0.0% |
| European | 2,129 | 3.0% |
| Filipino | 20 | 0.0% |
| Finnish | 513 | 0.7% |
| French | 2,464 | 3.5% |
| French Canadian | 407 | 0.6% |
| German | 18,629 | 26.1% |
| Greek | 97 | 0.1% |
| Guatemalan | 26 | 0.0% |
| Hungarian | 243 | 0.3% |
| Icelander | 27 | 0.0% |
| Indian (Asian) | 49 | 0.1% |
| Indonesian | 7 | 0.0% |
| Inupiat | 8 | 0.0% |
| Iranian | 22 | 0.0% |
| Irish | 11,619 | 16.3% |
| Iroquois | 5 | 0.0% |
| Italian | 2,809 | 3.9% |
| Jamaican | 31 | 0.0% |
| Japanese | 1 | 0.0% |
| Korean | 147 | 0.2% |
| Laotian | 30 | 0.0% |
| Latvian | 12 | 0.0% |
| Lebanese | 82 | 0.1% |
| Lithuanian | 153 | 0.2% |
| Luxembourger | 105 | 0.2% |
| Macedonian | 11 | 0.0% |
| Mexican | 1,751 | 2.5% |
| Mexican American Indian | 6 | 0.0% |
| Native Hawaiian | 57 | 0.1% |
| Navajo | 66 | 0.1% |
| Northern European | 508 | 0.7% |
| Norwegian | 5,496 | 7.7% |
| Pakistani | 69 | 0.1% |
| Pennsylvania German | 91 | 0.1% |
| Peruvian | 2 | 0.0% |
| Polish | 1,508 | 2.1% |
| Portuguese | 110 | 0.2% |
| Potawatomi | 30 | 0.0% |
| Puerto Rican | 202 | 0.3% |
| Puget Sound Salish | 10 | 0.0% |
| Romanian | 396 | 0.5% |
| Russian | 615 | 0.9% |
| Scandinavian | 1,465 | 2.1% |
| Scotch-Irish | 1,157 | 1.6% |
| Scottish | 2,293 | 3.2% |
| Seminole | 6 | 0.0% |
| Serbian | 12 | 0.0% |
| Shoshone | 24 | 0.0% |
| Sioux | 192 | 0.3% |
| Slavic | 112 | 0.2% |
| Slovak | 89 | 0.1% |
| Slovene | 89 | 0.1% |
| South American | 106 | 0.2% |
| Spaniard | 91 | 0.1% |
| Spanish | 277 | 0.4% |
| Spanish American | 24 | 0.0% |
| Subsaharan African | 14 | 0.0% |
| Swedish | 2,963 | 4.1% |
| Swiss | 352 | 0.5% |
| Thai | 178 | 0.3% |
| Tlingit-Haida | 94 | 0.1% |
| Trinidadian and Tobagonian | 16 | 0.0% |
| Ukrainian | 278 | 0.4% |
| Welsh | 758 | 1.1% |
| West Indian | 79 | 0.1% |
| Yugoslavian | 35 | 0.1% | View All 108 Rows |
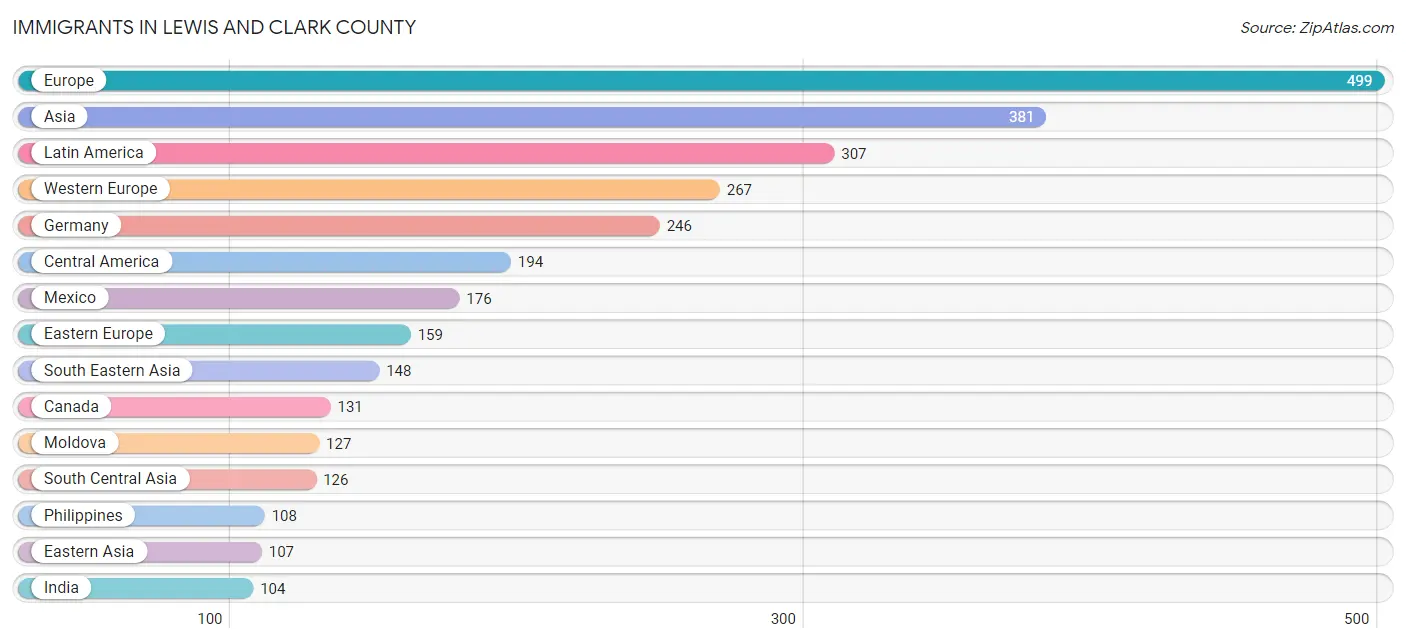
Immigrants in Lewis and Clark County
The most numerous immigrant groups reported in Lewis and Clark County came from Europe (499 | 0.7%), Asia (381 | 0.5%), Latin America (307 | 0.4%), Western Europe (267 | 0.4%), and Germany (246 | 0.3%), together accounting for 2.4% of all Lewis and Clark County residents.
| Immigration Origin | # Population | % Population |
| Asia | 381 | 0.5% |
| Australia | 9 | 0.0% |
| Brazil | 40 | 0.1% |
| Cambodia | 1 | 0.0% |
| Canada | 131 | 0.2% |
| Caribbean | 52 | 0.1% |
| Central America | 194 | 0.3% |
| China | 10 | 0.0% |
| Colombia | 9 | 0.0% |
| Dominican Republic | 9 | 0.0% |
| Eastern Asia | 107 | 0.2% |
| Eastern Europe | 159 | 0.2% |
| England | 25 | 0.0% |
| Europe | 499 | 0.7% |
| France | 9 | 0.0% |
| Germany | 246 | 0.3% |
| Guatemala | 18 | 0.0% |
| India | 104 | 0.2% |
| Iran | 22 | 0.0% |
| Italy | 9 | 0.0% |
| Jamaica | 31 | 0.0% |
| Japan | 13 | 0.0% |
| Korea | 84 | 0.1% |
| Latin America | 307 | 0.4% |
| Mexico | 176 | 0.3% |
| Moldova | 127 | 0.2% |
| Netherlands | 12 | 0.0% |
| Northern Europe | 41 | 0.1% |
| Oceania | 9 | 0.0% |
| Peru | 12 | 0.0% |
| Philippines | 108 | 0.2% |
| Portugal | 8 | 0.0% |
| Romania | 20 | 0.0% |
| Russia | 12 | 0.0% |
| South America | 61 | 0.1% |
| South Central Asia | 126 | 0.2% |
| South Eastern Asia | 148 | 0.2% |
| Southern Europe | 32 | 0.0% |
| Spain | 15 | 0.0% |
| Sweden | 10 | 0.0% |
| Taiwan | 10 | 0.0% |
| Thailand | 25 | 0.0% |
| Trinidad and Tobago | 12 | 0.0% |
| Vietnam | 14 | 0.0% |
| Western Europe | 267 | 0.4% | View All 45 Rows |
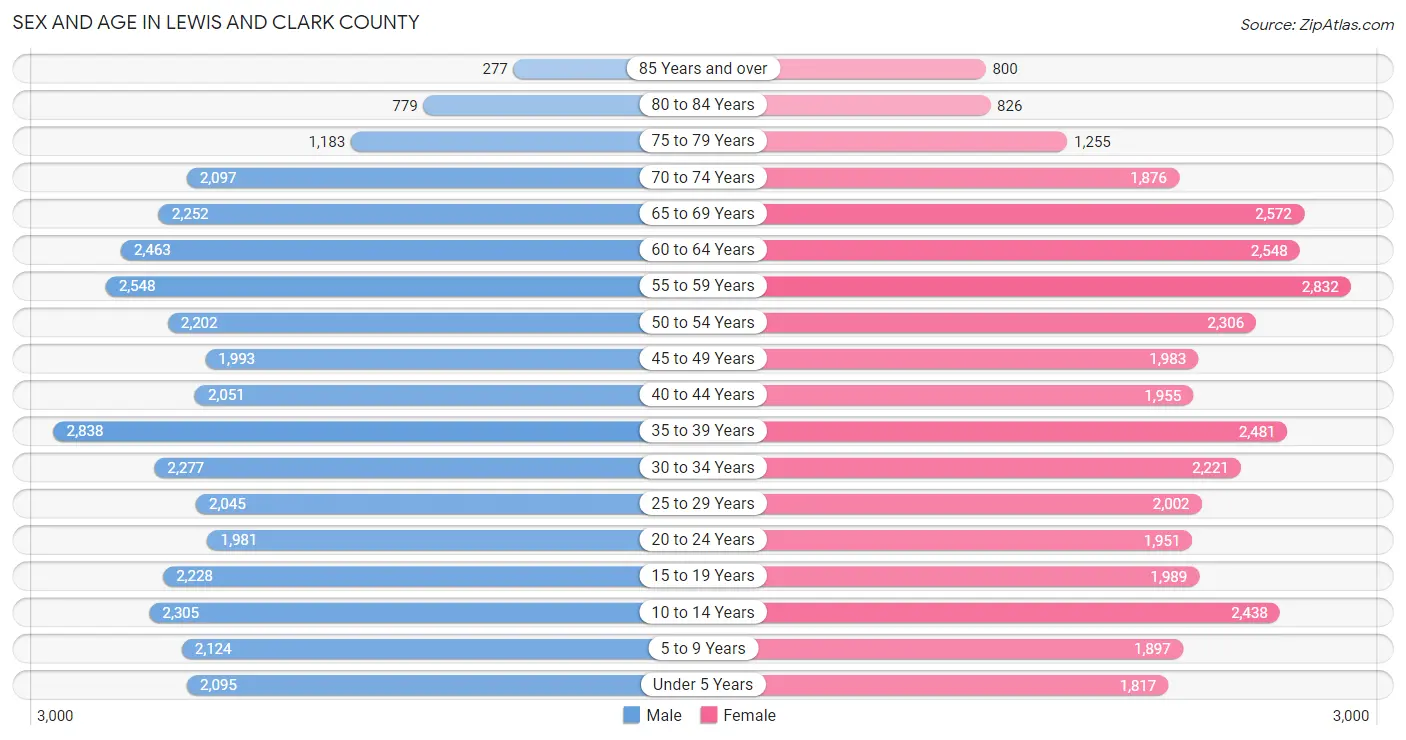
Sex and Age in Lewis and Clark County
Sex and Age in Lewis and Clark County
The most populous age groups in Lewis and Clark County are 35 to 39 Years (2,838 | 7.9%) for men and 55 to 59 Years (2,832 | 7.9%) for women.
| Age Bracket | Male | Female |
| Under 5 Years | 2,095 (5.9%) | 1,817 (5.1%) |
| 5 to 9 Years | 2,124 (5.9%) | 1,897 (5.3%) |
| 10 to 14 Years | 2,305 (6.5%) | 2,438 (6.8%) |
| 15 to 19 Years | 2,228 (6.2%) | 1,989 (5.6%) |
| 20 to 24 Years | 1,981 (5.5%) | 1,951 (5.5%) |
| 25 to 29 Years | 2,045 (5.7%) | 2,002 (5.6%) |
| 30 to 34 Years | 2,277 (6.4%) | 2,221 (6.2%) |
| 35 to 39 Years | 2,838 (7.9%) | 2,481 (6.9%) |
| 40 to 44 Years | 2,051 (5.7%) | 1,955 (5.5%) |
| 45 to 49 Years | 1,993 (5.6%) | 1,983 (5.6%) |
| 50 to 54 Years | 2,202 (6.2%) | 2,306 (6.5%) |
| 55 to 59 Years | 2,548 (7.1%) | 2,832 (7.9%) |
| 60 to 64 Years | 2,463 (6.9%) | 2,548 (7.1%) |
| 65 to 69 Years | 2,252 (6.3%) | 2,572 (7.2%) |
| 70 to 74 Years | 2,097 (5.9%) | 1,876 (5.2%) |
| 75 to 79 Years | 1,183 (3.3%) | 1,255 (3.5%) |
| 80 to 84 Years | 779 (2.2%) | 826 (2.3%) |
| 85 Years and over | 277 (0.8%) | 800 (2.2%) |
| Total | 35,738 (100.0%) | 35,749 (100.0%) |
Families and Households in Lewis and Clark County
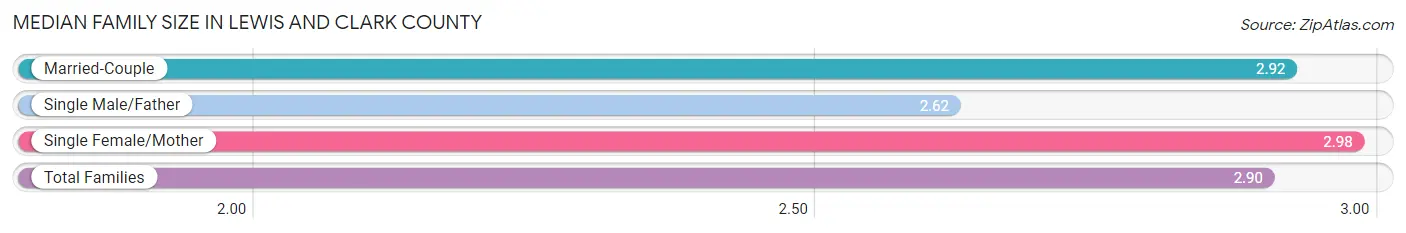
Median Family Size in Lewis and Clark County
The median family size in Lewis and Clark County is 2.90 persons per family, with single female/mother families (2,343 | 12.9%) accounting for the largest median family size of 2.98 persons per family. On the other hand, single male/father families (1,314 | 7.3%) represent the smallest median family size with 2.62 persons per family.
| Family Type | # Families | Family Size |
| Married-Couple | 14,445 (79.8%) | 2.92 |
| Single Male/Father | 1,314 (7.3%) | 2.62 |
| Single Female/Mother | 2,343 (12.9%) | 2.98 |
| Total Families | 18,102 (100.0%) | 2.90 |
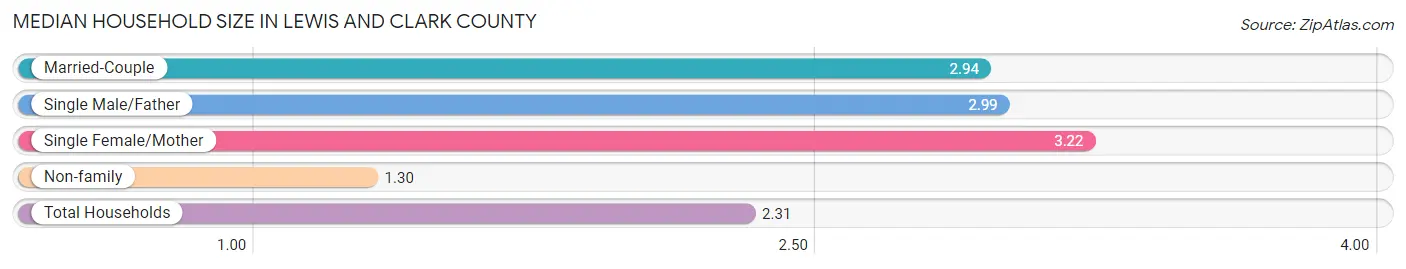
Median Household Size in Lewis and Clark County
The median household size in Lewis and Clark County is 2.31 persons per household, with single female/mother households (2,343 | 7.7%) accounting for the largest median household size of 3.22 persons per household. non-family households (12,179 | 40.2%) represent the smallest median household size with 1.30 persons per household.
| Household Type | # Households | Household Size |
| Married-Couple | 14,445 (47.7%) | 2.94 |
| Single Male/Father | 1,314 (4.3%) | 2.99 |
| Single Female/Mother | 2,343 (7.7%) | 3.22 |
| Non-family | 12,179 (40.2%) | 1.30 |
| Total Households | 30,281 (100.0%) | 2.31 |
Household Size by Marriage Status in Lewis and Clark County
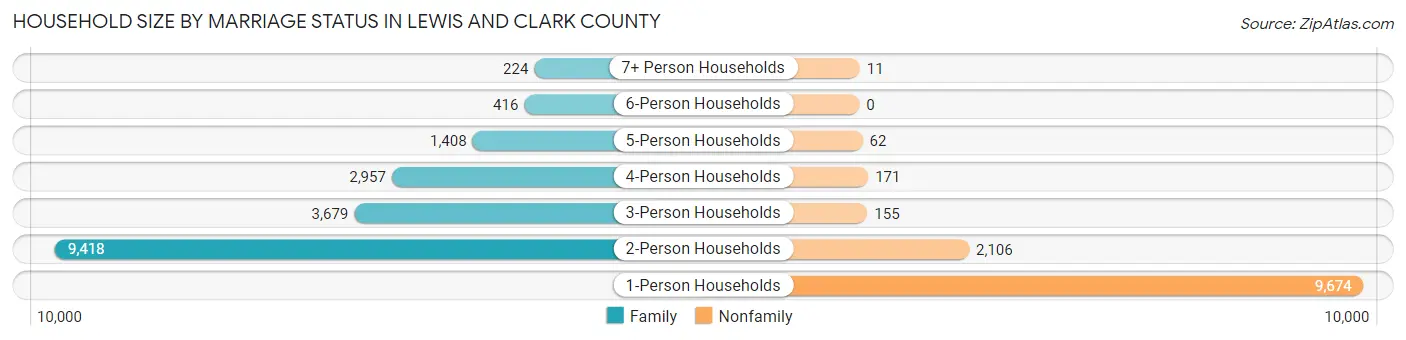
Out of a total of 30,281 households in Lewis and Clark County, 18,102 (59.8%) are family households, while 12,179 (40.2%) are nonfamily households. The most numerous type of family households are 2-person households, comprising 9,418, and the most common type of nonfamily households are 1-person households, comprising 9,674.
| Household Size | Family Households | Nonfamily Households |
| 1-Person Households | - | 9,674 (32.0%) |
| 2-Person Households | 9,418 (31.1%) | 2,106 (7.0%) |
| 3-Person Households | 3,679 (12.1%) | 155 (0.5%) |
| 4-Person Households | 2,957 (9.8%) | 171 (0.6%) |
| 5-Person Households | 1,408 (4.6%) | 62 (0.2%) |
| 6-Person Households | 416 (1.4%) | 0 (0.0%) |
| 7+ Person Households | 224 (0.7%) | 11 (0.0%) |
| Total | 18,102 (59.8%) | 12,179 (40.2%) |
Female Fertility in Lewis and Clark County
Fertility by Age in Lewis and Clark County
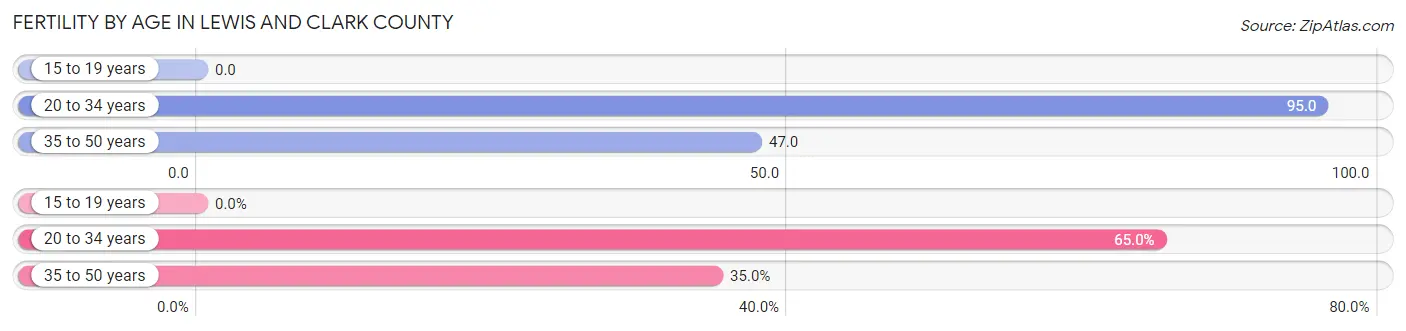
Average fertility rate in Lewis and Clark County is 61.0 births per 1,000 women. Women in the age bracket of 20 to 34 years have the highest fertility rate with 95.0 births per 1,000 women. Women in the age bracket of 20 to 34 years acount for 65.0% of all women with births.
| Age Bracket | Women with Births | Births / 1,000 Women |
| 15 to 19 years | 0 (0.0%) | 0.0 |
| 20 to 34 years | 588 (65.0%) | 95.0 |
| 35 to 50 years | 316 (35.0%) | 47.0 |
| Total | 904 (100.0%) | 61.0 |
Fertility by Age by Marriage Status in Lewis and Clark County
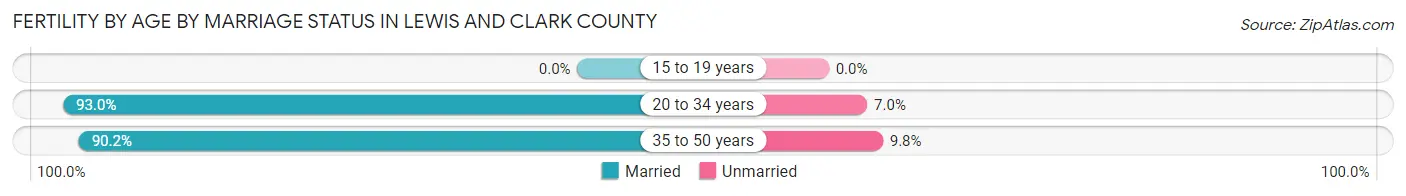
92.0% of women with births (904) in Lewis and Clark County are married. The highest percentage of unmarried women with births falls into 35 to 50 years age bracket with 9.8% of them unmarried at the time of birth, while the lowest percentage of unmarried women with births belong to 20 to 34 years age bracket with 7.0% of them unmarried.
| Age Bracket | Married | Unmarried |
| 15 to 19 years | 0 (0.0%) | 0 (0.0%) |
| 20 to 34 years | 547 (93.0%) | 41 (7.0%) |
| 35 to 50 years | 285 (90.2%) | 31 (9.8%) |
| Total | 832 (92.0%) | 72 (8.0%) |
Fertility by Education in Lewis and Clark County
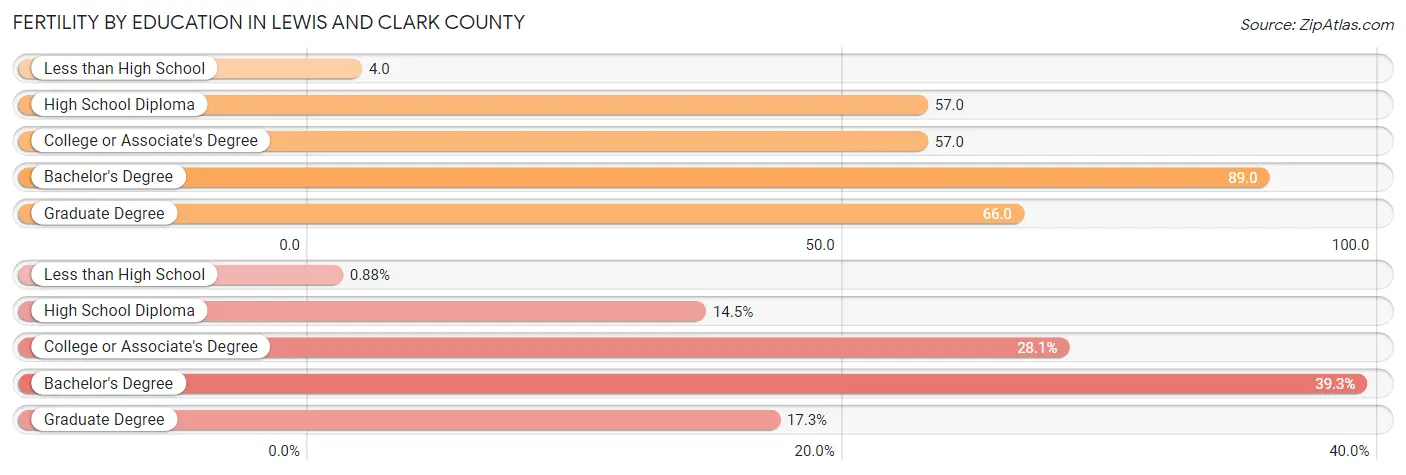
Average fertility rate in Lewis and Clark County is 61.0 births per 1,000 women. Women with the education attainment of bachelor's degree have the highest fertility rate of 89.0 births per 1,000 women, while women with the education attainment of less than high school have the lowest fertility at 4.0 births per 1,000 women. Women with the education attainment of bachelor's degree represent 39.3% of all women with births.
| Educational Attainment | Women with Births | Births / 1,000 Women |
| Less than High School | 8 (0.9%) | 4.0 |
| High School Diploma | 131 (14.5%) | 57.0 |
| College or Associate's Degree | 254 (28.1%) | 57.0 |
| Bachelor's Degree | 355 (39.3%) | 89.0 |
| Graduate Degree | 156 (17.3%) | 66.0 |
| Total | 904 (100.0%) | 61.0 |
Fertility by Education by Marriage Status in Lewis and Clark County
8.0% of women with births in Lewis and Clark County are unmarried. Women with the educational attainment of high school diploma are most likely to be married with 100.0% of them married at childbirth, while women with the educational attainment of less than high school are least likely to be married with 100.0% of them unmarried at childbirth.
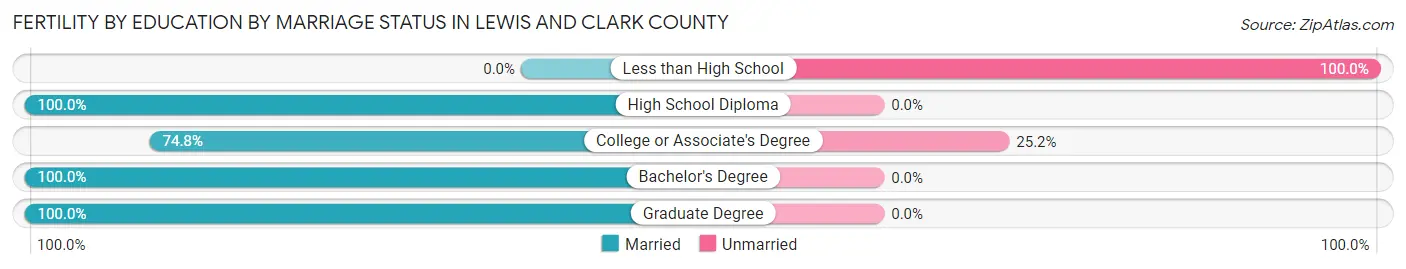
| Educational Attainment | Married | Unmarried |
| Less than High School | 0 (0.0%) | 8 (100.0%) |
| High School Diploma | 131 (100.0%) | 0 (0.0%) |
| College or Associate's Degree | 190 (74.8%) | 64 (25.2%) |
| Bachelor's Degree | 355 (100.0%) | 0 (0.0%) |
| Graduate Degree | 156 (100.0%) | 0 (0.0%) |
| Total | 832 (92.0%) | 72 (8.0%) |
Employment Characteristics in Lewis and Clark County
Employment by Class of Employer in Lewis and Clark County
Among the 35,944 employed individuals in Lewis and Clark County, private company employees (17,082 | 47.5%), state government employees (5,690 | 15.8%), and not-for-profit organizations (4,624 | 12.9%) make up the most common classes of employment.
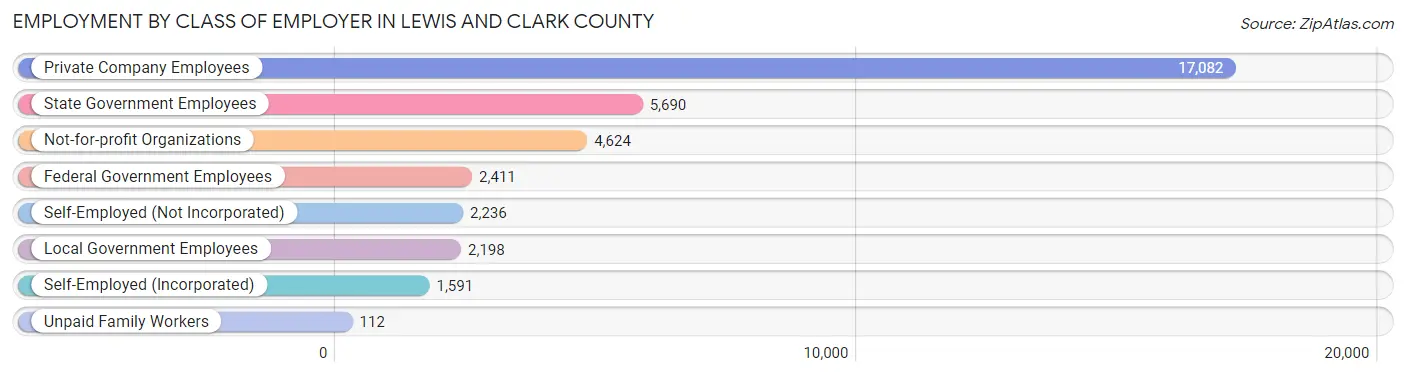
| Employer Class | # Employees | % Employees |
| Private Company Employees | 17,082 | 47.5% |
| Self-Employed (Incorporated) | 1,591 | 4.4% |
| Self-Employed (Not Incorporated) | 2,236 | 6.2% |
| Not-for-profit Organizations | 4,624 | 12.9% |
| Local Government Employees | 2,198 | 6.1% |
| State Government Employees | 5,690 | 15.8% |
| Federal Government Employees | 2,411 | 6.7% |
| Unpaid Family Workers | 112 | 0.3% |
| Total | 35,944 | 100.0% |
Employment Status by Age in Lewis and Clark County
According to the labor force statistics for Lewis and Clark County, out of the total population over 16 years of age (57,860), 65.1% or 37,667 individuals are in the labor force, with 3.5% or 1,318 of them unemployed. The age group with the highest labor force participation rate is 25 to 29 years, with 90.6% or 3,667 individuals in the labor force. Within the labor force, the 16 to 19 years age range has the highest percentage of unemployed individuals, with 19.0% or 299 of them being unemployed.
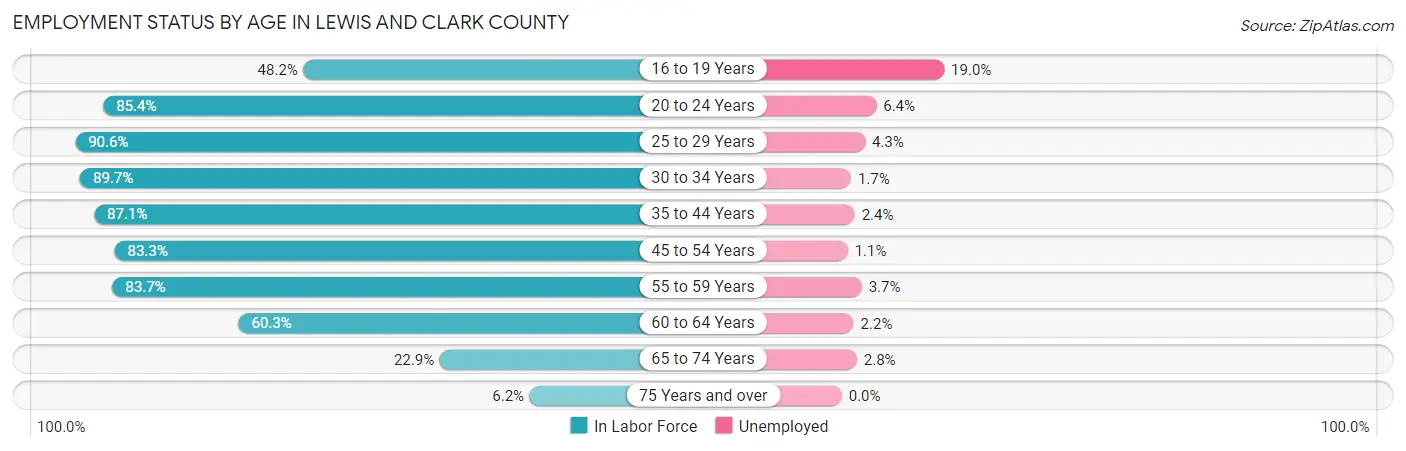
| Age Bracket | In Labor Force | Unemployed |
| 16 to 19 Years | 1,574 (48.2%) | 299 (19.0%) |
| 20 to 24 Years | 3,358 (85.4%) | 215 (6.4%) |
| 25 to 29 Years | 3,667 (90.6%) | 158 (4.3%) |
| 30 to 34 Years | 4,035 (89.7%) | 69 (1.7%) |
| 35 to 44 Years | 8,122 (87.1%) | 195 (2.4%) |
| 45 to 54 Years | 7,067 (83.3%) | 78 (1.1%) |
| 55 to 59 Years | 4,503 (83.7%) | 167 (3.7%) |
| 60 to 64 Years | 3,022 (60.3%) | 66 (2.2%) |
| 65 to 74 Years | 2,015 (22.9%) | 56 (2.8%) |
| 75 Years and over | 317 (6.2%) | 0 (0.0%) |
| Total | 37,667 (65.1%) | 1,318 (3.5%) |
Employment Status by Educational Attainment in Lewis and Clark County
According to labor force statistics for Lewis and Clark County, 82.8% of individuals (30,425) out of the total population between 25 and 64 years of age (36,745) are in the labor force, with 2.4% or 730 of them being unemployed. The group with the highest labor force participation rate are those with the educational attainment of bachelor's degree or higher, with 88.0% or 14,560 individuals in the labor force. Within the labor force, individuals with less than high school education have the highest percentage of unemployment, with 10.6% or 110 of them being unemployed.
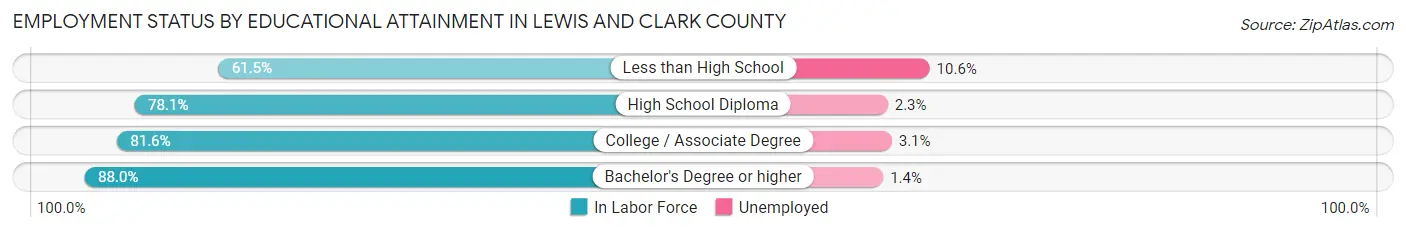
| Educational Attainment | In Labor Force | Unemployed |
| Less than High School | 1,042 (61.5%) | 180 (10.6%) |
| High School Diploma | 6,177 (78.1%) | 182 (2.3%) |
| College / Associate Degree | 8,646 (81.6%) | 328 (3.1%) |
| Bachelor's Degree or higher | 14,560 (88.0%) | 232 (1.4%) |
| Total | 30,425 (82.8%) | 882 (2.4%) |
Employment Occupations by Sex in Lewis and Clark County
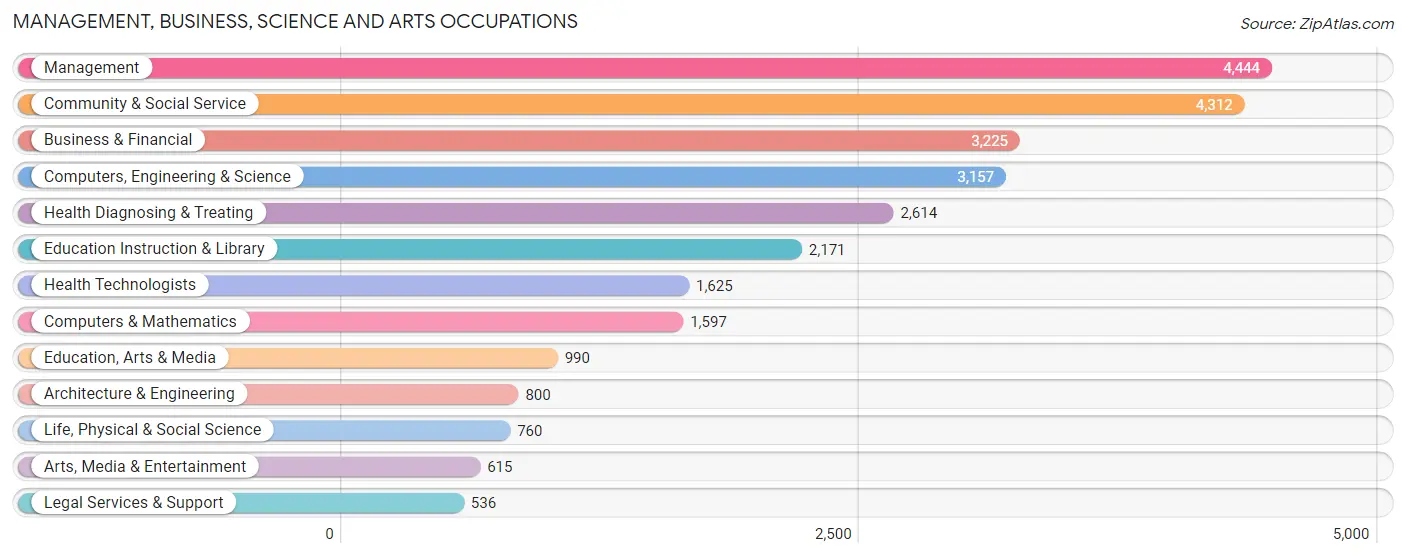
Management, Business, Science and Arts Occupations
The most common Management, Business, Science and Arts occupations in Lewis and Clark County are Management (4,444 | 12.3%), Community & Social Service (4,312 | 11.9%), Business & Financial (3,225 | 8.9%), Computers, Engineering & Science (3,157 | 8.7%), and Health Diagnosing & Treating (2,614 | 7.2%).
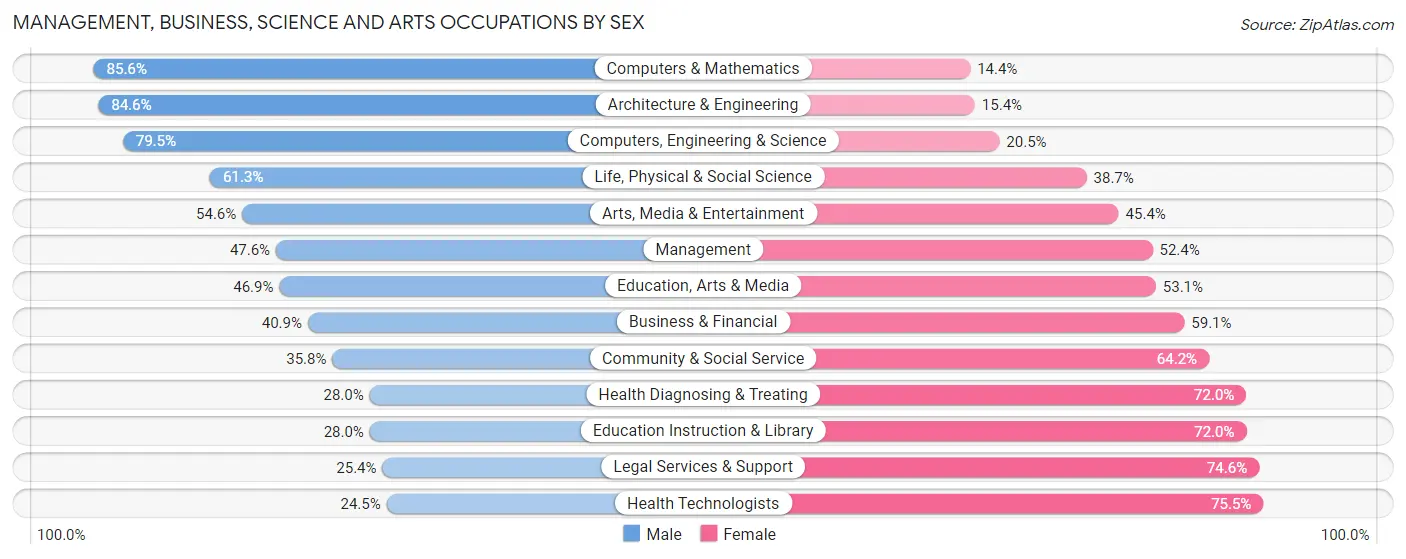
Management, Business, Science and Arts Occupations by Sex
Within the Management, Business, Science and Arts occupations in Lewis and Clark County, the most male-oriented occupations are Computers & Mathematics (85.6%), Architecture & Engineering (84.6%), and Computers, Engineering & Science (79.5%), while the most female-oriented occupations are Health Technologists (75.5%), Legal Services & Support (74.6%), and Education Instruction & Library (72.0%).
| Occupation | Male | Female |
| Management | 2,114 (47.6%) | 2,330 (52.4%) |
| Business & Financial | 1,320 (40.9%) | 1,905 (59.1%) |
| Computers, Engineering & Science | 2,510 (79.5%) | 647 (20.5%) |
| Computers & Mathematics | 1,367 (85.6%) | 230 (14.4%) |
| Architecture & Engineering | 677 (84.6%) | 123 (15.4%) |
| Life, Physical & Social Science | 466 (61.3%) | 294 (38.7%) |
| Community & Social Service | 1,544 (35.8%) | 2,768 (64.2%) |
| Education, Arts & Media | 464 (46.9%) | 526 (53.1%) |
| Legal Services & Support | 136 (25.4%) | 400 (74.6%) |
| Education Instruction & Library | 608 (28.0%) | 1,563 (72.0%) |
| Arts, Media & Entertainment | 336 (54.6%) | 279 (45.4%) |
| Health Diagnosing & Treating | 733 (28.0%) | 1,881 (72.0%) |
| Health Technologists | 398 (24.5%) | 1,227 (75.5%) |
| Total (Category) | 8,221 (46.3%) | 9,531 (53.7%) |
| Total (Overall) | 19,081 (52.8%) | 17,035 (47.2%) |
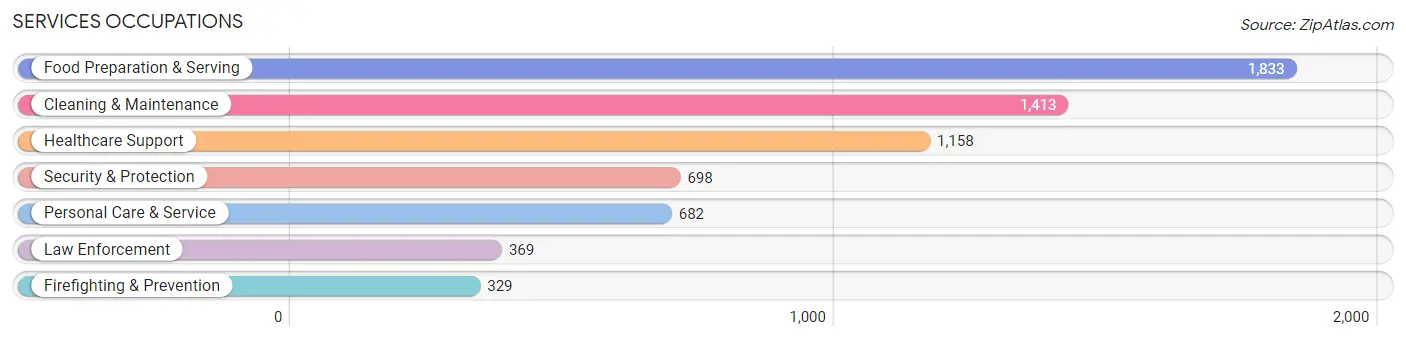
Services Occupations
The most common Services occupations in Lewis and Clark County are Food Preparation & Serving (1,833 | 5.1%), Cleaning & Maintenance (1,413 | 3.9%), Healthcare Support (1,158 | 3.2%), Security & Protection (698 | 1.9%), and Personal Care & Service (682 | 1.9%).
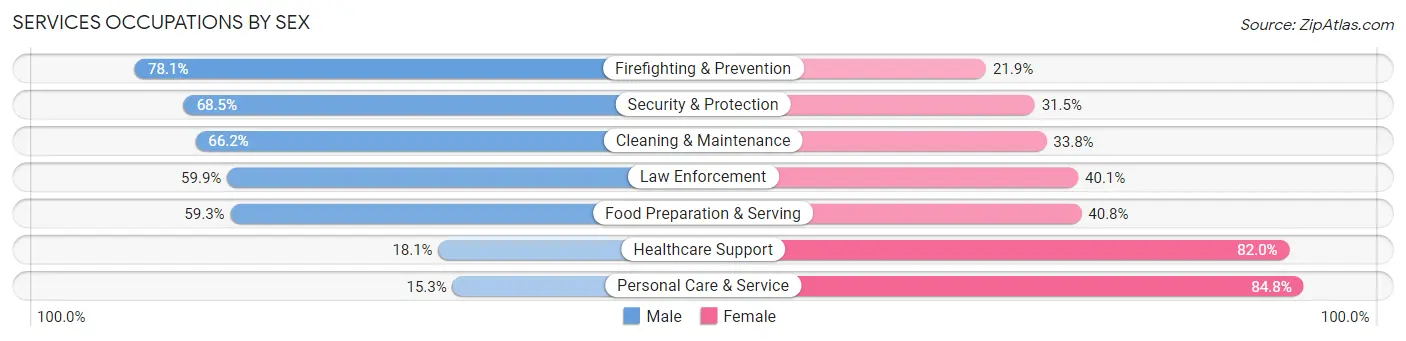
Services Occupations by Sex
Within the Services occupations in Lewis and Clark County, the most male-oriented occupations are Firefighting & Prevention (78.1%), Security & Protection (68.5%), and Cleaning & Maintenance (66.2%), while the most female-oriented occupations are Personal Care & Service (84.8%), Healthcare Support (82.0%), and Food Preparation & Serving (40.7%).
| Occupation | Male | Female |
| Healthcare Support | 209 (18.0%) | 949 (82.0%) |
| Security & Protection | 478 (68.5%) | 220 (31.5%) |
| Firefighting & Prevention | 257 (78.1%) | 72 (21.9%) |
| Law Enforcement | 221 (59.9%) | 148 (40.1%) |
| Food Preparation & Serving | 1,086 (59.3%) | 747 (40.7%) |
| Cleaning & Maintenance | 935 (66.2%) | 478 (33.8%) |
| Personal Care & Service | 104 (15.2%) | 578 (84.8%) |
| Total (Category) | 2,812 (48.6%) | 2,972 (51.4%) |
| Total (Overall) | 19,081 (52.8%) | 17,035 (47.2%) |
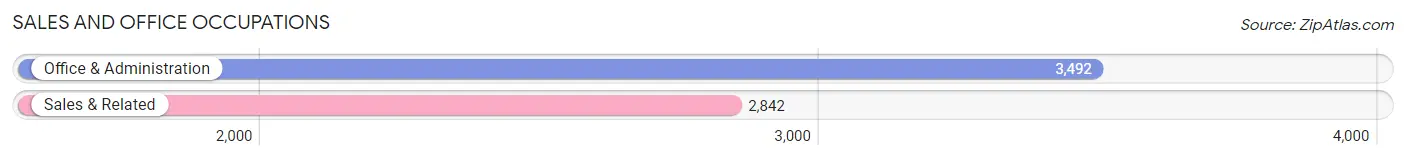
Sales and Office Occupations
The most common Sales and Office occupations in Lewis and Clark County are Office & Administration (3,492 | 9.7%), and Sales & Related (2,842 | 7.9%).
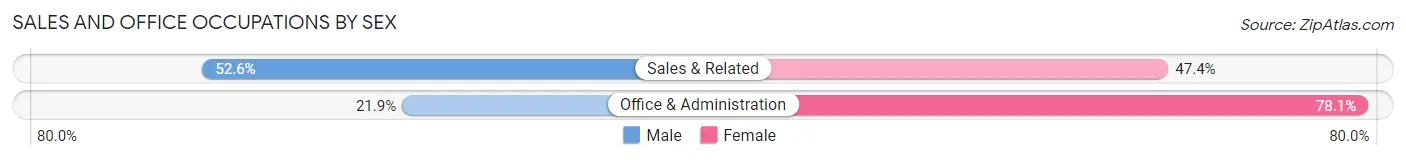
Sales and Office Occupations by Sex
| Occupation | Male | Female |
| Sales & Related | 1,496 (52.6%) | 1,346 (47.4%) |
| Office & Administration | 766 (21.9%) | 2,726 (78.1%) |
| Total (Category) | 2,262 (35.7%) | 4,072 (64.3%) |
| Total (Overall) | 19,081 (52.8%) | 17,035 (47.2%) |
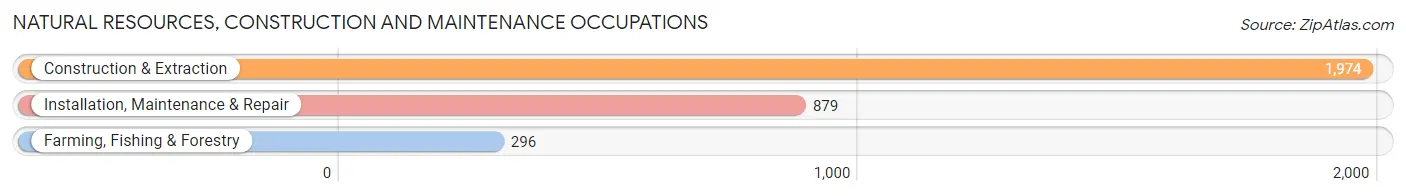
Natural Resources, Construction and Maintenance Occupations
The most common Natural Resources, Construction and Maintenance occupations in Lewis and Clark County are Construction & Extraction (1,974 | 5.5%), Installation, Maintenance & Repair (879 | 2.4%), and Farming, Fishing & Forestry (296 | 0.8%).
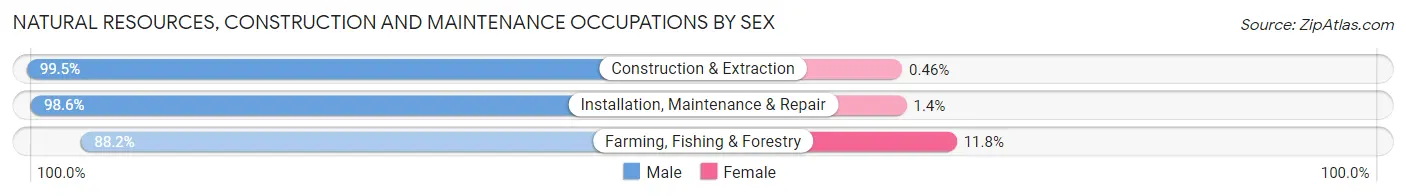
Natural Resources, Construction and Maintenance Occupations by Sex
| Occupation | Male | Female |
| Farming, Fishing & Forestry | 261 (88.2%) | 35 (11.8%) |
| Construction & Extraction | 1,965 (99.5%) | 9 (0.5%) |
| Installation, Maintenance & Repair | 867 (98.6%) | 12 (1.4%) |
| Total (Category) | 3,093 (98.2%) | 56 (1.8%) |
| Total (Overall) | 19,081 (52.8%) | 17,035 (47.2%) |
Production, Transportation and Moving Occupations
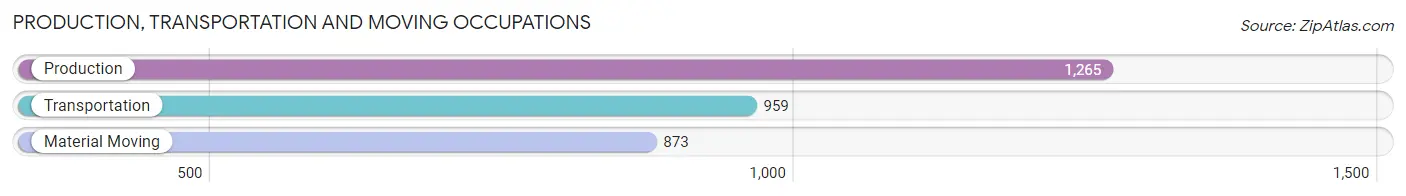
The most common Production, Transportation and Moving occupations in Lewis and Clark County are Production (1,265 | 3.5%), Transportation (959 | 2.7%), and Material Moving (873 | 2.4%).
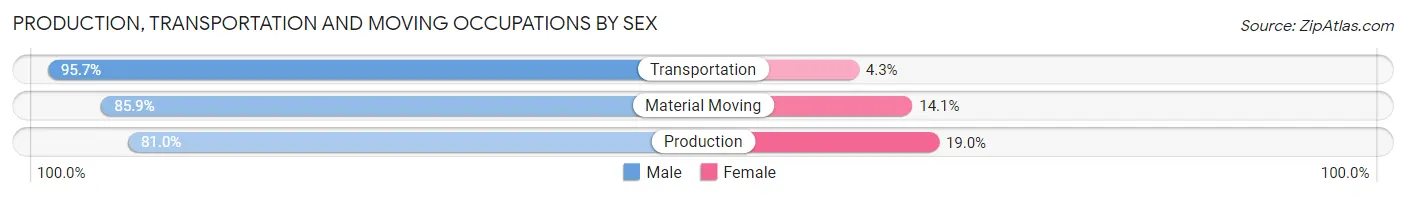
Production, Transportation and Moving Occupations by Sex
| Occupation | Male | Female |
| Production | 1,025 (81.0%) | 240 (19.0%) |
| Transportation | 918 (95.7%) | 41 (4.3%) |
| Material Moving | 750 (85.9%) | 123 (14.1%) |
| Total (Category) | 2,693 (87.0%) | 404 (13.0%) |
| Total (Overall) | 19,081 (52.8%) | 17,035 (47.2%) |
Employment Industries by Sex in Lewis and Clark County
Employment Industries in Lewis and Clark County
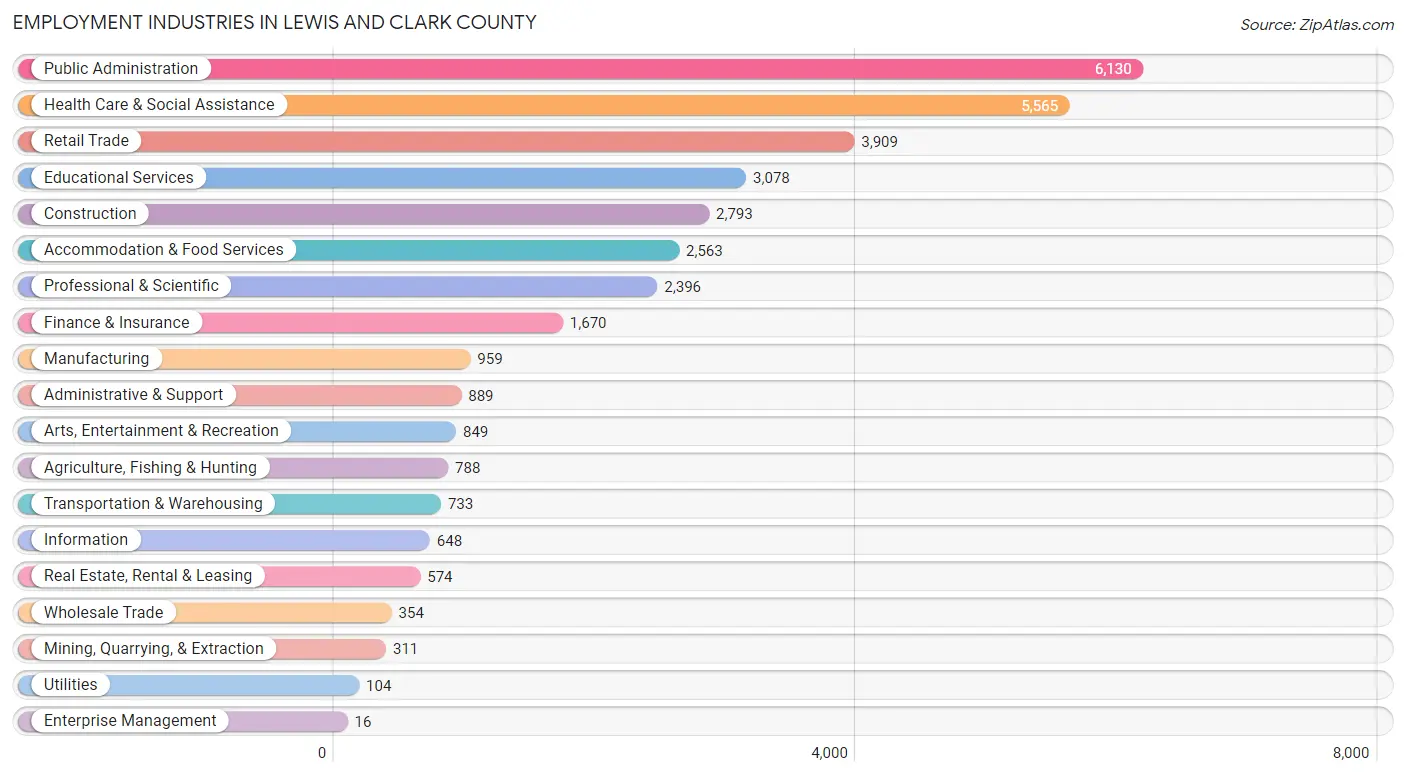
The major employment industries in Lewis and Clark County include Public Administration (6,130 | 17.0%), Health Care & Social Assistance (5,565 | 15.4%), Retail Trade (3,909 | 10.8%), Educational Services (3,078 | 8.5%), and Construction (2,793 | 7.7%).
Employment Industries by Sex in Lewis and Clark County
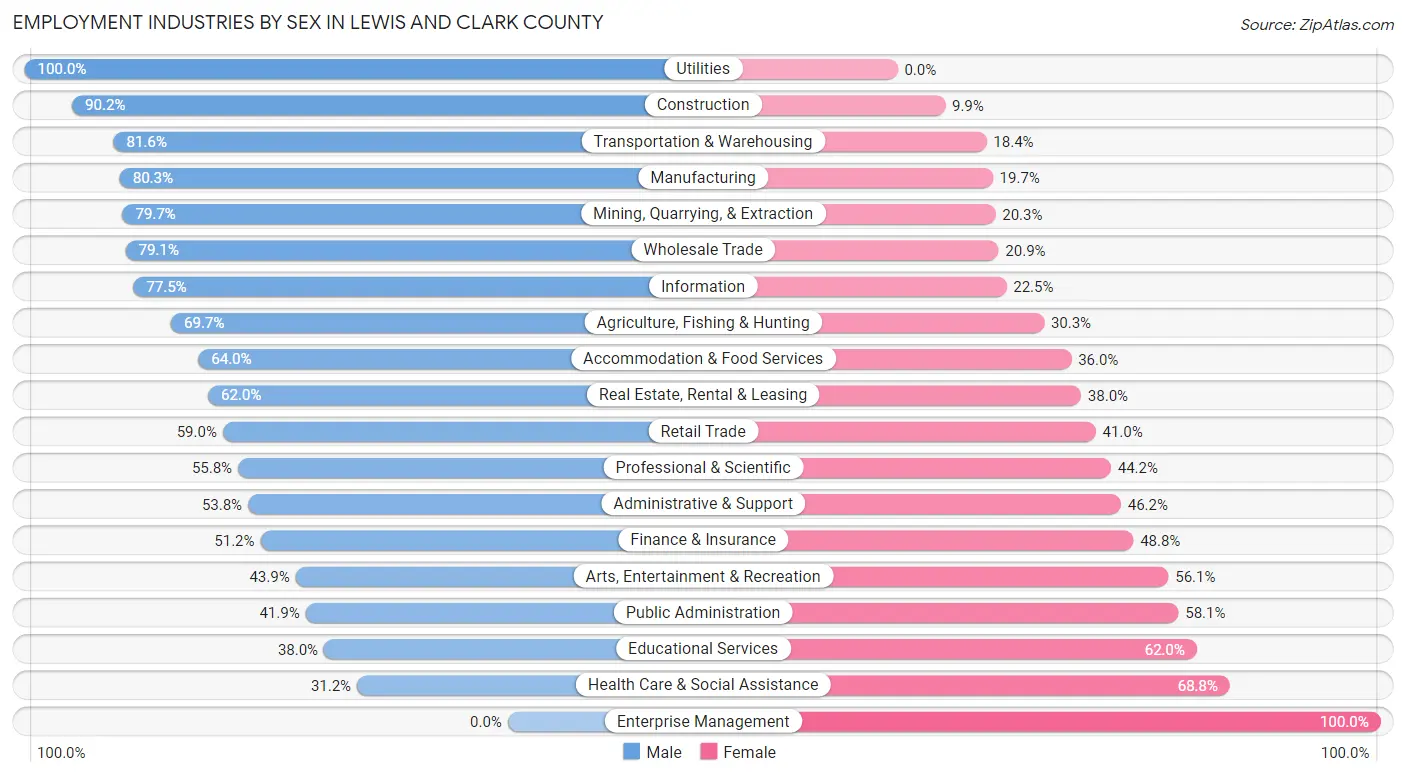
The Lewis and Clark County industries that see more men than women are Utilities (100.0%), Construction (90.1%), and Transportation & Warehousing (81.6%), whereas the industries that tend to have a higher number of women are Enterprise Management (100.0%), Health Care & Social Assistance (68.8%), and Educational Services (62.0%).
| Industry | Male | Female |
| Agriculture, Fishing & Hunting | 549 (69.7%) | 239 (30.3%) |
| Mining, Quarrying, & Extraction | 248 (79.7%) | 63 (20.3%) |
| Construction | 2,518 (90.1%) | 275 (9.9%) |
| Manufacturing | 770 (80.3%) | 189 (19.7%) |
| Wholesale Trade | 280 (79.1%) | 74 (20.9%) |
| Retail Trade | 2,306 (59.0%) | 1,603 (41.0%) |
| Transportation & Warehousing | 598 (81.6%) | 135 (18.4%) |
| Utilities | 104 (100.0%) | 0 (0.0%) |
| Information | 502 (77.5%) | 146 (22.5%) |
| Finance & Insurance | 855 (51.2%) | 815 (48.8%) |
| Real Estate, Rental & Leasing | 356 (62.0%) | 218 (38.0%) |
| Professional & Scientific | 1,338 (55.8%) | 1,058 (44.2%) |
| Enterprise Management | 0 (0.0%) | 16 (100.0%) |
| Administrative & Support | 478 (53.8%) | 411 (46.2%) |
| Educational Services | 1,171 (38.0%) | 1,907 (62.0%) |
| Health Care & Social Assistance | 1,737 (31.2%) | 3,828 (68.8%) |
| Arts, Entertainment & Recreation | 373 (43.9%) | 476 (56.1%) |
| Accommodation & Food Services | 1,641 (64.0%) | 922 (36.0%) |
| Public Administration | 2,566 (41.9%) | 3,564 (58.1%) |
| Total | 19,081 (52.8%) | 17,035 (47.2%) |
Education in Lewis and Clark County
School Enrollment in Lewis and Clark County
The most common levels of schooling among the 15,346 students in Lewis and Clark County are middle school (3,879 | 25.3%), college / undergraduate (2,911 | 19.0%), and elementary school (2,908 | 19.0%).
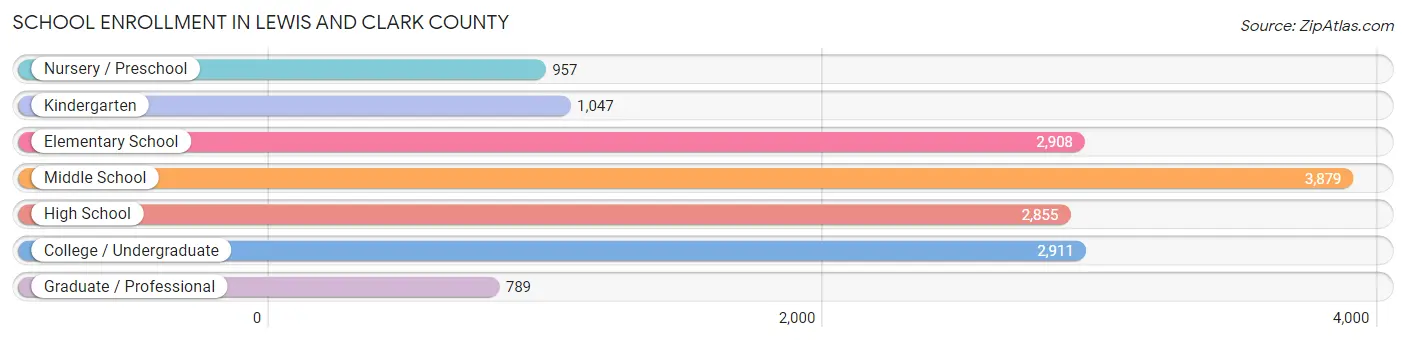
| School Level | # Students | % Students |
| Nursery / Preschool | 957 | 6.2% |
| Kindergarten | 1,047 | 6.8% |
| Elementary School | 2,908 | 19.0% |
| Middle School | 3,879 | 25.3% |
| High School | 2,855 | 18.6% |
| College / Undergraduate | 2,911 | 19.0% |
| Graduate / Professional | 789 | 5.1% |
| Total | 15,346 | 100.0% |
School Enrollment by Age by Funding Source in Lewis and Clark County
Out of a total of 15,346 students who are enrolled in schools in Lewis and Clark County, 3,177 (20.7%) attend a private institution, while the remaining 12,169 (79.3%) are enrolled in public schools. The age group of 20 to 24 year olds has the highest likelihood of being enrolled in private schools, with 863 (61.1% in the age bracket) enrolled. Conversely, the age group of 25 to 34 year olds has the lowest likelihood of being enrolled in a private school, with 546 (94.6% in the age bracket) attending a public institution.
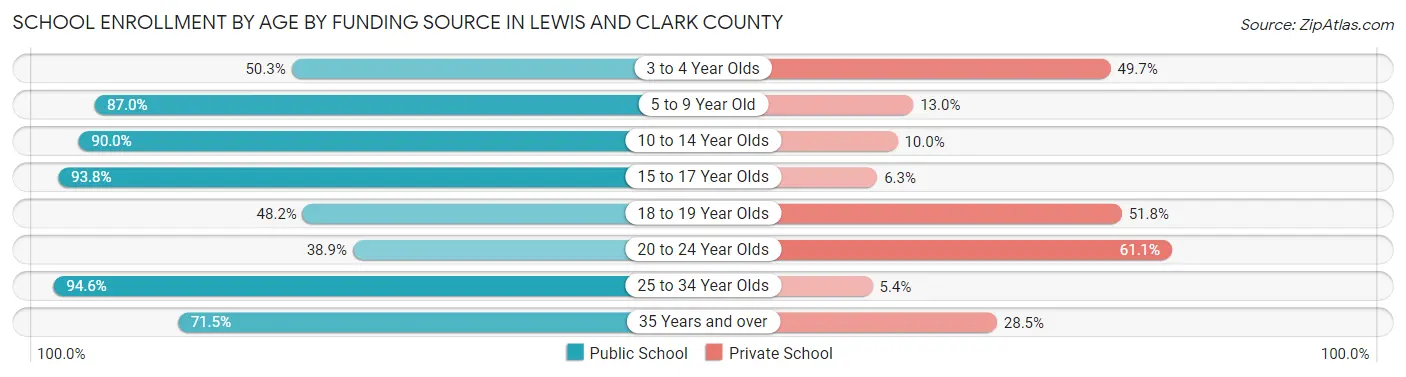
| Age Bracket | Public School | Private School |
| 3 to 4 Year Olds | 350 (50.3%) | 346 (49.7%) |
| 5 to 9 Year Old | 3,271 (87.0%) | 487 (13.0%) |
| 10 to 14 Year Olds | 4,132 (90.0%) | 460 (10.0%) |
| 15 to 17 Year Olds | 2,099 (93.8%) | 140 (6.2%) |
| 18 to 19 Year Olds | 551 (48.2%) | 592 (51.8%) |
| 20 to 24 Year Olds | 549 (38.9%) | 863 (61.1%) |
| 25 to 34 Year Olds | 546 (94.6%) | 31 (5.4%) |
| 35 Years and over | 664 (71.5%) | 265 (28.5%) |
| Total | 12,169 (79.3%) | 3,177 (20.7%) |
Educational Attainment by Field of Study in Lewis and Clark County
Business (3,769 | 15.7%), education (2,858 | 11.9%), science & technology (2,553 | 10.7%), bio, nature & agricultural (2,335 | 9.8%), and social sciences (1,880 | 7.9%) are the most common fields of study among 23,943 individuals in Lewis and Clark County who have obtained a bachelor's degree or higher.
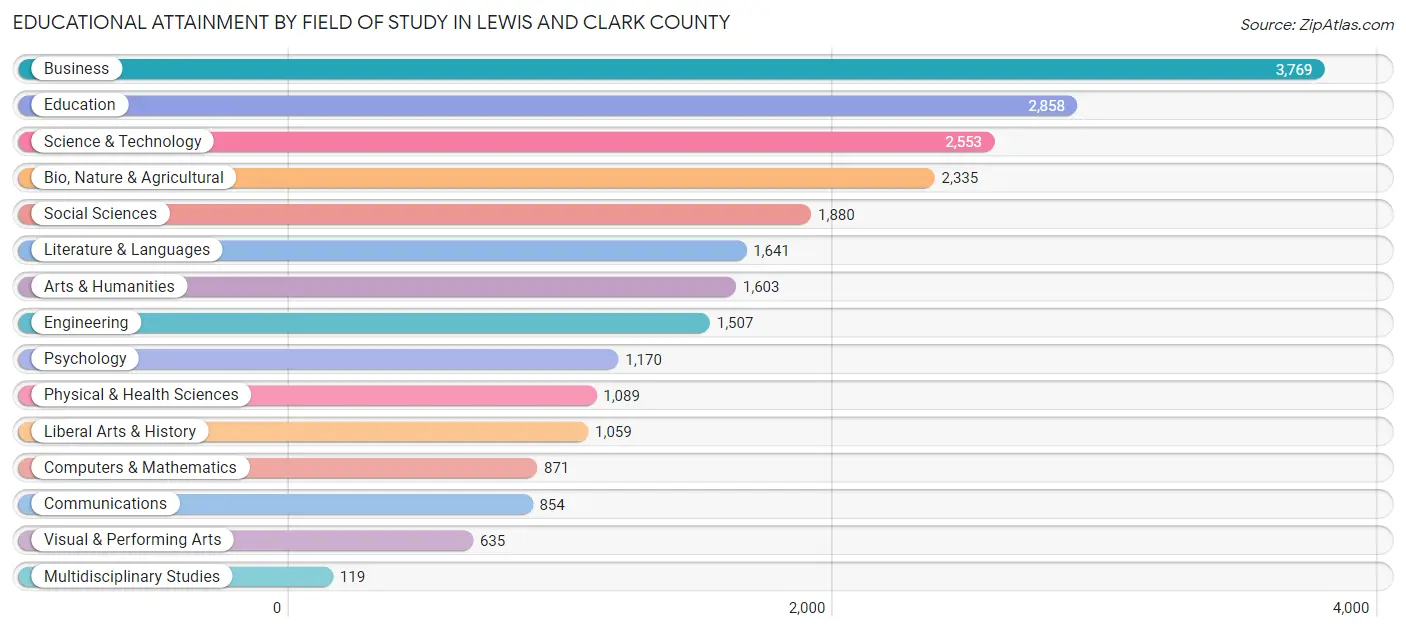
| Field of Study | # Graduates | % Graduates |
| Computers & Mathematics | 871 | 3.6% |
| Bio, Nature & Agricultural | 2,335 | 9.8% |
| Physical & Health Sciences | 1,089 | 4.5% |
| Psychology | 1,170 | 4.9% |
| Social Sciences | 1,880 | 7.9% |
| Engineering | 1,507 | 6.3% |
| Multidisciplinary Studies | 119 | 0.5% |
| Science & Technology | 2,553 | 10.7% |
| Business | 3,769 | 15.7% |
| Education | 2,858 | 11.9% |
| Literature & Languages | 1,641 | 6.9% |
| Liberal Arts & History | 1,059 | 4.4% |
| Visual & Performing Arts | 635 | 2.6% |
| Communications | 854 | 3.6% |
| Arts & Humanities | 1,603 | 6.7% |
| Total | 23,943 | 100.0% |
Transportation & Commute in Lewis and Clark County
Vehicle Availability by Sex in Lewis and Clark County
The most prevalent vehicle ownership categories in Lewis and Clark County are males with 2 vehicles (7,380, accounting for 39.0%) and females with 2 vehicles (6,570, making up 44.2%).
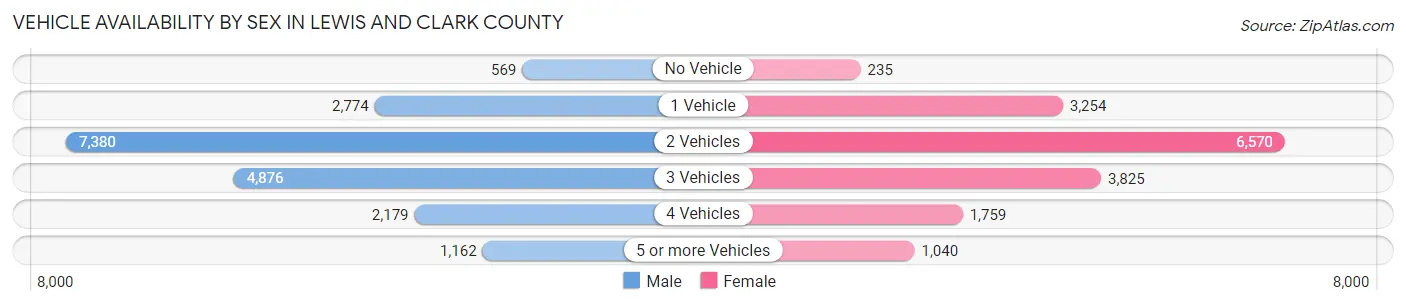
| Vehicles Available | Male | Female |
| No Vehicle | 569 (3.0%) | 235 (1.4%) |
| 1 Vehicle | 2,774 (14.6%) | 3,254 (19.5%) |
| 2 Vehicles | 7,380 (39.0%) | 6,570 (39.4%) |
| 3 Vehicles | 4,876 (25.7%) | 3,825 (22.9%) |
| 4 Vehicles | 2,179 (11.5%) | 1,759 (10.5%) |
| 5 or more Vehicles | 1,162 (6.1%) | 1,040 (6.2%) |
| Total | 18,940 (100.0%) | 16,683 (100.0%) |
Commute Time in Lewis and Clark County
The most frequently occuring commute durations in Lewis and Clark County are 15 to 19 minutes (7,985 commuters, 25.2%), 10 to 14 minutes (6,834 commuters, 21.6%), and 5 to 9 minutes (5,007 commuters, 15.8%).
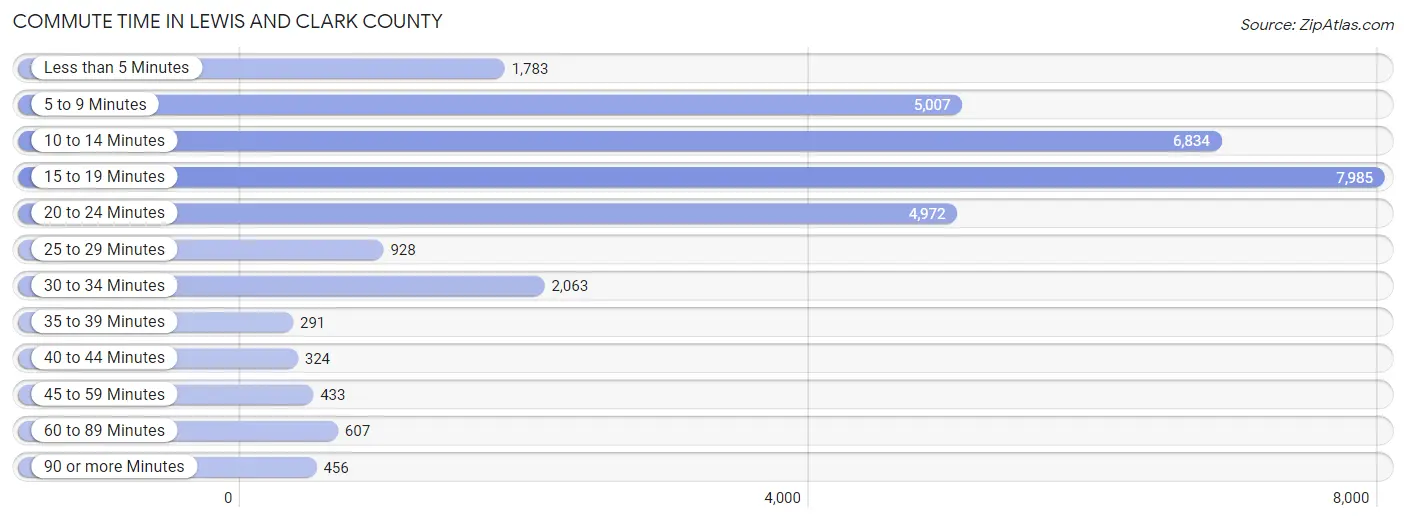
| Commute Time | # Commuters | % Commuters |
| Less than 5 Minutes | 1,783 | 5.6% |
| 5 to 9 Minutes | 5,007 | 15.8% |
| 10 to 14 Minutes | 6,834 | 21.6% |
| 15 to 19 Minutes | 7,985 | 25.2% |
| 20 to 24 Minutes | 4,972 | 15.7% |
| 25 to 29 Minutes | 928 | 2.9% |
| 30 to 34 Minutes | 2,063 | 6.5% |
| 35 to 39 Minutes | 291 | 0.9% |
| 40 to 44 Minutes | 324 | 1.0% |
| 45 to 59 Minutes | 433 | 1.4% |
| 60 to 89 Minutes | 607 | 1.9% |
| 90 or more Minutes | 456 | 1.4% |
Commute Time by Sex in Lewis and Clark County
The most common commute times in Lewis and Clark County are 15 to 19 minutes (4,088 commuters, 24.3%) for males and 15 to 19 minutes (3,897 commuters, 26.2%) for females.
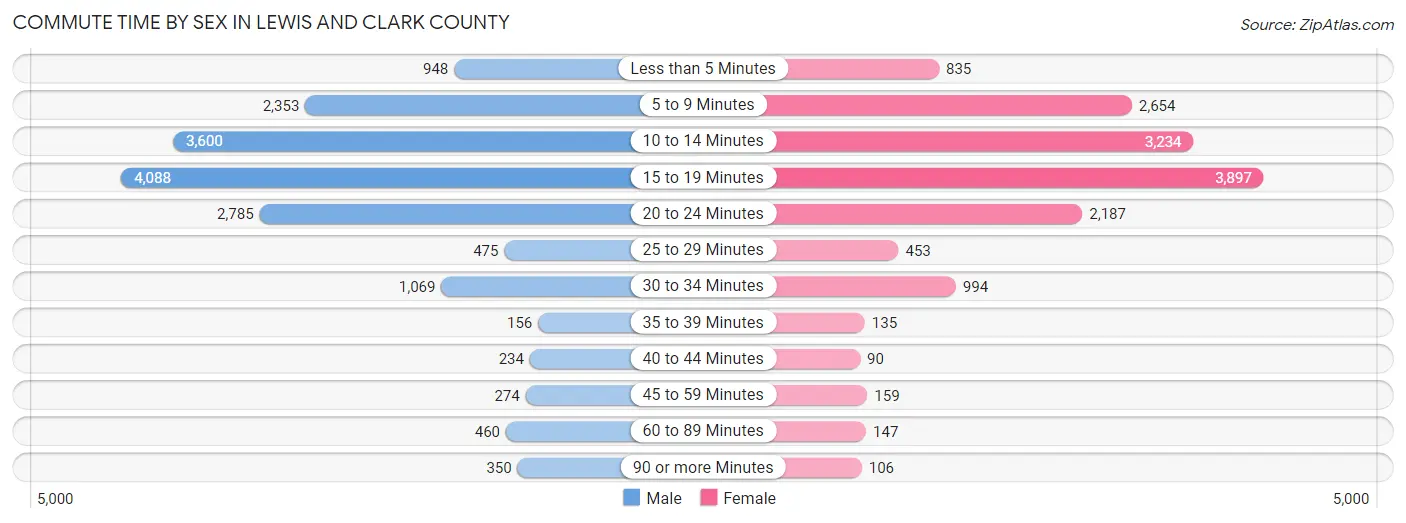
| Commute Time | Male | Female |
| Less than 5 Minutes | 948 (5.7%) | 835 (5.6%) |
| 5 to 9 Minutes | 2,353 (14.0%) | 2,654 (17.8%) |
| 10 to 14 Minutes | 3,600 (21.4%) | 3,234 (21.7%) |
| 15 to 19 Minutes | 4,088 (24.3%) | 3,897 (26.2%) |
| 20 to 24 Minutes | 2,785 (16.6%) | 2,187 (14.7%) |
| 25 to 29 Minutes | 475 (2.8%) | 453 (3.0%) |
| 30 to 34 Minutes | 1,069 (6.4%) | 994 (6.7%) |
| 35 to 39 Minutes | 156 (0.9%) | 135 (0.9%) |
| 40 to 44 Minutes | 234 (1.4%) | 90 (0.6%) |
| 45 to 59 Minutes | 274 (1.6%) | 159 (1.1%) |
| 60 to 89 Minutes | 460 (2.7%) | 147 (1.0%) |
| 90 or more Minutes | 350 (2.1%) | 106 (0.7%) |
Time of Departure to Work by Sex in Lewis and Clark County
The most frequent times of departure to work in Lewis and Clark County are 7:30 AM to 7:59 AM (3,904, 23.3%) for males and 7:30 AM to 7:59 AM (3,775, 25.4%) for females.
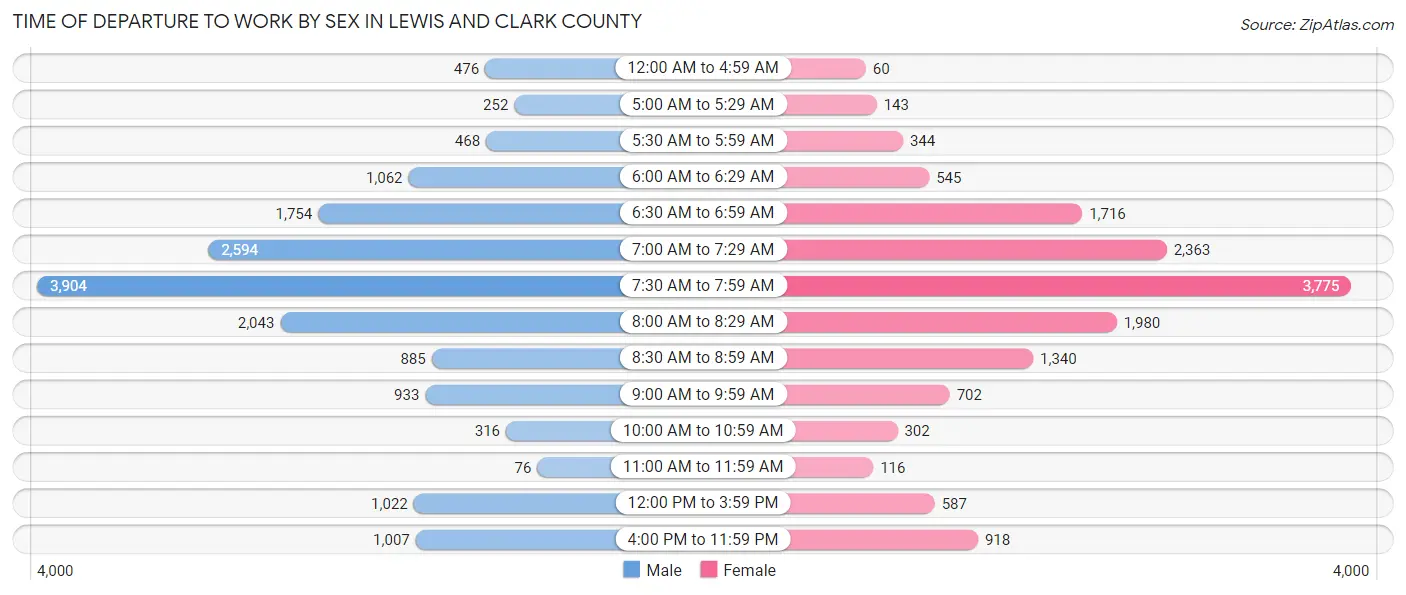
| Time of Departure | Male | Female |
| 12:00 AM to 4:59 AM | 476 (2.8%) | 60 (0.4%) |
| 5:00 AM to 5:29 AM | 252 (1.5%) | 143 (1.0%) |
| 5:30 AM to 5:59 AM | 468 (2.8%) | 344 (2.3%) |
| 6:00 AM to 6:29 AM | 1,062 (6.3%) | 545 (3.7%) |
| 6:30 AM to 6:59 AM | 1,754 (10.4%) | 1,716 (11.5%) |
| 7:00 AM to 7:29 AM | 2,594 (15.4%) | 2,363 (15.9%) |
| 7:30 AM to 7:59 AM | 3,904 (23.3%) | 3,775 (25.4%) |
| 8:00 AM to 8:29 AM | 2,043 (12.2%) | 1,980 (13.3%) |
| 8:30 AM to 8:59 AM | 885 (5.3%) | 1,340 (9.0%) |
| 9:00 AM to 9:59 AM | 933 (5.6%) | 702 (4.7%) |
| 10:00 AM to 10:59 AM | 316 (1.9%) | 302 (2.0%) |
| 11:00 AM to 11:59 AM | 76 (0.4%) | 116 (0.8%) |
| 12:00 PM to 3:59 PM | 1,022 (6.1%) | 587 (3.9%) |
| 4:00 PM to 11:59 PM | 1,007 (6.0%) | 918 (6.2%) |
| Total | 16,792 (100.0%) | 14,891 (100.0%) |
Housing Occupancy in Lewis and Clark County
Occupancy by Ownership in Lewis and Clark County
Of the total 30,281 dwellings in Lewis and Clark County, owner-occupied units account for 21,354 (70.5%), while renter-occupied units make up 8,927 (29.5%).
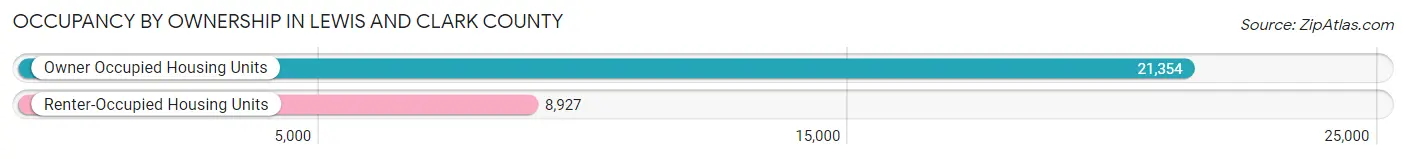
| Occupancy | # Housing Units | % Housing Units |
| Owner Occupied Housing Units | 21,354 | 70.5% |
| Renter-Occupied Housing Units | 8,927 | 29.5% |
| Total Occupied Housing Units | 30,281 | 100.0% |
Occupancy by Household Size in Lewis and Clark County
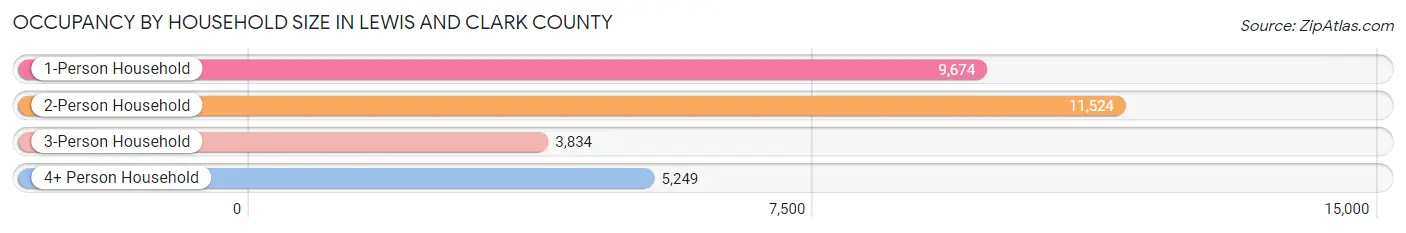
| Household Size | # Housing Units | % Housing Units |
| 1-Person Household | 9,674 | 32.0% |
| 2-Person Household | 11,524 | 38.1% |
| 3-Person Household | 3,834 | 12.7% |
| 4+ Person Household | 5,249 | 17.3% |
| Total Housing Units | 30,281 | 100.0% |
Occupancy by Ownership by Household Size in Lewis and Clark County
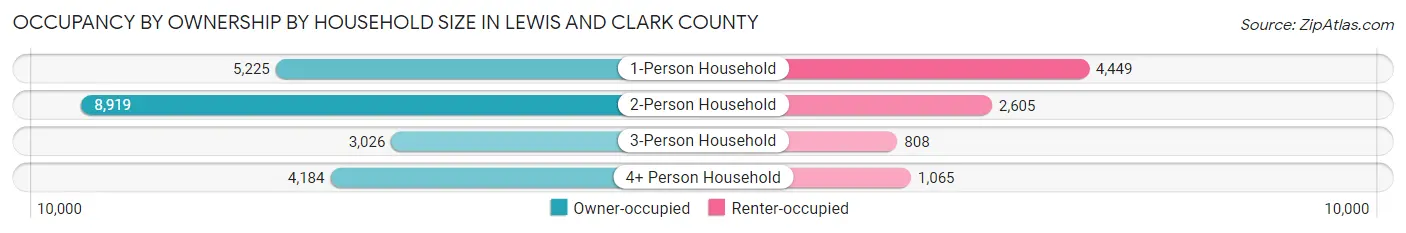
| Household Size | Owner-occupied | Renter-occupied |
| 1-Person Household | 5,225 (54.0%) | 4,449 (46.0%) |
| 2-Person Household | 8,919 (77.4%) | 2,605 (22.6%) |
| 3-Person Household | 3,026 (78.9%) | 808 (21.1%) |
| 4+ Person Household | 4,184 (79.7%) | 1,065 (20.3%) |
| Total Housing Units | 21,354 (70.5%) | 8,927 (29.5%) |
Occupancy by Educational Attainment in Lewis and Clark County
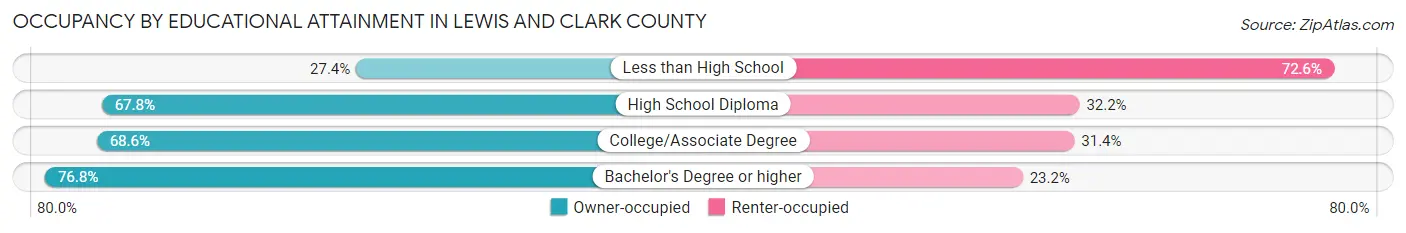
| Household Size | Owner-occupied | Renter-occupied |
| Less than High School | 326 (27.4%) | 863 (72.6%) |
| High School Diploma | 4,418 (67.8%) | 2,102 (32.2%) |
| College/Associate Degree | 5,993 (68.6%) | 2,748 (31.4%) |
| Bachelor's Degree or higher | 10,617 (76.8%) | 3,214 (23.2%) |
Occupancy by Age of Householder in Lewis and Clark County
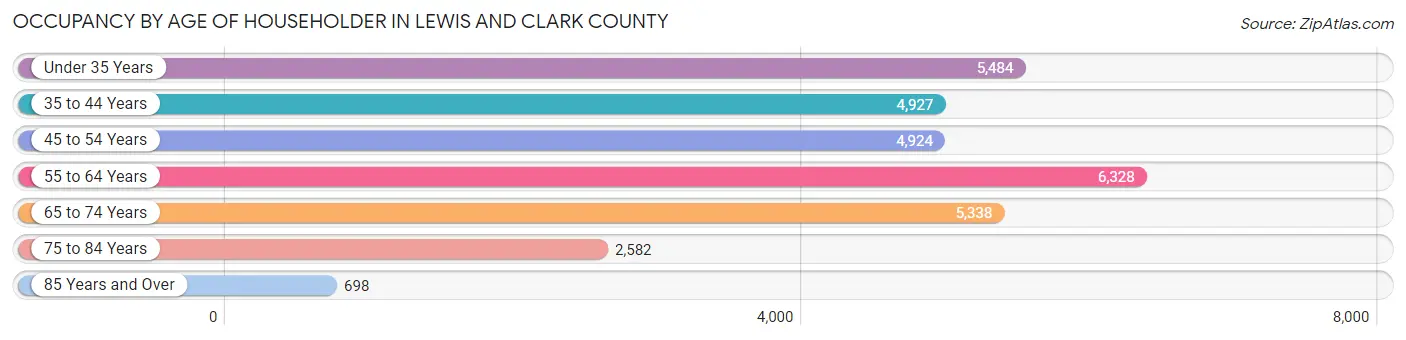
| Age Bracket | # Households | % Households |
| Under 35 Years | 5,484 | 18.1% |
| 35 to 44 Years | 4,927 | 16.3% |
| 45 to 54 Years | 4,924 | 16.3% |
| 55 to 64 Years | 6,328 | 20.9% |
| 65 to 74 Years | 5,338 | 17.6% |
| 75 to 84 Years | 2,582 | 8.5% |
| 85 Years and Over | 698 | 2.3% |
| Total | 30,281 | 100.0% |
Housing Finances in Lewis and Clark County
Median Income by Occupancy in Lewis and Clark County
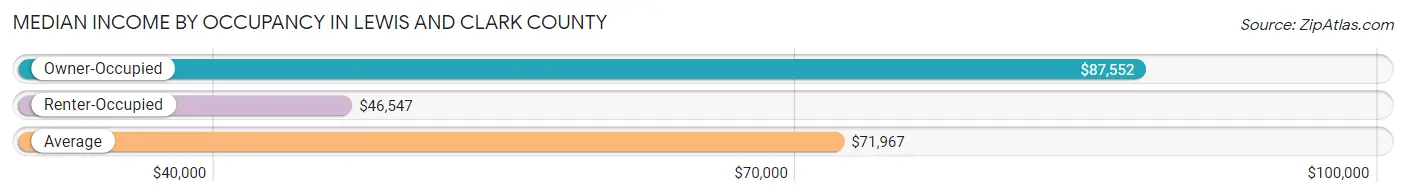
| Occupancy Type | # Households | Median Income |
| Owner-Occupied | 21,354 (70.5%) | $87,552 |
| Renter-Occupied | 8,927 (29.5%) | $46,547 |
| Average | 30,281 (100.0%) | $71,967 |
Occupancy by Householder Income Bracket in Lewis and Clark County
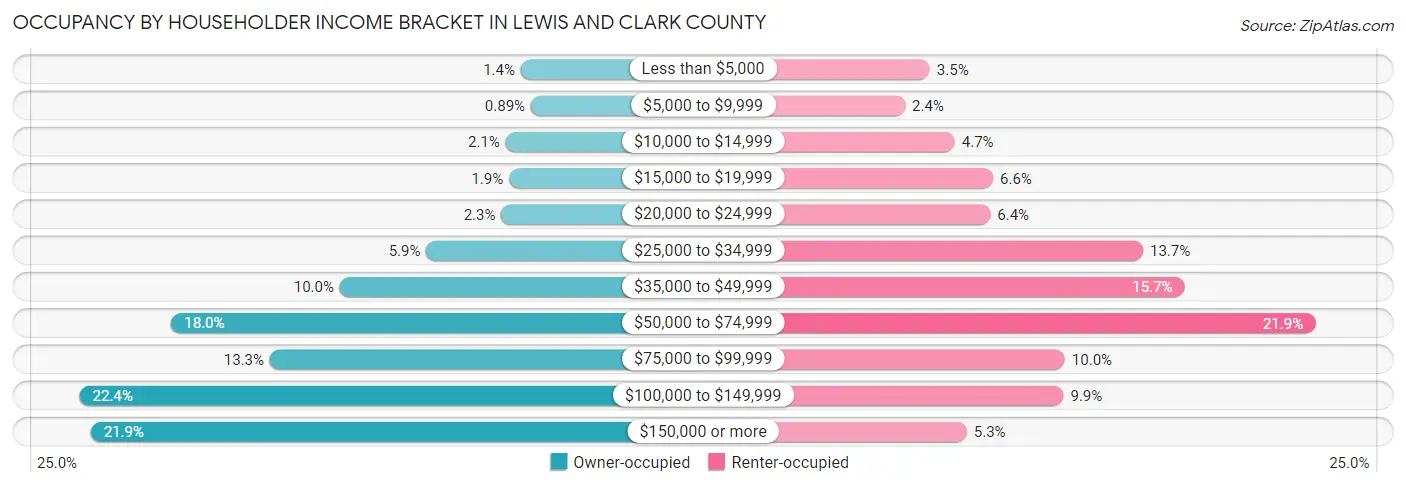
| Income Bracket | Owner-occupied | Renter-occupied |
| Less than $5,000 | 293 (1.4%) | 316 (3.5%) |
| $5,000 to $9,999 | 189 (0.9%) | 211 (2.4%) |
| $10,000 to $14,999 | 447 (2.1%) | 422 (4.7%) |
| $15,000 to $19,999 | 412 (1.9%) | 585 (6.6%) |
| $20,000 to $24,999 | 491 (2.3%) | 573 (6.4%) |
| $25,000 to $34,999 | 1,254 (5.9%) | 1,222 (13.7%) |
| $35,000 to $49,999 | 2,134 (10.0%) | 1,398 (15.7%) |
| $50,000 to $74,999 | 3,845 (18.0%) | 1,953 (21.9%) |
| $75,000 to $99,999 | 2,844 (13.3%) | 890 (10.0%) |
| $100,000 to $149,999 | 4,780 (22.4%) | 884 (9.9%) |
| $150,000 or more | 4,665 (21.8%) | 473 (5.3%) |
| Total | 21,354 (100.0%) | 8,927 (100.0%) |
Monthly Housing Cost Tiers in Lewis and Clark County
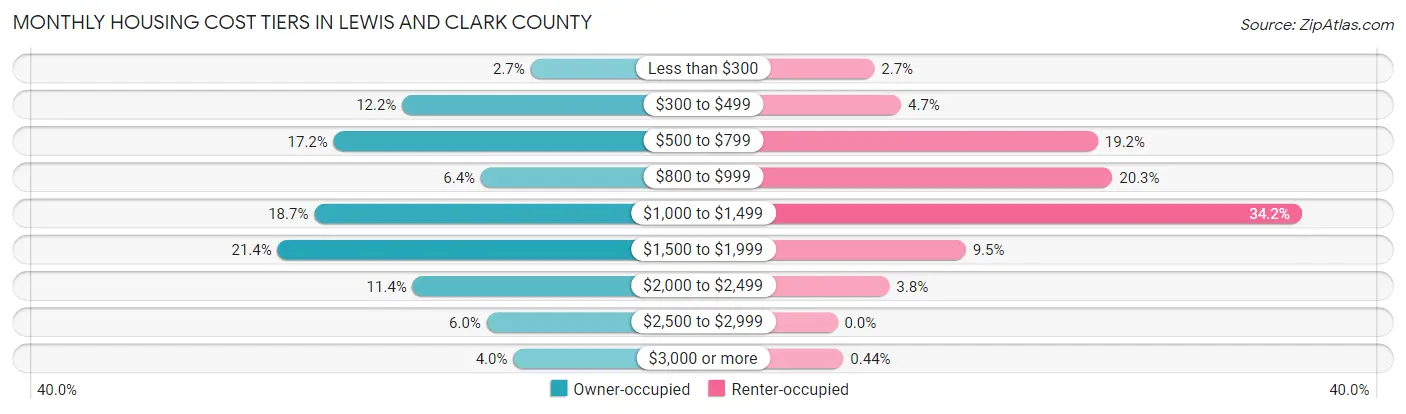
| Monthly Cost | Owner-occupied | Renter-occupied |
| Less than $300 | 586 (2.7%) | 243 (2.7%) |
| $300 to $499 | 2,603 (12.2%) | 419 (4.7%) |
| $500 to $799 | 3,681 (17.2%) | 1,712 (19.2%) |
| $800 to $999 | 1,365 (6.4%) | 1,808 (20.3%) |
| $1,000 to $1,499 | 3,986 (18.7%) | 3,051 (34.2%) |
| $1,500 to $1,999 | 4,564 (21.4%) | 844 (9.5%) |
| $2,000 to $2,499 | 2,438 (11.4%) | 342 (3.8%) |
| $2,500 to $2,999 | 1,274 (6.0%) | 0 (0.0%) |
| $3,000 or more | 857 (4.0%) | 39 (0.4%) |
| Total | 21,354 (100.0%) | 8,927 (100.0%) |
Physical Housing Characteristics in Lewis and Clark County
Housing Structures in Lewis and Clark County
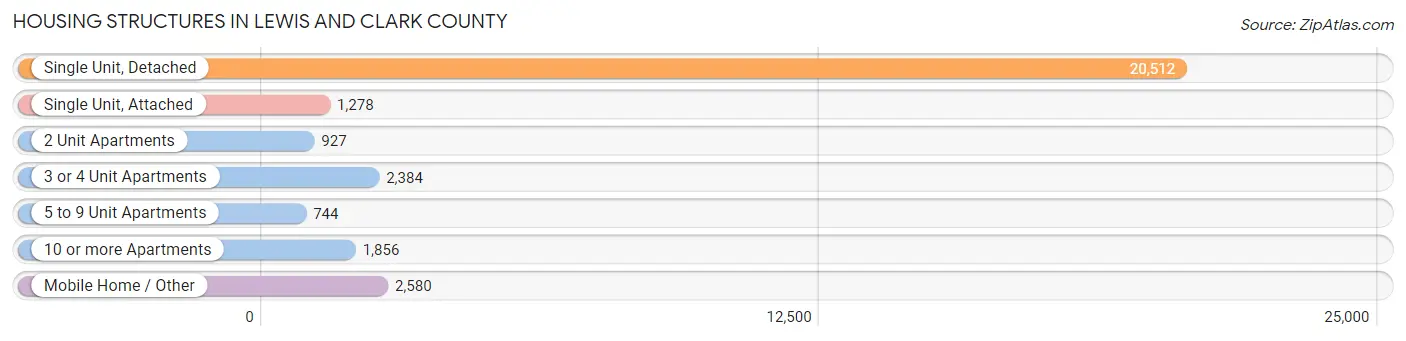
| Structure Type | # Housing Units | % Housing Units |
| Single Unit, Detached | 20,512 | 67.7% |
| Single Unit, Attached | 1,278 | 4.2% |
| 2 Unit Apartments | 927 | 3.1% |
| 3 or 4 Unit Apartments | 2,384 | 7.9% |
| 5 to 9 Unit Apartments | 744 | 2.5% |
| 10 or more Apartments | 1,856 | 6.1% |
| Mobile Home / Other | 2,580 | 8.5% |
| Total | 30,281 | 100.0% |
Housing Structures by Occupancy in Lewis and Clark County
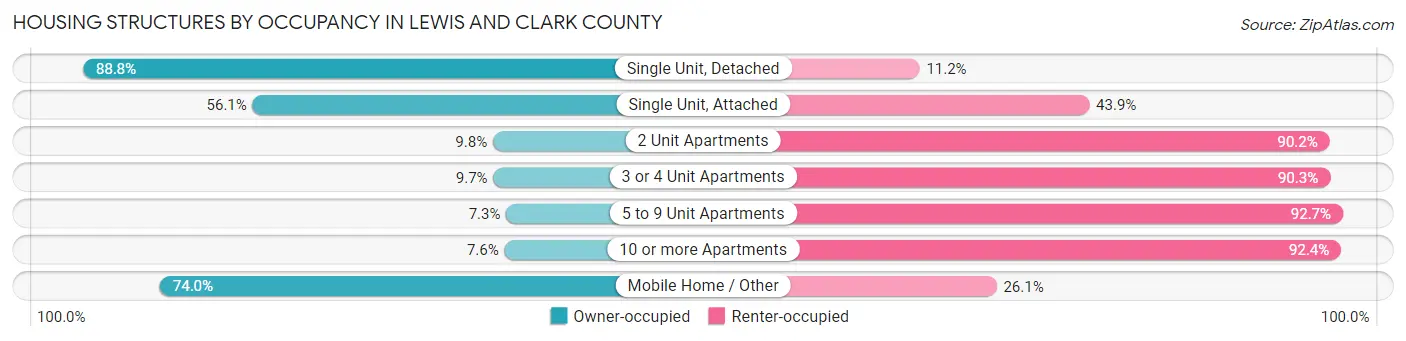
| Structure Type | Owner-occupied | Renter-occupied |
| Single Unit, Detached | 18,211 (88.8%) | 2,301 (11.2%) |
| Single Unit, Attached | 717 (56.1%) | 561 (43.9%) |
| 2 Unit Apartments | 91 (9.8%) | 836 (90.2%) |
| 3 or 4 Unit Apartments | 232 (9.7%) | 2,152 (90.3%) |
| 5 to 9 Unit Apartments | 54 (7.3%) | 690 (92.7%) |
| 10 or more Apartments | 141 (7.6%) | 1,715 (92.4%) |
| Mobile Home / Other | 1,908 (74.0%) | 672 (26.1%) |
| Total | 21,354 (70.5%) | 8,927 (29.5%) |
Housing Structures by Number of Rooms in Lewis and Clark County
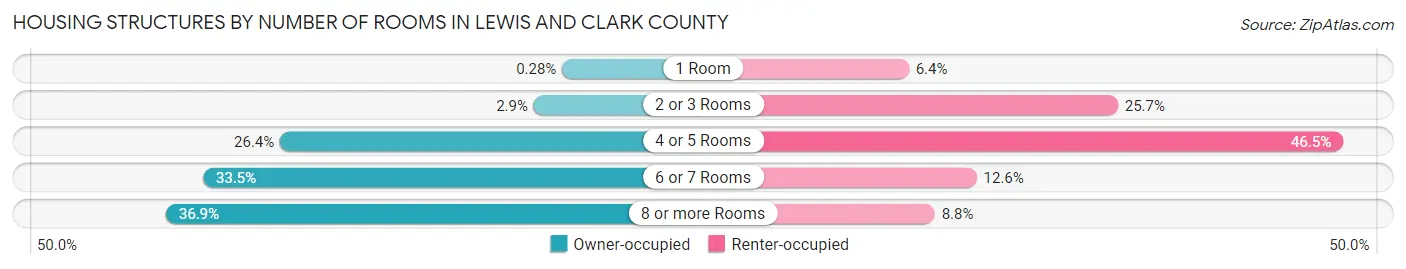
| Number of Rooms | Owner-occupied | Renter-occupied |
| 1 Room | 59 (0.3%) | 568 (6.4%) |
| 2 or 3 Rooms | 621 (2.9%) | 2,294 (25.7%) |
| 4 or 5 Rooms | 5,632 (26.4%) | 4,154 (46.5%) |
| 6 or 7 Rooms | 7,155 (33.5%) | 1,128 (12.6%) |
| 8 or more Rooms | 7,887 (36.9%) | 783 (8.8%) |
| Total | 21,354 (100.0%) | 8,927 (100.0%) |
Housing Structure by Heating Type in Lewis and Clark County
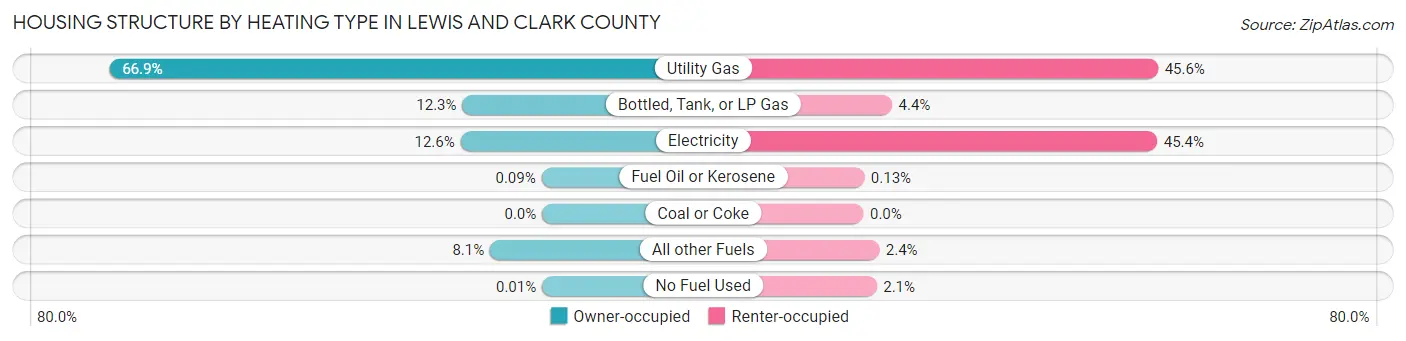
| Heating Type | Owner-occupied | Renter-occupied |
| Utility Gas | 14,288 (66.9%) | 4,066 (45.6%) |
| Bottled, Tank, or LP Gas | 2,633 (12.3%) | 394 (4.4%) |
| Electricity | 2,693 (12.6%) | 4,054 (45.4%) |
| Fuel Oil or Kerosene | 19 (0.1%) | 12 (0.1%) |
| Coal or Coke | 0 (0.0%) | 0 (0.0%) |
| All other Fuels | 1,718 (8.1%) | 218 (2.4%) |
| No Fuel Used | 3 (0.0%) | 183 (2.1%) |
| Total | 21,354 (100.0%) | 8,927 (100.0%) |
Household Vehicle Usage in Lewis and Clark County
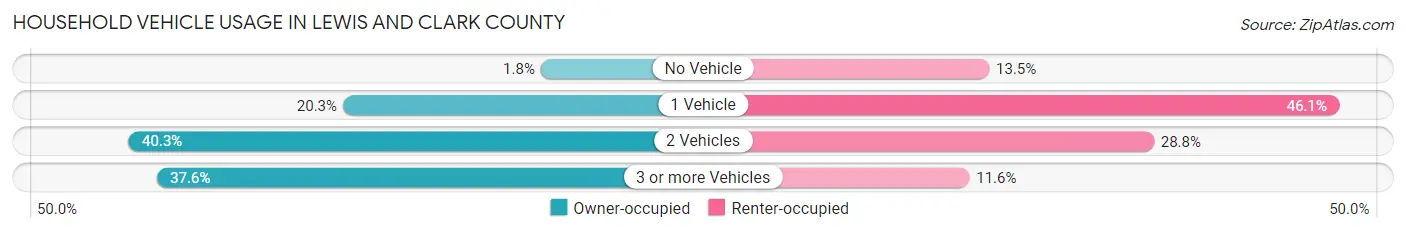
| Vehicles per Household | Owner-occupied | Renter-occupied |
| No Vehicle | 389 (1.8%) | 1,202 (13.5%) |
| 1 Vehicle | 4,333 (20.3%) | 4,115 (46.1%) |
| 2 Vehicles | 8,597 (40.3%) | 2,574 (28.8%) |
| 3 or more Vehicles | 8,035 (37.6%) | 1,036 (11.6%) |
| Total | 21,354 (100.0%) | 8,927 (100.0%) |
Real Estate & Mortgages in Lewis and Clark County
Real Estate and Mortgage Overview in Lewis and Clark County
| Characteristic | Without Mortgage | With Mortgage |
| Housing Units | 7,963 | 13,391 |
| Median Property Value | $301,600 | $344,200 |
| Median Household Income | $61,644 | $3,504 |
| Monthly Housing Costs | $557 | $857 |
| Real Estate Taxes | $2,750 | $229 |
Property Value by Mortgage Status in Lewis and Clark County
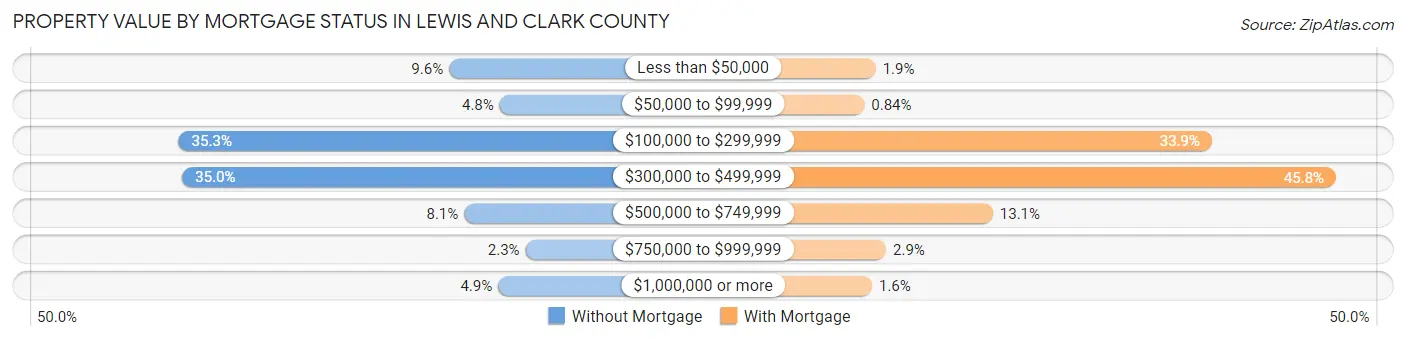
| Property Value | Without Mortgage | With Mortgage |
| Less than $50,000 | 763 (9.6%) | 257 (1.9%) |
| $50,000 to $99,999 | 379 (4.8%) | 113 (0.8%) |
| $100,000 to $299,999 | 2,813 (35.3%) | 4,543 (33.9%) |
| $300,000 to $499,999 | 2,786 (35.0%) | 6,126 (45.8%) |
| $500,000 to $749,999 | 648 (8.1%) | 1,752 (13.1%) |
| $750,000 to $999,999 | 183 (2.3%) | 390 (2.9%) |
| $1,000,000 or more | 391 (4.9%) | 210 (1.6%) |
| Total | 7,963 (100.0%) | 13,391 (100.0%) |
Household Income by Mortgage Status in Lewis and Clark County
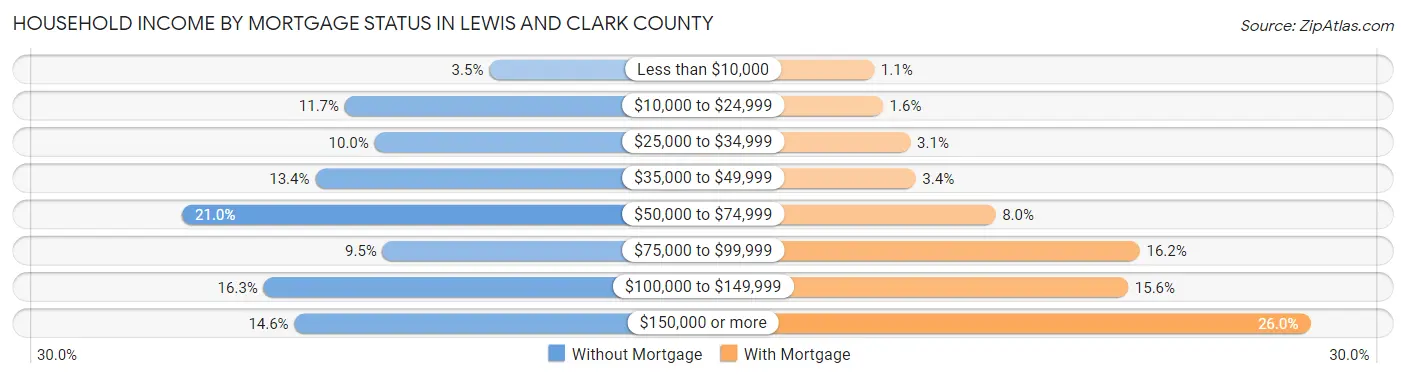
| Household Income | Without Mortgage | With Mortgage |
| Less than $10,000 | 275 (3.5%) | 141 (1.1%) |
| $10,000 to $24,999 | 932 (11.7%) | 207 (1.5%) |
| $25,000 to $34,999 | 796 (10.0%) | 418 (3.1%) |
| $35,000 to $49,999 | 1,066 (13.4%) | 458 (3.4%) |
| $50,000 to $74,999 | 1,672 (21.0%) | 1,068 (8.0%) |
| $75,000 to $99,999 | 760 (9.5%) | 2,173 (16.2%) |
| $100,000 to $149,999 | 1,301 (16.3%) | 2,084 (15.6%) |
| $150,000 or more | 1,161 (14.6%) | 3,479 (26.0%) |
| Total | 7,963 (100.0%) | 13,391 (100.0%) |
Property Value to Household Income Ratio in Lewis and Clark County
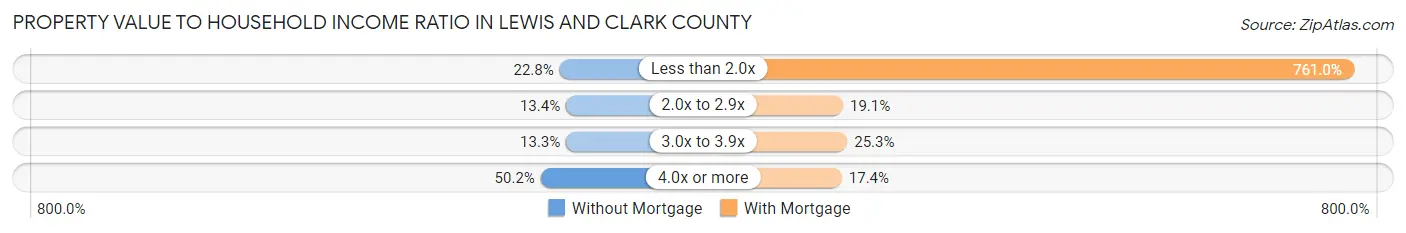
| Value-to-Income Ratio | Without Mortgage | With Mortgage |
| Less than 2.0x | 1,815 (22.8%) | 101,906 (761.0%) |
| 2.0x to 2.9x | 1,069 (13.4%) | 2,554 (19.1%) |
| 3.0x to 3.9x | 1,056 (13.3%) | 3,385 (25.3%) |
| 4.0x or more | 3,998 (50.2%) | 2,325 (17.4%) |
| Total | 7,963 (100.0%) | 13,391 (100.0%) |
Real Estate Taxes by Mortgage Status in Lewis and Clark County
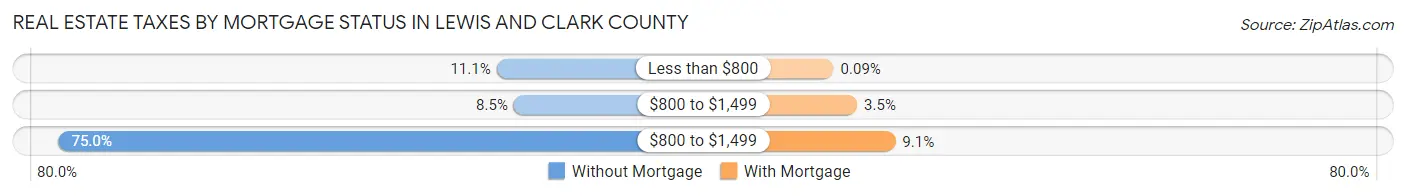
| Property Taxes | Without Mortgage | With Mortgage |
| Less than $800 | 880 (11.1%) | 12 (0.1%) |
| $800 to $1,499 | 679 (8.5%) | 471 (3.5%) |
| $800 to $1,499 | 5,975 (75.0%) | 1,220 (9.1%) |
| Total | 7,963 (100.0%) | 13,391 (100.0%) |
Health & Disability in Lewis and Clark County
Health Insurance Coverage by Age in Lewis and Clark County
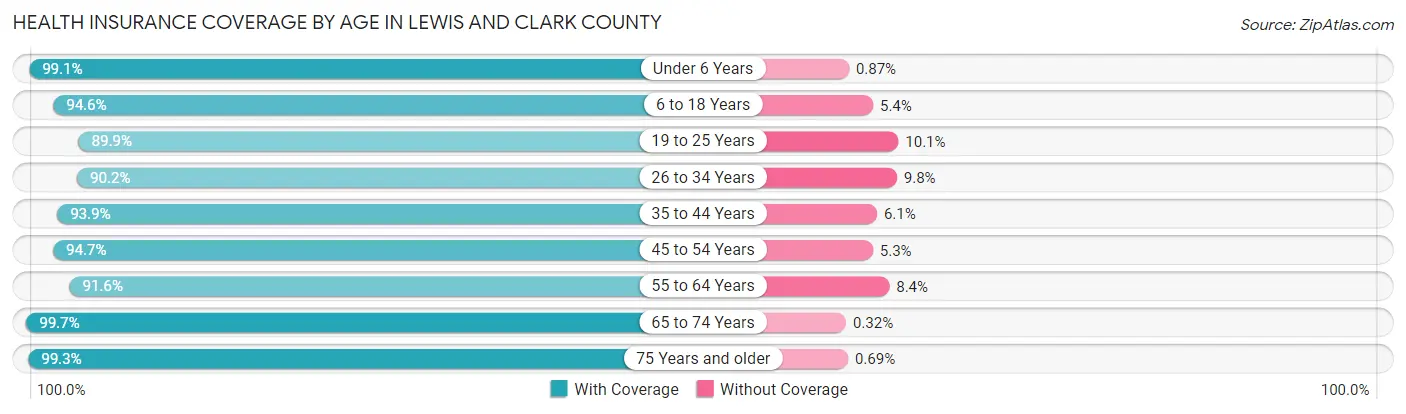
| Age Bracket | With Coverage | Without Coverage |
| Under 6 Years | 4,659 (99.1%) | 41 (0.9%) |
| 6 to 18 Years | 10,829 (94.6%) | 613 (5.4%) |
| 19 to 25 Years | 4,436 (89.9%) | 497 (10.1%) |
| 26 to 34 Years | 7,191 (90.2%) | 781 (9.8%) |
| 35 to 44 Years | 8,669 (93.9%) | 562 (6.1%) |
| 45 to 54 Years | 7,967 (94.7%) | 448 (5.3%) |
| 55 to 64 Years | 9,435 (91.6%) | 864 (8.4%) |
| 65 to 74 Years | 8,677 (99.7%) | 28 (0.3%) |
| 75 Years and older | 4,925 (99.3%) | 34 (0.7%) |
| Total | 66,788 (94.5%) | 3,868 (5.5%) |
Health Insurance Coverage by Citizenship Status in Lewis and Clark County
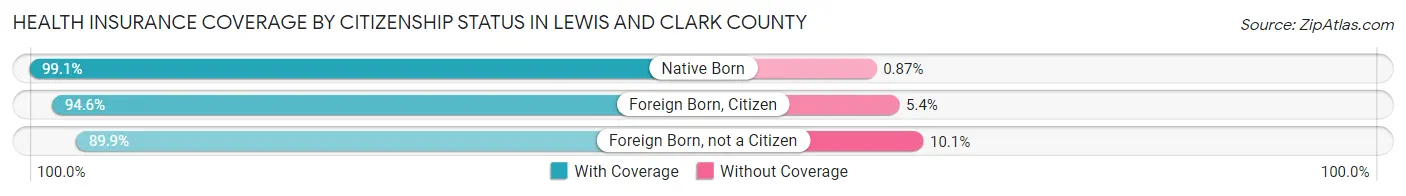
| Citizenship Status | With Coverage | Without Coverage |
| Native Born | 4,659 (99.1%) | 41 (0.9%) |
| Foreign Born, Citizen | 10,829 (94.6%) | 613 (5.4%) |
| Foreign Born, not a Citizen | 4,436 (89.9%) | 497 (10.1%) |
Health Insurance Coverage by Household Income in Lewis and Clark County
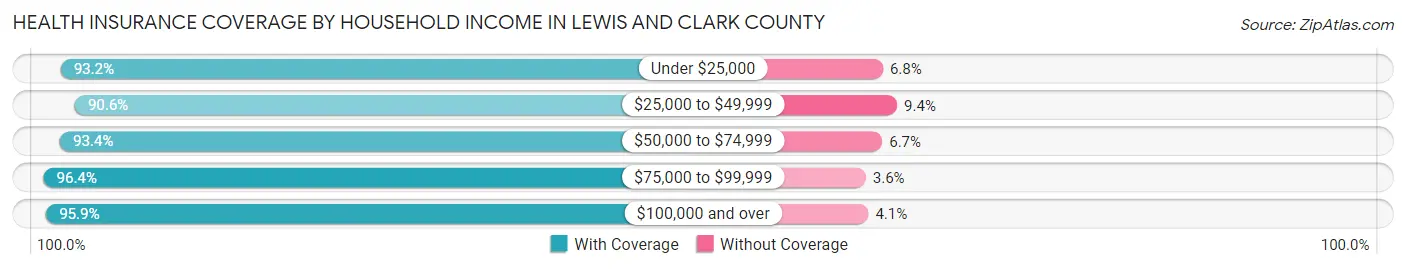
| Household Income | With Coverage | Without Coverage |
| Under $25,000 | 5,598 (93.2%) | 407 (6.8%) |
| $25,000 to $49,999 | 9,410 (90.6%) | 981 (9.4%) |
| $50,000 to $74,999 | 12,397 (93.3%) | 883 (6.7%) |
| $75,000 to $99,999 | 9,575 (96.4%) | 354 (3.6%) |
| $100,000 and over | 28,758 (95.9%) | 1,218 (4.1%) |
Public vs Private Health Insurance Coverage by Age in Lewis and Clark County
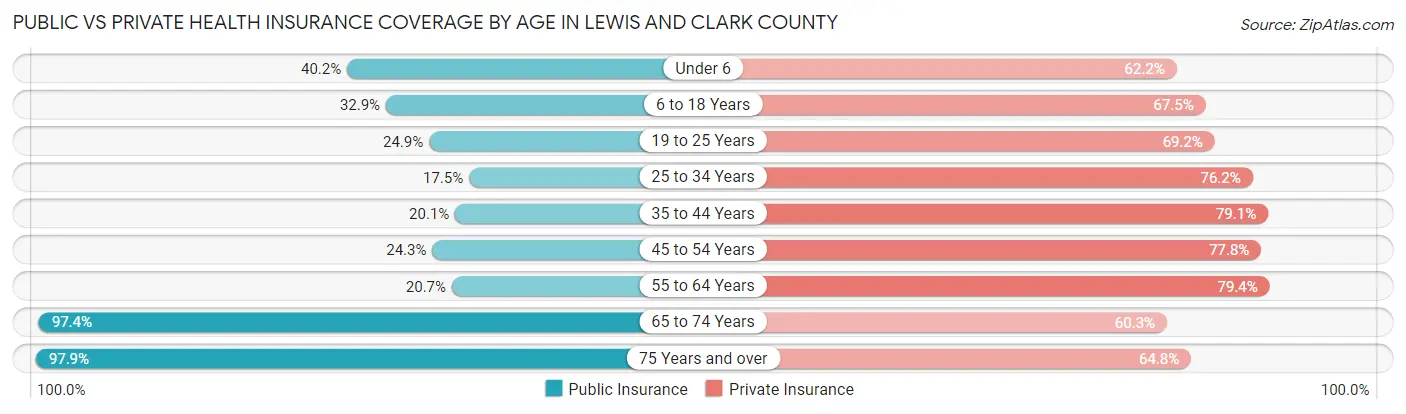
| Age Bracket | Public Insurance | Private Insurance |
| Under 6 | 1,887 (40.2%) | 2,921 (62.2%) |
| 6 to 18 Years | 3,768 (32.9%) | 7,725 (67.5%) |
| 19 to 25 Years | 1,230 (24.9%) | 3,414 (69.2%) |
| 25 to 34 Years | 1,395 (17.5%) | 6,077 (76.2%) |
| 35 to 44 Years | 1,854 (20.1%) | 7,302 (79.1%) |
| 45 to 54 Years | 2,047 (24.3%) | 6,550 (77.8%) |
| 55 to 64 Years | 2,131 (20.7%) | 8,177 (79.4%) |
| 65 to 74 Years | 8,475 (97.4%) | 5,253 (60.3%) |
| 75 Years and over | 4,855 (97.9%) | 3,215 (64.8%) |
| Total | 27,642 (39.1%) | 50,634 (71.7%) |
Disability Status by Sex by Age in Lewis and Clark County
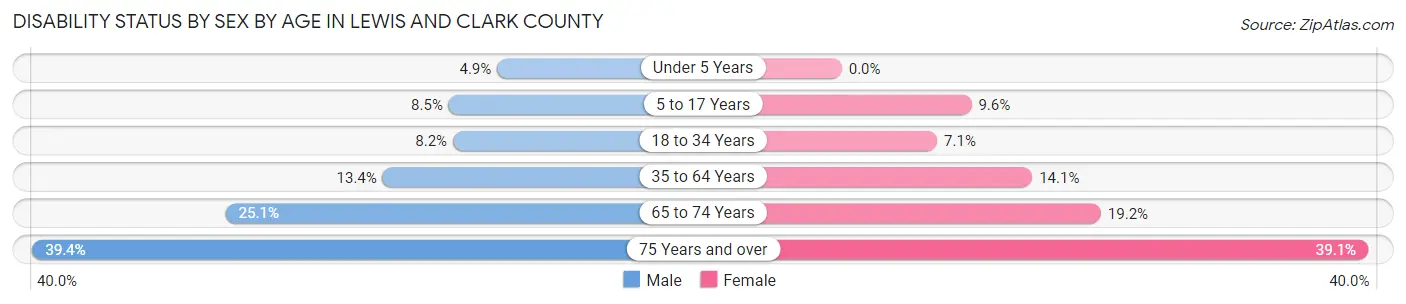
| Age Bracket | Male | Female |
| Under 5 Years | 103 (4.9%) | 0 (0.0%) |
| 5 to 17 Years | 490 (8.5%) | 528 (9.6%) |
| 18 to 34 Years | 572 (8.2%) | 490 (7.1%) |
| 35 to 64 Years | 1,866 (13.4%) | 1,986 (14.1%) |
| 65 to 74 Years | 1,085 (25.1%) | 842 (19.2%) |
| 75 Years and over | 876 (39.4%) | 1,069 (39.1%) |
Disability Class by Sex by Age in Lewis and Clark County
Disability Class: Hearing Difficulty

| Age Bracket | Male | Female |
| Under 5 Years | 20 (0.9%) | 0 (0.0%) |
| 5 to 17 Years | 22 (0.4%) | 56 (1.0%) |
| 18 to 34 Years | 91 (1.3%) | 77 (1.1%) |
| 35 to 64 Years | 829 (6.0%) | 397 (2.8%) |
| 65 to 74 Years | 454 (10.5%) | 155 (3.5%) |
| 75 Years and over | 571 (25.7%) | 497 (18.2%) |
Disability Class: Vision Difficulty
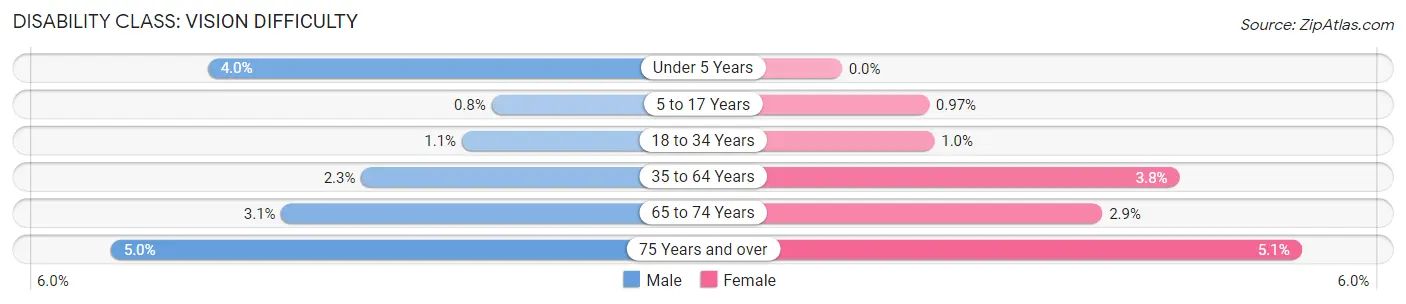
| Age Bracket | Male | Female |
| Under 5 Years | 83 (4.0%) | 0 (0.0%) |
| 5 to 17 Years | 46 (0.8%) | 53 (1.0%) |
| 18 to 34 Years | 79 (1.1%) | 71 (1.0%) |
| 35 to 64 Years | 313 (2.2%) | 528 (3.8%) |
| 65 to 74 Years | 136 (3.1%) | 127 (2.9%) |
| 75 Years and over | 112 (5.0%) | 140 (5.1%) |
Disability Class: Cognitive Difficulty
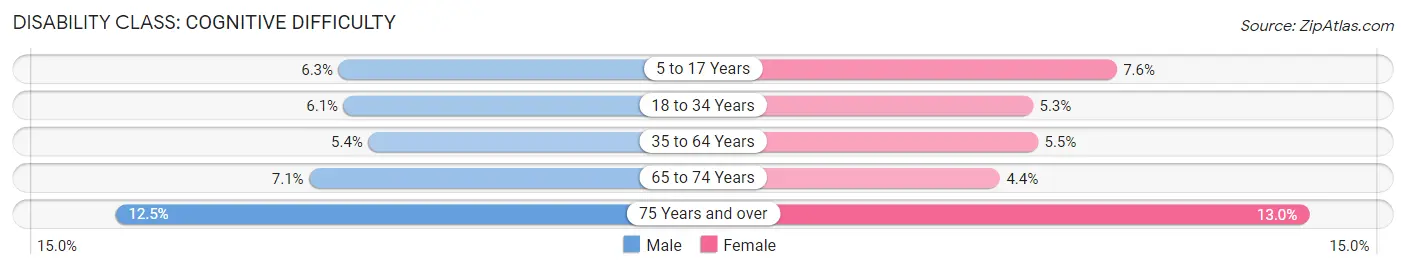
| Age Bracket | Male | Female |
| 5 to 17 Years | 360 (6.2%) | 419 (7.6%) |
| 18 to 34 Years | 426 (6.1%) | 367 (5.3%) |
| 35 to 64 Years | 753 (5.4%) | 766 (5.4%) |
| 65 to 74 Years | 306 (7.1%) | 192 (4.4%) |
| 75 Years and over | 277 (12.5%) | 356 (13.0%) |
Disability Class: Ambulatory Difficulty
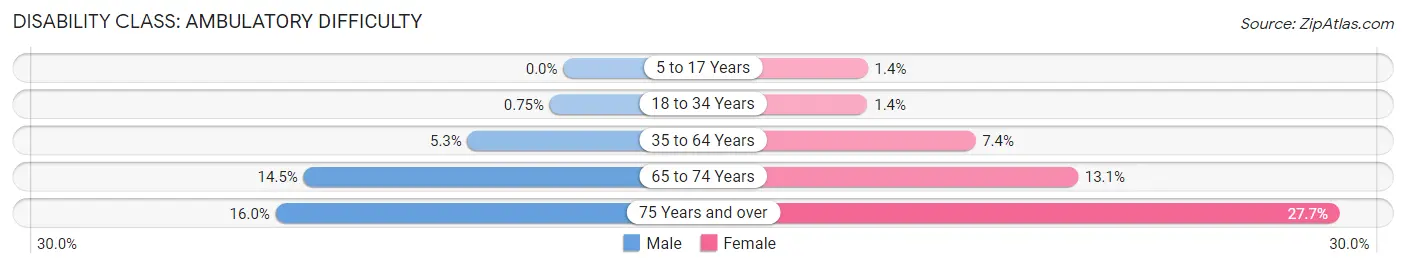
| Age Bracket | Male | Female |
| 5 to 17 Years | 0 (0.0%) | 79 (1.4%) |
| 18 to 34 Years | 52 (0.7%) | 98 (1.4%) |
| 35 to 64 Years | 741 (5.3%) | 1,043 (7.4%) |
| 65 to 74 Years | 626 (14.5%) | 575 (13.1%) |
| 75 Years and over | 356 (16.0%) | 759 (27.7%) |
Disability Class: Self-Care Difficulty
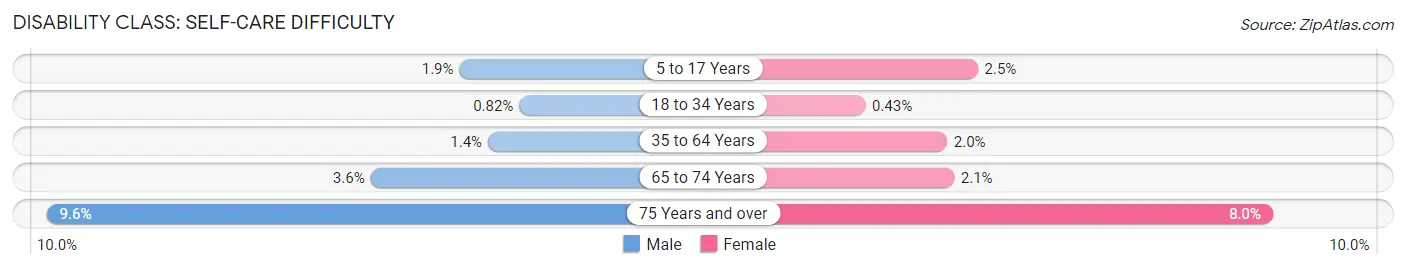
| Age Bracket | Male | Female |
| 5 to 17 Years | 111 (1.9%) | 138 (2.5%) |
| 18 to 34 Years | 57 (0.8%) | 30 (0.4%) |
| 35 to 64 Years | 195 (1.4%) | 274 (1.9%) |
| 65 to 74 Years | 155 (3.6%) | 91 (2.1%) |
| 75 Years and over | 213 (9.6%) | 219 (8.0%) |
Technology Access in Lewis and Clark County
Computing Device Access in Lewis and Clark County
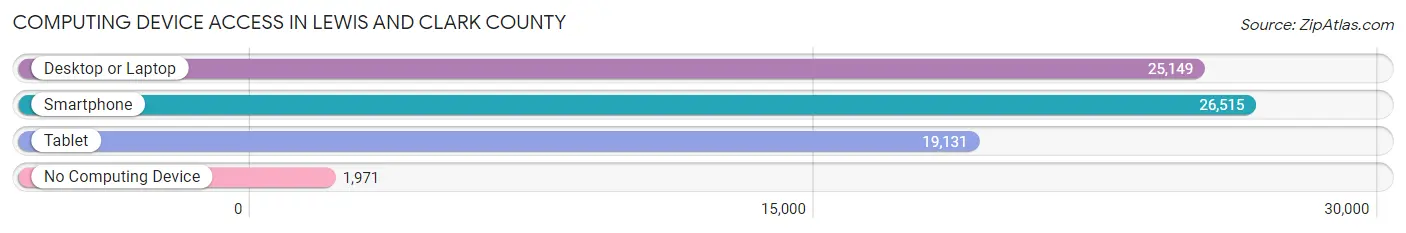
| Device Type | # Households | % Households |
| Desktop or Laptop | 25,149 | 83.1% |
| Smartphone | 26,515 | 87.6% |
| Tablet | 19,131 | 63.2% |
| No Computing Device | 1,971 | 6.5% |
| Total | 30,281 | 100.0% |
Internet Access in Lewis and Clark County
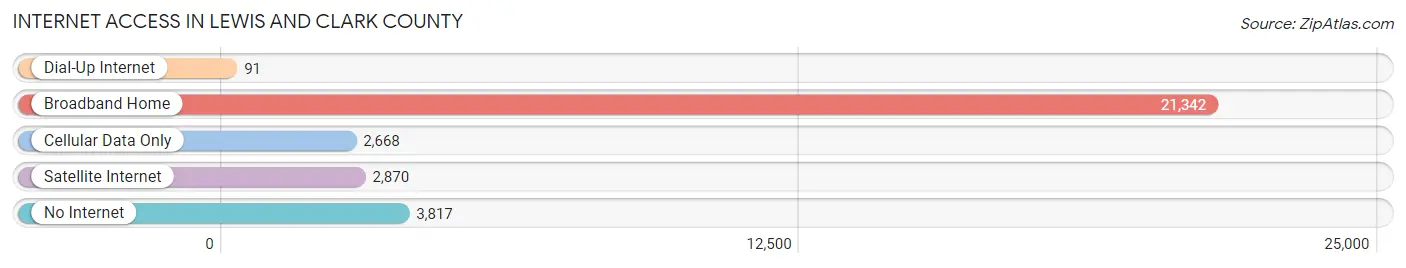
| Internet Type | # Households | % Households |
| Dial-Up Internet | 91 | 0.3% |
| Broadband Home | 21,342 | 70.5% |
| Cellular Data Only | 2,668 | 8.8% |
| Satellite Internet | 2,870 | 9.5% |
| No Internet | 3,817 | 12.6% |
| Total | 30,281 | 100.0% |
Lewis and Clark County Summary
Lewis and Clark County is located in the state of Montana, in the western United States. It is the fourth most populous county in the state, with a population of 63,395 as of the 2010 census. The county seat is Helena, the state capital. The county was named after the famous explorers Meriwether Lewis and William Clark, who explored the area in 1805.
Geography
Lewis and Clark County is located in the western part of Montana, in the Rocky Mountain region. It is bordered by Jefferson County to the north, Broadwater County to the east, Meagher County to the south, and Cascade County to the west. The county covers an area of 2,541 square miles, making it the fourth largest county in the state. The county is mostly mountainous, with the Rocky Mountains to the west and the Big Belt Mountains to the east. The highest point in the county is Mount Helena, which has an elevation of 8,058 feet. The county also contains several rivers, including the Missouri River, the Dearborn River, and the Smith River.
Climate
Lewis and Clark County has a semi-arid climate, with cold winters and hot summers. The average annual temperature is 44.3°F, with an average high of 68.2°F in July and an average low of 20.4°F in January. The average annual precipitation is 13.7 inches, with most of the precipitation falling in the spring and summer months.
Demographics
As of the 2010 census, there were 63,395 people, 25,845 households, and 16,845 families living in the county. The population density was 25 people per square mile. The racial makeup of the county was 92.3% White, 0.7% African American, 1.2% Native American, 0.7% Asian, 0.1% Pacific Islander, 3.2% from other races, and 2.0% from two or more races. Hispanic or Latino of any race were 6.2% of the population.
The median income for a household in the county was $41,945, and the median income for a family was $50,945. The per capita income for the county was $21,845. About 11.2% of families and 15.2% of the population were below the poverty line, including 20.2% of those under age 18 and 8.2% of those age 65 or over.
Economy
The economy of Lewis and Clark County is largely based on agriculture, tourism, and government services. The county is home to several large agricultural operations, including cattle ranches, wheat farms, and vegetable farms. Tourism is also an important part of the economy, with many visitors coming to the area to enjoy the natural beauty of the Rocky Mountains and the nearby rivers. The county is also home to several government offices, including the state capitol building in Helena.
The unemployment rate in Lewis and Clark County was 4.2% as of April 2021, lower than the national average of 6.1%. The median household income in the county was $51,945, higher than the national median of $57,652.
Conclusion
Lewis and Clark County is a beautiful and diverse county located in the western part of Montana. It is home to 63,395 people, and the economy is largely based on agriculture, tourism, and government services. The county is also home to several large agricultural operations, and the unemployment rate is lower than the national average. The county is a great place to live, work, and visit, and it is sure to continue to be a vibrant and prosperous part of Montana for many years to come.
Common Questions
What is Per Capita Income in Lewis and Clark County?
Per Capita income in Lewis and Clark County is $41,274.
What is the Median Family Income in Lewis and Clark County?
Median Family Income in Lewis and Clark County is $97,500.
What is the Median Household income in Lewis and Clark County?
Median Household Income in Lewis and Clark County is $71,967.
What is Income or Wage Gap in Lewis and Clark County?
Income or Wage Gap in Lewis and Clark County is 24.5%.
Women in Lewis and Clark County earn 75.5 cents for every dollar earned by a man.
What is Family Income Deficit in Lewis and Clark County?
Family Income Deficit in Lewis and Clark County is $10,146.
Families that are below poverty line in Lewis and Clark County earn $10,146 less on average than the poverty threshold level.
What is Inequality or Gini Index in Lewis and Clark County?
Inequality or Gini Index in Lewis and Clark County is 0.44.
What is the Total Population of Lewis and Clark County?
Total Population of Lewis and Clark County is 71,487.
What is the Total Male Population of Lewis and Clark County?
Total Male Population of Lewis and Clark County is 35,738.
What is the Total Female Population of Lewis and Clark County?
Total Female Population of Lewis and Clark County is 35,749.
What is the Ratio of Males per 100 Females in Lewis and Clark County?
There are 99.97 Males per 100 Females in Lewis and Clark County.
What is the Ratio of Females per 100 Males in Lewis and Clark County?
There are 100.03 Females per 100 Males in Lewis and Clark County.
What is the Median Population Age in Lewis and Clark County?
Median Population Age in Lewis and Clark County is 41.2 Years.
What is the Average Family Size in Lewis and Clark County
Average Family Size in Lewis and Clark County is 2.9 People.
What is the Average Household Size in Lewis and Clark County
Average Household Size in Lewis and Clark County is 2.3 People.
How Large is the Labor Force in Lewis and Clark County?
There are 37,667 People in the Labor Forcein in Lewis and Clark County.
What is the Percentage of People in the Labor Force in Lewis and Clark County?
65.1% of People are in the Labor Force in Lewis and Clark County.
What is the Unemployment Rate in Lewis and Clark County?
Unemployment Rate in Lewis and Clark County is 3.5%.