Rosebud County, MT Map & Demographics
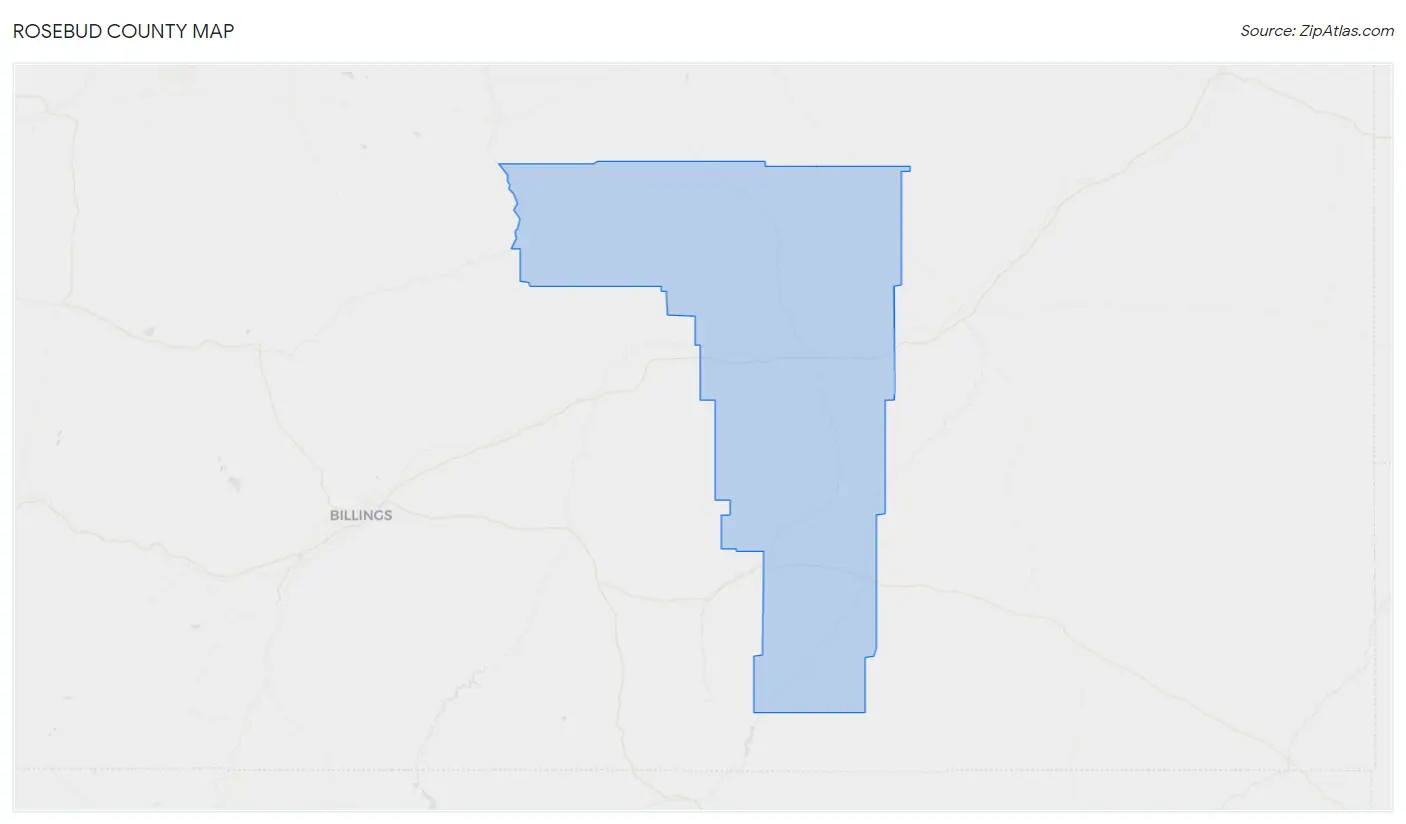
Rosebud County Map
Rosebud County Overview
$27,655
PER CAPITA INCOME
$66,975
AVG FAMILY INCOME
$57,656
AVG HOUSEHOLD INCOME
32.8%
WAGE / INCOME GAP [ % ]
67.2¢/ $1
WAGE / INCOME GAP [ $ ]
$17,253
FAMILY INCOME DEFICIT
0.45
INEQUALITY / GINI INDEX
8,310
TOTAL POPULATION
4,176
MALE POPULATION
4,134
FEMALE POPULATION
101.02
MALES / 100 FEMALES
98.99
FEMALES / 100 MALES
36.4
MEDIAN AGE
3.5
AVG FAMILY SIZE
2.7
AVG HOUSEHOLD SIZE
3,617
LABOR FORCE [ PEOPLE ]
58.8%
PERCENT IN LABOR FORCE
9.2%
UNEMPLOYMENT RATE
Rosebud County Area Codes
Income in Rosebud County
Income Overview in Rosebud County
Per Capita Income in Rosebud County is $27,655, while median incomes of families and households are $66,975 and $57,656 respectively.
| Characteristic | Number | Measure |
| Per Capita Income | 8,310 | $27,655 |
| Median Family Income | 1,937 | $66,975 |
| Mean Family Income | 1,937 | $82,974 |
| Median Household Income | 3,043 | $57,656 |
| Mean Household Income | 3,043 | $71,825 |
| Income Deficit | 1,937 | $17,253 |
| Wage / Income Gap (%) | 8,310 | 32.83% |
| Wage / Income Gap ($) | 8,310 | 67.17¢ per $1 |
| Gini / Inequality Index | 8,310 | 0.45 |
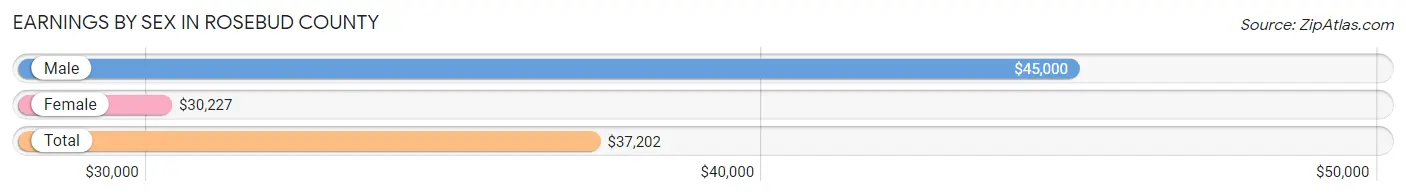
Earnings by Sex in Rosebud County
Average Earnings in Rosebud County are $37,202, $45,000 for men and $30,227 for women, a difference of 32.8%.
| Sex | Number | Average Earnings |
| Male | 1,930 (53.5%) | $45,000 |
| Female | 1,680 (46.5%) | $30,227 |
| Total | 3,610 (100.0%) | $37,202 |
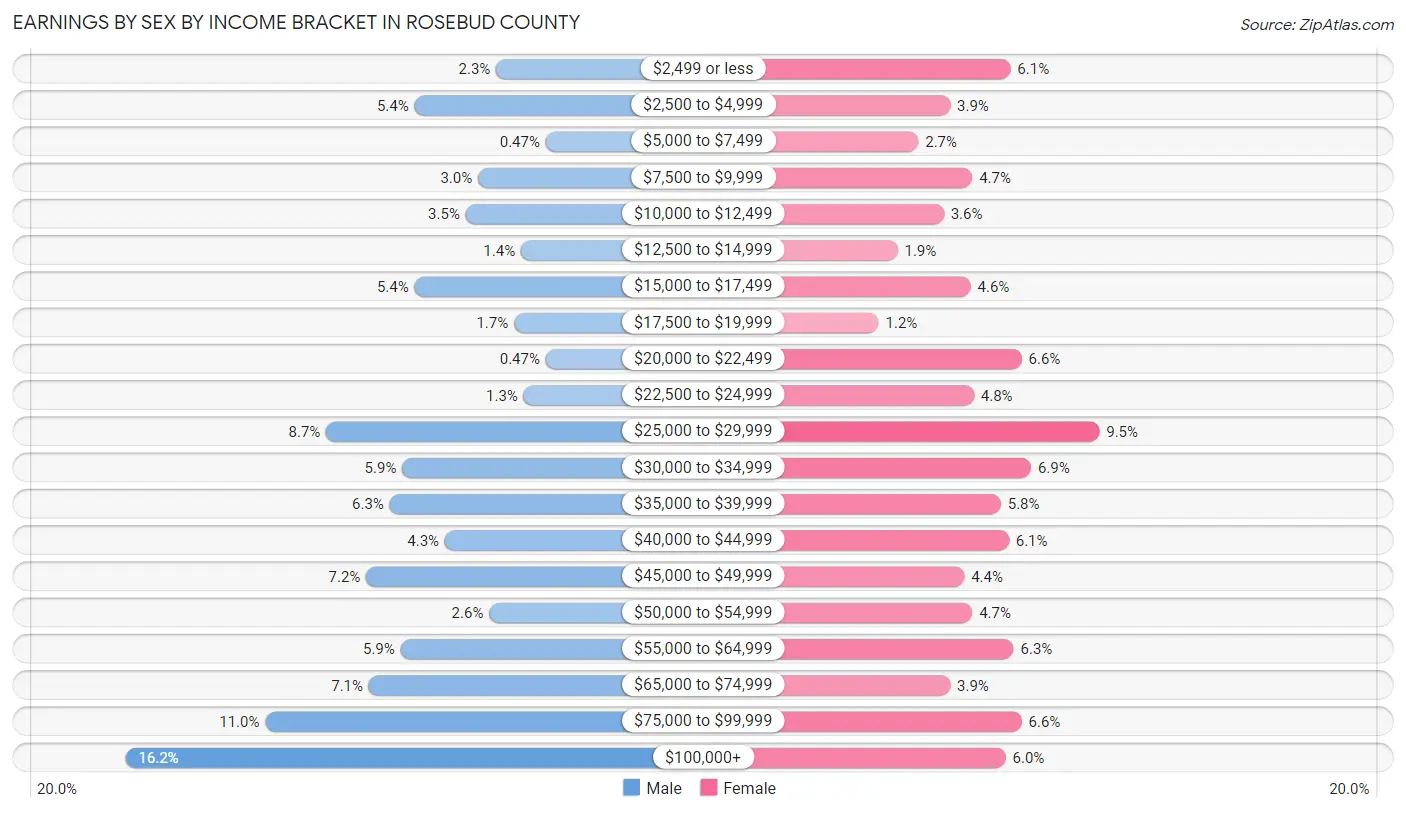
Earnings by Sex by Income Bracket in Rosebud County
The most common earnings brackets in Rosebud County are $100,000+ for men (313 | 16.2%) and $25,000 to $29,999 for women (159 | 9.5%).
| Income | Male | Female |
| $2,499 or less | 45 (2.3%) | 103 (6.1%) |
| $2,500 to $4,999 | 104 (5.4%) | 65 (3.9%) |
| $5,000 to $7,499 | 9 (0.5%) | 45 (2.7%) |
| $7,500 to $9,999 | 58 (3.0%) | 79 (4.7%) |
| $10,000 to $12,499 | 67 (3.5%) | 61 (3.6%) |
| $12,500 to $14,999 | 27 (1.4%) | 32 (1.9%) |
| $15,000 to $17,499 | 104 (5.4%) | 78 (4.6%) |
| $17,500 to $19,999 | 32 (1.7%) | 20 (1.2%) |
| $20,000 to $22,499 | 9 (0.5%) | 110 (6.6%) |
| $22,500 to $24,999 | 25 (1.3%) | 80 (4.8%) |
| $25,000 to $29,999 | 168 (8.7%) | 159 (9.5%) |
| $30,000 to $34,999 | 113 (5.9%) | 116 (6.9%) |
| $35,000 to $39,999 | 122 (6.3%) | 97 (5.8%) |
| $40,000 to $44,999 | 82 (4.3%) | 102 (6.1%) |
| $45,000 to $49,999 | 139 (7.2%) | 74 (4.4%) |
| $50,000 to $54,999 | 50 (2.6%) | 79 (4.7%) |
| $55,000 to $64,999 | 114 (5.9%) | 105 (6.2%) |
| $65,000 to $74,999 | 137 (7.1%) | 65 (3.9%) |
| $75,000 to $99,999 | 212 (11.0%) | 110 (6.6%) |
| $100,000+ | 313 (16.2%) | 100 (5.9%) |
| Total | 1,930 (100.0%) | 1,680 (100.0%) |
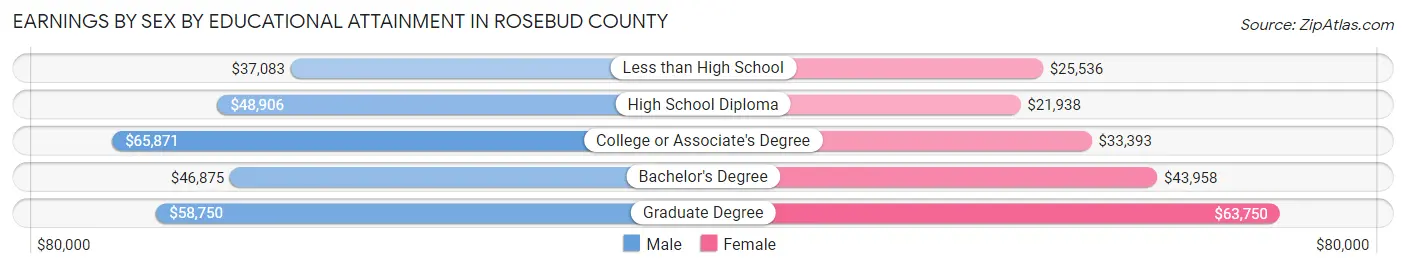
Earnings by Sex by Educational Attainment in Rosebud County
Average earnings in Rosebud County are $51,538 for men and $35,366 for women, a difference of 31.4%. Men with an educational attainment of college or associate's degree enjoy the highest average annual earnings of $65,871, while those with less than high school education earn the least with $37,083. Women with an educational attainment of graduate degree earn the most with the average annual earnings of $63,750, while those with high school diploma education have the smallest earnings of $21,938.
| Educational Attainment | Male Income | Female Income |
| Less than High School | $37,083 | $25,536 |
| High School Diploma | $48,906 | $21,938 |
| College or Associate's Degree | $65,871 | $33,393 |
| Bachelor's Degree | $46,875 | $43,958 |
| Graduate Degree | $58,750 | $63,750 |
| Total | $51,538 | $35,366 |
Family Income in Rosebud County
Family Income Brackets in Rosebud County
According to the Rosebud County family income data, there are 447 families falling into the $100,000 to $149,999 income range, which is the most common income bracket and makes up 23.1% of all families. Conversely, the $10,000 to $14,999 income bracket is the least frequent group with only 37 families (1.9%) belonging to this category.
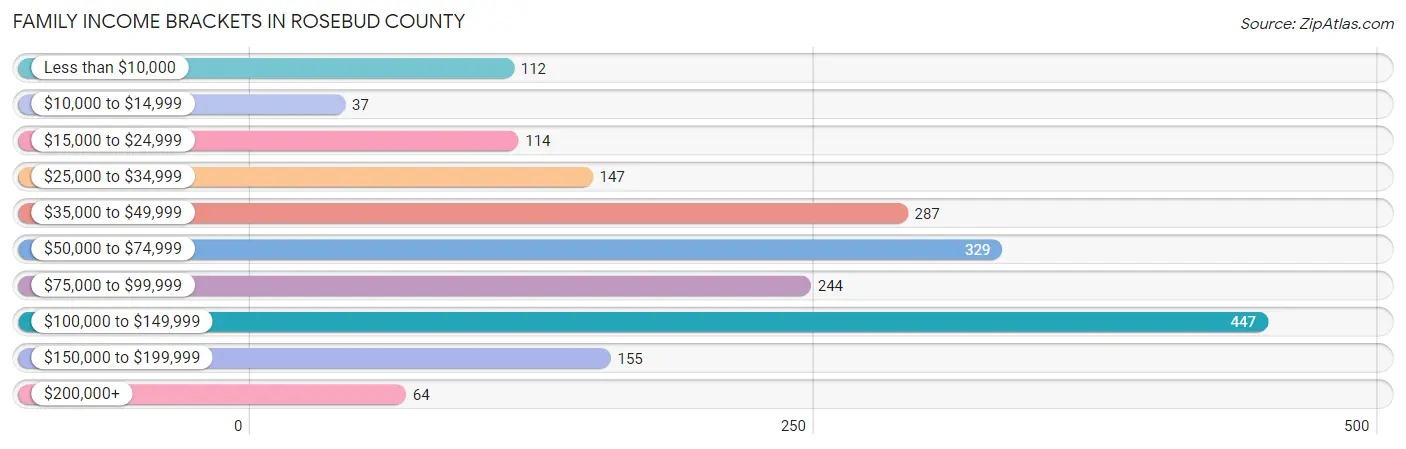
| Income Bracket | # Families | % Families |
| Less than $10,000 | 112 | 5.8% |
| $10,000 to $14,999 | 37 | 1.9% |
| $15,000 to $24,999 | 114 | 5.9% |
| $25,000 to $34,999 | 147 | 7.6% |
| $35,000 to $49,999 | 287 | 14.8% |
| $50,000 to $74,999 | 329 | 17.0% |
| $75,000 to $99,999 | 244 | 12.6% |
| $100,000 to $149,999 | 447 | 23.1% |
| $150,000 to $199,999 | 155 | 8.0% |
| $200,000+ | 64 | 3.3% |
Family Income by Famaliy Size in Rosebud County
6-person families (63 | 3.3%) account for the highest median family income in Rosebud County with $90,417 per family, while 2-person families (866 | 44.7%) have the highest median income of $32,298 per family member.
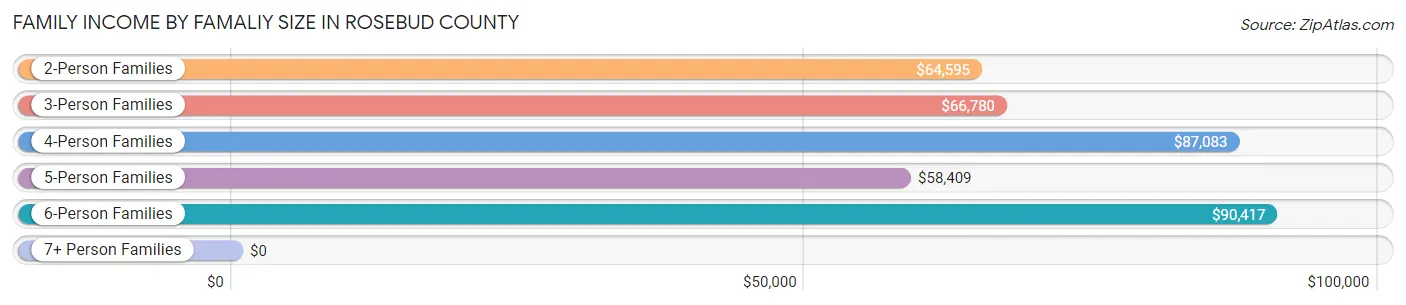
| Income Bracket | # Families | Median Income |
| 2-Person Families | 866 (44.7%) | $64,595 |
| 3-Person Families | 399 (20.6%) | $66,780 |
| 4-Person Families | 291 (15.0%) | $87,083 |
| 5-Person Families | 220 (11.4%) | $58,409 |
| 6-Person Families | 63 (3.3%) | $90,417 |
| 7+ Person Families | 98 (5.1%) | $0 |
| Total | 1,937 (100.0%) | $66,975 |
Family Income by Number of Earners in Rosebud County
The median family income in Rosebud County is $66,975, with families comprising 3+ earners (165) having the highest median family income of $152,798, while families with no earners (444) have the lowest median family income of $32,857, accounting for 8.5% and 22.9% of families, respectively.
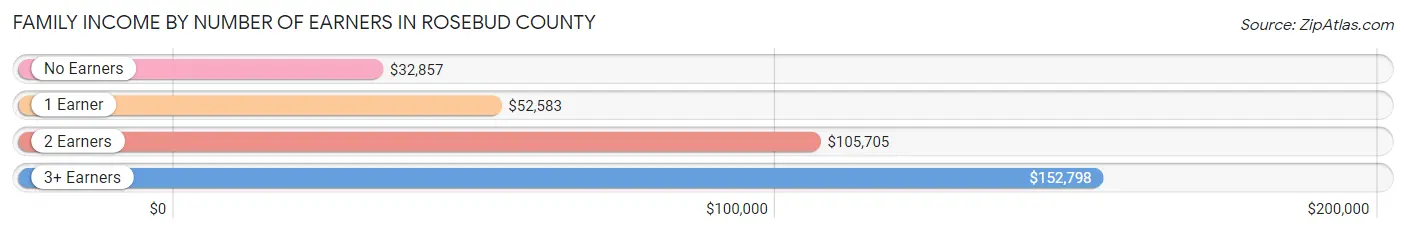
| Number of Earners | # Families | Median Income |
| No Earners | 444 (22.9%) | $32,857 |
| 1 Earner | 683 (35.3%) | $52,583 |
| 2 Earners | 645 (33.3%) | $105,705 |
| 3+ Earners | 165 (8.5%) | $152,798 |
| Total | 1,937 (100.0%) | $66,975 |
Household Income in Rosebud County
Household Income Brackets in Rosebud County
With 529 households falling in the category, the $50,000 to $74,999 income range is the most frequent in Rosebud County, accounting for 17.4% of all households. In contrast, only 122 households (4.0%) fall into the $200,000+ income bracket, making it the least populous group.
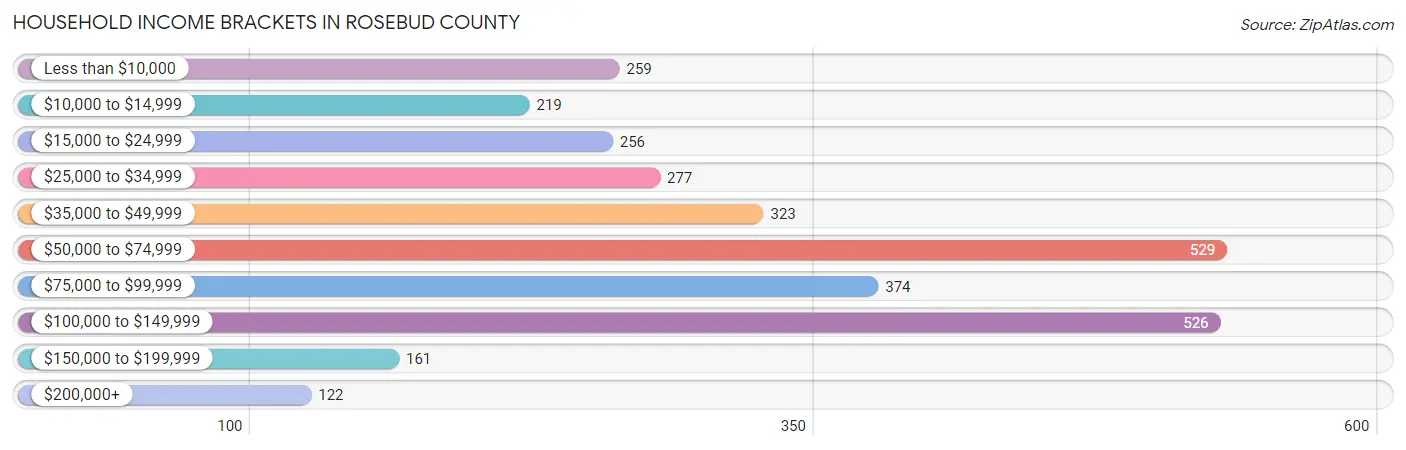
| Income Bracket | # Households | % Households |
| Less than $10,000 | 259 | 8.5% |
| $10,000 to $14,999 | 219 | 7.2% |
| $15,000 to $24,999 | 256 | 8.4% |
| $25,000 to $34,999 | 277 | 9.1% |
| $35,000 to $49,999 | 323 | 10.6% |
| $50,000 to $74,999 | 529 | 17.4% |
| $75,000 to $99,999 | 374 | 12.3% |
| $100,000 to $149,999 | 526 | 17.3% |
| $150,000 to $199,999 | 161 | 5.3% |
| $200,000+ | 122 | 4.0% |
Household Income by Householder Age in Rosebud County
The median household income in Rosebud County is $57,656, with the highest median household income of $69,228 found in the 45 to 64 years age bracket for the primary householder. A total of 1,135 households (37.3%) fall into this category. Meanwhile, the 15 to 24 years age bracket for the primary householder has the lowest median household income of $31,806, with 131 households (4.3%) in this group.
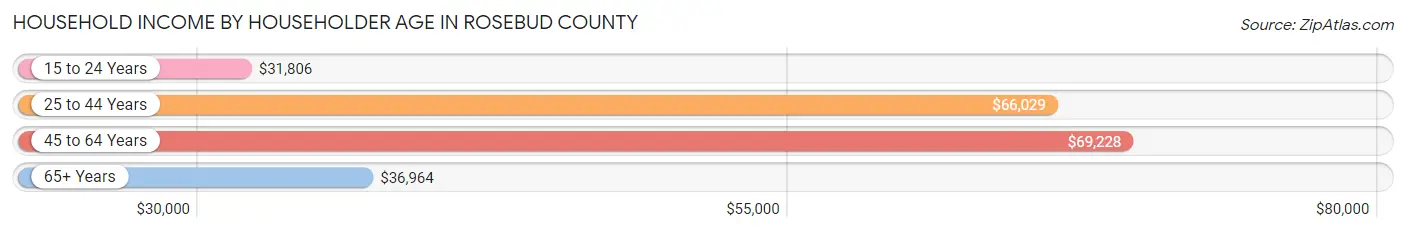
| Income Bracket | # Households | Median Income |
| 15 to 24 Years | 131 (4.3%) | $31,806 |
| 25 to 44 Years | 852 (28.0%) | $66,029 |
| 45 to 64 Years | 1,135 (37.3%) | $69,228 |
| 65+ Years | 925 (30.4%) | $36,964 |
| Total | 3,043 (100.0%) | $57,656 |
Poverty in Rosebud County
Income Below Poverty by Sex and Age in Rosebud County
With 19.1% poverty level for males and 21.6% for females among the residents of Rosebud County, 5 year old males and 5 year old females are the most vulnerable to poverty, with 46 males (56.1%) and 67 females (68.4%) in their respective age groups living below the poverty level.
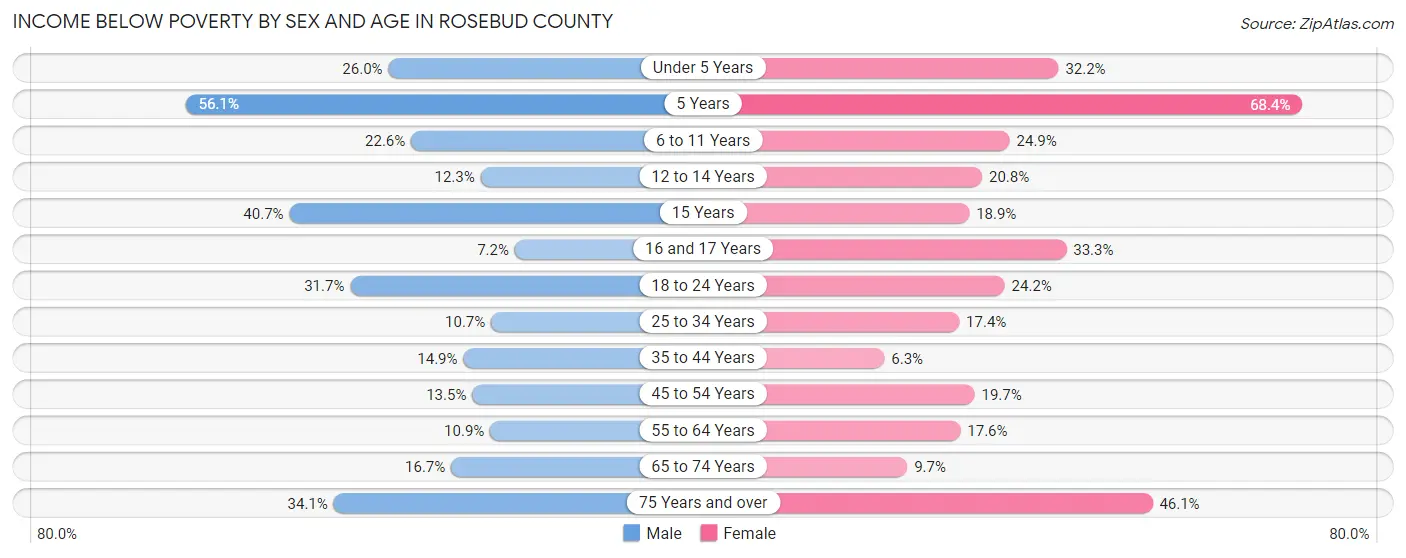
| Age Bracket | Male | Female |
| Under 5 Years | 99 (26.0%) | 92 (32.2%) |
| 5 Years | 46 (56.1%) | 67 (68.4%) |
| 6 to 11 Years | 78 (22.6%) | 81 (24.9%) |
| 12 to 14 Years | 30 (12.3%) | 45 (20.8%) |
| 15 Years | 24 (40.7%) | 14 (18.9%) |
| 16 and 17 Years | 8 (7.2%) | 48 (33.3%) |
| 18 to 24 Years | 125 (31.7%) | 88 (24.2%) |
| 25 to 34 Years | 41 (10.7%) | 80 (17.4%) |
| 35 to 44 Years | 68 (14.8%) | 33 (6.3%) |
| 45 to 54 Years | 59 (13.5%) | 68 (19.7%) |
| 55 to 64 Years | 60 (10.9%) | 103 (17.6%) |
| 65 to 74 Years | 78 (16.7%) | 37 (9.7%) |
| 75 Years and over | 73 (34.1%) | 125 (46.1%) |
| Total | 789 (19.1%) | 881 (21.6%) |
Income Above Poverty by Sex and Age in Rosebud County
According to the poverty statistics in Rosebud County, males aged 16 and 17 years and females aged 35 to 44 years are the age groups that are most secure financially, with 92.8% of males and 93.7% of females in these age groups living above the poverty line.
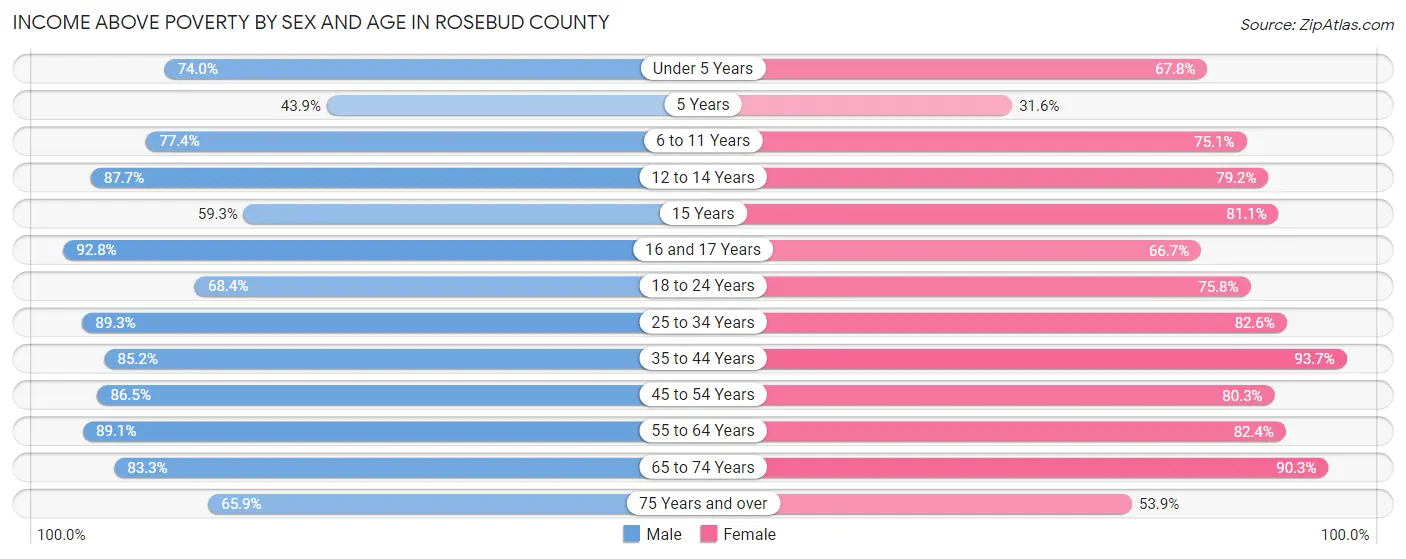
| Age Bracket | Male | Female |
| Under 5 Years | 282 (74.0%) | 194 (67.8%) |
| 5 Years | 36 (43.9%) | 31 (31.6%) |
| 6 to 11 Years | 267 (77.4%) | 244 (75.1%) |
| 12 to 14 Years | 214 (87.7%) | 171 (79.2%) |
| 15 Years | 35 (59.3%) | 60 (81.1%) |
| 16 and 17 Years | 103 (92.8%) | 96 (66.7%) |
| 18 to 24 Years | 270 (68.3%) | 276 (75.8%) |
| 25 to 34 Years | 341 (89.3%) | 379 (82.6%) |
| 35 to 44 Years | 390 (85.2%) | 489 (93.7%) |
| 45 to 54 Years | 377 (86.5%) | 277 (80.3%) |
| 55 to 64 Years | 492 (89.1%) | 482 (82.4%) |
| 65 to 74 Years | 390 (83.3%) | 344 (90.3%) |
| 75 Years and over | 141 (65.9%) | 146 (53.9%) |
| Total | 3,338 (80.9%) | 3,189 (78.3%) |
Income Below Poverty Among Married-Couple Families in Rosebud County
The poverty statistics for married-couple families in Rosebud County show that 8.2% or 123 of the total 1,496 families live below the poverty line. Families with 5 or more children have the highest poverty rate of 25.5%, comprising of 14 families. On the other hand, families with 1 or 2 children have the lowest poverty rate of 2.7%, which includes 11 families.
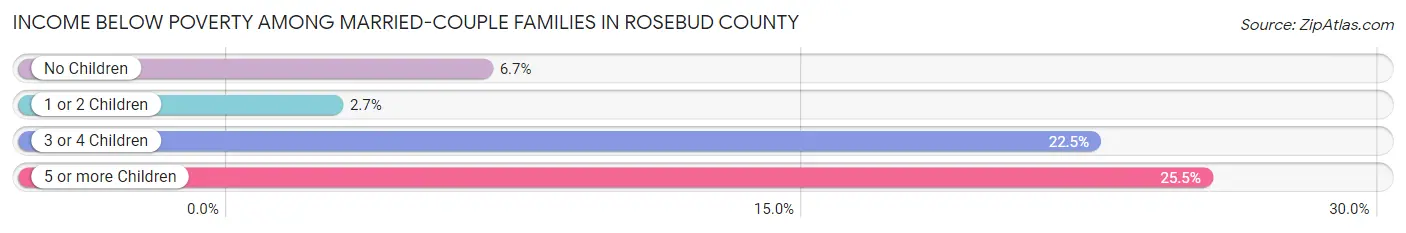
| Children | Above Poverty | Below Poverty |
| No Children | 800 (93.3%) | 57 (6.7%) |
| 1 or 2 Children | 391 (97.3%) | 11 (2.7%) |
| 3 or 4 Children | 141 (77.5%) | 41 (22.5%) |
| 5 or more Children | 41 (74.6%) | 14 (25.5%) |
| Total | 1,373 (91.8%) | 123 (8.2%) |
Income Below Poverty Among Single-Parent Households in Rosebud County
According to the poverty data in Rosebud County, 10.7% or 16 single-father households and 35.0% or 102 single-mother households are living below the poverty line. Among single-father households, those with no children have the highest poverty rate, with 13 households (19.7%) experiencing poverty. Likewise, among single-mother households, those with 5 or more children have the highest poverty rate, with 11 households (100.0%) falling below the poverty line.
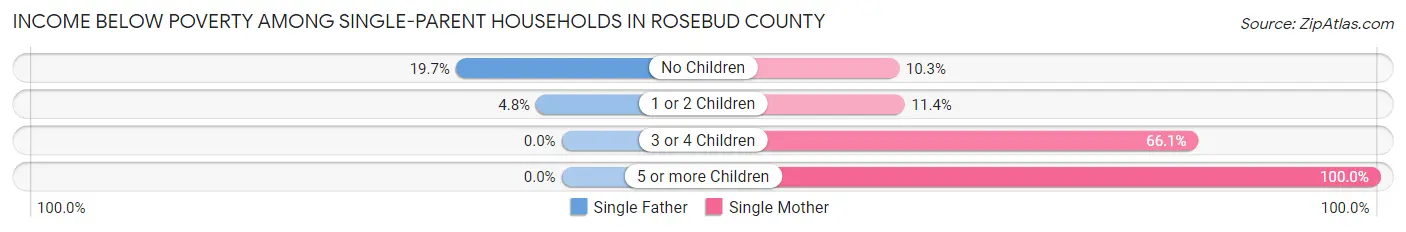
| Children | Single Father | Single Mother |
| No Children | 13 (19.7%) | 4 (10.3%) |
| 1 or 2 Children | 3 (4.8%) | 15 (11.4%) |
| 3 or 4 Children | 0 (0.0%) | 72 (66.1%) |
| 5 or more Children | 0 (0.0%) | 11 (100.0%) |
| Total | 16 (10.7%) | 102 (35.0%) |
Income Below Poverty Among Married-Couple vs Single-Parent Households in Rosebud County
The poverty data for Rosebud County shows that 123 of the married-couple family households (8.2%) and 118 of the single-parent households (26.8%) are living below the poverty level. Within the married-couple family households, those with 5 or more children have the highest poverty rate, with 14 households (25.5%) falling below the poverty line. Among the single-parent households, those with 3 or 4 children have the highest poverty rate, with 72 household (59.5%) living below poverty.
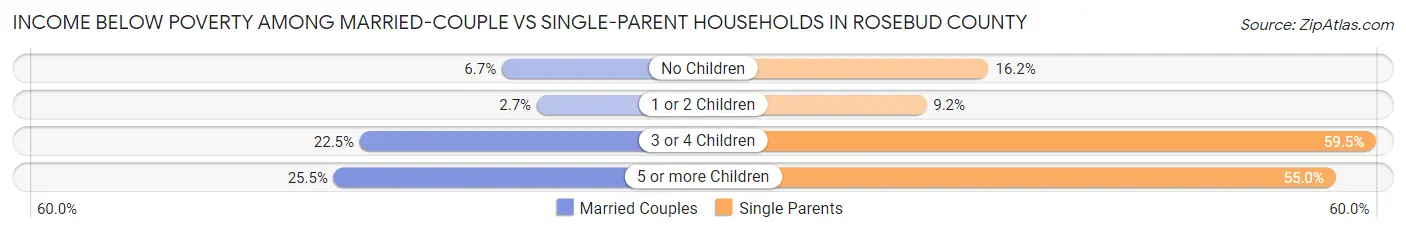
| Children | Married-Couple Families | Single-Parent Households |
| No Children | 57 (6.7%) | 17 (16.2%) |
| 1 or 2 Children | 11 (2.7%) | 18 (9.2%) |
| 3 or 4 Children | 41 (22.5%) | 72 (59.5%) |
| 5 or more Children | 14 (25.5%) | 11 (55.0%) |
| Total | 123 (8.2%) | 118 (26.8%) |
Race in Rosebud County
The most populous races in Rosebud County are White / Caucasian (4,463 | 53.7%), Native / Alaskan (3,176 | 38.2%), and Two or more Races (481 | 5.8%).
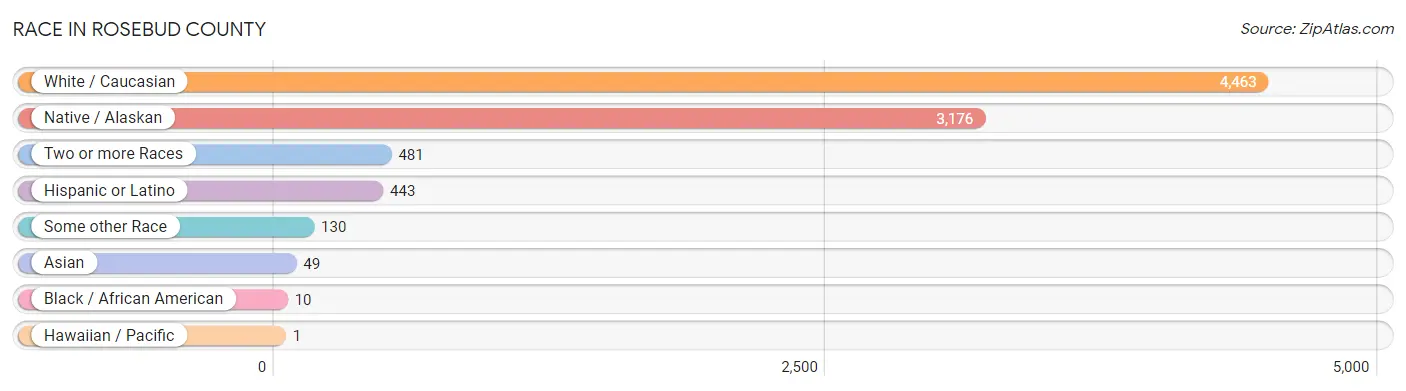
| Race | # Population | % Population |
| Asian | 49 | 0.6% |
| Black / African American | 10 | 0.1% |
| Hawaiian / Pacific | 1 | 0.0% |
| Hispanic or Latino | 443 | 5.3% |
| Native / Alaskan | 3,176 | 38.2% |
| White / Caucasian | 4,463 | 53.7% |
| Two or more Races | 481 | 5.8% |
| Some other Race | 130 | 1.6% |
| Total | 8,310 | 100.0% |
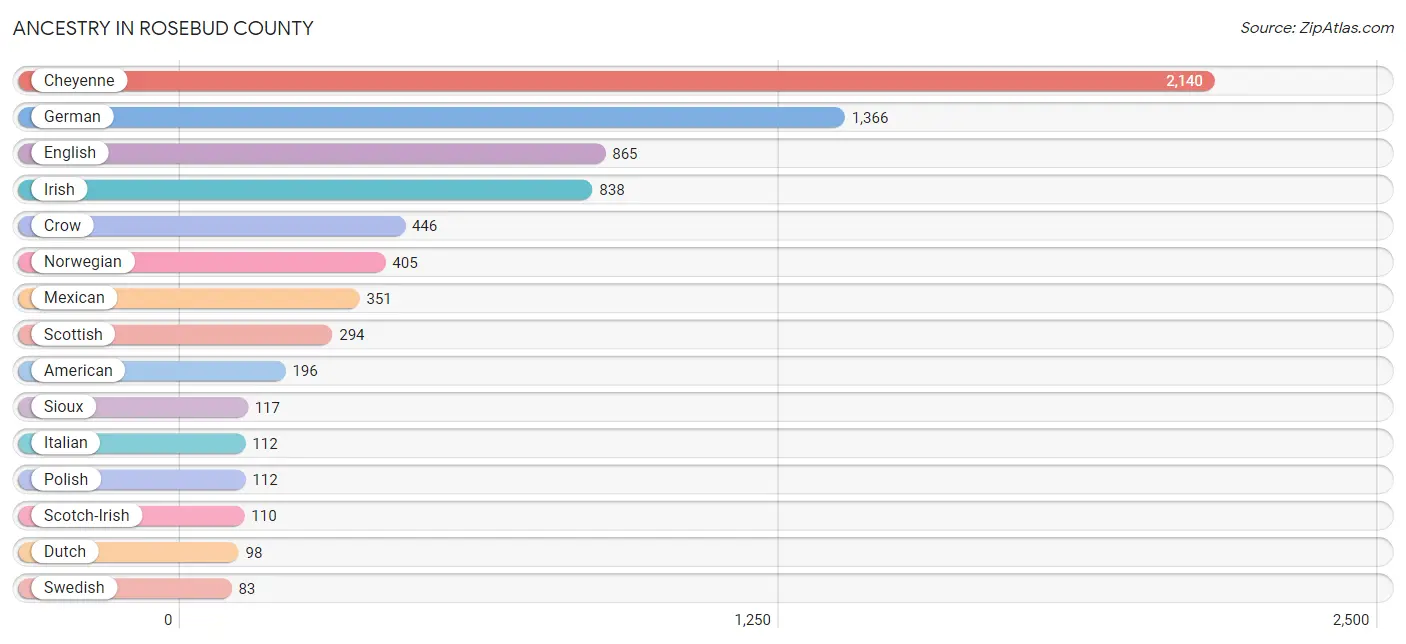
Ancestry in Rosebud County
The most populous ancestries reported in Rosebud County are Cheyenne (2,140 | 25.8%), German (1,366 | 16.4%), English (865 | 10.4%), Irish (838 | 10.1%), and Crow (446 | 5.4%), together accounting for 68.0% of all Rosebud County residents.
| Ancestry | # Population | % Population |
| Aleut | 18 | 0.2% |
| American | 196 | 2.4% |
| Arapaho | 27 | 0.3% |
| Belgian | 27 | 0.3% |
| Blackfeet | 10 | 0.1% |
| Canadian | 4 | 0.1% |
| Cheyenne | 2,140 | 25.8% |
| Chippewa | 41 | 0.5% |
| Cree | 25 | 0.3% |
| Creek | 13 | 0.2% |
| Croatian | 8 | 0.1% |
| Crow | 446 | 5.4% |
| Cuban | 9 | 0.1% |
| Czech | 2 | 0.0% |
| Czechoslovakian | 15 | 0.2% |
| Danish | 63 | 0.8% |
| Delaware | 15 | 0.2% |
| Dutch | 98 | 1.2% |
| Eastern European | 5 | 0.1% |
| English | 865 | 10.4% |
| European | 56 | 0.7% |
| Finnish | 24 | 0.3% |
| French | 63 | 0.8% |
| French Canadian | 74 | 0.9% |
| German | 1,366 | 16.4% |
| German Russian | 19 | 0.2% |
| Greek | 6 | 0.1% |
| Hungarian | 2 | 0.0% |
| Irish | 838 | 10.1% |
| Italian | 112 | 1.3% |
| Kiowa | 21 | 0.3% |
| Korean | 49 | 0.6% |
| Mexican | 351 | 4.2% |
| Native Hawaiian | 1 | 0.0% |
| Navajo | 46 | 0.5% |
| Northern European | 1 | 0.0% |
| Norwegian | 405 | 4.9% |
| Ottawa | 16 | 0.2% |
| Polish | 112 | 1.3% |
| Portuguese | 15 | 0.2% |
| Puerto Rican | 10 | 0.1% |
| Russian | 59 | 0.7% |
| Scandinavian | 12 | 0.1% |
| Scotch-Irish | 110 | 1.3% |
| Scottish | 294 | 3.5% |
| Shoshone | 22 | 0.3% |
| Sioux | 117 | 1.4% |
| Slavic | 24 | 0.3% |
| South American | 73 | 0.9% |
| Swedish | 83 | 1.0% |
| Swiss | 73 | 0.9% |
| Ukrainian | 20 | 0.2% |
| Venezuelan | 73 | 0.9% |
| Welsh | 56 | 0.7% |
| Yugoslavian | 1 | 0.0% | View All 55 Rows |
Immigrants in Rosebud County
The most numerous immigrant groups reported in Rosebud County came from Latin America (83 | 1.0%), South America (52 | 0.6%), Venezuela (52 | 0.6%), Asia (35 | 0.4%), and Philippines (35 | 0.4%), together accounting for 3.1% of all Rosebud County residents.
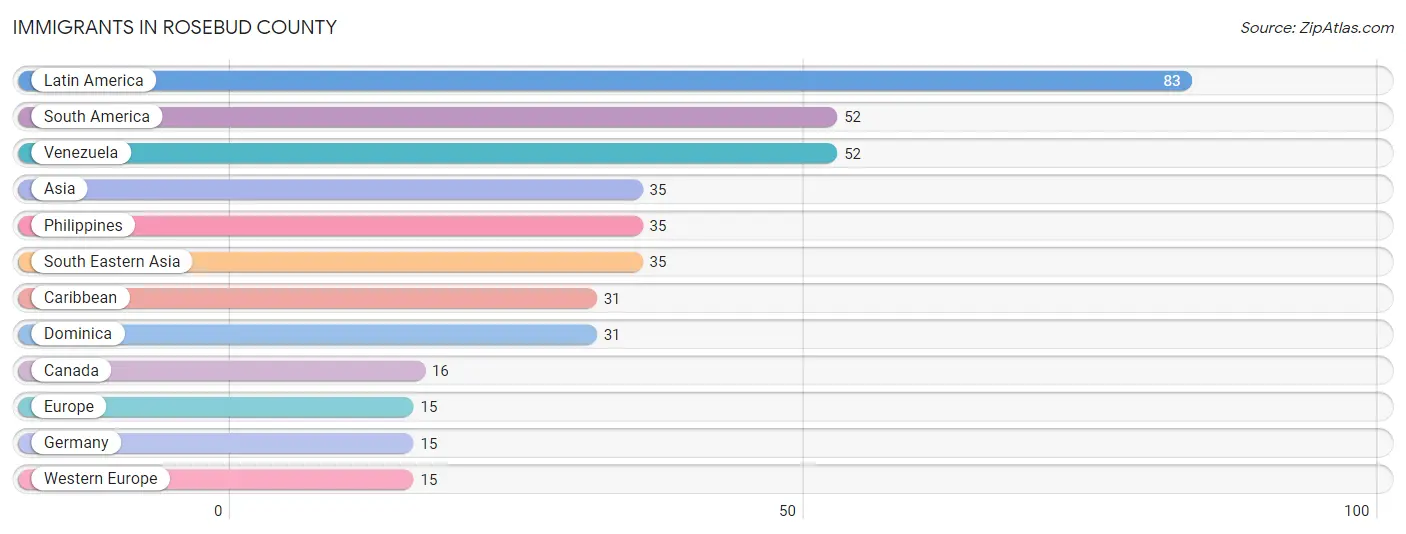
| Immigration Origin | # Population | % Population |
| Asia | 35 | 0.4% |
| Canada | 16 | 0.2% |
| Caribbean | 31 | 0.4% |
| Dominica | 31 | 0.4% |
| Europe | 15 | 0.2% |
| Germany | 15 | 0.2% |
| Latin America | 83 | 1.0% |
| Philippines | 35 | 0.4% |
| South America | 52 | 0.6% |
| South Eastern Asia | 35 | 0.4% |
| Venezuela | 52 | 0.6% |
| Western Europe | 15 | 0.2% | View All 12 Rows |
Sex and Age in Rosebud County
Sex and Age in Rosebud County
The most populous age groups in Rosebud County are Under 5 Years (381 | 9.1%) for men and 10 to 14 Years (431 | 10.4%) for women.
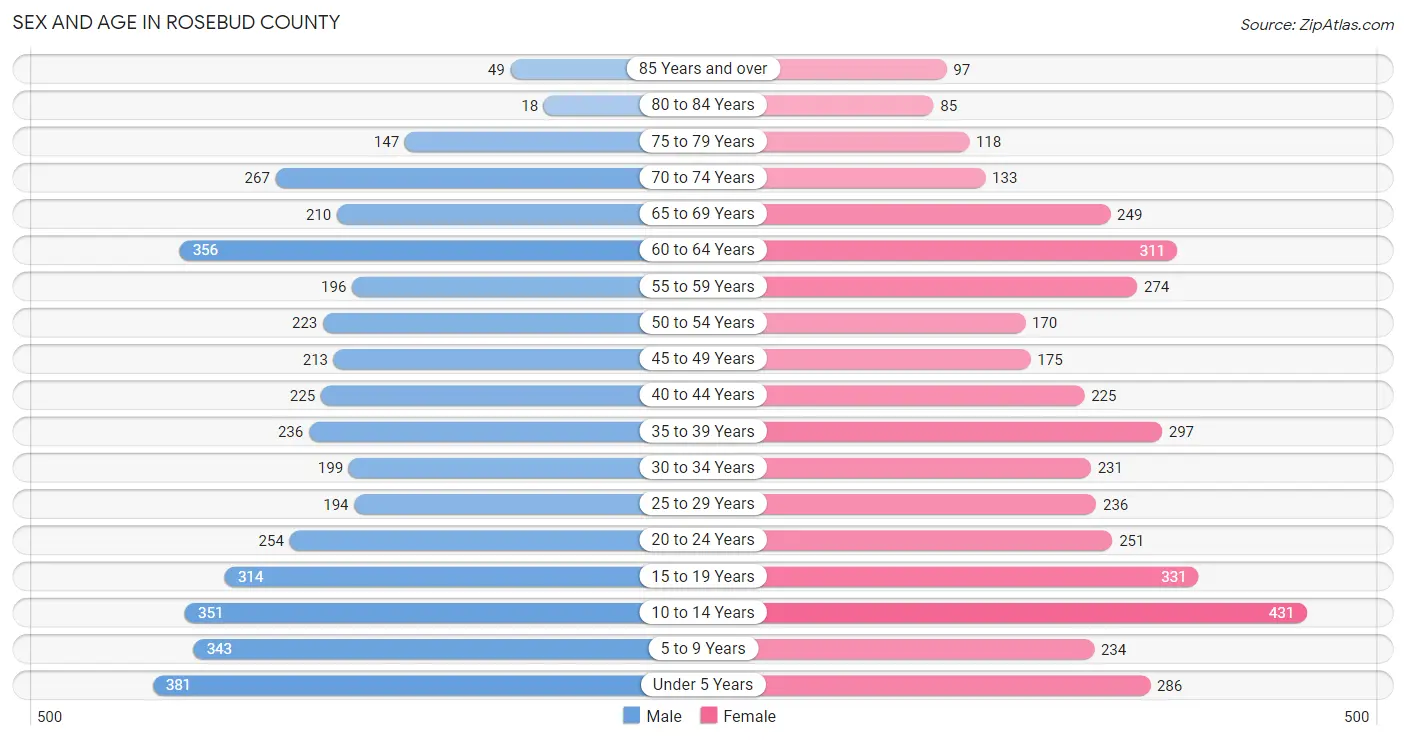
| Age Bracket | Male | Female |
| Under 5 Years | 381 (9.1%) | 286 (6.9%) |
| 5 to 9 Years | 343 (8.2%) | 234 (5.7%) |
| 10 to 14 Years | 351 (8.4%) | 431 (10.4%) |
| 15 to 19 Years | 314 (7.5%) | 331 (8.0%) |
| 20 to 24 Years | 254 (6.1%) | 251 (6.1%) |
| 25 to 29 Years | 194 (4.6%) | 236 (5.7%) |
| 30 to 34 Years | 199 (4.8%) | 231 (5.6%) |
| 35 to 39 Years | 236 (5.7%) | 297 (7.2%) |
| 40 to 44 Years | 225 (5.4%) | 225 (5.4%) |
| 45 to 49 Years | 213 (5.1%) | 175 (4.2%) |
| 50 to 54 Years | 223 (5.3%) | 170 (4.1%) |
| 55 to 59 Years | 196 (4.7%) | 274 (6.6%) |
| 60 to 64 Years | 356 (8.5%) | 311 (7.5%) |
| 65 to 69 Years | 210 (5.0%) | 249 (6.0%) |
| 70 to 74 Years | 267 (6.4%) | 133 (3.2%) |
| 75 to 79 Years | 147 (3.5%) | 118 (2.9%) |
| 80 to 84 Years | 18 (0.4%) | 85 (2.1%) |
| 85 Years and over | 49 (1.2%) | 97 (2.4%) |
| Total | 4,176 (100.0%) | 4,134 (100.0%) |
Families and Households in Rosebud County
Median Family Size in Rosebud County
The median family size in Rosebud County is 3.46 persons per family, with single female/mother families (291 | 15.0%) accounting for the largest median family size of 4.22 persons per family. On the other hand, married-couple families (1,496 | 77.2%) represent the smallest median family size with 3.32 persons per family.
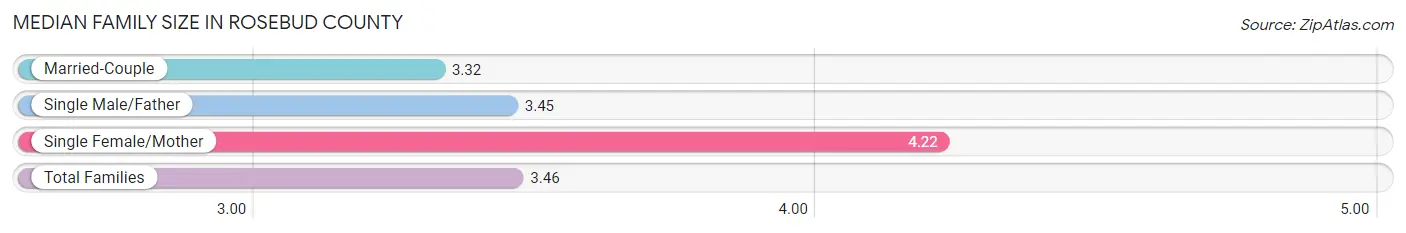
| Family Type | # Families | Family Size |
| Married-Couple | 1,496 (77.2%) | 3.32 |
| Single Male/Father | 150 (7.7%) | 3.45 |
| Single Female/Mother | 291 (15.0%) | 4.22 |
| Total Families | 1,937 (100.0%) | 3.46 |
Median Household Size in Rosebud County
The median household size in Rosebud County is 2.70 persons per household, with single female/mother households (291 | 9.6%) accounting for the largest median household size of 4.53 persons per household. non-family households (1,106 | 36.3%) represent the smallest median household size with 1.18 persons per household.
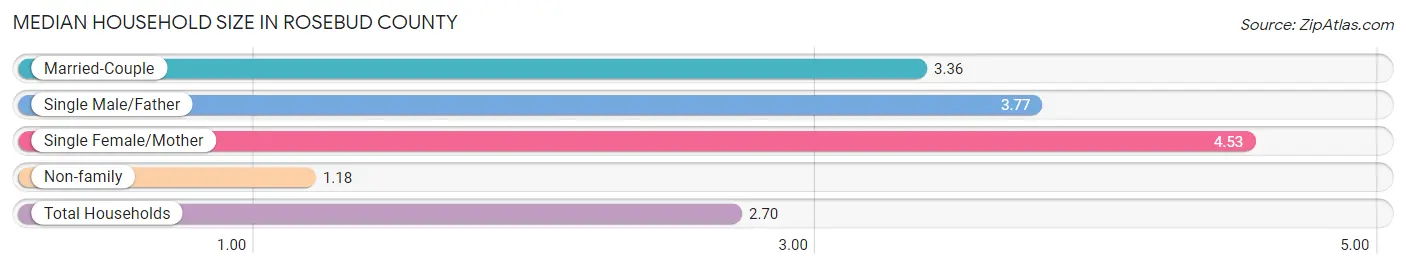
| Household Type | # Households | Household Size |
| Married-Couple | 1,496 (49.2%) | 3.36 |
| Single Male/Father | 150 (4.9%) | 3.77 |
| Single Female/Mother | 291 (9.6%) | 4.53 |
| Non-family | 1,106 (36.3%) | 1.18 |
| Total Households | 3,043 (100.0%) | 2.70 |
Household Size by Marriage Status in Rosebud County
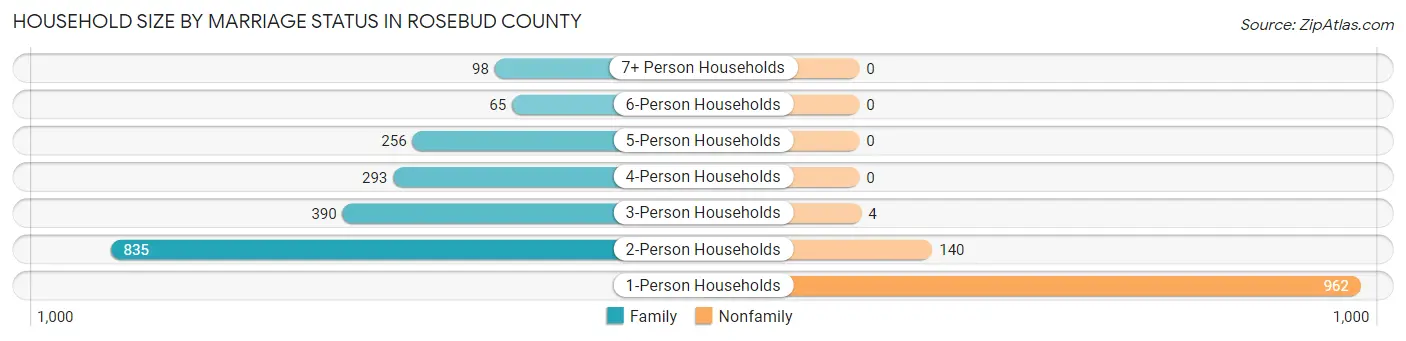
Out of a total of 3,043 households in Rosebud County, 1,937 (63.6%) are family households, while 1,106 (36.3%) are nonfamily households. The most numerous type of family households are 2-person households, comprising 835, and the most common type of nonfamily households are 1-person households, comprising 962.
| Household Size | Family Households | Nonfamily Households |
| 1-Person Households | - | 962 (31.6%) |
| 2-Person Households | 835 (27.4%) | 140 (4.6%) |
| 3-Person Households | 390 (12.8%) | 4 (0.1%) |
| 4-Person Households | 293 (9.6%) | 0 (0.0%) |
| 5-Person Households | 256 (8.4%) | 0 (0.0%) |
| 6-Person Households | 65 (2.1%) | 0 (0.0%) |
| 7+ Person Households | 98 (3.2%) | 0 (0.0%) |
| Total | 1,937 (63.6%) | 1,106 (36.3%) |
Female Fertility in Rosebud County
Fertility by Age in Rosebud County
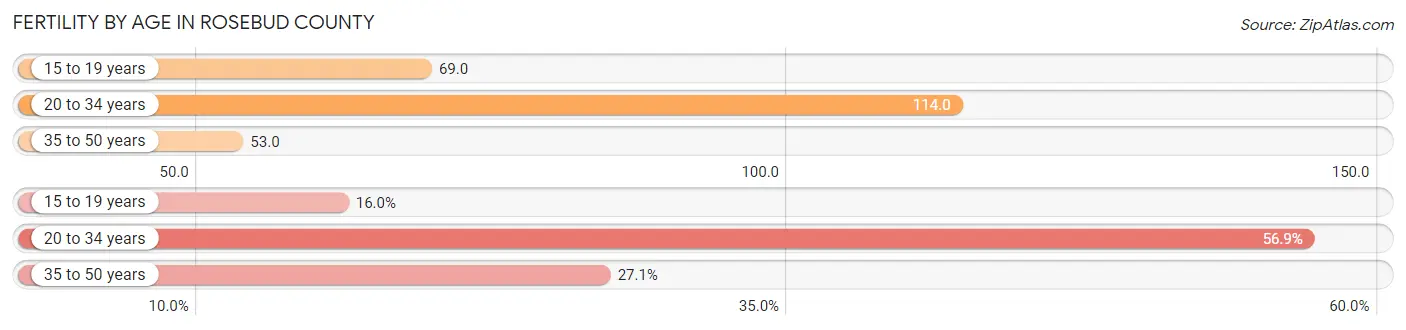
Average fertility rate in Rosebud County is 81.0 births per 1,000 women. Women in the age bracket of 20 to 34 years have the highest fertility rate with 114.0 births per 1,000 women. Women in the age bracket of 20 to 34 years acount for 56.9% of all women with births.
| Age Bracket | Women with Births | Births / 1,000 Women |
| 15 to 19 years | 23 (16.0%) | 69.0 |
| 20 to 34 years | 82 (56.9%) | 114.0 |
| 35 to 50 years | 39 (27.1%) | 53.0 |
| Total | 144 (100.0%) | 81.0 |
Fertility by Age by Marriage Status in Rosebud County
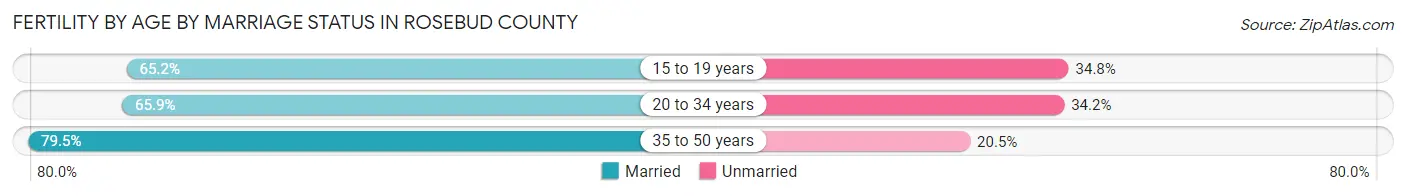
69.4% of women with births (144) in Rosebud County are married. The highest percentage of unmarried women with births falls into 15 to 19 years age bracket with 34.8% of them unmarried at the time of birth, while the lowest percentage of unmarried women with births belong to 35 to 50 years age bracket with 20.5% of them unmarried.
| Age Bracket | Married | Unmarried |
| 15 to 19 years | 15 (65.2%) | 8 (34.8%) |
| 20 to 34 years | 54 (65.8%) | 28 (34.2%) |
| 35 to 50 years | 31 (79.5%) | 8 (20.5%) |
| Total | 100 (69.4%) | 44 (30.6%) |
Fertility by Education in Rosebud County
| Educational Attainment | Women with Births | Births / 1,000 Women |
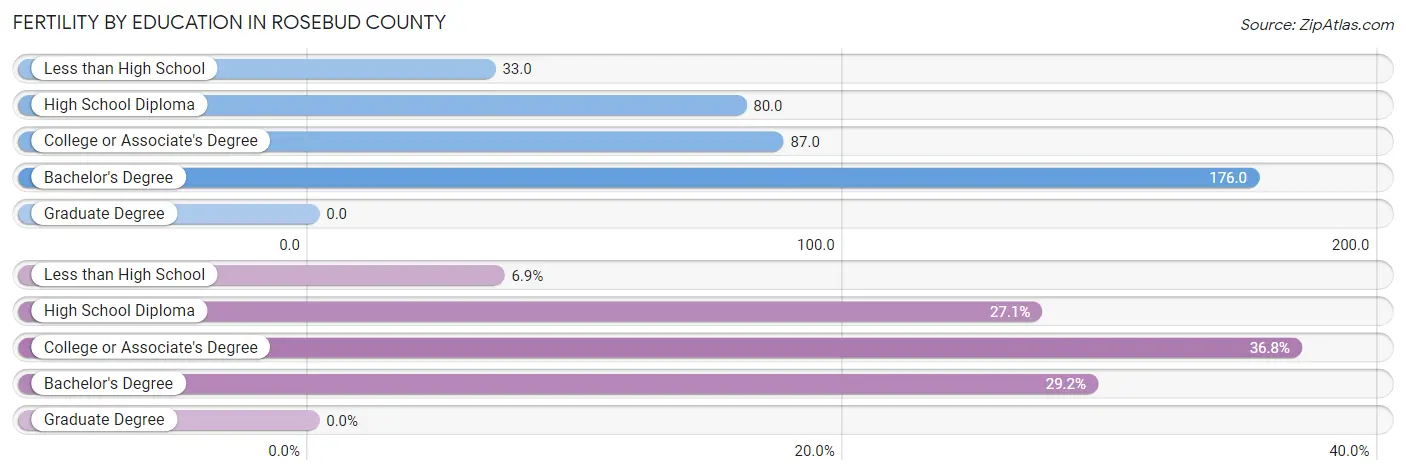
| Less than High School | 10 (6.9%) | 33.0 |
| High School Diploma | 39 (27.1%) | 80.0 |
| College or Associate's Degree | 53 (36.8%) | 87.0 |
| Bachelor's Degree | 42 (29.2%) | 176.0 |
| Graduate Degree | 0 (0.0%) | 0.0 |
| Total | 144 (100.0%) | 81.0 |
Fertility by Education by Marriage Status in Rosebud County
30.6% of women with births in Rosebud County are unmarried. Women with the educational attainment of college or associate's degree are most likely to be married with 90.6% of them married at childbirth, while women with the educational attainment of less than high school are least likely to be married with 100.0% of them unmarried at childbirth.
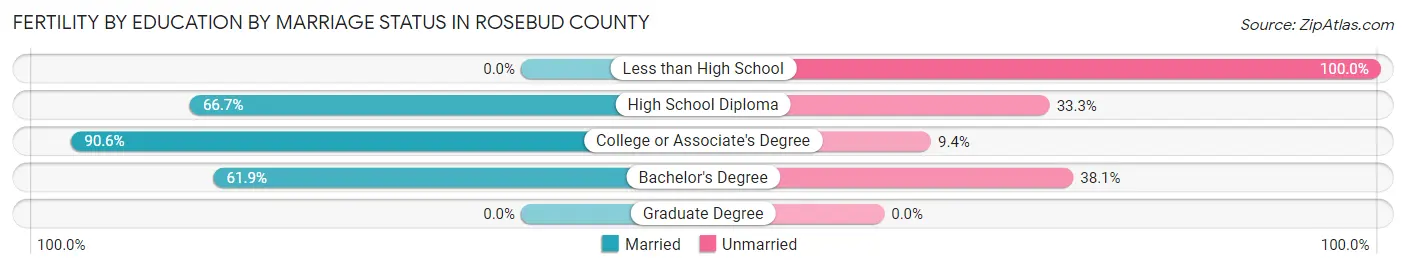
| Educational Attainment | Married | Unmarried |
| Less than High School | 0 (0.0%) | 10 (100.0%) |
| High School Diploma | 26 (66.7%) | 13 (33.3%) |
| College or Associate's Degree | 48 (90.6%) | 5 (9.4%) |
| Bachelor's Degree | 26 (61.9%) | 16 (38.1%) |
| Graduate Degree | 0 (0.0%) | 0 (0.0%) |
| Total | 100 (69.4%) | 44 (30.6%) |
Employment Characteristics in Rosebud County
Employment by Class of Employer in Rosebud County
Among the 3,207 employed individuals in Rosebud County, private company employees (1,623 | 50.6%), local government employees (485 | 15.1%), and not-for-profit organizations (368 | 11.5%) make up the most common classes of employment.
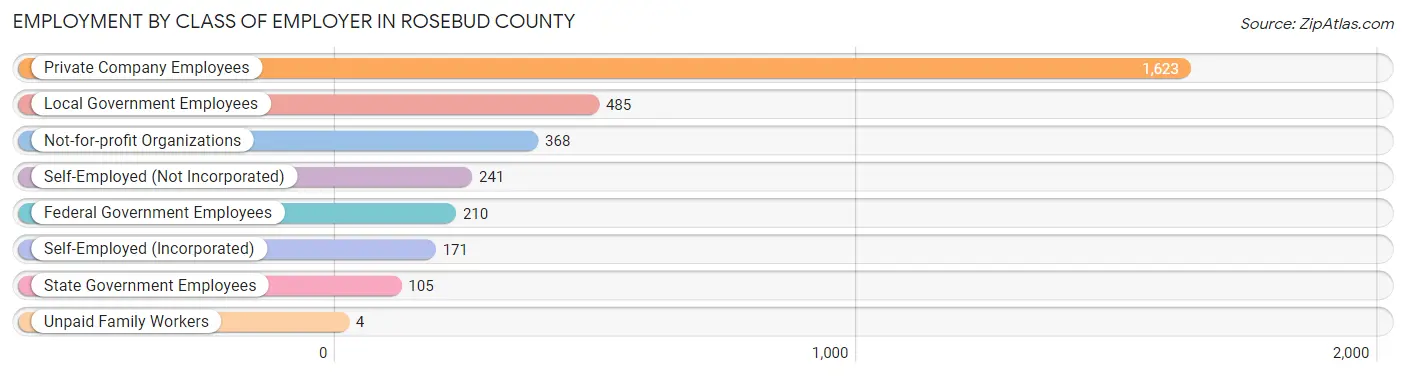
| Employer Class | # Employees | % Employees |
| Private Company Employees | 1,623 | 50.6% |
| Self-Employed (Incorporated) | 171 | 5.3% |
| Self-Employed (Not Incorporated) | 241 | 7.5% |
| Not-for-profit Organizations | 368 | 11.5% |
| Local Government Employees | 485 | 15.1% |
| State Government Employees | 105 | 3.3% |
| Federal Government Employees | 210 | 6.6% |
| Unpaid Family Workers | 4 | 0.1% |
| Total | 3,207 | 100.0% |
Employment Status by Age in Rosebud County
According to the labor force statistics for Rosebud County, out of the total population over 16 years of age (6,151), 58.8% or 3,617 individuals are in the labor force, with 9.2% or 333 of them unemployed. The age group with the highest labor force participation rate is 45 to 54 years, with 84.5% or 660 individuals in the labor force. Within the labor force, the 20 to 24 years age range has the highest percentage of unemployed individuals, with 23.7% or 90 of them being unemployed.
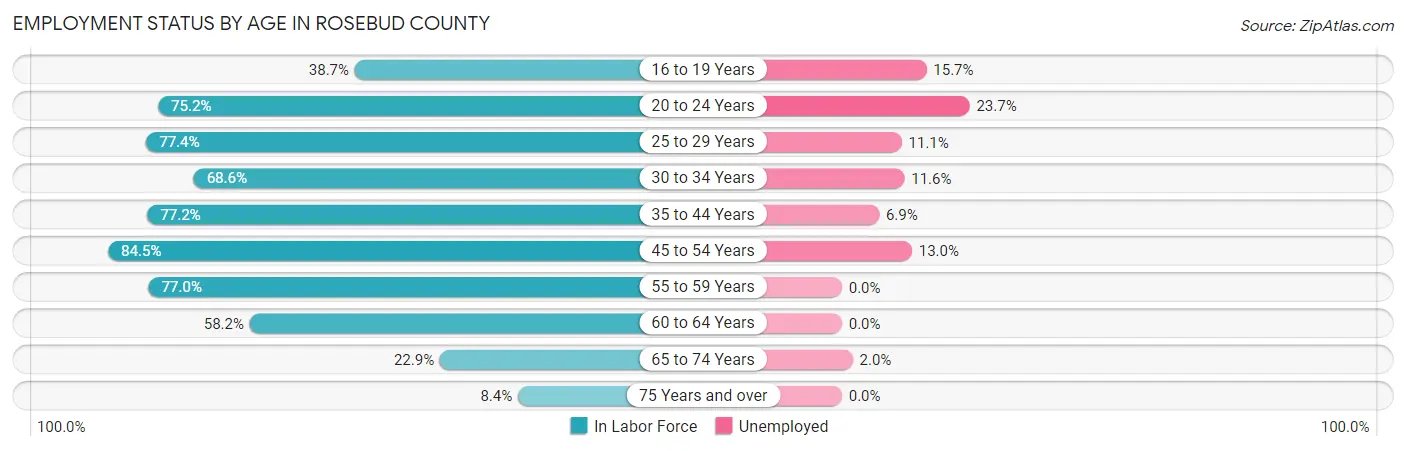
| Age Bracket | In Labor Force | Unemployed |
| 16 to 19 Years | 198 (38.7%) | 31 (15.7%) |
| 20 to 24 Years | 380 (75.2%) | 90 (23.7%) |
| 25 to 29 Years | 333 (77.4%) | 37 (11.1%) |
| 30 to 34 Years | 295 (68.6%) | 34 (11.6%) |
| 35 to 44 Years | 759 (77.2%) | 52 (6.9%) |
| 45 to 54 Years | 660 (84.5%) | 86 (13.0%) |
| 55 to 59 Years | 362 (77.0%) | 0 (0.0%) |
| 60 to 64 Years | 388 (58.2%) | 0 (0.0%) |
| 65 to 74 Years | 197 (22.9%) | 4 (2.0%) |
| 75 Years and over | 43 (8.4%) | 0 (0.0%) |
| Total | 3,617 (58.8%) | 333 (9.2%) |
Employment Status by Educational Attainment in Rosebud County
According to labor force statistics for Rosebud County, 74.4% of individuals (2,798) out of the total population between 25 and 64 years of age (3,761) are in the labor force, with 7.5% or 210 of them being unemployed. The group with the highest labor force participation rate are those with the educational attainment of bachelor's degree or higher, with 88.8% or 687 individuals in the labor force. Within the labor force, individuals with less than high school education have the highest percentage of unemployment, with 17.6% or 35 of them being unemployed.
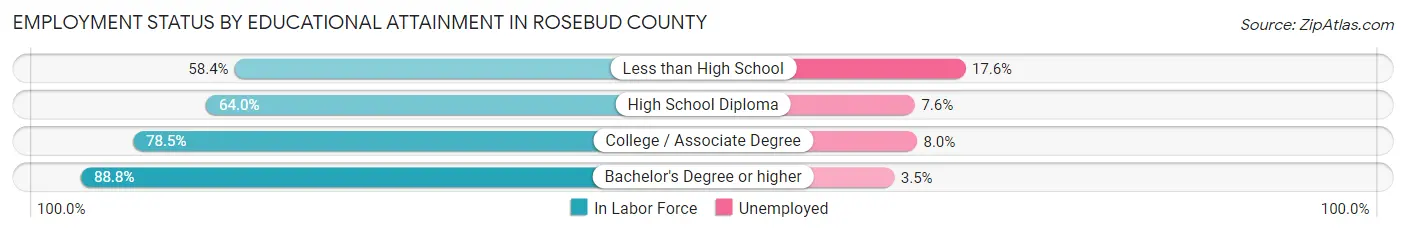
| Educational Attainment | In Labor Force | Unemployed |
| Less than High School | 199 (58.4%) | 60 (17.6%) |
| High School Diploma | 733 (64.0%) | 87 (7.6%) |
| College / Associate Degree | 1,178 (78.5%) | 120 (8.0%) |
| Bachelor's Degree or higher | 687 (88.8%) | 27 (3.5%) |
| Total | 2,798 (74.4%) | 282 (7.5%) |
Employment Occupations by Sex in Rosebud County
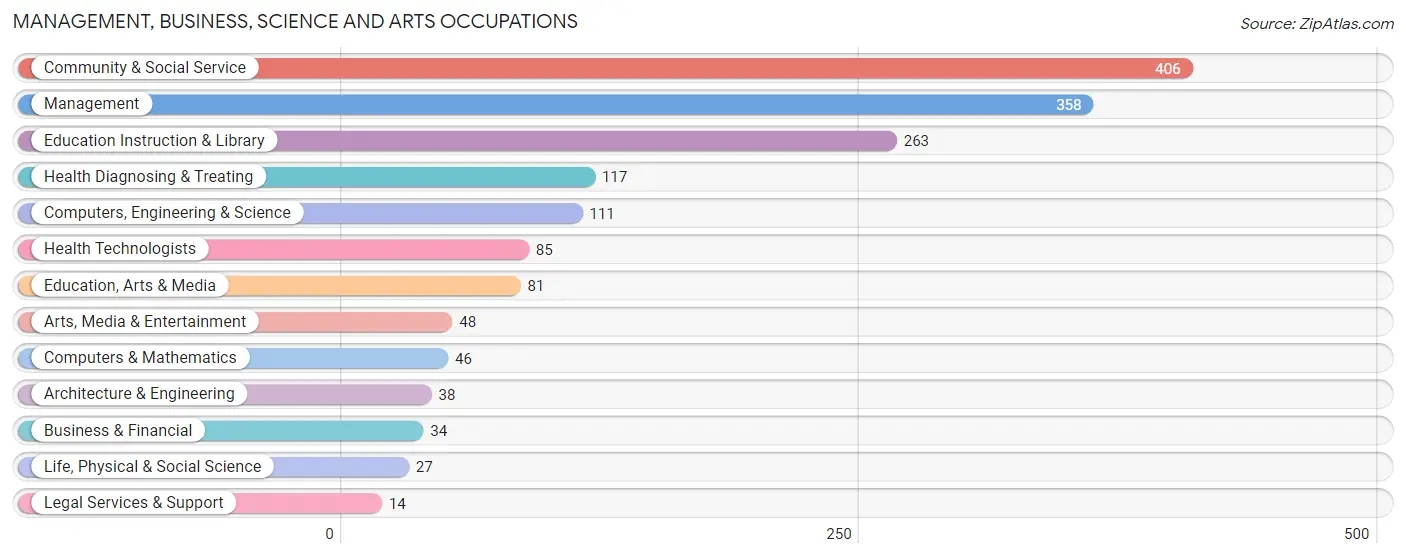
Management, Business, Science and Arts Occupations
The most common Management, Business, Science and Arts occupations in Rosebud County are Community & Social Service (406 | 12.4%), Management (358 | 10.9%), Education Instruction & Library (263 | 8.0%), Health Diagnosing & Treating (117 | 3.6%), and Computers, Engineering & Science (111 | 3.4%).
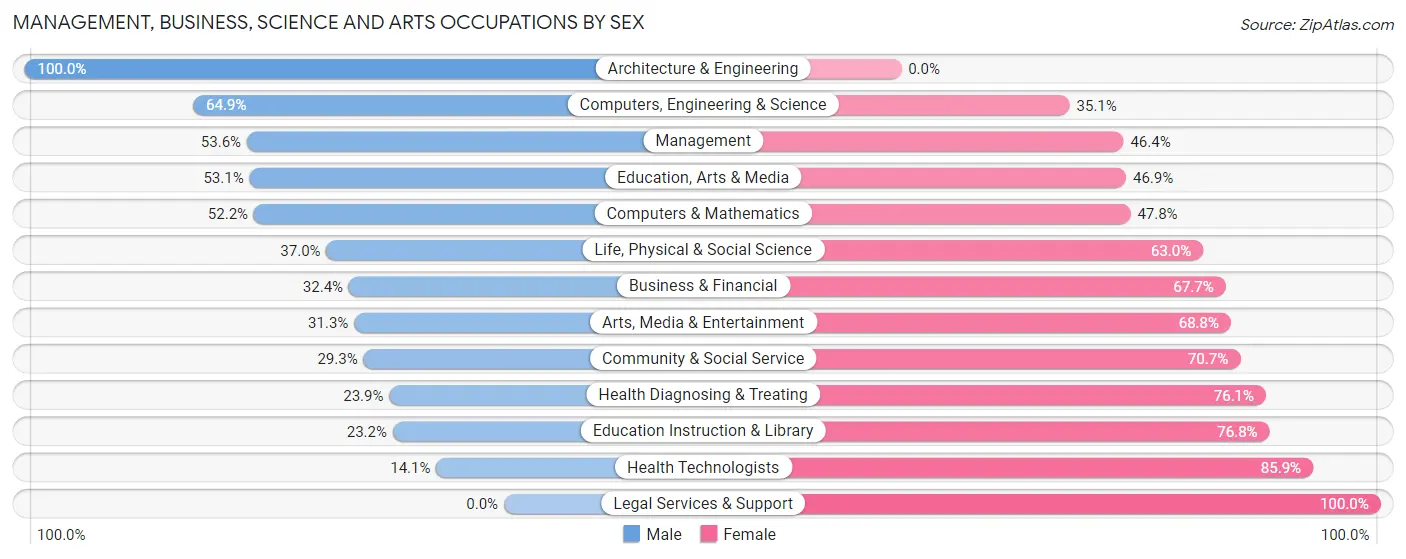
Management, Business, Science and Arts Occupations by Sex
Within the Management, Business, Science and Arts occupations in Rosebud County, the most male-oriented occupations are Architecture & Engineering (100.0%), Computers, Engineering & Science (64.9%), and Management (53.6%), while the most female-oriented occupations are Legal Services & Support (100.0%), Health Technologists (85.9%), and Education Instruction & Library (76.8%).
| Occupation | Male | Female |
| Management | 192 (53.6%) | 166 (46.4%) |
| Business & Financial | 11 (32.4%) | 23 (67.6%) |
| Computers, Engineering & Science | 72 (64.9%) | 39 (35.1%) |
| Computers & Mathematics | 24 (52.2%) | 22 (47.8%) |
| Architecture & Engineering | 38 (100.0%) | 0 (0.0%) |
| Life, Physical & Social Science | 10 (37.0%) | 17 (63.0%) |
| Community & Social Service | 119 (29.3%) | 287 (70.7%) |
| Education, Arts & Media | 43 (53.1%) | 38 (46.9%) |
| Legal Services & Support | 0 (0.0%) | 14 (100.0%) |
| Education Instruction & Library | 61 (23.2%) | 202 (76.8%) |
| Arts, Media & Entertainment | 15 (31.2%) | 33 (68.8%) |
| Health Diagnosing & Treating | 28 (23.9%) | 89 (76.1%) |
| Health Technologists | 12 (14.1%) | 73 (85.9%) |
| Total (Category) | 422 (41.1%) | 604 (58.9%) |
| Total (Overall) | 1,722 (52.6%) | 1,549 (47.4%) |
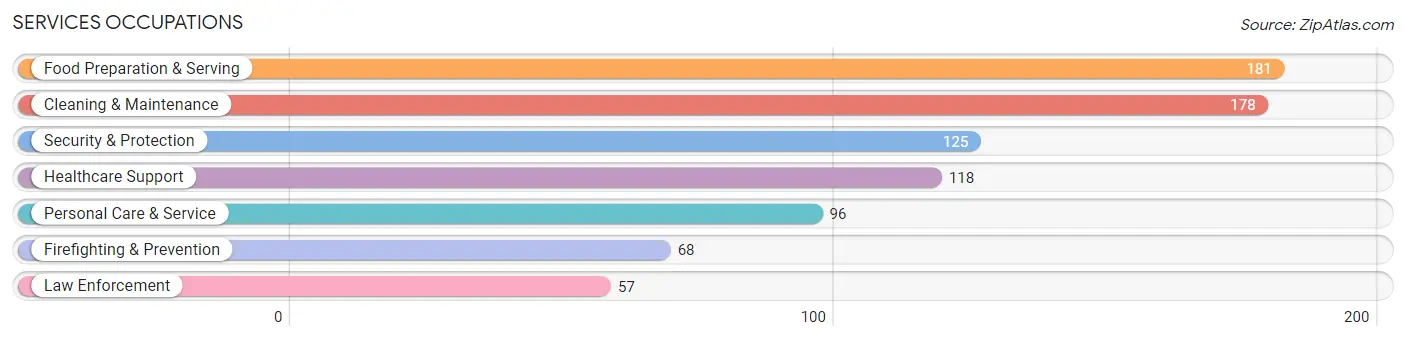
Services Occupations
The most common Services occupations in Rosebud County are Food Preparation & Serving (181 | 5.5%), Cleaning & Maintenance (178 | 5.4%), Security & Protection (125 | 3.8%), Healthcare Support (118 | 3.6%), and Personal Care & Service (96 | 2.9%).
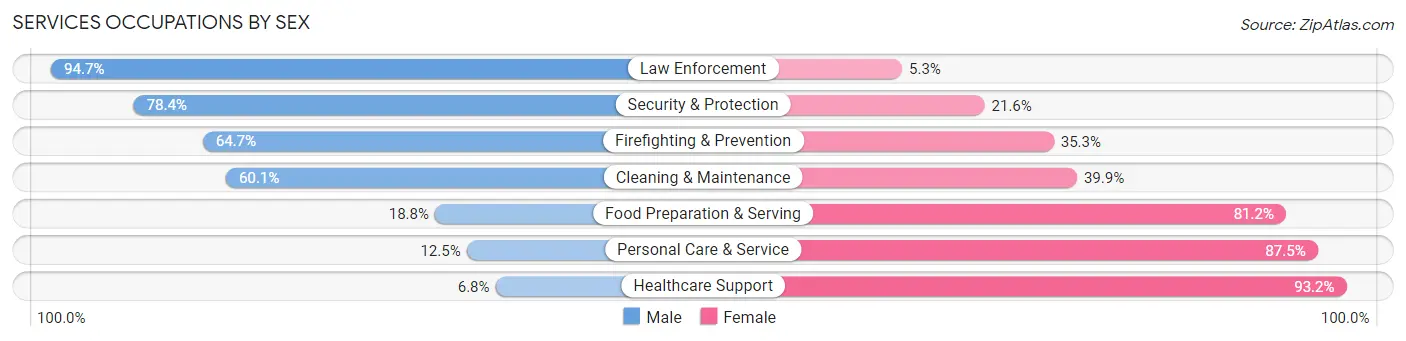
Services Occupations by Sex
Within the Services occupations in Rosebud County, the most male-oriented occupations are Law Enforcement (94.7%), Security & Protection (78.4%), and Firefighting & Prevention (64.7%), while the most female-oriented occupations are Healthcare Support (93.2%), Personal Care & Service (87.5%), and Food Preparation & Serving (81.2%).
| Occupation | Male | Female |
| Healthcare Support | 8 (6.8%) | 110 (93.2%) |
| Security & Protection | 98 (78.4%) | 27 (21.6%) |
| Firefighting & Prevention | 44 (64.7%) | 24 (35.3%) |
| Law Enforcement | 54 (94.7%) | 3 (5.3%) |
| Food Preparation & Serving | 34 (18.8%) | 147 (81.2%) |
| Cleaning & Maintenance | 107 (60.1%) | 71 (39.9%) |
| Personal Care & Service | 12 (12.5%) | 84 (87.5%) |
| Total (Category) | 259 (37.1%) | 439 (62.9%) |
| Total (Overall) | 1,722 (52.6%) | 1,549 (47.4%) |
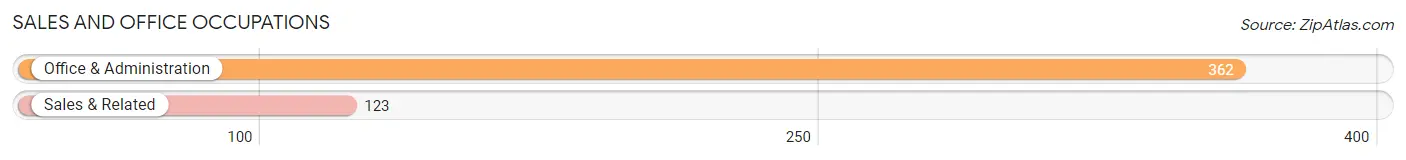
Sales and Office Occupations
The most common Sales and Office occupations in Rosebud County are Office & Administration (362 | 11.1%), and Sales & Related (123 | 3.8%).
Sales and Office Occupations by Sex
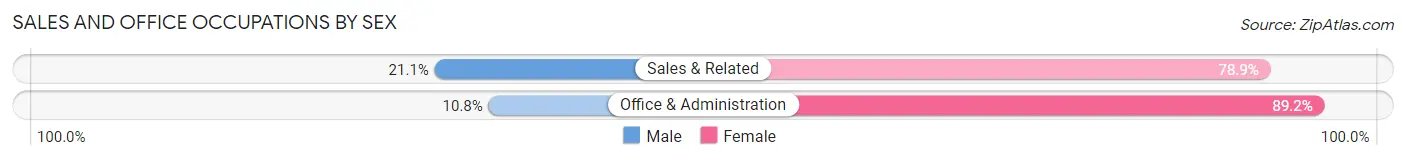
| Occupation | Male | Female |
| Sales & Related | 26 (21.1%) | 97 (78.9%) |
| Office & Administration | 39 (10.8%) | 323 (89.2%) |
| Total (Category) | 65 (13.4%) | 420 (86.6%) |
| Total (Overall) | 1,722 (52.6%) | 1,549 (47.4%) |
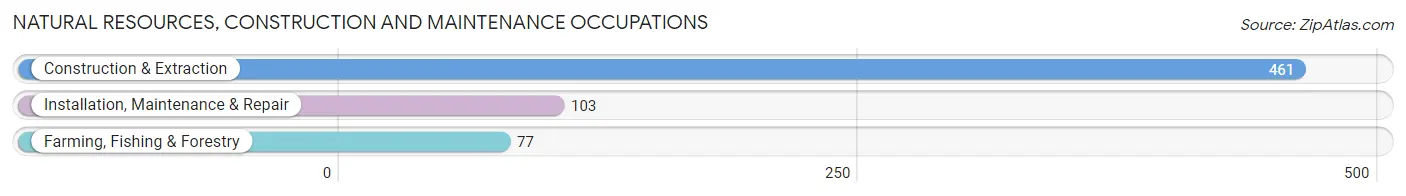
Natural Resources, Construction and Maintenance Occupations
The most common Natural Resources, Construction and Maintenance occupations in Rosebud County are Construction & Extraction (461 | 14.1%), Installation, Maintenance & Repair (103 | 3.2%), and Farming, Fishing & Forestry (77 | 2.4%).
Natural Resources, Construction and Maintenance Occupations by Sex
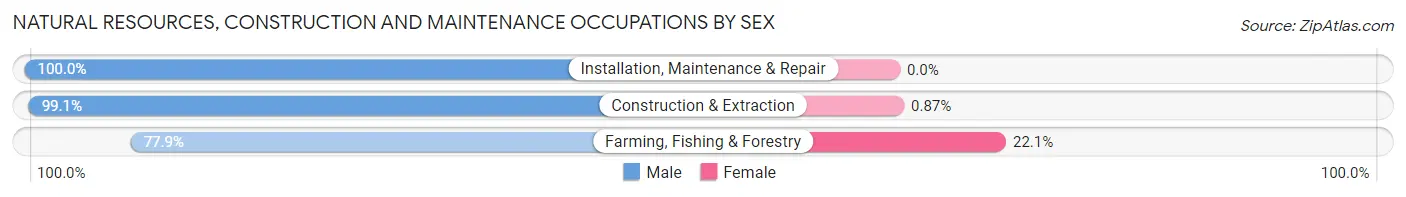
| Occupation | Male | Female |
| Farming, Fishing & Forestry | 60 (77.9%) | 17 (22.1%) |
| Construction & Extraction | 457 (99.1%) | 4 (0.9%) |
| Installation, Maintenance & Repair | 103 (100.0%) | 0 (0.0%) |
| Total (Category) | 620 (96.7%) | 21 (3.3%) |
| Total (Overall) | 1,722 (52.6%) | 1,549 (47.4%) |
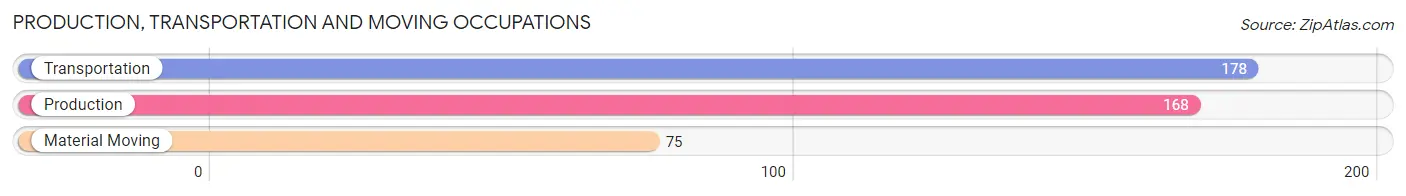
Production, Transportation and Moving Occupations
The most common Production, Transportation and Moving occupations in Rosebud County are Transportation (178 | 5.4%), Production (168 | 5.1%), and Material Moving (75 | 2.3%).
Production, Transportation and Moving Occupations by Sex
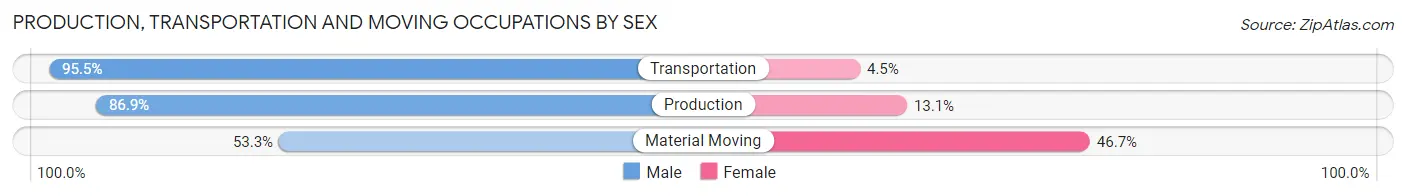
| Occupation | Male | Female |
| Production | 146 (86.9%) | 22 (13.1%) |
| Transportation | 170 (95.5%) | 8 (4.5%) |
| Material Moving | 40 (53.3%) | 35 (46.7%) |
| Total (Category) | 356 (84.6%) | 65 (15.4%) |
| Total (Overall) | 1,722 (52.6%) | 1,549 (47.4%) |
Employment Industries by Sex in Rosebud County
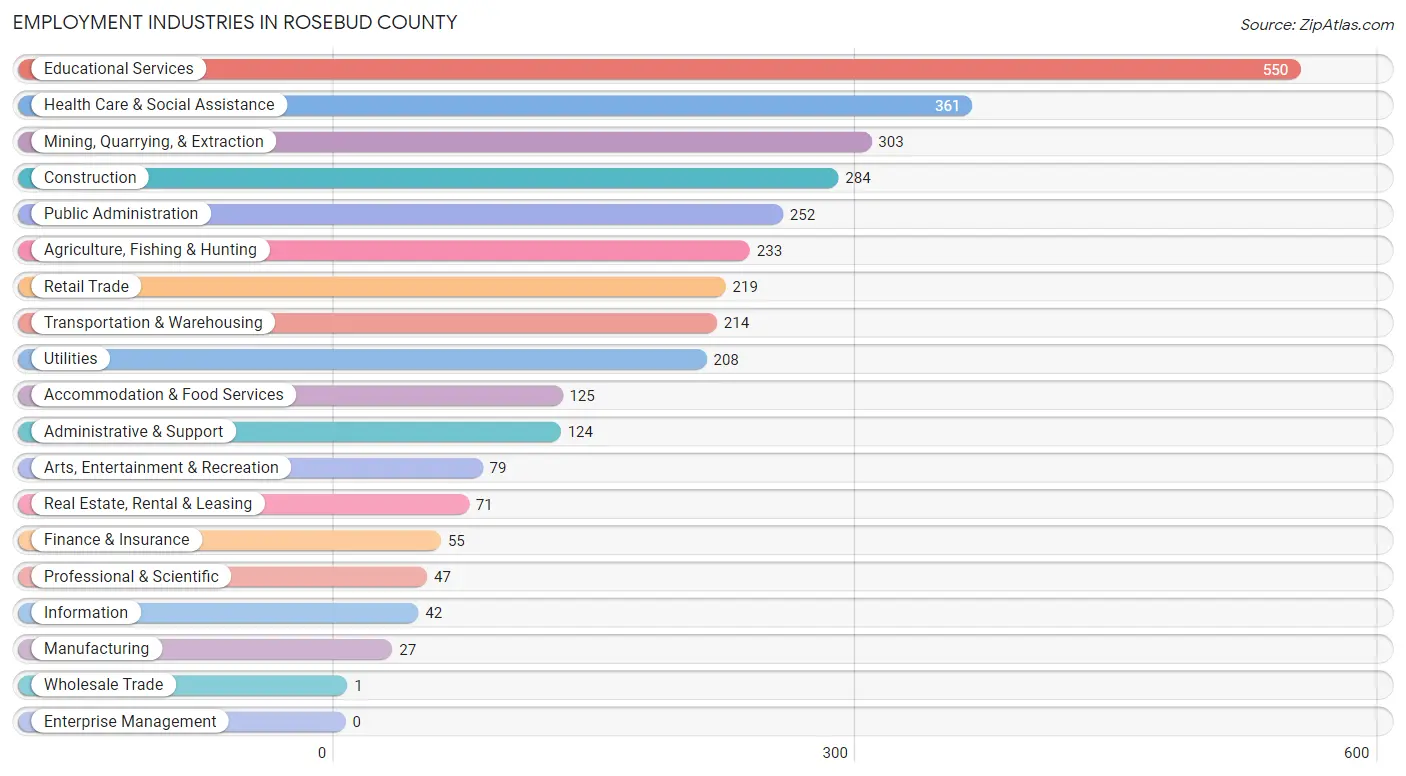
Employment Industries in Rosebud County
The major employment industries in Rosebud County include Educational Services (550 | 16.8%), Health Care & Social Assistance (361 | 11.0%), Mining, Quarrying, & Extraction (303 | 9.3%), Construction (284 | 8.7%), and Public Administration (252 | 7.7%).
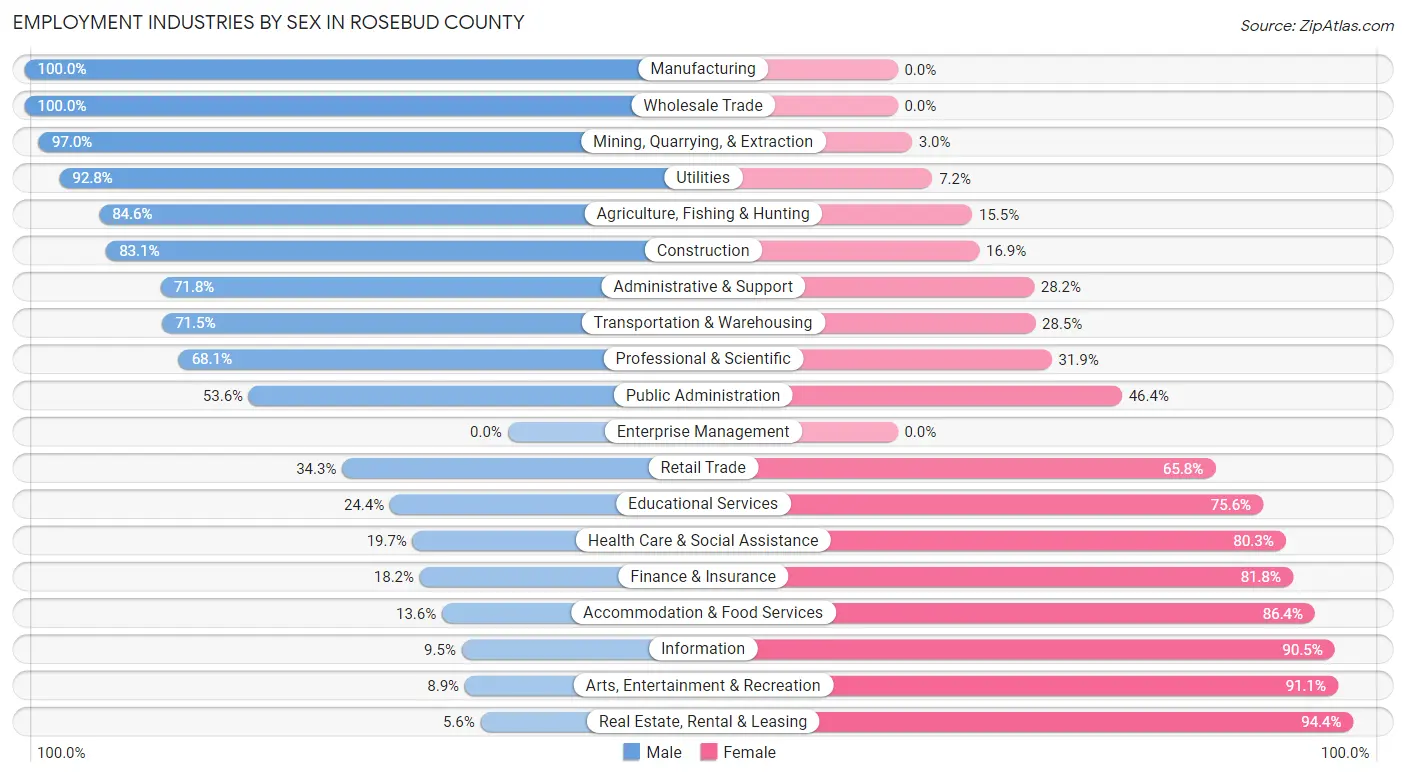
Employment Industries by Sex in Rosebud County
The Rosebud County industries that see more men than women are Manufacturing (100.0%), Wholesale Trade (100.0%), and Mining, Quarrying, & Extraction (97.0%), whereas the industries that tend to have a higher number of women are Real Estate, Rental & Leasing (94.4%), Arts, Entertainment & Recreation (91.1%), and Information (90.5%).
| Industry | Male | Female |
| Agriculture, Fishing & Hunting | 197 (84.6%) | 36 (15.4%) |
| Mining, Quarrying, & Extraction | 294 (97.0%) | 9 (3.0%) |
| Construction | 236 (83.1%) | 48 (16.9%) |
| Manufacturing | 27 (100.0%) | 0 (0.0%) |
| Wholesale Trade | 1 (100.0%) | 0 (0.0%) |
| Retail Trade | 75 (34.3%) | 144 (65.7%) |
| Transportation & Warehousing | 153 (71.5%) | 61 (28.5%) |
| Utilities | 193 (92.8%) | 15 (7.2%) |
| Information | 4 (9.5%) | 38 (90.5%) |
| Finance & Insurance | 10 (18.2%) | 45 (81.8%) |
| Real Estate, Rental & Leasing | 4 (5.6%) | 67 (94.4%) |
| Professional & Scientific | 32 (68.1%) | 15 (31.9%) |
| Enterprise Management | 0 (0.0%) | 0 (0.0%) |
| Administrative & Support | 89 (71.8%) | 35 (28.2%) |
| Educational Services | 134 (24.4%) | 416 (75.6%) |
| Health Care & Social Assistance | 71 (19.7%) | 290 (80.3%) |
| Arts, Entertainment & Recreation | 7 (8.9%) | 72 (91.1%) |
| Accommodation & Food Services | 17 (13.6%) | 108 (86.4%) |
| Public Administration | 135 (53.6%) | 117 (46.4%) |
| Total | 1,722 (52.6%) | 1,549 (47.4%) |
Education in Rosebud County
School Enrollment in Rosebud County
The most common levels of schooling among the 2,027 students in Rosebud County are middle school (584 | 28.8%), high school (459 | 22.6%), and elementary school (396 | 19.5%).
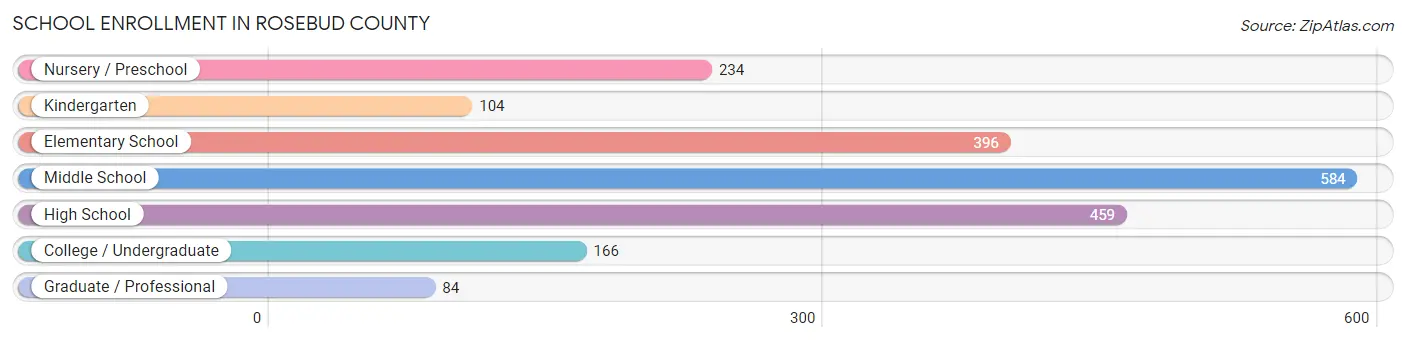
| School Level | # Students | % Students |
| Nursery / Preschool | 234 | 11.5% |
| Kindergarten | 104 | 5.1% |
| Elementary School | 396 | 19.5% |
| Middle School | 584 | 28.8% |
| High School | 459 | 22.6% |
| College / Undergraduate | 166 | 8.2% |
| Graduate / Professional | 84 | 4.1% |
| Total | 2,027 | 100.0% |
School Enrollment by Age by Funding Source in Rosebud County
Out of a total of 2,027 students who are enrolled in schools in Rosebud County, 233 (11.5%) attend a private institution, while the remaining 1,794 (88.5%) are enrolled in public schools. The age group of 3 to 4 year olds has the highest likelihood of being enrolled in private schools, with 48 (34.8% in the age bracket) enrolled. Conversely, the age group of 25 to 34 year olds has the lowest likelihood of being enrolled in a private school, with 37 (100.0% in the age bracket) attending a public institution.
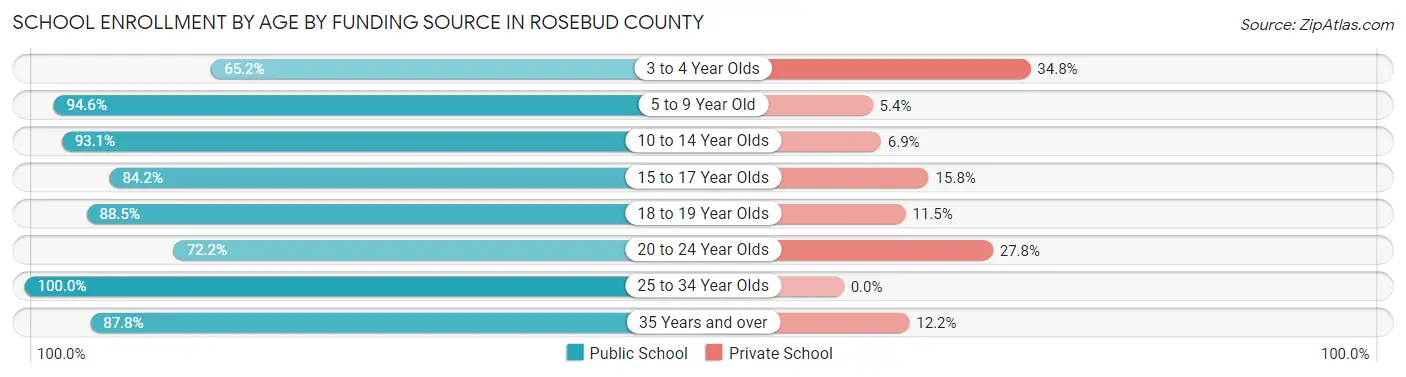
| Age Bracket | Public School | Private School |
| 3 to 4 Year Olds | 90 (65.2%) | 48 (34.8%) |
| 5 to 9 Year Old | 438 (94.6%) | 25 (5.4%) |
| 10 to 14 Year Olds | 673 (93.1%) | 50 (6.9%) |
| 15 to 17 Year Olds | 319 (84.2%) | 60 (15.8%) |
| 18 to 19 Year Olds | 115 (88.5%) | 15 (11.5%) |
| 20 to 24 Year Olds | 78 (72.2%) | 30 (27.8%) |
| 25 to 34 Year Olds | 37 (100.0%) | 0 (0.0%) |
| 35 Years and over | 43 (87.8%) | 6 (12.2%) |
| Total | 1,794 (88.5%) | 233 (11.5%) |
Educational Attainment by Field of Study in Rosebud County
Education (286 | 25.9%), science & technology (188 | 17.0%), business (161 | 14.6%), bio, nature & agricultural (123 | 11.1%), and liberal arts & history (89 | 8.1%) are the most common fields of study among 1,104 individuals in Rosebud County who have obtained a bachelor's degree or higher.
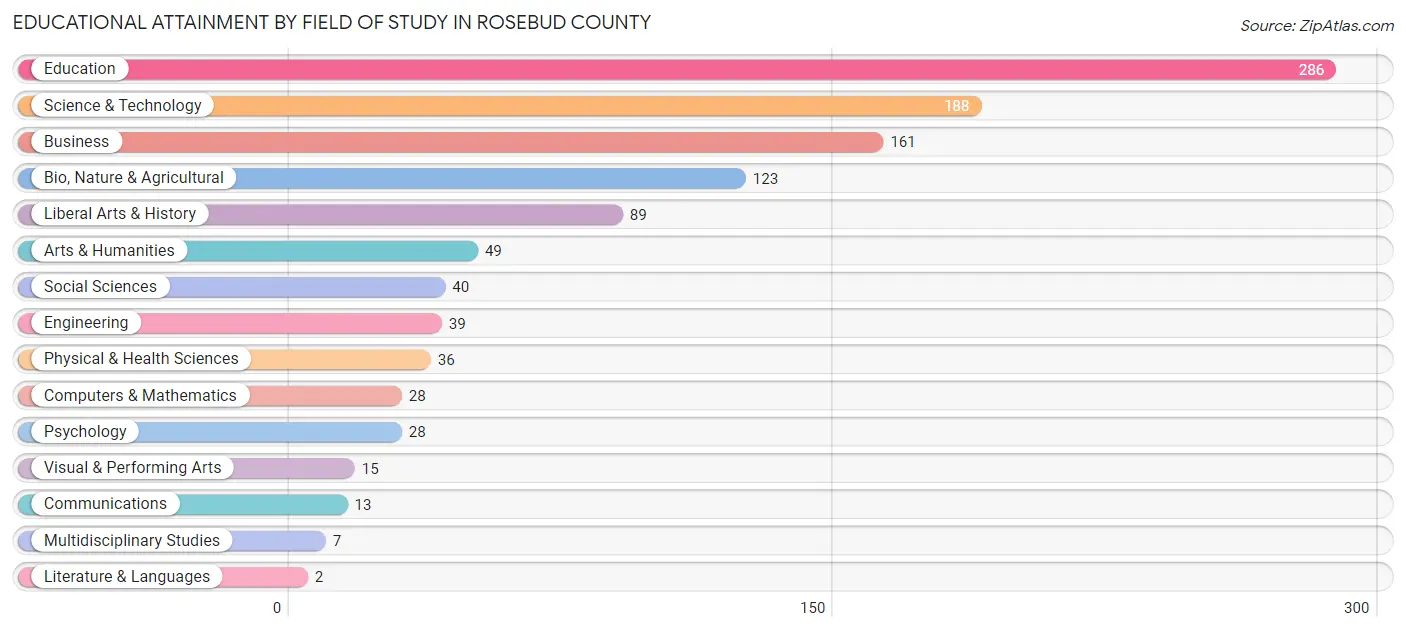
| Field of Study | # Graduates | % Graduates |
| Computers & Mathematics | 28 | 2.5% |
| Bio, Nature & Agricultural | 123 | 11.1% |
| Physical & Health Sciences | 36 | 3.3% |
| Psychology | 28 | 2.5% |
| Social Sciences | 40 | 3.6% |
| Engineering | 39 | 3.5% |
| Multidisciplinary Studies | 7 | 0.6% |
| Science & Technology | 188 | 17.0% |
| Business | 161 | 14.6% |
| Education | 286 | 25.9% |
| Literature & Languages | 2 | 0.2% |
| Liberal Arts & History | 89 | 8.1% |
| Visual & Performing Arts | 15 | 1.4% |
| Communications | 13 | 1.2% |
| Arts & Humanities | 49 | 4.4% |
| Total | 1,104 | 100.0% |
Transportation & Commute in Rosebud County
Vehicle Availability by Sex in Rosebud County
The most prevalent vehicle ownership categories in Rosebud County are males with 2 vehicles (482, accounting for 28.7%) and females with 2 vehicles (345, making up 31.7%).
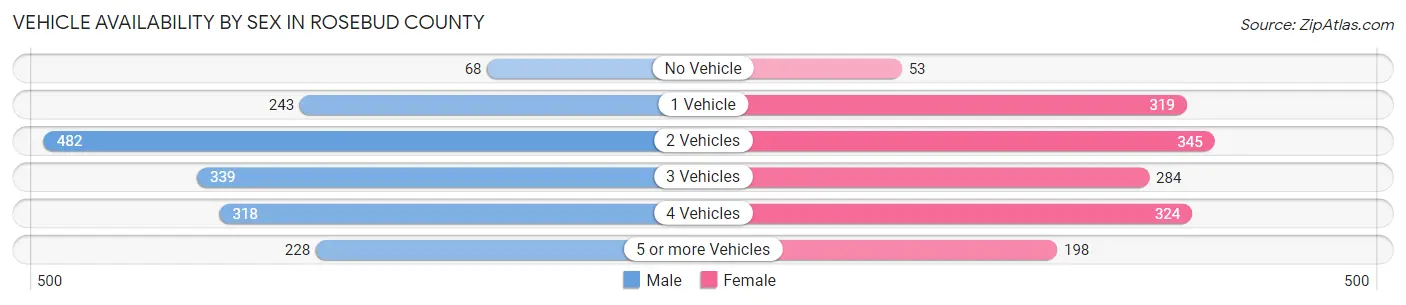
| Vehicles Available | Male | Female |
| No Vehicle | 68 (4.1%) | 53 (3.5%) |
| 1 Vehicle | 243 (14.5%) | 319 (20.9%) |
| 2 Vehicles | 482 (28.7%) | 345 (22.7%) |
| 3 Vehicles | 339 (20.2%) | 284 (18.6%) |
| 4 Vehicles | 318 (19.0%) | 324 (21.3%) |
| 5 or more Vehicles | 228 (13.6%) | 198 (13.0%) |
| Total | 1,678 (100.0%) | 1,523 (100.0%) |
Commute Time in Rosebud County
The most frequently occuring commute durations in Rosebud County are 5 to 9 minutes (1,155 commuters, 37.8%), less than 5 minutes (554 commuters, 18.1%), and 10 to 14 minutes (339 commuters, 11.1%).
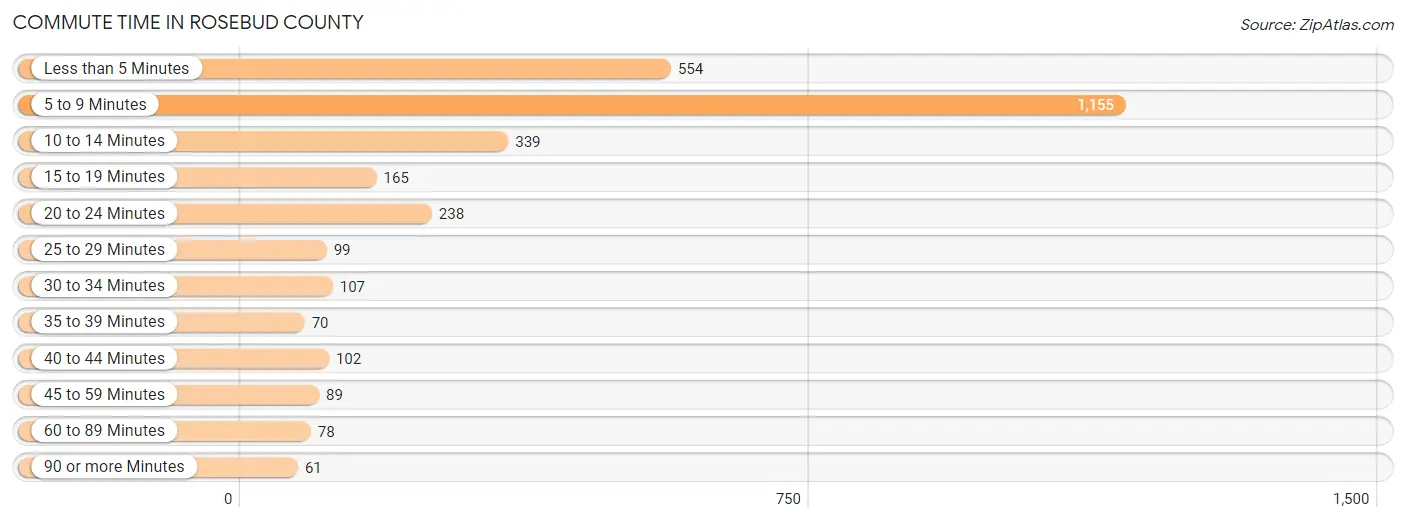
| Commute Time | # Commuters | % Commuters |
| Less than 5 Minutes | 554 | 18.1% |
| 5 to 9 Minutes | 1,155 | 37.8% |
| 10 to 14 Minutes | 339 | 11.1% |
| 15 to 19 Minutes | 165 | 5.4% |
| 20 to 24 Minutes | 238 | 7.8% |
| 25 to 29 Minutes | 99 | 3.2% |
| 30 to 34 Minutes | 107 | 3.5% |
| 35 to 39 Minutes | 70 | 2.3% |
| 40 to 44 Minutes | 102 | 3.3% |
| 45 to 59 Minutes | 89 | 2.9% |
| 60 to 89 Minutes | 78 | 2.5% |
| 90 or more Minutes | 61 | 2.0% |
Commute Time by Sex in Rosebud County
The most common commute times in Rosebud County are 5 to 9 minutes (599 commuters, 38.4%) for males and 5 to 9 minutes (556 commuters, 37.1%) for females.
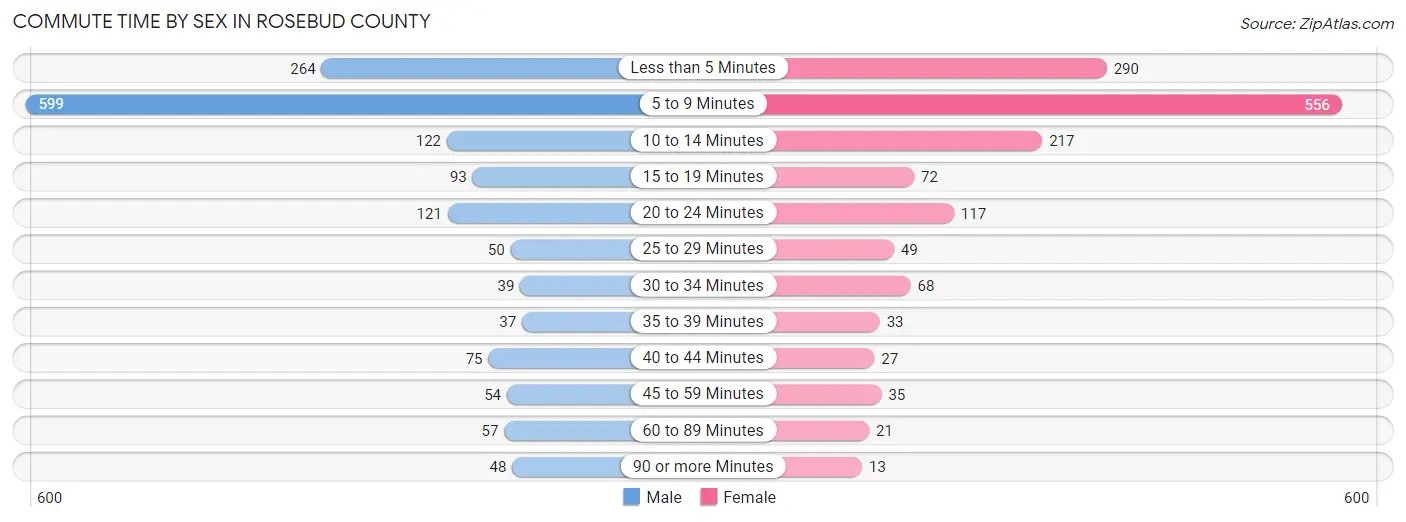
| Commute Time | Male | Female |
| Less than 5 Minutes | 264 (16.9%) | 290 (19.4%) |
| 5 to 9 Minutes | 599 (38.4%) | 556 (37.1%) |
| 10 to 14 Minutes | 122 (7.8%) | 217 (14.5%) |
| 15 to 19 Minutes | 93 (6.0%) | 72 (4.8%) |
| 20 to 24 Minutes | 121 (7.8%) | 117 (7.8%) |
| 25 to 29 Minutes | 50 (3.2%) | 49 (3.3%) |
| 30 to 34 Minutes | 39 (2.5%) | 68 (4.5%) |
| 35 to 39 Minutes | 37 (2.4%) | 33 (2.2%) |
| 40 to 44 Minutes | 75 (4.8%) | 27 (1.8%) |
| 45 to 59 Minutes | 54 (3.5%) | 35 (2.3%) |
| 60 to 89 Minutes | 57 (3.7%) | 21 (1.4%) |
| 90 or more Minutes | 48 (3.1%) | 13 (0.9%) |
Time of Departure to Work by Sex in Rosebud County
The most frequent times of departure to work in Rosebud County are 7:00 AM to 7:29 AM (264, 16.9%) for males and 7:30 AM to 7:59 AM (563, 37.6%) for females.
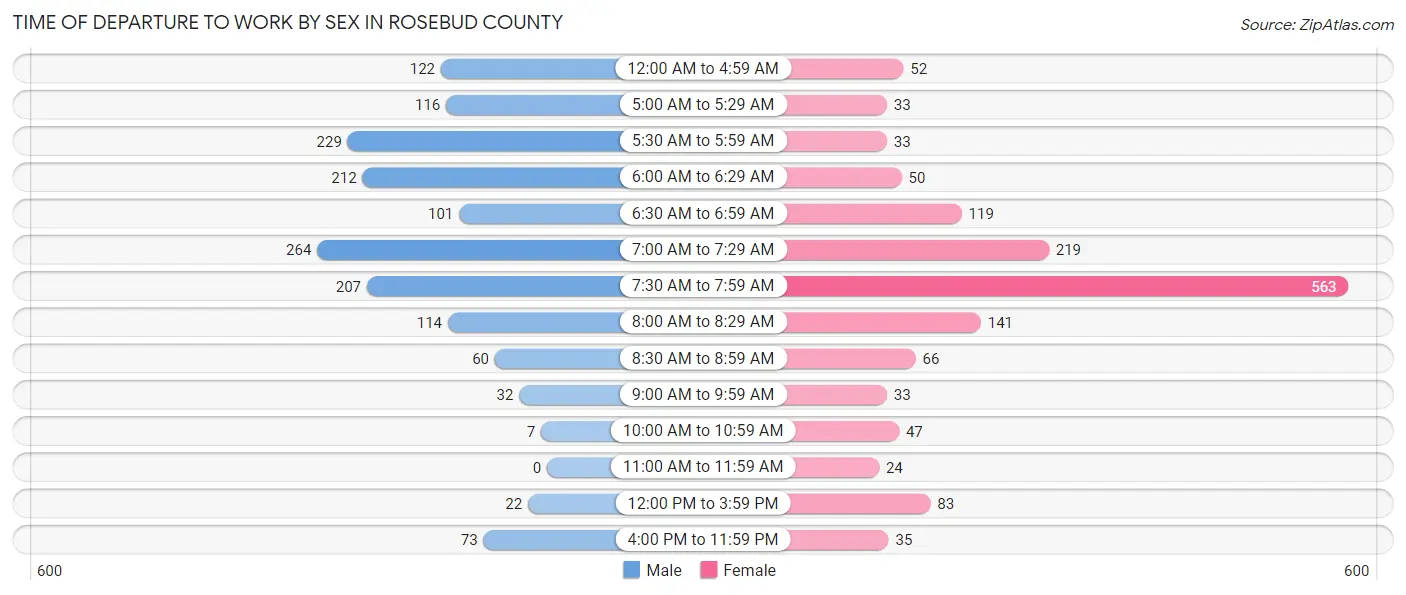
| Time of Departure | Male | Female |
| 12:00 AM to 4:59 AM | 122 (7.8%) | 52 (3.5%) |
| 5:00 AM to 5:29 AM | 116 (7.4%) | 33 (2.2%) |
| 5:30 AM to 5:59 AM | 229 (14.7%) | 33 (2.2%) |
| 6:00 AM to 6:29 AM | 212 (13.6%) | 50 (3.3%) |
| 6:30 AM to 6:59 AM | 101 (6.5%) | 119 (7.9%) |
| 7:00 AM to 7:29 AM | 264 (16.9%) | 219 (14.6%) |
| 7:30 AM to 7:59 AM | 207 (13.3%) | 563 (37.6%) |
| 8:00 AM to 8:29 AM | 114 (7.3%) | 141 (9.4%) |
| 8:30 AM to 8:59 AM | 60 (3.8%) | 66 (4.4%) |
| 9:00 AM to 9:59 AM | 32 (2.1%) | 33 (2.2%) |
| 10:00 AM to 10:59 AM | 7 (0.4%) | 47 (3.1%) |
| 11:00 AM to 11:59 AM | 0 (0.0%) | 24 (1.6%) |
| 12:00 PM to 3:59 PM | 22 (1.4%) | 83 (5.5%) |
| 4:00 PM to 11:59 PM | 73 (4.7%) | 35 (2.3%) |
| Total | 1,559 (100.0%) | 1,498 (100.0%) |
Housing Occupancy in Rosebud County
Occupancy by Ownership in Rosebud County
Of the total 3,043 dwellings in Rosebud County, owner-occupied units account for 1,958 (64.3%), while renter-occupied units make up 1,085 (35.7%).
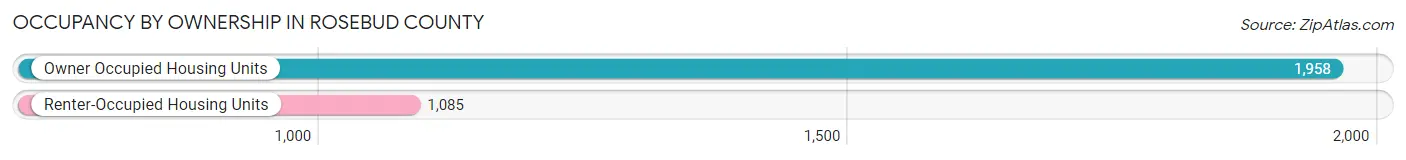
| Occupancy | # Housing Units | % Housing Units |
| Owner Occupied Housing Units | 1,958 | 64.3% |
| Renter-Occupied Housing Units | 1,085 | 35.7% |
| Total Occupied Housing Units | 3,043 | 100.0% |
Occupancy by Household Size in Rosebud County
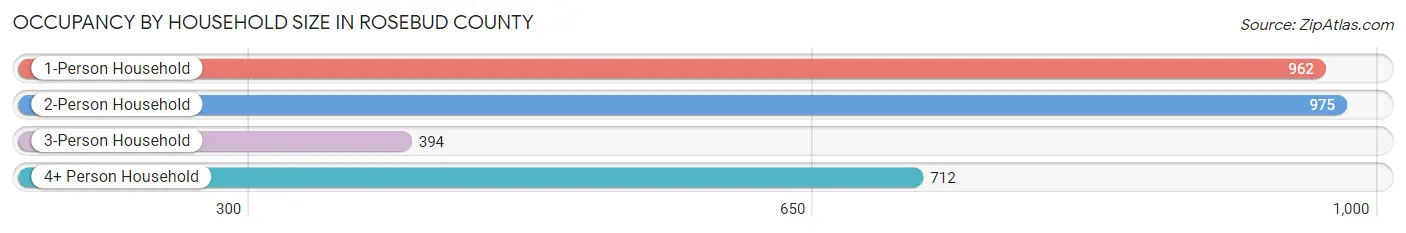
| Household Size | # Housing Units | % Housing Units |
| 1-Person Household | 962 | 31.6% |
| 2-Person Household | 975 | 32.0% |
| 3-Person Household | 394 | 13.0% |
| 4+ Person Household | 712 | 23.4% |
| Total Housing Units | 3,043 | 100.0% |
Occupancy by Ownership by Household Size in Rosebud County
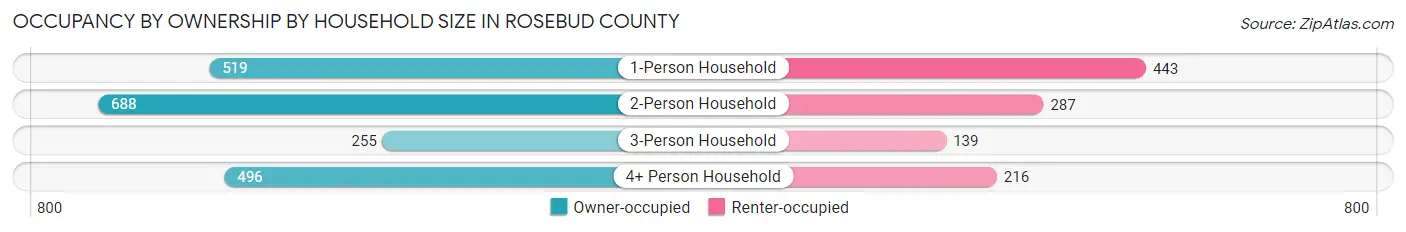
| Household Size | Owner-occupied | Renter-occupied |
| 1-Person Household | 519 (53.9%) | 443 (46.1%) |
| 2-Person Household | 688 (70.6%) | 287 (29.4%) |
| 3-Person Household | 255 (64.7%) | 139 (35.3%) |
| 4+ Person Household | 496 (69.7%) | 216 (30.3%) |
| Total Housing Units | 1,958 (64.3%) | 1,085 (35.7%) |
Occupancy by Educational Attainment in Rosebud County
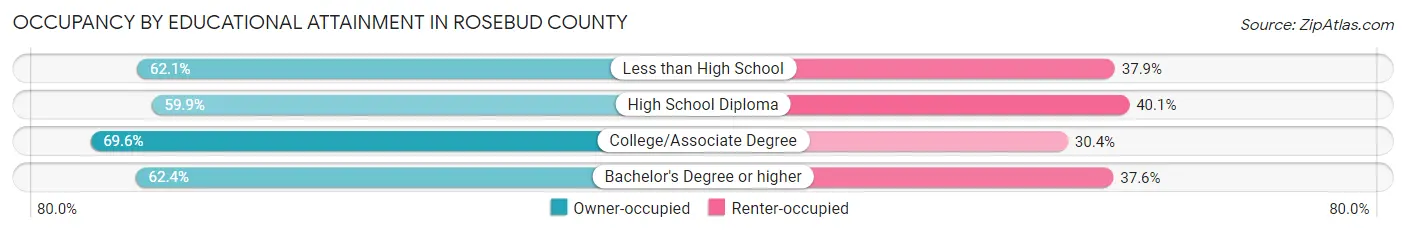
| Household Size | Owner-occupied | Renter-occupied |
| Less than High School | 151 (62.1%) | 92 (37.9%) |
| High School Diploma | 595 (59.9%) | 399 (40.1%) |
| College/Associate Degree | 824 (69.6%) | 360 (30.4%) |
| Bachelor's Degree or higher | 388 (62.4%) | 234 (37.6%) |
Occupancy by Age of Householder in Rosebud County
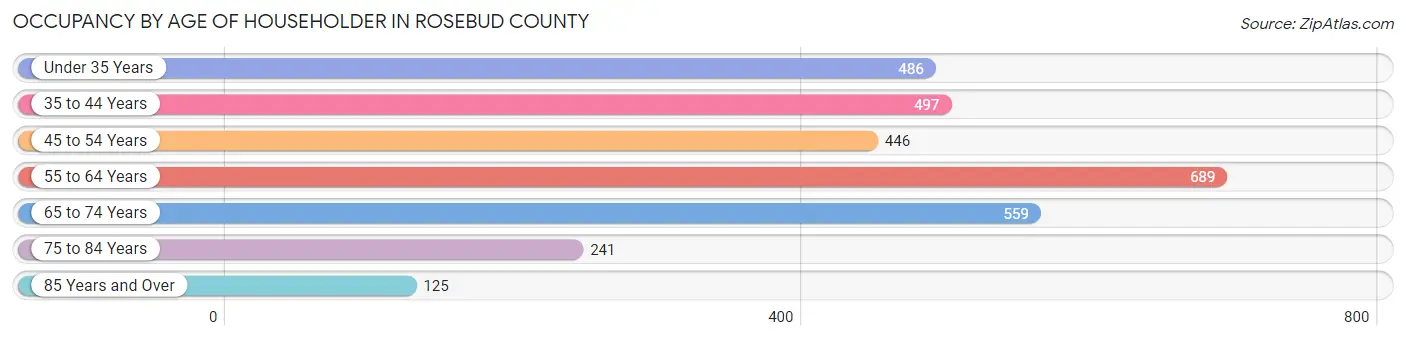
| Age Bracket | # Households | % Households |
| Under 35 Years | 486 | 16.0% |
| 35 to 44 Years | 497 | 16.3% |
| 45 to 54 Years | 446 | 14.7% |
| 55 to 64 Years | 689 | 22.6% |
| 65 to 74 Years | 559 | 18.4% |
| 75 to 84 Years | 241 | 7.9% |
| 85 Years and Over | 125 | 4.1% |
| Total | 3,043 | 100.0% |
Housing Finances in Rosebud County
Median Income by Occupancy in Rosebud County
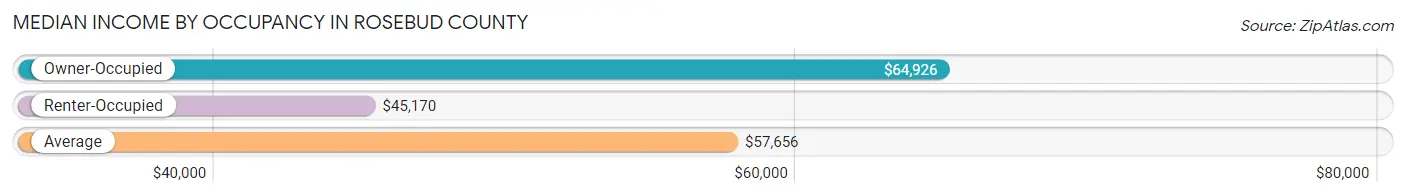
| Occupancy Type | # Households | Median Income |
| Owner-Occupied | 1,958 (64.3%) | $64,926 |
| Renter-Occupied | 1,085 (35.7%) | $45,170 |
| Average | 3,043 (100.0%) | $57,656 |
Occupancy by Householder Income Bracket in Rosebud County
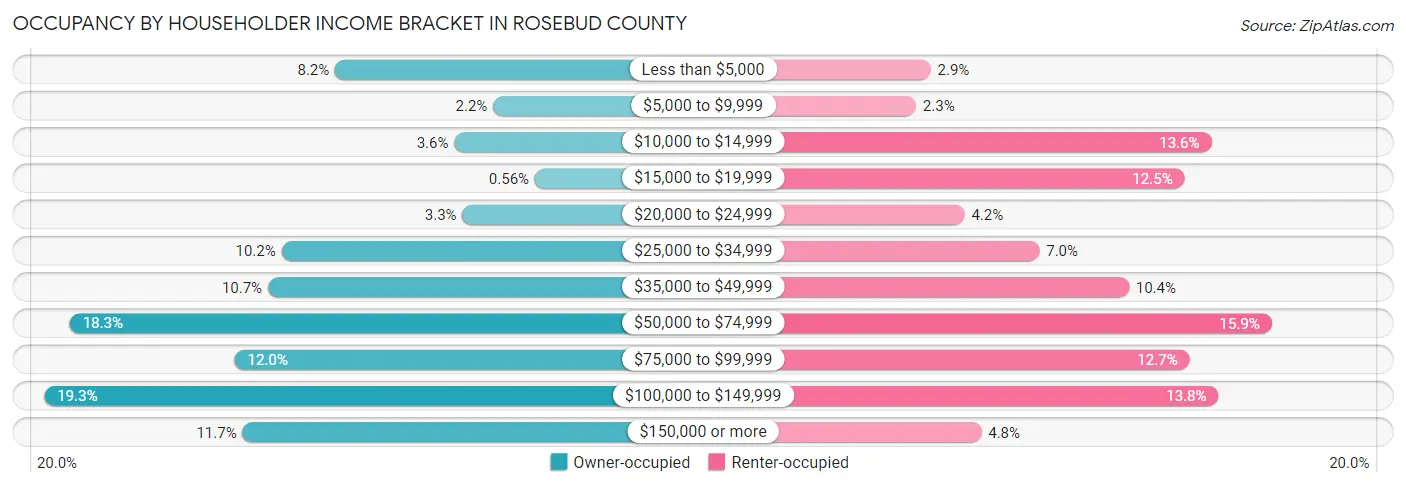
| Income Bracket | Owner-occupied | Renter-occupied |
| Less than $5,000 | 160 (8.2%) | 31 (2.9%) |
| $5,000 to $9,999 | 42 (2.1%) | 25 (2.3%) |
| $10,000 to $14,999 | 71 (3.6%) | 147 (13.6%) |
| $15,000 to $19,999 | 11 (0.6%) | 136 (12.5%) |
| $20,000 to $24,999 | 65 (3.3%) | 45 (4.2%) |
| $25,000 to $34,999 | 200 (10.2%) | 76 (7.0%) |
| $35,000 to $49,999 | 210 (10.7%) | 113 (10.4%) |
| $50,000 to $74,999 | 358 (18.3%) | 172 (15.9%) |
| $75,000 to $99,999 | 235 (12.0%) | 138 (12.7%) |
| $100,000 to $149,999 | 377 (19.3%) | 150 (13.8%) |
| $150,000 or more | 229 (11.7%) | 52 (4.8%) |
| Total | 1,958 (100.0%) | 1,085 (100.0%) |
Monthly Housing Cost Tiers in Rosebud County
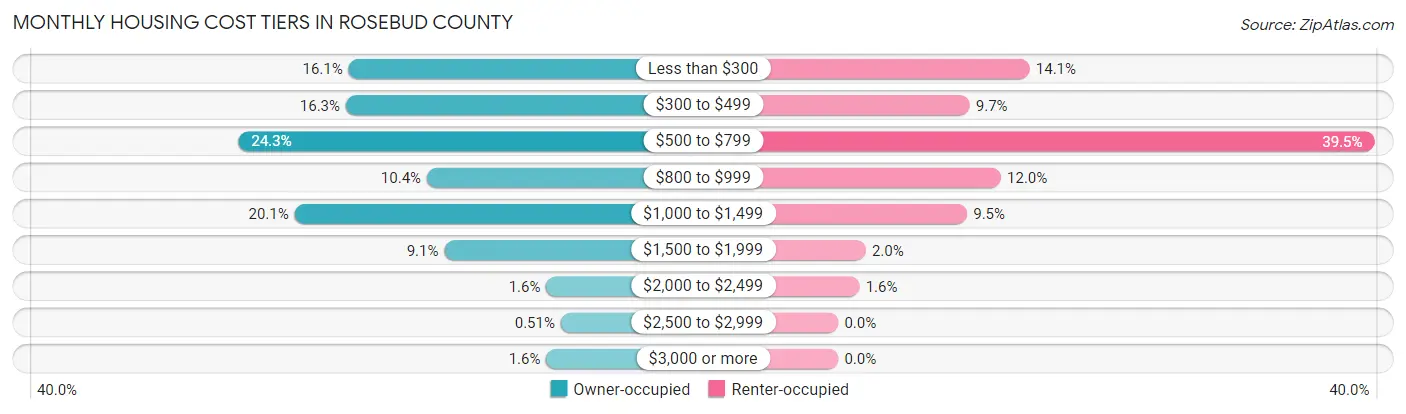
| Monthly Cost | Owner-occupied | Renter-occupied |
| Less than $300 | 316 (16.1%) | 153 (14.1%) |
| $300 to $499 | 320 (16.3%) | 105 (9.7%) |
| $500 to $799 | 475 (24.3%) | 429 (39.5%) |
| $800 to $999 | 203 (10.4%) | 130 (12.0%) |
| $1,000 to $1,499 | 394 (20.1%) | 103 (9.5%) |
| $1,500 to $1,999 | 178 (9.1%) | 22 (2.0%) |
| $2,000 to $2,499 | 31 (1.6%) | 17 (1.6%) |
| $2,500 to $2,999 | 10 (0.5%) | 0 (0.0%) |
| $3,000 or more | 31 (1.6%) | 0 (0.0%) |
| Total | 1,958 (100.0%) | 1,085 (100.0%) |
Physical Housing Characteristics in Rosebud County
Housing Structures in Rosebud County
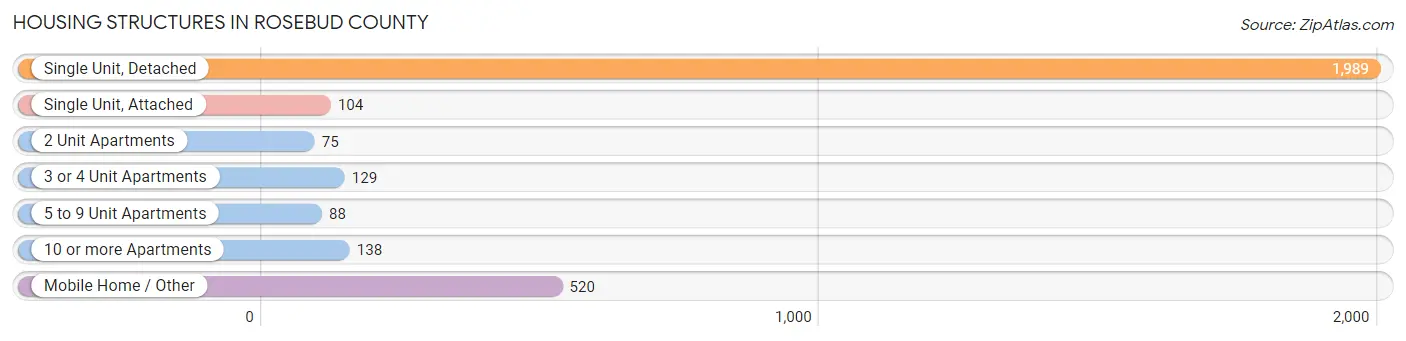
| Structure Type | # Housing Units | % Housing Units |
| Single Unit, Detached | 1,989 | 65.4% |
| Single Unit, Attached | 104 | 3.4% |
| 2 Unit Apartments | 75 | 2.5% |
| 3 or 4 Unit Apartments | 129 | 4.2% |
| 5 to 9 Unit Apartments | 88 | 2.9% |
| 10 or more Apartments | 138 | 4.5% |
| Mobile Home / Other | 520 | 17.1% |
| Total | 3,043 | 100.0% |
Housing Structures by Occupancy in Rosebud County
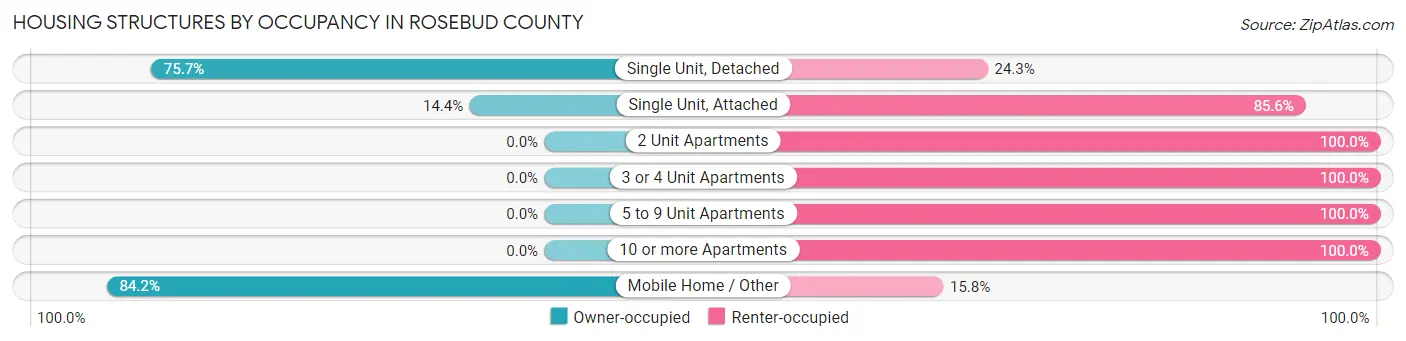
| Structure Type | Owner-occupied | Renter-occupied |
| Single Unit, Detached | 1,505 (75.7%) | 484 (24.3%) |
| Single Unit, Attached | 15 (14.4%) | 89 (85.6%) |
| 2 Unit Apartments | 0 (0.0%) | 75 (100.0%) |
| 3 or 4 Unit Apartments | 0 (0.0%) | 129 (100.0%) |
| 5 to 9 Unit Apartments | 0 (0.0%) | 88 (100.0%) |
| 10 or more Apartments | 0 (0.0%) | 138 (100.0%) |
| Mobile Home / Other | 438 (84.2%) | 82 (15.8%) |
| Total | 1,958 (64.3%) | 1,085 (35.7%) |
Housing Structures by Number of Rooms in Rosebud County
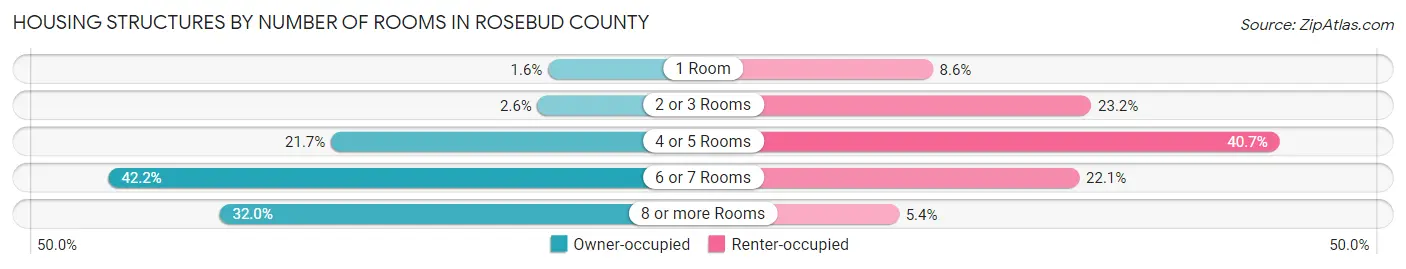
| Number of Rooms | Owner-occupied | Renter-occupied |
| 1 Room | 31 (1.6%) | 93 (8.6%) |
| 2 or 3 Rooms | 50 (2.5%) | 252 (23.2%) |
| 4 or 5 Rooms | 424 (21.6%) | 441 (40.6%) |
| 6 or 7 Rooms | 827 (42.2%) | 240 (22.1%) |
| 8 or more Rooms | 626 (32.0%) | 59 (5.4%) |
| Total | 1,958 (100.0%) | 1,085 (100.0%) |
Housing Structure by Heating Type in Rosebud County
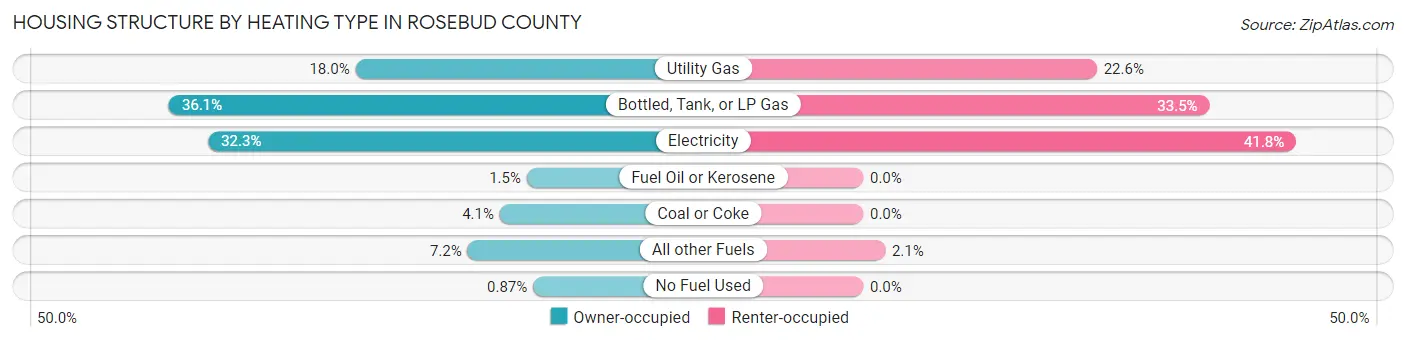
| Heating Type | Owner-occupied | Renter-occupied |
| Utility Gas | 353 (18.0%) | 245 (22.6%) |
| Bottled, Tank, or LP Gas | 706 (36.1%) | 363 (33.5%) |
| Electricity | 632 (32.3%) | 454 (41.8%) |
| Fuel Oil or Kerosene | 29 (1.5%) | 0 (0.0%) |
| Coal or Coke | 80 (4.1%) | 0 (0.0%) |
| All other Fuels | 141 (7.2%) | 23 (2.1%) |
| No Fuel Used | 17 (0.9%) | 0 (0.0%) |
| Total | 1,958 (100.0%) | 1,085 (100.0%) |
Household Vehicle Usage in Rosebud County
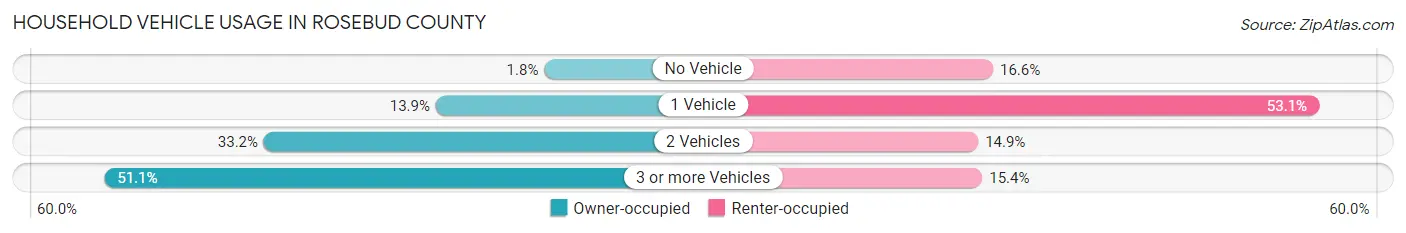
| Vehicles per Household | Owner-occupied | Renter-occupied |
| No Vehicle | 35 (1.8%) | 180 (16.6%) |
| 1 Vehicle | 273 (13.9%) | 576 (53.1%) |
| 2 Vehicles | 650 (33.2%) | 162 (14.9%) |
| 3 or more Vehicles | 1,000 (51.1%) | 167 (15.4%) |
| Total | 1,958 (100.0%) | 1,085 (100.0%) |
Real Estate & Mortgages in Rosebud County
Real Estate and Mortgage Overview in Rosebud County
| Characteristic | Without Mortgage | With Mortgage |
| Housing Units | 1,206 | 752 |
| Median Property Value | $116,200 | $182,000 |
| Median Household Income | $45,156 | $107 |
| Monthly Housing Costs | $485 | $31 |
| Real Estate Taxes | $798 | $37 |
Property Value by Mortgage Status in Rosebud County
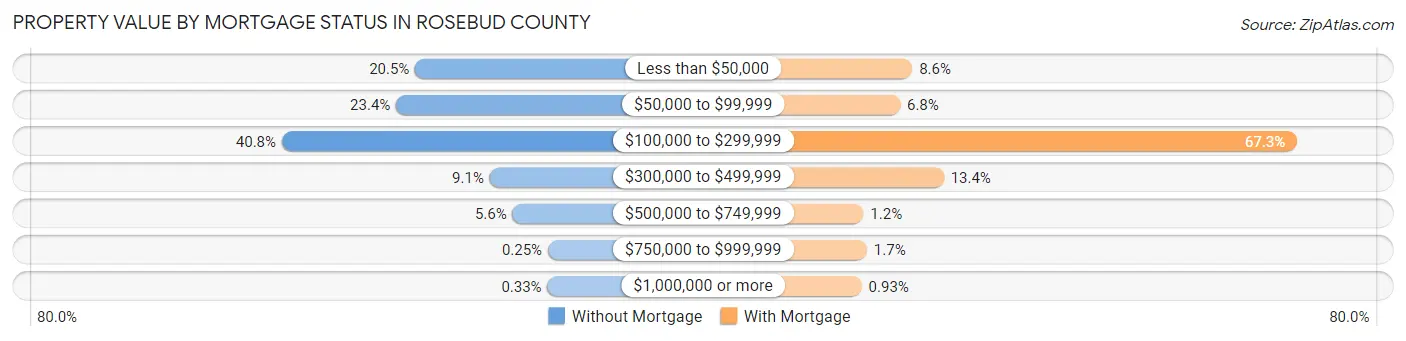
| Property Value | Without Mortgage | With Mortgage |
| Less than $50,000 | 247 (20.5%) | 65 (8.6%) |
| $50,000 to $99,999 | 282 (23.4%) | 51 (6.8%) |
| $100,000 to $299,999 | 492 (40.8%) | 506 (67.3%) |
| $300,000 to $499,999 | 110 (9.1%) | 101 (13.4%) |
| $500,000 to $749,999 | 68 (5.6%) | 9 (1.2%) |
| $750,000 to $999,999 | 3 (0.3%) | 13 (1.7%) |
| $1,000,000 or more | 4 (0.3%) | 7 (0.9%) |
| Total | 1,206 (100.0%) | 752 (100.0%) |
Household Income by Mortgage Status in Rosebud County
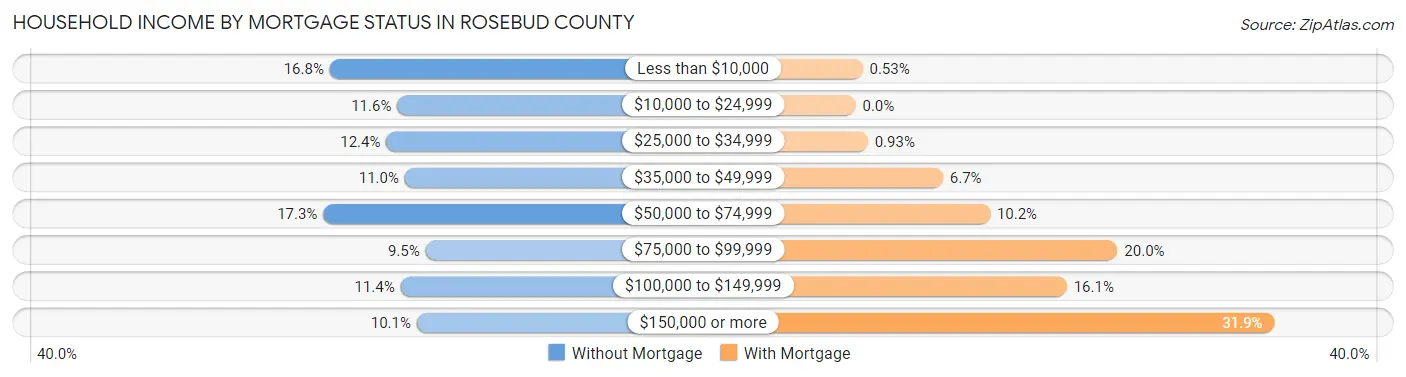
| Household Income | Without Mortgage | With Mortgage |
| Less than $10,000 | 202 (16.8%) | 4 (0.5%) |
| $10,000 to $24,999 | 140 (11.6%) | 0 (0.0%) |
| $25,000 to $34,999 | 150 (12.4%) | 7 (0.9%) |
| $35,000 to $49,999 | 133 (11.0%) | 50 (6.7%) |
| $50,000 to $74,999 | 208 (17.2%) | 77 (10.2%) |
| $75,000 to $99,999 | 114 (9.5%) | 150 (20.0%) |
| $100,000 to $149,999 | 137 (11.4%) | 121 (16.1%) |
| $150,000 or more | 122 (10.1%) | 240 (31.9%) |
| Total | 1,206 (100.0%) | 752 (100.0%) |
Property Value to Household Income Ratio in Rosebud County
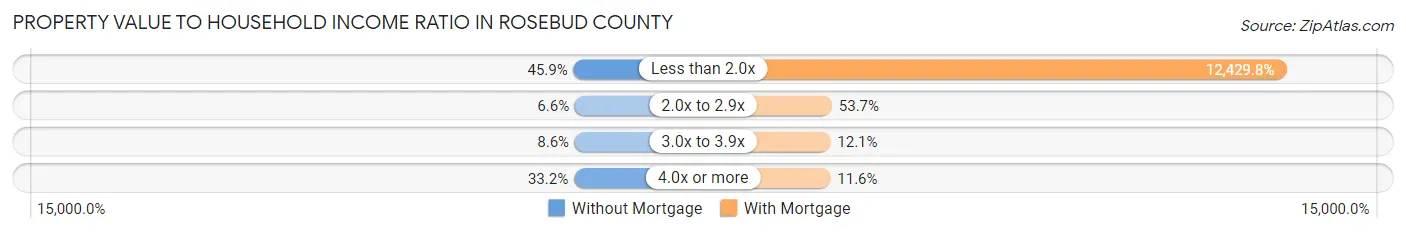
| Value-to-Income Ratio | Without Mortgage | With Mortgage |
| Less than 2.0x | 554 (45.9%) | 93,472 (12,429.8%) |
| 2.0x to 2.9x | 80 (6.6%) | 404 (53.7%) |
| 3.0x to 3.9x | 104 (8.6%) | 91 (12.1%) |
| 4.0x or more | 400 (33.2%) | 87 (11.6%) |
| Total | 1,206 (100.0%) | 752 (100.0%) |
Real Estate Taxes by Mortgage Status in Rosebud County
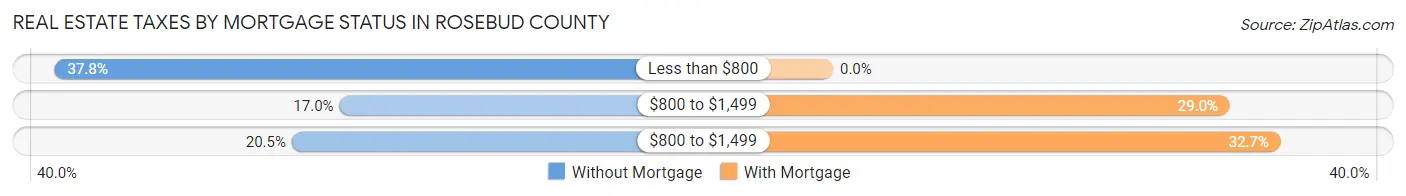
| Property Taxes | Without Mortgage | With Mortgage |
| Less than $800 | 456 (37.8%) | 0 (0.0%) |
| $800 to $1,499 | 205 (17.0%) | 218 (29.0%) |
| $800 to $1,499 | 247 (20.5%) | 246 (32.7%) |
| Total | 1,206 (100.0%) | 752 (100.0%) |
Health & Disability in Rosebud County
Health Insurance Coverage by Age in Rosebud County
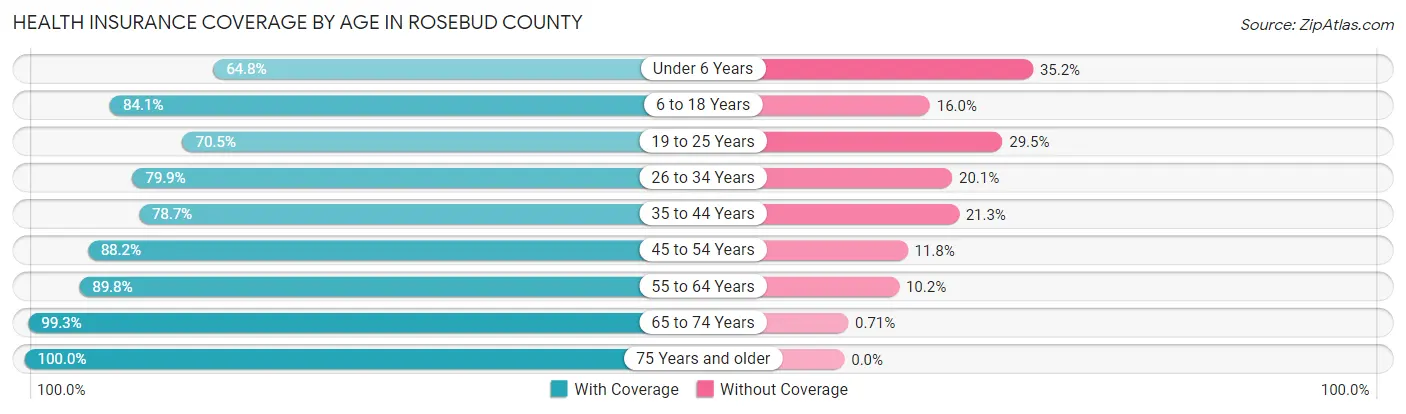
| Age Bracket | With Coverage | Without Coverage |
| Under 6 Years | 549 (64.8%) | 298 (35.2%) |
| 6 to 18 Years | 1,412 (84.1%) | 268 (16.0%) |
| 19 to 25 Years | 498 (70.5%) | 208 (29.5%) |
| 26 to 34 Years | 612 (79.9%) | 154 (20.1%) |
| 35 to 44 Years | 771 (78.7%) | 209 (21.3%) |
| 45 to 54 Years | 689 (88.2%) | 92 (11.8%) |
| 55 to 64 Years | 1,021 (89.8%) | 116 (10.2%) |
| 65 to 74 Years | 843 (99.3%) | 6 (0.7%) |
| 75 Years and older | 485 (100.0%) | 0 (0.0%) |
| Total | 6,880 (83.6%) | 1,351 (16.4%) |
Health Insurance Coverage by Citizenship Status in Rosebud County
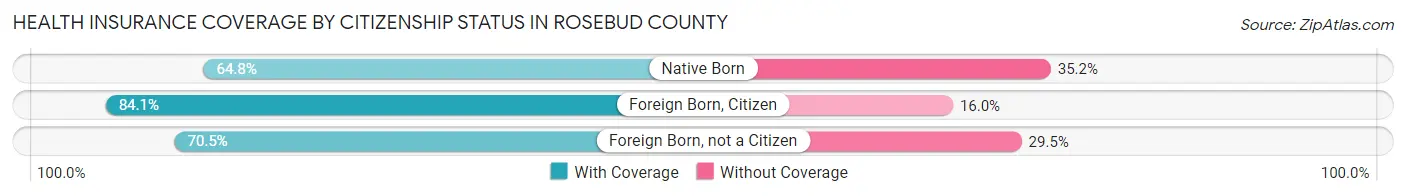
| Citizenship Status | With Coverage | Without Coverage |
| Native Born | 549 (64.8%) | 298 (35.2%) |
| Foreign Born, Citizen | 1,412 (84.1%) | 268 (16.0%) |
| Foreign Born, not a Citizen | 498 (70.5%) | 208 (29.5%) |
Health Insurance Coverage by Household Income in Rosebud County
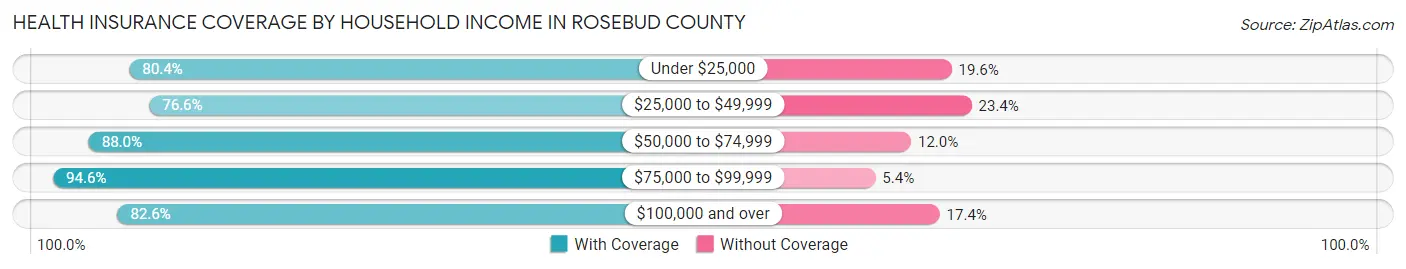
| Household Income | With Coverage | Without Coverage |
| Under $25,000 | 1,174 (80.4%) | 287 (19.6%) |
| $25,000 to $49,999 | 1,075 (76.6%) | 328 (23.4%) |
| $50,000 to $74,999 | 1,227 (88.0%) | 168 (12.0%) |
| $75,000 to $99,999 | 936 (94.6%) | 53 (5.4%) |
| $100,000 and over | 2,444 (82.6%) | 515 (17.4%) |
Public vs Private Health Insurance Coverage by Age in Rosebud County
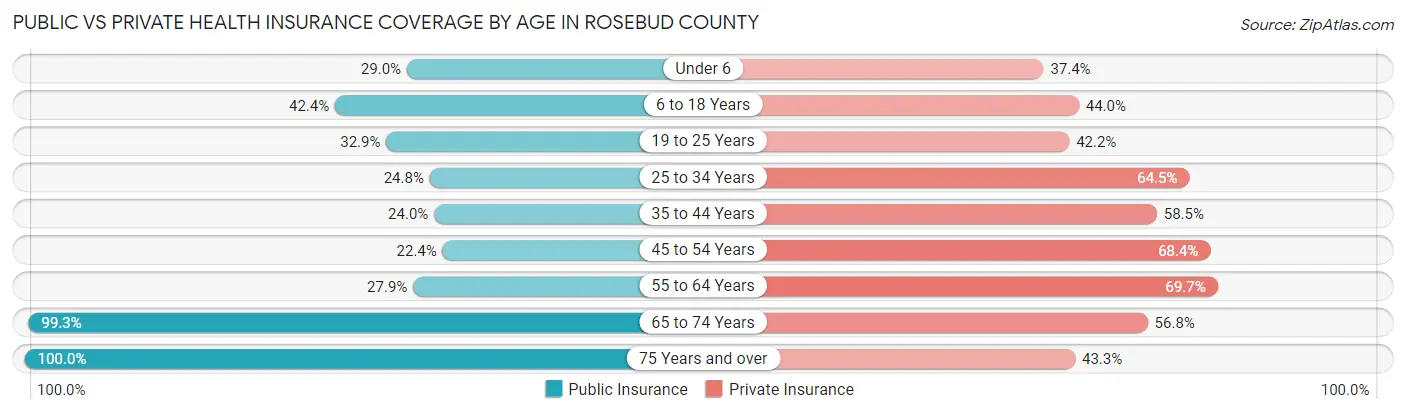
| Age Bracket | Public Insurance | Private Insurance |
| Under 6 | 246 (29.0%) | 317 (37.4%) |
| 6 to 18 Years | 712 (42.4%) | 739 (44.0%) |
| 19 to 25 Years | 232 (32.9%) | 298 (42.2%) |
| 25 to 34 Years | 190 (24.8%) | 494 (64.5%) |
| 35 to 44 Years | 235 (24.0%) | 573 (58.5%) |
| 45 to 54 Years | 175 (22.4%) | 534 (68.4%) |
| 55 to 64 Years | 317 (27.9%) | 793 (69.7%) |
| 65 to 74 Years | 843 (99.3%) | 482 (56.8%) |
| 75 Years and over | 485 (100.0%) | 210 (43.3%) |
| Total | 3,435 (41.7%) | 4,440 (53.9%) |
Disability Status by Sex by Age in Rosebud County
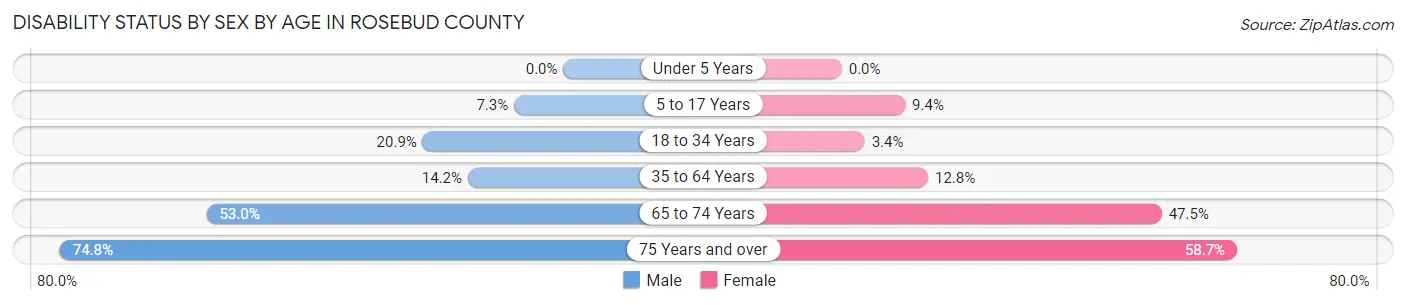
| Age Bracket | Male | Female |
| Under 5 Years | 0 (0.0%) | 0 (0.0%) |
| 5 to 17 Years | 63 (7.3%) | 83 (9.4%) |
| 18 to 34 Years | 160 (20.9%) | 28 (3.4%) |
| 35 to 64 Years | 205 (14.2%) | 186 (12.8%) |
| 65 to 74 Years | 248 (53.0%) | 181 (47.5%) |
| 75 Years and over | 160 (74.8%) | 159 (58.7%) |
Disability Class by Sex by Age in Rosebud County
Disability Class: Hearing Difficulty
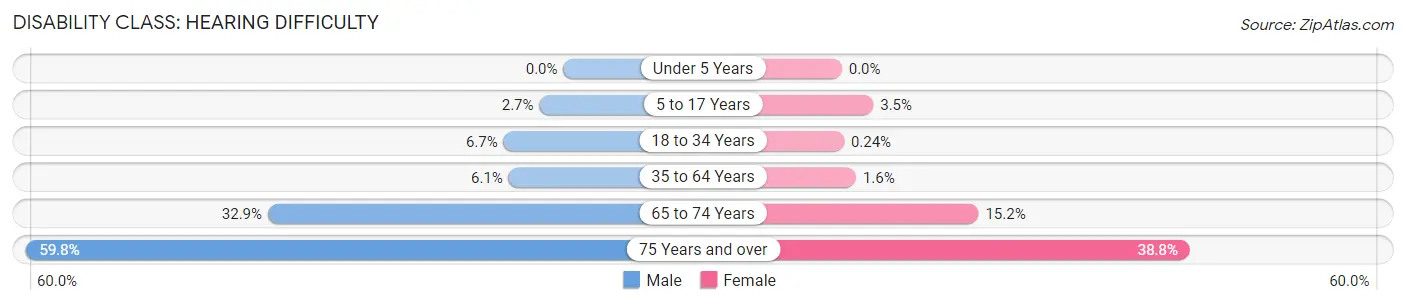
| Age Bracket | Male | Female |
| Under 5 Years | 0 (0.0%) | 0 (0.0%) |
| 5 to 17 Years | 23 (2.7%) | 31 (3.5%) |
| 18 to 34 Years | 51 (6.7%) | 2 (0.2%) |
| 35 to 64 Years | 88 (6.1%) | 23 (1.6%) |
| 65 to 74 Years | 154 (32.9%) | 58 (15.2%) |
| 75 Years and over | 128 (59.8%) | 105 (38.8%) |
Disability Class: Vision Difficulty
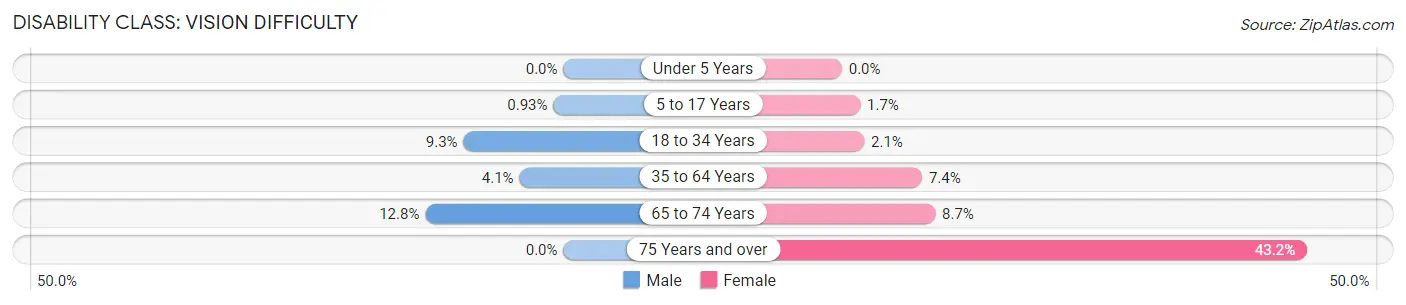
| Age Bracket | Male | Female |
| Under 5 Years | 0 (0.0%) | 0 (0.0%) |
| 5 to 17 Years | 8 (0.9%) | 15 (1.7%) |
| 18 to 34 Years | 71 (9.3%) | 17 (2.1%) |
| 35 to 64 Years | 59 (4.1%) | 108 (7.4%) |
| 65 to 74 Years | 60 (12.8%) | 33 (8.7%) |
| 75 Years and over | 0 (0.0%) | 117 (43.2%) |
Disability Class: Cognitive Difficulty
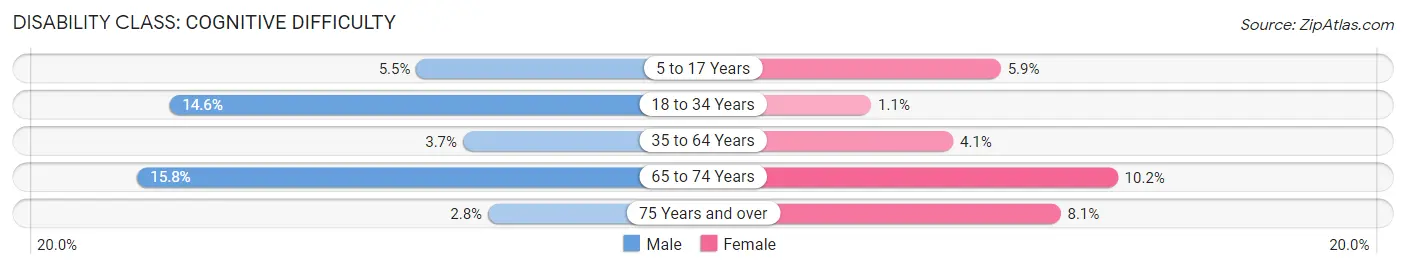
| Age Bracket | Male | Female |
| 5 to 17 Years | 47 (5.5%) | 52 (5.9%) |
| 18 to 34 Years | 112 (14.6%) | 9 (1.1%) |
| 35 to 64 Years | 54 (3.7%) | 60 (4.1%) |
| 65 to 74 Years | 74 (15.8%) | 39 (10.2%) |
| 75 Years and over | 6 (2.8%) | 22 (8.1%) |
Disability Class: Ambulatory Difficulty
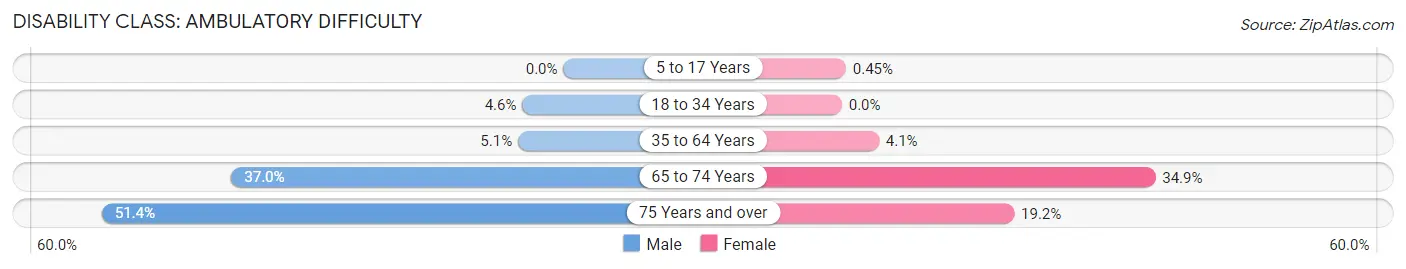
| Age Bracket | Male | Female |
| 5 to 17 Years | 0 (0.0%) | 4 (0.4%) |
| 18 to 34 Years | 35 (4.6%) | 0 (0.0%) |
| 35 to 64 Years | 73 (5.1%) | 60 (4.1%) |
| 65 to 74 Years | 173 (37.0%) | 133 (34.9%) |
| 75 Years and over | 110 (51.4%) | 52 (19.2%) |
Disability Class: Self-Care Difficulty
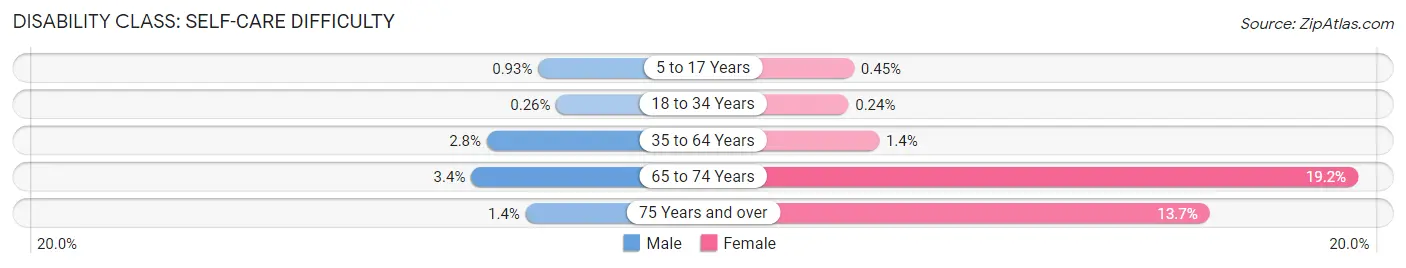
| Age Bracket | Male | Female |
| 5 to 17 Years | 8 (0.9%) | 4 (0.4%) |
| 18 to 34 Years | 2 (0.3%) | 2 (0.2%) |
| 35 to 64 Years | 41 (2.8%) | 20 (1.4%) |
| 65 to 74 Years | 16 (3.4%) | 73 (19.2%) |
| 75 Years and over | 3 (1.4%) | 37 (13.7%) |
Technology Access in Rosebud County
Computing Device Access in Rosebud County
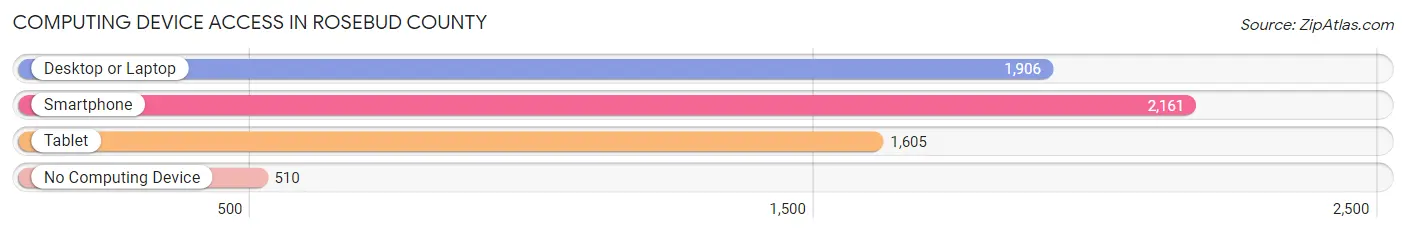
| Device Type | # Households | % Households |
| Desktop or Laptop | 1,906 | 62.6% |
| Smartphone | 2,161 | 71.0% |
| Tablet | 1,605 | 52.7% |
| No Computing Device | 510 | 16.8% |
| Total | 3,043 | 100.0% |
Internet Access in Rosebud County
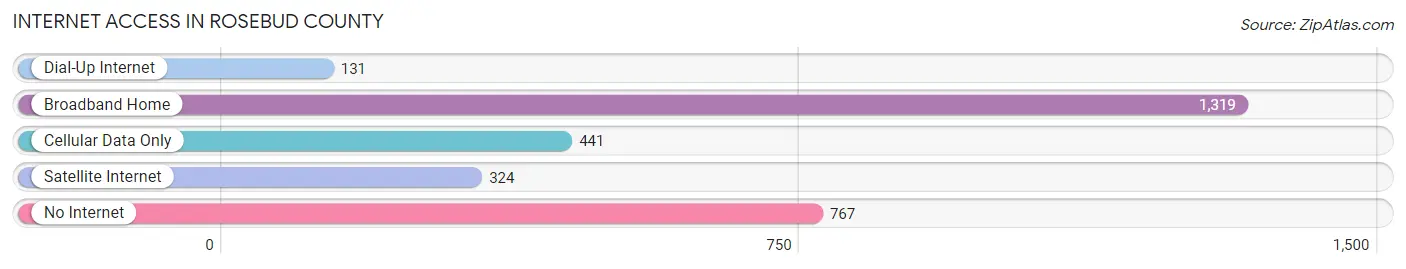
| Internet Type | # Households | % Households |
| Dial-Up Internet | 131 | 4.3% |
| Broadband Home | 1,319 | 43.3% |
| Cellular Data Only | 441 | 14.5% |
| Satellite Internet | 324 | 10.6% |
| No Internet | 767 | 25.2% |
| Total | 3,043 | 100.0% |
Rosebud County Summary
Rosebud County is located in the southeastern corner of Montana, and is bordered by Yellowstone County to the north, Big Horn County to the east, Carbon County to the south, and Treasure County to the west. The county seat is Forsyth, and the largest city is Colstrip. Rosebud County covers an area of 2,717 square miles, and has a population of 9,845 as of the 2010 census.
History
Rosebud County was established in 1901, and was named after the Rosebud River, which flows through the county. The county was originally inhabited by the Crow and Northern Cheyenne tribes, and was part of the Crow Indian Reservation until the late 19th century. The area was opened to homesteaders in the 1880s, and the town of Forsyth was established in 1887. The county was officially organized in 1901, and the county seat was moved to Forsyth in 1902.
Geography
Rosebud County is located in the southeastern corner of Montana, and is bordered by Yellowstone County to the north, Big Horn County to the east, Carbon County to the south, and Treasure County to the west. The county covers an area of 2,717 square miles, and is mostly comprised of rolling hills and prairies. The county is home to the Rosebud River, which flows through the county from north to south. The county also contains several small lakes, including Lake Elmo, Lake Francis, and Lake Josephine.
Economy
The economy of Rosebud County is largely based on agriculture and energy production. The county is home to several large farms, which produce a variety of crops, including wheat, barley, oats, and hay. The county is also home to several large coal mines, which produce coal for use in power plants. The county is also home to several oil and gas wells, which produce oil and natural gas for use in the region.
Demographics
As of the 2010 census, Rosebud County had a population of 9,845. The population was spread out with a median age of 38.7 years. The racial makeup of the county was 87.3% White, 0.7% African American, 8.2% Native American, 0.3% Asian, 0.1% Pacific Islander, 0.7% from other races, and 2.7% from two or more races. The population was also spread out with 24.3% under the age of 18, 8.2% from 18 to 24, 25.2% from 25 to 44, 28.2% from 45 to 64, and 13.9% who were 65 years of age or older. The median income for a household in the county was $37,941, and the median income for a family was $45,938. The per capita income for the county was $18,945.
Rosebud County is a rural county with a strong agricultural and energy production base. The county is home to a diverse population, and has a strong economy. The county is also home to several small towns and communities, which provide a variety of services and amenities to the residents of the county.
Common Questions
What is Per Capita Income in Rosebud County?
Per Capita income in Rosebud County is $27,655.
What is the Median Family Income in Rosebud County?
Median Family Income in Rosebud County is $66,975.
What is the Median Household income in Rosebud County?
Median Household Income in Rosebud County is $57,656.
What is Income or Wage Gap in Rosebud County?
Income or Wage Gap in Rosebud County is 32.8%.
Women in Rosebud County earn 67.2 cents for every dollar earned by a man.
What is Family Income Deficit in Rosebud County?
Family Income Deficit in Rosebud County is $17,253.
Families that are below poverty line in Rosebud County earn $17,253 less on average than the poverty threshold level.
What is Inequality or Gini Index in Rosebud County?
Inequality or Gini Index in Rosebud County is 0.45.
What is the Total Population of Rosebud County?
Total Population of Rosebud County is 8,310.
What is the Total Male Population of Rosebud County?
Total Male Population of Rosebud County is 4,176.
What is the Total Female Population of Rosebud County?
Total Female Population of Rosebud County is 4,134.
What is the Ratio of Males per 100 Females in Rosebud County?
There are 101.02 Males per 100 Females in Rosebud County.
What is the Ratio of Females per 100 Males in Rosebud County?
There are 98.99 Females per 100 Males in Rosebud County.
What is the Median Population Age in Rosebud County?
Median Population Age in Rosebud County is 36.4 Years.
What is the Average Family Size in Rosebud County
Average Family Size in Rosebud County is 3.5 People.
What is the Average Household Size in Rosebud County
Average Household Size in Rosebud County is 2.7 People.
How Large is the Labor Force in Rosebud County?
There are 3,617 People in the Labor Forcein in Rosebud County.
What is the Percentage of People in the Labor Force in Rosebud County?
58.8% of People are in the Labor Force in Rosebud County.
What is the Unemployment Rate in Rosebud County?
Unemployment Rate in Rosebud County is 9.2%.