Jefferson County, MT Map & Demographics
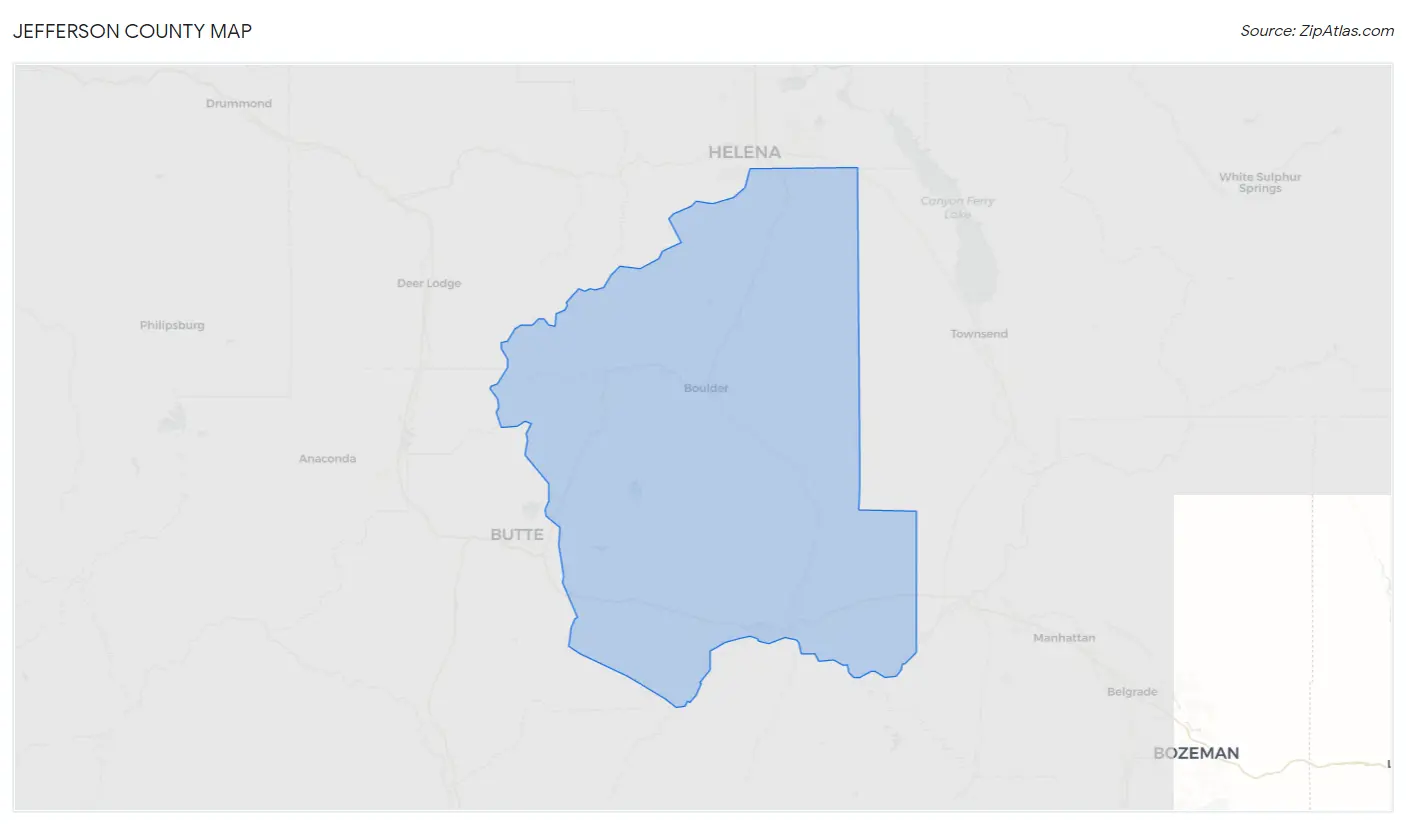
Jefferson County Map
Jefferson County Overview
$39,963
PER CAPITA INCOME
$89,914
AVG FAMILY INCOME
$73,875
AVG HOUSEHOLD INCOME
40.8%
WAGE / INCOME GAP [ % ]
59.2¢/ $1
WAGE / INCOME GAP [ $ ]
$10,446
FAMILY INCOME DEFICIT
0.43
INEQUALITY / GINI INDEX
12,273
TOTAL POPULATION
6,282
MALE POPULATION
5,991
FEMALE POPULATION
104.86
MALES / 100 FEMALES
95.37
FEMALES / 100 MALES
47.4
MEDIAN AGE
3.0
AVG FAMILY SIZE
2.6
AVG HOUSEHOLD SIZE
5,821
LABOR FORCE [ PEOPLE ]
57.5%
PERCENT IN LABOR FORCE
3.4%
UNEMPLOYMENT RATE
Jefferson County Area Codes
Income in Jefferson County
Income Overview in Jefferson County
Per Capita Income in Jefferson County is $39,963, while median incomes of families and households are $89,914 and $73,875 respectively.
| Characteristic | Number | Measure |
| Per Capita Income | 12,273 | $39,963 |
| Median Family Income | 3,520 | $89,914 |
| Mean Family Income | 3,520 | $115,348 |
| Median Household Income | 4,681 | $73,875 |
| Mean Household Income | 4,681 | $101,042 |
| Income Deficit | 3,520 | $10,446 |
| Wage / Income Gap (%) | 12,273 | 40.85% |
| Wage / Income Gap ($) | 12,273 | 59.15¢ per $1 |
| Gini / Inequality Index | 12,273 | 0.43 |
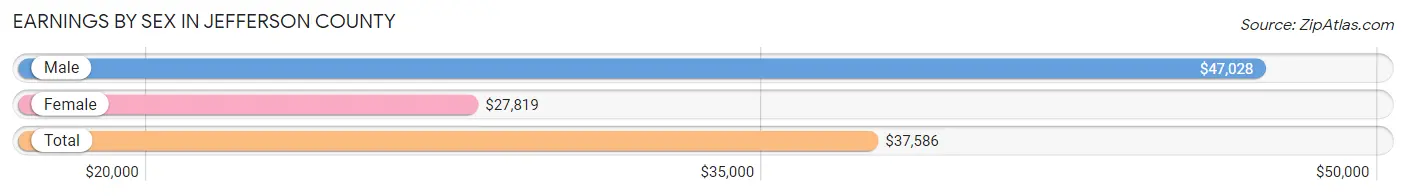
Earnings by Sex in Jefferson County
Average Earnings in Jefferson County are $37,586, $47,028 for men and $27,819 for women, a difference of 40.8%.
| Sex | Number | Average Earnings |
| Male | 3,427 (52.9%) | $47,028 |
| Female | 3,047 (47.1%) | $27,819 |
| Total | 6,474 (100.0%) | $37,586 |
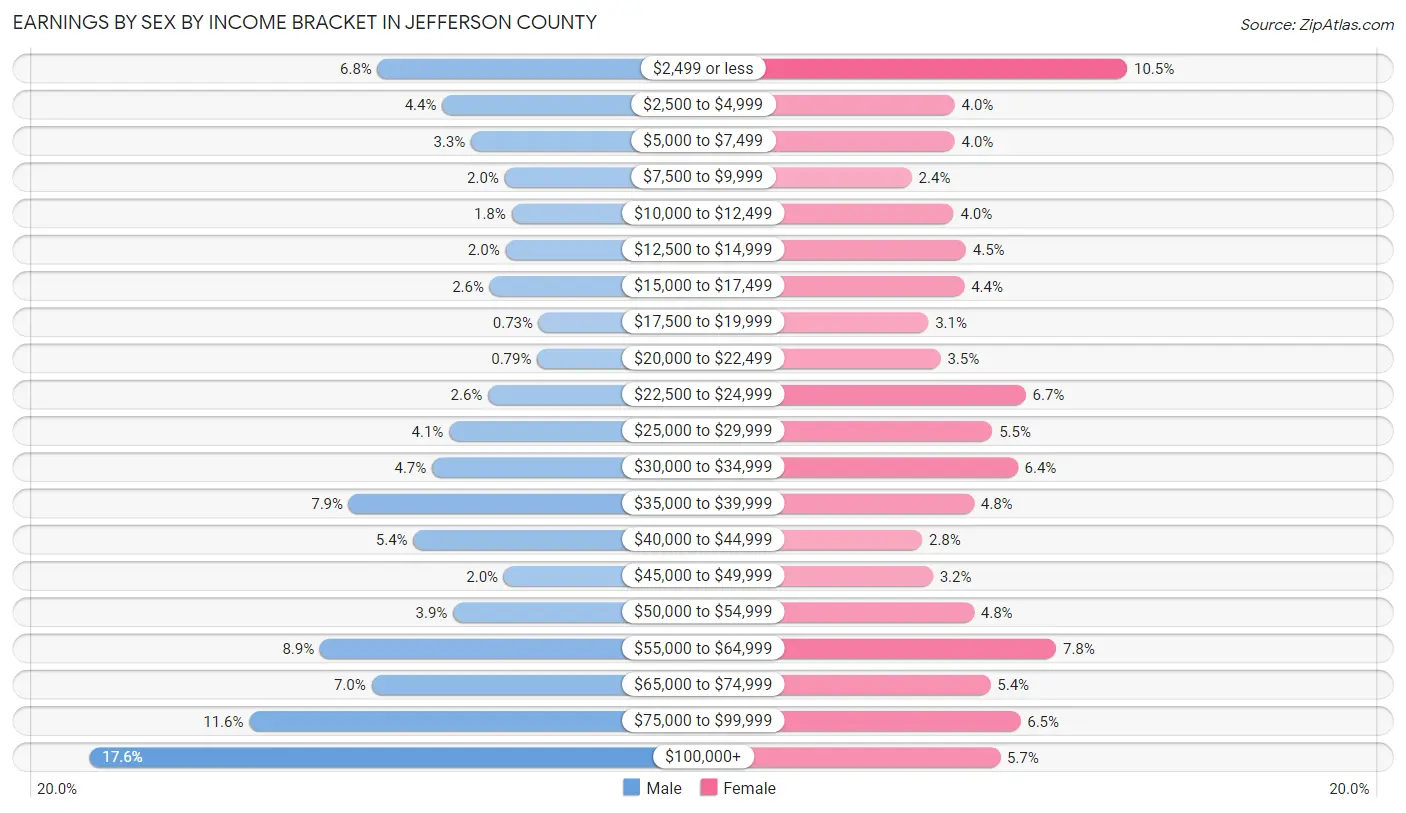
Earnings by Sex by Income Bracket in Jefferson County
The most common earnings brackets in Jefferson County are $100,000+ for men (602 | 17.6%) and $2,499 or less for women (320 | 10.5%).
| Income | Male | Female |
| $2,499 or less | 232 (6.8%) | 320 (10.5%) |
| $2,500 to $4,999 | 149 (4.3%) | 123 (4.0%) |
| $5,000 to $7,499 | 112 (3.3%) | 123 (4.0%) |
| $7,500 to $9,999 | 69 (2.0%) | 74 (2.4%) |
| $10,000 to $12,499 | 60 (1.8%) | 122 (4.0%) |
| $12,500 to $14,999 | 68 (2.0%) | 136 (4.5%) |
| $15,000 to $17,499 | 88 (2.6%) | 134 (4.4%) |
| $17,500 to $19,999 | 25 (0.7%) | 93 (3.0%) |
| $20,000 to $22,499 | 27 (0.8%) | 107 (3.5%) |
| $22,500 to $24,999 | 90 (2.6%) | 204 (6.7%) |
| $25,000 to $29,999 | 140 (4.1%) | 166 (5.4%) |
| $30,000 to $34,999 | 162 (4.7%) | 195 (6.4%) |
| $35,000 to $39,999 | 269 (7.9%) | 145 (4.8%) |
| $40,000 to $44,999 | 186 (5.4%) | 86 (2.8%) |
| $45,000 to $49,999 | 70 (2.0%) | 98 (3.2%) |
| $50,000 to $54,999 | 135 (3.9%) | 145 (4.8%) |
| $55,000 to $64,999 | 306 (8.9%) | 239 (7.8%) |
| $65,000 to $74,999 | 240 (7.0%) | 164 (5.4%) |
| $75,000 to $99,999 | 397 (11.6%) | 198 (6.5%) |
| $100,000+ | 602 (17.6%) | 175 (5.7%) |
| Total | 3,427 (100.0%) | 3,047 (100.0%) |
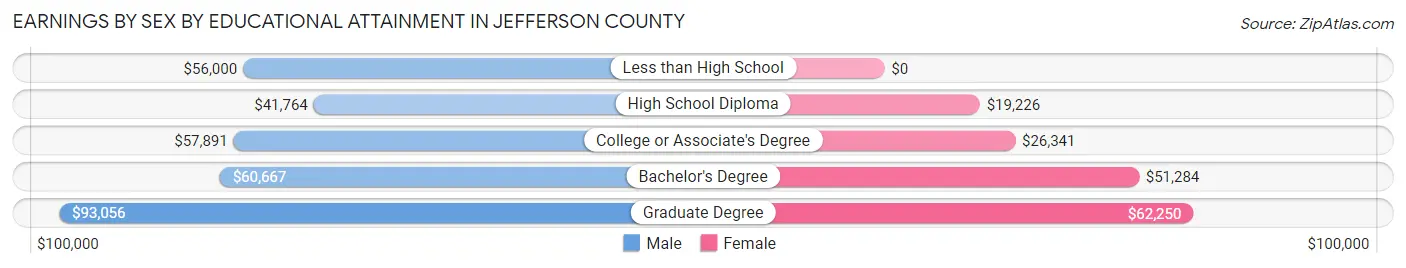
Earnings by Sex by Educational Attainment in Jefferson County
Average earnings in Jefferson County are $56,090 for men and $32,679 for women, a difference of 41.7%. Men with an educational attainment of graduate degree enjoy the highest average annual earnings of $93,056, while those with high school diploma education earn the least with $41,764. Women with an educational attainment of graduate degree earn the most with the average annual earnings of $62,250, while those with high school diploma education have the smallest earnings of $19,226.
| Educational Attainment | Male Income | Female Income |
| Less than High School | $56,000 | $0 |
| High School Diploma | $41,764 | $19,226 |
| College or Associate's Degree | $57,891 | $26,341 |
| Bachelor's Degree | $60,667 | $51,284 |
| Graduate Degree | $93,056 | $62,250 |
| Total | $56,090 | $32,679 |
Family Income in Jefferson County
Family Income Brackets in Jefferson County
According to the Jefferson County family income data, there are 767 families falling into the $50,000 to $74,999 income range, which is the most common income bracket and makes up 21.8% of all families. Conversely, the $10,000 to $14,999 income bracket is the least frequent group with only 21 families (0.6%) belonging to this category.
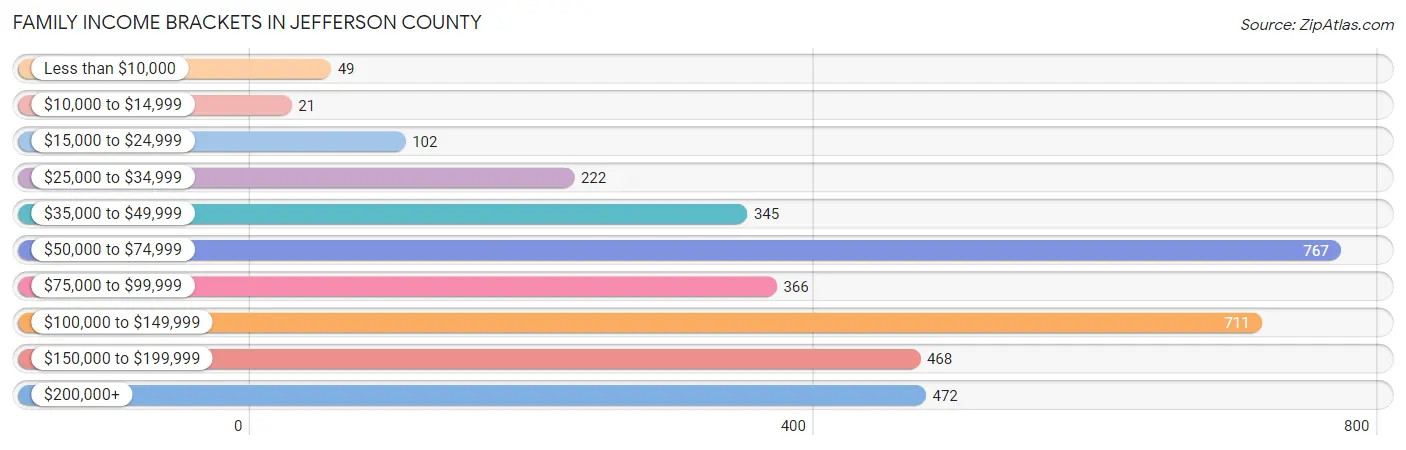
| Income Bracket | # Families | % Families |
| Less than $10,000 | 49 | 1.4% |
| $10,000 to $14,999 | 21 | 0.6% |
| $15,000 to $24,999 | 102 | 2.9% |
| $25,000 to $34,999 | 222 | 6.3% |
| $35,000 to $49,999 | 345 | 9.8% |
| $50,000 to $74,999 | 767 | 21.8% |
| $75,000 to $99,999 | 366 | 10.4% |
| $100,000 to $149,999 | 711 | 20.2% |
| $150,000 to $199,999 | 468 | 13.3% |
| $200,000+ | 472 | 13.4% |
Family Income by Famaliy Size in Jefferson County
7+ person families (77 | 2.2%) account for the highest median family income in Jefferson County with $146,964 per family, while 2-person families (1,961 | 55.7%) have the highest median income of $39,062 per family member.
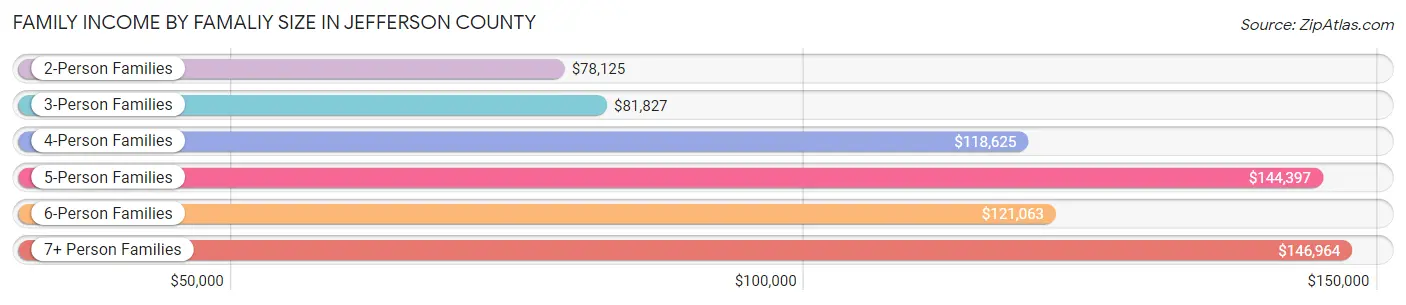
| Income Bracket | # Families | Median Income |
| 2-Person Families | 1,961 (55.7%) | $78,125 |
| 3-Person Families | 611 (17.4%) | $81,827 |
| 4-Person Families | 616 (17.5%) | $118,625 |
| 5-Person Families | 192 (5.4%) | $144,397 |
| 6-Person Families | 63 (1.8%) | $121,063 |
| 7+ Person Families | 77 (2.2%) | $146,964 |
| Total | 3,520 (100.0%) | $89,914 |
Family Income by Number of Earners in Jefferson County
The median family income in Jefferson County is $89,914, with families comprising 3+ earners (333) having the highest median family income of $153,438, while families with no earners (712) have the lowest median family income of $56,406, accounting for 9.5% and 20.2% of families, respectively.
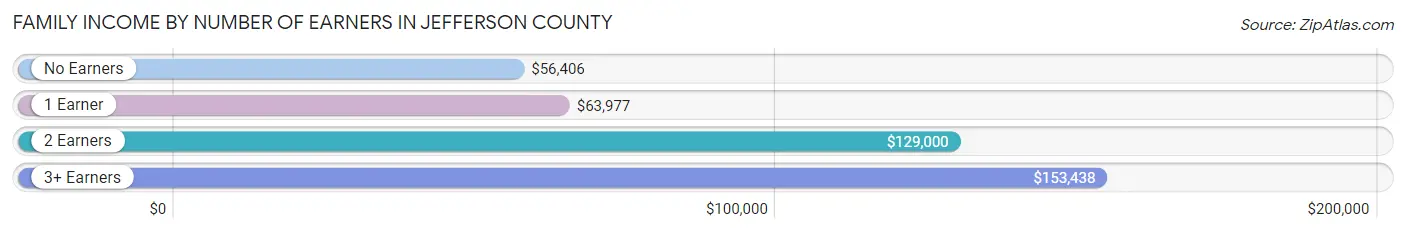
| Number of Earners | # Families | Median Income |
| No Earners | 712 (20.2%) | $56,406 |
| 1 Earner | 995 (28.3%) | $63,977 |
| 2 Earners | 1,480 (42.0%) | $129,000 |
| 3+ Earners | 333 (9.5%) | $153,438 |
| Total | 3,520 (100.0%) | $89,914 |
Household Income in Jefferson County
Household Income Brackets in Jefferson County
With 964 households falling in the category, the $50,000 to $74,999 income range is the most frequent in Jefferson County, accounting for 20.6% of all households. In contrast, only 61 households (1.3%) fall into the $10,000 to $14,999 income bracket, making it the least populous group.
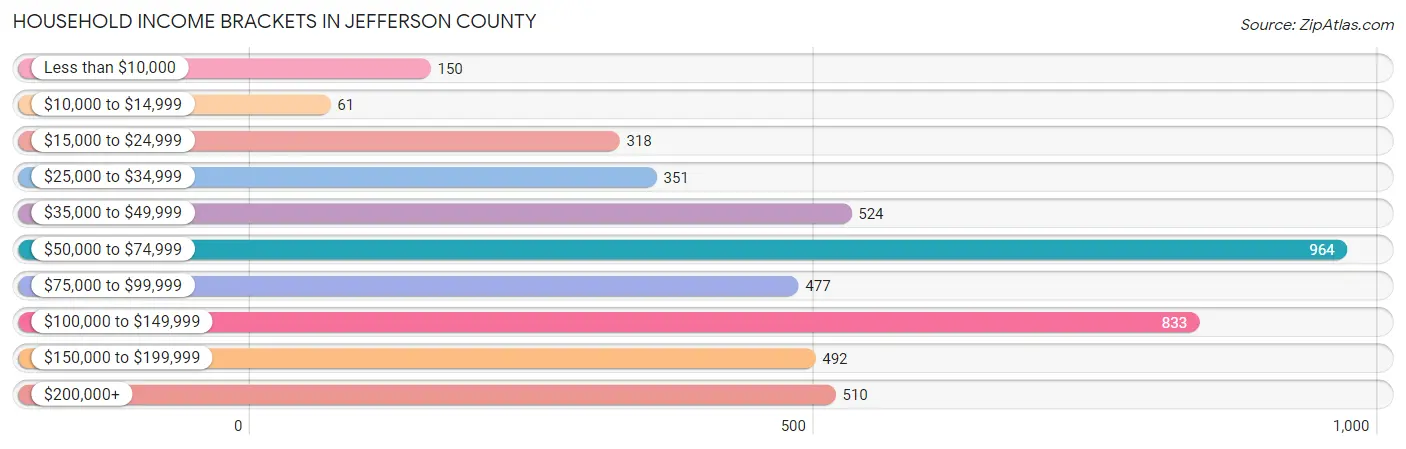
| Income Bracket | # Households | % Households |
| Less than $10,000 | 150 | 3.2% |
| $10,000 to $14,999 | 61 | 1.3% |
| $15,000 to $24,999 | 318 | 6.8% |
| $25,000 to $34,999 | 351 | 7.5% |
| $35,000 to $49,999 | 524 | 11.2% |
| $50,000 to $74,999 | 964 | 20.6% |
| $75,000 to $99,999 | 477 | 10.2% |
| $100,000 to $149,999 | 833 | 17.8% |
| $150,000 to $199,999 | 492 | 10.5% |
| $200,000+ | 510 | 10.9% |
Household Income by Householder Age in Jefferson County
The median household income in Jefferson County is $73,875, with the highest median household income of $96,447 found in the 45 to 64 years age bracket for the primary householder. A total of 1,958 households (41.8%) fall into this category. Meanwhile, the 15 to 24 years age bracket for the primary householder has the lowest median household income of $0, with 12 households (0.3%) in this group.
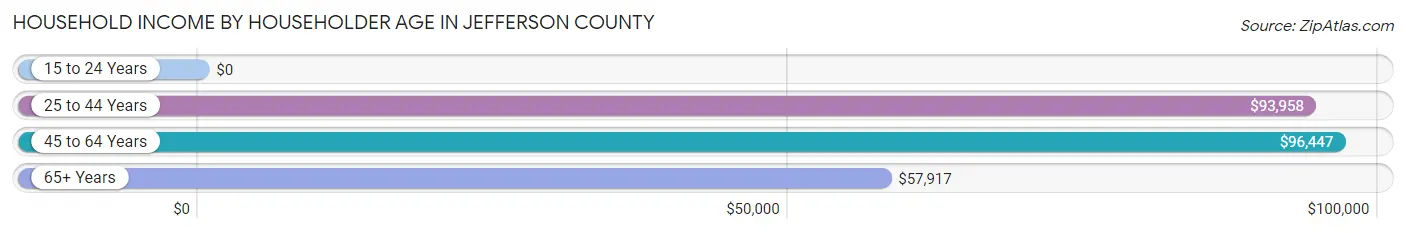
| Income Bracket | # Households | Median Income |
| 15 to 24 Years | 12 (0.3%) | $0 |
| 25 to 44 Years | 1,087 (23.2%) | $93,958 |
| 45 to 64 Years | 1,958 (41.8%) | $96,447 |
| 65+ Years | 1,624 (34.7%) | $57,917 |
| Total | 4,681 (100.0%) | $73,875 |
Poverty in Jefferson County
Income Below Poverty by Sex and Age in Jefferson County
With 4.5% poverty level for males and 5.6% for females among the residents of Jefferson County, 55 to 64 year old males and 15 year old females are the most vulnerable to poverty, with 115 males (10.9%) and 27 females (26.2%) in their respective age groups living below the poverty level.
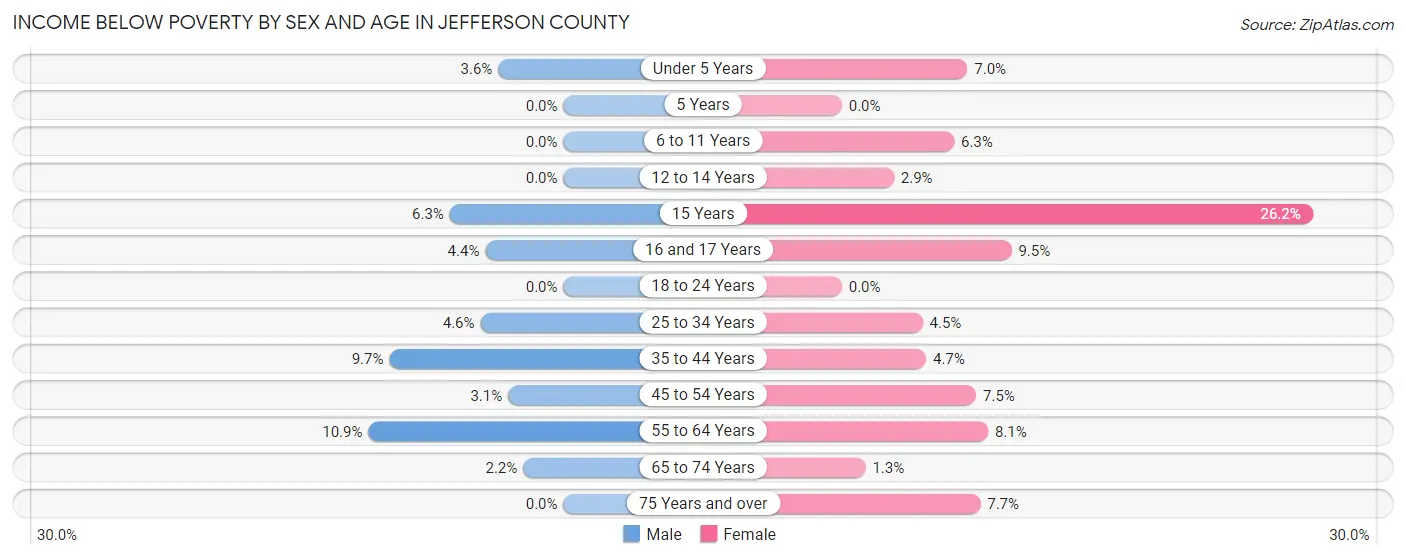
| Age Bracket | Male | Female |
| Under 5 Years | 11 (3.6%) | 16 (7.0%) |
| 5 Years | 0 (0.0%) | 0 (0.0%) |
| 6 to 11 Years | 0 (0.0%) | 26 (6.2%) |
| 12 to 14 Years | 0 (0.0%) | 6 (2.9%) |
| 15 Years | 5 (6.3%) | 27 (26.2%) |
| 16 and 17 Years | 8 (4.3%) | 12 (9.5%) |
| 18 to 24 Years | 0 (0.0%) | 0 (0.0%) |
| 25 to 34 Years | 26 (4.6%) | 24 (4.5%) |
| 35 to 44 Years | 69 (9.7%) | 30 (4.7%) |
| 45 to 54 Years | 25 (3.1%) | 60 (7.5%) |
| 55 to 64 Years | 115 (10.9%) | 86 (8.1%) |
| 65 to 74 Years | 22 (2.2%) | 12 (1.3%) |
| 75 Years and over | 0 (0.0%) | 29 (7.7%) |
| Total | 281 (4.5%) | 328 (5.6%) |
Income Above Poverty by Sex and Age in Jefferson County
According to the poverty statistics in Jefferson County, males aged 5 years and females aged 5 years are the age groups that are most secure financially, with 100.0% of males and 100.0% of females in these age groups living above the poverty line.
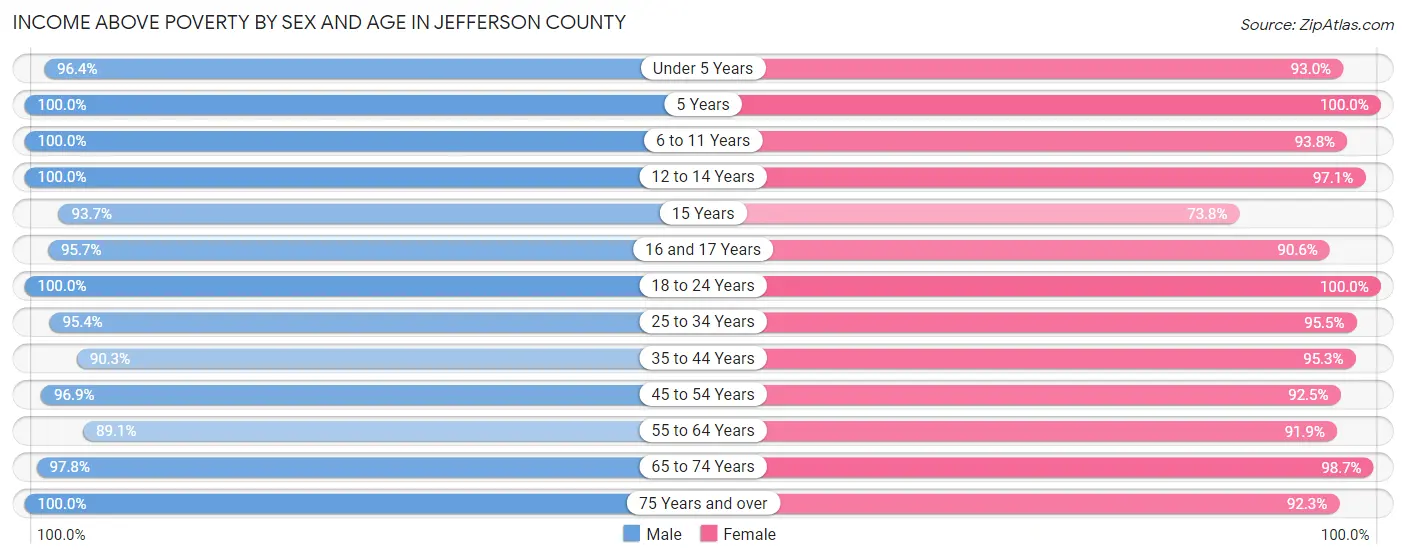
| Age Bracket | Male | Female |
| Under 5 Years | 292 (96.4%) | 213 (93.0%) |
| 5 Years | 102 (100.0%) | 42 (100.0%) |
| 6 to 11 Years | 431 (100.0%) | 390 (93.8%) |
| 12 to 14 Years | 159 (100.0%) | 201 (97.1%) |
| 15 Years | 74 (93.7%) | 76 (73.8%) |
| 16 and 17 Years | 176 (95.7%) | 115 (90.5%) |
| 18 to 24 Years | 397 (100.0%) | 405 (100.0%) |
| 25 to 34 Years | 537 (95.4%) | 509 (95.5%) |
| 35 to 44 Years | 643 (90.3%) | 609 (95.3%) |
| 45 to 54 Years | 786 (96.9%) | 742 (92.5%) |
| 55 to 64 Years | 944 (89.1%) | 970 (91.9%) |
| 65 to 74 Years | 959 (97.8%) | 895 (98.7%) |
| 75 Years and over | 424 (100.0%) | 347 (92.3%) |
| Total | 5,924 (95.5%) | 5,514 (94.4%) |
Income Below Poverty Among Married-Couple Families in Jefferson County
The poverty statistics for married-couple families in Jefferson County show that 1.1% or 33 of the total 3,136 families live below the poverty line. Families with 3 or 4 children have the highest poverty rate of 1.8%, comprising of 5 families. On the other hand, families with 1 or 2 children have the lowest poverty rate of 0.0%, which includes 0 families.
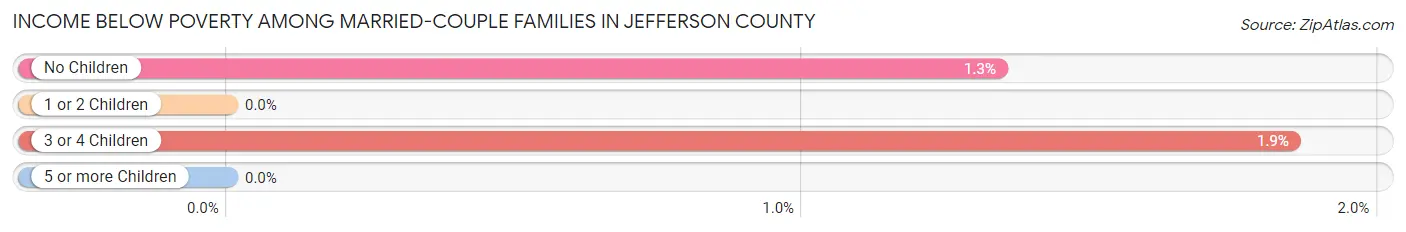
| Children | Above Poverty | Below Poverty |
| No Children | 2,062 (98.7%) | 28 (1.3%) |
| 1 or 2 Children | 748 (100.0%) | 0 (0.0%) |
| 3 or 4 Children | 266 (98.2%) | 5 (1.8%) |
| 5 or more Children | 27 (100.0%) | 0 (0.0%) |
| Total | 3,103 (99.0%) | 33 (1.1%) |
Income Below Poverty Among Single-Parent Households in Jefferson County
According to the poverty data in Jefferson County, 12.6% or 20 single-father households and 15.1% or 34 single-mother households are living below the poverty line. Among single-father households, those with 1 or 2 children have the highest poverty rate, with 20 households (20.6%) experiencing poverty. Likewise, among single-mother households, those with 3 or 4 children have the highest poverty rate, with 9 households (33.3%) falling below the poverty line.
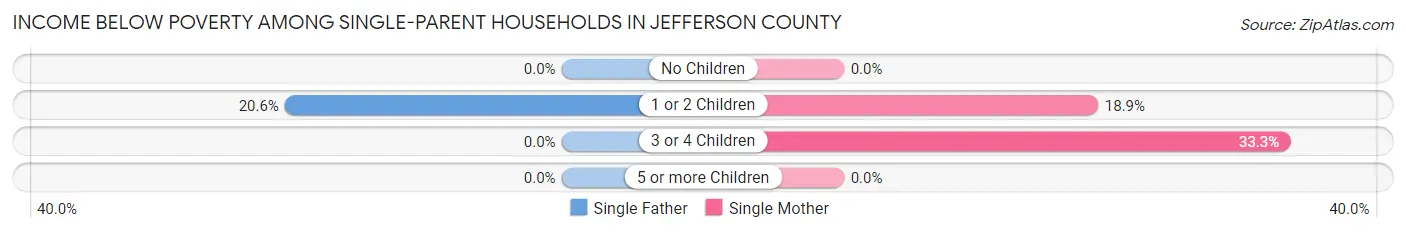
| Children | Single Father | Single Mother |
| No Children | 0 (0.0%) | 0 (0.0%) |
| 1 or 2 Children | 20 (20.6%) | 25 (18.9%) |
| 3 or 4 Children | 0 (0.0%) | 9 (33.3%) |
| 5 or more Children | 0 (0.0%) | 0 (0.0%) |
| Total | 20 (12.6%) | 34 (15.1%) |
Income Below Poverty Among Married-Couple vs Single-Parent Households in Jefferson County
The poverty data for Jefferson County shows that 33 of the married-couple family households (1.1%) and 54 of the single-parent households (14.1%) are living below the poverty level. Within the married-couple family households, those with 3 or 4 children have the highest poverty rate, with 5 households (1.8%) falling below the poverty line. Among the single-parent households, those with 3 or 4 children have the highest poverty rate, with 9 household (24.3%) living below poverty.
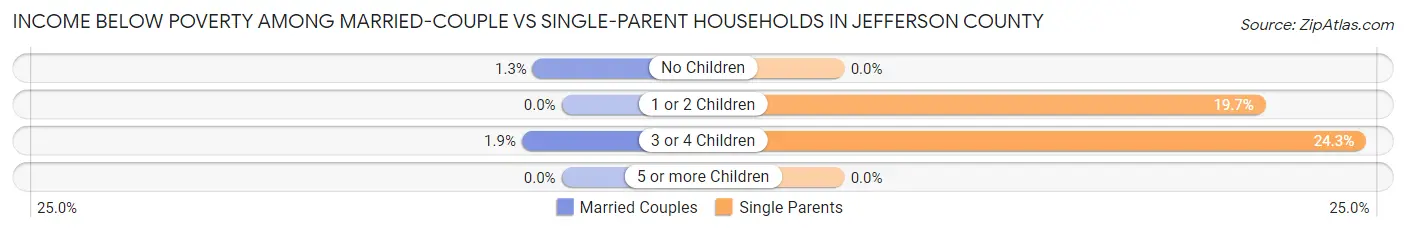
| Children | Married-Couple Families | Single-Parent Households |
| No Children | 28 (1.3%) | 0 (0.0%) |
| 1 or 2 Children | 0 (0.0%) | 45 (19.7%) |
| 3 or 4 Children | 5 (1.8%) | 9 (24.3%) |
| 5 or more Children | 0 (0.0%) | 0 (0.0%) |
| Total | 33 (1.1%) | 54 (14.1%) |
Race in Jefferson County
The most populous races in Jefferson County are White / Caucasian (11,437 | 93.2%), Two or more Races (535 | 4.4%), and Hispanic or Latino (366 | 3.0%).
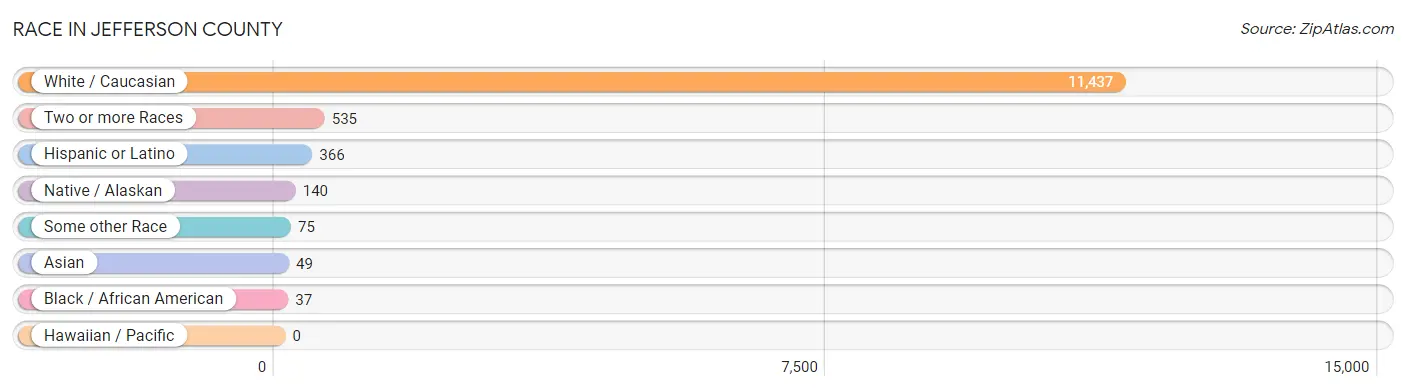
| Race | # Population | % Population |
| Asian | 49 | 0.4% |
| Black / African American | 37 | 0.3% |
| Hawaiian / Pacific | 0 | 0.0% |
| Hispanic or Latino | 366 | 3.0% |
| Native / Alaskan | 140 | 1.1% |
| White / Caucasian | 11,437 | 93.2% |
| Two or more Races | 535 | 4.4% |
| Some other Race | 75 | 0.6% |
| Total | 12,273 | 100.0% |
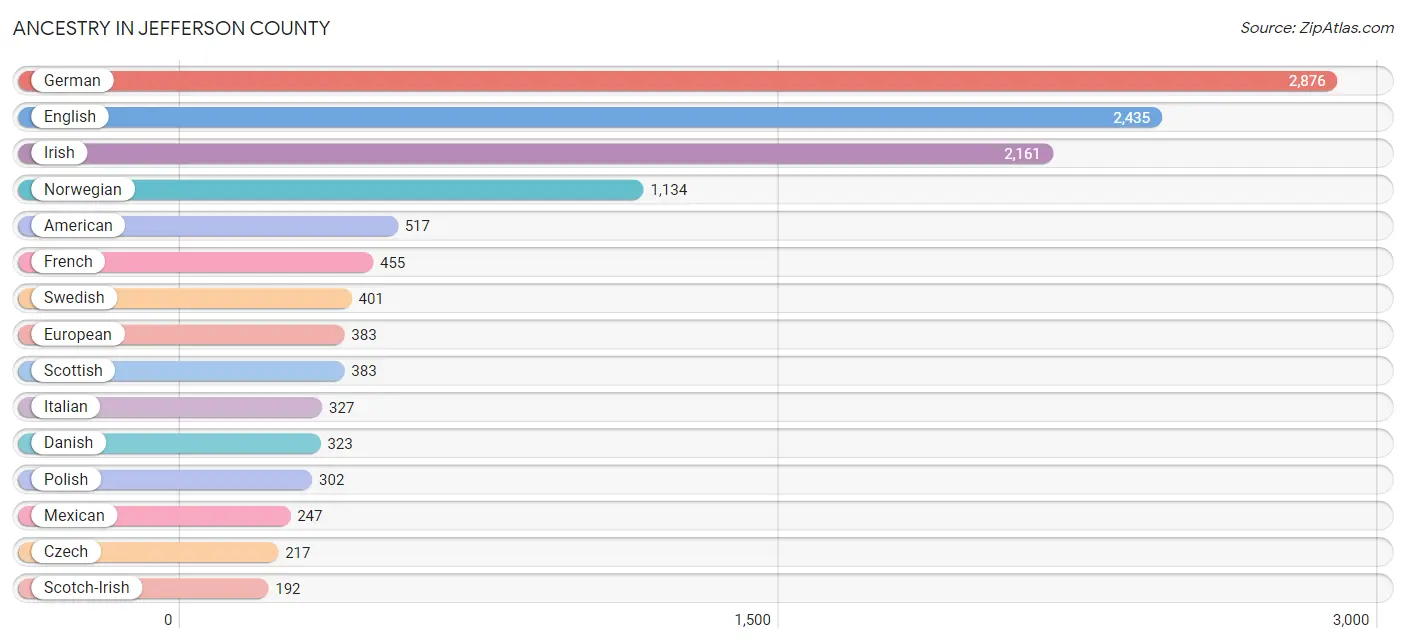
Ancestry in Jefferson County
The most populous ancestries reported in Jefferson County are German (2,876 | 23.4%), English (2,435 | 19.8%), Irish (2,161 | 17.6%), Norwegian (1,134 | 9.2%), and American (517 | 4.2%), together accounting for 74.3% of all Jefferson County residents.
| Ancestry | # Population | % Population |
| Alaska Native | 4 | 0.0% |
| American | 517 | 4.2% |
| Apache | 6 | 0.1% |
| Arab | 5 | 0.0% |
| Austrian | 17 | 0.1% |
| Basque | 30 | 0.2% |
| Bhutanese | 18 | 0.2% |
| Blackfeet | 99 | 0.8% |
| British | 145 | 1.2% |
| Bulgarian | 7 | 0.1% |
| Burmese | 85 | 0.7% |
| Canadian | 13 | 0.1% |
| Cherokee | 55 | 0.4% |
| Cheyenne | 9 | 0.1% |
| Chippewa | 26 | 0.2% |
| Comanche | 30 | 0.2% |
| Cree | 5 | 0.0% |
| Croatian | 34 | 0.3% |
| Crow | 5 | 0.0% |
| Cuban | 3 | 0.0% |
| Czech | 217 | 1.8% |
| Danish | 323 | 2.6% |
| Dutch | 117 | 0.9% |
| Eastern European | 34 | 0.3% |
| English | 2,435 | 19.8% |
| Ethiopian | 9 | 0.1% |
| European | 383 | 3.1% |
| Finnish | 154 | 1.3% |
| French | 455 | 3.7% |
| French American Indian | 2 | 0.0% |
| French Canadian | 158 | 1.3% |
| German | 2,876 | 23.4% |
| Greek | 83 | 0.7% |
| Hungarian | 38 | 0.3% |
| Indian (Asian) | 4 | 0.0% |
| Irish | 2,161 | 17.6% |
| Italian | 327 | 2.7% |
| Lithuanian | 10 | 0.1% |
| Mexican | 247 | 2.0% |
| Native Hawaiian | 4 | 0.0% |
| Navajo | 3 | 0.0% |
| Northern European | 28 | 0.2% |
| Norwegian | 1,134 | 9.2% |
| Polish | 302 | 2.5% |
| Potawatomi | 8 | 0.1% |
| Romanian | 11 | 0.1% |
| Russian | 146 | 1.2% |
| Scandinavian | 191 | 1.6% |
| Scotch-Irish | 192 | 1.6% |
| Scottish | 383 | 3.1% |
| Serbian | 10 | 0.1% |
| Sioux | 20 | 0.2% |
| Slavic | 1 | 0.0% |
| Slovak | 3 | 0.0% |
| Slovene | 23 | 0.2% |
| South American | 47 | 0.4% |
| Spaniard | 9 | 0.1% |
| Spanish | 21 | 0.2% |
| Subsaharan African | 9 | 0.1% |
| Swedish | 401 | 3.3% |
| Swiss | 60 | 0.5% |
| Ukrainian | 10 | 0.1% |
| Venezuelan | 47 | 0.4% |
| Welsh | 88 | 0.7% |
| Yaqui | 4 | 0.0% |
| Yugoslavian | 20 | 0.2% | View All 66 Rows |
Immigrants in Jefferson County
The most numerous immigrant groups reported in Jefferson County came from Canada (95 | 0.8%), Latin America (66 | 0.5%), Central America (53 | 0.4%), Europe (53 | 0.4%), and Mexico (53 | 0.4%), together accounting for 2.6% of all Jefferson County residents.
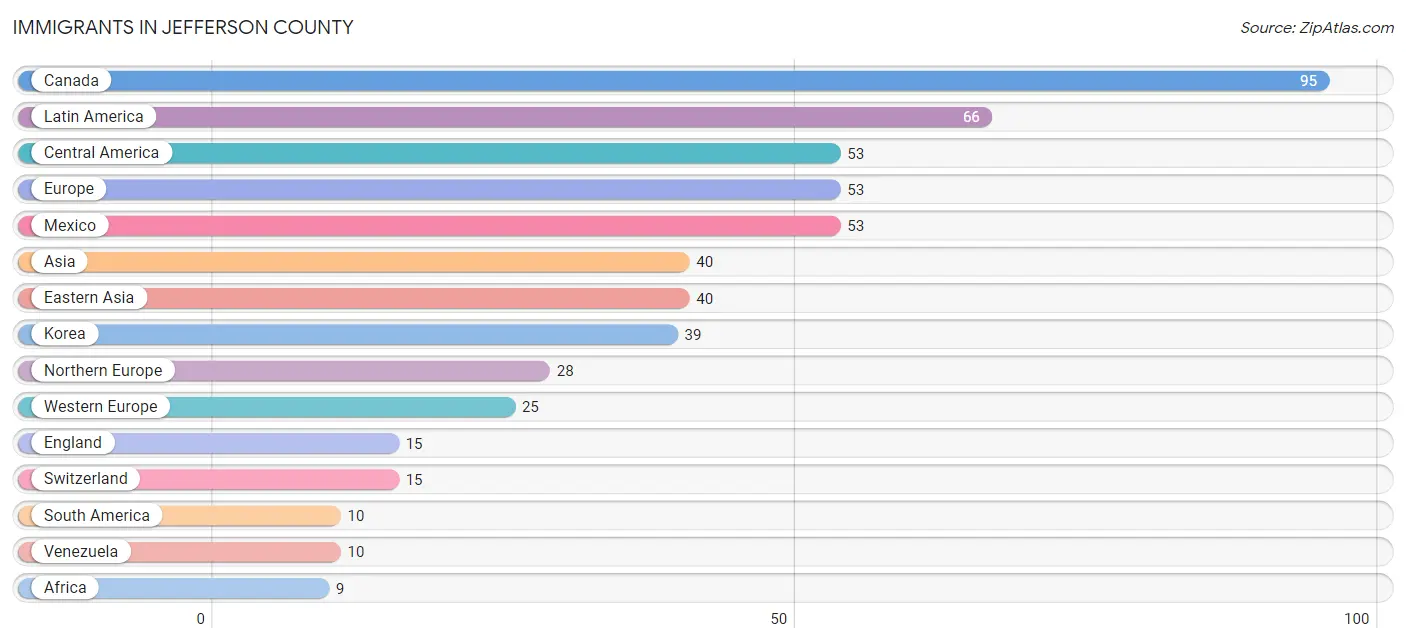
| Immigration Origin | # Population | % Population |
| Africa | 9 | 0.1% |
| Asia | 40 | 0.3% |
| Austria | 6 | 0.1% |
| Canada | 95 | 0.8% |
| Caribbean | 3 | 0.0% |
| Central America | 53 | 0.4% |
| Cuba | 3 | 0.0% |
| Eastern Africa | 9 | 0.1% |
| Eastern Asia | 40 | 0.3% |
| England | 15 | 0.1% |
| Ethiopia | 9 | 0.1% |
| Europe | 53 | 0.4% |
| Germany | 4 | 0.0% |
| Japan | 1 | 0.0% |
| Korea | 39 | 0.3% |
| Latin America | 66 | 0.5% |
| Mexico | 53 | 0.4% |
| Northern Europe | 28 | 0.2% |
| Oceania | 5 | 0.0% |
| South America | 10 | 0.1% |
| Switzerland | 15 | 0.1% |
| Venezuela | 10 | 0.1% |
| Western Europe | 25 | 0.2% | View All 23 Rows |
Sex and Age in Jefferson County
Sex and Age in Jefferson County
The most populous age groups in Jefferson County are 65 to 69 Years (596 | 9.5%) for men and 65 to 69 Years (610 | 10.2%) for women.
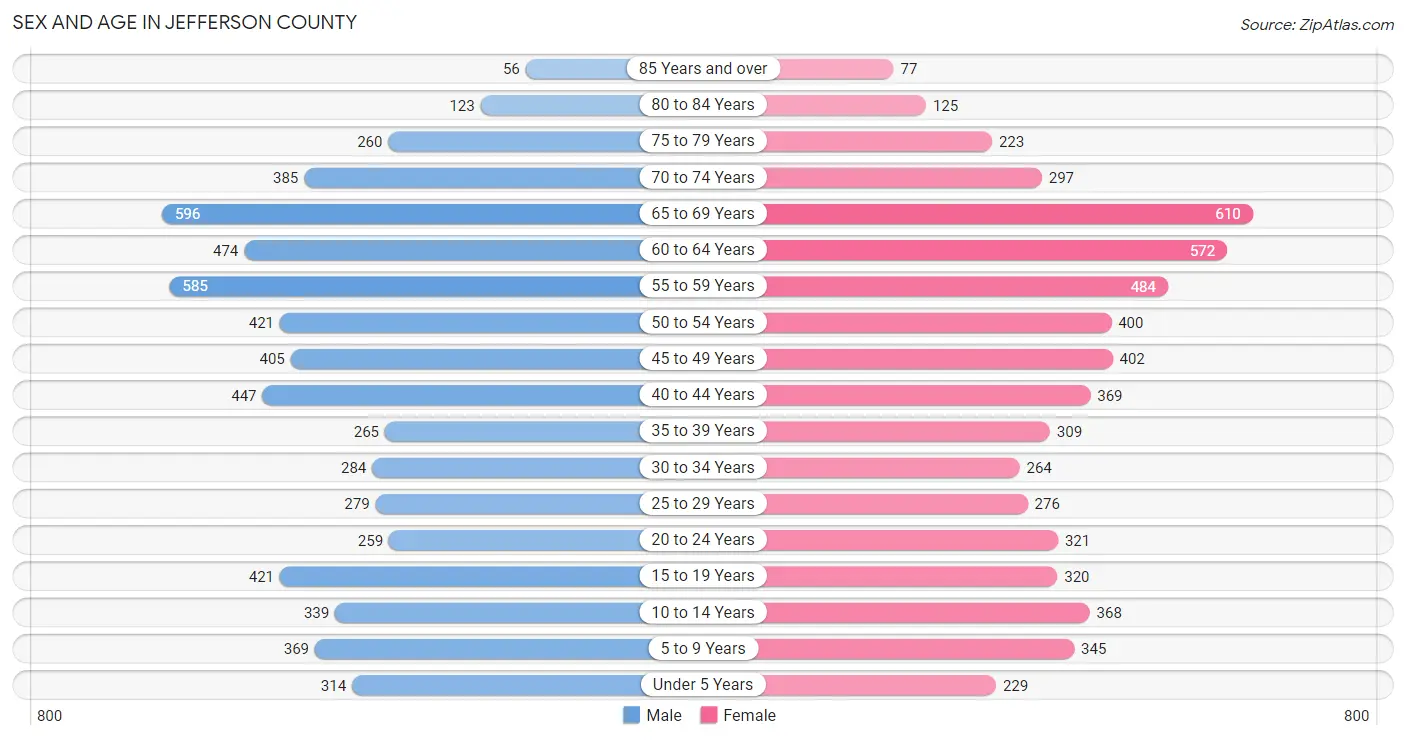
| Age Bracket | Male | Female |
| Under 5 Years | 314 (5.0%) | 229 (3.8%) |
| 5 to 9 Years | 369 (5.9%) | 345 (5.8%) |
| 10 to 14 Years | 339 (5.4%) | 368 (6.1%) |
| 15 to 19 Years | 421 (6.7%) | 320 (5.3%) |
| 20 to 24 Years | 259 (4.1%) | 321 (5.4%) |
| 25 to 29 Years | 279 (4.4%) | 276 (4.6%) |
| 30 to 34 Years | 284 (4.5%) | 264 (4.4%) |
| 35 to 39 Years | 265 (4.2%) | 309 (5.2%) |
| 40 to 44 Years | 447 (7.1%) | 369 (6.2%) |
| 45 to 49 Years | 405 (6.5%) | 402 (6.7%) |
| 50 to 54 Years | 421 (6.7%) | 400 (6.7%) |
| 55 to 59 Years | 585 (9.3%) | 484 (8.1%) |
| 60 to 64 Years | 474 (7.5%) | 572 (9.6%) |
| 65 to 69 Years | 596 (9.5%) | 610 (10.2%) |
| 70 to 74 Years | 385 (6.1%) | 297 (5.0%) |
| 75 to 79 Years | 260 (4.1%) | 223 (3.7%) |
| 80 to 84 Years | 123 (2.0%) | 125 (2.1%) |
| 85 Years and over | 56 (0.9%) | 77 (1.3%) |
| Total | 6,282 (100.0%) | 5,991 (100.0%) |
Families and Households in Jefferson County
Median Family Size in Jefferson County
The median family size in Jefferson County is 2.95 persons per family, with single female/mother families (225 | 6.4%) accounting for the largest median family size of 3.66 persons per family. On the other hand, single male/father families (159 | 4.5%) represent the smallest median family size with 2.52 persons per family.
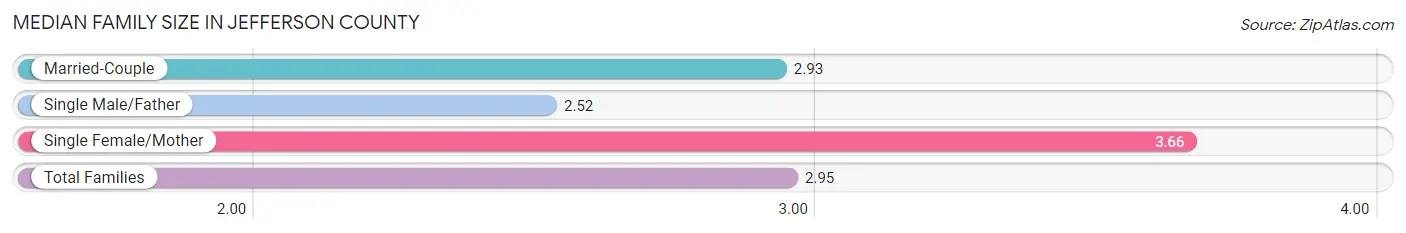
| Family Type | # Families | Family Size |
| Married-Couple | 3,136 (89.1%) | 2.93 |
| Single Male/Father | 159 (4.5%) | 2.52 |
| Single Female/Mother | 225 (6.4%) | 3.66 |
| Total Families | 3,520 (100.0%) | 2.95 |
Median Household Size in Jefferson County
The median household size in Jefferson County is 2.56 persons per household, with single female/mother households (225 | 4.8%) accounting for the largest median household size of 3.88 persons per household. non-family households (1,161 | 24.8%) represent the smallest median household size with 1.23 persons per household.
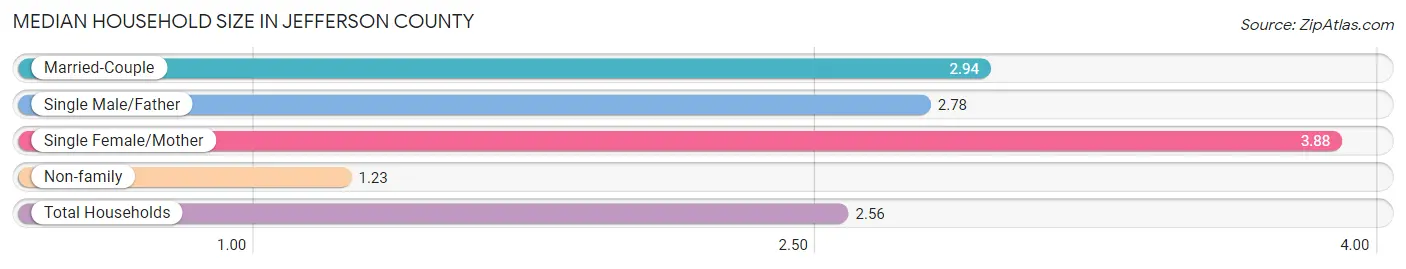
| Household Type | # Households | Household Size |
| Married-Couple | 3,136 (67.0%) | 2.94 |
| Single Male/Father | 159 (3.4%) | 2.78 |
| Single Female/Mother | 225 (4.8%) | 3.88 |
| Non-family | 1,161 (24.8%) | 1.23 |
| Total Households | 4,681 (100.0%) | 2.56 |
Household Size by Marriage Status in Jefferson County
Out of a total of 4,681 households in Jefferson County, 3,520 (75.2%) are family households, while 1,161 (24.8%) are nonfamily households. The most numerous type of family households are 2-person households, comprising 1,891, and the most common type of nonfamily households are 1-person households, comprising 991.
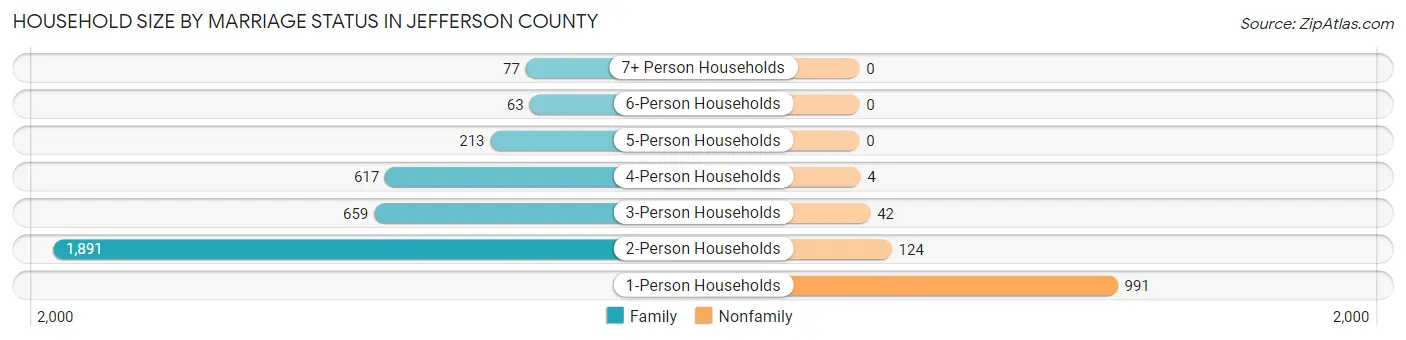
| Household Size | Family Households | Nonfamily Households |
| 1-Person Households | - | 991 (21.2%) |
| 2-Person Households | 1,891 (40.4%) | 124 (2.6%) |
| 3-Person Households | 659 (14.1%) | 42 (0.9%) |
| 4-Person Households | 617 (13.2%) | 4 (0.1%) |
| 5-Person Households | 213 (4.5%) | 0 (0.0%) |
| 6-Person Households | 63 (1.3%) | 0 (0.0%) |
| 7+ Person Households | 77 (1.6%) | 0 (0.0%) |
| Total | 3,520 (75.2%) | 1,161 (24.8%) |
Female Fertility in Jefferson County
Fertility by Age in Jefferson County
Average fertility rate in Jefferson County is 42.0 births per 1,000 women. Women in the age bracket of 20 to 34 years have the highest fertility rate with 108.0 births per 1,000 women. Women in the age bracket of 20 to 34 years acount for 93.9% of all women with births.
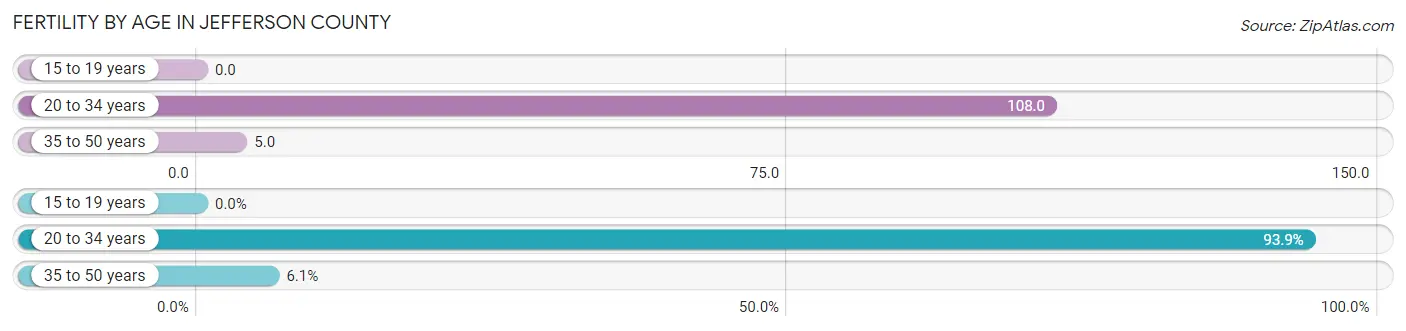
| Age Bracket | Women with Births | Births / 1,000 Women |
| 15 to 19 years | 0 (0.0%) | 0.0 |
| 20 to 34 years | 93 (93.9%) | 108.0 |
| 35 to 50 years | 6 (6.1%) | 5.0 |
| Total | 99 (100.0%) | 42.0 |
Fertility by Age by Marriage Status in Jefferson County
64.6% of women with births (99) in Jefferson County are married. The highest percentage of unmarried women with births falls into 20 to 34 years age bracket with 37.6% of them unmarried at the time of birth, while the lowest percentage of unmarried women with births belong to 35 to 50 years age bracket with 0.0% of them unmarried.
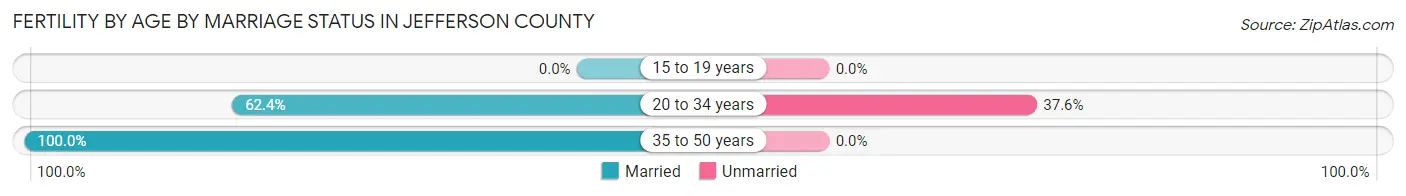
| Age Bracket | Married | Unmarried |
| 15 to 19 years | 0 (0.0%) | 0 (0.0%) |
| 20 to 34 years | 58 (62.4%) | 35 (37.6%) |
| 35 to 50 years | 6 (100.0%) | 0 (0.0%) |
| Total | 64 (64.6%) | 35 (35.3%) |
Fertility by Education in Jefferson County
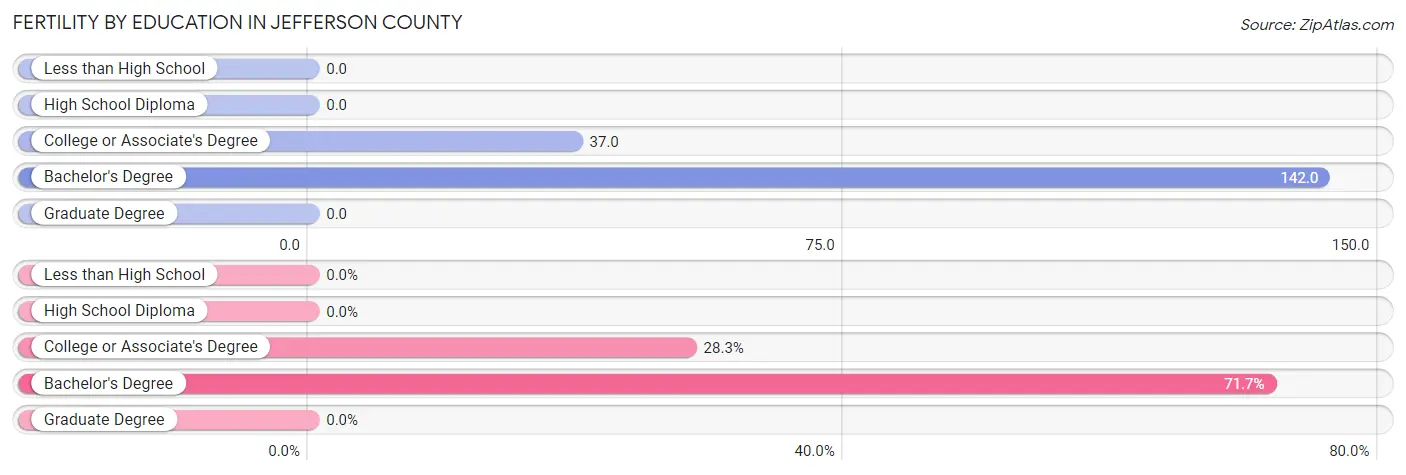
| Educational Attainment | Women with Births | Births / 1,000 Women |
| Less than High School | 0 (0.0%) | 0.0 |
| High School Diploma | 0 (0.0%) | 0.0 |
| College or Associate's Degree | 28 (28.3%) | 37.0 |
| Bachelor's Degree | 71 (71.7%) | 142.0 |
| Graduate Degree | 0 (0.0%) | 0.0 |
| Total | 99 (100.0%) | 42.0 |
Fertility by Education by Marriage Status in Jefferson County
35.3% of women with births in Jefferson County are unmarried. Women with the educational attainment of bachelor's degree are most likely to be married with 87.3% of them married at childbirth, while women with the educational attainment of college or associate's degree are least likely to be married with 92.9% of them unmarried at childbirth.
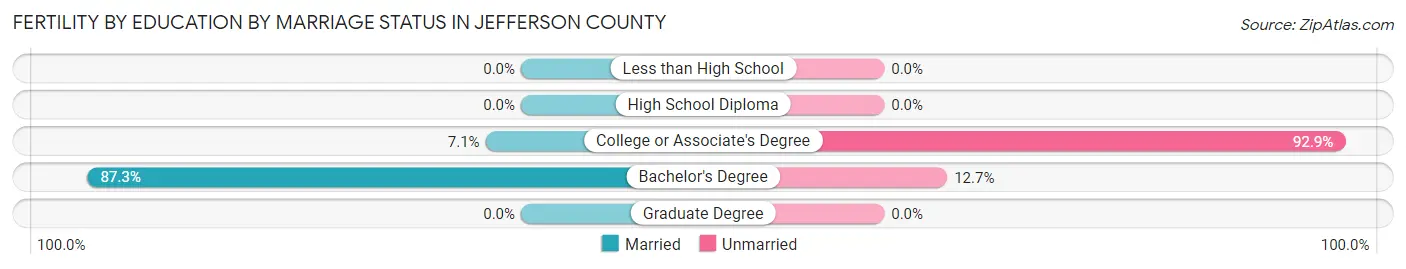
| Educational Attainment | Married | Unmarried |
| Less than High School | 0 (0.0%) | 0 (0.0%) |
| High School Diploma | 0 (0.0%) | 0 (0.0%) |
| College or Associate's Degree | 2 (7.1%) | 26 (92.9%) |
| Bachelor's Degree | 62 (87.3%) | 9 (12.7%) |
| Graduate Degree | 0 (0.0%) | 0 (0.0%) |
| Total | 64 (64.6%) | 35 (35.3%) |
Employment Characteristics in Jefferson County
Employment by Class of Employer in Jefferson County
Among the 5,433 employed individuals in Jefferson County, private company employees (2,759 | 50.8%), state government employees (665 | 12.2%), and local government employees (497 | 9.1%) make up the most common classes of employment.
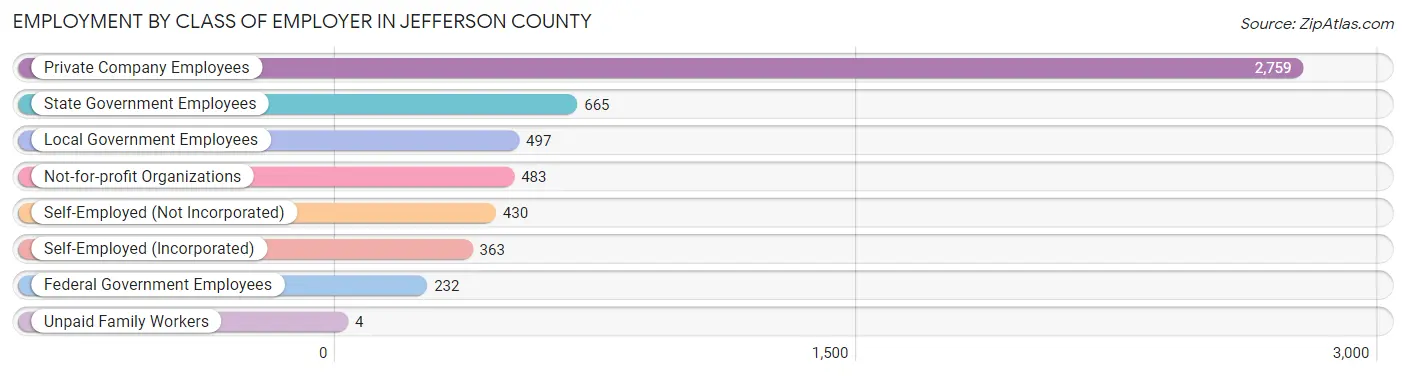
| Employer Class | # Employees | % Employees |
| Private Company Employees | 2,759 | 50.8% |
| Self-Employed (Incorporated) | 363 | 6.7% |
| Self-Employed (Not Incorporated) | 430 | 7.9% |
| Not-for-profit Organizations | 483 | 8.9% |
| Local Government Employees | 497 | 9.1% |
| State Government Employees | 665 | 12.2% |
| Federal Government Employees | 232 | 4.3% |
| Unpaid Family Workers | 4 | 0.1% |
| Total | 5,433 | 100.0% |
Employment Status by Age in Jefferson County
According to the labor force statistics for Jefferson County, out of the total population over 16 years of age (10,124), 57.5% or 5,821 individuals are in the labor force, with 3.4% or 198 of them unemployed. The age group with the highest labor force participation rate is 25 to 29 years, with 90.3% or 501 individuals in the labor force. Within the labor force, the 16 to 19 years age range has the highest percentage of unemployed individuals, with 20.9% or 54 of them being unemployed.
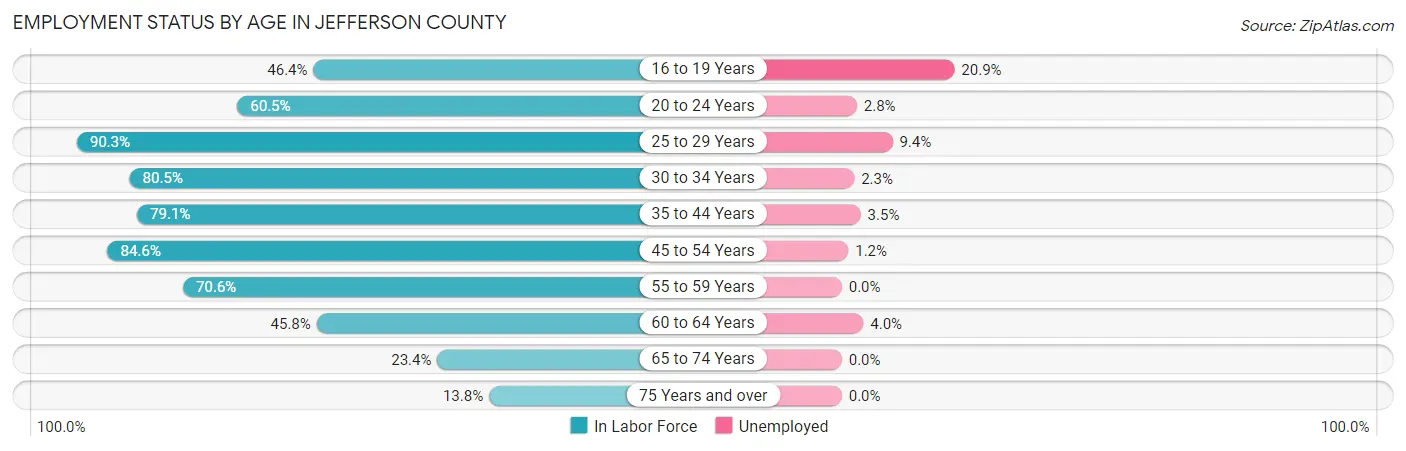
| Age Bracket | In Labor Force | Unemployed |
| 16 to 19 Years | 258 (46.4%) | 54 (20.9%) |
| 20 to 24 Years | 351 (60.5%) | 10 (2.8%) |
| 25 to 29 Years | 501 (90.3%) | 47 (9.4%) |
| 30 to 34 Years | 441 (80.5%) | 10 (2.3%) |
| 35 to 44 Years | 1,099 (79.1%) | 38 (3.5%) |
| 45 to 54 Years | 1,377 (84.6%) | 17 (1.2%) |
| 55 to 59 Years | 755 (70.6%) | 0 (0.0%) |
| 60 to 64 Years | 479 (45.8%) | 19 (4.0%) |
| 65 to 74 Years | 442 (23.4%) | 0 (0.0%) |
| 75 Years and over | 119 (13.8%) | 0 (0.0%) |
| Total | 5,821 (57.5%) | 198 (3.4%) |
Employment Status by Educational Attainment in Jefferson County
According to labor force statistics for Jefferson County, 74.6% of individuals (4,652) out of the total population between 25 and 64 years of age (6,236) are in the labor force, with 2.8% or 130 of them being unemployed. The group with the highest labor force participation rate are those with the educational attainment of bachelor's degree or higher, with 79.1% or 1,689 individuals in the labor force. Within the labor force, individuals with less than high school education have the highest percentage of unemployment, with 15.3% or 18 of them being unemployed.
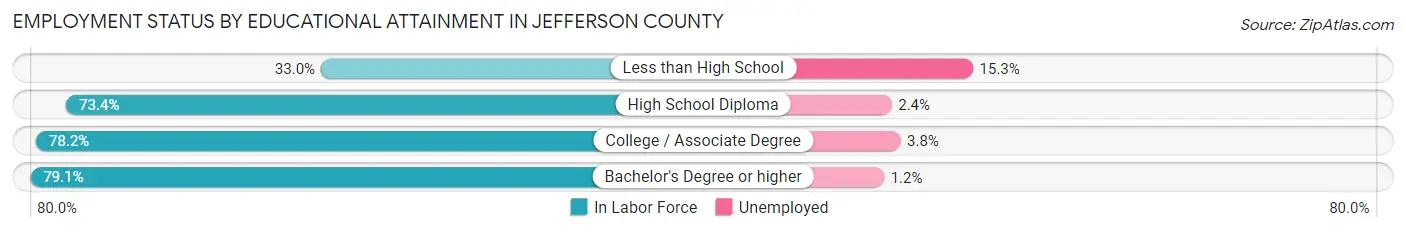
| Educational Attainment | In Labor Force | Unemployed |
| Less than High School | 118 (33.0%) | 55 (15.3%) |
| High School Diploma | 1,227 (73.4%) | 40 (2.4%) |
| College / Associate Degree | 1,620 (78.2%) | 79 (3.8%) |
| Bachelor's Degree or higher | 1,689 (79.1%) | 26 (1.2%) |
| Total | 4,652 (74.6%) | 175 (2.8%) |
Employment Occupations by Sex in Jefferson County
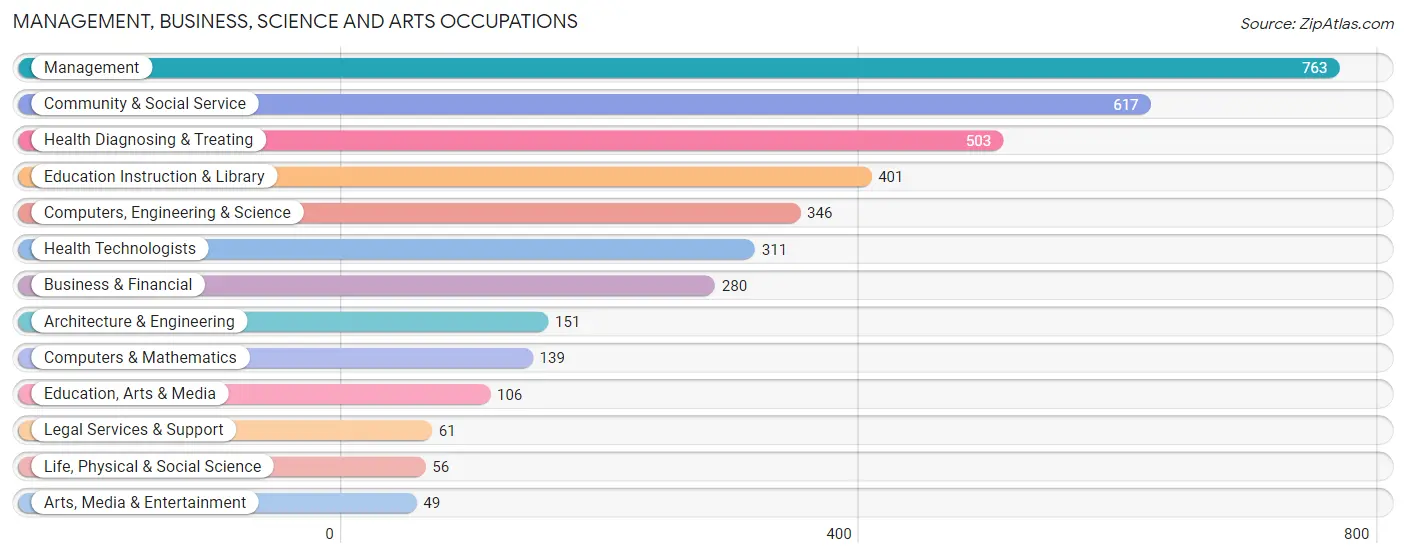
Management, Business, Science and Arts Occupations
The most common Management, Business, Science and Arts occupations in Jefferson County are Management (763 | 13.6%), Community & Social Service (617 | 11.0%), Health Diagnosing & Treating (503 | 8.9%), Education Instruction & Library (401 | 7.1%), and Computers, Engineering & Science (346 | 6.1%).
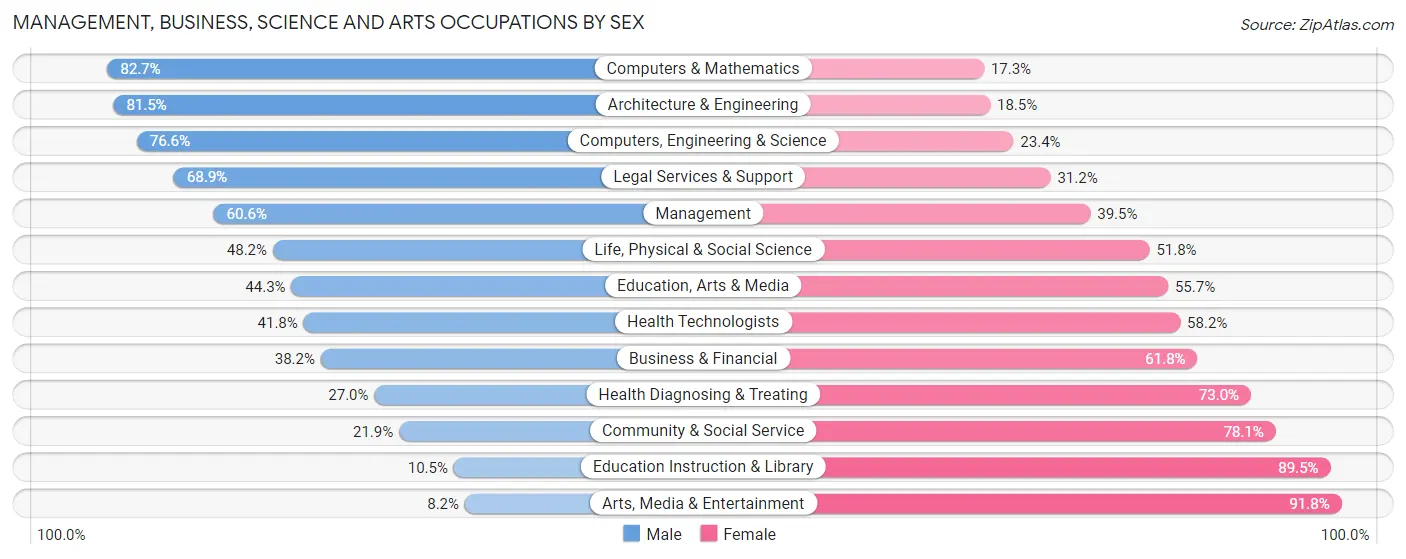
Management, Business, Science and Arts Occupations by Sex
Within the Management, Business, Science and Arts occupations in Jefferson County, the most male-oriented occupations are Computers & Mathematics (82.7%), Architecture & Engineering (81.5%), and Computers, Engineering & Science (76.6%), while the most female-oriented occupations are Arts, Media & Entertainment (91.8%), Education Instruction & Library (89.5%), and Community & Social Service (78.1%).
| Occupation | Male | Female |
| Management | 462 (60.6%) | 301 (39.5%) |
| Business & Financial | 107 (38.2%) | 173 (61.8%) |
| Computers, Engineering & Science | 265 (76.6%) | 81 (23.4%) |
| Computers & Mathematics | 115 (82.7%) | 24 (17.3%) |
| Architecture & Engineering | 123 (81.5%) | 28 (18.5%) |
| Life, Physical & Social Science | 27 (48.2%) | 29 (51.8%) |
| Community & Social Service | 135 (21.9%) | 482 (78.1%) |
| Education, Arts & Media | 47 (44.3%) | 59 (55.7%) |
| Legal Services & Support | 42 (68.9%) | 19 (31.1%) |
| Education Instruction & Library | 42 (10.5%) | 359 (89.5%) |
| Arts, Media & Entertainment | 4 (8.2%) | 45 (91.8%) |
| Health Diagnosing & Treating | 136 (27.0%) | 367 (73.0%) |
| Health Technologists | 130 (41.8%) | 181 (58.2%) |
| Total (Category) | 1,105 (44.0%) | 1,404 (56.0%) |
| Total (Overall) | 2,987 (53.1%) | 2,635 (46.9%) |
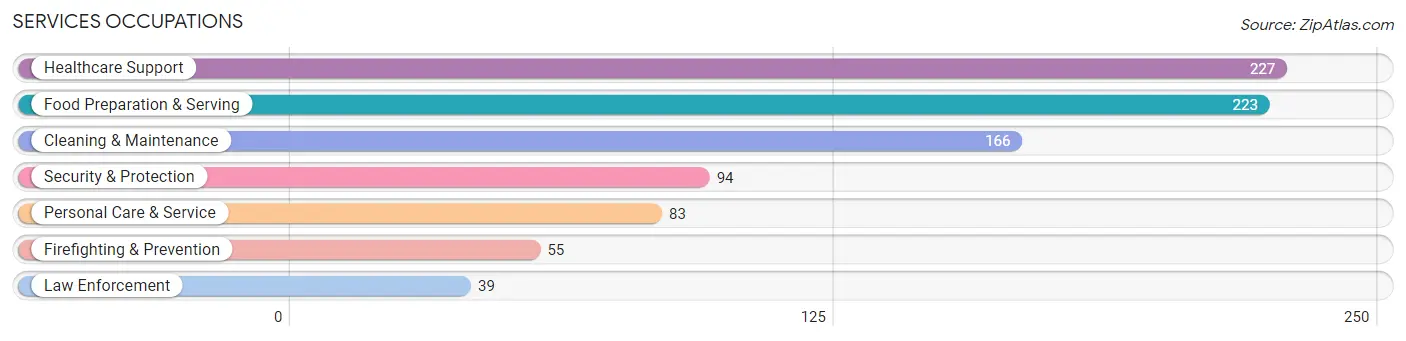
Services Occupations
The most common Services occupations in Jefferson County are Healthcare Support (227 | 4.0%), Food Preparation & Serving (223 | 4.0%), Cleaning & Maintenance (166 | 2.9%), Security & Protection (94 | 1.7%), and Personal Care & Service (83 | 1.5%).
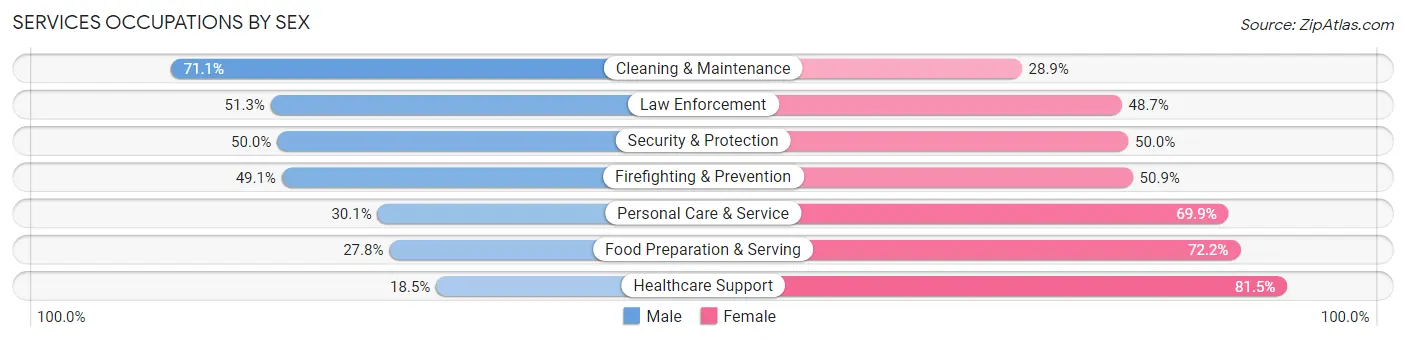
Services Occupations by Sex
Within the Services occupations in Jefferson County, the most male-oriented occupations are Cleaning & Maintenance (71.1%), Law Enforcement (51.3%), and Security & Protection (50.0%), while the most female-oriented occupations are Healthcare Support (81.5%), Food Preparation & Serving (72.2%), and Personal Care & Service (69.9%).
| Occupation | Male | Female |
| Healthcare Support | 42 (18.5%) | 185 (81.5%) |
| Security & Protection | 47 (50.0%) | 47 (50.0%) |
| Firefighting & Prevention | 27 (49.1%) | 28 (50.9%) |
| Law Enforcement | 20 (51.3%) | 19 (48.7%) |
| Food Preparation & Serving | 62 (27.8%) | 161 (72.2%) |
| Cleaning & Maintenance | 118 (71.1%) | 48 (28.9%) |
| Personal Care & Service | 25 (30.1%) | 58 (69.9%) |
| Total (Category) | 294 (37.1%) | 499 (62.9%) |
| Total (Overall) | 2,987 (53.1%) | 2,635 (46.9%) |
Sales and Office Occupations
The most common Sales and Office occupations in Jefferson County are Office & Administration (604 | 10.7%), and Sales & Related (380 | 6.8%).
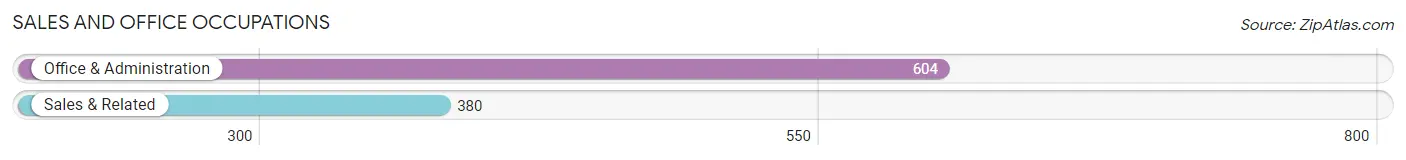
Sales and Office Occupations by Sex
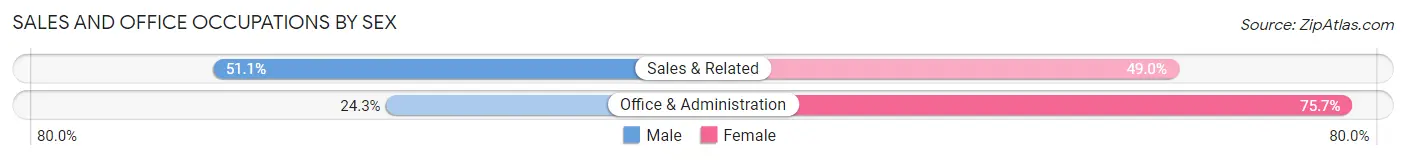
| Occupation | Male | Female |
| Sales & Related | 194 (51.0%) | 186 (48.9%) |
| Office & Administration | 147 (24.3%) | 457 (75.7%) |
| Total (Category) | 341 (34.6%) | 643 (65.3%) |
| Total (Overall) | 2,987 (53.1%) | 2,635 (46.9%) |
Natural Resources, Construction and Maintenance Occupations
The most common Natural Resources, Construction and Maintenance occupations in Jefferson County are Construction & Extraction (453 | 8.1%), Installation, Maintenance & Repair (236 | 4.2%), and Farming, Fishing & Forestry (99 | 1.8%).
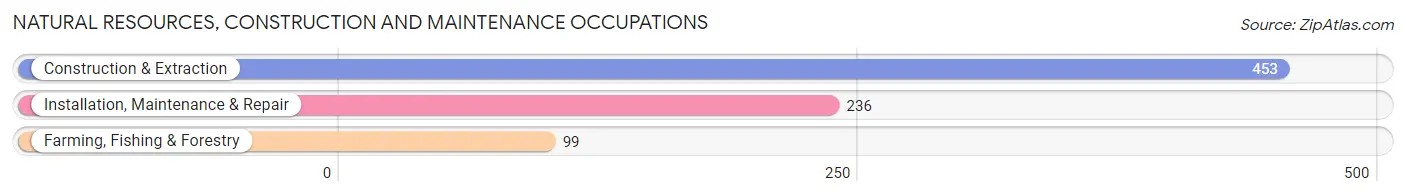
Natural Resources, Construction and Maintenance Occupations by Sex
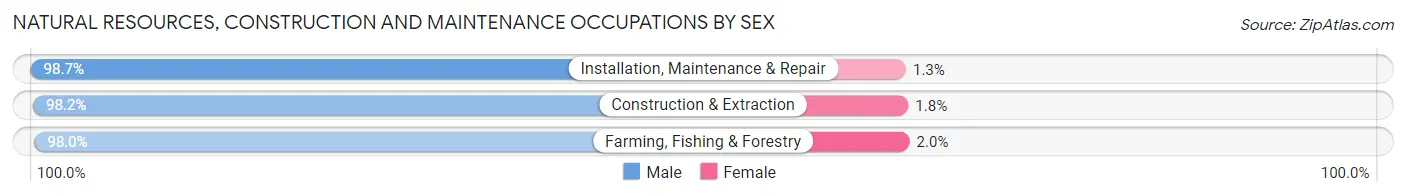
| Occupation | Male | Female |
| Farming, Fishing & Forestry | 97 (98.0%) | 2 (2.0%) |
| Construction & Extraction | 445 (98.2%) | 8 (1.8%) |
| Installation, Maintenance & Repair | 233 (98.7%) | 3 (1.3%) |
| Total (Category) | 775 (98.4%) | 13 (1.7%) |
| Total (Overall) | 2,987 (53.1%) | 2,635 (46.9%) |
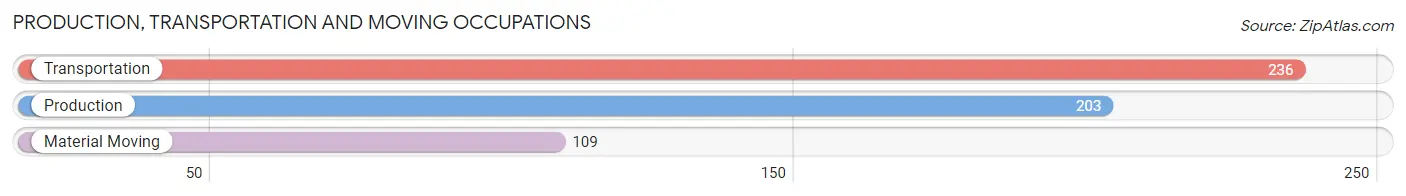
Production, Transportation and Moving Occupations
The most common Production, Transportation and Moving occupations in Jefferson County are Transportation (236 | 4.2%), Production (203 | 3.6%), and Material Moving (109 | 1.9%).
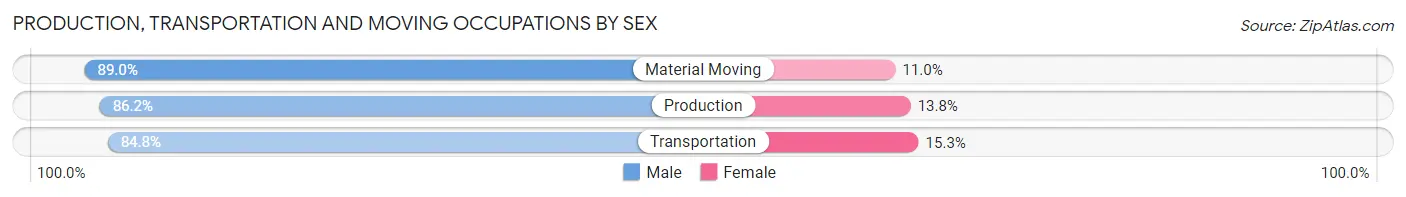
Production, Transportation and Moving Occupations by Sex
| Occupation | Male | Female |
| Production | 175 (86.2%) | 28 (13.8%) |
| Transportation | 200 (84.8%) | 36 (15.2%) |
| Material Moving | 97 (89.0%) | 12 (11.0%) |
| Total (Category) | 472 (86.1%) | 76 (13.9%) |
| Total (Overall) | 2,987 (53.1%) | 2,635 (46.9%) |
Employment Industries by Sex in Jefferson County
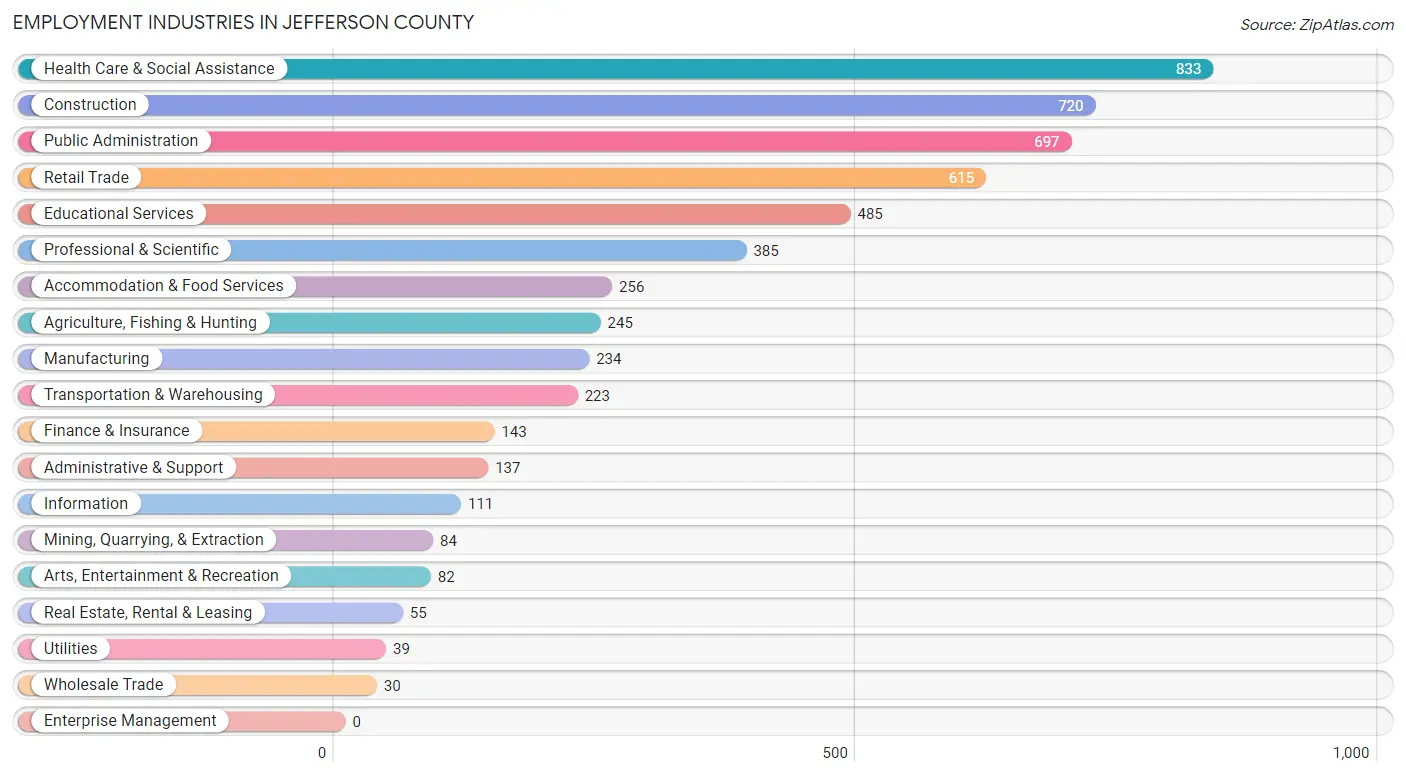
Employment Industries in Jefferson County
The major employment industries in Jefferson County include Health Care & Social Assistance (833 | 14.8%), Construction (720 | 12.8%), Public Administration (697 | 12.4%), Retail Trade (615 | 10.9%), and Educational Services (485 | 8.6%).
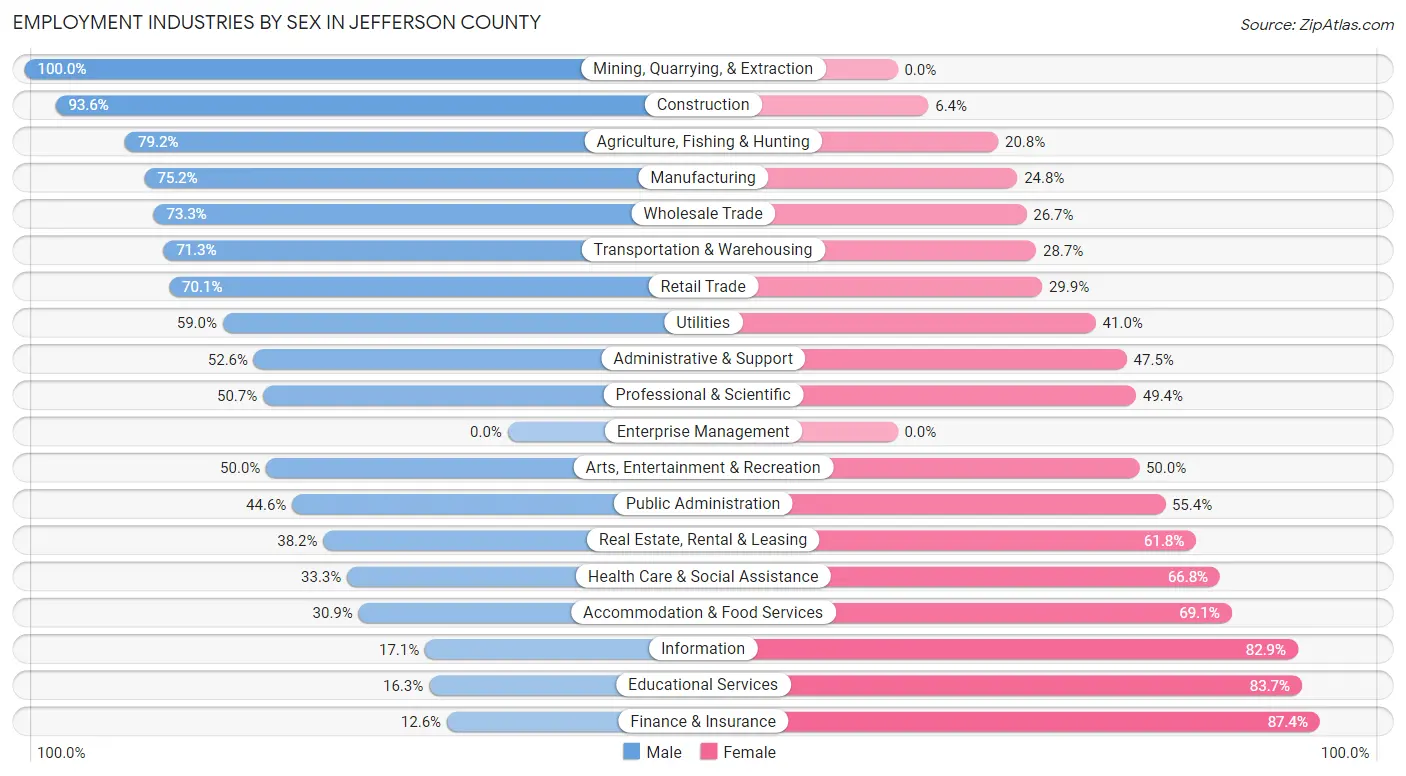
Employment Industries by Sex in Jefferson County
The Jefferson County industries that see more men than women are Mining, Quarrying, & Extraction (100.0%), Construction (93.6%), and Agriculture, Fishing & Hunting (79.2%), whereas the industries that tend to have a higher number of women are Finance & Insurance (87.4%), Educational Services (83.7%), and Information (82.9%).
| Industry | Male | Female |
| Agriculture, Fishing & Hunting | 194 (79.2%) | 51 (20.8%) |
| Mining, Quarrying, & Extraction | 84 (100.0%) | 0 (0.0%) |
| Construction | 674 (93.6%) | 46 (6.4%) |
| Manufacturing | 176 (75.2%) | 58 (24.8%) |
| Wholesale Trade | 22 (73.3%) | 8 (26.7%) |
| Retail Trade | 431 (70.1%) | 184 (29.9%) |
| Transportation & Warehousing | 159 (71.3%) | 64 (28.7%) |
| Utilities | 23 (59.0%) | 16 (41.0%) |
| Information | 19 (17.1%) | 92 (82.9%) |
| Finance & Insurance | 18 (12.6%) | 125 (87.4%) |
| Real Estate, Rental & Leasing | 21 (38.2%) | 34 (61.8%) |
| Professional & Scientific | 195 (50.6%) | 190 (49.3%) |
| Enterprise Management | 0 (0.0%) | 0 (0.0%) |
| Administrative & Support | 72 (52.5%) | 65 (47.4%) |
| Educational Services | 79 (16.3%) | 406 (83.7%) |
| Health Care & Social Assistance | 277 (33.3%) | 556 (66.7%) |
| Arts, Entertainment & Recreation | 41 (50.0%) | 41 (50.0%) |
| Accommodation & Food Services | 79 (30.9%) | 177 (69.1%) |
| Public Administration | 311 (44.6%) | 386 (55.4%) |
| Total | 2,987 (53.1%) | 2,635 (46.9%) |
Education in Jefferson County
School Enrollment in Jefferson County
The most common levels of schooling among the 2,468 students in Jefferson County are high school (671 | 27.2%), middle school (538 | 21.8%), and elementary school (535 | 21.7%).
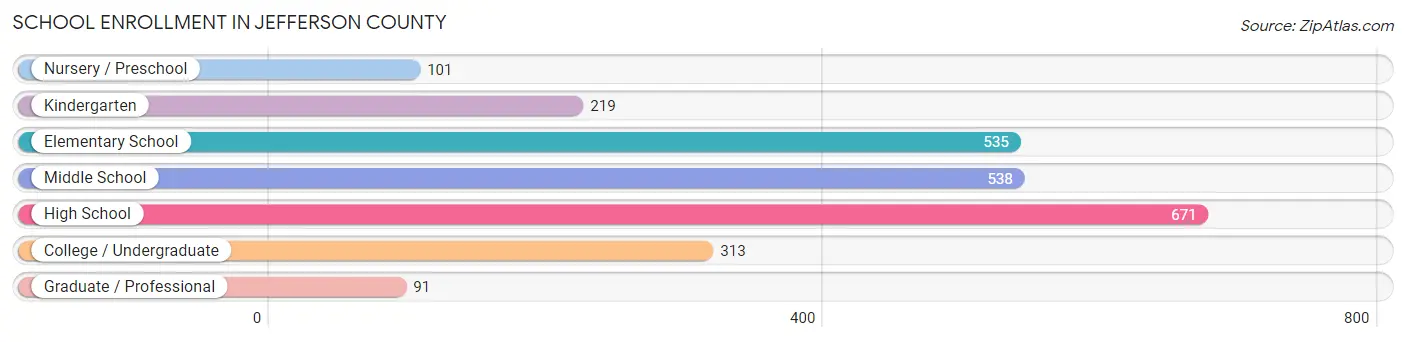
| School Level | # Students | % Students |
| Nursery / Preschool | 101 | 4.1% |
| Kindergarten | 219 | 8.9% |
| Elementary School | 535 | 21.7% |
| Middle School | 538 | 21.8% |
| High School | 671 | 27.2% |
| College / Undergraduate | 313 | 12.7% |
| Graduate / Professional | 91 | 3.7% |
| Total | 2,468 | 100.0% |
School Enrollment by Age by Funding Source in Jefferson County
Out of a total of 2,468 students who are enrolled in schools in Jefferson County, 249 (10.1%) attend a private institution, while the remaining 2,219 (89.9%) are enrolled in public schools. The age group of 3 to 4 year olds has the highest likelihood of being enrolled in private schools, with 22 (40.7% in the age bracket) enrolled. Conversely, the age group of 18 to 19 year olds has the lowest likelihood of being enrolled in a private school, with 168 (100.0% in the age bracket) attending a public institution.
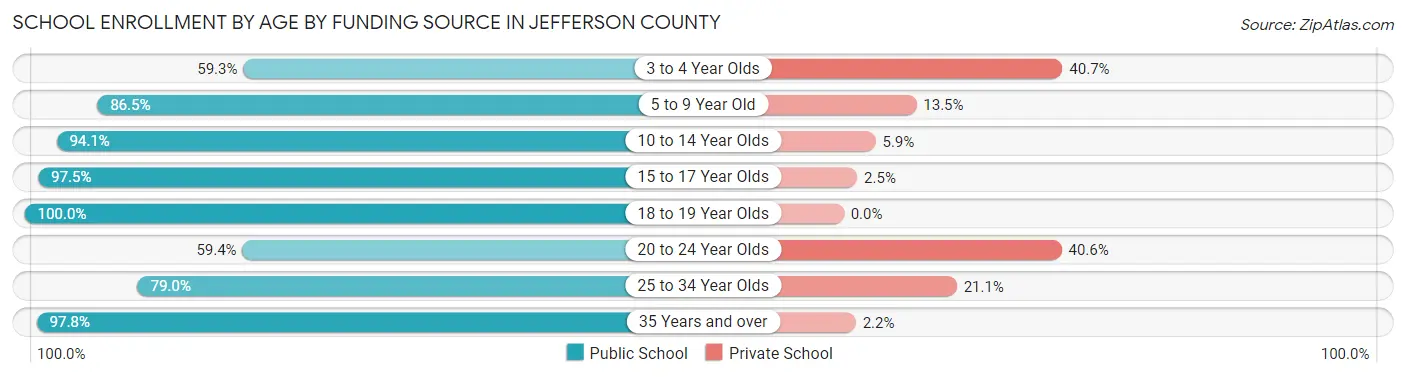
| Age Bracket | Public School | Private School |
| 3 to 4 Year Olds | 32 (59.3%) | 22 (40.7%) |
| 5 to 9 Year Old | 600 (86.5%) | 94 (13.5%) |
| 10 to 14 Year Olds | 665 (94.1%) | 42 (5.9%) |
| 15 to 17 Year Olds | 466 (97.5%) | 12 (2.5%) |
| 18 to 19 Year Olds | 168 (100.0%) | 0 (0.0%) |
| 20 to 24 Year Olds | 82 (59.4%) | 56 (40.6%) |
| 25 to 34 Year Olds | 75 (78.9%) | 20 (21.0%) |
| 35 Years and over | 131 (97.8%) | 3 (2.2%) |
| Total | 2,219 (89.9%) | 249 (10.1%) |
Educational Attainment by Field of Study in Jefferson County
Education (534 | 16.0%), business (488 | 14.6%), science & technology (479 | 14.3%), bio, nature & agricultural (301 | 9.0%), and social sciences (265 | 7.9%) are the most common fields of study among 3,349 individuals in Jefferson County who have obtained a bachelor's degree or higher.
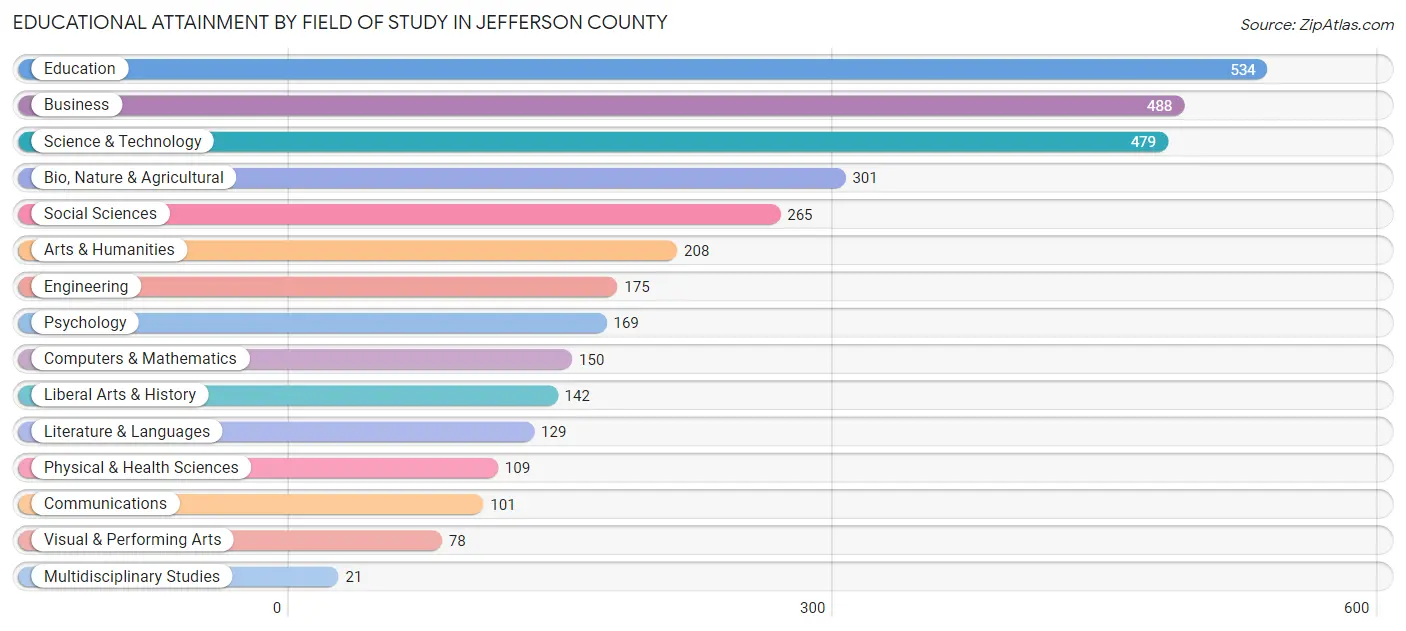
| Field of Study | # Graduates | % Graduates |
| Computers & Mathematics | 150 | 4.5% |
| Bio, Nature & Agricultural | 301 | 9.0% |
| Physical & Health Sciences | 109 | 3.3% |
| Psychology | 169 | 5.1% |
| Social Sciences | 265 | 7.9% |
| Engineering | 175 | 5.2% |
| Multidisciplinary Studies | 21 | 0.6% |
| Science & Technology | 479 | 14.3% |
| Business | 488 | 14.6% |
| Education | 534 | 16.0% |
| Literature & Languages | 129 | 3.8% |
| Liberal Arts & History | 142 | 4.2% |
| Visual & Performing Arts | 78 | 2.3% |
| Communications | 101 | 3.0% |
| Arts & Humanities | 208 | 6.2% |
| Total | 3,349 | 100.0% |
Transportation & Commute in Jefferson County
Vehicle Availability by Sex in Jefferson County
The most prevalent vehicle ownership categories in Jefferson County are males with 3 vehicles (850, accounting for 29.7%) and females with 3 vehicles (747, making up 33.1%).
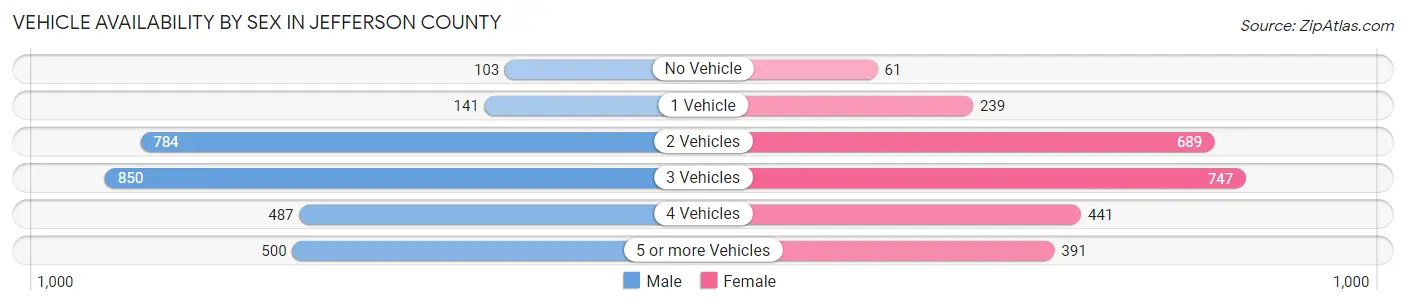
| Vehicles Available | Male | Female |
| No Vehicle | 103 (3.6%) | 61 (2.4%) |
| 1 Vehicle | 141 (4.9%) | 239 (9.3%) |
| 2 Vehicles | 784 (27.4%) | 689 (26.8%) |
| 3 Vehicles | 850 (29.7%) | 747 (29.1%) |
| 4 Vehicles | 487 (17.0%) | 441 (17.2%) |
| 5 or more Vehicles | 500 (17.4%) | 391 (15.2%) |
| Total | 2,865 (100.0%) | 2,568 (100.0%) |
Commute Time in Jefferson County
The most frequently occuring commute durations in Jefferson County are 15 to 19 minutes (1,104 commuters, 22.5%), 10 to 14 minutes (726 commuters, 14.8%), and 20 to 24 minutes (688 commuters, 14.0%).
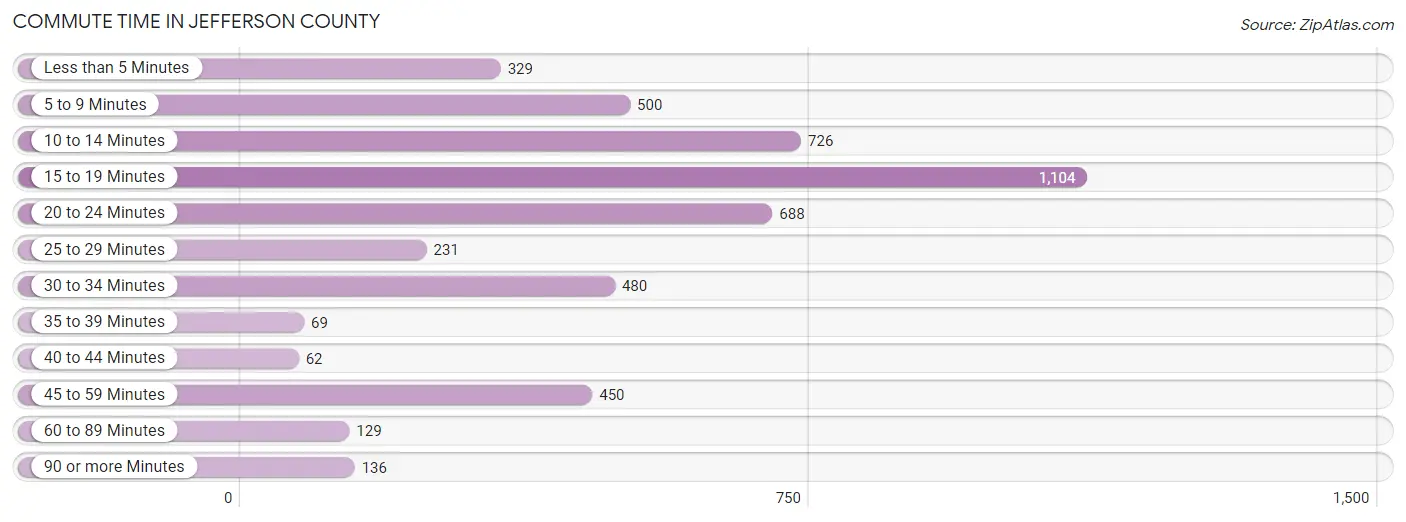
| Commute Time | # Commuters | % Commuters |
| Less than 5 Minutes | 329 | 6.7% |
| 5 to 9 Minutes | 500 | 10.2% |
| 10 to 14 Minutes | 726 | 14.8% |
| 15 to 19 Minutes | 1,104 | 22.5% |
| 20 to 24 Minutes | 688 | 14.0% |
| 25 to 29 Minutes | 231 | 4.7% |
| 30 to 34 Minutes | 480 | 9.8% |
| 35 to 39 Minutes | 69 | 1.4% |
| 40 to 44 Minutes | 62 | 1.3% |
| 45 to 59 Minutes | 450 | 9.2% |
| 60 to 89 Minutes | 129 | 2.6% |
| 90 or more Minutes | 136 | 2.8% |
Commute Time by Sex in Jefferson County
The most common commute times in Jefferson County are 15 to 19 minutes (429 commuters, 16.3%) for males and 15 to 19 minutes (675 commuters, 29.6%) for females.
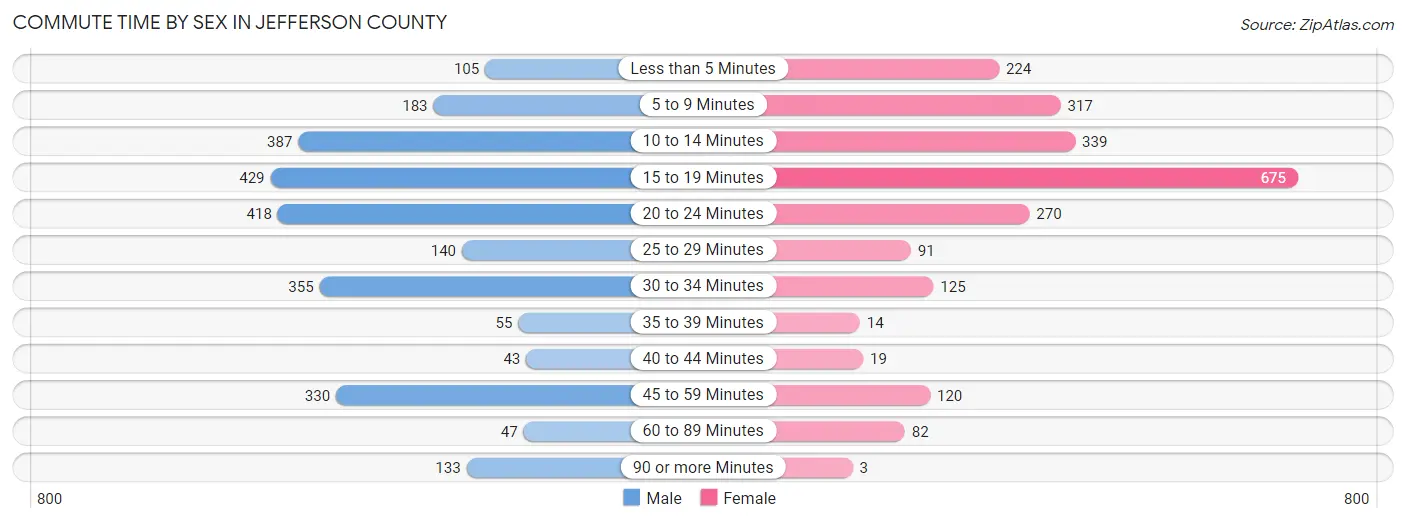
| Commute Time | Male | Female |
| Less than 5 Minutes | 105 (4.0%) | 224 (9.8%) |
| 5 to 9 Minutes | 183 (7.0%) | 317 (13.9%) |
| 10 to 14 Minutes | 387 (14.7%) | 339 (14.9%) |
| 15 to 19 Minutes | 429 (16.3%) | 675 (29.6%) |
| 20 to 24 Minutes | 418 (15.9%) | 270 (11.8%) |
| 25 to 29 Minutes | 140 (5.3%) | 91 (4.0%) |
| 30 to 34 Minutes | 355 (13.5%) | 125 (5.5%) |
| 35 to 39 Minutes | 55 (2.1%) | 14 (0.6%) |
| 40 to 44 Minutes | 43 (1.6%) | 19 (0.8%) |
| 45 to 59 Minutes | 330 (12.6%) | 120 (5.3%) |
| 60 to 89 Minutes | 47 (1.8%) | 82 (3.6%) |
| 90 or more Minutes | 133 (5.1%) | 3 (0.1%) |
Time of Departure to Work by Sex in Jefferson County
The most frequent times of departure to work in Jefferson County are 7:00 AM to 7:29 AM (539, 20.5%) for males and 7:30 AM to 7:59 AM (513, 22.5%) for females.
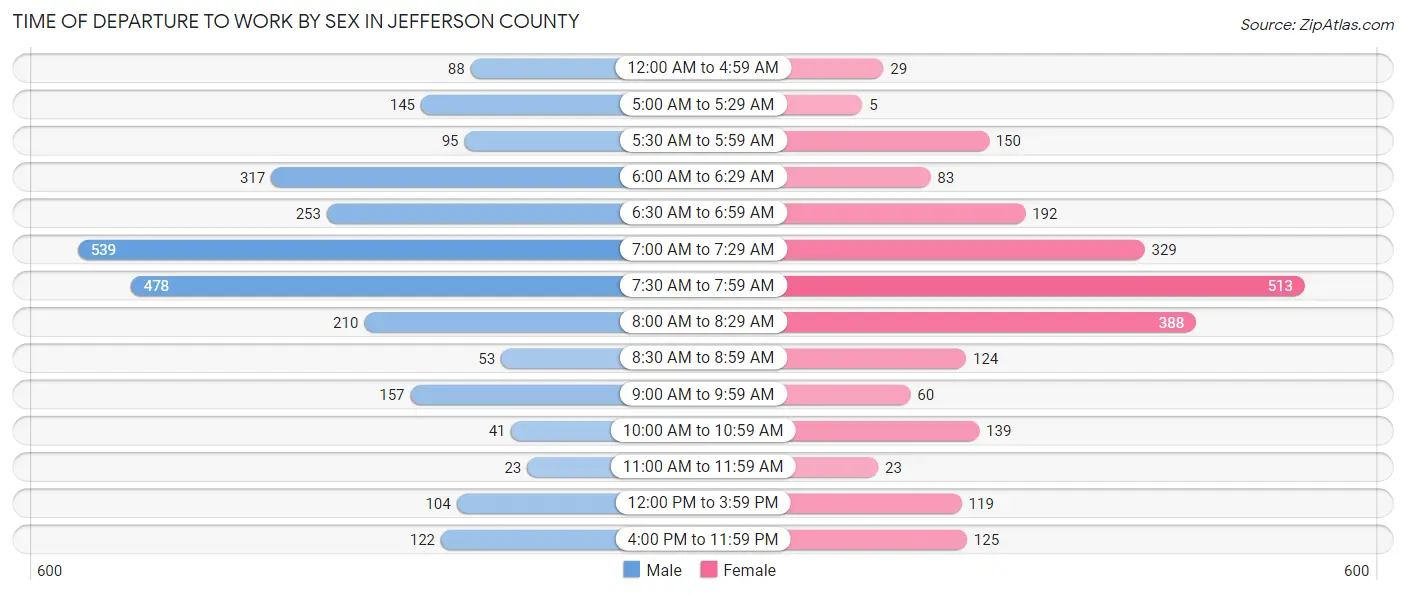
| Time of Departure | Male | Female |
| 12:00 AM to 4:59 AM | 88 (3.4%) | 29 (1.3%) |
| 5:00 AM to 5:29 AM | 145 (5.5%) | 5 (0.2%) |
| 5:30 AM to 5:59 AM | 95 (3.6%) | 150 (6.6%) |
| 6:00 AM to 6:29 AM | 317 (12.1%) | 83 (3.6%) |
| 6:30 AM to 6:59 AM | 253 (9.6%) | 192 (8.4%) |
| 7:00 AM to 7:29 AM | 539 (20.5%) | 329 (14.4%) |
| 7:30 AM to 7:59 AM | 478 (18.2%) | 513 (22.5%) |
| 8:00 AM to 8:29 AM | 210 (8.0%) | 388 (17.0%) |
| 8:30 AM to 8:59 AM | 53 (2.0%) | 124 (5.4%) |
| 9:00 AM to 9:59 AM | 157 (6.0%) | 60 (2.6%) |
| 10:00 AM to 10:59 AM | 41 (1.6%) | 139 (6.1%) |
| 11:00 AM to 11:59 AM | 23 (0.9%) | 23 (1.0%) |
| 12:00 PM to 3:59 PM | 104 (4.0%) | 119 (5.2%) |
| 4:00 PM to 11:59 PM | 122 (4.6%) | 125 (5.5%) |
| Total | 2,625 (100.0%) | 2,279 (100.0%) |
Housing Occupancy in Jefferson County
Occupancy by Ownership in Jefferson County
Of the total 4,681 dwellings in Jefferson County, owner-occupied units account for 3,890 (83.1%), while renter-occupied units make up 791 (16.9%).
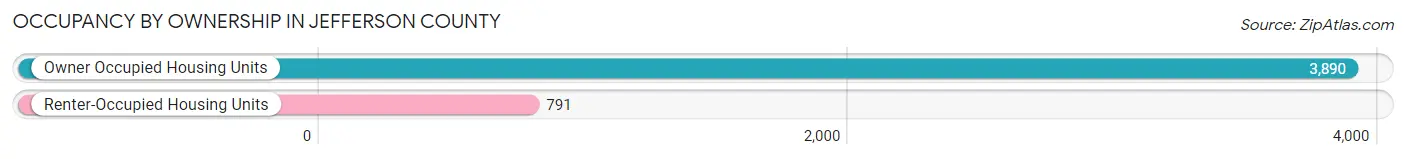
| Occupancy | # Housing Units | % Housing Units |
| Owner Occupied Housing Units | 3,890 | 83.1% |
| Renter-Occupied Housing Units | 791 | 16.9% |
| Total Occupied Housing Units | 4,681 | 100.0% |
Occupancy by Household Size in Jefferson County
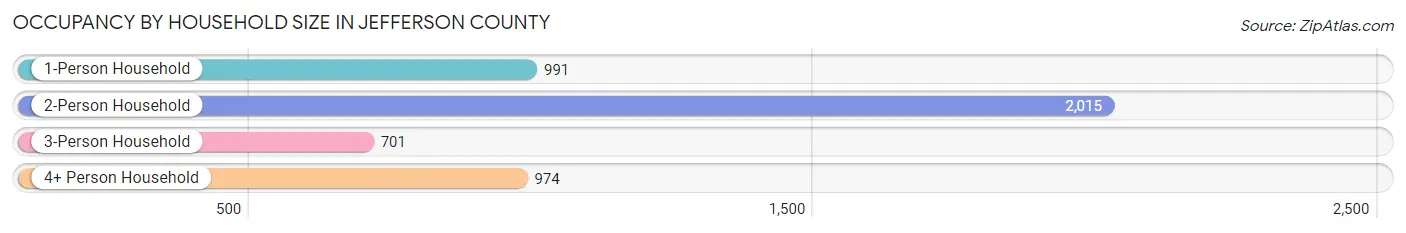
| Household Size | # Housing Units | % Housing Units |
| 1-Person Household | 991 | 21.2% |
| 2-Person Household | 2,015 | 43.0% |
| 3-Person Household | 701 | 15.0% |
| 4+ Person Household | 974 | 20.8% |
| Total Housing Units | 4,681 | 100.0% |
Occupancy by Ownership by Household Size in Jefferson County
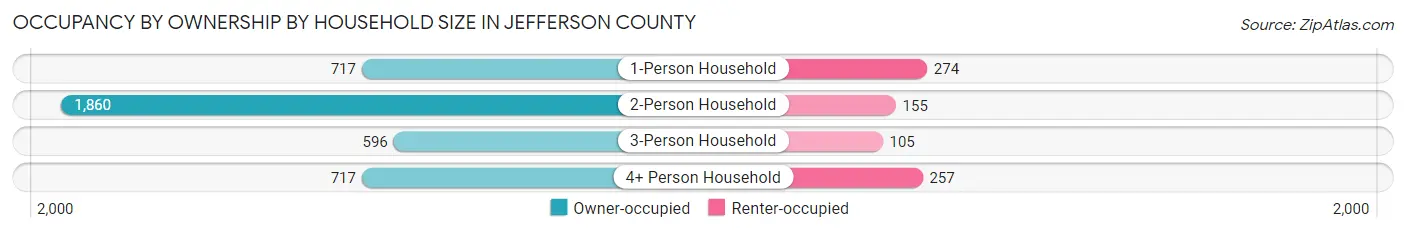
| Household Size | Owner-occupied | Renter-occupied |
| 1-Person Household | 717 (72.4%) | 274 (27.7%) |
| 2-Person Household | 1,860 (92.3%) | 155 (7.7%) |
| 3-Person Household | 596 (85.0%) | 105 (15.0%) |
| 4+ Person Household | 717 (73.6%) | 257 (26.4%) |
| Total Housing Units | 3,890 (83.1%) | 791 (16.9%) |
Occupancy by Educational Attainment in Jefferson County
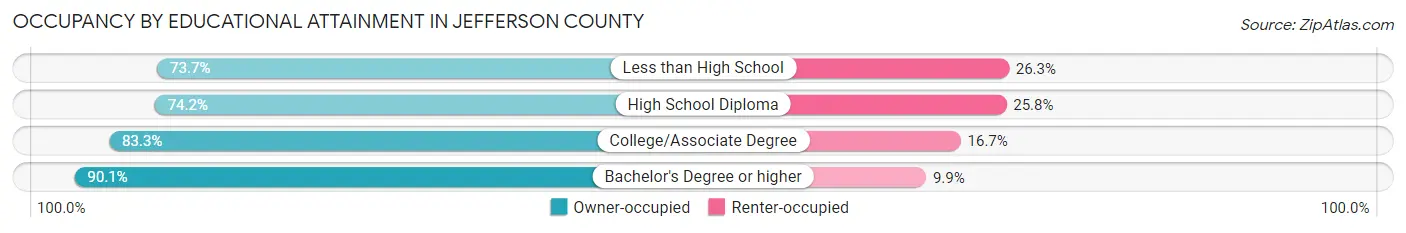
| Household Size | Owner-occupied | Renter-occupied |
| Less than High School | 129 (73.7%) | 46 (26.3%) |
| High School Diploma | 880 (74.2%) | 306 (25.8%) |
| College/Associate Degree | 1,348 (83.3%) | 271 (16.7%) |
| Bachelor's Degree or higher | 1,533 (90.1%) | 168 (9.9%) |
Occupancy by Age of Householder in Jefferson County
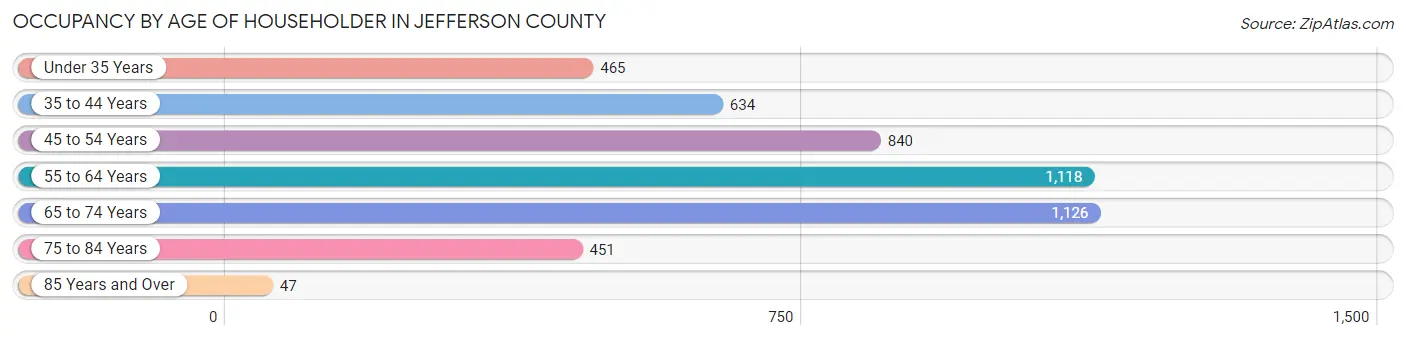
| Age Bracket | # Households | % Households |
| Under 35 Years | 465 | 9.9% |
| 35 to 44 Years | 634 | 13.5% |
| 45 to 54 Years | 840 | 17.9% |
| 55 to 64 Years | 1,118 | 23.9% |
| 65 to 74 Years | 1,126 | 24.0% |
| 75 to 84 Years | 451 | 9.6% |
| 85 Years and Over | 47 | 1.0% |
| Total | 4,681 | 100.0% |
Housing Finances in Jefferson County
Median Income by Occupancy in Jefferson County
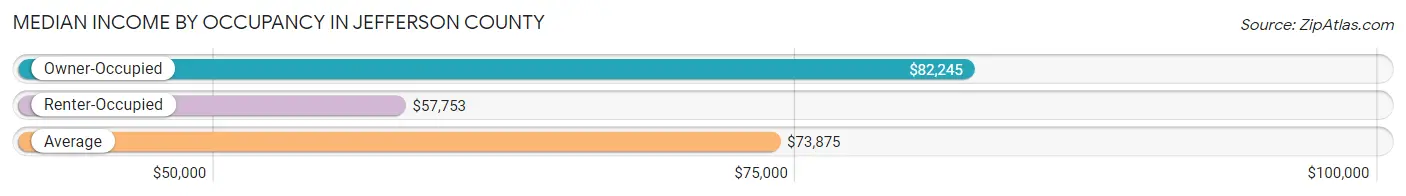
| Occupancy Type | # Households | Median Income |
| Owner-Occupied | 3,890 (83.1%) | $82,245 |
| Renter-Occupied | 791 (16.9%) | $57,753 |
| Average | 4,681 (100.0%) | $73,875 |
Occupancy by Householder Income Bracket in Jefferson County
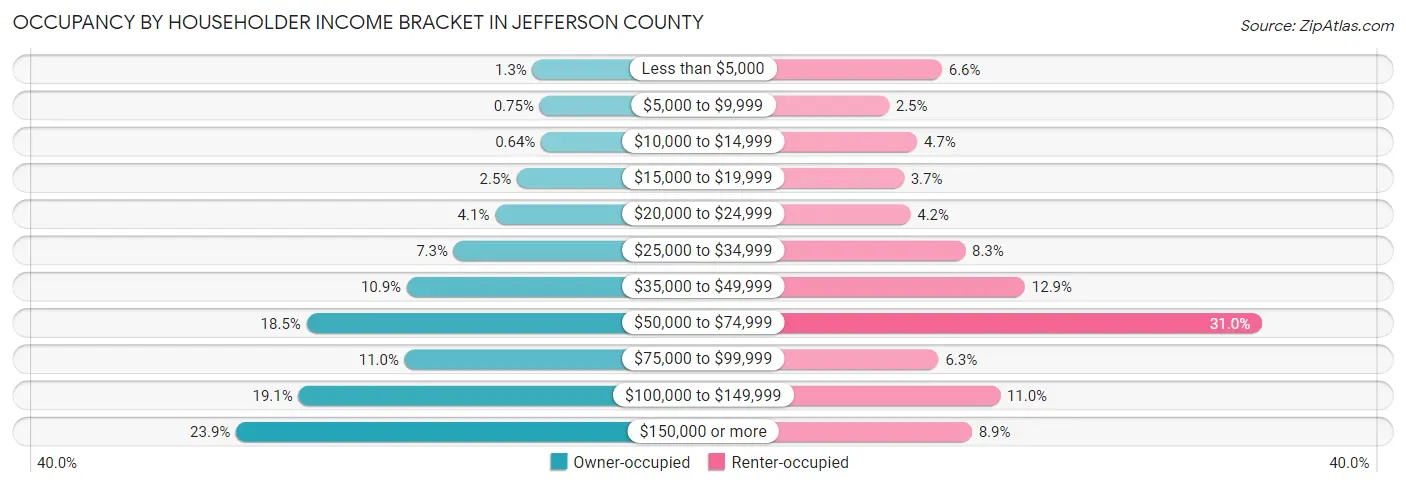
| Income Bracket | Owner-occupied | Renter-occupied |
| Less than $5,000 | 50 (1.3%) | 52 (6.6%) |
| $5,000 to $9,999 | 29 (0.7%) | 20 (2.5%) |
| $10,000 to $14,999 | 25 (0.6%) | 37 (4.7%) |
| $15,000 to $19,999 | 96 (2.5%) | 29 (3.7%) |
| $20,000 to $24,999 | 161 (4.1%) | 33 (4.2%) |
| $25,000 to $34,999 | 284 (7.3%) | 66 (8.3%) |
| $35,000 to $49,999 | 423 (10.9%) | 102 (12.9%) |
| $50,000 to $74,999 | 720 (18.5%) | 245 (31.0%) |
| $75,000 to $99,999 | 429 (11.0%) | 50 (6.3%) |
| $100,000 to $149,999 | 744 (19.1%) | 87 (11.0%) |
| $150,000 or more | 929 (23.9%) | 70 (8.8%) |
| Total | 3,890 (100.0%) | 791 (100.0%) |
Monthly Housing Cost Tiers in Jefferson County
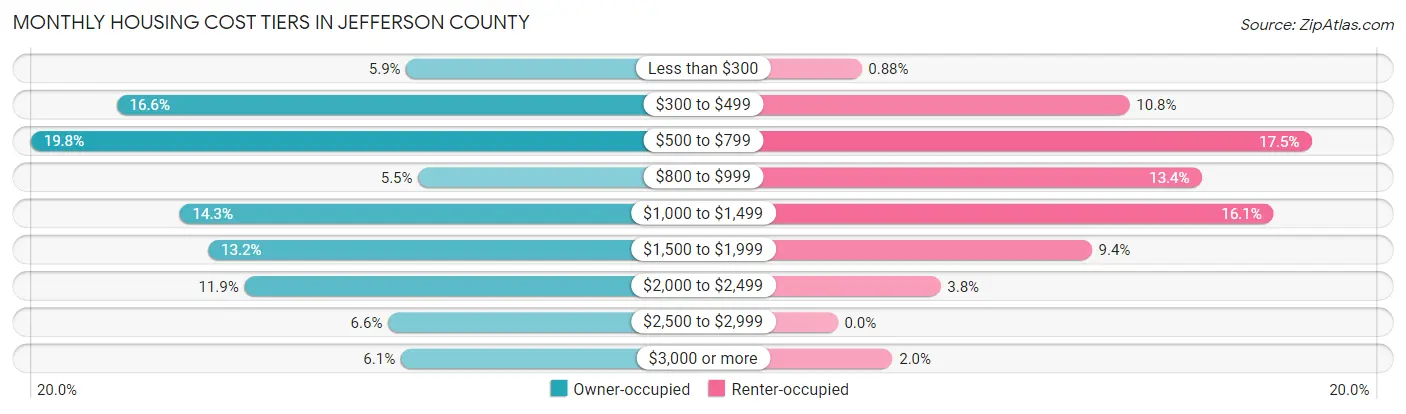
| Monthly Cost | Owner-occupied | Renter-occupied |
| Less than $300 | 231 (5.9%) | 7 (0.9%) |
| $300 to $499 | 646 (16.6%) | 85 (10.7%) |
| $500 to $799 | 769 (19.8%) | 138 (17.4%) |
| $800 to $999 | 214 (5.5%) | 106 (13.4%) |
| $1,000 to $1,499 | 556 (14.3%) | 127 (16.1%) |
| $1,500 to $1,999 | 515 (13.2%) | 74 (9.4%) |
| $2,000 to $2,499 | 463 (11.9%) | 30 (3.8%) |
| $2,500 to $2,999 | 257 (6.6%) | 0 (0.0%) |
| $3,000 or more | 239 (6.1%) | 16 (2.0%) |
| Total | 3,890 (100.0%) | 791 (100.0%) |
Physical Housing Characteristics in Jefferson County
Housing Structures in Jefferson County
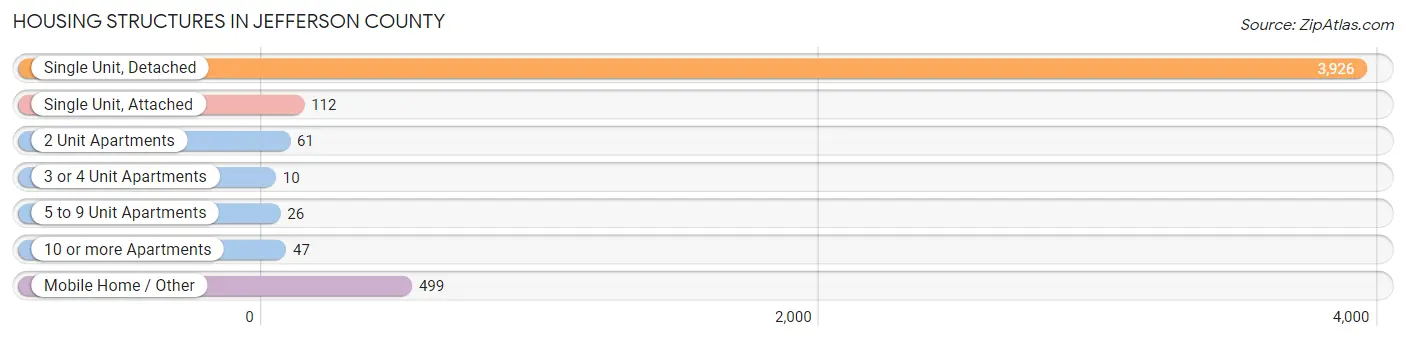
| Structure Type | # Housing Units | % Housing Units |
| Single Unit, Detached | 3,926 | 83.9% |
| Single Unit, Attached | 112 | 2.4% |
| 2 Unit Apartments | 61 | 1.3% |
| 3 or 4 Unit Apartments | 10 | 0.2% |
| 5 to 9 Unit Apartments | 26 | 0.6% |
| 10 or more Apartments | 47 | 1.0% |
| Mobile Home / Other | 499 | 10.7% |
| Total | 4,681 | 100.0% |
Housing Structures by Occupancy in Jefferson County
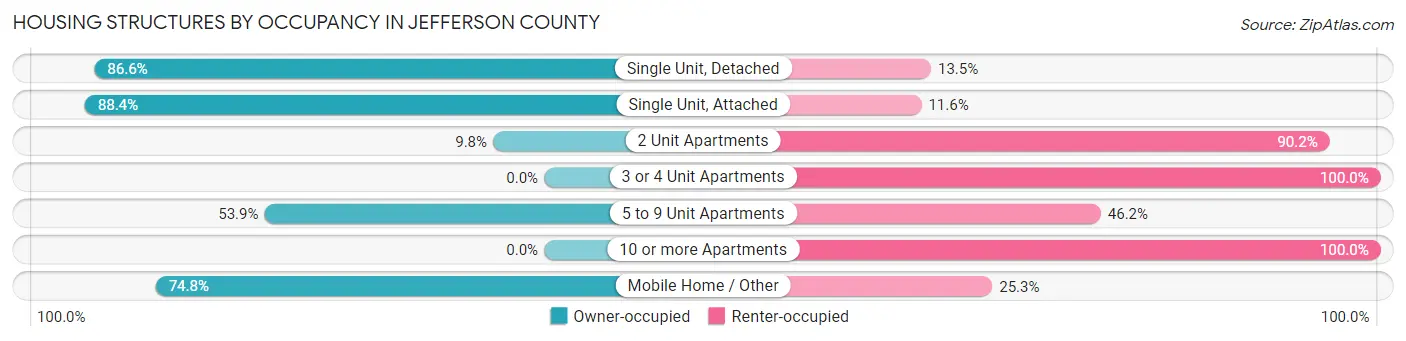
| Structure Type | Owner-occupied | Renter-occupied |
| Single Unit, Detached | 3,398 (86.6%) | 528 (13.5%) |
| Single Unit, Attached | 99 (88.4%) | 13 (11.6%) |
| 2 Unit Apartments | 6 (9.8%) | 55 (90.2%) |
| 3 or 4 Unit Apartments | 0 (0.0%) | 10 (100.0%) |
| 5 to 9 Unit Apartments | 14 (53.8%) | 12 (46.2%) |
| 10 or more Apartments | 0 (0.0%) | 47 (100.0%) |
| Mobile Home / Other | 373 (74.8%) | 126 (25.3%) |
| Total | 3,890 (83.1%) | 791 (16.9%) |
Housing Structures by Number of Rooms in Jefferson County
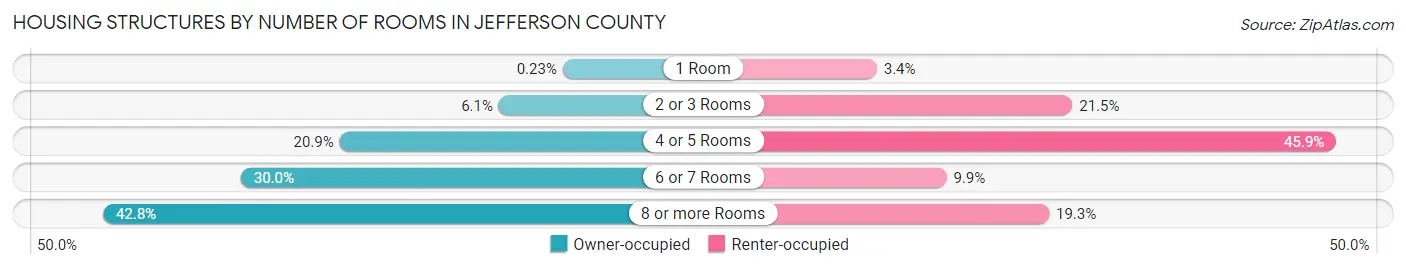
| Number of Rooms | Owner-occupied | Renter-occupied |
| 1 Room | 9 (0.2%) | 27 (3.4%) |
| 2 or 3 Rooms | 239 (6.1%) | 170 (21.5%) |
| 4 or 5 Rooms | 812 (20.9%) | 363 (45.9%) |
| 6 or 7 Rooms | 1,167 (30.0%) | 78 (9.9%) |
| 8 or more Rooms | 1,663 (42.7%) | 153 (19.3%) |
| Total | 3,890 (100.0%) | 791 (100.0%) |
Housing Structure by Heating Type in Jefferson County
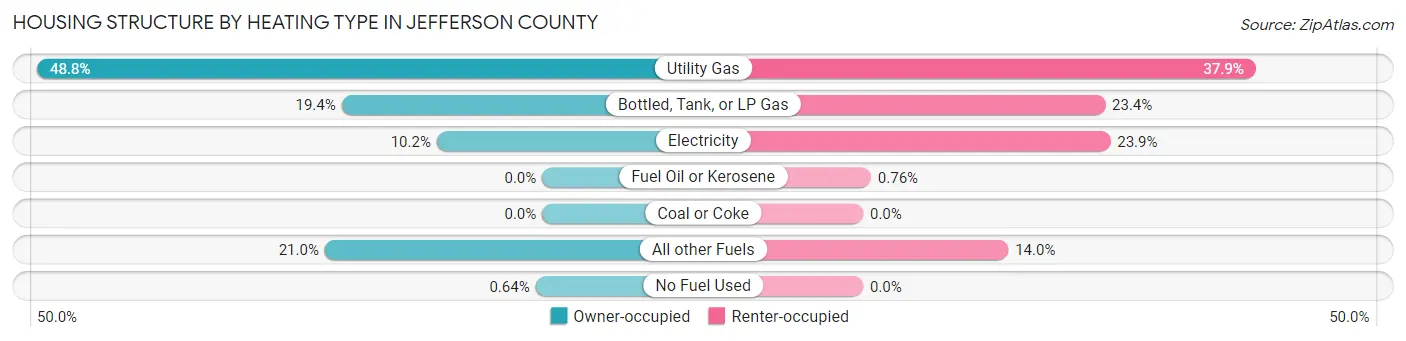
| Heating Type | Owner-occupied | Renter-occupied |
| Utility Gas | 1,898 (48.8%) | 300 (37.9%) |
| Bottled, Tank, or LP Gas | 754 (19.4%) | 185 (23.4%) |
| Electricity | 396 (10.2%) | 189 (23.9%) |
| Fuel Oil or Kerosene | 0 (0.0%) | 6 (0.8%) |
| Coal or Coke | 0 (0.0%) | 0 (0.0%) |
| All other Fuels | 817 (21.0%) | 111 (14.0%) |
| No Fuel Used | 25 (0.6%) | 0 (0.0%) |
| Total | 3,890 (100.0%) | 791 (100.0%) |
Household Vehicle Usage in Jefferson County
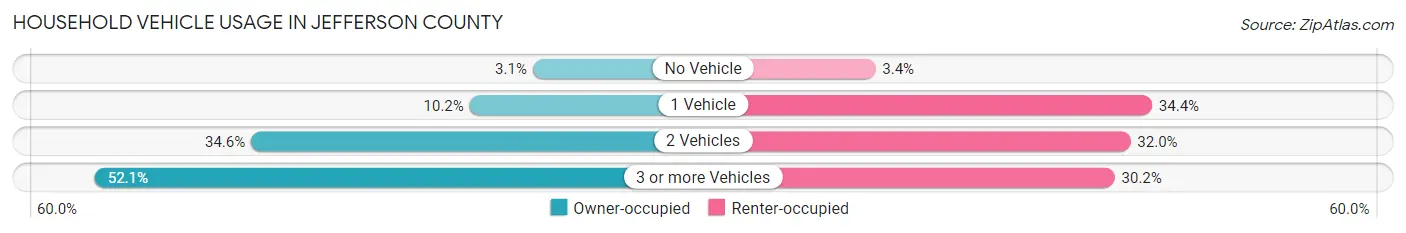
| Vehicles per Household | Owner-occupied | Renter-occupied |
| No Vehicle | 120 (3.1%) | 27 (3.4%) |
| 1 Vehicle | 395 (10.2%) | 272 (34.4%) |
| 2 Vehicles | 1,347 (34.6%) | 253 (32.0%) |
| 3 or more Vehicles | 2,028 (52.1%) | 239 (30.2%) |
| Total | 3,890 (100.0%) | 791 (100.0%) |
Real Estate & Mortgages in Jefferson County
Real Estate and Mortgage Overview in Jefferson County
| Characteristic | Without Mortgage | With Mortgage |
| Housing Units | 1,721 | 2,169 |
| Median Property Value | $294,900 | $395,400 |
| Median Household Income | $65,163 | $671 |
| Monthly Housing Costs | $502 | $239 |
| Real Estate Taxes | $2,083 | $42 |
Property Value by Mortgage Status in Jefferson County
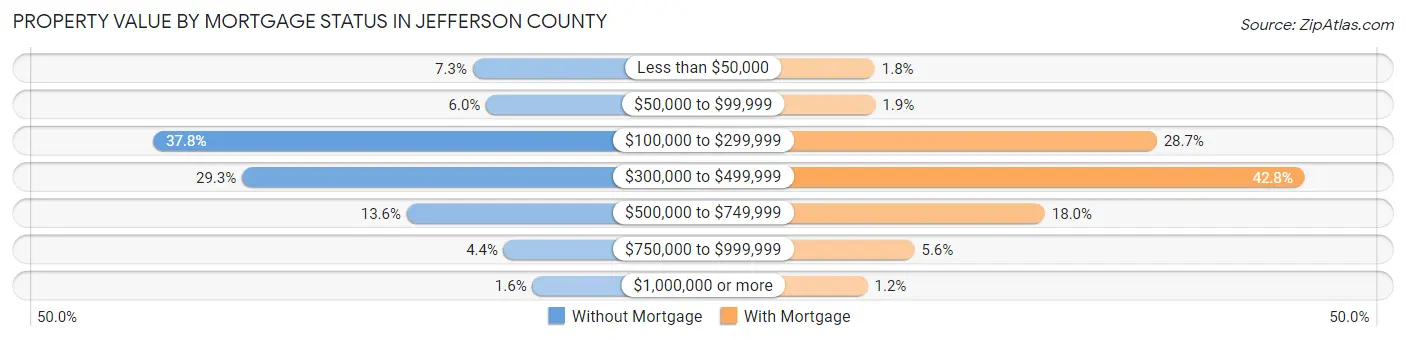
| Property Value | Without Mortgage | With Mortgage |
| Less than $50,000 | 126 (7.3%) | 40 (1.8%) |
| $50,000 to $99,999 | 104 (6.0%) | 41 (1.9%) |
| $100,000 to $299,999 | 650 (37.8%) | 622 (28.7%) |
| $300,000 to $499,999 | 504 (29.3%) | 928 (42.8%) |
| $500,000 to $749,999 | 234 (13.6%) | 391 (18.0%) |
| $750,000 to $999,999 | 75 (4.4%) | 122 (5.6%) |
| $1,000,000 or more | 28 (1.6%) | 25 (1.1%) |
| Total | 1,721 (100.0%) | 2,169 (100.0%) |
Household Income by Mortgage Status in Jefferson County
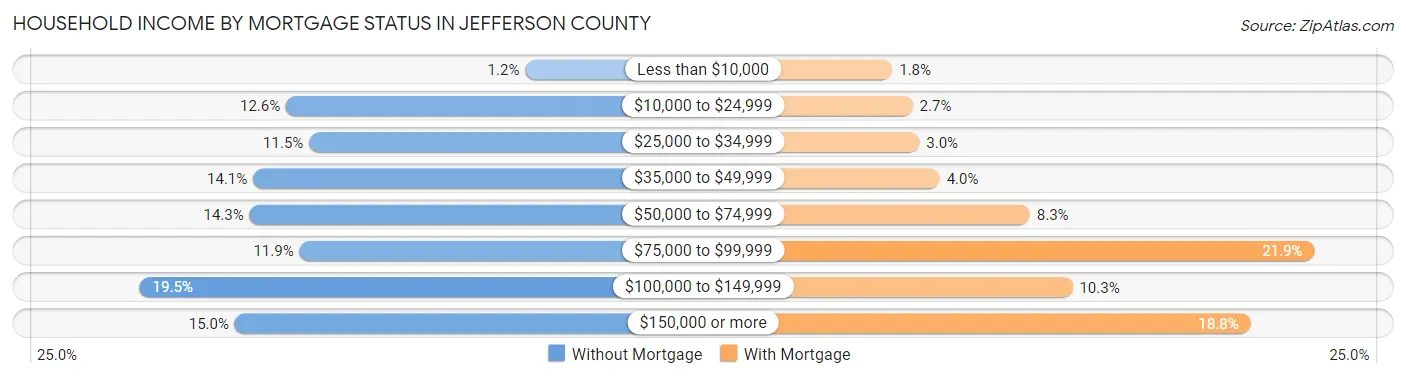
| Household Income | Without Mortgage | With Mortgage |
| Less than $10,000 | 20 (1.2%) | 38 (1.8%) |
| $10,000 to $24,999 | 216 (12.6%) | 59 (2.7%) |
| $25,000 to $34,999 | 197 (11.5%) | 66 (3.0%) |
| $35,000 to $49,999 | 243 (14.1%) | 87 (4.0%) |
| $50,000 to $74,999 | 246 (14.3%) | 180 (8.3%) |
| $75,000 to $99,999 | 205 (11.9%) | 474 (21.8%) |
| $100,000 to $149,999 | 336 (19.5%) | 224 (10.3%) |
| $150,000 or more | 258 (15.0%) | 408 (18.8%) |
| Total | 1,721 (100.0%) | 2,169 (100.0%) |
Property Value to Household Income Ratio in Jefferson County
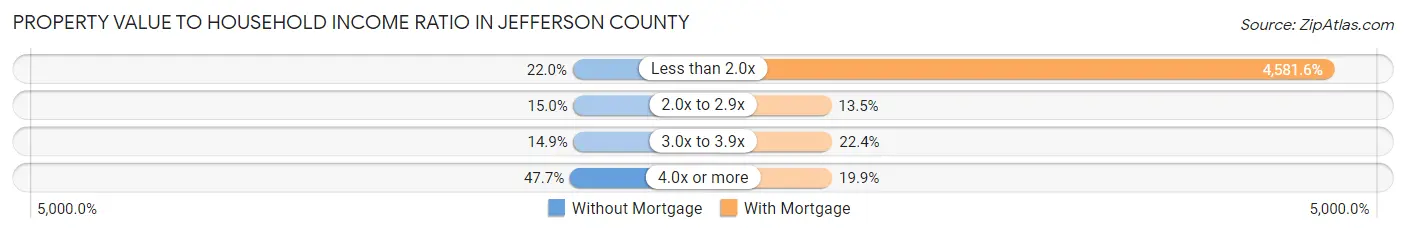
| Value-to-Income Ratio | Without Mortgage | With Mortgage |
| Less than 2.0x | 378 (22.0%) | 99,375 (4,581.6%) |
| 2.0x to 2.9x | 258 (15.0%) | 292 (13.5%) |
| 3.0x to 3.9x | 257 (14.9%) | 486 (22.4%) |
| 4.0x or more | 821 (47.7%) | 432 (19.9%) |
| Total | 1,721 (100.0%) | 2,169 (100.0%) |
Real Estate Taxes by Mortgage Status in Jefferson County
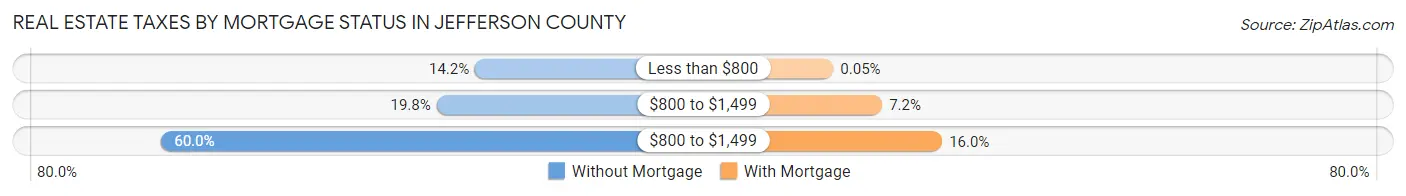
| Property Taxes | Without Mortgage | With Mortgage |
| Less than $800 | 244 (14.2%) | 1 (0.1%) |
| $800 to $1,499 | 341 (19.8%) | 156 (7.2%) |
| $800 to $1,499 | 1,033 (60.0%) | 346 (16.0%) |
| Total | 1,721 (100.0%) | 2,169 (100.0%) |
Health & Disability in Jefferson County
Health Insurance Coverage by Age in Jefferson County
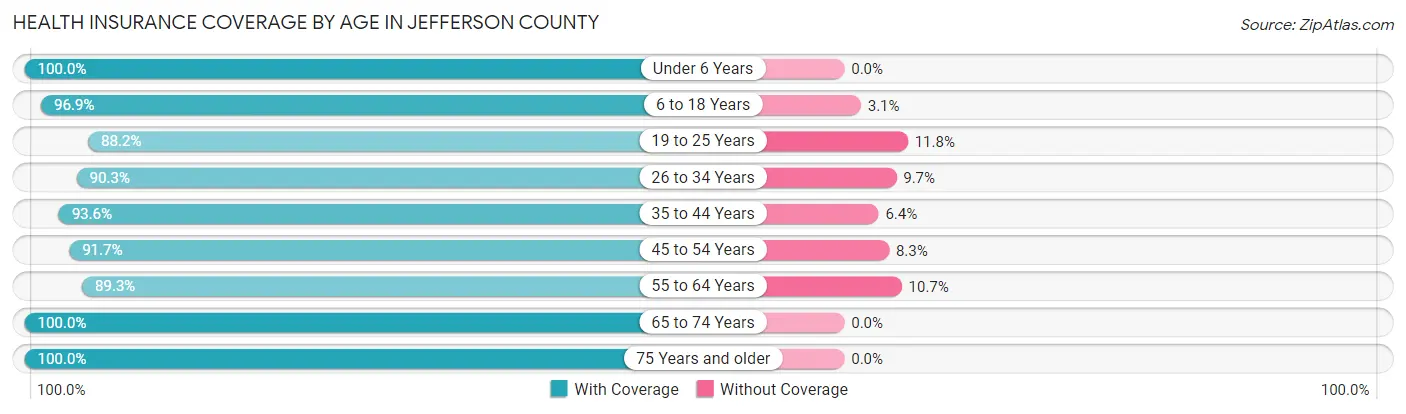
| Age Bracket | With Coverage | Without Coverage |
| Under 6 Years | 687 (100.0%) | 0 (0.0%) |
| 6 to 18 Years | 1,857 (96.9%) | 59 (3.1%) |
| 19 to 25 Years | 656 (88.2%) | 88 (11.8%) |
| 26 to 34 Years | 885 (90.3%) | 95 (9.7%) |
| 35 to 44 Years | 1,265 (93.6%) | 86 (6.4%) |
| 45 to 54 Years | 1,474 (91.7%) | 134 (8.3%) |
| 55 to 64 Years | 1,889 (89.3%) | 226 (10.7%) |
| 65 to 74 Years | 1,888 (100.0%) | 0 (0.0%) |
| 75 Years and older | 800 (100.0%) | 0 (0.0%) |
| Total | 11,401 (94.3%) | 688 (5.7%) |
Health Insurance Coverage by Citizenship Status in Jefferson County
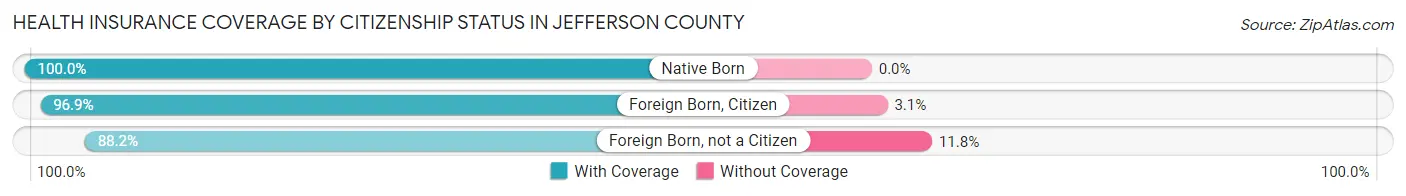
| Citizenship Status | With Coverage | Without Coverage |
| Native Born | 687 (100.0%) | 0 (0.0%) |
| Foreign Born, Citizen | 1,857 (96.9%) | 59 (3.1%) |
| Foreign Born, not a Citizen | 656 (88.2%) | 88 (11.8%) |
Health Insurance Coverage by Household Income in Jefferson County
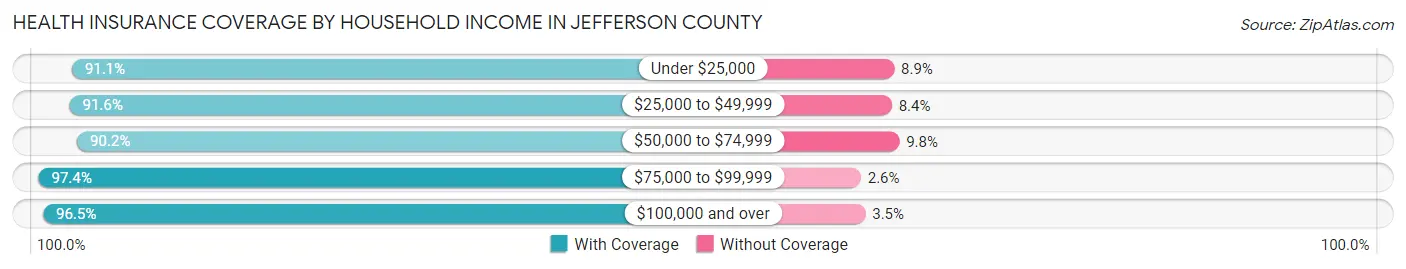
| Household Income | With Coverage | Without Coverage |
| Under $25,000 | 679 (91.1%) | 66 (8.9%) |
| $25,000 to $49,999 | 1,697 (91.6%) | 156 (8.4%) |
| $50,000 to $74,999 | 2,149 (90.2%) | 234 (9.8%) |
| $75,000 to $99,999 | 1,115 (97.4%) | 30 (2.6%) |
| $100,000 and over | 5,643 (96.5%) | 202 (3.5%) |
Public vs Private Health Insurance Coverage by Age in Jefferson County
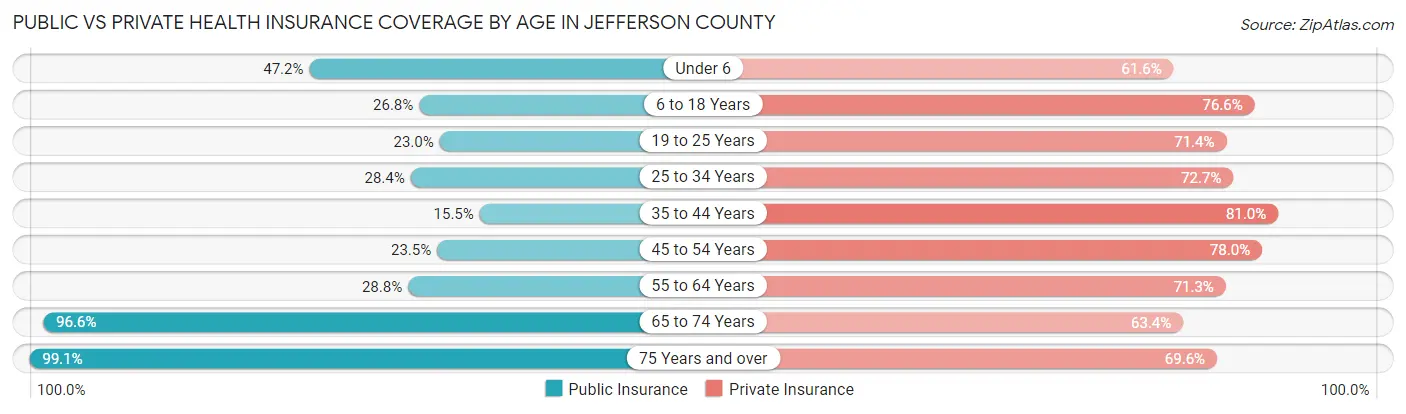
| Age Bracket | Public Insurance | Private Insurance |
| Under 6 | 324 (47.2%) | 423 (61.6%) |
| 6 to 18 Years | 513 (26.8%) | 1,468 (76.6%) |
| 19 to 25 Years | 171 (23.0%) | 531 (71.4%) |
| 25 to 34 Years | 278 (28.4%) | 712 (72.7%) |
| 35 to 44 Years | 210 (15.5%) | 1,094 (81.0%) |
| 45 to 54 Years | 377 (23.4%) | 1,254 (78.0%) |
| 55 to 64 Years | 610 (28.8%) | 1,507 (71.3%) |
| 65 to 74 Years | 1,823 (96.6%) | 1,196 (63.3%) |
| 75 Years and over | 793 (99.1%) | 557 (69.6%) |
| Total | 5,099 (42.2%) | 8,742 (72.3%) |
Disability Status by Sex by Age in Jefferson County
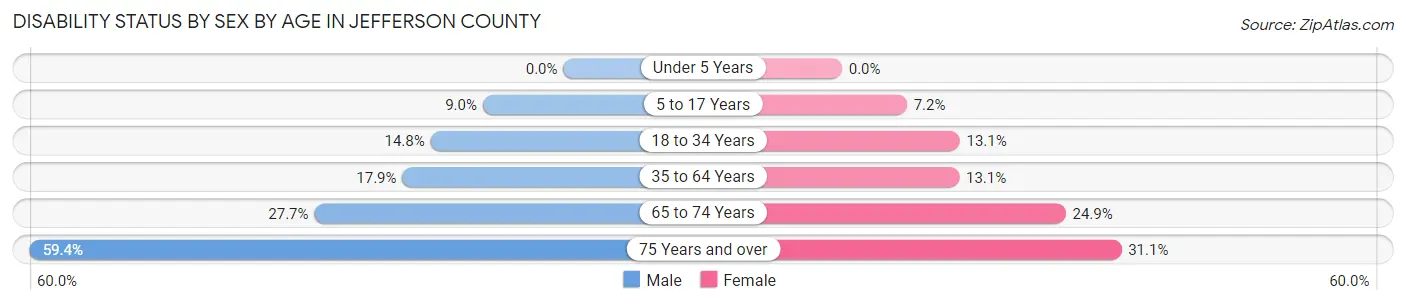
| Age Bracket | Male | Female |
| Under 5 Years | 0 (0.0%) | 0 (0.0%) |
| 5 to 17 Years | 86 (9.0%) | 67 (7.2%) |
| 18 to 34 Years | 142 (14.8%) | 123 (13.1%) |
| 35 to 64 Years | 462 (17.9%) | 326 (13.1%) |
| 65 to 74 Years | 272 (27.7%) | 226 (24.9%) |
| 75 Years and over | 252 (59.4%) | 117 (31.1%) |
Disability Class by Sex by Age in Jefferson County
Disability Class: Hearing Difficulty
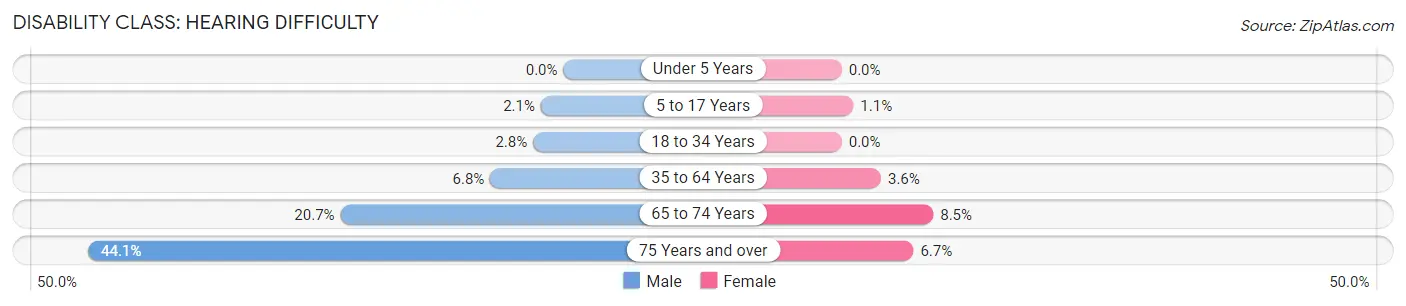
| Age Bracket | Male | Female |
| Under 5 Years | 0 (0.0%) | 0 (0.0%) |
| 5 to 17 Years | 20 (2.1%) | 10 (1.1%) |
| 18 to 34 Years | 27 (2.8%) | 0 (0.0%) |
| 35 to 64 Years | 175 (6.8%) | 91 (3.6%) |
| 65 to 74 Years | 203 (20.7%) | 77 (8.5%) |
| 75 Years and over | 187 (44.1%) | 25 (6.7%) |
Disability Class: Vision Difficulty
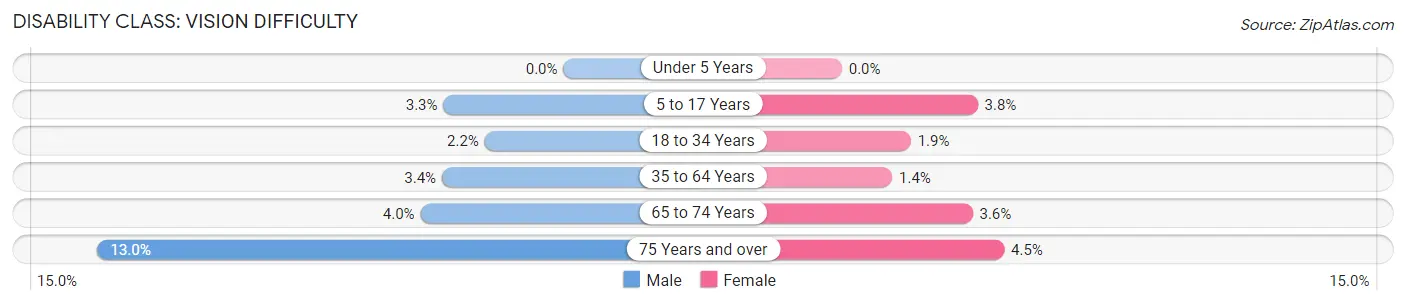
| Age Bracket | Male | Female |
| Under 5 Years | 0 (0.0%) | 0 (0.0%) |
| 5 to 17 Years | 32 (3.3%) | 35 (3.8%) |
| 18 to 34 Years | 21 (2.2%) | 18 (1.9%) |
| 35 to 64 Years | 87 (3.4%) | 35 (1.4%) |
| 65 to 74 Years | 39 (4.0%) | 33 (3.6%) |
| 75 Years and over | 55 (13.0%) | 17 (4.5%) |
Disability Class: Cognitive Difficulty
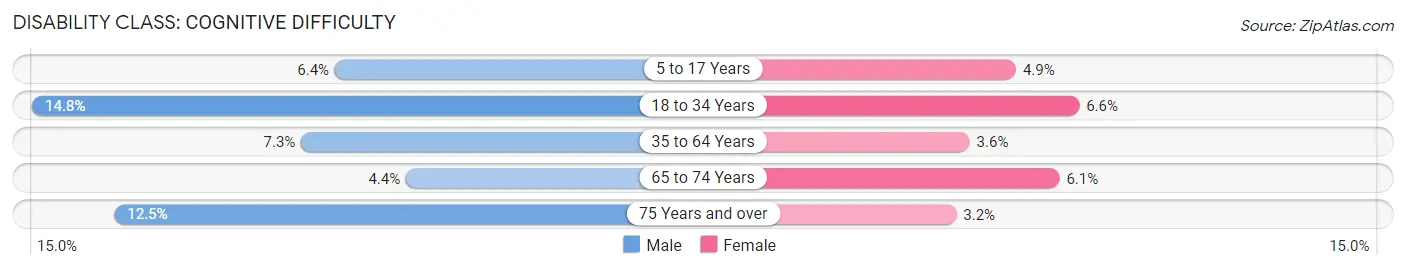
| Age Bracket | Male | Female |
| 5 to 17 Years | 61 (6.4%) | 45 (4.9%) |
| 18 to 34 Years | 142 (14.8%) | 62 (6.6%) |
| 35 to 64 Years | 188 (7.3%) | 89 (3.6%) |
| 65 to 74 Years | 43 (4.4%) | 55 (6.1%) |
| 75 Years and over | 53 (12.5%) | 12 (3.2%) |
Disability Class: Ambulatory Difficulty
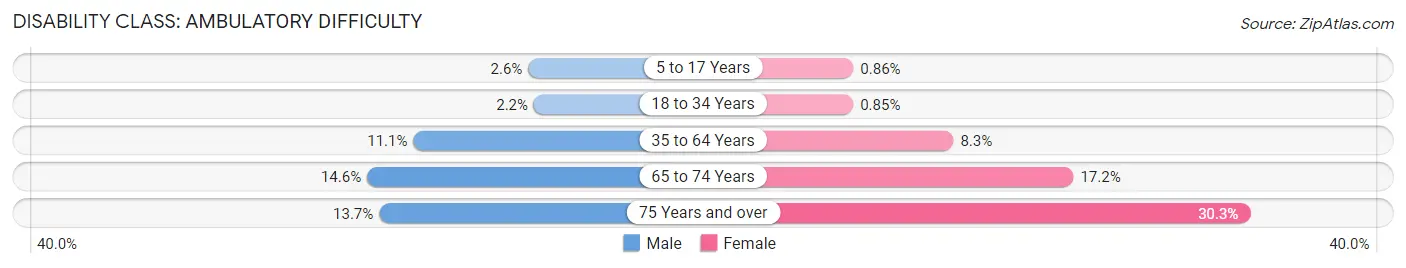
| Age Bracket | Male | Female |
| 5 to 17 Years | 25 (2.6%) | 8 (0.9%) |
| 18 to 34 Years | 21 (2.2%) | 8 (0.9%) |
| 35 to 64 Years | 287 (11.1%) | 207 (8.3%) |
| 65 to 74 Years | 143 (14.6%) | 156 (17.2%) |
| 75 Years and over | 58 (13.7%) | 114 (30.3%) |
Disability Class: Self-Care Difficulty
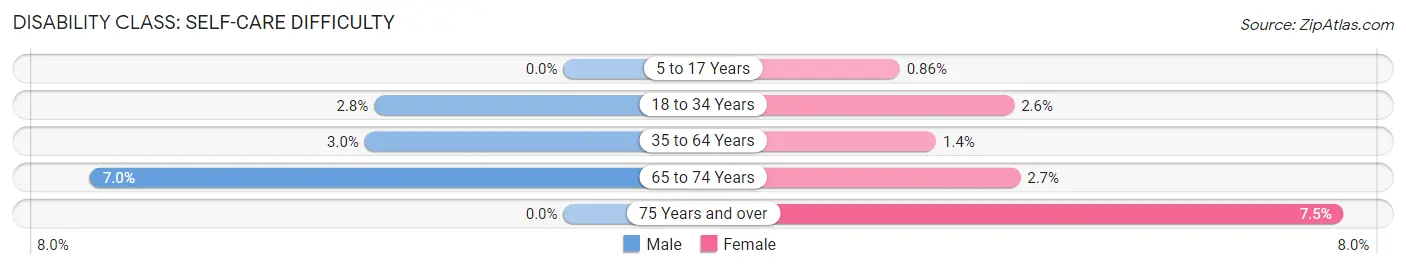
| Age Bracket | Male | Female |
| 5 to 17 Years | 0 (0.0%) | 8 (0.9%) |
| 18 to 34 Years | 27 (2.8%) | 24 (2.6%) |
| 35 to 64 Years | 76 (2.9%) | 35 (1.4%) |
| 65 to 74 Years | 69 (7.0%) | 24 (2.6%) |
| 75 Years and over | 0 (0.0%) | 28 (7.4%) |
Technology Access in Jefferson County
Computing Device Access in Jefferson County
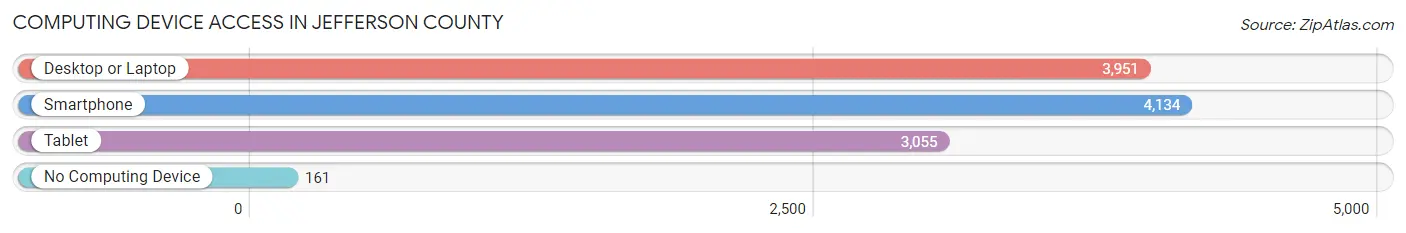
| Device Type | # Households | % Households |
| Desktop or Laptop | 3,951 | 84.4% |
| Smartphone | 4,134 | 88.3% |
| Tablet | 3,055 | 65.3% |
| No Computing Device | 161 | 3.4% |
| Total | 4,681 | 100.0% |
Internet Access in Jefferson County
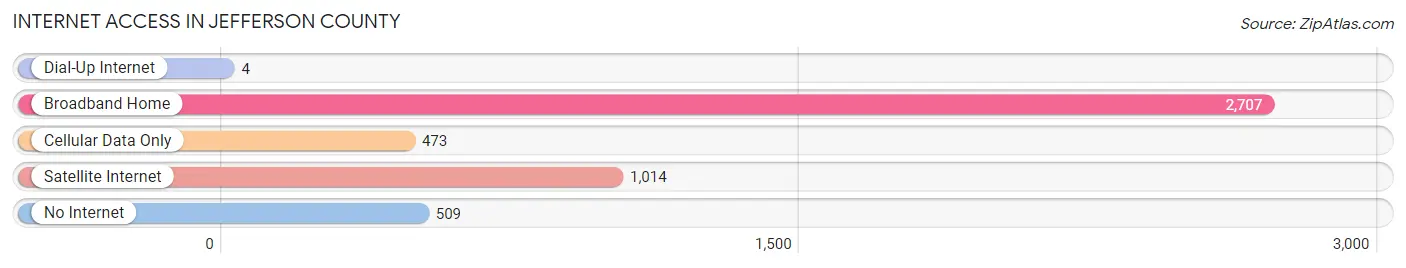
| Internet Type | # Households | % Households |
| Dial-Up Internet | 4 | 0.1% |
| Broadband Home | 2,707 | 57.8% |
| Cellular Data Only | 473 | 10.1% |
| Satellite Internet | 1,014 | 21.7% |
| No Internet | 509 | 10.9% |
| Total | 4,681 | 100.0% |
Jefferson County Summary
Jefferson County, Montana is located in the southwestern corner of the state, bordered by Idaho to the west and Wyoming to the south. It is the fourth-largest county in Montana, covering an area of 2,845 square miles. The county seat is Boulder, and the largest city is Whitehall. As of the 2010 census, the population was 11,406.
History
The area that is now Jefferson County was first inhabited by Native American tribes, including the Salish, Kootenai, and Blackfeet. The first white settlers arrived in the area in the 1860s, and the county was officially established in 1865. The county was named after Thomas Jefferson, the third president of the United States.
The county was initially an agricultural area, with settlers growing wheat, barley, and oats. In the late 19th century, the area became known for its copper and gold mining. The county also became a popular tourist destination, with visitors coming to enjoy the area’s natural beauty.
Geography
Jefferson County is located in the Rocky Mountains, with the Continental Divide running through the county. The county is home to several mountain ranges, including the Tobacco Root Mountains, the Big Belt Mountains, and the Elkhorn Mountains. The county is also home to several rivers, including the Jefferson River, the Big Hole River, and the Boulder River.
The county has a variety of terrain, ranging from high mountain peaks to rolling hills and plains. The highest point in the county is Mount Jefferson, which has an elevation of 10,154 feet. The lowest point is the Jefferson River, which has an elevation of 3,400 feet.
Economy
The economy of Jefferson County is largely based on agriculture and tourism. The county is home to several large farms, which produce wheat, barley, oats, hay, and other crops. The county is also home to several ranches, which raise cattle, sheep, and horses.
Tourism is also an important part of the county’s economy. The county is home to several popular tourist attractions, including the Lewis and Clark Caverns State Park, the Jefferson River Canoe Trail, and the Big Hole National Battlefield.
Demographics
As of the 2010 census, the population of Jefferson County was 11,406. The population is predominantly white (94.3%), with small percentages of Native American (2.2%), African American (0.7%), Asian (0.4%), and other races (2.4%). The median household income is $41,945, and the median age is 44.7 years.
Jefferson County is a rural area, with most of the population living in small towns and rural areas. The largest city in the county is Whitehall, which has a population of 1,845. Other cities in the county include Boulder (population 1,072), Clancy (population 845), and Cardwell (population 645).
Conclusion
Jefferson County, Montana is a rural area located in the southwestern corner of the state. The county is home to several mountain ranges, rivers, and other natural attractions, making it a popular tourist destination. The economy of the county is largely based on agriculture and tourism, and the population is predominantly white.
Common Questions
What is Per Capita Income in Jefferson County?
Per Capita income in Jefferson County is $39,963.
What is the Median Family Income in Jefferson County?
Median Family Income in Jefferson County is $89,914.
What is the Median Household income in Jefferson County?
Median Household Income in Jefferson County is $73,875.
What is Income or Wage Gap in Jefferson County?
Income or Wage Gap in Jefferson County is 40.8%.
Women in Jefferson County earn 59.2 cents for every dollar earned by a man.
What is Family Income Deficit in Jefferson County?
Family Income Deficit in Jefferson County is $10,446.
Families that are below poverty line in Jefferson County earn $10,446 less on average than the poverty threshold level.
What is Inequality or Gini Index in Jefferson County?
Inequality or Gini Index in Jefferson County is 0.43.
What is the Total Population of Jefferson County?
Total Population of Jefferson County is 12,273.
What is the Total Male Population of Jefferson County?
Total Male Population of Jefferson County is 6,282.
What is the Total Female Population of Jefferson County?
Total Female Population of Jefferson County is 5,991.
What is the Ratio of Males per 100 Females in Jefferson County?
There are 104.86 Males per 100 Females in Jefferson County.
What is the Ratio of Females per 100 Males in Jefferson County?
There are 95.37 Females per 100 Males in Jefferson County.
What is the Median Population Age in Jefferson County?
Median Population Age in Jefferson County is 47.4 Years.
What is the Average Family Size in Jefferson County
Average Family Size in Jefferson County is 3.0 People.
What is the Average Household Size in Jefferson County
Average Household Size in Jefferson County is 2.6 People.
How Large is the Labor Force in Jefferson County?
There are 5,821 People in the Labor Forcein in Jefferson County.
What is the Percentage of People in the Labor Force in Jefferson County?
57.5% of People are in the Labor Force in Jefferson County.
What is the Unemployment Rate in Jefferson County?
Unemployment Rate in Jefferson County is 3.4%.