Evergreen, MT Map & Demographics
Evergreen Map
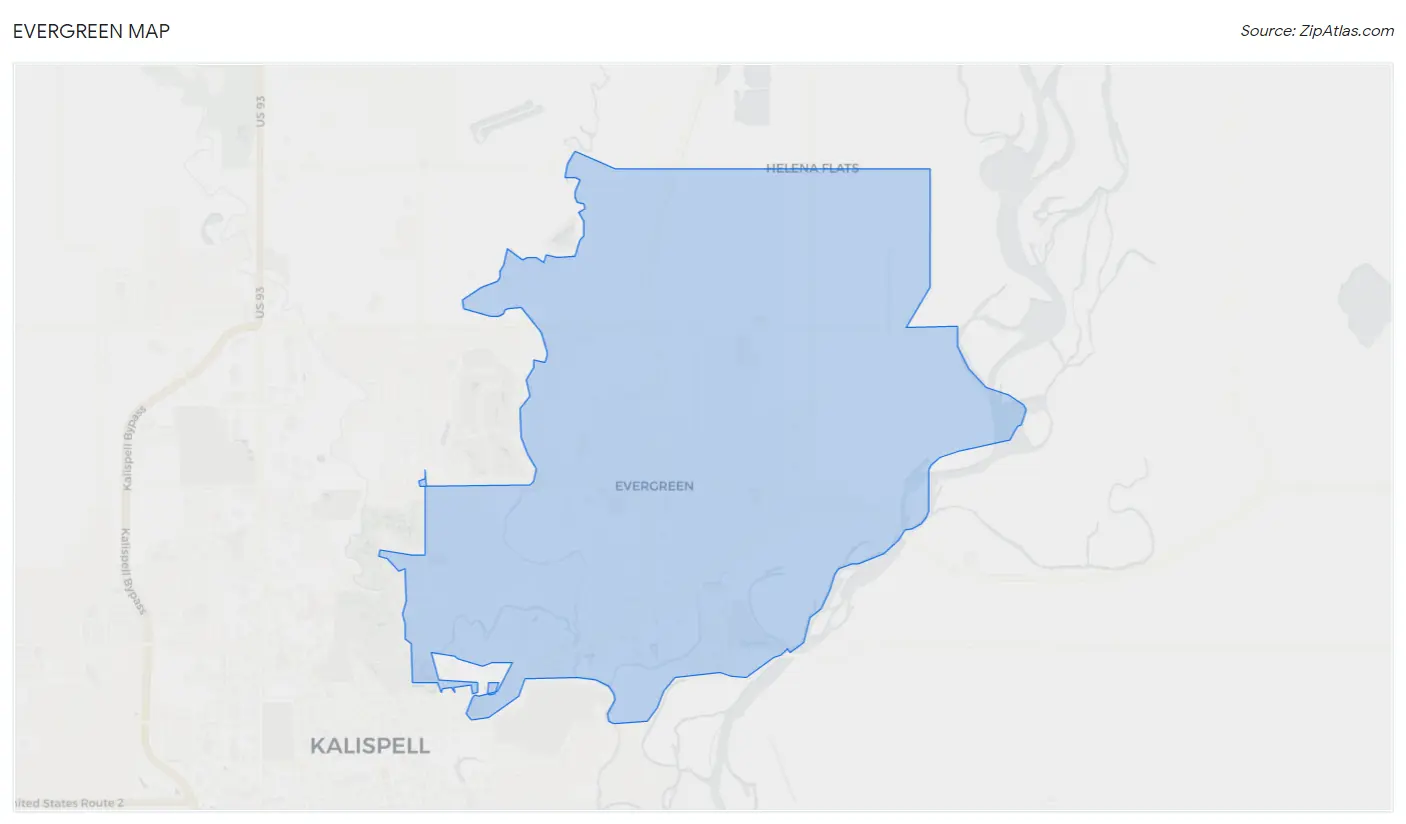
Evergreen Overview
$28,955
PER CAPITA INCOME
$75,799
AVG FAMILY INCOME
$68,039
AVG HOUSEHOLD INCOME
24.7%
WAGE / INCOME GAP [ % ]
75.3¢/ $1
WAGE / INCOME GAP [ $ ]
$10,063
FAMILY INCOME DEFICIT
0.36
INEQUALITY / GINI INDEX
8,514
TOTAL POPULATION
4,186
MALE POPULATION
4,328
FEMALE POPULATION
96.72
MALES / 100 FEMALES
103.39
FEMALES / 100 MALES
38.9
MEDIAN AGE
3.1
AVG FAMILY SIZE
2.8
AVG HOUSEHOLD SIZE
4,867
LABOR FORCE [ PEOPLE ]
69.9%
PERCENT IN LABOR FORCE
4.3%
UNEMPLOYMENT RATE
Evergreen Area Codes
Income in Evergreen
Income Overview in Evergreen
Per Capita Income in Evergreen is $28,955, while median incomes of families and households are $75,799 and $68,039 respectively.
| Characteristic | Number | Measure |
| Per Capita Income | 8,514 | $28,955 |
| Median Family Income | 2,254 | $75,799 |
| Mean Family Income | 2,254 | $86,725 |
| Median Household Income | 3,068 | $68,039 |
| Mean Household Income | 3,068 | $77,460 |
| Income Deficit | 2,254 | $10,063 |
| Wage / Income Gap (%) | 8,514 | 24.66% |
| Wage / Income Gap ($) | 8,514 | 75.34¢ per $1 |
| Gini / Inequality Index | 8,514 | 0.36 |
Earnings by Sex in Evergreen
Average Earnings in Evergreen are $33,817, $39,519 for men and $29,772 for women, a difference of 24.7%.
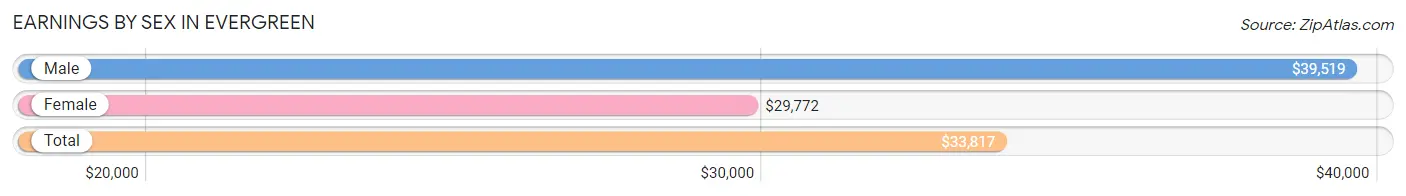
| Sex | Number | Average Earnings |
| Male | 2,700 (53.5%) | $39,519 |
| Female | 2,348 (46.5%) | $29,772 |
| Total | 5,048 (100.0%) | $33,817 |
Earnings by Sex by Income Bracket in Evergreen
The most common earnings brackets in Evergreen are $55,000 to $64,999 for men (350 | 13.0%) and $25,000 to $29,999 for women (406 | 17.3%).
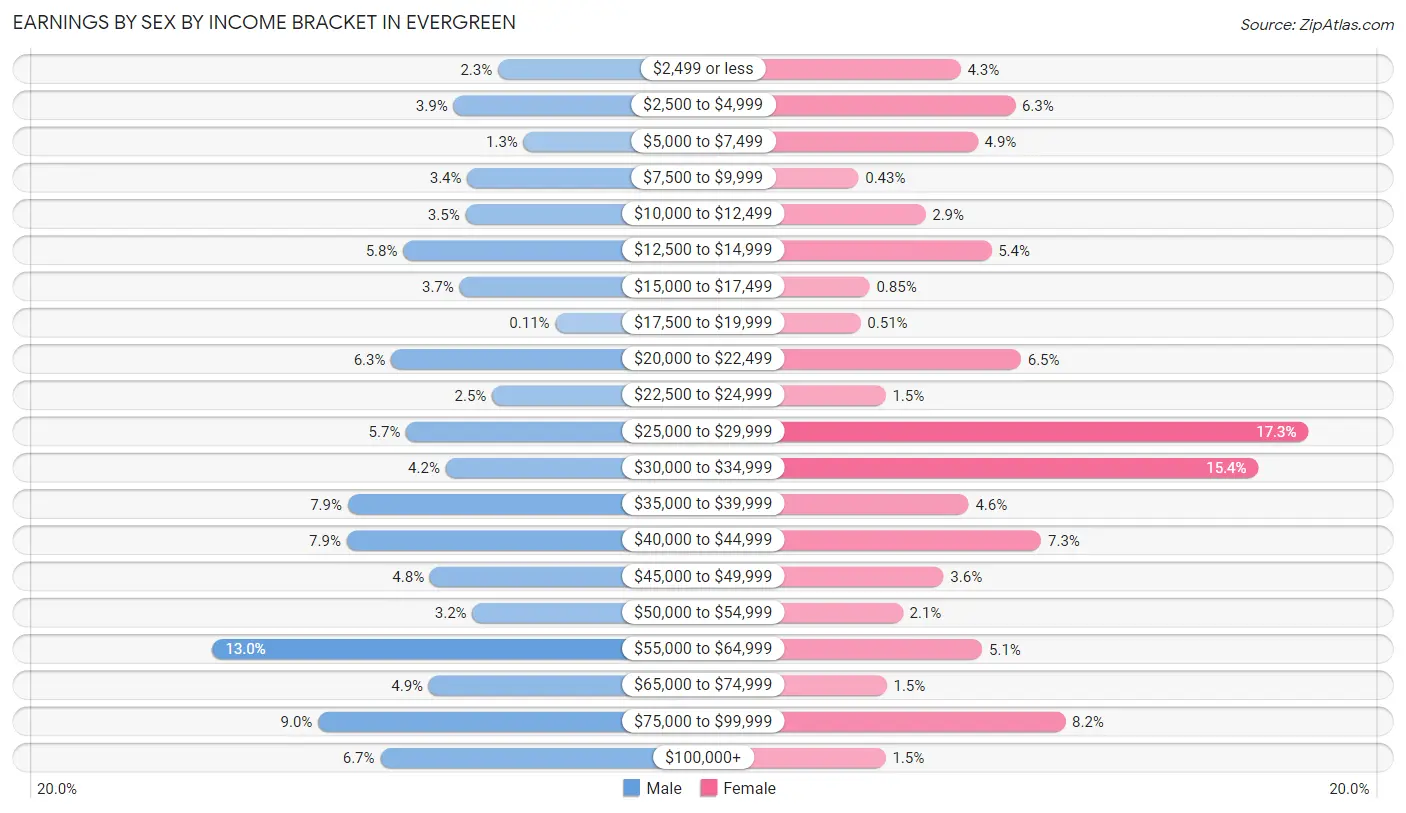
| Income | Male | Female |
| $2,499 or less | 61 (2.3%) | 100 (4.3%) |
| $2,500 to $4,999 | 106 (3.9%) | 148 (6.3%) |
| $5,000 to $7,499 | 35 (1.3%) | 115 (4.9%) |
| $7,500 to $9,999 | 92 (3.4%) | 10 (0.4%) |
| $10,000 to $12,499 | 94 (3.5%) | 69 (2.9%) |
| $12,500 to $14,999 | 157 (5.8%) | 127 (5.4%) |
| $15,000 to $17,499 | 100 (3.7%) | 20 (0.9%) |
| $17,500 to $19,999 | 3 (0.1%) | 12 (0.5%) |
| $20,000 to $22,499 | 169 (6.3%) | 153 (6.5%) |
| $22,500 to $24,999 | 67 (2.5%) | 34 (1.5%) |
| $25,000 to $29,999 | 154 (5.7%) | 406 (17.3%) |
| $30,000 to $34,999 | 114 (4.2%) | 362 (15.4%) |
| $35,000 to $39,999 | 213 (7.9%) | 107 (4.6%) |
| $40,000 to $44,999 | 214 (7.9%) | 171 (7.3%) |
| $45,000 to $49,999 | 130 (4.8%) | 85 (3.6%) |
| $50,000 to $54,999 | 87 (3.2%) | 49 (2.1%) |
| $55,000 to $64,999 | 350 (13.0%) | 119 (5.1%) |
| $65,000 to $74,999 | 131 (4.9%) | 35 (1.5%) |
| $75,000 to $99,999 | 243 (9.0%) | 192 (8.2%) |
| $100,000+ | 180 (6.7%) | 34 (1.5%) |
| Total | 2,700 (100.0%) | 2,348 (100.0%) |
Earnings by Sex by Educational Attainment in Evergreen
Average earnings in Evergreen are $41,345 for men and $33,760 for women, a difference of 18.3%. Men with an educational attainment of college or associate's degree enjoy the highest average annual earnings of $54,236, while those with high school diploma education earn the least with $33,980. Women with an educational attainment of bachelor's degree earn the most with the average annual earnings of $40,810, while those with high school diploma education have the smallest earnings of $27,282.
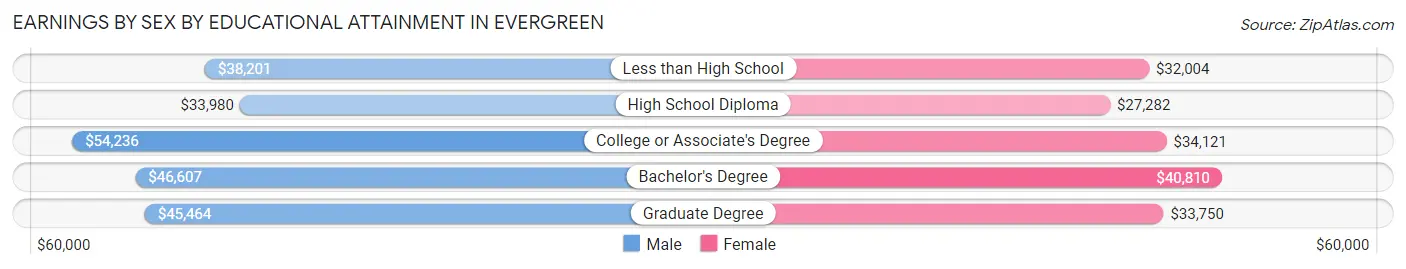
| Educational Attainment | Male Income | Female Income |
| Less than High School | $38,201 | $32,004 |
| High School Diploma | $33,980 | $27,282 |
| College or Associate's Degree | $54,236 | $34,121 |
| Bachelor's Degree | $46,607 | $40,810 |
| Graduate Degree | $45,464 | $33,750 |
| Total | $41,345 | $33,760 |
Family Income in Evergreen
Family Income Brackets in Evergreen
According to the Evergreen family income data, there are 460 families falling into the $75,000 to $99,999 income range, which is the most common income bracket and makes up 20.4% of all families. Conversely, the $15,000 to $24,999 income bracket is the least frequent group with only 27 families (1.2%) belonging to this category.
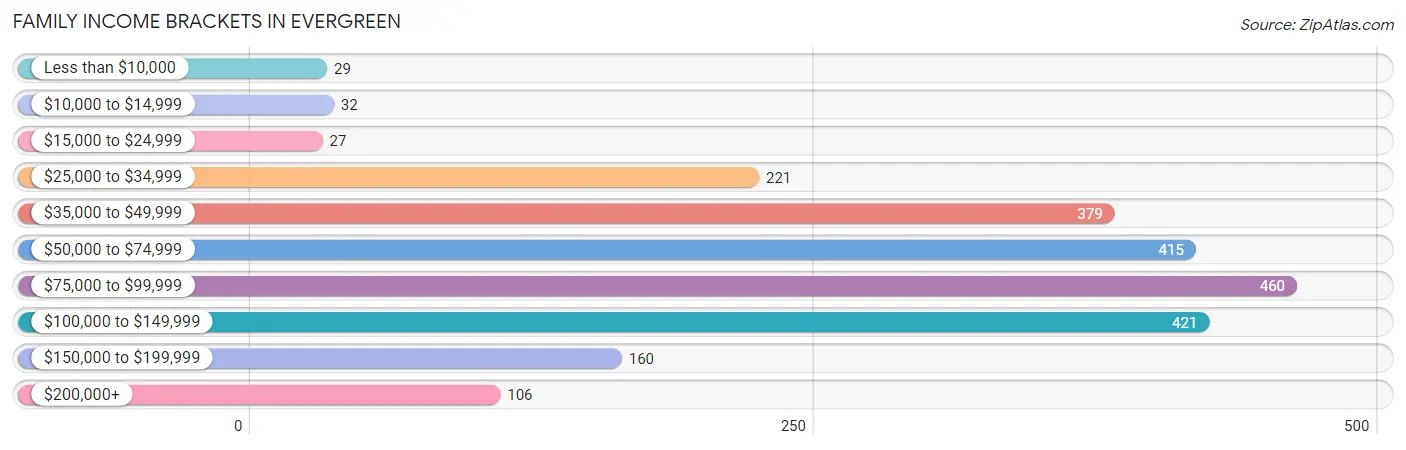
| Income Bracket | # Families | % Families |
| Less than $10,000 | 29 | 1.3% |
| $10,000 to $14,999 | 32 | 1.4% |
| $15,000 to $24,999 | 27 | 1.2% |
| $25,000 to $34,999 | 221 | 9.8% |
| $35,000 to $49,999 | 379 | 16.8% |
| $50,000 to $74,999 | 415 | 18.4% |
| $75,000 to $99,999 | 460 | 20.4% |
| $100,000 to $149,999 | 421 | 18.7% |
| $150,000 to $199,999 | 160 | 7.1% |
| $200,000+ | 106 | 4.7% |
Family Income by Famaliy Size in Evergreen
6-person families (56 | 2.5%) account for the highest median family income in Evergreen with $132,656 per family, while 2-person families (1,167 | 51.8%) have the highest median income of $38,924 per family member.
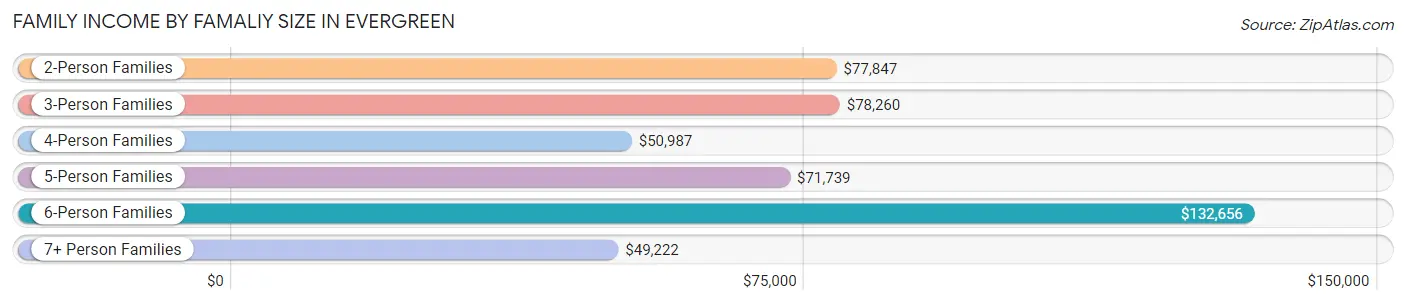
| Income Bracket | # Families | Median Income |
| 2-Person Families | 1,167 (51.8%) | $77,847 |
| 3-Person Families | 553 (24.5%) | $78,260 |
| 4-Person Families | 327 (14.5%) | $50,987 |
| 5-Person Families | 78 (3.5%) | $71,739 |
| 6-Person Families | 56 (2.5%) | $132,656 |
| 7+ Person Families | 73 (3.2%) | $49,222 |
| Total | 2,254 (100.0%) | $75,799 |
Family Income by Number of Earners in Evergreen
The median family income in Evergreen is $75,799, with families comprising 2 earners (1,068) having the highest median family income of $95,726, while families with no earners (227) have the lowest median family income of $37,250, accounting for 47.4% and 10.1% of families, respectively.
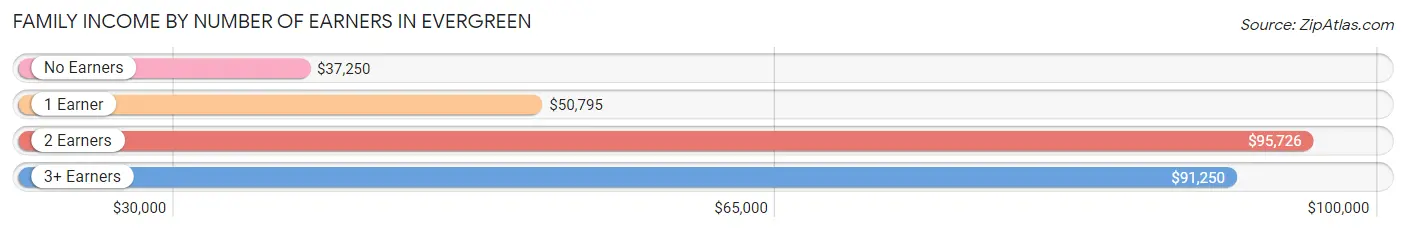
| Number of Earners | # Families | Median Income |
| No Earners | 227 (10.1%) | $37,250 |
| 1 Earner | 579 (25.7%) | $50,795 |
| 2 Earners | 1,068 (47.4%) | $95,726 |
| 3+ Earners | 380 (16.9%) | $91,250 |
| Total | 2,254 (100.0%) | $75,799 |
Household Income in Evergreen
Household Income Brackets in Evergreen
With 657 households falling in the category, the $75,000 to $99,999 income range is the most frequent in Evergreen, accounting for 21.4% of all households. In contrast, only 40 households (1.3%) fall into the $10,000 to $14,999 income bracket, making it the least populous group.
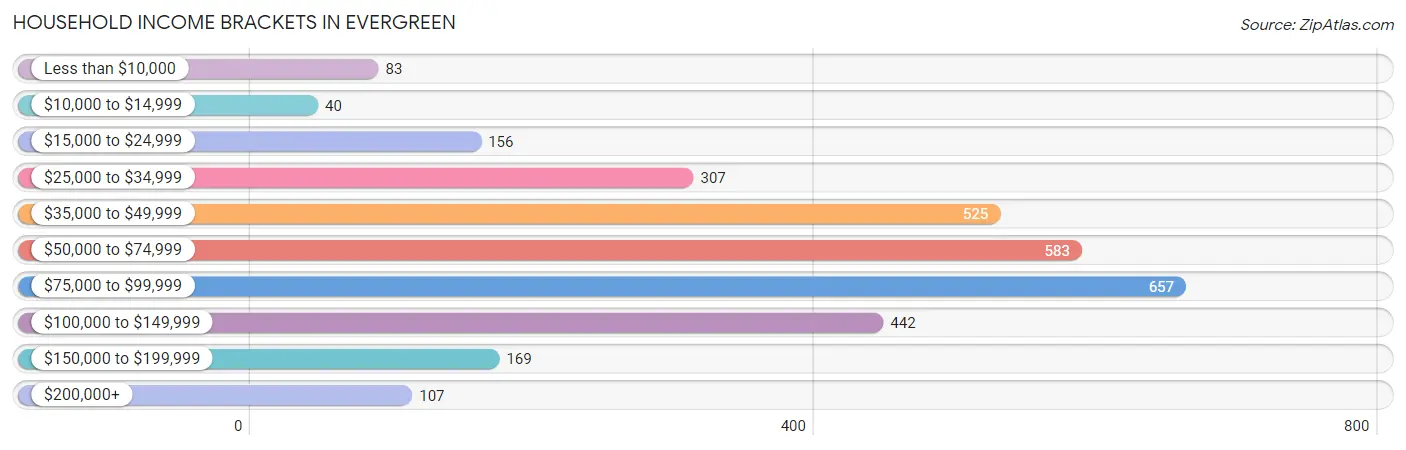
| Income Bracket | # Households | % Households |
| Less than $10,000 | 83 | 2.7% |
| $10,000 to $14,999 | 40 | 1.3% |
| $15,000 to $24,999 | 156 | 5.1% |
| $25,000 to $34,999 | 307 | 10.0% |
| $35,000 to $49,999 | 525 | 17.1% |
| $50,000 to $74,999 | 583 | 19.0% |
| $75,000 to $99,999 | 657 | 21.4% |
| $100,000 to $149,999 | 442 | 14.4% |
| $150,000 to $199,999 | 169 | 5.5% |
| $200,000+ | 107 | 3.5% |
Household Income by Householder Age in Evergreen
The median household income in Evergreen is $68,039, with the highest median household income of $80,568 found in the 15 to 24 years age bracket for the primary householder. A total of 141 households (4.6%) fall into this category. Meanwhile, the 65+ years age bracket for the primary householder has the lowest median household income of $44,531, with 713 households (23.2%) in this group.
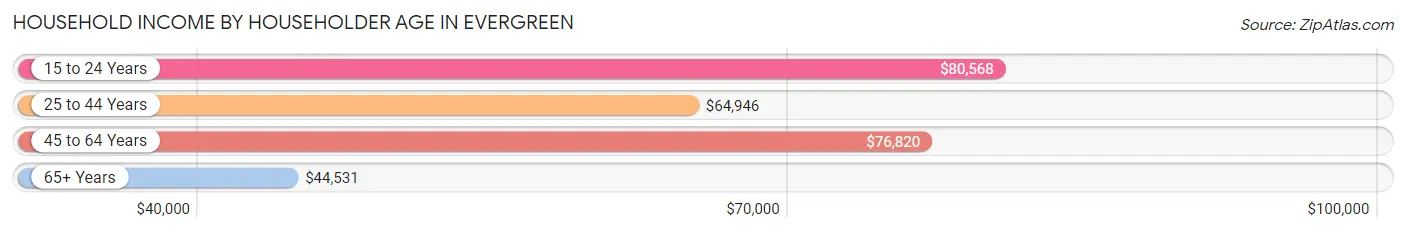
| Income Bracket | # Households | Median Income |
| 15 to 24 Years | 141 (4.6%) | $80,568 |
| 25 to 44 Years | 969 (31.6%) | $64,946 |
| 45 to 64 Years | 1,245 (40.6%) | $76,820 |
| 65+ Years | 713 (23.2%) | $44,531 |
| Total | 3,068 (100.0%) | $68,039 |
Poverty in Evergreen
Income Below Poverty by Sex and Age in Evergreen
With 11.8% poverty level for males and 11.7% for females among the residents of Evergreen, 15 year old males and 15 year old females are the most vulnerable to poverty, with 13 males (59.1%) and 44 females (86.3%) in their respective age groups living below the poverty level.
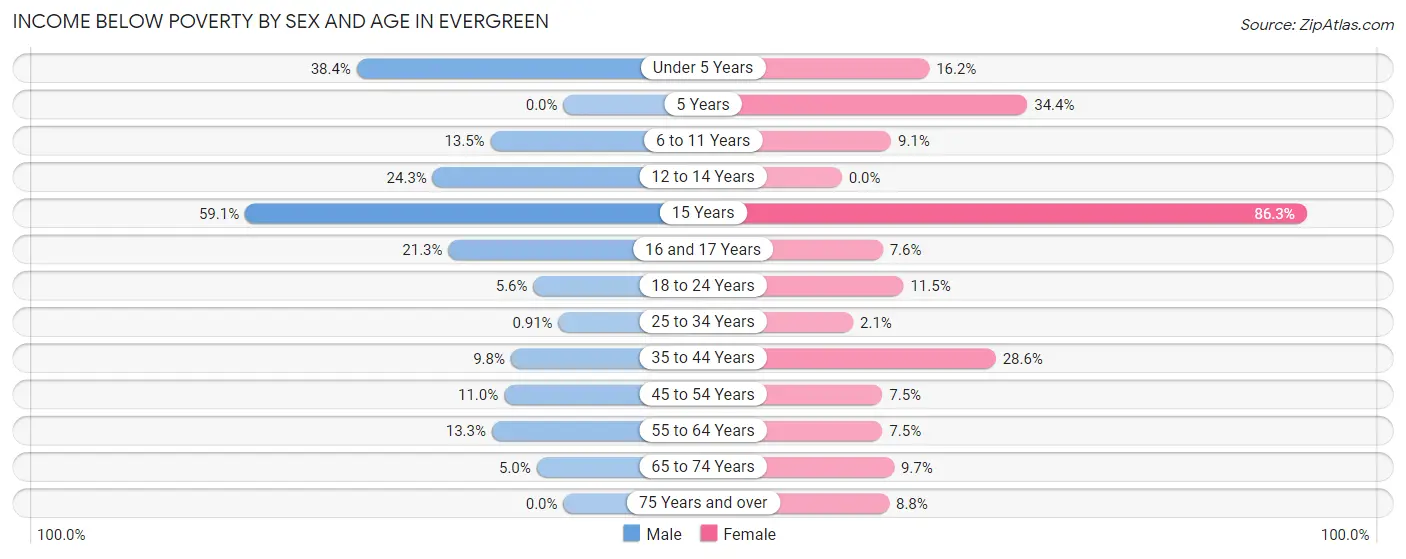
| Age Bracket | Male | Female |
| Under 5 Years | 122 (38.4%) | 30 (16.2%) |
| 5 Years | 0 (0.0%) | 21 (34.4%) |
| 6 to 11 Years | 23 (13.5%) | 33 (9.1%) |
| 12 to 14 Years | 49 (24.3%) | 0 (0.0%) |
| 15 Years | 13 (59.1%) | 44 (86.3%) |
| 16 and 17 Years | 35 (21.3%) | 11 (7.6%) |
| 18 to 24 Years | 27 (5.6%) | 56 (11.5%) |
| 25 to 34 Years | 4 (0.9%) | 10 (2.1%) |
| 35 to 44 Years | 65 (9.8%) | 148 (28.6%) |
| 45 to 54 Years | 56 (11.0%) | 43 (7.5%) |
| 55 to 64 Years | 82 (13.3%) | 55 (7.5%) |
| 65 to 74 Years | 20 (5.0%) | 31 (9.7%) |
| 75 Years and over | 0 (0.0%) | 20 (8.8%) |
| Total | 496 (11.8%) | 502 (11.7%) |
Income Above Poverty by Sex and Age in Evergreen
According to the poverty statistics in Evergreen, males aged 5 years and females aged 12 to 14 years are the age groups that are most secure financially, with 100.0% of males and 100.0% of females in these age groups living above the poverty line.
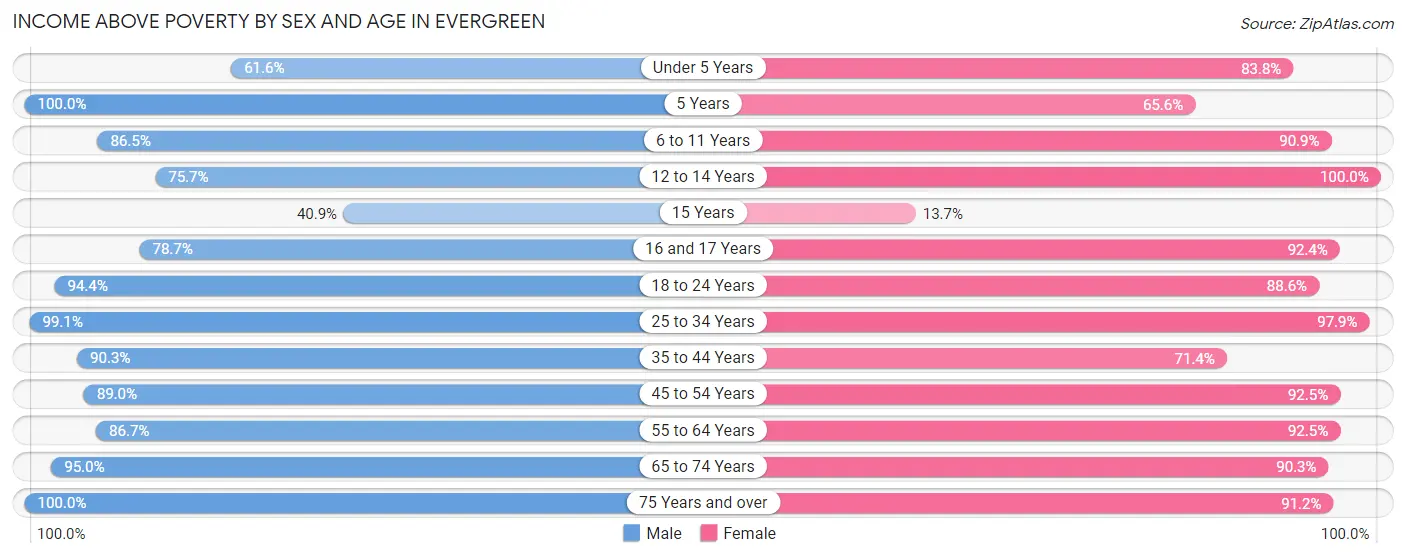
| Age Bracket | Male | Female |
| Under 5 Years | 196 (61.6%) | 155 (83.8%) |
| 5 Years | 17 (100.0%) | 40 (65.6%) |
| 6 to 11 Years | 147 (86.5%) | 328 (90.9%) |
| 12 to 14 Years | 153 (75.7%) | 164 (100.0%) |
| 15 Years | 9 (40.9%) | 7 (13.7%) |
| 16 and 17 Years | 129 (78.7%) | 134 (92.4%) |
| 18 to 24 Years | 458 (94.4%) | 433 (88.5%) |
| 25 to 34 Years | 437 (99.1%) | 466 (97.9%) |
| 35 to 44 Years | 602 (90.2%) | 370 (71.4%) |
| 45 to 54 Years | 453 (89.0%) | 528 (92.5%) |
| 55 to 64 Years | 535 (86.7%) | 674 (92.5%) |
| 65 to 74 Years | 383 (95.0%) | 289 (90.3%) |
| 75 Years and over | 171 (100.0%) | 208 (91.2%) |
| Total | 3,690 (88.1%) | 3,796 (88.3%) |
Income Below Poverty Among Married-Couple Families in Evergreen
The poverty statistics for married-couple families in Evergreen show that 5.4% or 102 of the total 1,873 families live below the poverty line. Families with 5 or more children have the highest poverty rate of 100.0%, comprising of 11 families. On the other hand, families with no children have the lowest poverty rate of 0.0%, which includes 0 families.
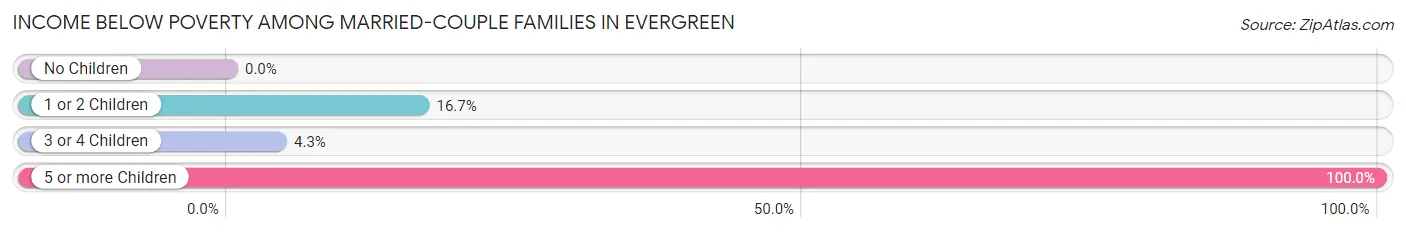
| Children | Above Poverty | Below Poverty |
| No Children | 1,194 (100.0%) | 0 (0.0%) |
| 1 or 2 Children | 420 (83.3%) | 84 (16.7%) |
| 3 or 4 Children | 157 (95.7%) | 7 (4.3%) |
| 5 or more Children | 0 (0.0%) | 11 (100.0%) |
| Total | 1,771 (94.6%) | 102 (5.4%) |
Income Below Poverty Among Single-Parent Households in Evergreen
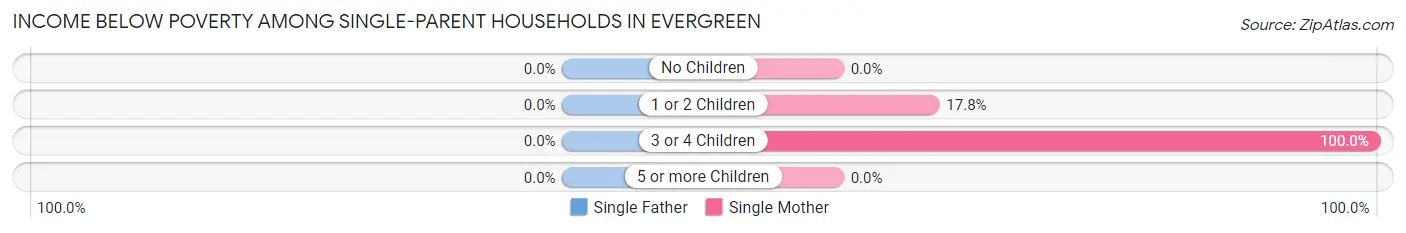
| Children | Single Father | Single Mother |
| No Children | 0 (0.0%) | 0 (0.0%) |
| 1 or 2 Children | 0 (0.0%) | 28 (17.8%) |
| 3 or 4 Children | 0 (0.0%) | 20 (100.0%) |
| 5 or more Children | 0 (0.0%) | 0 (0.0%) |
| Total | 0 (0.0%) | 48 (15.9%) |
Income Below Poverty Among Married-Couple vs Single-Parent Households in Evergreen
The poverty data for Evergreen shows that 102 of the married-couple family households (5.4%) and 48 of the single-parent households (12.6%) are living below the poverty level. Within the married-couple family households, those with 5 or more children have the highest poverty rate, with 11 households (100.0%) falling below the poverty line. Among the single-parent households, those with 3 or 4 children have the highest poverty rate, with 20 household (100.0%) living below poverty.
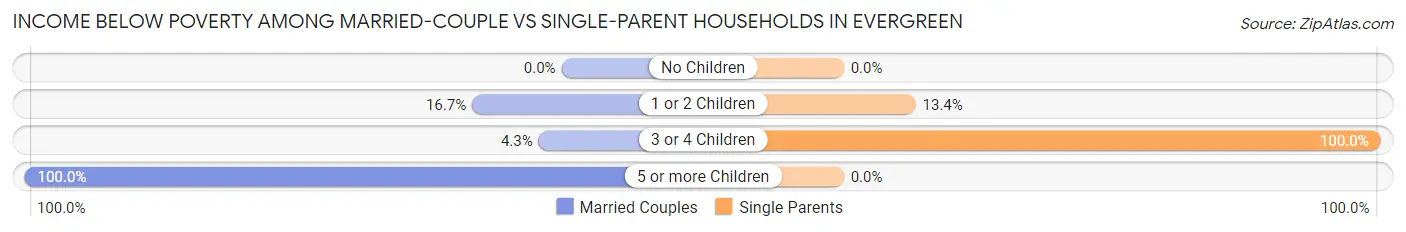
| Children | Married-Couple Families | Single-Parent Households |
| No Children | 0 (0.0%) | 0 (0.0%) |
| 1 or 2 Children | 84 (16.7%) | 28 (13.4%) |
| 3 or 4 Children | 7 (4.3%) | 20 (100.0%) |
| 5 or more Children | 11 (100.0%) | 0 (0.0%) |
| Total | 102 (5.4%) | 48 (12.6%) |
Race in Evergreen
The most populous races in Evergreen are White / Caucasian (7,814 | 91.8%), Two or more Races (619 | 7.3%), and Hispanic or Latino (217 | 2.5%).
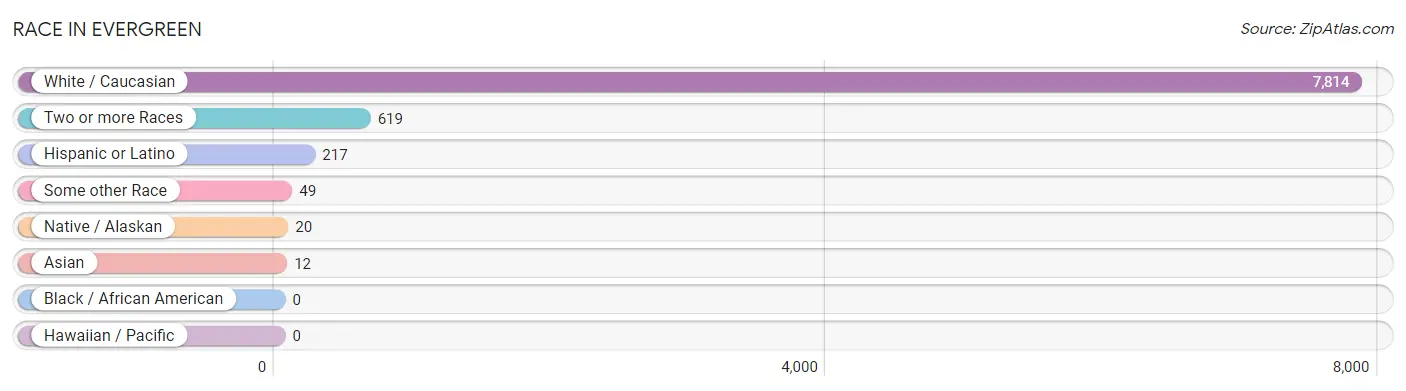
| Race | # Population | % Population |
| Asian | 12 | 0.1% |
| Black / African American | 0 | 0.0% |
| Hawaiian / Pacific | 0 | 0.0% |
| Hispanic or Latino | 217 | 2.5% |
| Native / Alaskan | 20 | 0.2% |
| White / Caucasian | 7,814 | 91.8% |
| Two or more Races | 619 | 7.3% |
| Some other Race | 49 | 0.6% |
| Total | 8,514 | 100.0% |
Ancestry in Evergreen
The most populous ancestries reported in Evergreen are German (1,832 | 21.5%), Irish (1,227 | 14.4%), English (1,058 | 12.4%), Norwegian (771 | 9.1%), and Swedish (400 | 4.7%), together accounting for 62.1% of all Evergreen residents.
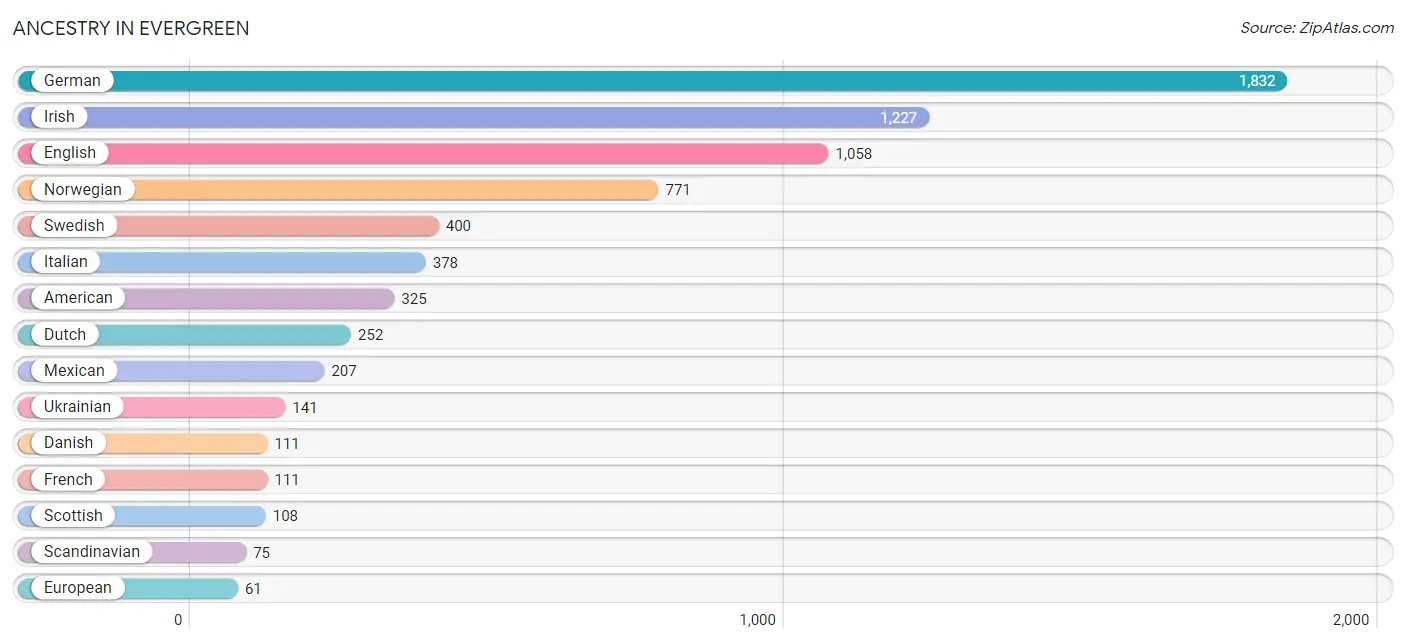
| Ancestry | # Population | % Population |
| American | 325 | 3.8% |
| Arab | 26 | 0.3% |
| Basque | 12 | 0.1% |
| Belgian | 7 | 0.1% |
| Blackfeet | 49 | 0.6% |
| British | 4 | 0.1% |
| Cherokee | 17 | 0.2% |
| Chippewa | 5 | 0.1% |
| Comanche | 3 | 0.0% |
| Cuban | 5 | 0.1% |
| Czech | 17 | 0.2% |
| Czechoslovakian | 5 | 0.1% |
| Danish | 111 | 1.3% |
| Dutch | 252 | 3.0% |
| Dutch West Indian | 44 | 0.5% |
| Eastern European | 6 | 0.1% |
| Egyptian | 22 | 0.3% |
| English | 1,058 | 12.4% |
| European | 61 | 0.7% |
| Finnish | 48 | 0.6% |
| French | 111 | 1.3% |
| German | 1,832 | 21.5% |
| Greek | 3 | 0.0% |
| Hungarian | 40 | 0.5% |
| Indian (Asian) | 19 | 0.2% |
| Inupiat | 1 | 0.0% |
| Irish | 1,227 | 14.4% |
| Italian | 378 | 4.4% |
| Korean | 61 | 0.7% |
| Lebanese | 4 | 0.1% |
| Mexican | 207 | 2.4% |
| Mexican American Indian | 37 | 0.4% |
| Northern European | 25 | 0.3% |
| Norwegian | 771 | 9.1% |
| Polish | 30 | 0.4% |
| Romanian | 45 | 0.5% |
| Russian | 25 | 0.3% |
| Scandinavian | 75 | 0.9% |
| Scotch-Irish | 17 | 0.2% |
| Scottish | 108 | 1.3% |
| Serbian | 24 | 0.3% |
| Shoshone | 20 | 0.2% |
| Spanish | 5 | 0.1% |
| Swedish | 400 | 4.7% |
| Ukrainian | 141 | 1.7% |
| Welsh | 39 | 0.5% | View All 46 Rows |
Immigrants in Evergreen
The most numerous immigrant groups reported in Evergreen came from Asia (53 | 0.6%), Eastern Europe (42 | 0.5%), Europe (42 | 0.5%), Ukraine (42 | 0.5%), and Kazakhstan (41 | 0.5%), together accounting for 2.6% of all Evergreen residents.
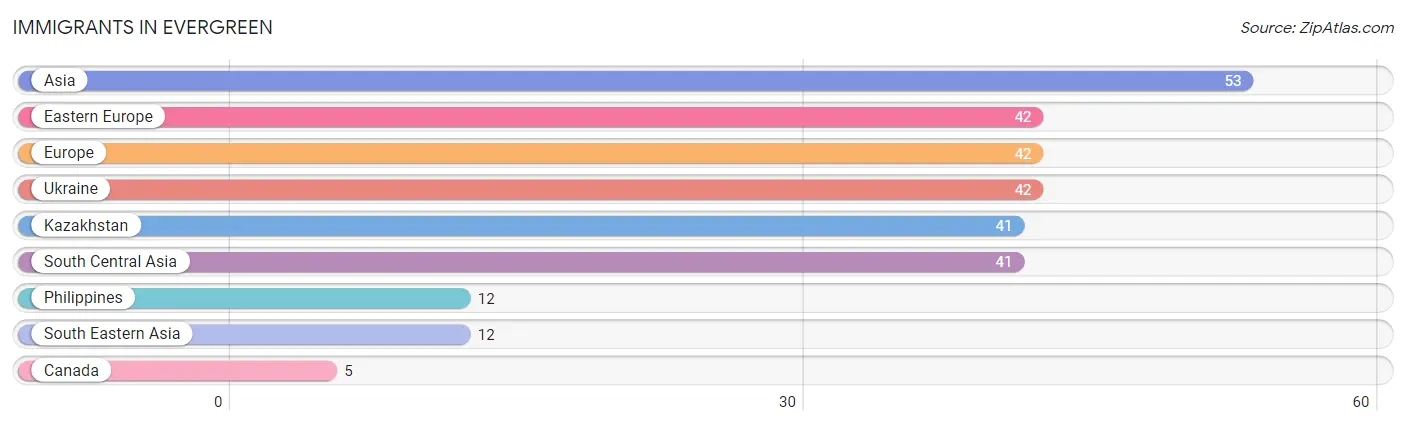
| Immigration Origin | # Population | % Population |
| Asia | 53 | 0.6% |
| Canada | 5 | 0.1% |
| Eastern Europe | 42 | 0.5% |
| Europe | 42 | 0.5% |
| Kazakhstan | 41 | 0.5% |
| Philippines | 12 | 0.1% |
| South Central Asia | 41 | 0.5% |
| South Eastern Asia | 12 | 0.1% |
| Ukraine | 42 | 0.5% | View All 9 Rows |
Sex and Age in Evergreen
Sex and Age in Evergreen
The most populous age groups in Evergreen are 20 to 24 Years (445 | 10.6%) for men and 10 to 14 Years (467 | 10.8%) for women.
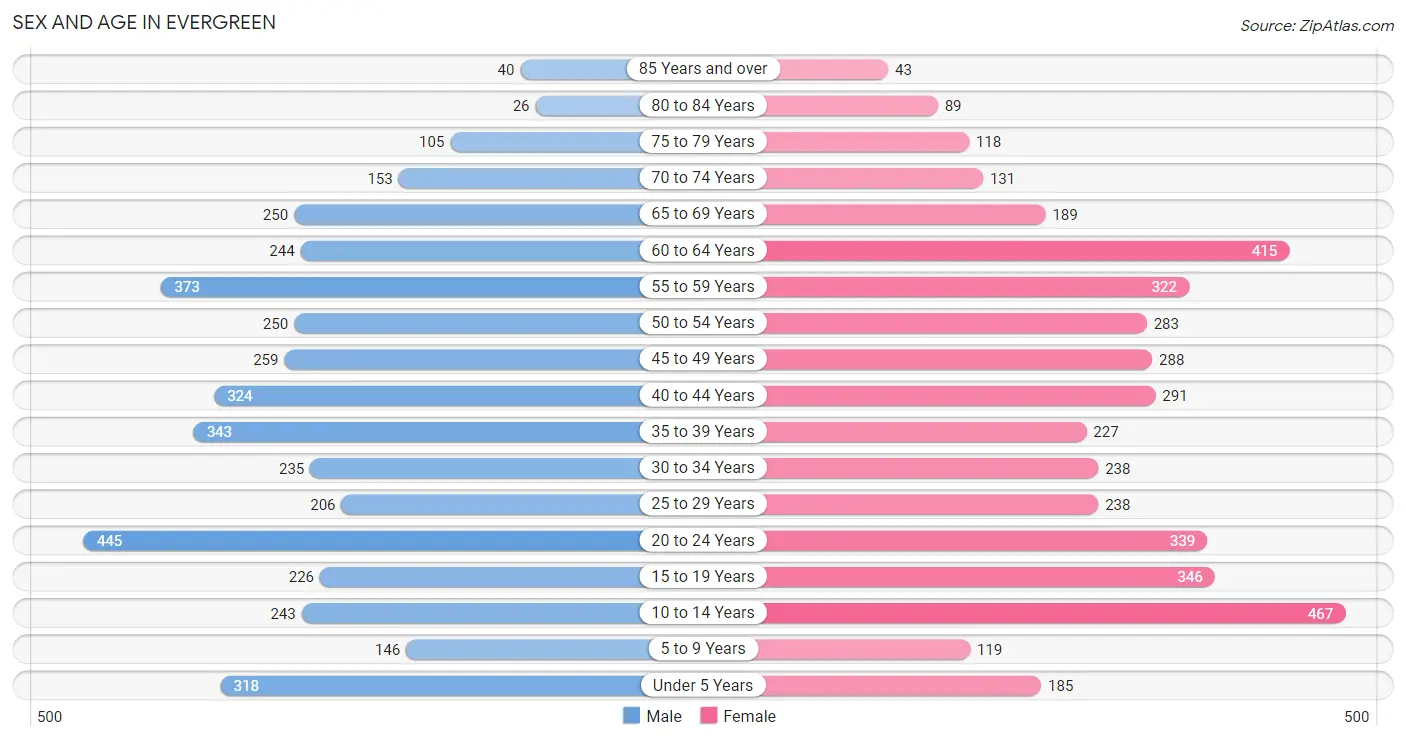
| Age Bracket | Male | Female |
| Under 5 Years | 318 (7.6%) | 185 (4.3%) |
| 5 to 9 Years | 146 (3.5%) | 119 (2.8%) |
| 10 to 14 Years | 243 (5.8%) | 467 (10.8%) |
| 15 to 19 Years | 226 (5.4%) | 346 (8.0%) |
| 20 to 24 Years | 445 (10.6%) | 339 (7.8%) |
| 25 to 29 Years | 206 (4.9%) | 238 (5.5%) |
| 30 to 34 Years | 235 (5.6%) | 238 (5.5%) |
| 35 to 39 Years | 343 (8.2%) | 227 (5.2%) |
| 40 to 44 Years | 324 (7.7%) | 291 (6.7%) |
| 45 to 49 Years | 259 (6.2%) | 288 (6.7%) |
| 50 to 54 Years | 250 (6.0%) | 283 (6.5%) |
| 55 to 59 Years | 373 (8.9%) | 322 (7.4%) |
| 60 to 64 Years | 244 (5.8%) | 415 (9.6%) |
| 65 to 69 Years | 250 (6.0%) | 189 (4.4%) |
| 70 to 74 Years | 153 (3.7%) | 131 (3.0%) |
| 75 to 79 Years | 105 (2.5%) | 118 (2.7%) |
| 80 to 84 Years | 26 (0.6%) | 89 (2.1%) |
| 85 Years and over | 40 (1.0%) | 43 (1.0%) |
| Total | 4,186 (100.0%) | 4,328 (100.0%) |
Families and Households in Evergreen
Median Family Size in Evergreen
The median family size in Evergreen is 3.13 persons per family, with married-couple families (1,873 | 83.1%) accounting for the largest median family size of 3.17 persons per family. On the other hand, single female/mother families (302 | 13.4%) represent the smallest median family size with 2.84 persons per family.
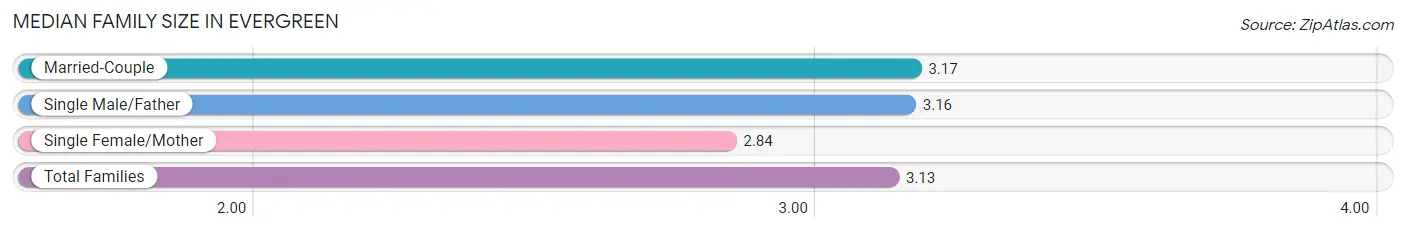
| Family Type | # Families | Family Size |
| Married-Couple | 1,873 (83.1%) | 3.17 |
| Single Male/Father | 79 (3.5%) | 3.16 |
| Single Female/Mother | 302 (13.4%) | 2.84 |
| Total Families | 2,254 (100.0%) | 3.13 |
Median Household Size in Evergreen
The median household size in Evergreen is 2.76 persons per household, with single male/father households (79 | 2.6%) accounting for the largest median household size of 3.72 persons per household. non-family households (814 | 26.5%) represent the smallest median household size with 1.52 persons per household.
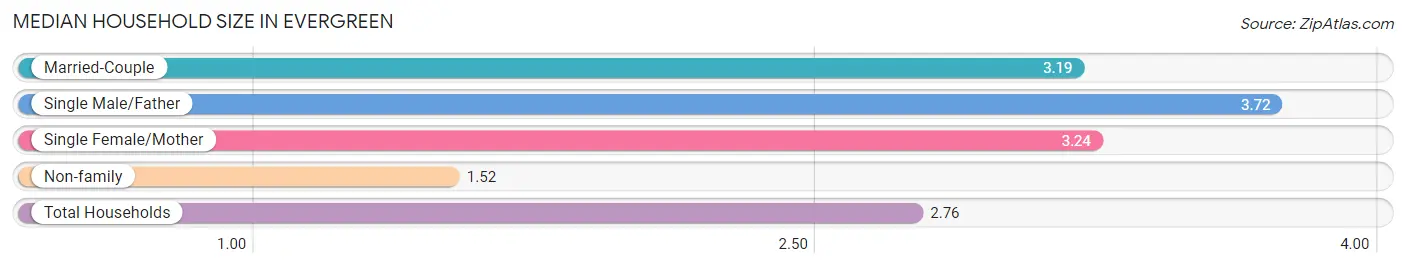
| Household Type | # Households | Household Size |
| Married-Couple | 1,873 (61.1%) | 3.19 |
| Single Male/Father | 79 (2.6%) | 3.72 |
| Single Female/Mother | 302 (9.8%) | 3.24 |
| Non-family | 814 (26.5%) | 1.52 |
| Total Households | 3,068 (100.0%) | 2.76 |
Household Size by Marriage Status in Evergreen
Out of a total of 3,068 households in Evergreen, 2,254 (73.5%) are family households, while 814 (26.5%) are nonfamily households. The most numerous type of family households are 2-person households, comprising 1,152, and the most common type of nonfamily households are 1-person households, comprising 522.
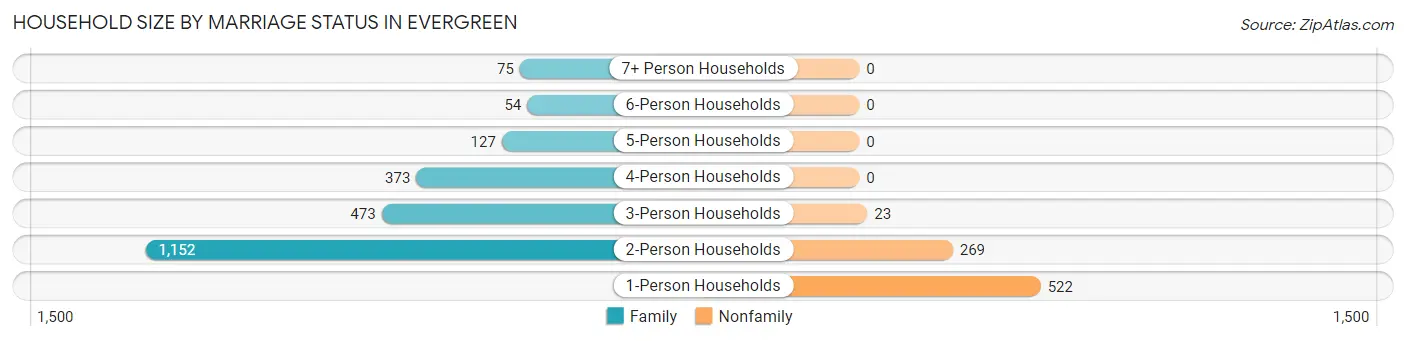
| Household Size | Family Households | Nonfamily Households |
| 1-Person Households | - | 522 (17.0%) |
| 2-Person Households | 1,152 (37.6%) | 269 (8.8%) |
| 3-Person Households | 473 (15.4%) | 23 (0.7%) |
| 4-Person Households | 373 (12.2%) | 0 (0.0%) |
| 5-Person Households | 127 (4.1%) | 0 (0.0%) |
| 6-Person Households | 54 (1.8%) | 0 (0.0%) |
| 7+ Person Households | 75 (2.4%) | 0 (0.0%) |
| Total | 2,254 (73.5%) | 814 (26.5%) |
Female Fertility in Evergreen
Fertility by Age in Evergreen
Average fertility rate in Evergreen is 50.0 births per 1,000 women. Women in the age bracket of 20 to 34 years have the highest fertility rate with 120.0 births per 1,000 women. Women in the age bracket of 20 to 34 years acount for 100.0% of all women with births.
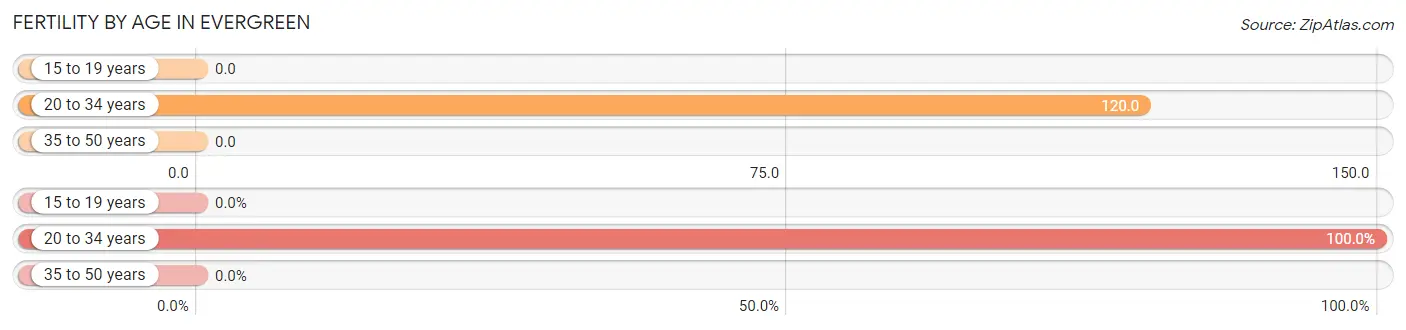
| Age Bracket | Women with Births | Births / 1,000 Women |
| 15 to 19 years | 0 (0.0%) | 0.0 |
| 20 to 34 years | 98 (100.0%) | 120.0 |
| 35 to 50 years | 0 (0.0%) | 0.0 |
| Total | 98 (100.0%) | 50.0 |
Fertility by Age by Marriage Status in Evergreen
34.7% of women with births (98) in Evergreen are married. The highest percentage of unmarried women with births falls into 20 to 34 years age bracket with 65.3% of them unmarried at the time of birth, while the lowest percentage of unmarried women with births belong to 20 to 34 years age bracket with 65.3% of them unmarried.
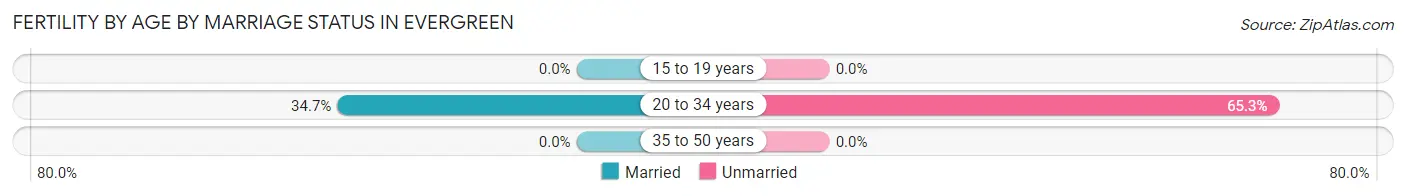
| Age Bracket | Married | Unmarried |
| 15 to 19 years | 0 (0.0%) | 0 (0.0%) |
| 20 to 34 years | 34 (34.7%) | 64 (65.3%) |
| 35 to 50 years | 0 (0.0%) | 0 (0.0%) |
| Total | 34 (34.7%) | 64 (65.3%) |
Fertility by Education in Evergreen
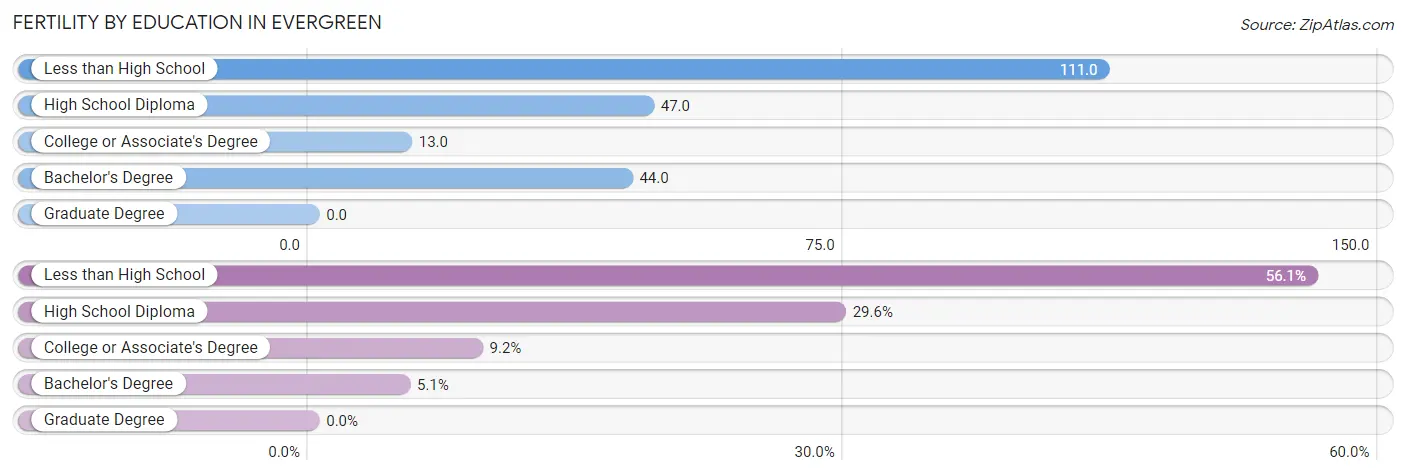
| Educational Attainment | Women with Births | Births / 1,000 Women |
| Less than High School | 55 (56.1%) | 111.0 |
| High School Diploma | 29 (29.6%) | 47.0 |
| College or Associate's Degree | 9 (9.2%) | 13.0 |
| Bachelor's Degree | 5 (5.1%) | 44.0 |
| Graduate Degree | 0 (0.0%) | 0.0 |
| Total | 98 (100.0%) | 50.0 |
Fertility by Education by Marriage Status in Evergreen
65.3% of women with births in Evergreen are unmarried. Women with the educational attainment of college or associate's degree are most likely to be married with 100.0% of them married at childbirth, while women with the educational attainment of less than high school are least likely to be married with 100.0% of them unmarried at childbirth.
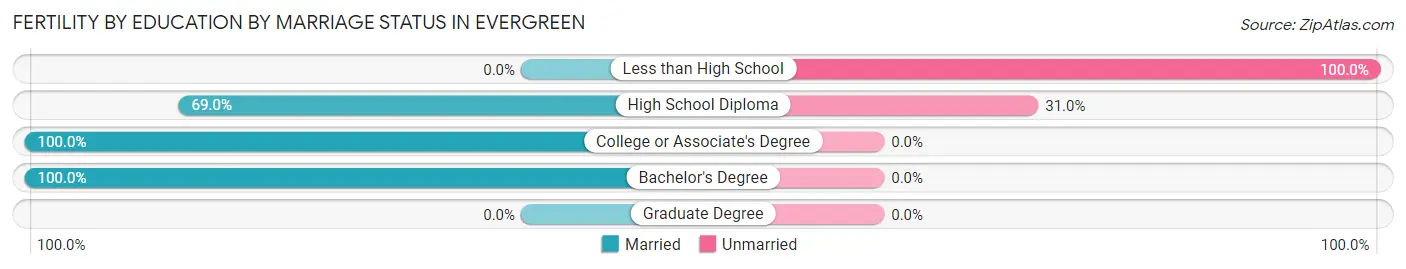
| Educational Attainment | Married | Unmarried |
| Less than High School | 0 (0.0%) | 55 (100.0%) |
| High School Diploma | 20 (69.0%) | 9 (31.0%) |
| College or Associate's Degree | 9 (100.0%) | 0 (0.0%) |
| Bachelor's Degree | 5 (100.0%) | 0 (0.0%) |
| Graduate Degree | 0 (0.0%) | 0 (0.0%) |
| Total | 34 (34.7%) | 64 (65.3%) |
Employment Characteristics in Evergreen
Employment by Class of Employer in Evergreen
Among the 4,545 employed individuals in Evergreen, private company employees (3,080 | 67.8%), self-employed (not incorporated) (544 | 12.0%), and self-employed (incorporated) (292 | 6.4%) make up the most common classes of employment.
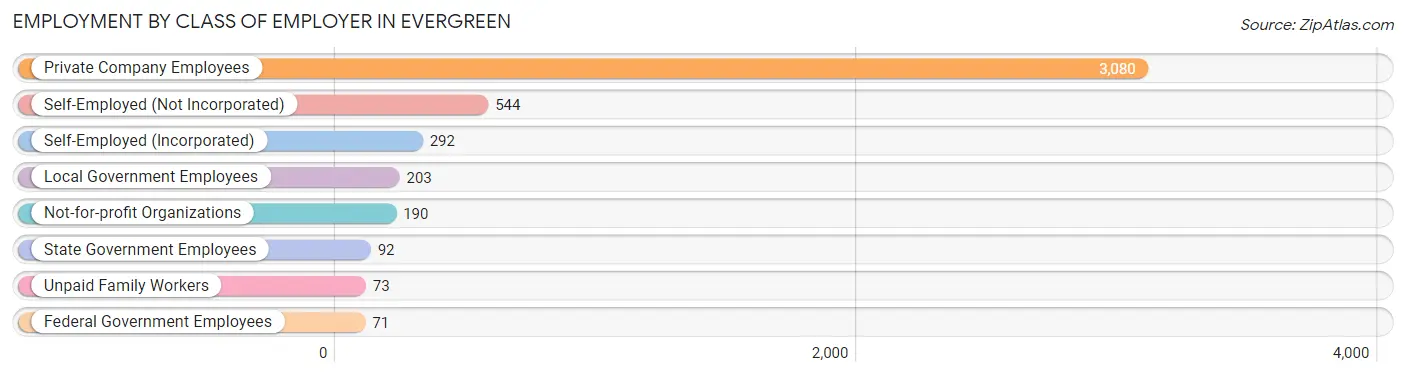
| Employer Class | # Employees | % Employees |
| Private Company Employees | 3,080 | 67.8% |
| Self-Employed (Incorporated) | 292 | 6.4% |
| Self-Employed (Not Incorporated) | 544 | 12.0% |
| Not-for-profit Organizations | 190 | 4.2% |
| Local Government Employees | 203 | 4.5% |
| State Government Employees | 92 | 2.0% |
| Federal Government Employees | 71 | 1.6% |
| Unpaid Family Workers | 73 | 1.6% |
| Total | 4,545 | 100.0% |
Employment Status by Age in Evergreen
According to the labor force statistics for Evergreen, out of the total population over 16 years of age (6,963), 69.9% or 4,867 individuals are in the labor force, with 4.3% or 209 of them unemployed. The age group with the highest labor force participation rate is 35 to 44 years, with 91.3% or 1,082 individuals in the labor force. Within the labor force, the 25 to 29 years age range has the highest percentage of unemployed individuals, with 17.8% or 56 of them being unemployed.
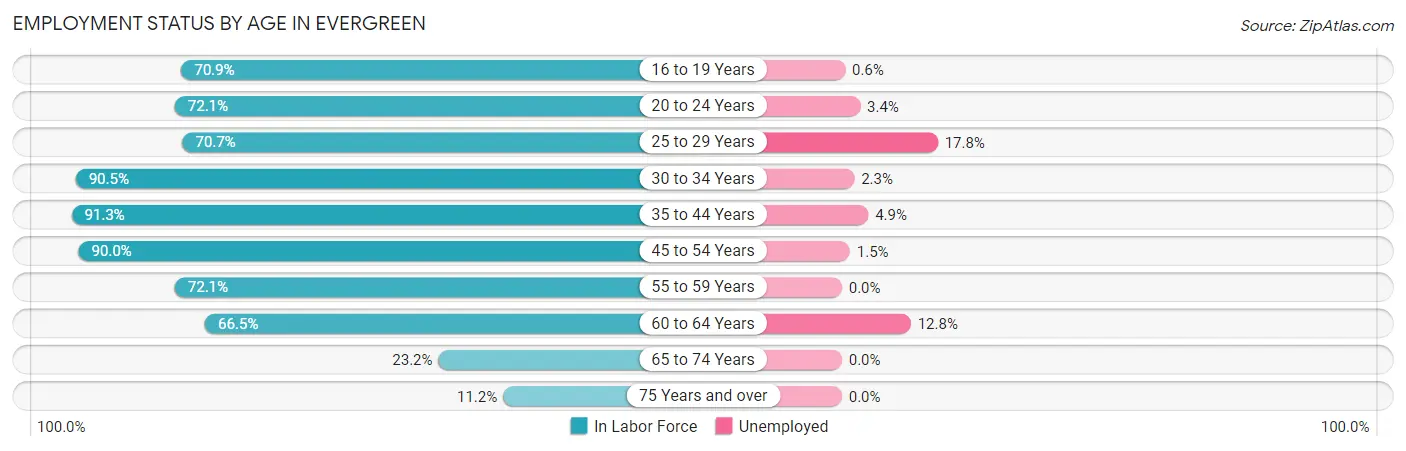
| Age Bracket | In Labor Force | Unemployed |
| 16 to 19 Years | 354 (70.9%) | 2 (0.6%) |
| 20 to 24 Years | 565 (72.1%) | 19 (3.4%) |
| 25 to 29 Years | 314 (70.7%) | 56 (17.8%) |
| 30 to 34 Years | 428 (90.5%) | 10 (2.3%) |
| 35 to 44 Years | 1,082 (91.3%) | 53 (4.9%) |
| 45 to 54 Years | 972 (90.0%) | 15 (1.5%) |
| 55 to 59 Years | 501 (72.1%) | 0 (0.0%) |
| 60 to 64 Years | 438 (66.5%) | 56 (12.8%) |
| 65 to 74 Years | 168 (23.2%) | 0 (0.0%) |
| 75 Years and over | 47 (11.2%) | 0 (0.0%) |
| Total | 4,867 (69.9%) | 209 (4.3%) |
Employment Status by Educational Attainment in Evergreen
According to labor force statistics for Evergreen, 82.3% of individuals (3,733) out of the total population between 25 and 64 years of age (4,536) are in the labor force, with 5.1% or 190 of them being unemployed. The group with the highest labor force participation rate are those with the educational attainment of bachelor's degree or higher, with 88.2% or 711 individuals in the labor force. Within the labor force, individuals with bachelor's degree or higher education have the highest percentage of unemployment, with 15.2% or 108 of them being unemployed.
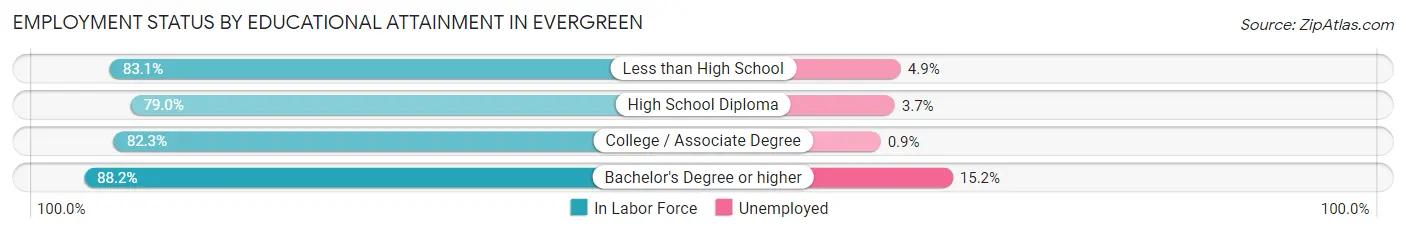
| Educational Attainment | In Labor Force | Unemployed |
| Less than High School | 535 (83.1%) | 32 (4.9%) |
| High School Diploma | 1,205 (79.0%) | 56 (3.7%) |
| College / Associate Degree | 1,285 (82.3%) | 14 (0.9%) |
| Bachelor's Degree or higher | 711 (88.2%) | 123 (15.2%) |
| Total | 3,733 (82.3%) | 231 (5.1%) |
Employment Occupations by Sex in Evergreen
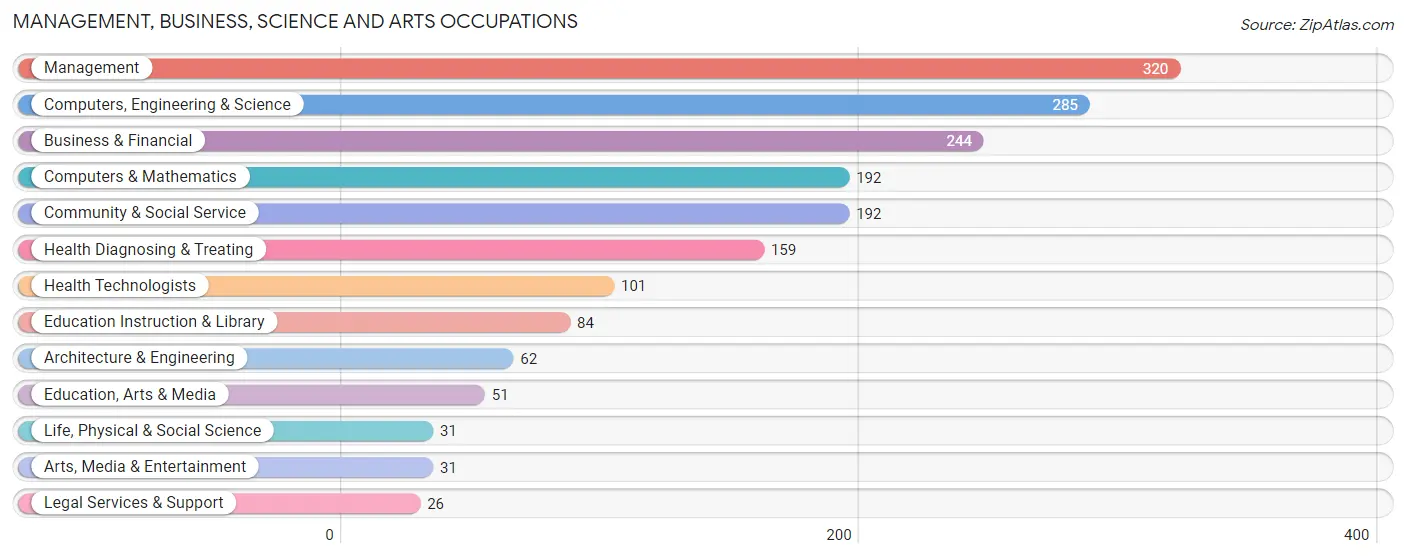
Management, Business, Science and Arts Occupations
The most common Management, Business, Science and Arts occupations in Evergreen are Management (320 | 6.9%), Computers, Engineering & Science (285 | 6.2%), Business & Financial (244 | 5.3%), Computers & Mathematics (192 | 4.2%), and Community & Social Service (192 | 4.2%).
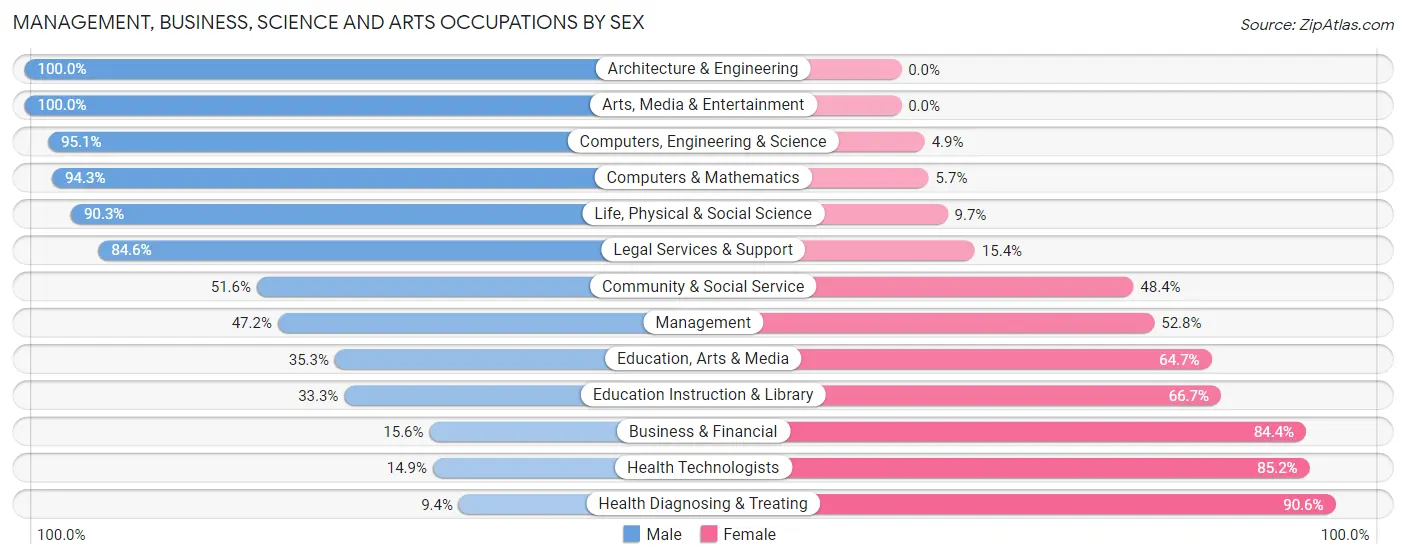
Management, Business, Science and Arts Occupations by Sex
Within the Management, Business, Science and Arts occupations in Evergreen, the most male-oriented occupations are Architecture & Engineering (100.0%), Arts, Media & Entertainment (100.0%), and Computers, Engineering & Science (95.1%), while the most female-oriented occupations are Health Diagnosing & Treating (90.6%), Health Technologists (85.2%), and Business & Financial (84.4%).
| Occupation | Male | Female |
| Management | 151 (47.2%) | 169 (52.8%) |
| Business & Financial | 38 (15.6%) | 206 (84.4%) |
| Computers, Engineering & Science | 271 (95.1%) | 14 (4.9%) |
| Computers & Mathematics | 181 (94.3%) | 11 (5.7%) |
| Architecture & Engineering | 62 (100.0%) | 0 (0.0%) |
| Life, Physical & Social Science | 28 (90.3%) | 3 (9.7%) |
| Community & Social Service | 99 (51.6%) | 93 (48.4%) |
| Education, Arts & Media | 18 (35.3%) | 33 (64.7%) |
| Legal Services & Support | 22 (84.6%) | 4 (15.4%) |
| Education Instruction & Library | 28 (33.3%) | 56 (66.7%) |
| Arts, Media & Entertainment | 31 (100.0%) | 0 (0.0%) |
| Health Diagnosing & Treating | 15 (9.4%) | 144 (90.6%) |
| Health Technologists | 15 (14.8%) | 86 (85.2%) |
| Total (Category) | 574 (47.8%) | 626 (52.2%) |
| Total (Overall) | 2,443 (52.9%) | 2,178 (47.1%) |
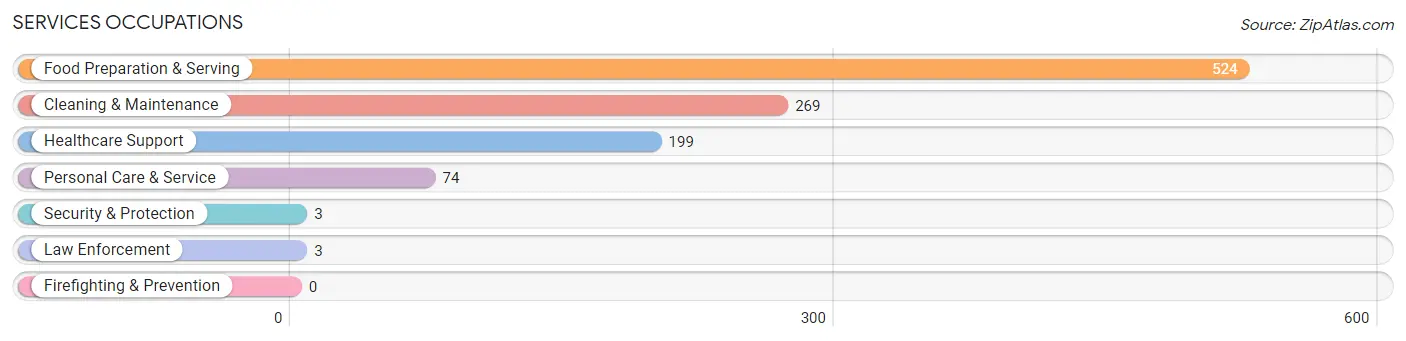
Services Occupations
The most common Services occupations in Evergreen are Food Preparation & Serving (524 | 11.3%), Cleaning & Maintenance (269 | 5.8%), Healthcare Support (199 | 4.3%), Personal Care & Service (74 | 1.6%), and Security & Protection (3 | 0.1%).
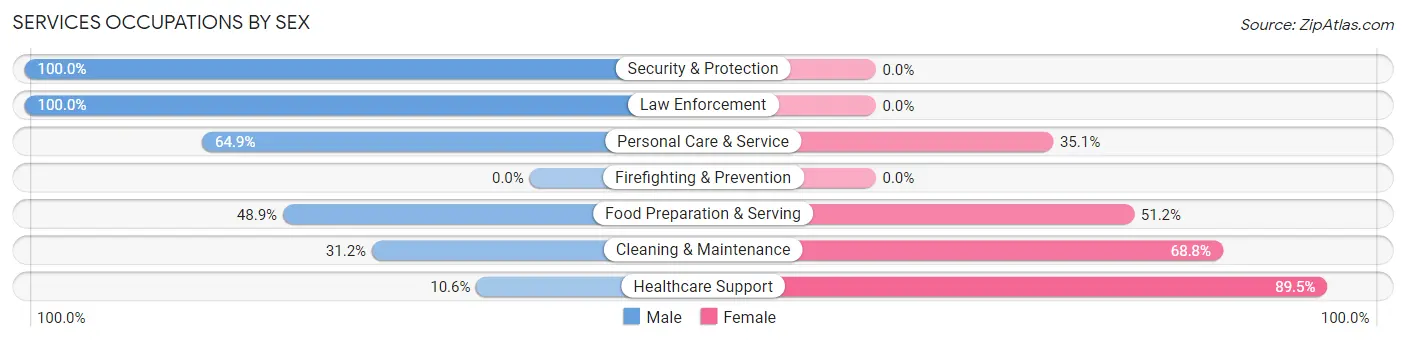
Services Occupations by Sex
Within the Services occupations in Evergreen, the most male-oriented occupations are Security & Protection (100.0%), Law Enforcement (100.0%), and Personal Care & Service (64.9%), while the most female-oriented occupations are Healthcare Support (89.4%), Cleaning & Maintenance (68.8%), and Food Preparation & Serving (51.1%).
| Occupation | Male | Female |
| Healthcare Support | 21 (10.5%) | 178 (89.4%) |
| Security & Protection | 3 (100.0%) | 0 (0.0%) |
| Firefighting & Prevention | 0 (0.0%) | 0 (0.0%) |
| Law Enforcement | 3 (100.0%) | 0 (0.0%) |
| Food Preparation & Serving | 256 (48.8%) | 268 (51.1%) |
| Cleaning & Maintenance | 84 (31.2%) | 185 (68.8%) |
| Personal Care & Service | 48 (64.9%) | 26 (35.1%) |
| Total (Category) | 412 (38.5%) | 657 (61.5%) |
| Total (Overall) | 2,443 (52.9%) | 2,178 (47.1%) |
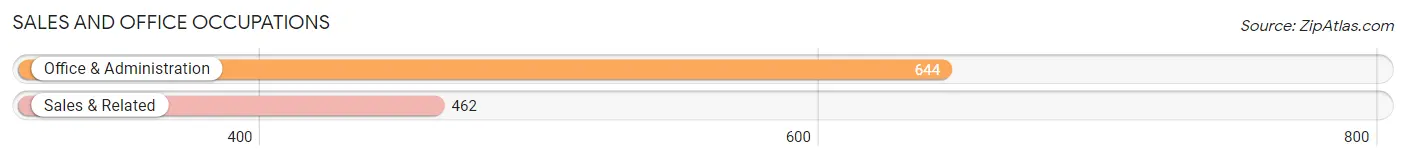
Sales and Office Occupations
The most common Sales and Office occupations in Evergreen are Office & Administration (644 | 13.9%), and Sales & Related (462 | 10.0%).
Sales and Office Occupations by Sex
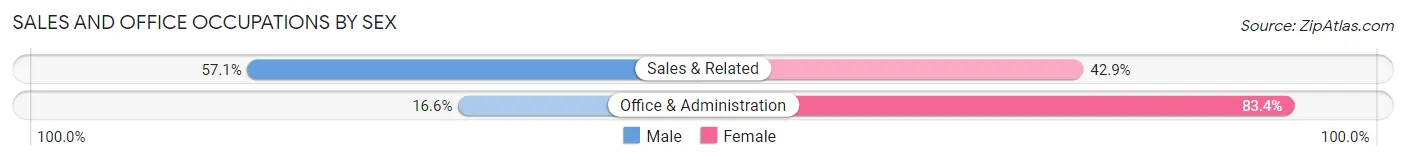
| Occupation | Male | Female |
| Sales & Related | 264 (57.1%) | 198 (42.9%) |
| Office & Administration | 107 (16.6%) | 537 (83.4%) |
| Total (Category) | 371 (33.5%) | 735 (66.5%) |
| Total (Overall) | 2,443 (52.9%) | 2,178 (47.1%) |
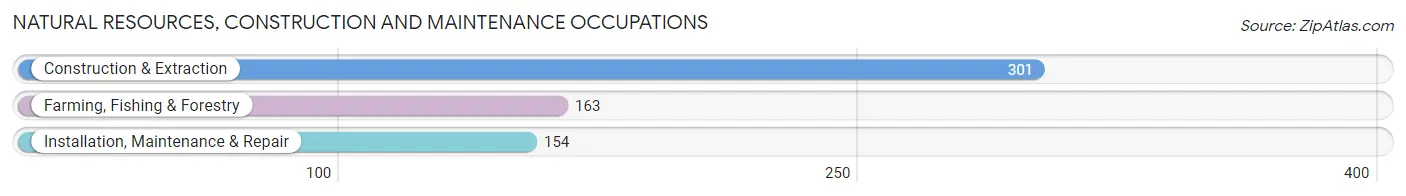
Natural Resources, Construction and Maintenance Occupations
The most common Natural Resources, Construction and Maintenance occupations in Evergreen are Construction & Extraction (301 | 6.5%), Farming, Fishing & Forestry (163 | 3.5%), and Installation, Maintenance & Repair (154 | 3.3%).
Natural Resources, Construction and Maintenance Occupations by Sex
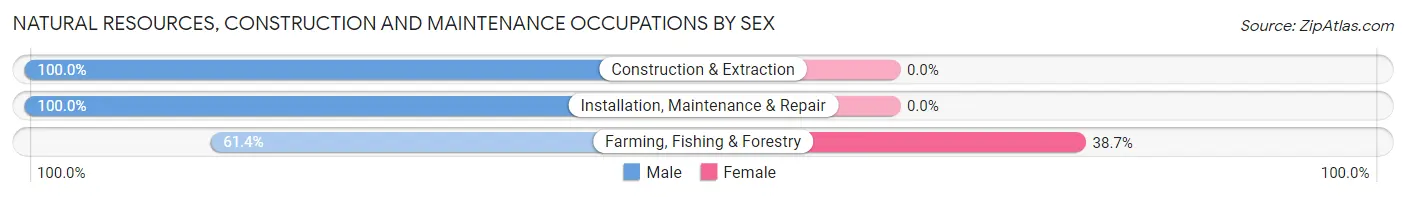
| Occupation | Male | Female |
| Farming, Fishing & Forestry | 100 (61.4%) | 63 (38.7%) |
| Construction & Extraction | 301 (100.0%) | 0 (0.0%) |
| Installation, Maintenance & Repair | 154 (100.0%) | 0 (0.0%) |
| Total (Category) | 555 (89.8%) | 63 (10.2%) |
| Total (Overall) | 2,443 (52.9%) | 2,178 (47.1%) |
Production, Transportation and Moving Occupations
The most common Production, Transportation and Moving occupations in Evergreen are Transportation (268 | 5.8%), Material Moving (240 | 5.2%), and Production (120 | 2.6%).
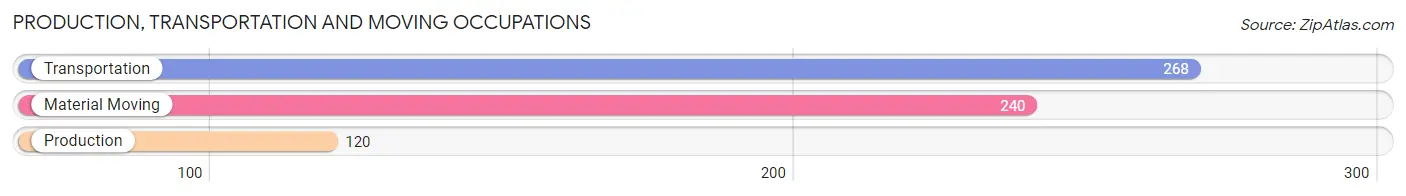
Production, Transportation and Moving Occupations by Sex
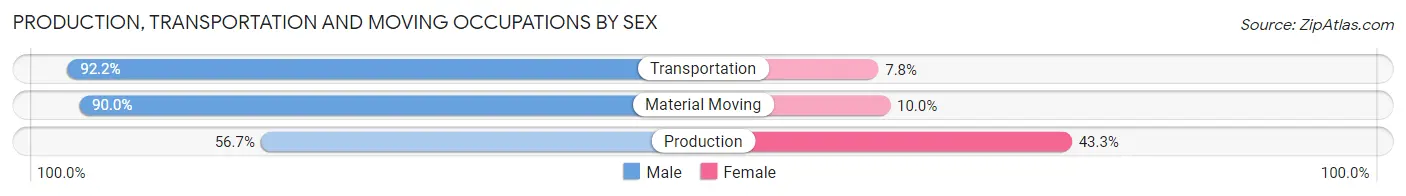
| Occupation | Male | Female |
| Production | 68 (56.7%) | 52 (43.3%) |
| Transportation | 247 (92.2%) | 21 (7.8%) |
| Material Moving | 216 (90.0%) | 24 (10.0%) |
| Total (Category) | 531 (84.6%) | 97 (15.4%) |
| Total (Overall) | 2,443 (52.9%) | 2,178 (47.1%) |
Employment Industries by Sex in Evergreen
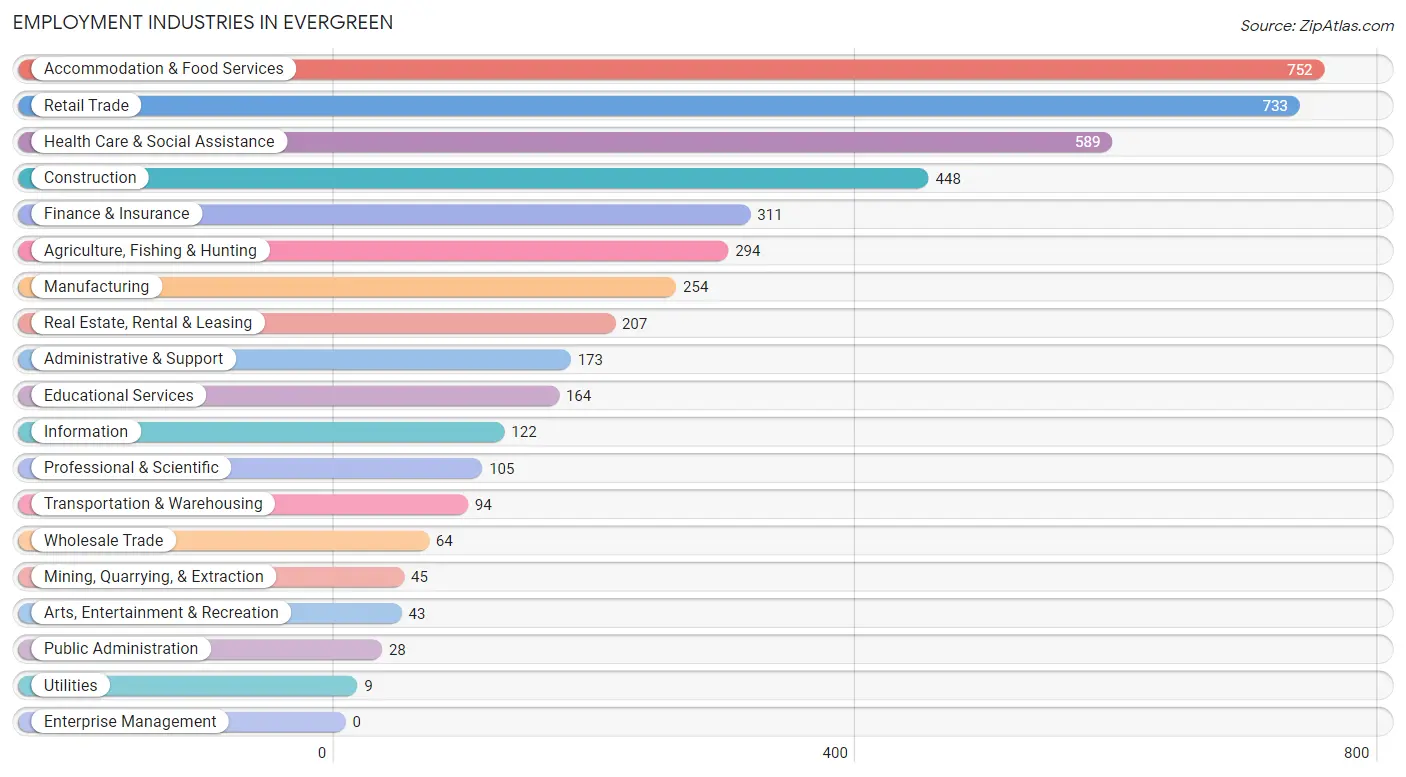
Employment Industries in Evergreen
The major employment industries in Evergreen include Accommodation & Food Services (752 | 16.3%), Retail Trade (733 | 15.9%), Health Care & Social Assistance (589 | 12.8%), Construction (448 | 9.7%), and Finance & Insurance (311 | 6.7%).
Employment Industries by Sex in Evergreen
The Evergreen industries that see more men than women are Mining, Quarrying, & Extraction (100.0%), Wholesale Trade (100.0%), and Transportation & Warehousing (100.0%), whereas the industries that tend to have a higher number of women are Health Care & Social Assistance (88.1%), Finance & Insurance (69.8%), and Utilities (66.7%).
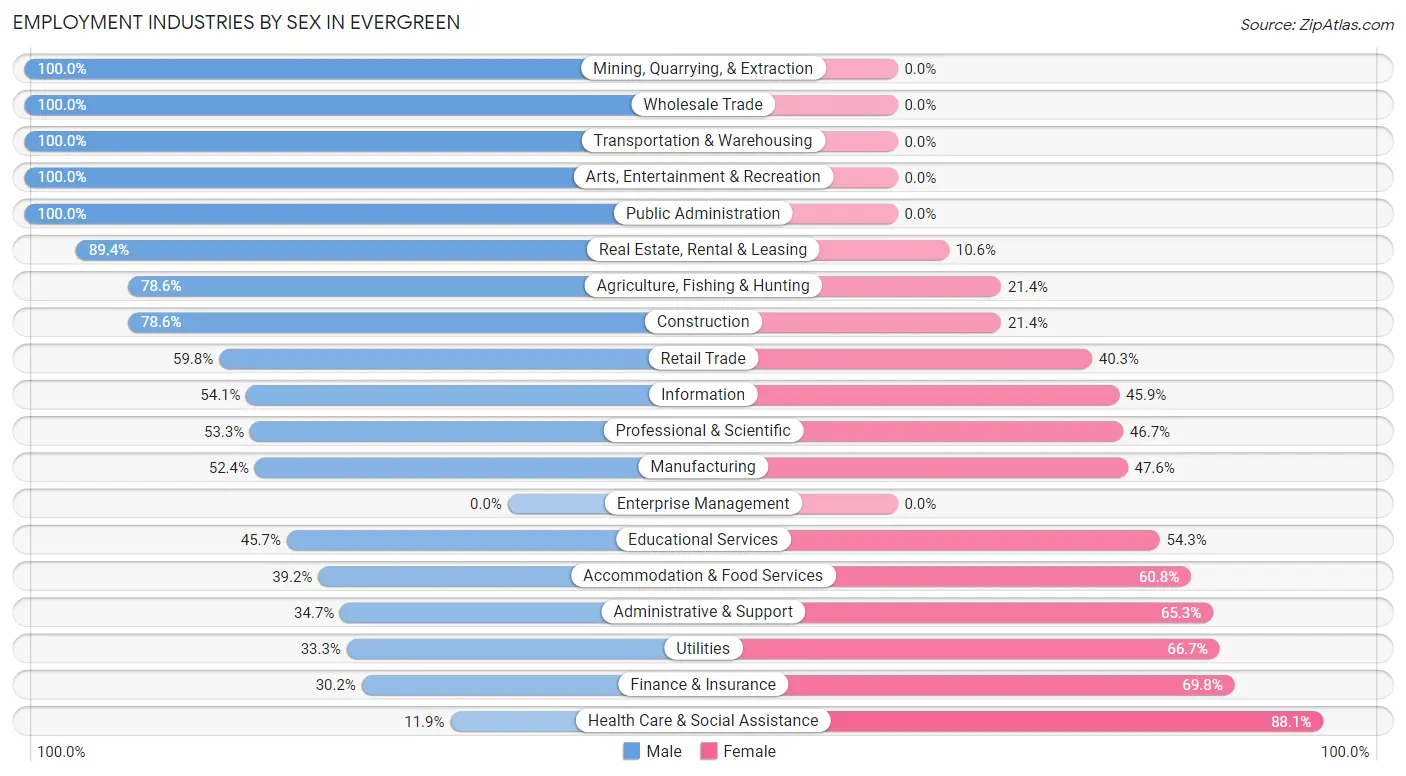
| Industry | Male | Female |
| Agriculture, Fishing & Hunting | 231 (78.6%) | 63 (21.4%) |
| Mining, Quarrying, & Extraction | 45 (100.0%) | 0 (0.0%) |
| Construction | 352 (78.6%) | 96 (21.4%) |
| Manufacturing | 133 (52.4%) | 121 (47.6%) |
| Wholesale Trade | 64 (100.0%) | 0 (0.0%) |
| Retail Trade | 438 (59.8%) | 295 (40.3%) |
| Transportation & Warehousing | 94 (100.0%) | 0 (0.0%) |
| Utilities | 3 (33.3%) | 6 (66.7%) |
| Information | 66 (54.1%) | 56 (45.9%) |
| Finance & Insurance | 94 (30.2%) | 217 (69.8%) |
| Real Estate, Rental & Leasing | 185 (89.4%) | 22 (10.6%) |
| Professional & Scientific | 56 (53.3%) | 49 (46.7%) |
| Enterprise Management | 0 (0.0%) | 0 (0.0%) |
| Administrative & Support | 60 (34.7%) | 113 (65.3%) |
| Educational Services | 75 (45.7%) | 89 (54.3%) |
| Health Care & Social Assistance | 70 (11.9%) | 519 (88.1%) |
| Arts, Entertainment & Recreation | 43 (100.0%) | 0 (0.0%) |
| Accommodation & Food Services | 295 (39.2%) | 457 (60.8%) |
| Public Administration | 28 (100.0%) | 0 (0.0%) |
| Total | 2,443 (52.9%) | 2,178 (47.1%) |
Education in Evergreen
School Enrollment in Evergreen
The most common levels of schooling among the 1,738 students in Evergreen are middle school (547 | 31.5%), high school (416 | 23.9%), and college / undergraduate (295 | 17.0%).
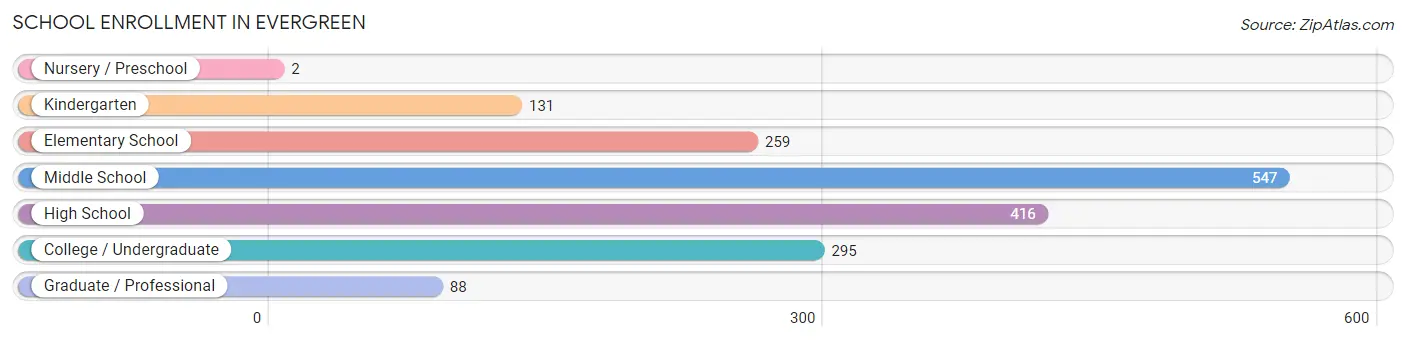
| School Level | # Students | % Students |
| Nursery / Preschool | 2 | 0.1% |
| Kindergarten | 131 | 7.5% |
| Elementary School | 259 | 14.9% |
| Middle School | 547 | 31.5% |
| High School | 416 | 23.9% |
| College / Undergraduate | 295 | 17.0% |
| Graduate / Professional | 88 | 5.1% |
| Total | 1,738 | 100.0% |
School Enrollment by Age by Funding Source in Evergreen
Out of a total of 1,738 students who are enrolled in schools in Evergreen, 287 (16.5%) attend a private institution, while the remaining 1,451 (83.5%) are enrolled in public schools. The age group of 18 to 19 year olds has the highest likelihood of being enrolled in private schools, with 47 (44.8% in the age bracket) enrolled. Conversely, the age group of 35 years and over has the lowest likelihood of being enrolled in a private school, with 69 (100.0% in the age bracket) attending a public institution.
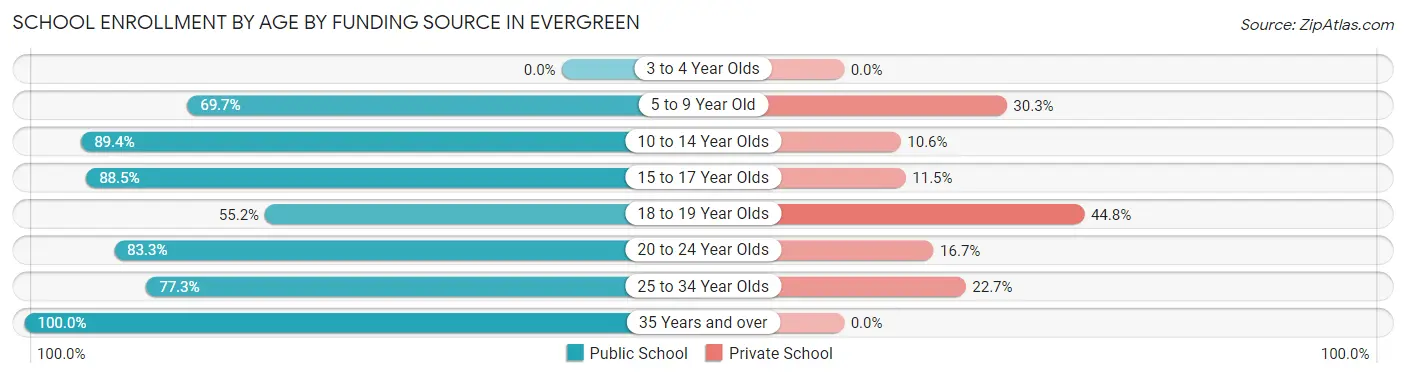
| Age Bracket | Public School | Private School |
| 3 to 4 Year Olds | 0 (0.0%) | 0 (0.0%) |
| 5 to 9 Year Old | 177 (69.7%) | 77 (30.3%) |
| 10 to 14 Year Olds | 627 (89.4%) | 74 (10.6%) |
| 15 to 17 Year Olds | 308 (88.5%) | 40 (11.5%) |
| 18 to 19 Year Olds | 58 (55.2%) | 47 (44.8%) |
| 20 to 24 Year Olds | 155 (83.3%) | 31 (16.7%) |
| 25 to 34 Year Olds | 58 (77.3%) | 17 (22.7%) |
| 35 Years and over | 69 (100.0%) | 0 (0.0%) |
| Total | 1,451 (83.5%) | 287 (16.5%) |
Educational Attainment by Field of Study in Evergreen
Business (281 | 20.7%), science & technology (205 | 15.1%), social sciences (168 | 12.4%), liberal arts & history (156 | 11.5%), and bio, nature & agricultural (130 | 9.6%) are the most common fields of study among 1,358 individuals in Evergreen who have obtained a bachelor's degree or higher.
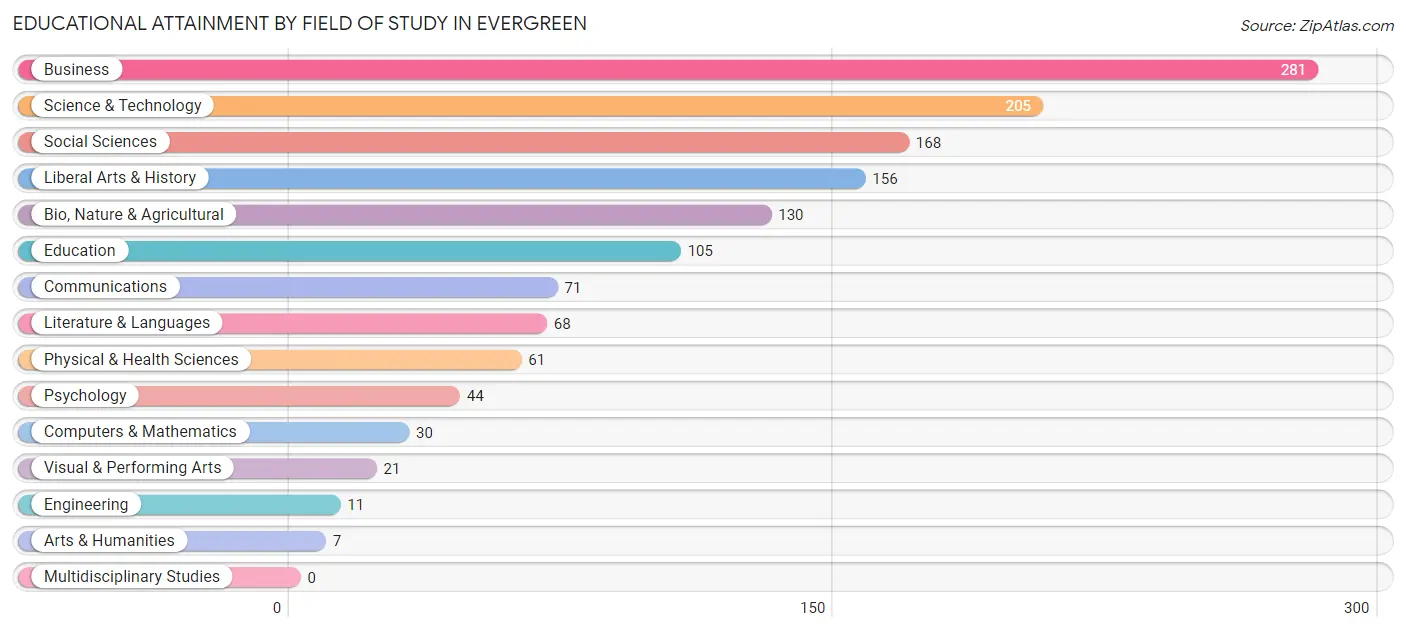
| Field of Study | # Graduates | % Graduates |
| Computers & Mathematics | 30 | 2.2% |
| Bio, Nature & Agricultural | 130 | 9.6% |
| Physical & Health Sciences | 61 | 4.5% |
| Psychology | 44 | 3.2% |
| Social Sciences | 168 | 12.4% |
| Engineering | 11 | 0.8% |
| Multidisciplinary Studies | 0 | 0.0% |
| Science & Technology | 205 | 15.1% |
| Business | 281 | 20.7% |
| Education | 105 | 7.7% |
| Literature & Languages | 68 | 5.0% |
| Liberal Arts & History | 156 | 11.5% |
| Visual & Performing Arts | 21 | 1.5% |
| Communications | 71 | 5.2% |
| Arts & Humanities | 7 | 0.5% |
| Total | 1,358 | 100.0% |
Transportation & Commute in Evergreen
Vehicle Availability by Sex in Evergreen
The most prevalent vehicle ownership categories in Evergreen are males with 2 vehicles (963, accounting for 40.2%) and females with 2 vehicles (794, making up 44.8%).
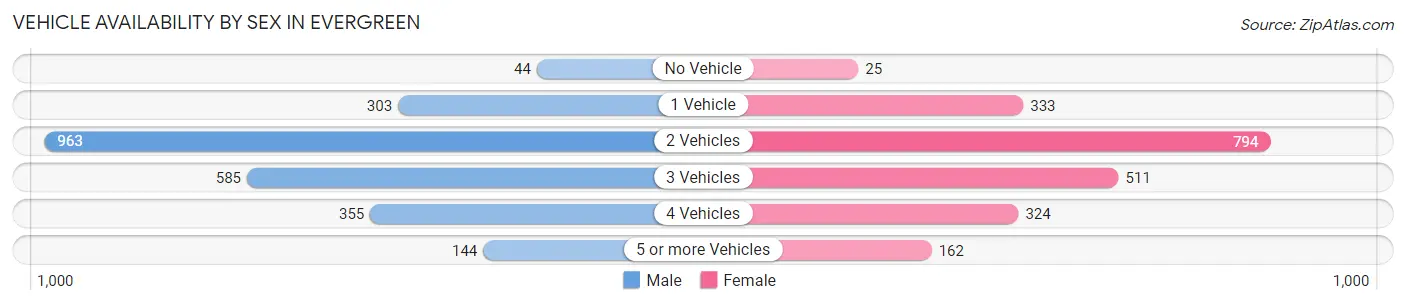
| Vehicles Available | Male | Female |
| No Vehicle | 44 (1.8%) | 25 (1.2%) |
| 1 Vehicle | 303 (12.7%) | 333 (15.5%) |
| 2 Vehicles | 963 (40.2%) | 794 (36.9%) |
| 3 Vehicles | 585 (24.4%) | 511 (23.8%) |
| 4 Vehicles | 355 (14.8%) | 324 (15.1%) |
| 5 or more Vehicles | 144 (6.0%) | 162 (7.5%) |
| Total | 2,394 (100.0%) | 2,149 (100.0%) |
Commute Time in Evergreen
The most frequently occuring commute durations in Evergreen are 15 to 19 minutes (957 commuters, 22.2%), 10 to 14 minutes (872 commuters, 20.2%), and 5 to 9 minutes (689 commuters, 16.0%).
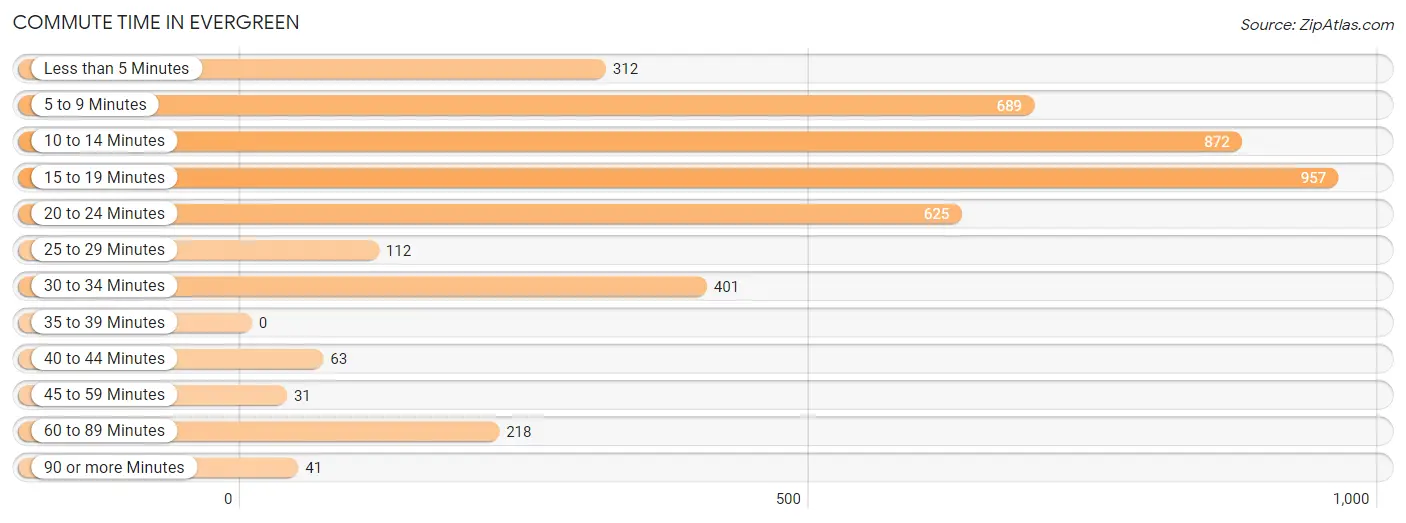
| Commute Time | # Commuters | % Commuters |
| Less than 5 Minutes | 312 | 7.2% |
| 5 to 9 Minutes | 689 | 16.0% |
| 10 to 14 Minutes | 872 | 20.2% |
| 15 to 19 Minutes | 957 | 22.2% |
| 20 to 24 Minutes | 625 | 14.5% |
| 25 to 29 Minutes | 112 | 2.6% |
| 30 to 34 Minutes | 401 | 9.3% |
| 35 to 39 Minutes | 0 | 0.0% |
| 40 to 44 Minutes | 63 | 1.5% |
| 45 to 59 Minutes | 31 | 0.7% |
| 60 to 89 Minutes | 218 | 5.1% |
| 90 or more Minutes | 41 | 0.9% |
Commute Time by Sex in Evergreen
The most common commute times in Evergreen are 15 to 19 minutes (488 commuters, 21.6%) for males and 15 to 19 minutes (469 commuters, 22.8%) for females.
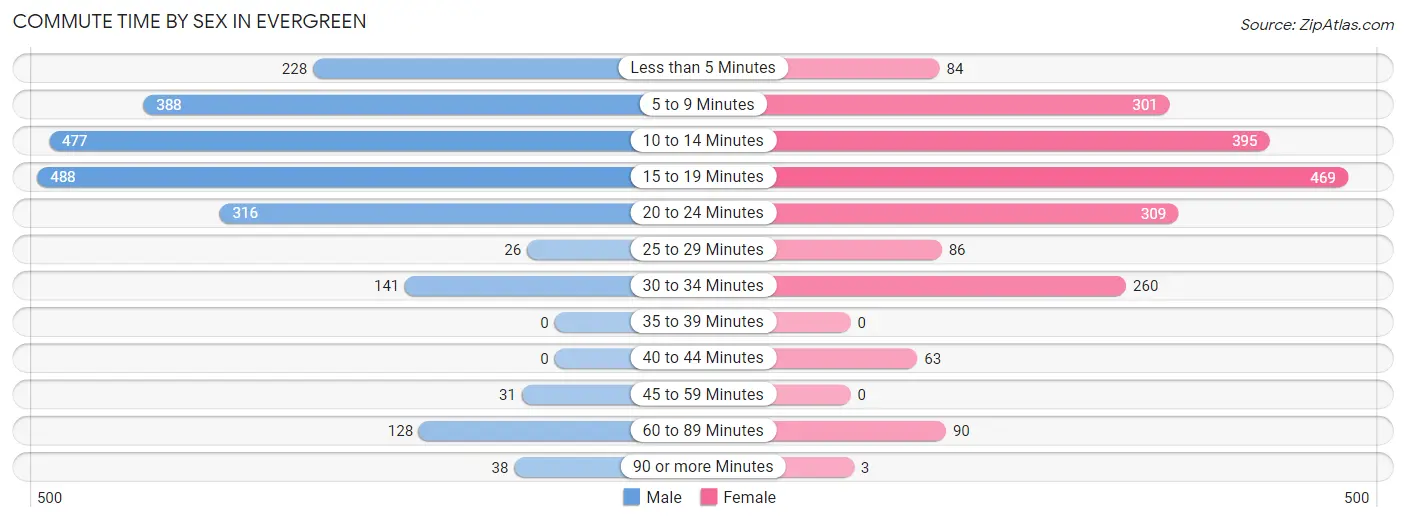
| Commute Time | Male | Female |
| Less than 5 Minutes | 228 (10.1%) | 84 (4.1%) |
| 5 to 9 Minutes | 388 (17.2%) | 301 (14.6%) |
| 10 to 14 Minutes | 477 (21.1%) | 395 (19.2%) |
| 15 to 19 Minutes | 488 (21.6%) | 469 (22.8%) |
| 20 to 24 Minutes | 316 (14.0%) | 309 (15.0%) |
| 25 to 29 Minutes | 26 (1.1%) | 86 (4.2%) |
| 30 to 34 Minutes | 141 (6.2%) | 260 (12.6%) |
| 35 to 39 Minutes | 0 (0.0%) | 0 (0.0%) |
| 40 to 44 Minutes | 0 (0.0%) | 63 (3.1%) |
| 45 to 59 Minutes | 31 (1.4%) | 0 (0.0%) |
| 60 to 89 Minutes | 128 (5.7%) | 90 (4.4%) |
| 90 or more Minutes | 38 (1.7%) | 3 (0.2%) |
Time of Departure to Work by Sex in Evergreen
The most frequent times of departure to work in Evergreen are 6:30 AM to 6:59 AM (436, 19.3%) for males and 7:30 AM to 7:59 AM (384, 18.6%) for females.
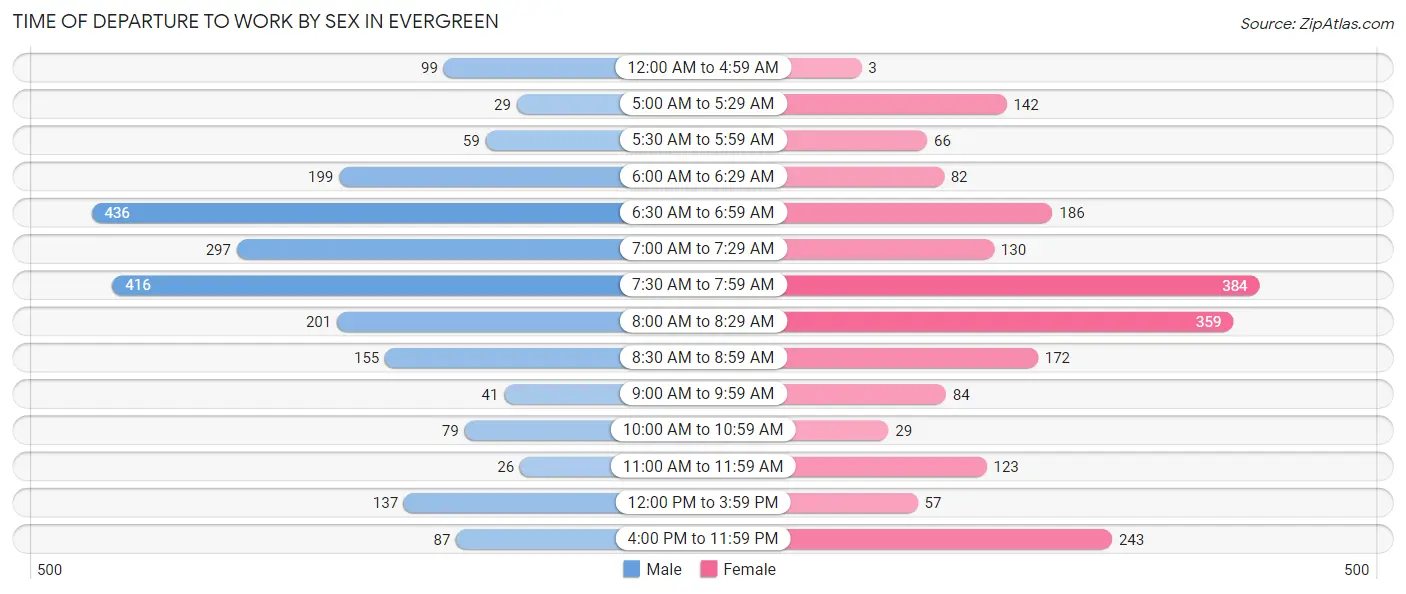
| Time of Departure | Male | Female |
| 12:00 AM to 4:59 AM | 99 (4.4%) | 3 (0.2%) |
| 5:00 AM to 5:29 AM | 29 (1.3%) | 142 (6.9%) |
| 5:30 AM to 5:59 AM | 59 (2.6%) | 66 (3.2%) |
| 6:00 AM to 6:29 AM | 199 (8.8%) | 82 (4.0%) |
| 6:30 AM to 6:59 AM | 436 (19.3%) | 186 (9.0%) |
| 7:00 AM to 7:29 AM | 297 (13.1%) | 130 (6.3%) |
| 7:30 AM to 7:59 AM | 416 (18.4%) | 384 (18.6%) |
| 8:00 AM to 8:29 AM | 201 (8.9%) | 359 (17.4%) |
| 8:30 AM to 8:59 AM | 155 (6.9%) | 172 (8.4%) |
| 9:00 AM to 9:59 AM | 41 (1.8%) | 84 (4.1%) |
| 10:00 AM to 10:59 AM | 79 (3.5%) | 29 (1.4%) |
| 11:00 AM to 11:59 AM | 26 (1.1%) | 123 (6.0%) |
| 12:00 PM to 3:59 PM | 137 (6.1%) | 57 (2.8%) |
| 4:00 PM to 11:59 PM | 87 (3.8%) | 243 (11.8%) |
| Total | 2,261 (100.0%) | 2,060 (100.0%) |
Housing Occupancy in Evergreen
Occupancy by Ownership in Evergreen
Of the total 3,068 dwellings in Evergreen, owner-occupied units account for 2,363 (77.0%), while renter-occupied units make up 705 (23.0%).
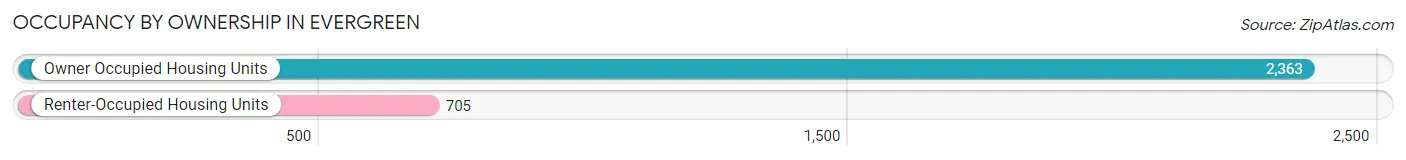
| Occupancy | # Housing Units | % Housing Units |
| Owner Occupied Housing Units | 2,363 | 77.0% |
| Renter-Occupied Housing Units | 705 | 23.0% |
| Total Occupied Housing Units | 3,068 | 100.0% |
Occupancy by Household Size in Evergreen
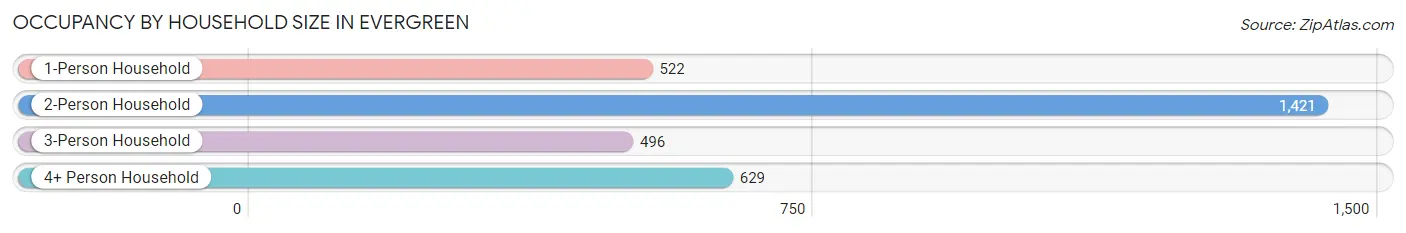
| Household Size | # Housing Units | % Housing Units |
| 1-Person Household | 522 | 17.0% |
| 2-Person Household | 1,421 | 46.3% |
| 3-Person Household | 496 | 16.2% |
| 4+ Person Household | 629 | 20.5% |
| Total Housing Units | 3,068 | 100.0% |
Occupancy by Ownership by Household Size in Evergreen
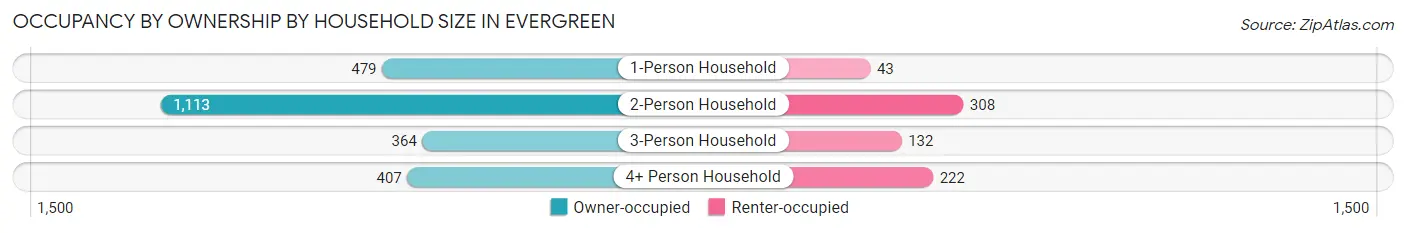
| Household Size | Owner-occupied | Renter-occupied |
| 1-Person Household | 479 (91.8%) | 43 (8.2%) |
| 2-Person Household | 1,113 (78.3%) | 308 (21.7%) |
| 3-Person Household | 364 (73.4%) | 132 (26.6%) |
| 4+ Person Household | 407 (64.7%) | 222 (35.3%) |
| Total Housing Units | 2,363 (77.0%) | 705 (23.0%) |
Occupancy by Educational Attainment in Evergreen
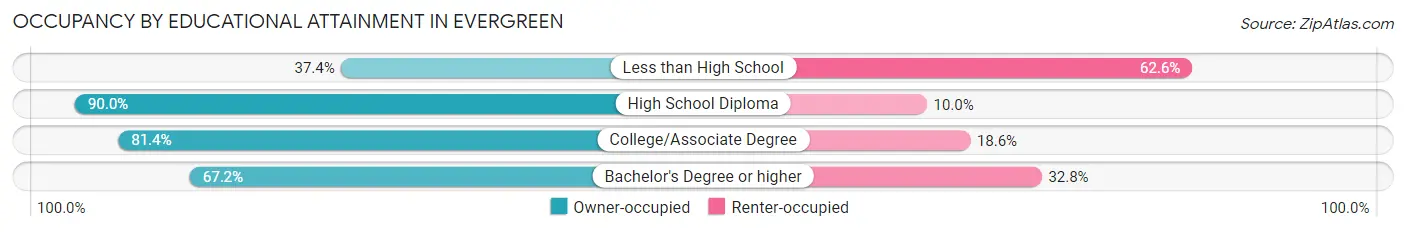
| Household Size | Owner-occupied | Renter-occupied |
| Less than High School | 99 (37.4%) | 166 (62.6%) |
| High School Diploma | 776 (90.0%) | 86 (10.0%) |
| College/Associate Degree | 1,051 (81.4%) | 240 (18.6%) |
| Bachelor's Degree or higher | 437 (67.2%) | 213 (32.8%) |
Occupancy by Age of Householder in Evergreen
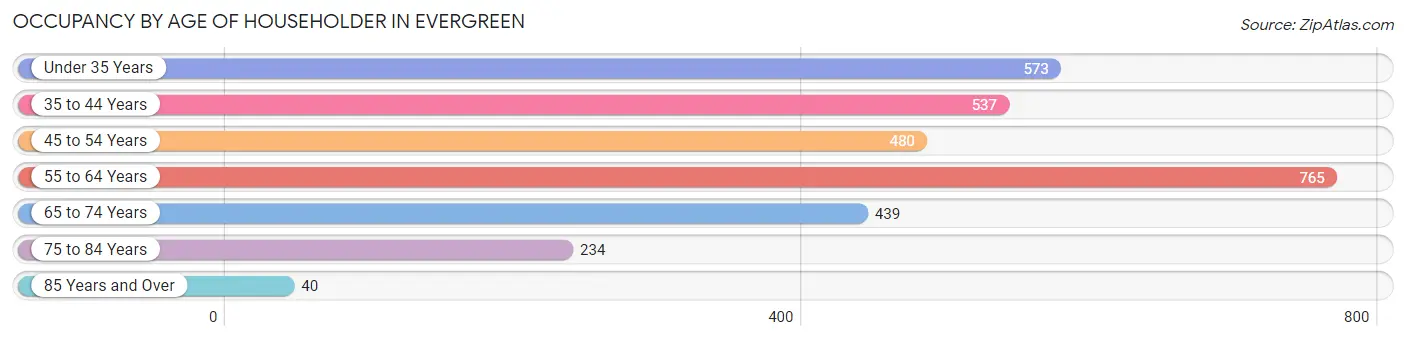
| Age Bracket | # Households | % Households |
| Under 35 Years | 573 | 18.7% |
| 35 to 44 Years | 537 | 17.5% |
| 45 to 54 Years | 480 | 15.7% |
| 55 to 64 Years | 765 | 24.9% |
| 65 to 74 Years | 439 | 14.3% |
| 75 to 84 Years | 234 | 7.6% |
| 85 Years and Over | 40 | 1.3% |
| Total | 3,068 | 100.0% |
Housing Finances in Evergreen
Median Income by Occupancy in Evergreen
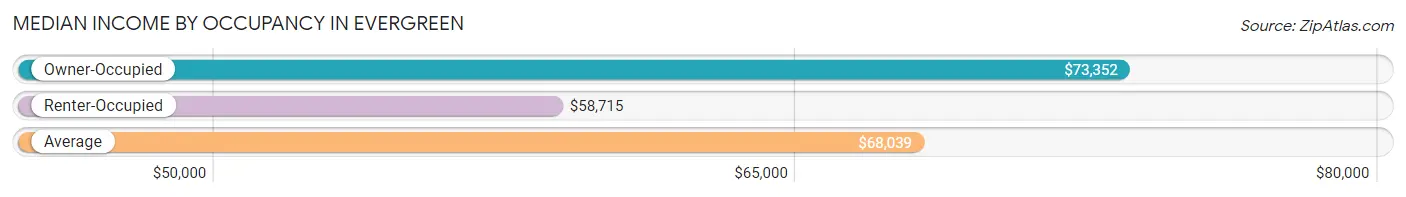
| Occupancy Type | # Households | Median Income |
| Owner-Occupied | 2,363 (77.0%) | $73,352 |
| Renter-Occupied | 705 (23.0%) | $58,715 |
| Average | 3,068 (100.0%) | $68,039 |
Occupancy by Householder Income Bracket in Evergreen
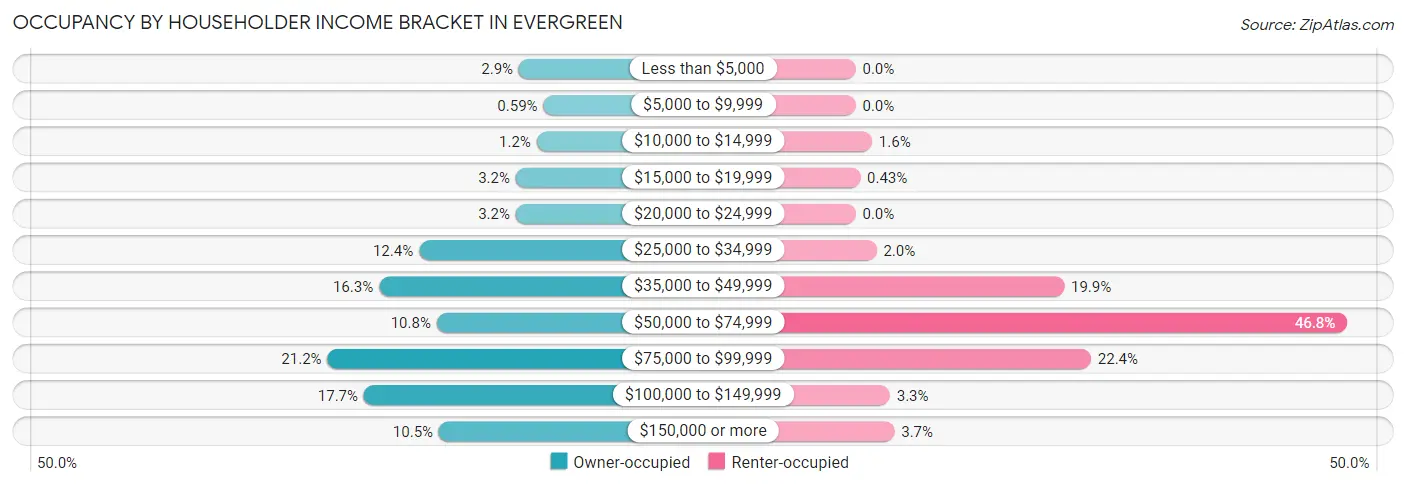
| Income Bracket | Owner-occupied | Renter-occupied |
| Less than $5,000 | 69 (2.9%) | 0 (0.0%) |
| $5,000 to $9,999 | 14 (0.6%) | 0 (0.0%) |
| $10,000 to $14,999 | 29 (1.2%) | 11 (1.6%) |
| $15,000 to $19,999 | 76 (3.2%) | 3 (0.4%) |
| $20,000 to $24,999 | 76 (3.2%) | 0 (0.0%) |
| $25,000 to $34,999 | 294 (12.4%) | 14 (2.0%) |
| $35,000 to $49,999 | 384 (16.3%) | 140 (19.9%) |
| $50,000 to $74,999 | 254 (10.7%) | 330 (46.8%) |
| $75,000 to $99,999 | 500 (21.2%) | 158 (22.4%) |
| $100,000 to $149,999 | 418 (17.7%) | 23 (3.3%) |
| $150,000 or more | 249 (10.5%) | 26 (3.7%) |
| Total | 2,363 (100.0%) | 705 (100.0%) |
Monthly Housing Cost Tiers in Evergreen
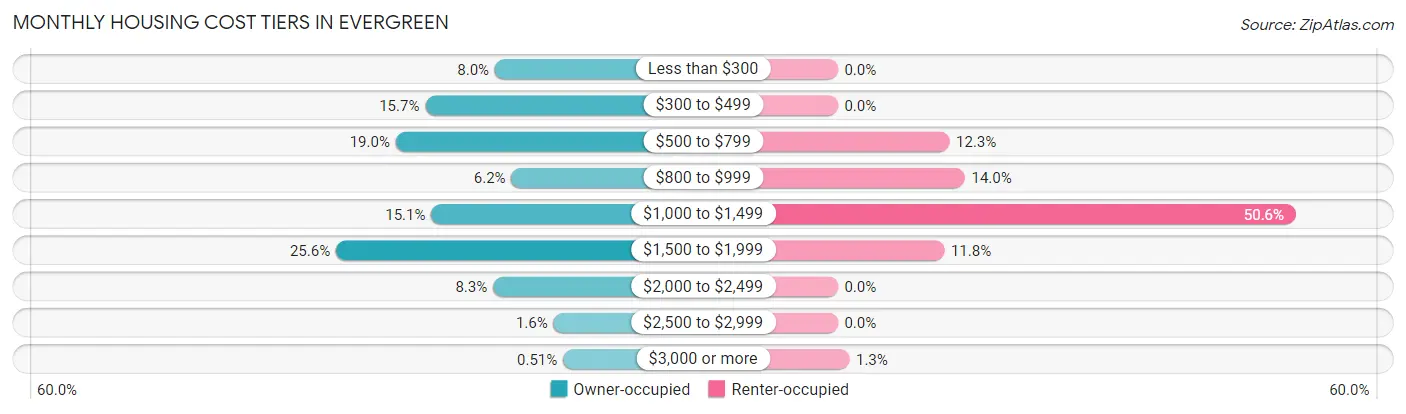
| Monthly Cost | Owner-occupied | Renter-occupied |
| Less than $300 | 190 (8.0%) | 0 (0.0%) |
| $300 to $499 | 372 (15.7%) | 0 (0.0%) |
| $500 to $799 | 449 (19.0%) | 87 (12.3%) |
| $800 to $999 | 147 (6.2%) | 99 (14.0%) |
| $1,000 to $1,499 | 356 (15.1%) | 357 (50.6%) |
| $1,500 to $1,999 | 605 (25.6%) | 83 (11.8%) |
| $2,000 to $2,499 | 195 (8.3%) | 0 (0.0%) |
| $2,500 to $2,999 | 37 (1.6%) | 0 (0.0%) |
| $3,000 or more | 12 (0.5%) | 9 (1.3%) |
| Total | 2,363 (100.0%) | 705 (100.0%) |
Physical Housing Characteristics in Evergreen
Housing Structures in Evergreen
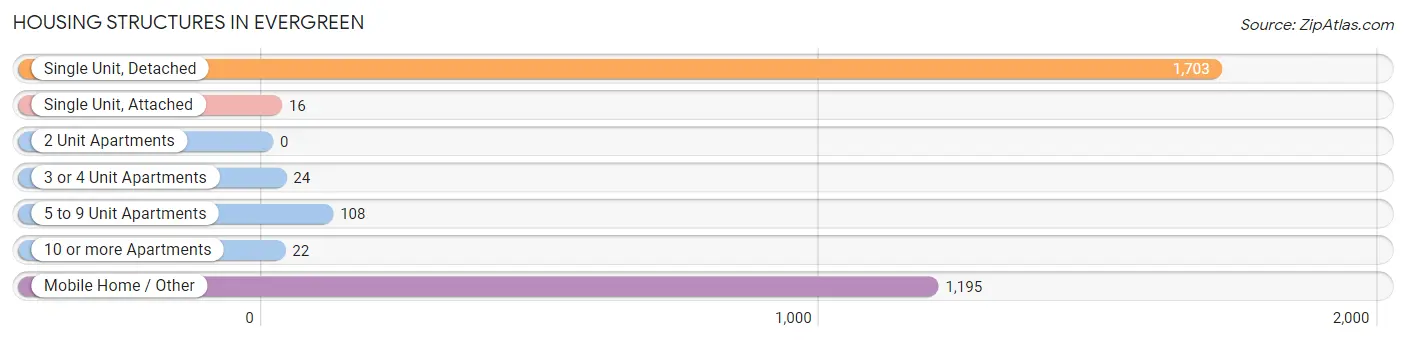
| Structure Type | # Housing Units | % Housing Units |
| Single Unit, Detached | 1,703 | 55.5% |
| Single Unit, Attached | 16 | 0.5% |
| 2 Unit Apartments | 0 | 0.0% |
| 3 or 4 Unit Apartments | 24 | 0.8% |
| 5 to 9 Unit Apartments | 108 | 3.5% |
| 10 or more Apartments | 22 | 0.7% |
| Mobile Home / Other | 1,195 | 39.0% |
| Total | 3,068 | 100.0% |
Housing Structures by Occupancy in Evergreen
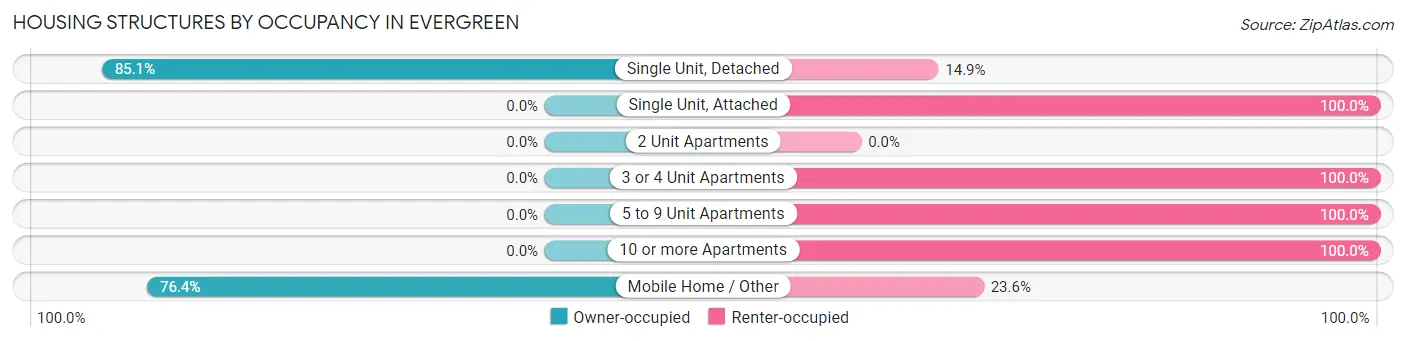
| Structure Type | Owner-occupied | Renter-occupied |
| Single Unit, Detached | 1,450 (85.1%) | 253 (14.9%) |
| Single Unit, Attached | 0 (0.0%) | 16 (100.0%) |
| 2 Unit Apartments | 0 (0.0%) | 0 (0.0%) |
| 3 or 4 Unit Apartments | 0 (0.0%) | 24 (100.0%) |
| 5 to 9 Unit Apartments | 0 (0.0%) | 108 (100.0%) |
| 10 or more Apartments | 0 (0.0%) | 22 (100.0%) |
| Mobile Home / Other | 913 (76.4%) | 282 (23.6%) |
| Total | 2,363 (77.0%) | 705 (23.0%) |
Housing Structures by Number of Rooms in Evergreen
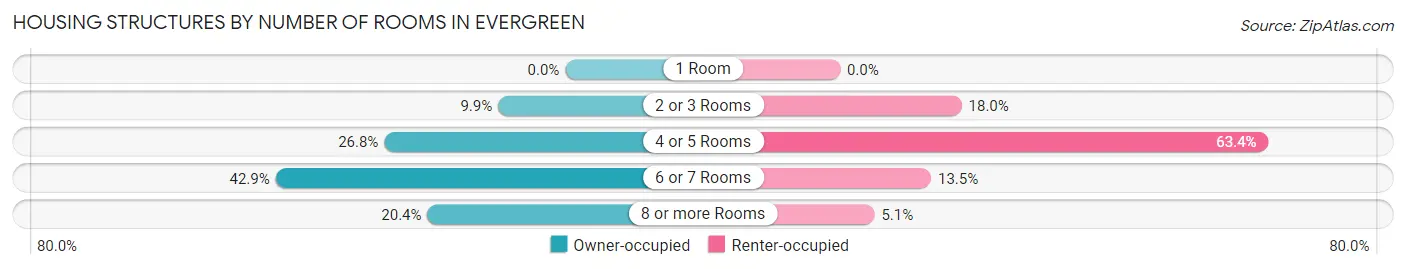
| Number of Rooms | Owner-occupied | Renter-occupied |
| 1 Room | 0 (0.0%) | 0 (0.0%) |
| 2 or 3 Rooms | 235 (9.9%) | 127 (18.0%) |
| 4 or 5 Rooms | 633 (26.8%) | 447 (63.4%) |
| 6 or 7 Rooms | 1,013 (42.9%) | 95 (13.5%) |
| 8 or more Rooms | 482 (20.4%) | 36 (5.1%) |
| Total | 2,363 (100.0%) | 705 (100.0%) |
Housing Structure by Heating Type in Evergreen
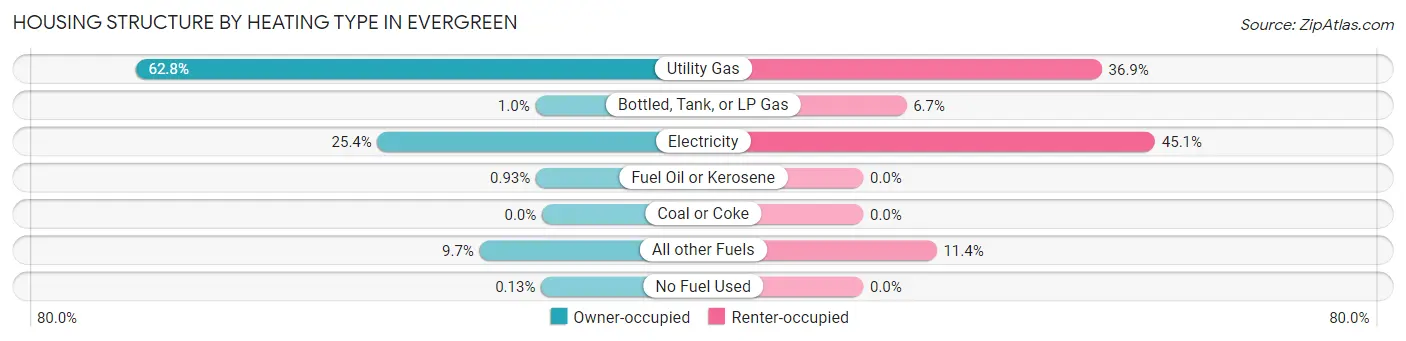
| Heating Type | Owner-occupied | Renter-occupied |
| Utility Gas | 1,485 (62.8%) | 260 (36.9%) |
| Bottled, Tank, or LP Gas | 24 (1.0%) | 47 (6.7%) |
| Electricity | 601 (25.4%) | 318 (45.1%) |
| Fuel Oil or Kerosene | 22 (0.9%) | 0 (0.0%) |
| Coal or Coke | 0 (0.0%) | 0 (0.0%) |
| All other Fuels | 228 (9.7%) | 80 (11.4%) |
| No Fuel Used | 3 (0.1%) | 0 (0.0%) |
| Total | 2,363 (100.0%) | 705 (100.0%) |
Household Vehicle Usage in Evergreen
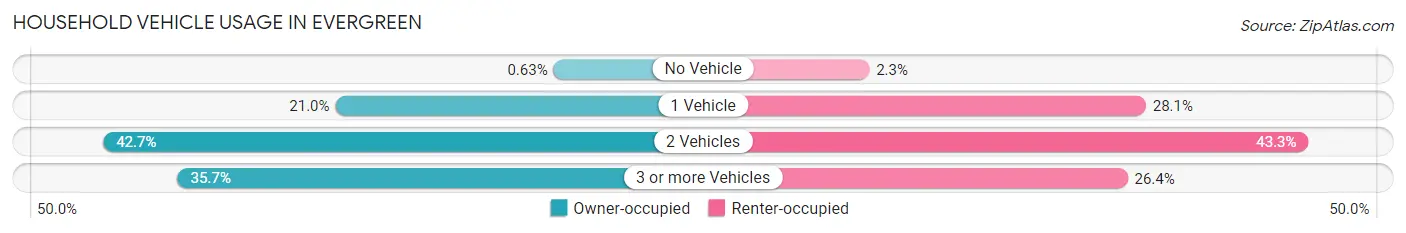
| Vehicles per Household | Owner-occupied | Renter-occupied |
| No Vehicle | 15 (0.6%) | 16 (2.3%) |
| 1 Vehicle | 496 (21.0%) | 198 (28.1%) |
| 2 Vehicles | 1,008 (42.7%) | 305 (43.3%) |
| 3 or more Vehicles | 844 (35.7%) | 186 (26.4%) |
| Total | 2,363 (100.0%) | 705 (100.0%) |
Real Estate & Mortgages in Evergreen
Real Estate and Mortgage Overview in Evergreen
| Characteristic | Without Mortgage | With Mortgage |
| Housing Units | 1,063 | 1,300 |
| Median Property Value | - | - |
| Median Household Income | $44,683 | $150 |
| Monthly Housing Costs | $485 | $12 |
| Real Estate Taxes | $1,234 | $44 |
Property Value by Mortgage Status in Evergreen
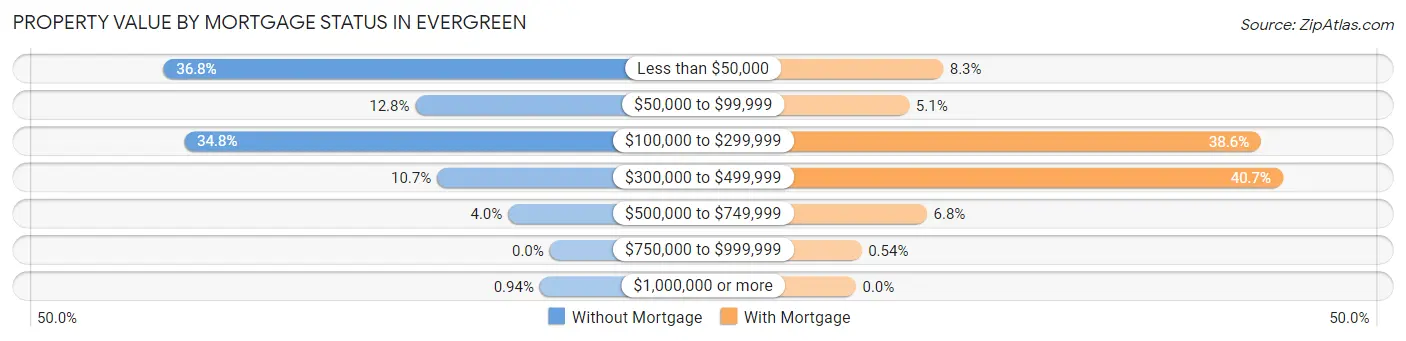
| Property Value | Without Mortgage | With Mortgage |
| Less than $50,000 | 391 (36.8%) | 108 (8.3%) |
| $50,000 to $99,999 | 136 (12.8%) | 66 (5.1%) |
| $100,000 to $299,999 | 370 (34.8%) | 502 (38.6%) |
| $300,000 to $499,999 | 114 (10.7%) | 529 (40.7%) |
| $500,000 to $749,999 | 42 (4.0%) | 88 (6.8%) |
| $750,000 to $999,999 | 0 (0.0%) | 7 (0.5%) |
| $1,000,000 or more | 10 (0.9%) | 0 (0.0%) |
| Total | 1,063 (100.0%) | 1,300 (100.0%) |
Household Income by Mortgage Status in Evergreen
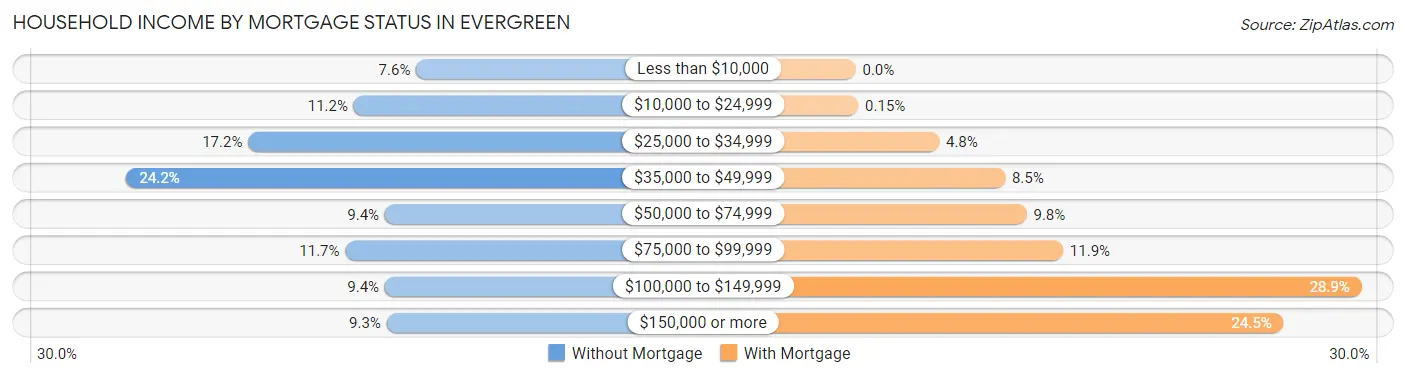
| Household Income | Without Mortgage | With Mortgage |
| Less than $10,000 | 81 (7.6%) | 0 (0.0%) |
| $10,000 to $24,999 | 119 (11.2%) | 2 (0.2%) |
| $25,000 to $34,999 | 183 (17.2%) | 62 (4.8%) |
| $35,000 to $49,999 | 257 (24.2%) | 111 (8.5%) |
| $50,000 to $74,999 | 100 (9.4%) | 127 (9.8%) |
| $75,000 to $99,999 | 124 (11.7%) | 154 (11.8%) |
| $100,000 to $149,999 | 100 (9.4%) | 376 (28.9%) |
| $150,000 or more | 99 (9.3%) | 318 (24.5%) |
| Total | 1,063 (100.0%) | 1,300 (100.0%) |
Property Value to Household Income Ratio in Evergreen
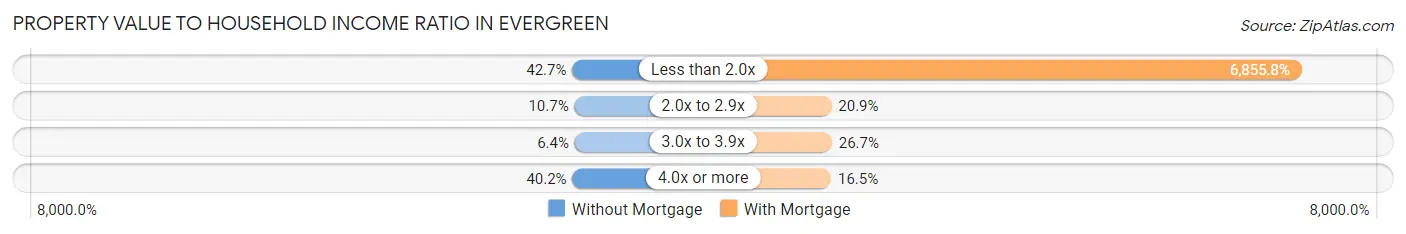
| Value-to-Income Ratio | Without Mortgage | With Mortgage |
| Less than 2.0x | 454 (42.7%) | 89,125 (6,855.8%) |
| 2.0x to 2.9x | 114 (10.7%) | 271 (20.8%) |
| 3.0x to 3.9x | 68 (6.4%) | 347 (26.7%) |
| 4.0x or more | 427 (40.2%) | 214 (16.5%) |
| Total | 1,063 (100.0%) | 1,300 (100.0%) |
Real Estate Taxes by Mortgage Status in Evergreen
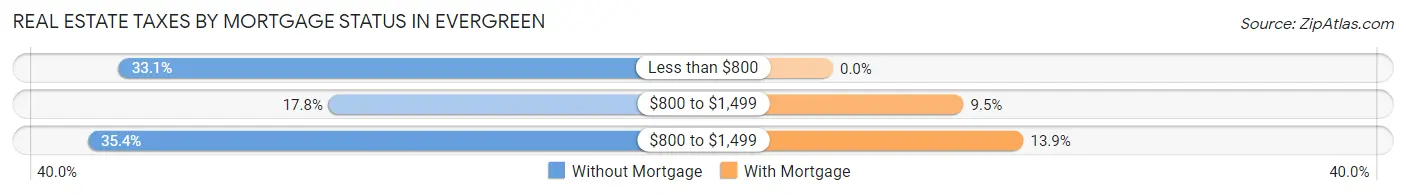
| Property Taxes | Without Mortgage | With Mortgage |
| Less than $800 | 352 (33.1%) | 0 (0.0%) |
| $800 to $1,499 | 189 (17.8%) | 124 (9.5%) |
| $800 to $1,499 | 376 (35.4%) | 181 (13.9%) |
| Total | 1,063 (100.0%) | 1,300 (100.0%) |
Health & Disability in Evergreen
Health Insurance Coverage by Age in Evergreen
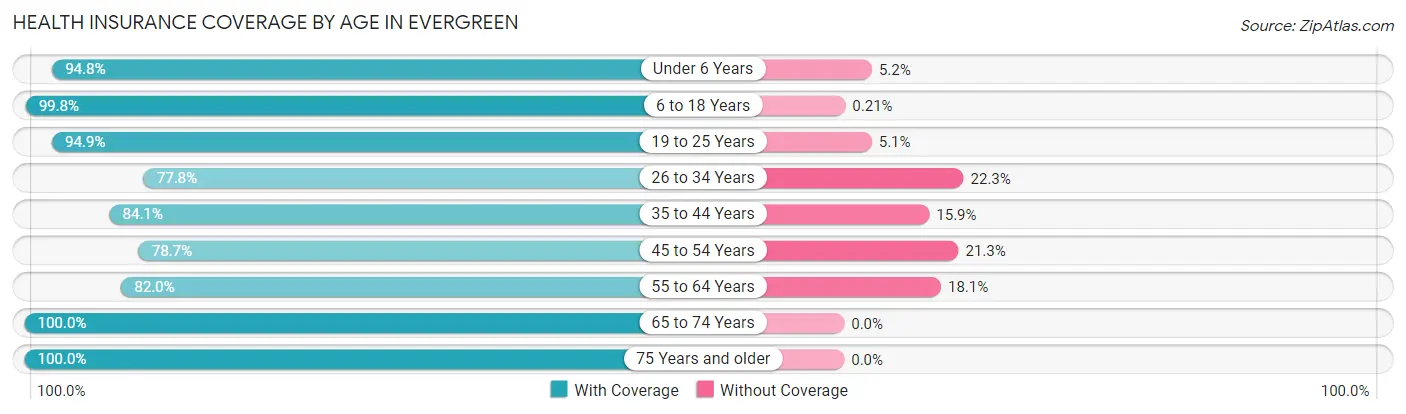
| Age Bracket | With Coverage | Without Coverage |
| Under 6 Years | 551 (94.8%) | 30 (5.2%) |
| 6 to 18 Years | 1,400 (99.8%) | 3 (0.2%) |
| 19 to 25 Years | 813 (94.9%) | 44 (5.1%) |
| 26 to 34 Years | 678 (77.7%) | 194 (22.3%) |
| 35 to 44 Years | 997 (84.1%) | 188 (15.9%) |
| 45 to 54 Years | 850 (78.7%) | 230 (21.3%) |
| 55 to 64 Years | 1,103 (82.0%) | 243 (18.0%) |
| 65 to 74 Years | 723 (100.0%) | 0 (0.0%) |
| 75 Years and older | 399 (100.0%) | 0 (0.0%) |
| Total | 7,514 (89.0%) | 932 (11.0%) |
Health Insurance Coverage by Citizenship Status in Evergreen
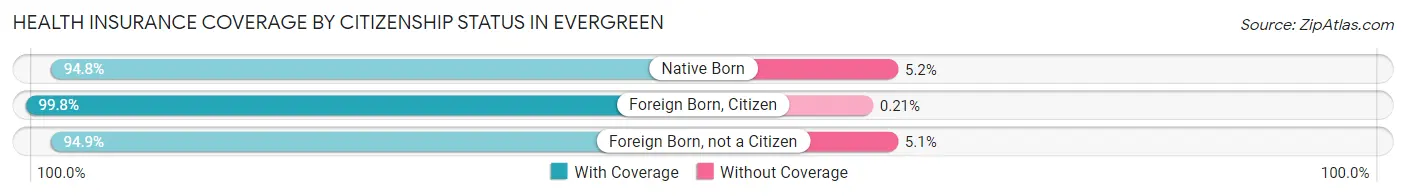
| Citizenship Status | With Coverage | Without Coverage |
| Native Born | 551 (94.8%) | 30 (5.2%) |
| Foreign Born, Citizen | 1,400 (99.8%) | 3 (0.2%) |
| Foreign Born, not a Citizen | 813 (94.9%) | 44 (5.1%) |
Health Insurance Coverage by Household Income in Evergreen
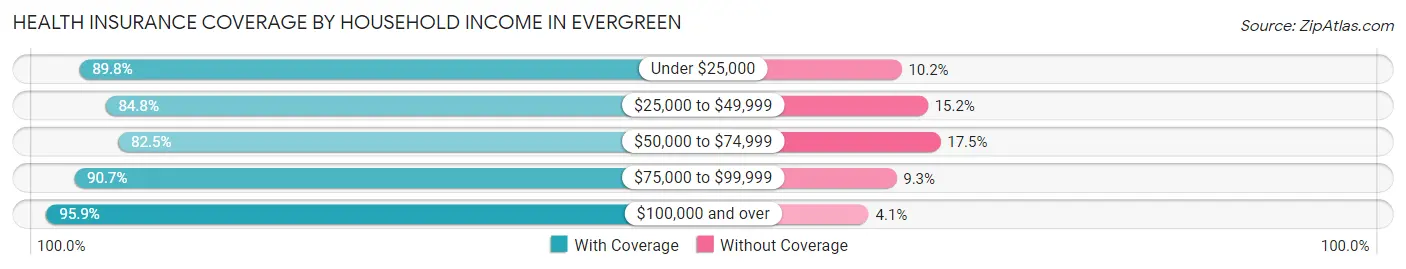
| Household Income | With Coverage | Without Coverage |
| Under $25,000 | 517 (89.8%) | 59 (10.2%) |
| $25,000 to $49,999 | 1,797 (84.8%) | 321 (15.2%) |
| $50,000 to $74,999 | 1,394 (82.5%) | 296 (17.5%) |
| $75,000 to $99,999 | 1,575 (90.7%) | 161 (9.3%) |
| $100,000 and over | 2,225 (95.9%) | 95 (4.1%) |
Public vs Private Health Insurance Coverage by Age in Evergreen
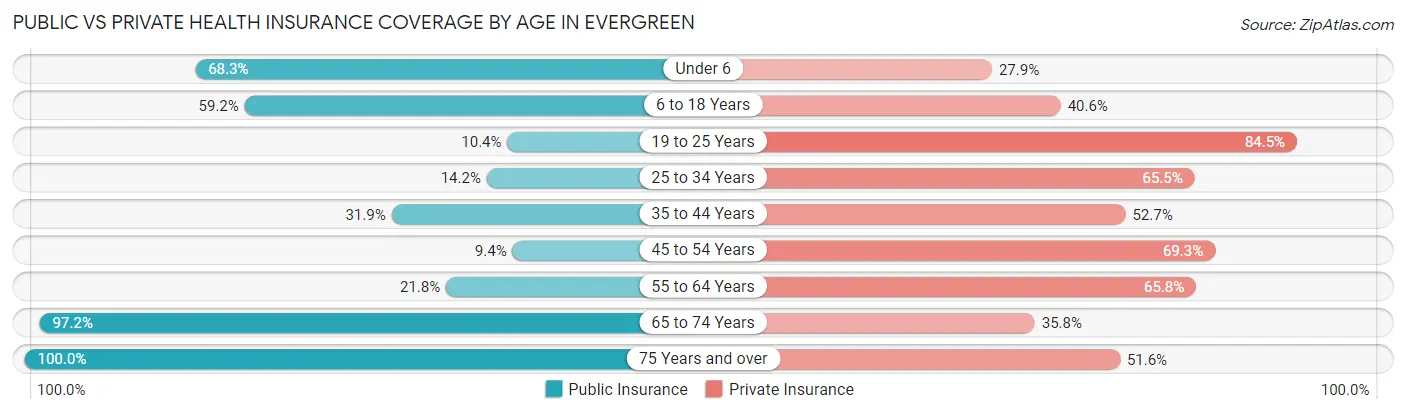
| Age Bracket | Public Insurance | Private Insurance |
| Under 6 | 397 (68.3%) | 162 (27.9%) |
| 6 to 18 Years | 830 (59.2%) | 570 (40.6%) |
| 19 to 25 Years | 89 (10.4%) | 724 (84.5%) |
| 25 to 34 Years | 124 (14.2%) | 571 (65.5%) |
| 35 to 44 Years | 378 (31.9%) | 624 (52.7%) |
| 45 to 54 Years | 102 (9.4%) | 748 (69.3%) |
| 55 to 64 Years | 293 (21.8%) | 885 (65.7%) |
| 65 to 74 Years | 703 (97.2%) | 259 (35.8%) |
| 75 Years and over | 399 (100.0%) | 206 (51.6%) |
| Total | 3,315 (39.3%) | 4,749 (56.2%) |
Disability Status by Sex by Age in Evergreen
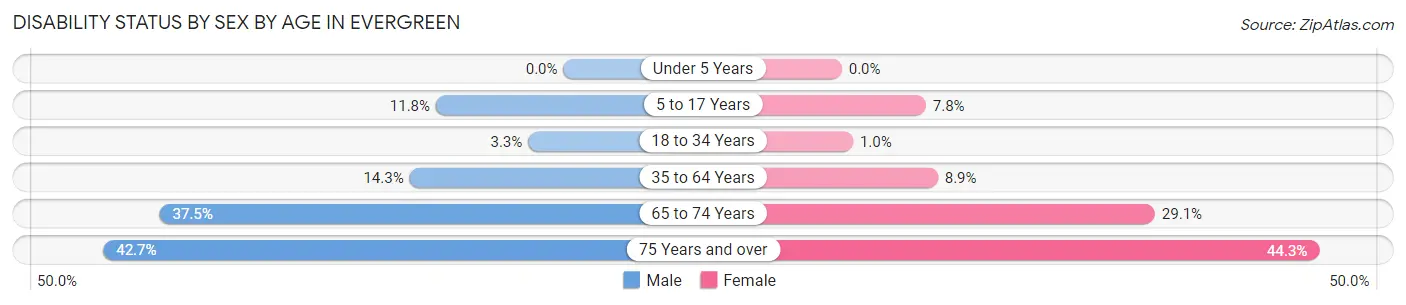
| Age Bracket | Male | Female |
| Under 5 Years | 0 (0.0%) | 0 (0.0%) |
| 5 to 17 Years | 68 (11.8%) | 61 (7.8%) |
| 18 to 34 Years | 29 (3.3%) | 10 (1.0%) |
| 35 to 64 Years | 256 (14.3%) | 162 (8.9%) |
| 65 to 74 Years | 151 (37.5%) | 93 (29.1%) |
| 75 Years and over | 73 (42.7%) | 101 (44.3%) |
Disability Class by Sex by Age in Evergreen
Disability Class: Hearing Difficulty
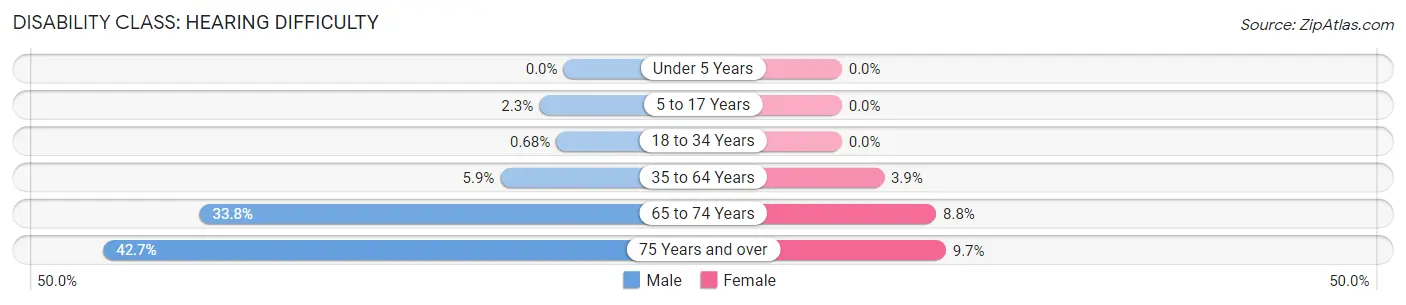
| Age Bracket | Male | Female |
| Under 5 Years | 0 (0.0%) | 0 (0.0%) |
| 5 to 17 Years | 13 (2.3%) | 0 (0.0%) |
| 18 to 34 Years | 6 (0.7%) | 0 (0.0%) |
| 35 to 64 Years | 105 (5.9%) | 71 (3.9%) |
| 65 to 74 Years | 136 (33.8%) | 28 (8.7%) |
| 75 Years and over | 73 (42.7%) | 22 (9.7%) |
Disability Class: Vision Difficulty
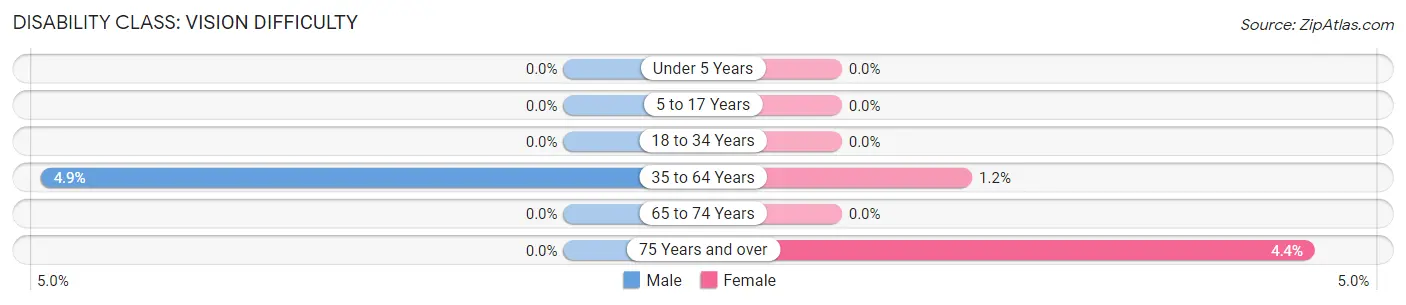
| Age Bracket | Male | Female |
| Under 5 Years | 0 (0.0%) | 0 (0.0%) |
| 5 to 17 Years | 0 (0.0%) | 0 (0.0%) |
| 18 to 34 Years | 0 (0.0%) | 0 (0.0%) |
| 35 to 64 Years | 87 (4.9%) | 22 (1.2%) |
| 65 to 74 Years | 0 (0.0%) | 0 (0.0%) |
| 75 Years and over | 0 (0.0%) | 10 (4.4%) |
Disability Class: Cognitive Difficulty
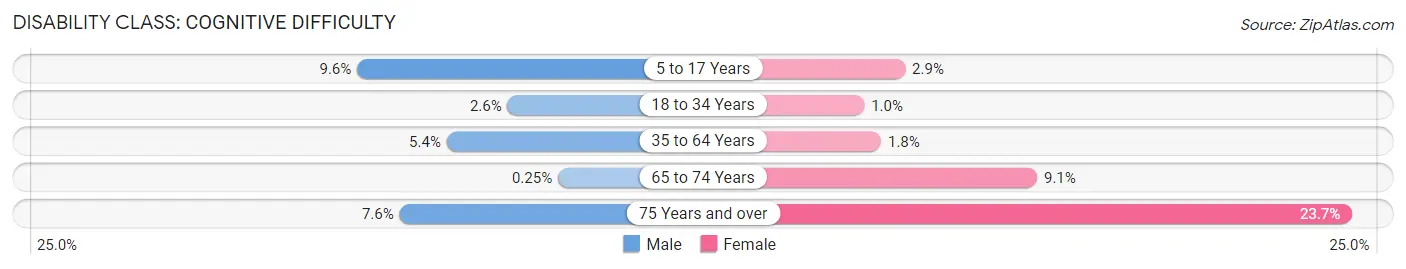
| Age Bracket | Male | Female |
| 5 to 17 Years | 55 (9.6%) | 23 (2.9%) |
| 18 to 34 Years | 23 (2.6%) | 10 (1.0%) |
| 35 to 64 Years | 97 (5.4%) | 33 (1.8%) |
| 65 to 74 Years | 1 (0.3%) | 29 (9.1%) |
| 75 Years and over | 13 (7.6%) | 54 (23.7%) |
Disability Class: Ambulatory Difficulty
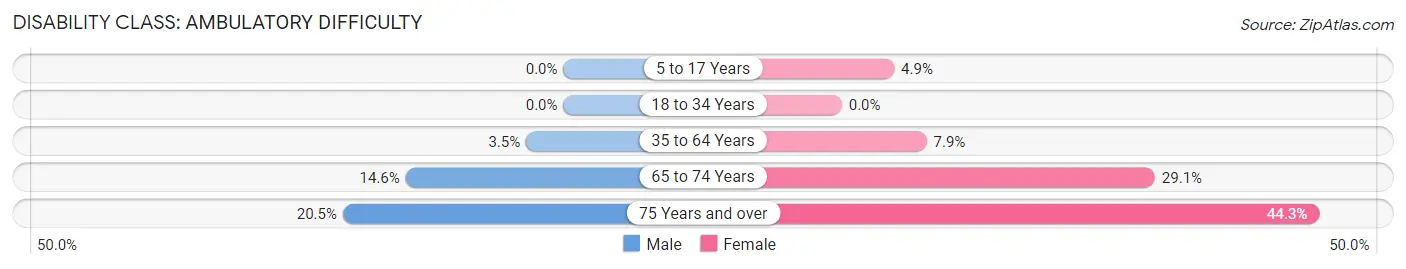
| Age Bracket | Male | Female |
| 5 to 17 Years | 0 (0.0%) | 38 (4.9%) |
| 18 to 34 Years | 0 (0.0%) | 0 (0.0%) |
| 35 to 64 Years | 62 (3.5%) | 143 (7.9%) |
| 65 to 74 Years | 59 (14.6%) | 93 (29.1%) |
| 75 Years and over | 35 (20.5%) | 101 (44.3%) |
Disability Class: Self-Care Difficulty
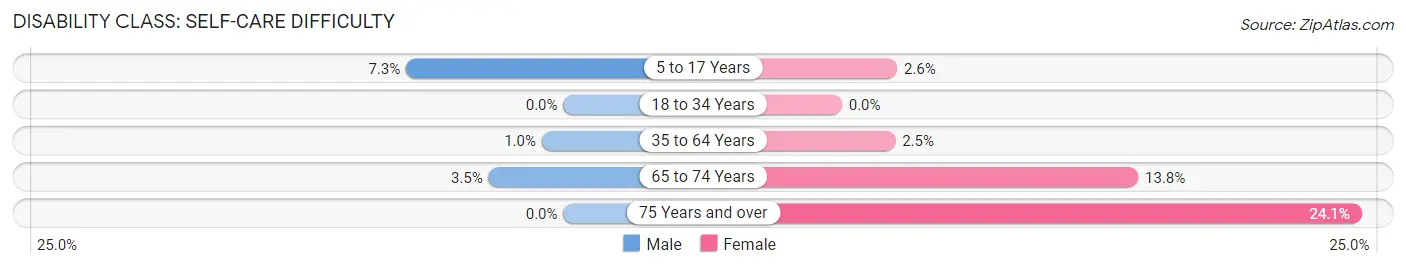
| Age Bracket | Male | Female |
| 5 to 17 Years | 42 (7.3%) | 20 (2.6%) |
| 18 to 34 Years | 0 (0.0%) | 0 (0.0%) |
| 35 to 64 Years | 18 (1.0%) | 45 (2.5%) |
| 65 to 74 Years | 14 (3.5%) | 44 (13.8%) |
| 75 Years and over | 0 (0.0%) | 55 (24.1%) |
Technology Access in Evergreen
Computing Device Access in Evergreen
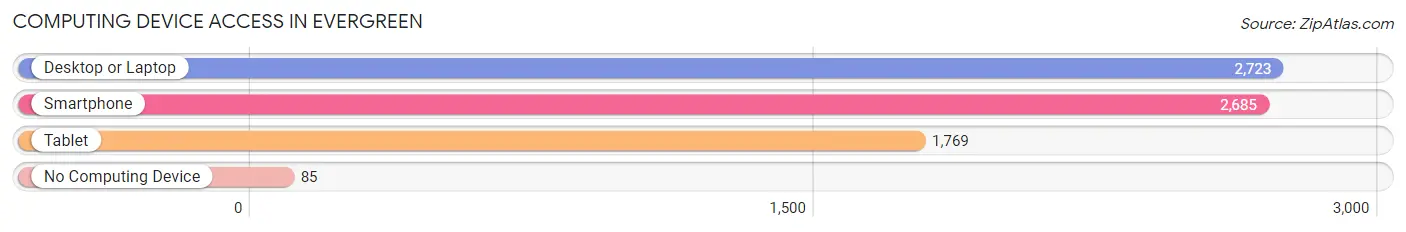
| Device Type | # Households | % Households |
| Desktop or Laptop | 2,723 | 88.7% |
| Smartphone | 2,685 | 87.5% |
| Tablet | 1,769 | 57.7% |
| No Computing Device | 85 | 2.8% |
| Total | 3,068 | 100.0% |
Internet Access in Evergreen
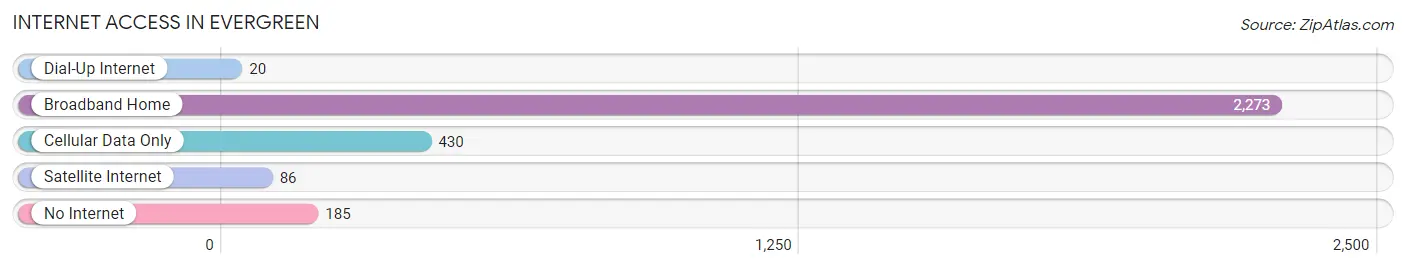
| Internet Type | # Households | % Households |
| Dial-Up Internet | 20 | 0.6% |
| Broadband Home | 2,273 | 74.1% |
| Cellular Data Only | 430 | 14.0% |
| Satellite Internet | 86 | 2.8% |
| No Internet | 185 | 6.0% |
| Total | 3,068 | 100.0% |
Evergreen Summary
History
The history of Evergreen, Montana dates back to the late 1800s when the area was first settled by homesteaders. The town was officially founded in 1891 and was named after the evergreen trees that grew in the area. The town was originally a logging and farming community, but it soon became a popular tourist destination due to its proximity to Glacier National Park.
In the early 1900s, the Great Northern Railway was built through the area, connecting Evergreen to the rest of Montana and the rest of the country. This allowed for the growth of the town and the development of the local economy.
In the 1950s, the town began to experience a population boom as people moved to the area to take advantage of the booming economy. The population of Evergreen grew from just over 1,000 in 1950 to over 4,000 in 2000.
Geography
Evergreen is located in northwestern Montana, just south of Glacier National Park. The town is situated in the Flathead Valley, which is surrounded by the Rocky Mountains. The Flathead River runs through the valley, providing a source of water for the town.
The town is located at an elevation of 3,400 feet and has a total area of 4.2 square miles. The climate in Evergreen is generally mild, with temperatures ranging from the low 30s in the winter to the high 80s in the summer.
Economy
The economy of Evergreen is largely based on tourism, as the town is located near Glacier National Park. The town also has a thriving agricultural sector, with many local farms producing a variety of crops.
The town also has a number of businesses, including restaurants, hotels, and retail stores. The town is also home to a number of manufacturing companies, including a paper mill and a furniture factory.
Demographics
As of the 2000 census, the population of Evergreen was 4,072. The racial makeup of the town was 95.3% White, 0.7% Native American, 0.3% Asian, 0.2% African American, 0.1% Pacific Islander, and 3.4% from other races.
The median household income in Evergreen was $37,917, and the median family income was $45,938. The per capita income was $20,945. About 8.3% of the population was below the poverty line.
Conclusion
Evergreen, Montana is a small town with a rich history and a thriving economy. The town is located near Glacier National Park and is home to a diverse population. The town has a strong agricultural sector and a number of businesses, making it a great place to live and work.
Common Questions
What is Per Capita Income in Evergreen?
Per Capita income in Evergreen is $28,955.
What is the Median Family Income in Evergreen?
Median Family Income in Evergreen is $75,799.
What is the Median Household income in Evergreen?
Median Household Income in Evergreen is $68,039.
What is Income or Wage Gap in Evergreen?
Income or Wage Gap in Evergreen is 24.7%.
Women in Evergreen earn 75.3 cents for every dollar earned by a man.
What is Family Income Deficit in Evergreen?
Family Income Deficit in Evergreen is $10,063.
Families that are below poverty line in Evergreen earn $10,063 less on average than the poverty threshold level.
What is Inequality or Gini Index in Evergreen?
Inequality or Gini Index in Evergreen is 0.36.
What is the Total Population of Evergreen?
Total Population of Evergreen is 8,514.
What is the Total Male Population of Evergreen?
Total Male Population of Evergreen is 4,186.
What is the Total Female Population of Evergreen?
Total Female Population of Evergreen is 4,328.
What is the Ratio of Males per 100 Females in Evergreen?
There are 96.72 Males per 100 Females in Evergreen.
What is the Ratio of Females per 100 Males in Evergreen?
There are 103.39 Females per 100 Males in Evergreen.
What is the Median Population Age in Evergreen?
Median Population Age in Evergreen is 38.9 Years.
What is the Average Family Size in Evergreen
Average Family Size in Evergreen is 3.1 People.
What is the Average Household Size in Evergreen
Average Household Size in Evergreen is 2.8 People.
How Large is the Labor Force in Evergreen?
There are 4,867 People in the Labor Forcein in Evergreen.
What is the Percentage of People in the Labor Force in Evergreen?
69.9% of People are in the Labor Force in Evergreen.
What is the Unemployment Rate in Evergreen?
Unemployment Rate in Evergreen is 4.3%.