Custer County, MT Map & Demographics
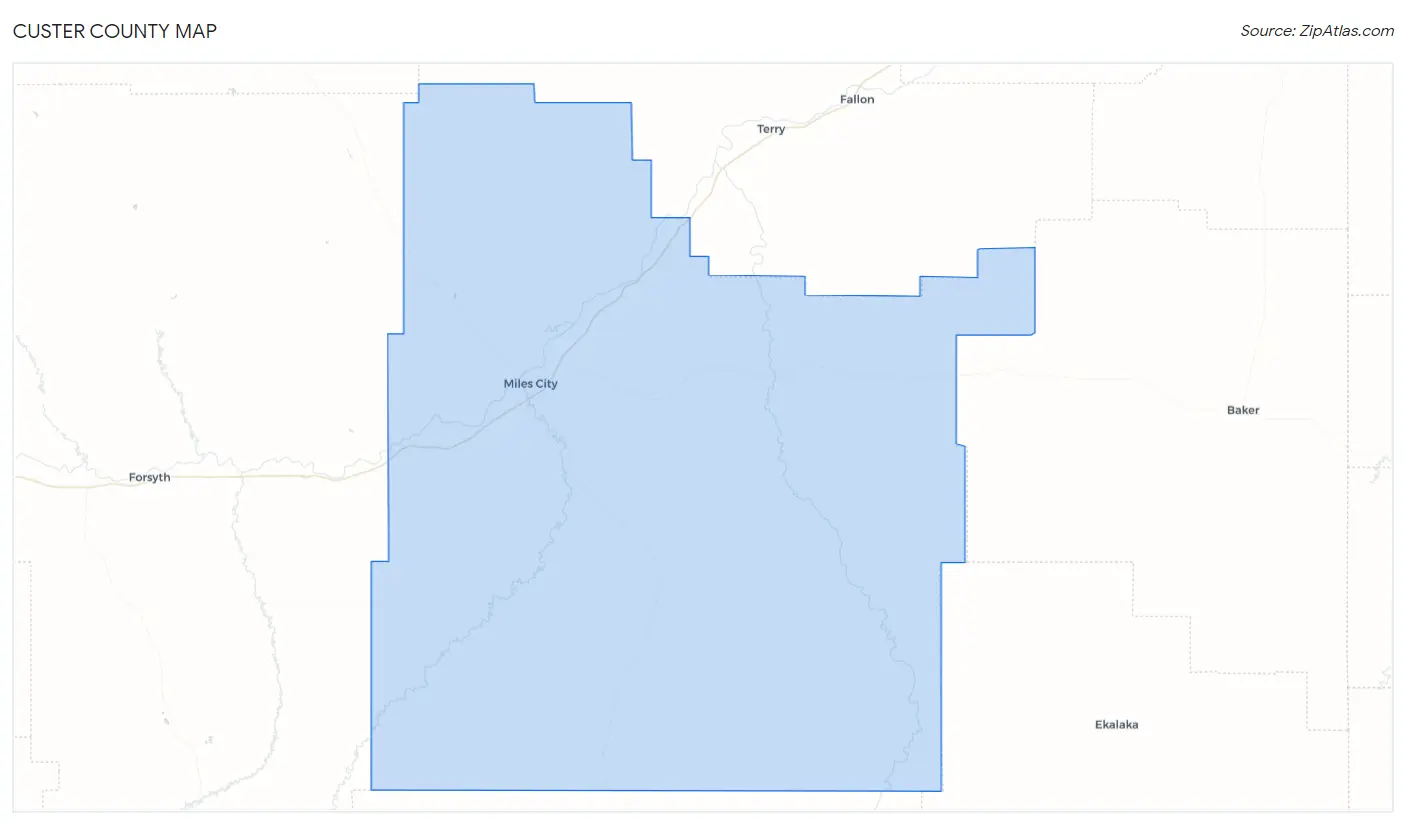
Custer County Map
Custer County Overview
$34,830
PER CAPITA INCOME
$81,549
AVG FAMILY INCOME
$61,114
AVG HOUSEHOLD INCOME
22.4%
WAGE / INCOME GAP [ % ]
77.6¢/ $1
WAGE / INCOME GAP [ $ ]
0.44
INEQUALITY / GINI INDEX
11,957
TOTAL POPULATION
6,024
MALE POPULATION
5,933
FEMALE POPULATION
101.53
MALES / 100 FEMALES
98.49
FEMALES / 100 MALES
42.8
MEDIAN AGE
2.9
AVG FAMILY SIZE
2.3
AVG HOUSEHOLD SIZE
6,464
LABOR FORCE [ PEOPLE ]
65.2%
PERCENT IN LABOR FORCE
3.3%
UNEMPLOYMENT RATE
Custer County Area Codes
Income in Custer County
Income Overview in Custer County
Per Capita Income in Custer County is $34,830, while median incomes of families and households are $81,549 and $61,114 respectively.
| Characteristic | Number | Measure |
| Per Capita Income | 11,957 | $34,830 |
| Median Family Income | 3,063 | $81,549 |
| Mean Family Income | 3,063 | $100,627 |
| Median Household Income | 4,996 | $61,114 |
| Mean Household Income | 4,996 | $82,231 |
| Income Deficit | 3,063 | $0 |
| Wage / Income Gap (%) | 11,957 | 22.44% |
| Wage / Income Gap ($) | 11,957 | 77.56¢ per $1 |
| Gini / Inequality Index | 11,957 | 0.44 |
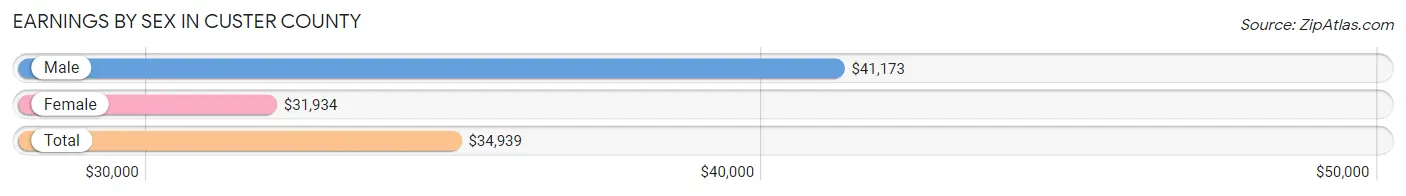
Earnings by Sex in Custer County
Average Earnings in Custer County are $34,939, $41,173 for men and $31,934 for women, a difference of 22.4%.
| Sex | Number | Average Earnings |
| Male | 3,719 (53.3%) | $41,173 |
| Female | 3,252 (46.7%) | $31,934 |
| Total | 6,971 (100.0%) | $34,939 |
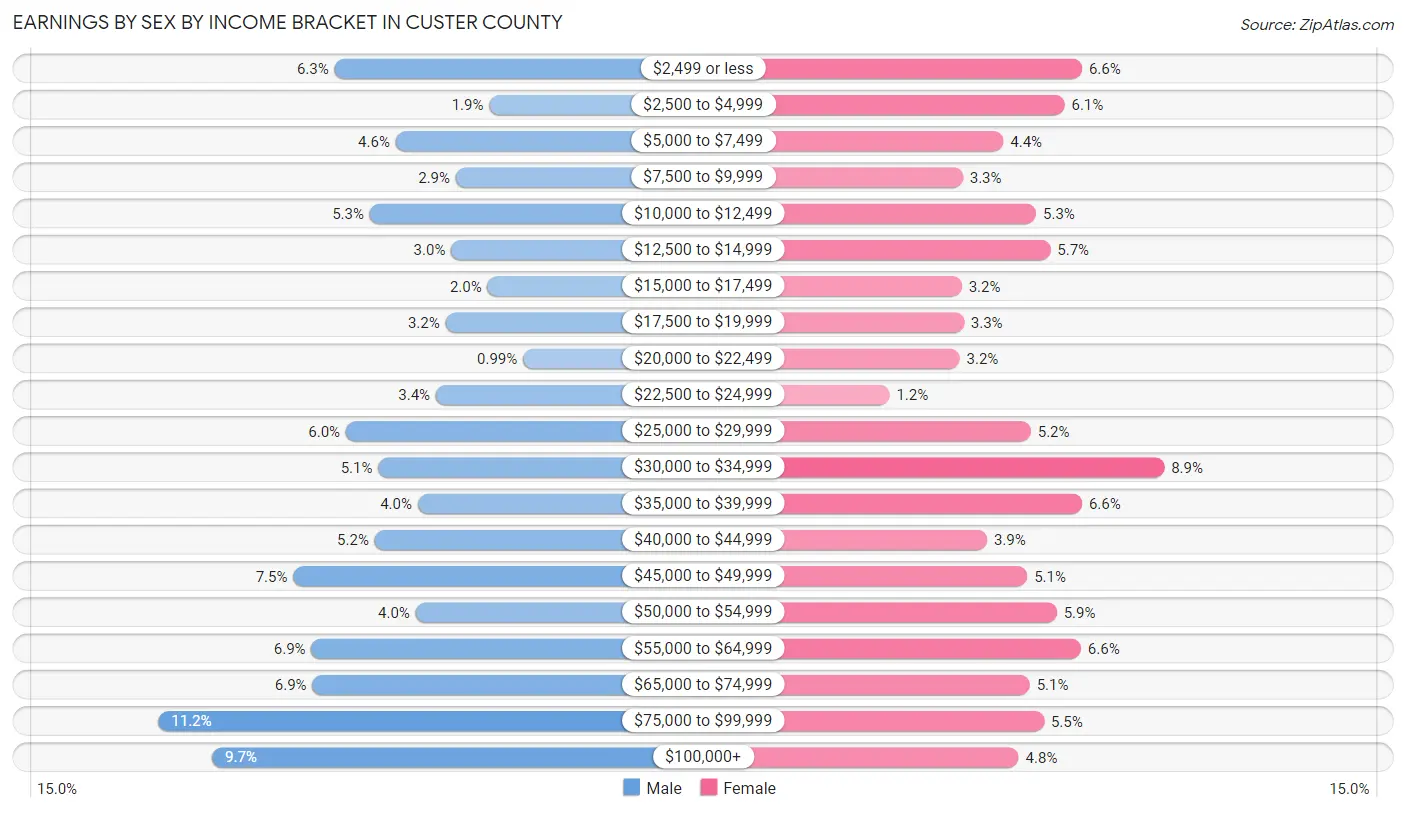
Earnings by Sex by Income Bracket in Custer County
The most common earnings brackets in Custer County are $75,000 to $99,999 for men (418 | 11.2%) and $30,000 to $34,999 for women (290 | 8.9%).
| Income | Male | Female |
| $2,499 or less | 234 (6.3%) | 215 (6.6%) |
| $2,500 to $4,999 | 72 (1.9%) | 199 (6.1%) |
| $5,000 to $7,499 | 170 (4.6%) | 143 (4.4%) |
| $7,500 to $9,999 | 107 (2.9%) | 106 (3.3%) |
| $10,000 to $12,499 | 197 (5.3%) | 173 (5.3%) |
| $12,500 to $14,999 | 112 (3.0%) | 186 (5.7%) |
| $15,000 to $17,499 | 74 (2.0%) | 105 (3.2%) |
| $17,500 to $19,999 | 118 (3.2%) | 107 (3.3%) |
| $20,000 to $22,499 | 37 (1.0%) | 103 (3.2%) |
| $22,500 to $24,999 | 128 (3.4%) | 39 (1.2%) |
| $25,000 to $29,999 | 222 (6.0%) | 168 (5.2%) |
| $30,000 to $34,999 | 188 (5.1%) | 290 (8.9%) |
| $35,000 to $39,999 | 147 (4.0%) | 215 (6.6%) |
| $40,000 to $44,999 | 192 (5.2%) | 128 (3.9%) |
| $45,000 to $49,999 | 277 (7.4%) | 165 (5.1%) |
| $50,000 to $54,999 | 149 (4.0%) | 192 (5.9%) |
| $55,000 to $64,999 | 258 (6.9%) | 214 (6.6%) |
| $65,000 to $74,999 | 257 (6.9%) | 167 (5.1%) |
| $75,000 to $99,999 | 418 (11.2%) | 180 (5.5%) |
| $100,000+ | 362 (9.7%) | 157 (4.8%) |
| Total | 3,719 (100.0%) | 3,252 (100.0%) |
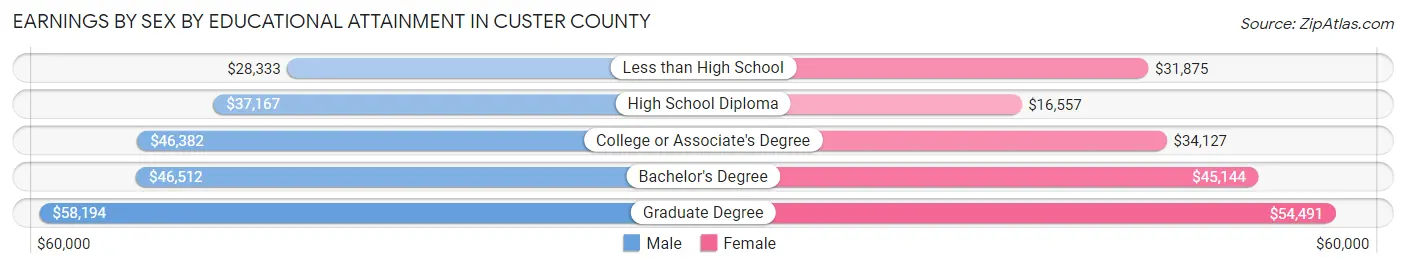
Earnings by Sex by Educational Attainment in Custer County
Average earnings in Custer County are $45,665 for men and $34,819 for women, a difference of 23.7%. Men with an educational attainment of graduate degree enjoy the highest average annual earnings of $58,194, while those with less than high school education earn the least with $28,333. Women with an educational attainment of graduate degree earn the most with the average annual earnings of $54,491, while those with high school diploma education have the smallest earnings of $16,557.
| Educational Attainment | Male Income | Female Income |
| Less than High School | $28,333 | $31,875 |
| High School Diploma | $37,167 | $16,557 |
| College or Associate's Degree | $46,382 | $34,127 |
| Bachelor's Degree | $46,512 | $45,144 |
| Graduate Degree | $58,194 | $54,491 |
| Total | $45,665 | $34,819 |
Family Income in Custer County
Family Income Brackets in Custer County
According to the Custer County family income data, there are 677 families falling into the $100,000 to $149,999 income range, which is the most common income bracket and makes up 22.1% of all families. Conversely, the less than $10,000 income bracket is the least frequent group with only 64 families (2.1%) belonging to this category.
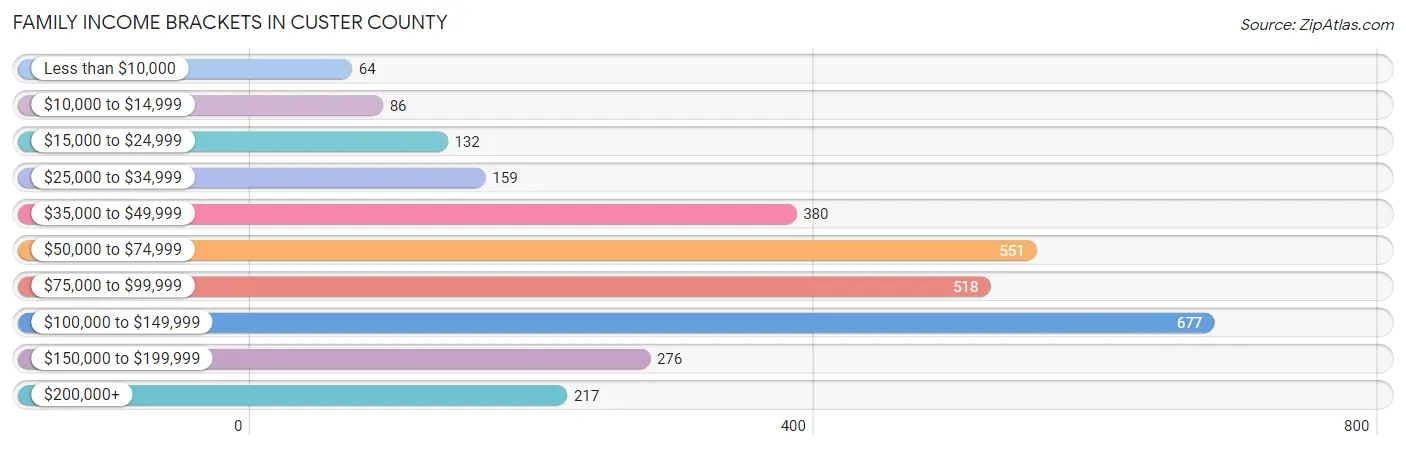
| Income Bracket | # Families | % Families |
| Less than $10,000 | 64 | 2.1% |
| $10,000 to $14,999 | 86 | 2.8% |
| $15,000 to $24,999 | 132 | 4.3% |
| $25,000 to $34,999 | 159 | 5.2% |
| $35,000 to $49,999 | 380 | 12.4% |
| $50,000 to $74,999 | 551 | 18.0% |
| $75,000 to $99,999 | 518 | 16.9% |
| $100,000 to $149,999 | 677 | 22.1% |
| $150,000 to $199,999 | 276 | 9.0% |
| $200,000+ | 217 | 7.1% |
Family Income by Famaliy Size in Custer County
4-person families (531 | 17.3%) account for the highest median family income in Custer County with $117,793 per family, while 2-person families (1,612 | 52.6%) have the highest median income of $33,442 per family member.
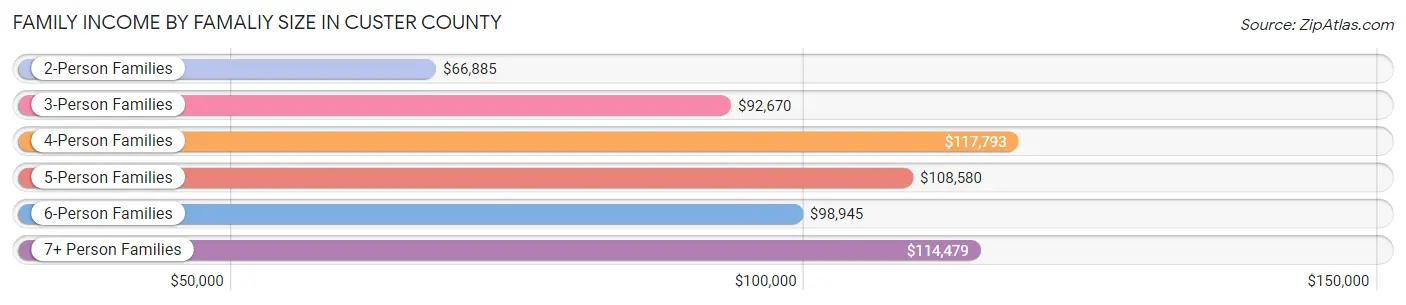
| Income Bracket | # Families | Median Income |
| 2-Person Families | 1,612 (52.6%) | $66,885 |
| 3-Person Families | 551 (18.0%) | $92,670 |
| 4-Person Families | 531 (17.3%) | $117,793 |
| 5-Person Families | 155 (5.1%) | $108,580 |
| 6-Person Families | 155 (5.1%) | $98,945 |
| 7+ Person Families | 59 (1.9%) | $114,479 |
| Total | 3,063 (100.0%) | $81,549 |
Family Income by Number of Earners in Custer County
The median family income in Custer County is $81,549, with families comprising 3+ earners (504) having the highest median family income of $129,063, while families with no earners (274) have the lowest median family income of $44,286, accounting for 16.5% and 8.9% of families, respectively.
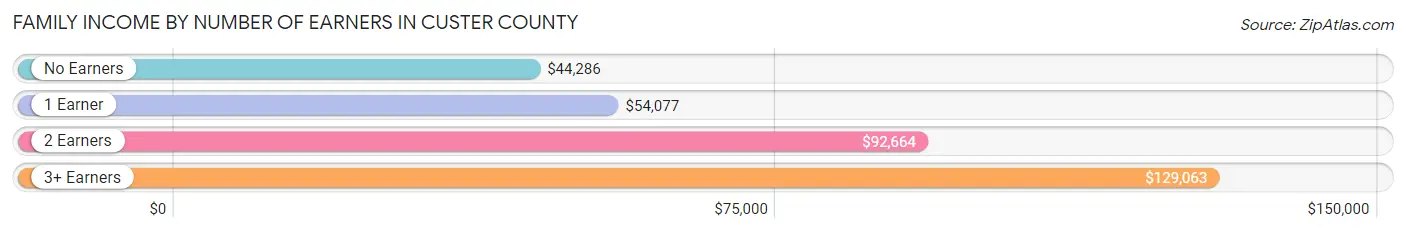
| Number of Earners | # Families | Median Income |
| No Earners | 274 (8.9%) | $44,286 |
| 1 Earner | 1,028 (33.6%) | $54,077 |
| 2 Earners | 1,257 (41.0%) | $92,664 |
| 3+ Earners | 504 (16.5%) | $129,063 |
| Total | 3,063 (100.0%) | $81,549 |
Household Income in Custer County
Household Income Brackets in Custer County
With 829 households falling in the category, the $100,000 to $149,999 income range is the most frequent in Custer County, accounting for 16.6% of all households. In contrast, only 245 households (4.9%) fall into the $200,000+ income bracket, making it the least populous group.
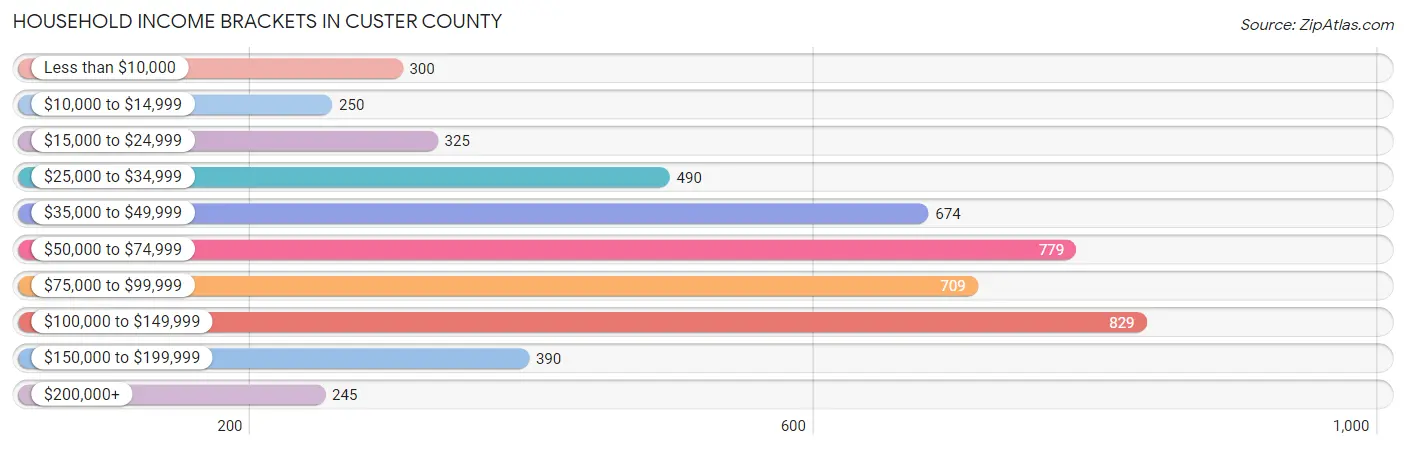
| Income Bracket | # Households | % Households |
| Less than $10,000 | 300 | 6.0% |
| $10,000 to $14,999 | 250 | 5.0% |
| $15,000 to $24,999 | 325 | 6.5% |
| $25,000 to $34,999 | 490 | 9.8% |
| $35,000 to $49,999 | 674 | 13.5% |
| $50,000 to $74,999 | 779 | 15.6% |
| $75,000 to $99,999 | 709 | 14.2% |
| $100,000 to $149,999 | 829 | 16.6% |
| $150,000 to $199,999 | 390 | 7.8% |
| $200,000+ | 245 | 4.9% |
Household Income by Householder Age in Custer County
The median household income in Custer County is $61,114, with the highest median household income of $81,436 found in the 45 to 64 years age bracket for the primary householder. A total of 1,694 households (33.9%) fall into this category. Meanwhile, the 15 to 24 years age bracket for the primary householder has the lowest median household income of $46,944, with 204 households (4.1%) in this group.
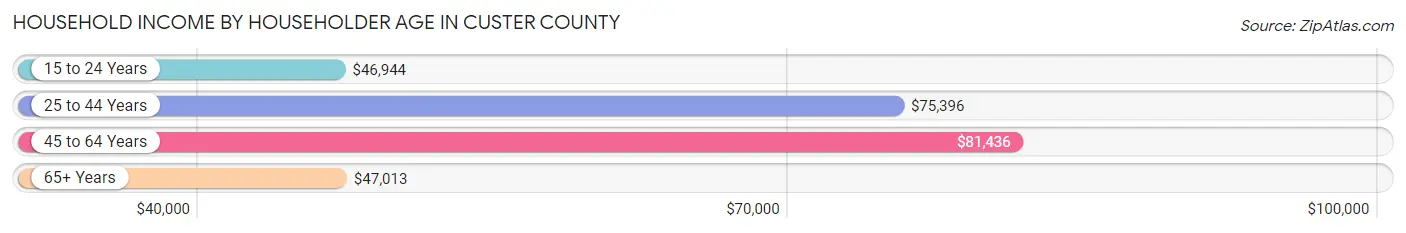
| Income Bracket | # Households | Median Income |
| 15 to 24 Years | 204 (4.1%) | $46,944 |
| 25 to 44 Years | 1,563 (31.3%) | $75,396 |
| 45 to 64 Years | 1,694 (33.9%) | $81,436 |
| 65+ Years | 1,535 (30.7%) | $47,013 |
| Total | 4,996 (100.0%) | $61,114 |
Poverty in Custer County
Income Below Poverty by Sex and Age in Custer County
With 11.7% poverty level for males and 10.5% for females among the residents of Custer County, 18 to 24 year old males and 15 year old females are the most vulnerable to poverty, with 124 males (22.6%) and 14 females (21.9%) in their respective age groups living below the poverty level.
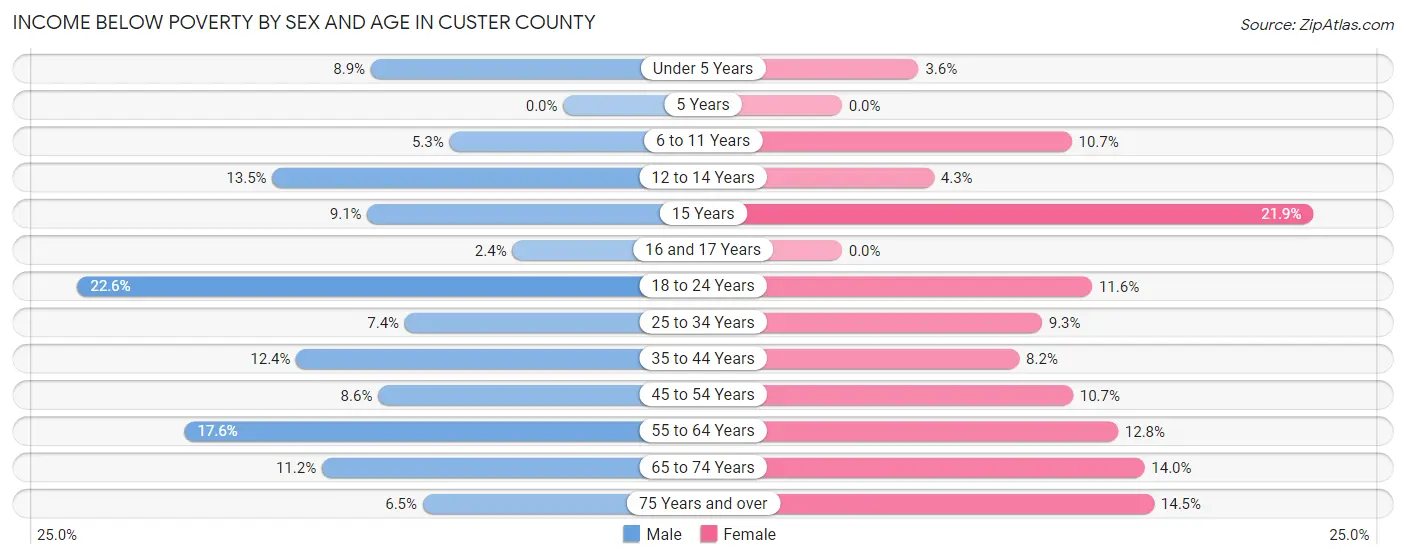
| Age Bracket | Male | Female |
| Under 5 Years | 25 (8.9%) | 10 (3.6%) |
| 5 Years | 0 (0.0%) | 0 (0.0%) |
| 6 to 11 Years | 22 (5.3%) | 34 (10.7%) |
| 12 to 14 Years | 32 (13.5%) | 9 (4.3%) |
| 15 Years | 5 (9.1%) | 14 (21.9%) |
| 16 and 17 Years | 3 (2.4%) | 0 (0.0%) |
| 18 to 24 Years | 124 (22.6%) | 39 (11.6%) |
| 25 to 34 Years | 51 (7.3%) | 62 (9.3%) |
| 35 to 44 Years | 101 (12.4%) | 57 (8.2%) |
| 45 to 54 Years | 55 (8.6%) | 77 (10.7%) |
| 55 to 64 Years | 164 (17.6%) | 119 (12.8%) |
| 65 to 74 Years | 71 (11.2%) | 106 (14.0%) |
| 75 Years and over | 26 (6.5%) | 75 (14.5%) |
| Total | 679 (11.7%) | 602 (10.5%) |
Income Above Poverty by Sex and Age in Custer County
According to the poverty statistics in Custer County, males aged 5 years and females aged 5 years are the age groups that are most secure financially, with 100.0% of males and 100.0% of females in these age groups living above the poverty line.
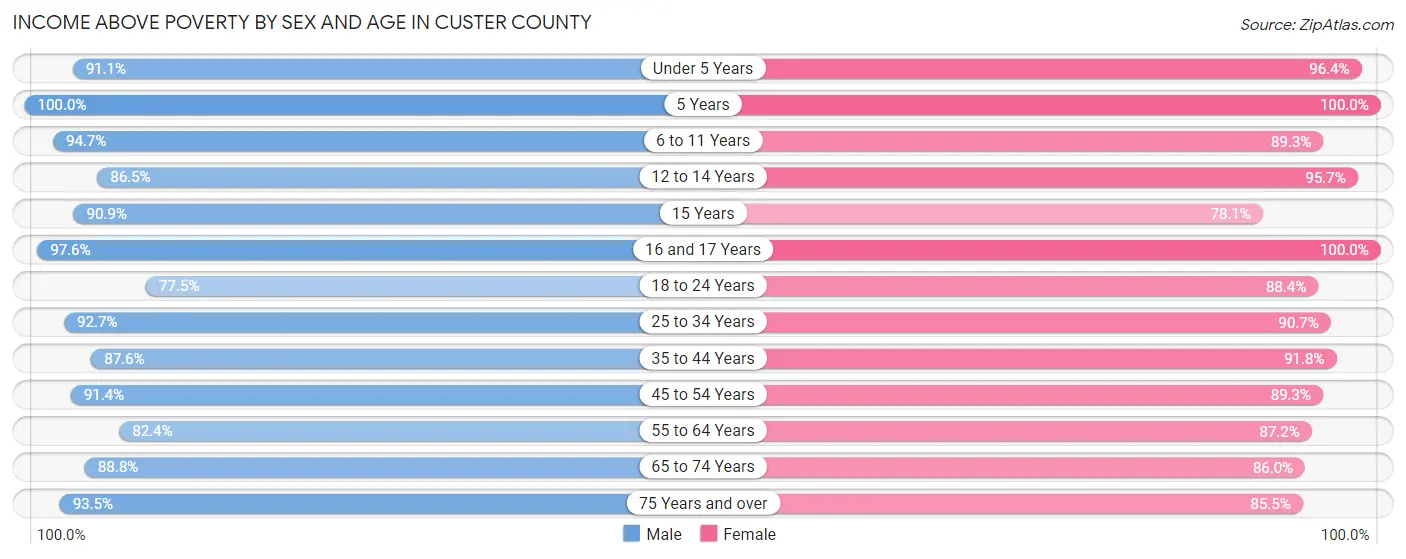
| Age Bracket | Male | Female |
| Under 5 Years | 255 (91.1%) | 271 (96.4%) |
| 5 Years | 22 (100.0%) | 74 (100.0%) |
| 6 to 11 Years | 395 (94.7%) | 285 (89.3%) |
| 12 to 14 Years | 205 (86.5%) | 202 (95.7%) |
| 15 Years | 50 (90.9%) | 50 (78.1%) |
| 16 and 17 Years | 124 (97.6%) | 164 (100.0%) |
| 18 to 24 Years | 426 (77.4%) | 297 (88.4%) |
| 25 to 34 Years | 643 (92.6%) | 606 (90.7%) |
| 35 to 44 Years | 714 (87.6%) | 636 (91.8%) |
| 45 to 54 Years | 585 (91.4%) | 641 (89.3%) |
| 55 to 64 Years | 769 (82.4%) | 810 (87.2%) |
| 65 to 74 Years | 563 (88.8%) | 649 (86.0%) |
| 75 Years and over | 373 (93.5%) | 443 (85.5%) |
| Total | 5,124 (88.3%) | 5,128 (89.5%) |
Income Below Poverty Among Married-Couple Families in Custer County
The poverty statistics for married-couple families in Custer County show that 5.5% or 139 of the total 2,509 families live below the poverty line. Families with 3 or 4 children have the highest poverty rate of 9.4%, comprising of 19 families. On the other hand, families with 5 or more children have the lowest poverty rate of 0.0%, which includes 0 families.
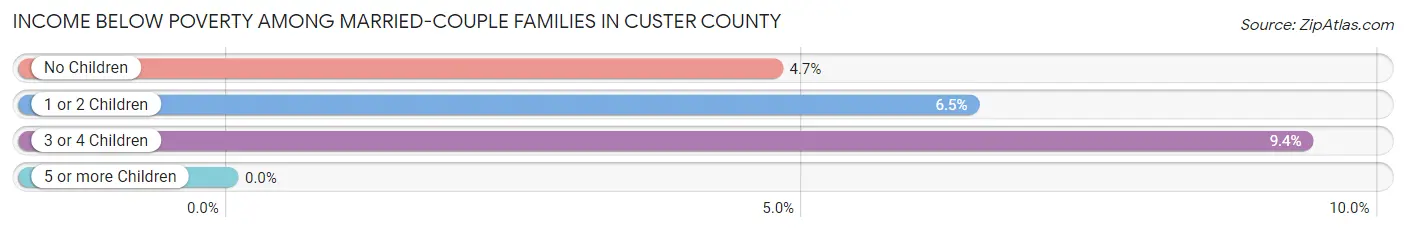
| Children | Above Poverty | Below Poverty |
| No Children | 1,448 (95.3%) | 72 (4.7%) |
| 1 or 2 Children | 696 (93.5%) | 48 (6.5%) |
| 3 or 4 Children | 184 (90.6%) | 19 (9.4%) |
| 5 or more Children | 42 (100.0%) | 0 (0.0%) |
| Total | 2,370 (94.5%) | 139 (5.5%) |
Income Below Poverty Among Single-Parent Households in Custer County
According to the poverty data in Custer County, 3.1% or 6 single-father households and 22.9% or 83 single-mother households are living below the poverty line. Among single-father households, those with 1 or 2 children have the highest poverty rate, with 6 households (5.7%) experiencing poverty. Likewise, among single-mother households, those with no children have the highest poverty rate, with 51 households (38.1%) falling below the poverty line.
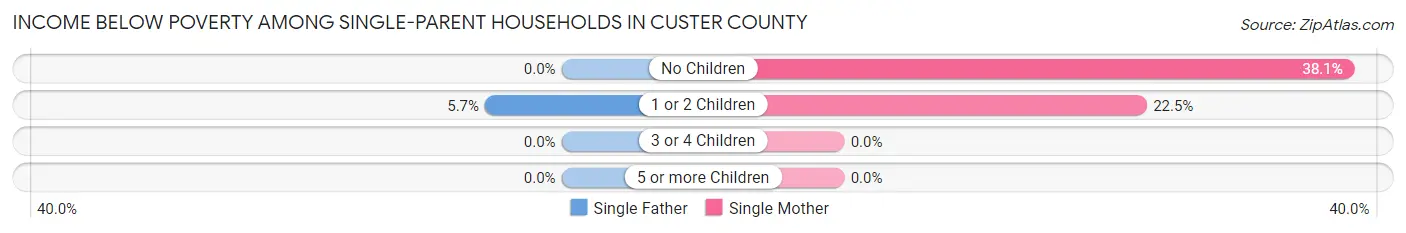
| Children | Single Father | Single Mother |
| No Children | 0 (0.0%) | 51 (38.1%) |
| 1 or 2 Children | 6 (5.7%) | 32 (22.5%) |
| 3 or 4 Children | 0 (0.0%) | 0 (0.0%) |
| 5 or more Children | 0 (0.0%) | 0 (0.0%) |
| Total | 6 (3.1%) | 83 (22.9%) |
Income Below Poverty Among Married-Couple vs Single-Parent Households in Custer County
The poverty data for Custer County shows that 139 of the married-couple family households (5.5%) and 89 of the single-parent households (16.1%) are living below the poverty level. Within the married-couple family households, those with 3 or 4 children have the highest poverty rate, with 19 households (9.4%) falling below the poverty line. Among the single-parent households, those with no children have the highest poverty rate, with 51 household (24.6%) living below poverty.
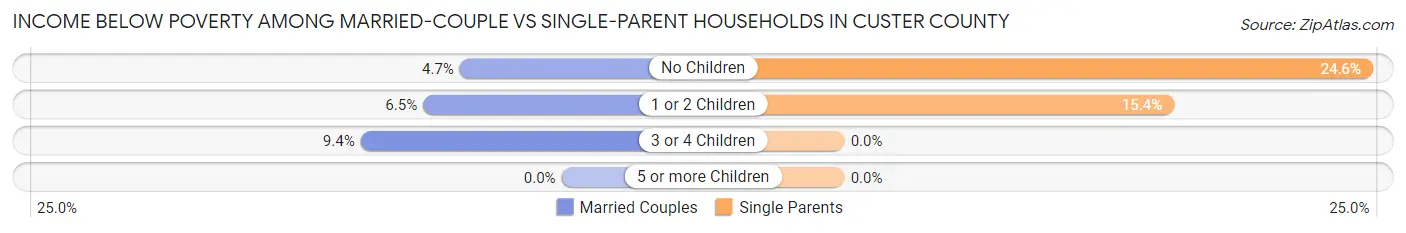
| Children | Married-Couple Families | Single-Parent Households |
| No Children | 72 (4.7%) | 51 (24.6%) |
| 1 or 2 Children | 48 (6.5%) | 38 (15.4%) |
| 3 or 4 Children | 19 (9.4%) | 0 (0.0%) |
| 5 or more Children | 0 (0.0%) | 0 (0.0%) |
| Total | 139 (5.5%) | 89 (16.1%) |
Race in Custer County
The most populous races in Custer County are White / Caucasian (10,934 | 91.4%), Two or more Races (662 | 5.5%), and Hispanic or Latino (430 | 3.6%).
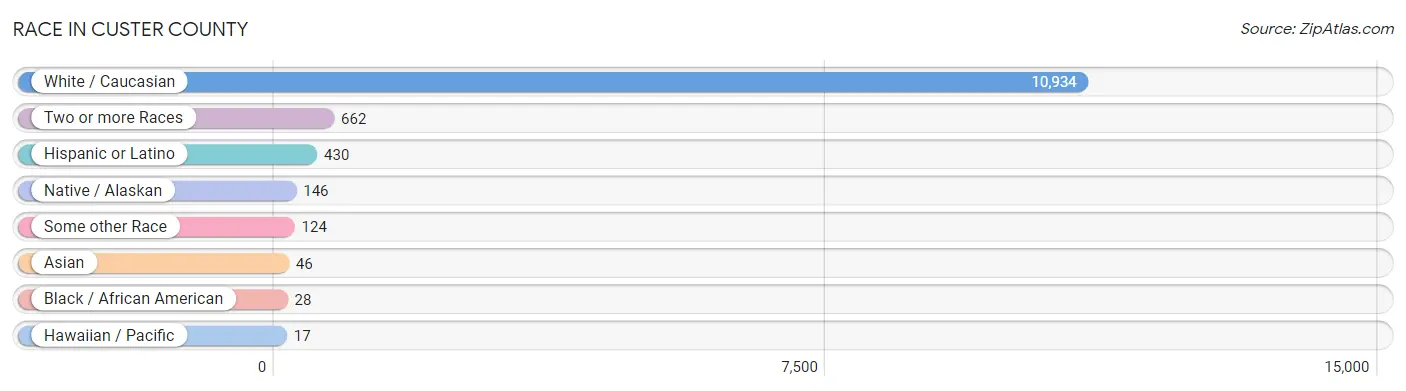
| Race | # Population | % Population |
| Asian | 46 | 0.4% |
| Black / African American | 28 | 0.2% |
| Hawaiian / Pacific | 17 | 0.1% |
| Hispanic or Latino | 430 | 3.6% |
| Native / Alaskan | 146 | 1.2% |
| White / Caucasian | 10,934 | 91.4% |
| Two or more Races | 662 | 5.5% |
| Some other Race | 124 | 1.0% |
| Total | 11,957 | 100.0% |
Ancestry in Custer County
The most populous ancestries reported in Custer County are German (3,397 | 28.4%), Irish (1,650 | 13.8%), English (1,265 | 10.6%), Norwegian (1,095 | 9.2%), and French (522 | 4.4%), together accounting for 66.3% of all Custer County residents.
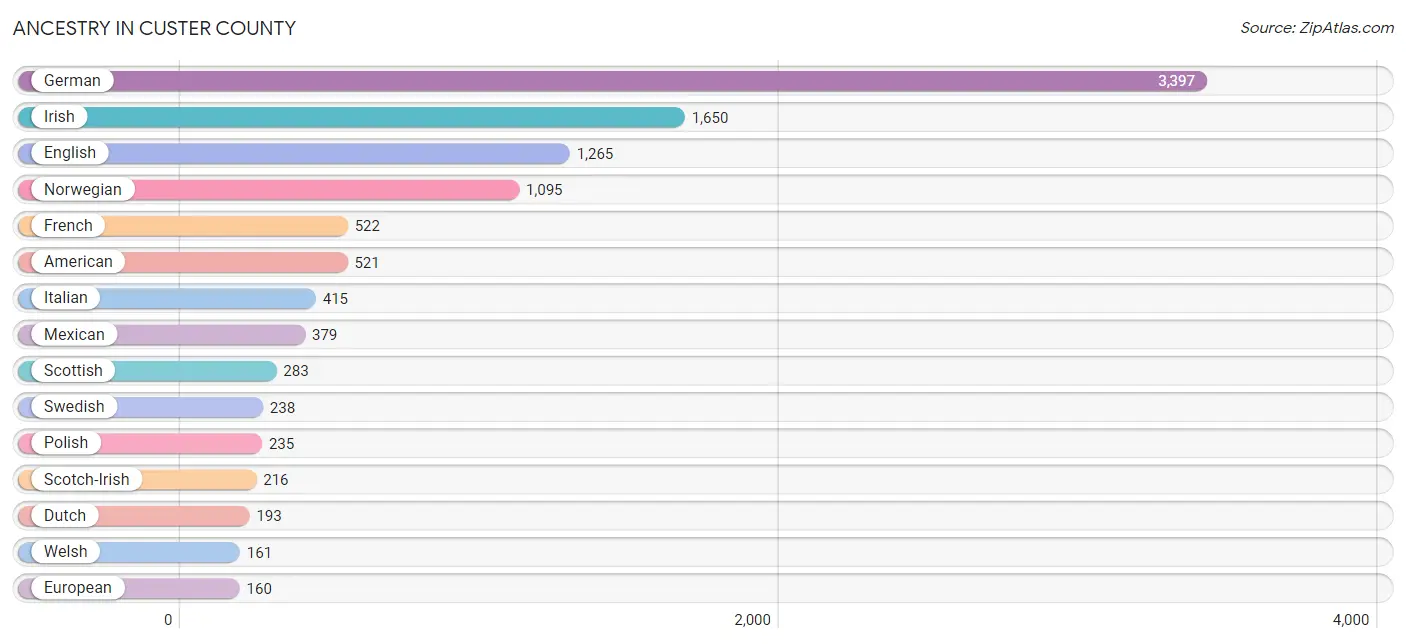
| Ancestry | # Population | % Population |
| African | 28 | 0.2% |
| American | 521 | 4.4% |
| Armenian | 20 | 0.2% |
| Assyrian / Chaldean / Syriac | 6 | 0.1% |
| Austrian | 38 | 0.3% |
| Basque | 9 | 0.1% |
| Belgian | 4 | 0.0% |
| Bhutanese | 66 | 0.5% |
| Blackfeet | 19 | 0.2% |
| British | 42 | 0.4% |
| Bulgarian | 6 | 0.1% |
| Burmese | 2 | 0.0% |
| Canadian | 12 | 0.1% |
| Central American | 19 | 0.2% |
| Cherokee | 69 | 0.6% |
| Cheyenne | 91 | 0.8% |
| Chippewa | 39 | 0.3% |
| Choctaw | 3 | 0.0% |
| Cree | 26 | 0.2% |
| Croatian | 20 | 0.2% |
| Crow | 4 | 0.0% |
| Czech | 133 | 1.1% |
| Danish | 142 | 1.2% |
| Dominican | 8 | 0.1% |
| Dutch | 193 | 1.6% |
| English | 1,265 | 10.6% |
| European | 160 | 1.3% |
| Finnish | 78 | 0.6% |
| French | 522 | 4.4% |
| French Canadian | 100 | 0.8% |
| German | 3,397 | 28.4% |
| Greek | 10 | 0.1% |
| Guatemalan | 19 | 0.2% |
| Hungarian | 85 | 0.7% |
| Indian (Asian) | 17 | 0.1% |
| Iranian | 3 | 0.0% |
| Irish | 1,650 | 13.8% |
| Italian | 415 | 3.5% |
| Korean | 9 | 0.1% |
| Mexican | 379 | 3.2% |
| Native Hawaiian | 4 | 0.0% |
| Northern European | 29 | 0.2% |
| Norwegian | 1,095 | 9.2% |
| Pennsylvania German | 2 | 0.0% |
| Polish | 235 | 2.0% |
| Portuguese | 28 | 0.2% |
| Potawatomi | 7 | 0.1% |
| Russian | 131 | 1.1% |
| Samoan | 13 | 0.1% |
| Scandinavian | 44 | 0.4% |
| Scotch-Irish | 216 | 1.8% |
| Scottish | 283 | 2.4% |
| Shoshone | 21 | 0.2% |
| Sioux | 72 | 0.6% |
| Slavic | 11 | 0.1% |
| Slovak | 7 | 0.1% |
| South African | 11 | 0.1% |
| Spaniard | 5 | 0.0% |
| Spanish | 11 | 0.1% |
| Sri Lankan | 34 | 0.3% |
| Subsaharan African | 39 | 0.3% |
| Swedish | 238 | 2.0% |
| Swiss | 72 | 0.6% |
| Ukrainian | 15 | 0.1% |
| Welsh | 161 | 1.3% |
| Yugoslavian | 60 | 0.5% | View All 66 Rows |
Immigrants in Custer County
The most numerous immigrant groups reported in Custer County came from Asia (81 | 0.7%), Europe (65 | 0.5%), Africa (39 | 0.3%), Eastern Europe (39 | 0.3%), and Eastern Asia (31 | 0.3%), together accounting for 2.1% of all Custer County residents.
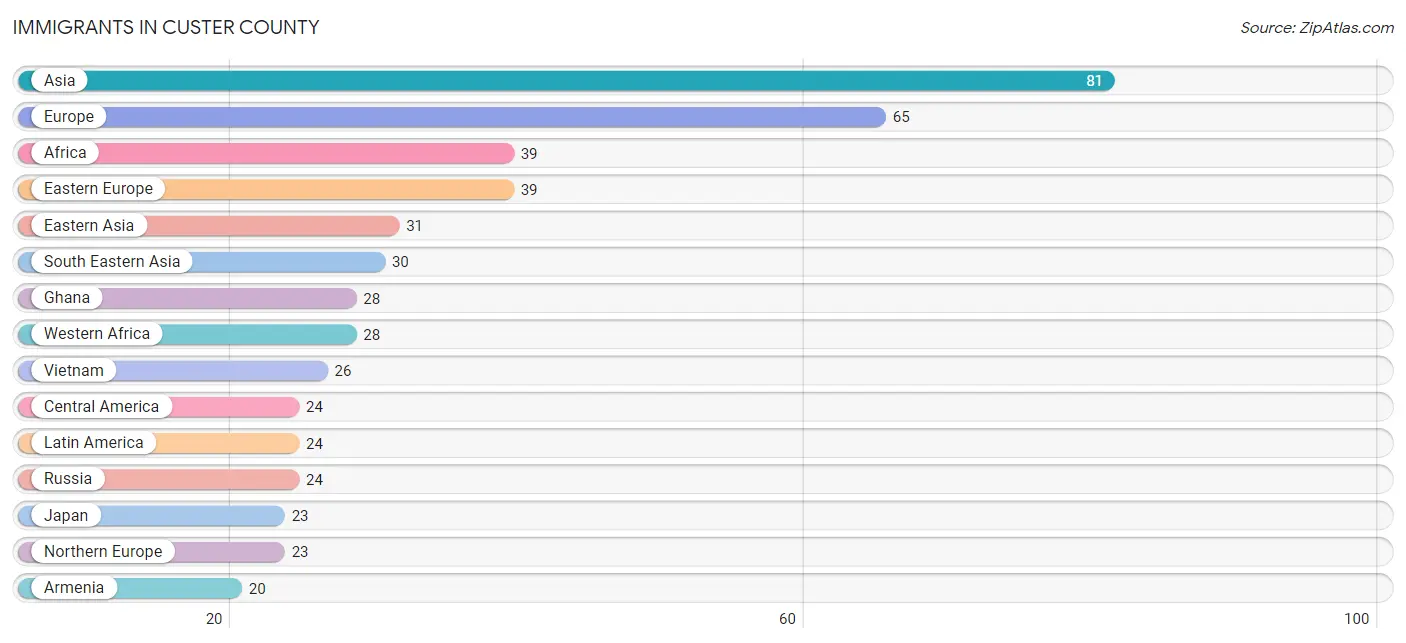
| Immigration Origin | # Population | % Population |
| Africa | 39 | 0.3% |
| Armenia | 20 | 0.2% |
| Asia | 81 | 0.7% |
| Australia | 3 | 0.0% |
| Canada | 13 | 0.1% |
| Central America | 24 | 0.2% |
| China | 6 | 0.1% |
| Eastern Asia | 31 | 0.3% |
| Eastern Europe | 39 | 0.3% |
| England | 4 | 0.0% |
| Europe | 65 | 0.5% |
| Germany | 3 | 0.0% |
| Ghana | 28 | 0.2% |
| Guatemala | 19 | 0.2% |
| Japan | 23 | 0.2% |
| Korea | 2 | 0.0% |
| Latin America | 24 | 0.2% |
| Mexico | 5 | 0.0% |
| Northern Europe | 23 | 0.2% |
| Norway | 2 | 0.0% |
| Oceania | 3 | 0.0% |
| Philippines | 4 | 0.0% |
| Poland | 15 | 0.1% |
| Russia | 24 | 0.2% |
| South Africa | 11 | 0.1% |
| South Eastern Asia | 30 | 0.3% |
| Vietnam | 26 | 0.2% |
| Western Africa | 28 | 0.2% |
| Western Asia | 20 | 0.2% |
| Western Europe | 3 | 0.0% | View All 30 Rows |
Sex and Age in Custer County
Sex and Age in Custer County
The most populous age groups in Custer County are 60 to 64 Years (494 | 8.2%) for men and 60 to 64 Years (482 | 8.1%) for women.
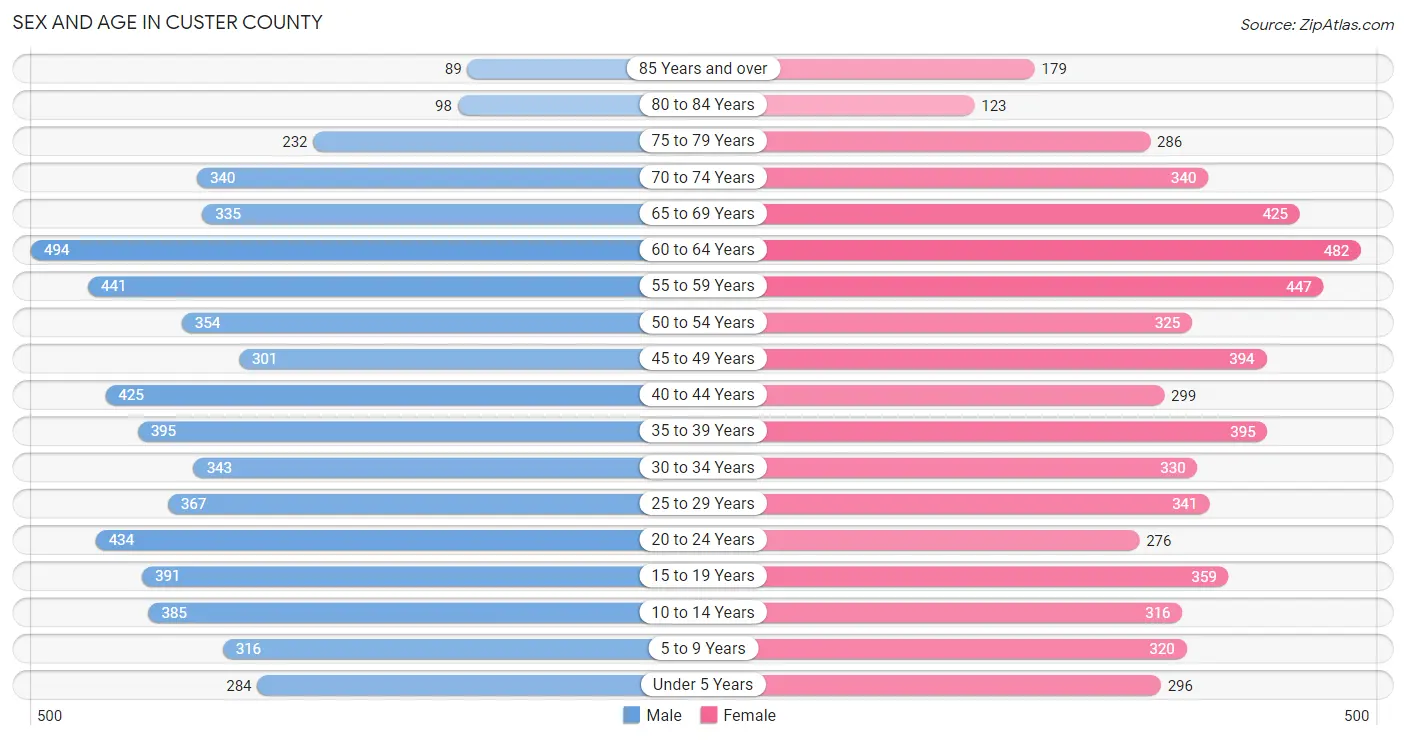
| Age Bracket | Male | Female |
| Under 5 Years | 284 (4.7%) | 296 (5.0%) |
| 5 to 9 Years | 316 (5.2%) | 320 (5.4%) |
| 10 to 14 Years | 385 (6.4%) | 316 (5.3%) |
| 15 to 19 Years | 391 (6.5%) | 359 (6.0%) |
| 20 to 24 Years | 434 (7.2%) | 276 (4.6%) |
| 25 to 29 Years | 367 (6.1%) | 341 (5.8%) |
| 30 to 34 Years | 343 (5.7%) | 330 (5.6%) |
| 35 to 39 Years | 395 (6.6%) | 395 (6.7%) |
| 40 to 44 Years | 425 (7.1%) | 299 (5.0%) |
| 45 to 49 Years | 301 (5.0%) | 394 (6.6%) |
| 50 to 54 Years | 354 (5.9%) | 325 (5.5%) |
| 55 to 59 Years | 441 (7.3%) | 447 (7.5%) |
| 60 to 64 Years | 494 (8.2%) | 482 (8.1%) |
| 65 to 69 Years | 335 (5.6%) | 425 (7.2%) |
| 70 to 74 Years | 340 (5.6%) | 340 (5.7%) |
| 75 to 79 Years | 232 (3.8%) | 286 (4.8%) |
| 80 to 84 Years | 98 (1.6%) | 123 (2.1%) |
| 85 Years and over | 89 (1.5%) | 179 (3.0%) |
| Total | 6,024 (100.0%) | 5,933 (100.0%) |
Families and Households in Custer County
Median Family Size in Custer County
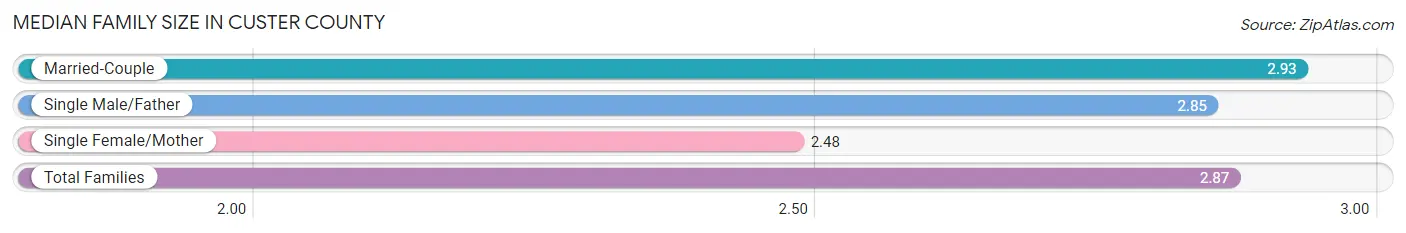
The median family size in Custer County is 2.87 persons per family, with married-couple families (2,509 | 81.9%) accounting for the largest median family size of 2.93 persons per family. On the other hand, single female/mother families (363 | 11.8%) represent the smallest median family size with 2.48 persons per family.
| Family Type | # Families | Family Size |
| Married-Couple | 2,509 (81.9%) | 2.93 |
| Single Male/Father | 191 (6.2%) | 2.85 |
| Single Female/Mother | 363 (11.8%) | 2.48 |
| Total Families | 3,063 (100.0%) | 2.87 |
Median Household Size in Custer County
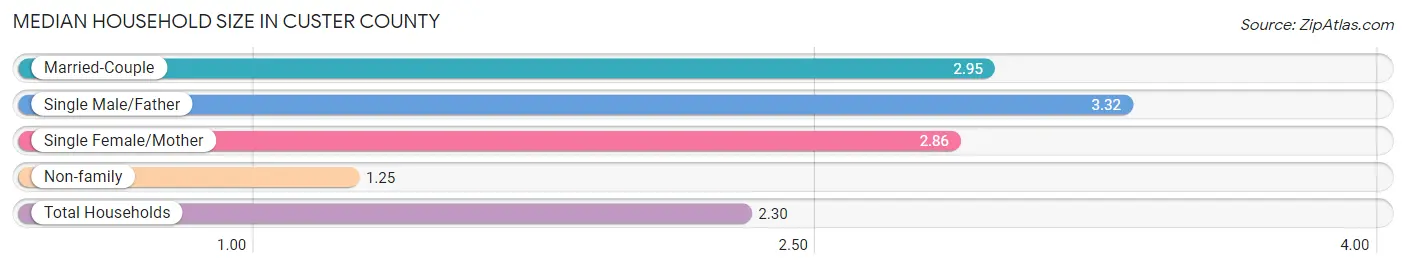
The median household size in Custer County is 2.30 persons per household, with single male/father households (191 | 3.8%) accounting for the largest median household size of 3.32 persons per household. non-family households (1,933 | 38.7%) represent the smallest median household size with 1.25 persons per household.
| Household Type | # Households | Household Size |
| Married-Couple | 2,509 (50.2%) | 2.95 |
| Single Male/Father | 191 (3.8%) | 3.32 |
| Single Female/Mother | 363 (7.3%) | 2.86 |
| Non-family | 1,933 (38.7%) | 1.25 |
| Total Households | 4,996 (100.0%) | 2.30 |
Household Size by Marriage Status in Custer County
Out of a total of 4,996 households in Custer County, 3,063 (61.3%) are family households, while 1,933 (38.7%) are nonfamily households. The most numerous type of family households are 2-person households, comprising 1,516, and the most common type of nonfamily households are 1-person households, comprising 1,605.
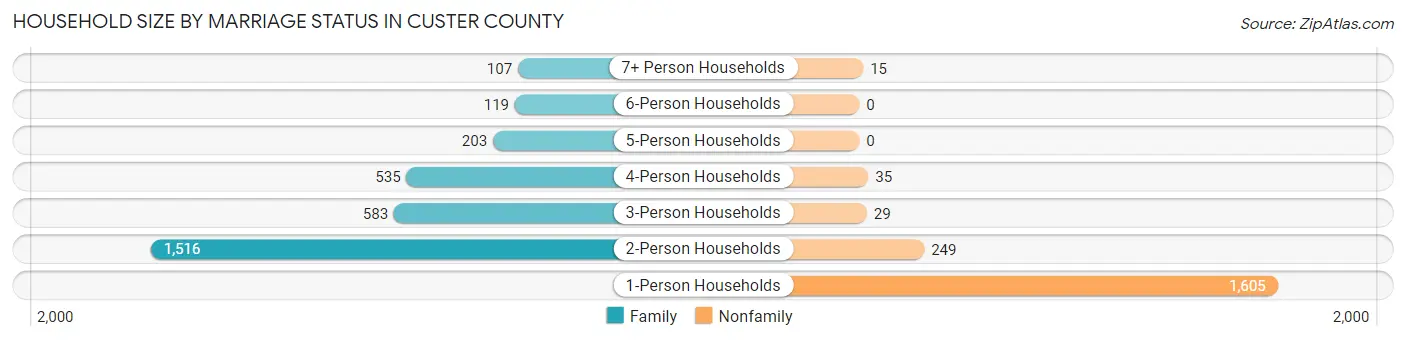
| Household Size | Family Households | Nonfamily Households |
| 1-Person Households | - | 1,605 (32.1%) |
| 2-Person Households | 1,516 (30.3%) | 249 (5.0%) |
| 3-Person Households | 583 (11.7%) | 29 (0.6%) |
| 4-Person Households | 535 (10.7%) | 35 (0.7%) |
| 5-Person Households | 203 (4.1%) | 0 (0.0%) |
| 6-Person Households | 119 (2.4%) | 0 (0.0%) |
| 7+ Person Households | 107 (2.1%) | 15 (0.3%) |
| Total | 3,063 (61.3%) | 1,933 (38.7%) |
Female Fertility in Custer County
Fertility by Age in Custer County
Average fertility rate in Custer County is 43.0 births per 1,000 women. Women in the age bracket of 20 to 34 years have the highest fertility rate with 65.0 births per 1,000 women. Women in the age bracket of 20 to 34 years acount for 59.1% of all women with births.
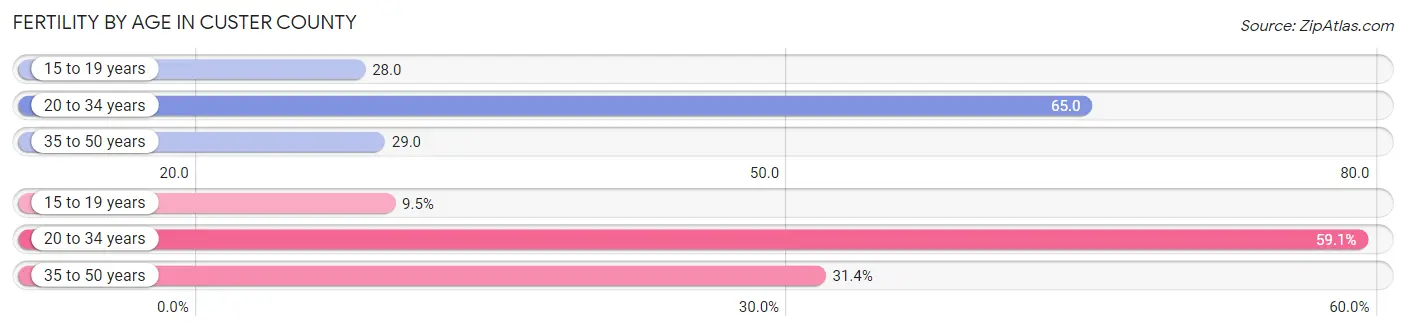
| Age Bracket | Women with Births | Births / 1,000 Women |
| 15 to 19 years | 10 (9.5%) | 28.0 |
| 20 to 34 years | 62 (59.1%) | 65.0 |
| 35 to 50 years | 33 (31.4%) | 29.0 |
| Total | 105 (100.0%) | 43.0 |
Fertility by Age by Marriage Status in Custer County
58.1% of women with births (105) in Custer County are married. The highest percentage of unmarried women with births falls into 15 to 19 years age bracket with 100.0% of them unmarried at the time of birth, while the lowest percentage of unmarried women with births belong to 35 to 50 years age bracket with 18.2% of them unmarried.
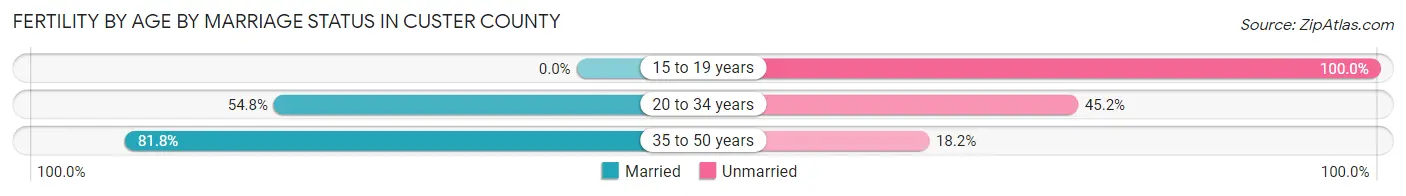
| Age Bracket | Married | Unmarried |
| 15 to 19 years | 0 (0.0%) | 10 (100.0%) |
| 20 to 34 years | 34 (54.8%) | 28 (45.2%) |
| 35 to 50 years | 27 (81.8%) | 6 (18.2%) |
| Total | 61 (58.1%) | 44 (41.9%) |
Fertility by Education in Custer County
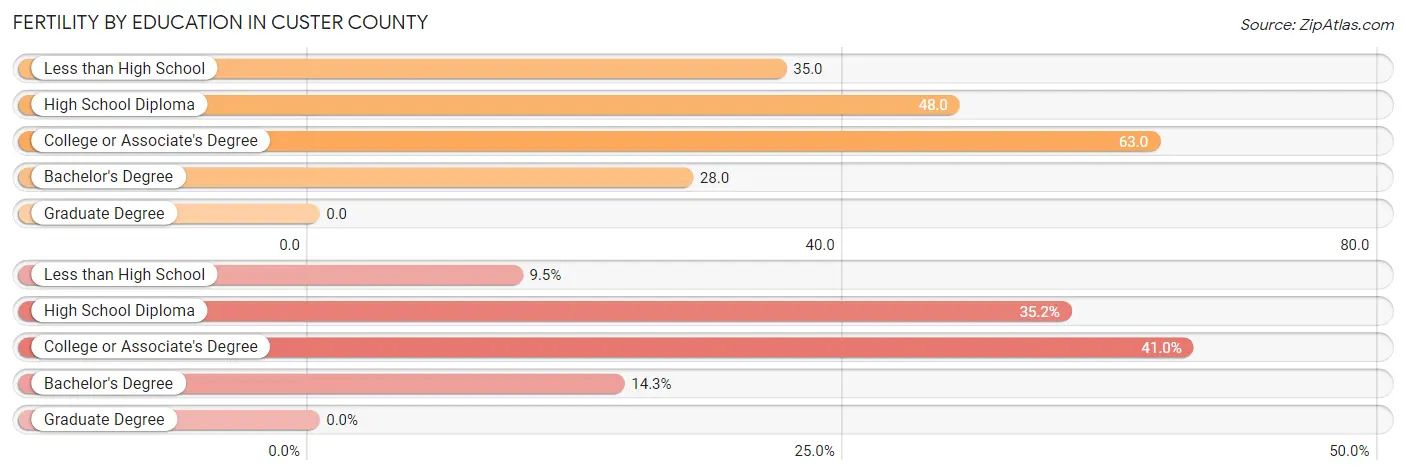
| Educational Attainment | Women with Births | Births / 1,000 Women |
| Less than High School | 10 (9.5%) | 35.0 |
| High School Diploma | 37 (35.2%) | 48.0 |
| College or Associate's Degree | 43 (40.9%) | 63.0 |
| Bachelor's Degree | 15 (14.3%) | 28.0 |
| Graduate Degree | 0 (0.0%) | 0.0 |
| Total | 105 (100.0%) | 43.0 |
Fertility by Education by Marriage Status in Custer County
41.9% of women with births in Custer County are unmarried. Women with the educational attainment of college or associate's degree are most likely to be married with 86.1% of them married at childbirth, while women with the educational attainment of less than high school are least likely to be married with 100.0% of them unmarried at childbirth.
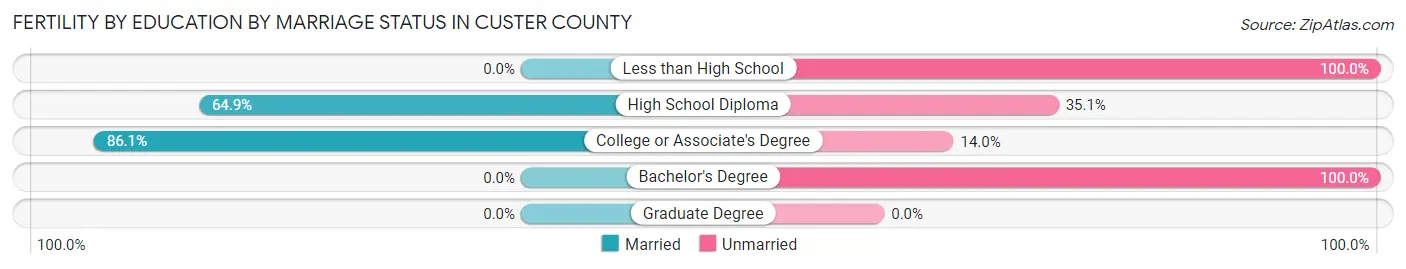
| Educational Attainment | Married | Unmarried |
| Less than High School | 0 (0.0%) | 10 (100.0%) |
| High School Diploma | 24 (64.9%) | 13 (35.1%) |
| College or Associate's Degree | 37 (86.1%) | 6 (14.0%) |
| Bachelor's Degree | 0 (0.0%) | 15 (100.0%) |
| Graduate Degree | 0 (0.0%) | 0 (0.0%) |
| Total | 61 (58.1%) | 44 (41.9%) |
Employment Characteristics in Custer County
Employment by Class of Employer in Custer County
Among the 6,150 employed individuals in Custer County, private company employees (3,550 | 57.7%), self-employed (not incorporated) (626 | 10.2%), and local government employees (561 | 9.1%) make up the most common classes of employment.
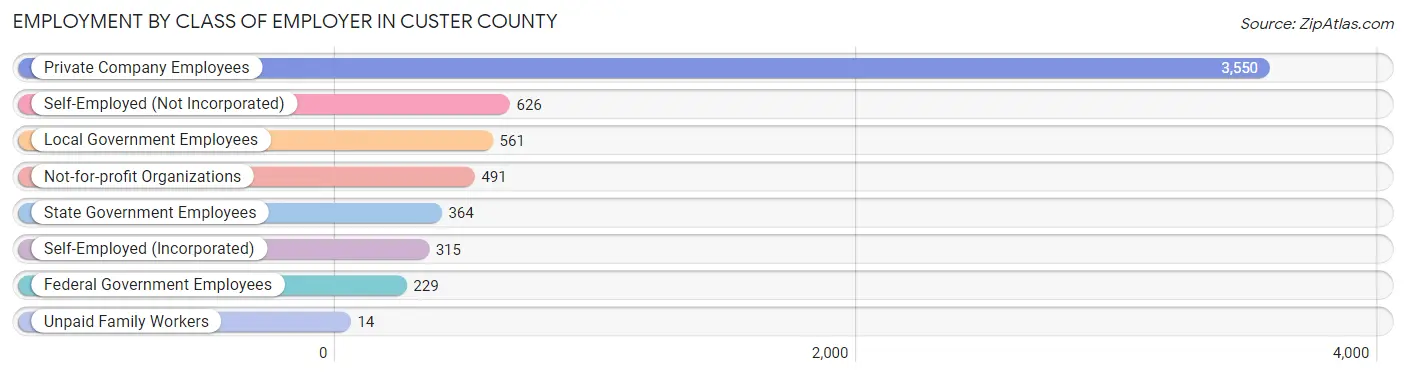
| Employer Class | # Employees | % Employees |
| Private Company Employees | 3,550 | 57.7% |
| Self-Employed (Incorporated) | 315 | 5.1% |
| Self-Employed (Not Incorporated) | 626 | 10.2% |
| Not-for-profit Organizations | 491 | 8.0% |
| Local Government Employees | 561 | 9.1% |
| State Government Employees | 364 | 5.9% |
| Federal Government Employees | 229 | 3.7% |
| Unpaid Family Workers | 14 | 0.2% |
| Total | 6,150 | 100.0% |
Employment Status by Age in Custer County
According to the labor force statistics for Custer County, out of the total population over 16 years of age (9,914), 65.2% or 6,464 individuals are in the labor force, with 3.3% or 213 of them unemployed. The age group with the highest labor force participation rate is 30 to 34 years, with 90.8% or 611 individuals in the labor force. Within the labor force, the 16 to 19 years age range has the highest percentage of unemployed individuals, with 16.0% or 60 of them being unemployed.
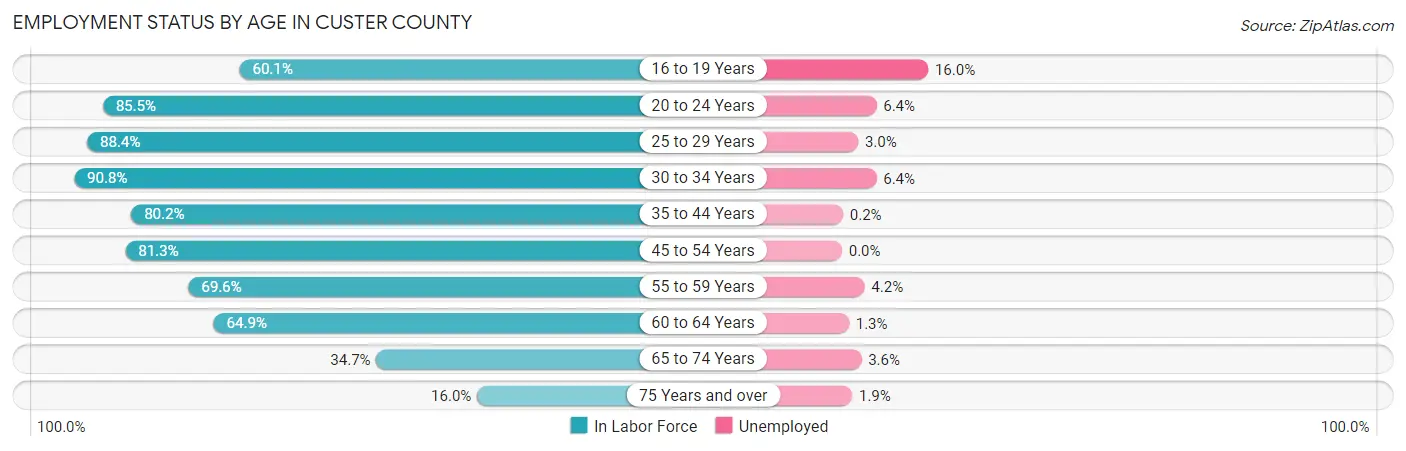
| Age Bracket | In Labor Force | Unemployed |
| 16 to 19 Years | 375 (60.1%) | 60 (16.0%) |
| 20 to 24 Years | 607 (85.5%) | 39 (6.4%) |
| 25 to 29 Years | 626 (88.4%) | 19 (3.0%) |
| 30 to 34 Years | 611 (90.8%) | 39 (6.4%) |
| 35 to 44 Years | 1,214 (80.2%) | 2 (0.2%) |
| 45 to 54 Years | 1,117 (81.3%) | 0 (0.0%) |
| 55 to 59 Years | 618 (69.6%) | 26 (4.2%) |
| 60 to 64 Years | 633 (64.9%) | 8 (1.3%) |
| 65 to 74 Years | 500 (34.7%) | 18 (3.6%) |
| 75 Years and over | 161 (16.0%) | 3 (1.9%) |
| Total | 6,464 (65.2%) | 213 (3.3%) |
Employment Status by Educational Attainment in Custer County
According to labor force statistics for Custer County, 78.6% of individuals (4,821) out of the total population between 25 and 64 years of age (6,133) are in the labor force, with 2.0% or 96 of them being unemployed. The group with the highest labor force participation rate are those with the educational attainment of bachelor's degree or higher, with 90.9% or 1,473 individuals in the labor force. Within the labor force, individuals with high school diploma education have the highest percentage of unemployment, with 2.9% or 38 of them being unemployed.
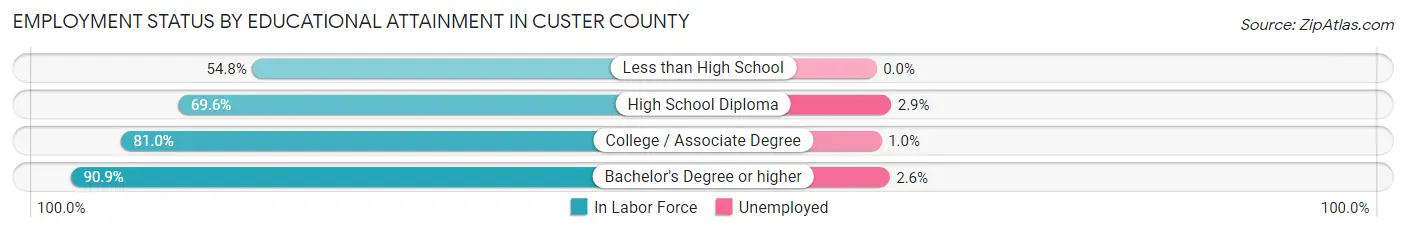
| Educational Attainment | In Labor Force | Unemployed |
| Less than High School | 193 (54.8%) | 0 (0.0%) |
| High School Diploma | 1,319 (69.6%) | 55 (2.9%) |
| College / Associate Degree | 1,835 (81.0%) | 23 (1.0%) |
| Bachelor's Degree or higher | 1,473 (90.9%) | 42 (2.6%) |
| Total | 4,821 (78.6%) | 123 (2.0%) |
Employment Occupations by Sex in Custer County
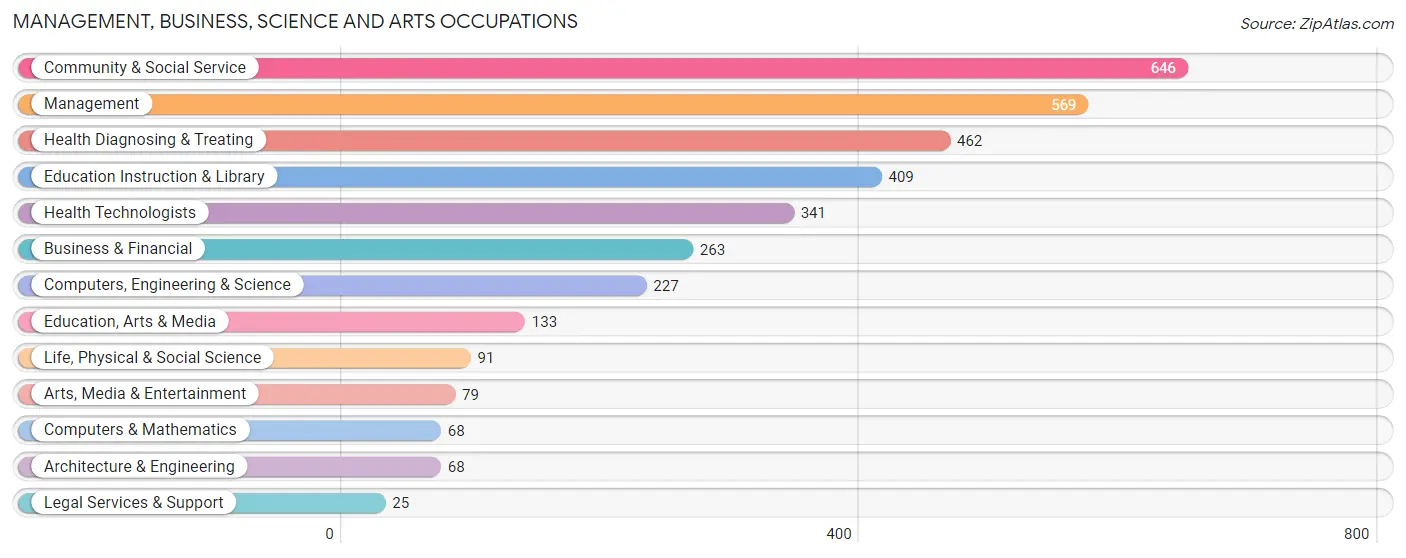
Management, Business, Science and Arts Occupations
The most common Management, Business, Science and Arts occupations in Custer County are Community & Social Service (646 | 10.3%), Management (569 | 9.1%), Health Diagnosing & Treating (462 | 7.4%), Education Instruction & Library (409 | 6.6%), and Health Technologists (341 | 5.5%).
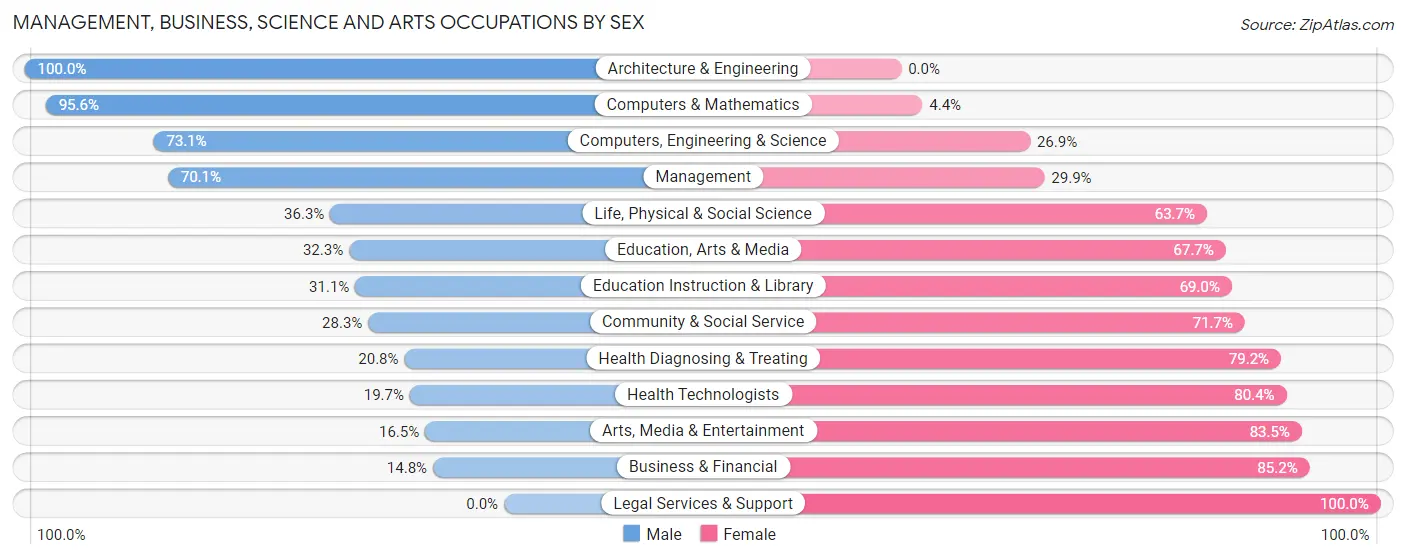
Management, Business, Science and Arts Occupations by Sex
Within the Management, Business, Science and Arts occupations in Custer County, the most male-oriented occupations are Architecture & Engineering (100.0%), Computers & Mathematics (95.6%), and Computers, Engineering & Science (73.1%), while the most female-oriented occupations are Legal Services & Support (100.0%), Business & Financial (85.2%), and Arts, Media & Entertainment (83.5%).
| Occupation | Male | Female |
| Management | 399 (70.1%) | 170 (29.9%) |
| Business & Financial | 39 (14.8%) | 224 (85.2%) |
| Computers, Engineering & Science | 166 (73.1%) | 61 (26.9%) |
| Computers & Mathematics | 65 (95.6%) | 3 (4.4%) |
| Architecture & Engineering | 68 (100.0%) | 0 (0.0%) |
| Life, Physical & Social Science | 33 (36.3%) | 58 (63.7%) |
| Community & Social Service | 183 (28.3%) | 463 (71.7%) |
| Education, Arts & Media | 43 (32.3%) | 90 (67.7%) |
| Legal Services & Support | 0 (0.0%) | 25 (100.0%) |
| Education Instruction & Library | 127 (31.0%) | 282 (69.0%) |
| Arts, Media & Entertainment | 13 (16.5%) | 66 (83.5%) |
| Health Diagnosing & Treating | 96 (20.8%) | 366 (79.2%) |
| Health Technologists | 67 (19.7%) | 274 (80.3%) |
| Total (Category) | 883 (40.7%) | 1,284 (59.3%) |
| Total (Overall) | 3,271 (52.4%) | 2,974 (47.6%) |
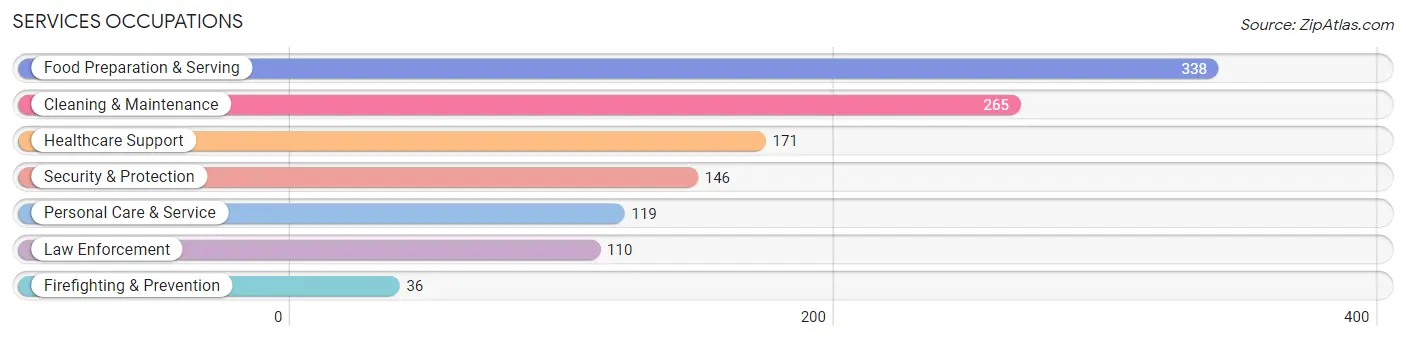
Services Occupations
The most common Services occupations in Custer County are Food Preparation & Serving (338 | 5.4%), Cleaning & Maintenance (265 | 4.2%), Healthcare Support (171 | 2.7%), Security & Protection (146 | 2.3%), and Personal Care & Service (119 | 1.9%).
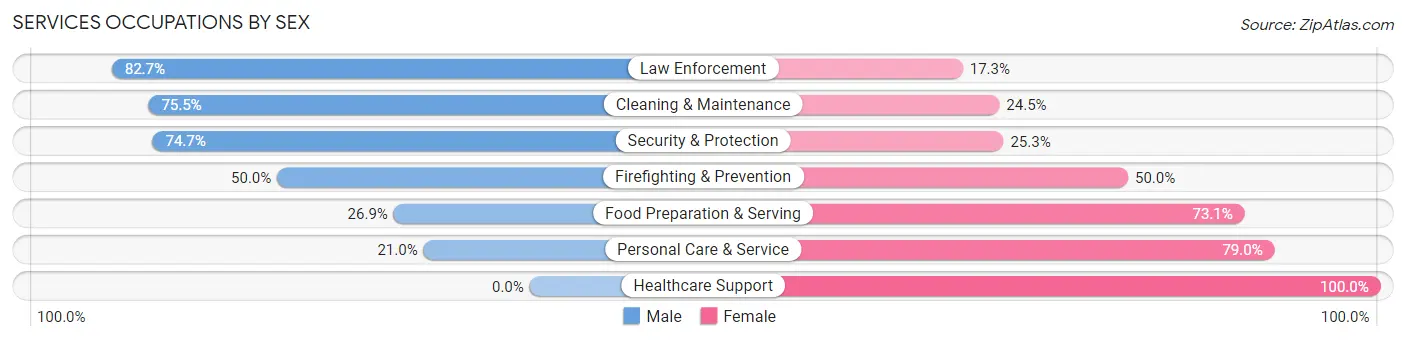
Services Occupations by Sex
Within the Services occupations in Custer County, the most male-oriented occupations are Law Enforcement (82.7%), Cleaning & Maintenance (75.5%), and Security & Protection (74.7%), while the most female-oriented occupations are Healthcare Support (100.0%), Personal Care & Service (79.0%), and Food Preparation & Serving (73.1%).
| Occupation | Male | Female |
| Healthcare Support | 0 (0.0%) | 171 (100.0%) |
| Security & Protection | 109 (74.7%) | 37 (25.3%) |
| Firefighting & Prevention | 18 (50.0%) | 18 (50.0%) |
| Law Enforcement | 91 (82.7%) | 19 (17.3%) |
| Food Preparation & Serving | 91 (26.9%) | 247 (73.1%) |
| Cleaning & Maintenance | 200 (75.5%) | 65 (24.5%) |
| Personal Care & Service | 25 (21.0%) | 94 (79.0%) |
| Total (Category) | 425 (40.9%) | 614 (59.1%) |
| Total (Overall) | 3,271 (52.4%) | 2,974 (47.6%) |
Sales and Office Occupations
The most common Sales and Office occupations in Custer County are Sales & Related (812 | 13.0%), and Office & Administration (677 | 10.8%).
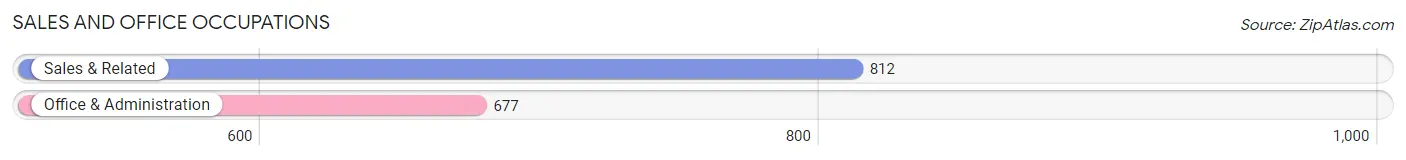
Sales and Office Occupations by Sex
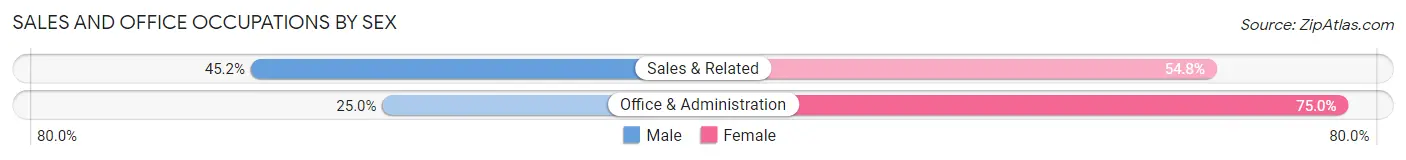
| Occupation | Male | Female |
| Sales & Related | 367 (45.2%) | 445 (54.8%) |
| Office & Administration | 169 (25.0%) | 508 (75.0%) |
| Total (Category) | 536 (36.0%) | 953 (64.0%) |
| Total (Overall) | 3,271 (52.4%) | 2,974 (47.6%) |
Natural Resources, Construction and Maintenance Occupations
The most common Natural Resources, Construction and Maintenance occupations in Custer County are Construction & Extraction (389 | 6.2%), Installation, Maintenance & Repair (247 | 4.0%), and Farming, Fishing & Forestry (198 | 3.2%).
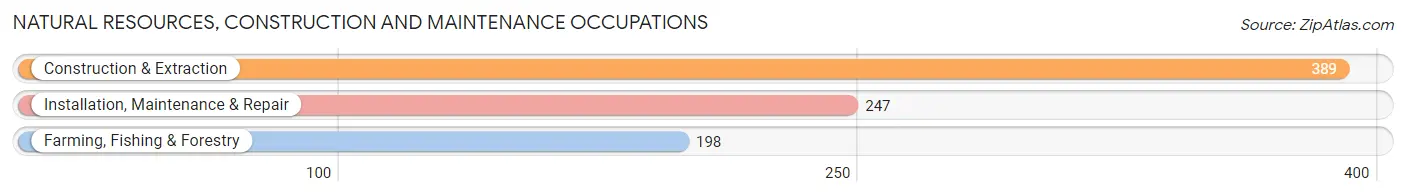
Natural Resources, Construction and Maintenance Occupations by Sex
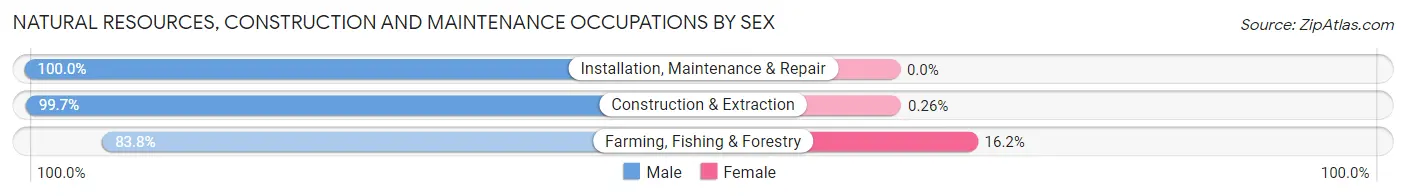
| Occupation | Male | Female |
| Farming, Fishing & Forestry | 166 (83.8%) | 32 (16.2%) |
| Construction & Extraction | 388 (99.7%) | 1 (0.3%) |
| Installation, Maintenance & Repair | 247 (100.0%) | 0 (0.0%) |
| Total (Category) | 801 (96.0%) | 33 (4.0%) |
| Total (Overall) | 3,271 (52.4%) | 2,974 (47.6%) |
Production, Transportation and Moving Occupations
The most common Production, Transportation and Moving occupations in Custer County are Material Moving (276 | 4.4%), Transportation (242 | 3.9%), and Production (198 | 3.2%).
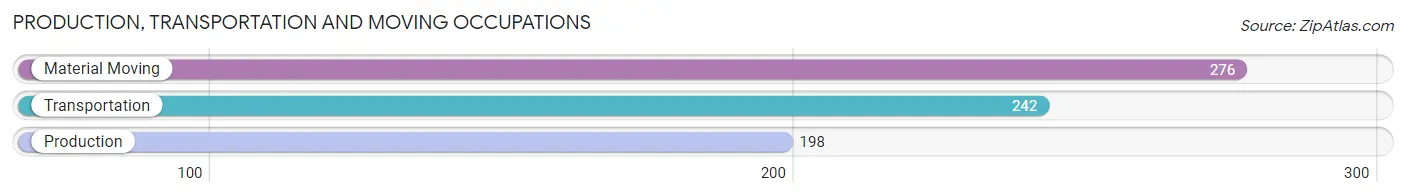
Production, Transportation and Moving Occupations by Sex
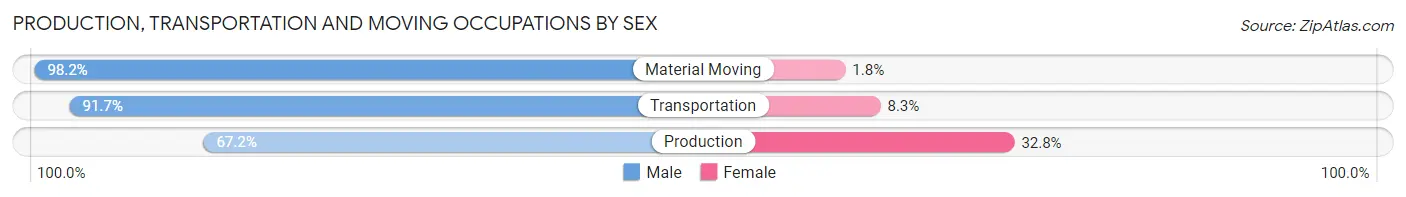
| Occupation | Male | Female |
| Production | 133 (67.2%) | 65 (32.8%) |
| Transportation | 222 (91.7%) | 20 (8.3%) |
| Material Moving | 271 (98.2%) | 5 (1.8%) |
| Total (Category) | 626 (87.4%) | 90 (12.6%) |
| Total (Overall) | 3,271 (52.4%) | 2,974 (47.6%) |
Employment Industries by Sex in Custer County
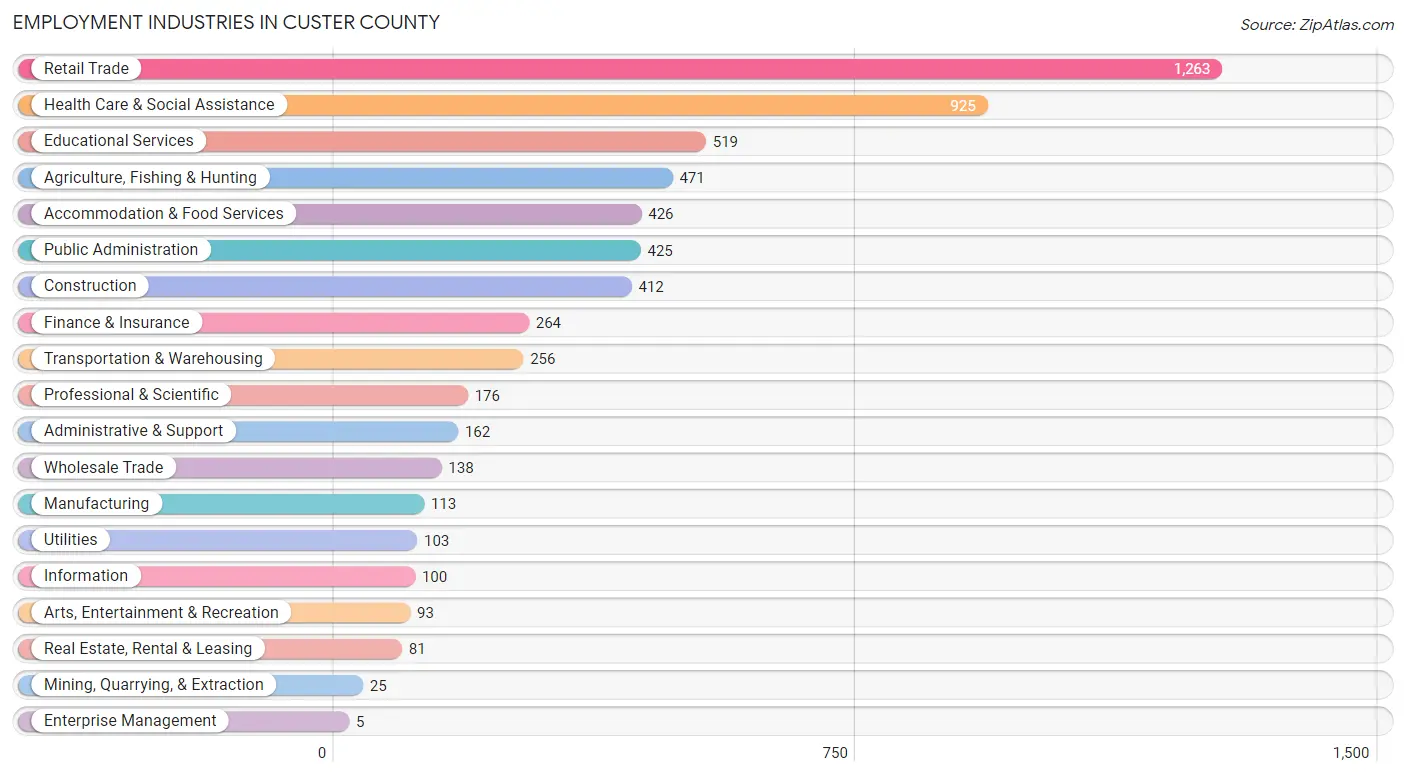
Employment Industries in Custer County
The major employment industries in Custer County include Retail Trade (1,263 | 20.2%), Health Care & Social Assistance (925 | 14.8%), Educational Services (519 | 8.3%), Agriculture, Fishing & Hunting (471 | 7.5%), and Accommodation & Food Services (426 | 6.8%).
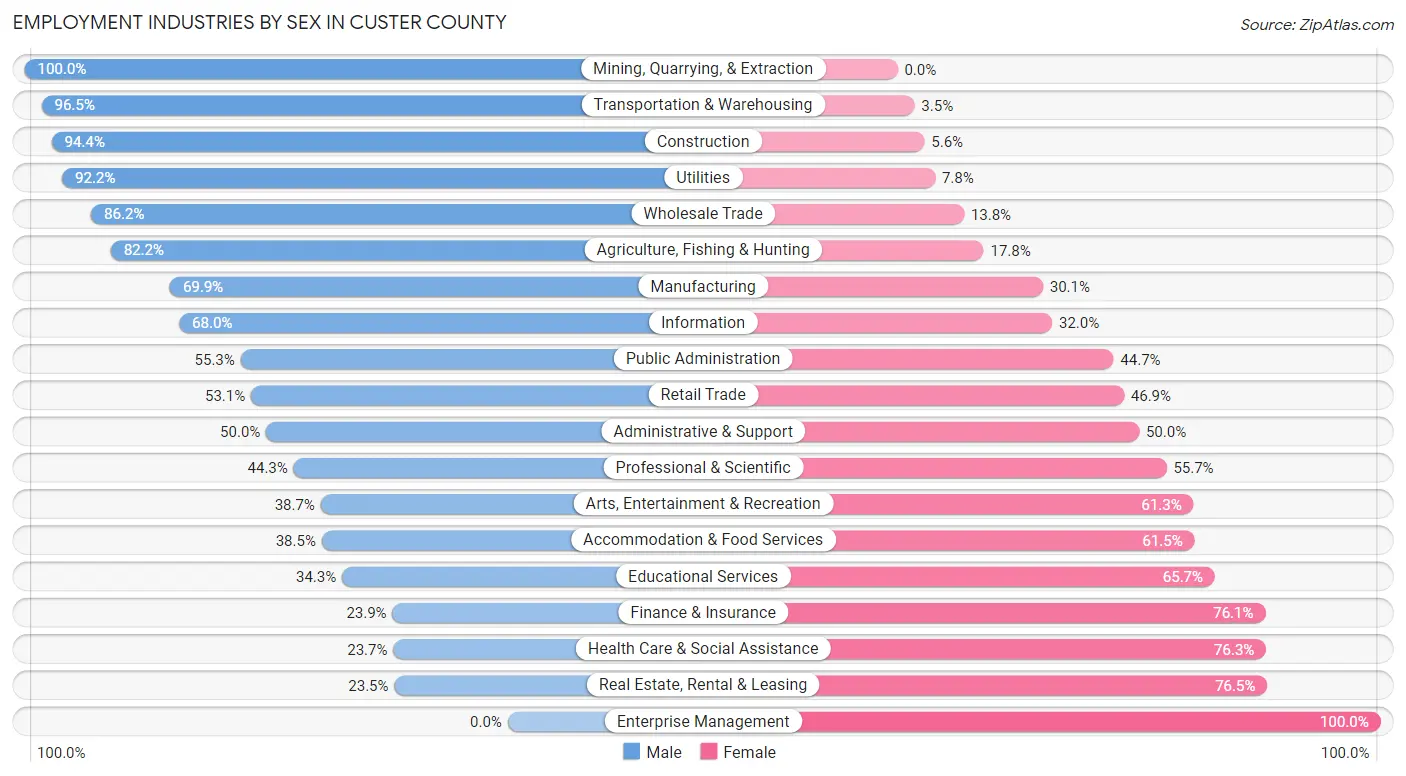
Employment Industries by Sex in Custer County
The Custer County industries that see more men than women are Mining, Quarrying, & Extraction (100.0%), Transportation & Warehousing (96.5%), and Construction (94.4%), whereas the industries that tend to have a higher number of women are Enterprise Management (100.0%), Real Estate, Rental & Leasing (76.5%), and Health Care & Social Assistance (76.3%).
| Industry | Male | Female |
| Agriculture, Fishing & Hunting | 387 (82.2%) | 84 (17.8%) |
| Mining, Quarrying, & Extraction | 25 (100.0%) | 0 (0.0%) |
| Construction | 389 (94.4%) | 23 (5.6%) |
| Manufacturing | 79 (69.9%) | 34 (30.1%) |
| Wholesale Trade | 119 (86.2%) | 19 (13.8%) |
| Retail Trade | 671 (53.1%) | 592 (46.9%) |
| Transportation & Warehousing | 247 (96.5%) | 9 (3.5%) |
| Utilities | 95 (92.2%) | 8 (7.8%) |
| Information | 68 (68.0%) | 32 (32.0%) |
| Finance & Insurance | 63 (23.9%) | 201 (76.1%) |
| Real Estate, Rental & Leasing | 19 (23.5%) | 62 (76.5%) |
| Professional & Scientific | 78 (44.3%) | 98 (55.7%) |
| Enterprise Management | 0 (0.0%) | 5 (100.0%) |
| Administrative & Support | 81 (50.0%) | 81 (50.0%) |
| Educational Services | 178 (34.3%) | 341 (65.7%) |
| Health Care & Social Assistance | 219 (23.7%) | 706 (76.3%) |
| Arts, Entertainment & Recreation | 36 (38.7%) | 57 (61.3%) |
| Accommodation & Food Services | 164 (38.5%) | 262 (61.5%) |
| Public Administration | 235 (55.3%) | 190 (44.7%) |
| Total | 3,271 (52.4%) | 2,974 (47.6%) |
Education in Custer County
School Enrollment in Custer County
The most common levels of schooling among the 2,454 students in Custer County are high school (593 | 24.2%), middle school (542 | 22.1%), and elementary school (529 | 21.6%).
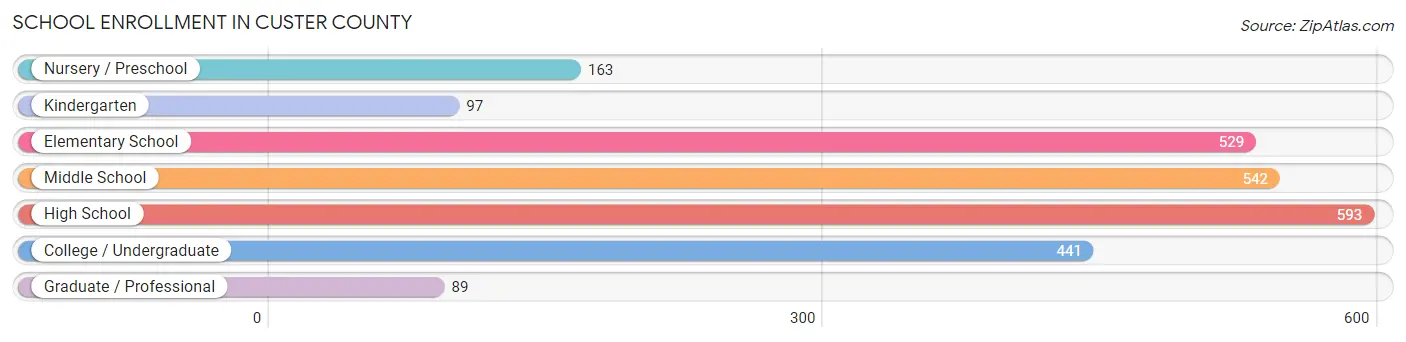
| School Level | # Students | % Students |
| Nursery / Preschool | 163 | 6.6% |
| Kindergarten | 97 | 4.0% |
| Elementary School | 529 | 21.6% |
| Middle School | 542 | 22.1% |
| High School | 593 | 24.2% |
| College / Undergraduate | 441 | 18.0% |
| Graduate / Professional | 89 | 3.6% |
| Total | 2,454 | 100.0% |
School Enrollment by Age by Funding Source in Custer County
Out of a total of 2,454 students who are enrolled in schools in Custer County, 339 (13.8%) attend a private institution, while the remaining 2,115 (86.2%) are enrolled in public schools. The age group of 35 years and over has the highest likelihood of being enrolled in private schools, with 36 (33.0% in the age bracket) enrolled. Conversely, the age group of 18 to 19 year olds has the lowest likelihood of being enrolled in a private school, with 211 (100.0% in the age bracket) attending a public institution.
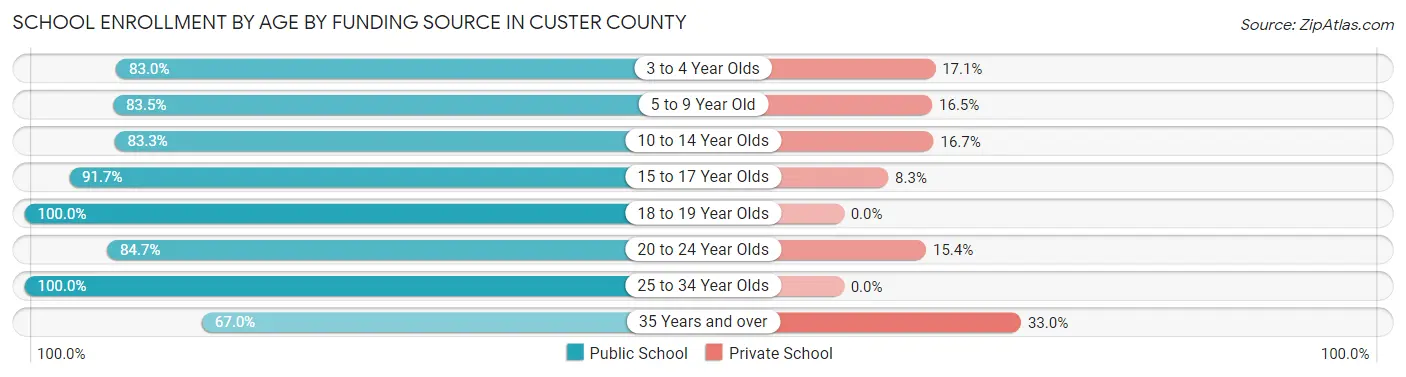
| Age Bracket | Public School | Private School |
| 3 to 4 Year Olds | 107 (83.0%) | 22 (17.1%) |
| 5 to 9 Year Old | 487 (83.5%) | 96 (16.5%) |
| 10 to 14 Year Olds | 567 (83.3%) | 114 (16.7%) |
| 15 to 17 Year Olds | 398 (91.7%) | 36 (8.3%) |
| 18 to 19 Year Olds | 211 (100.0%) | 0 (0.0%) |
| 20 to 24 Year Olds | 193 (84.7%) | 35 (15.3%) |
| 25 to 34 Year Olds | 79 (100.0%) | 0 (0.0%) |
| 35 Years and over | 73 (67.0%) | 36 (33.0%) |
| Total | 2,115 (86.2%) | 339 (13.8%) |
Educational Attainment by Field of Study in Custer County
Education (599 | 24.5%), business (415 | 17.0%), bio, nature & agricultural (294 | 12.0%), arts & humanities (237 | 9.7%), and science & technology (228 | 9.3%) are the most common fields of study among 2,444 individuals in Custer County who have obtained a bachelor's degree or higher.
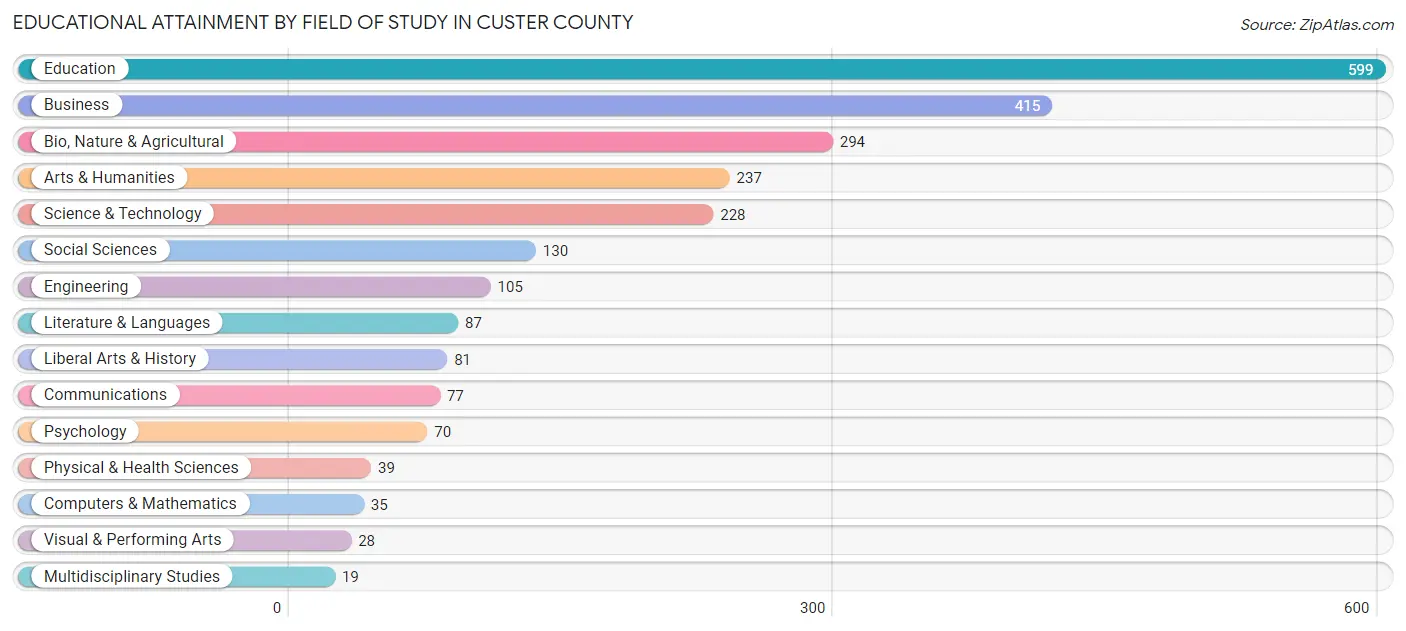
| Field of Study | # Graduates | % Graduates |
| Computers & Mathematics | 35 | 1.4% |
| Bio, Nature & Agricultural | 294 | 12.0% |
| Physical & Health Sciences | 39 | 1.6% |
| Psychology | 70 | 2.9% |
| Social Sciences | 130 | 5.3% |
| Engineering | 105 | 4.3% |
| Multidisciplinary Studies | 19 | 0.8% |
| Science & Technology | 228 | 9.3% |
| Business | 415 | 17.0% |
| Education | 599 | 24.5% |
| Literature & Languages | 87 | 3.6% |
| Liberal Arts & History | 81 | 3.3% |
| Visual & Performing Arts | 28 | 1.1% |
| Communications | 77 | 3.2% |
| Arts & Humanities | 237 | 9.7% |
| Total | 2,444 | 100.0% |
Transportation & Commute in Custer County
Vehicle Availability by Sex in Custer County
The most prevalent vehicle ownership categories in Custer County are males with 2 vehicles (1,217, accounting for 38.0%) and females with 2 vehicles (843, making up 42.6%).
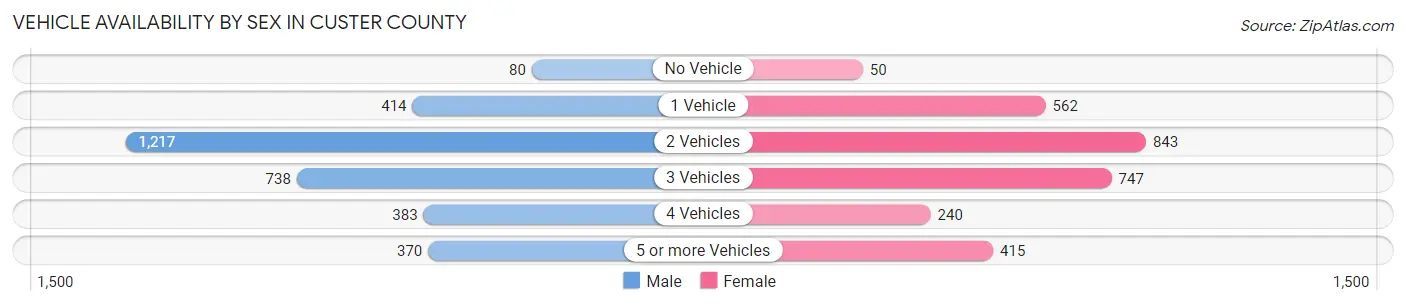
| Vehicles Available | Male | Female |
| No Vehicle | 80 (2.5%) | 50 (1.8%) |
| 1 Vehicle | 414 (12.9%) | 562 (19.7%) |
| 2 Vehicles | 1,217 (38.0%) | 843 (29.5%) |
| 3 Vehicles | 738 (23.1%) | 747 (26.2%) |
| 4 Vehicles | 383 (12.0%) | 240 (8.4%) |
| 5 or more Vehicles | 370 (11.6%) | 415 (14.5%) |
| Total | 3,202 (100.0%) | 2,857 (100.0%) |
Commute Time in Custer County
The most frequently occuring commute durations in Custer County are 5 to 9 minutes (2,139 commuters, 36.5%), 10 to 14 minutes (1,278 commuters, 21.8%), and less than 5 minutes (919 commuters, 15.7%).
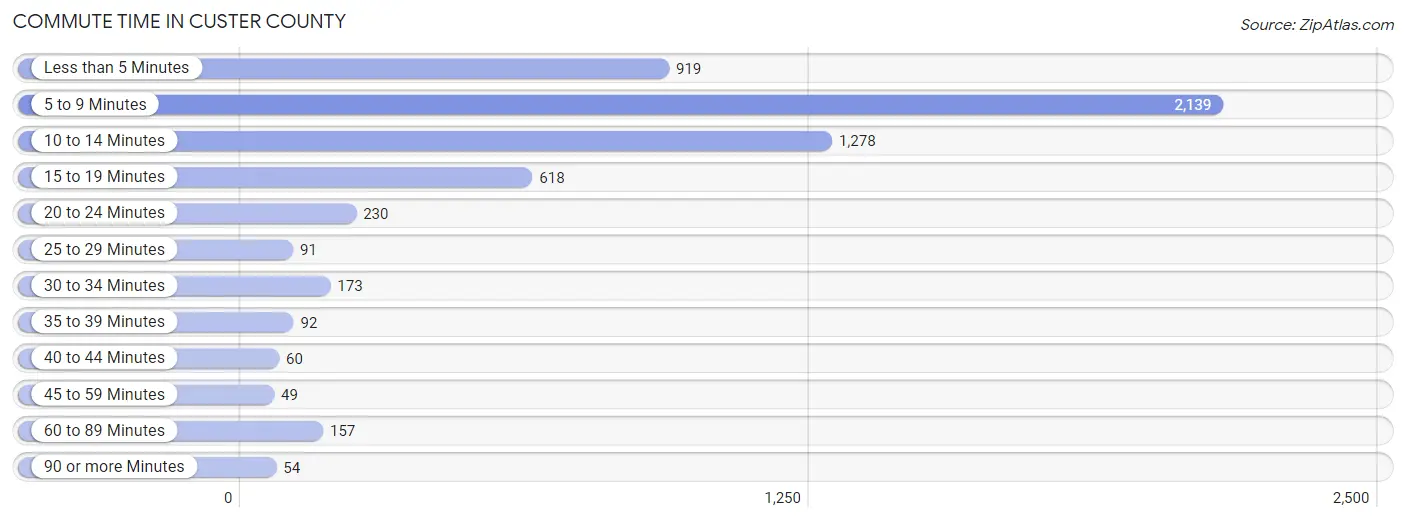
| Commute Time | # Commuters | % Commuters |
| Less than 5 Minutes | 919 | 15.7% |
| 5 to 9 Minutes | 2,139 | 36.5% |
| 10 to 14 Minutes | 1,278 | 21.8% |
| 15 to 19 Minutes | 618 | 10.5% |
| 20 to 24 Minutes | 230 | 3.9% |
| 25 to 29 Minutes | 91 | 1.5% |
| 30 to 34 Minutes | 173 | 2.9% |
| 35 to 39 Minutes | 92 | 1.6% |
| 40 to 44 Minutes | 60 | 1.0% |
| 45 to 59 Minutes | 49 | 0.8% |
| 60 to 89 Minutes | 157 | 2.7% |
| 90 or more Minutes | 54 | 0.9% |
Commute Time by Sex in Custer County
The most common commute times in Custer County are 5 to 9 minutes (1,068 commuters, 34.9%) for males and 5 to 9 minutes (1,071 commuters, 38.3%) for females.
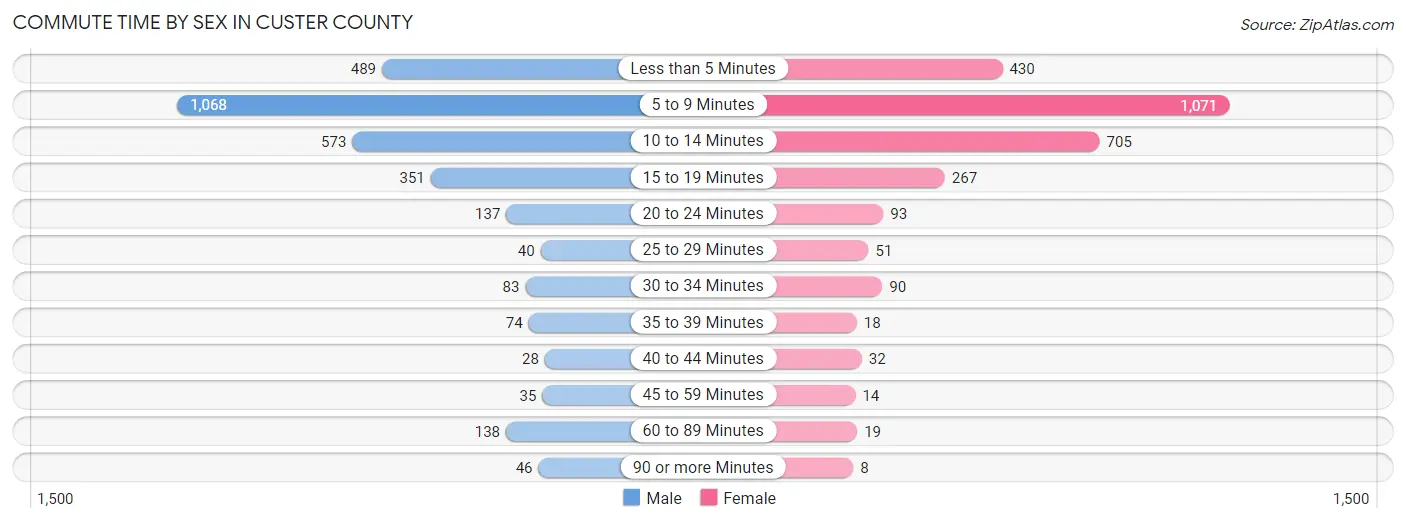
| Commute Time | Male | Female |
| Less than 5 Minutes | 489 (16.0%) | 430 (15.4%) |
| 5 to 9 Minutes | 1,068 (34.9%) | 1,071 (38.3%) |
| 10 to 14 Minutes | 573 (18.7%) | 705 (25.2%) |
| 15 to 19 Minutes | 351 (11.5%) | 267 (9.5%) |
| 20 to 24 Minutes | 137 (4.5%) | 93 (3.3%) |
| 25 to 29 Minutes | 40 (1.3%) | 51 (1.8%) |
| 30 to 34 Minutes | 83 (2.7%) | 90 (3.2%) |
| 35 to 39 Minutes | 74 (2.4%) | 18 (0.6%) |
| 40 to 44 Minutes | 28 (0.9%) | 32 (1.1%) |
| 45 to 59 Minutes | 35 (1.1%) | 14 (0.5%) |
| 60 to 89 Minutes | 138 (4.5%) | 19 (0.7%) |
| 90 or more Minutes | 46 (1.5%) | 8 (0.3%) |
Time of Departure to Work by Sex in Custer County
The most frequent times of departure to work in Custer County are 7:30 AM to 7:59 AM (579, 18.9%) for males and 7:30 AM to 7:59 AM (901, 32.2%) for females.
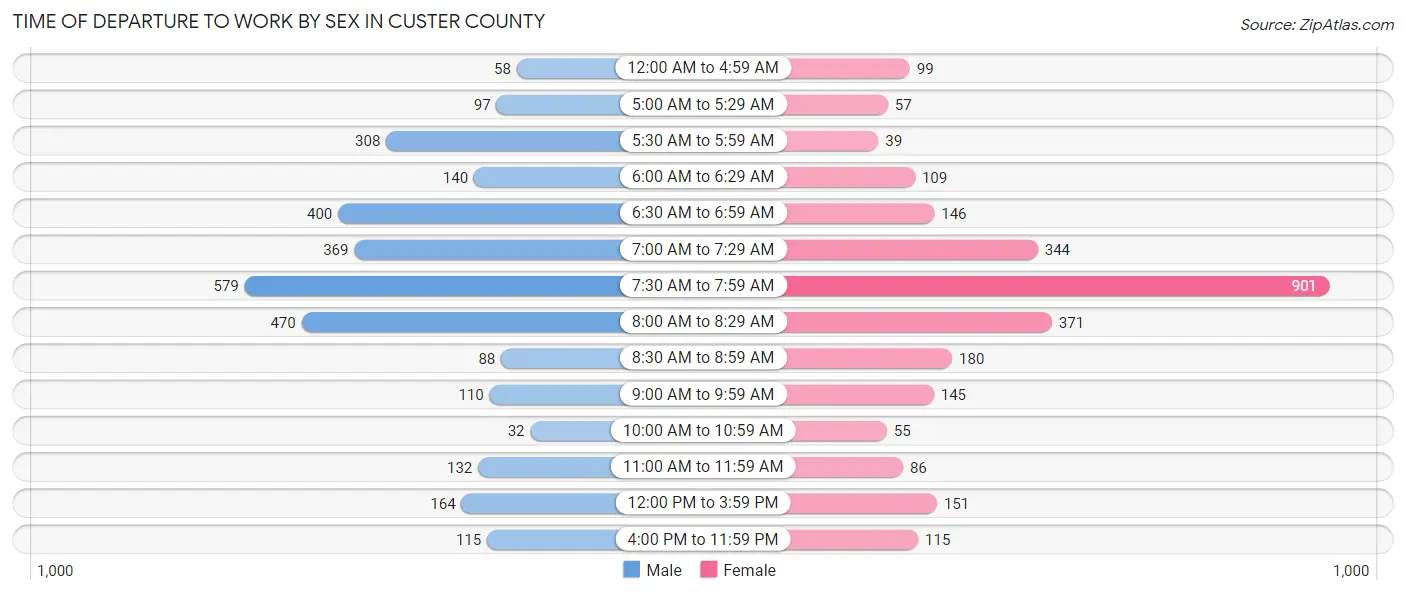
| Time of Departure | Male | Female |
| 12:00 AM to 4:59 AM | 58 (1.9%) | 99 (3.5%) |
| 5:00 AM to 5:29 AM | 97 (3.2%) | 57 (2.0%) |
| 5:30 AM to 5:59 AM | 308 (10.1%) | 39 (1.4%) |
| 6:00 AM to 6:29 AM | 140 (4.6%) | 109 (3.9%) |
| 6:30 AM to 6:59 AM | 400 (13.1%) | 146 (5.2%) |
| 7:00 AM to 7:29 AM | 369 (12.0%) | 344 (12.3%) |
| 7:30 AM to 7:59 AM | 579 (18.9%) | 901 (32.2%) |
| 8:00 AM to 8:29 AM | 470 (15.3%) | 371 (13.3%) |
| 8:30 AM to 8:59 AM | 88 (2.9%) | 180 (6.4%) |
| 9:00 AM to 9:59 AM | 110 (3.6%) | 145 (5.2%) |
| 10:00 AM to 10:59 AM | 32 (1.1%) | 55 (2.0%) |
| 11:00 AM to 11:59 AM | 132 (4.3%) | 86 (3.1%) |
| 12:00 PM to 3:59 PM | 164 (5.4%) | 151 (5.4%) |
| 4:00 PM to 11:59 PM | 115 (3.8%) | 115 (4.1%) |
| Total | 3,062 (100.0%) | 2,798 (100.0%) |
Housing Occupancy in Custer County
Occupancy by Ownership in Custer County
Of the total 4,996 dwellings in Custer County, owner-occupied units account for 3,362 (67.3%), while renter-occupied units make up 1,634 (32.7%).
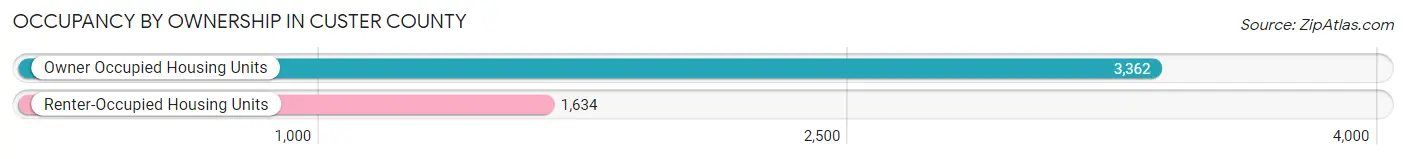
| Occupancy | # Housing Units | % Housing Units |
| Owner Occupied Housing Units | 3,362 | 67.3% |
| Renter-Occupied Housing Units | 1,634 | 32.7% |
| Total Occupied Housing Units | 4,996 | 100.0% |
Occupancy by Household Size in Custer County
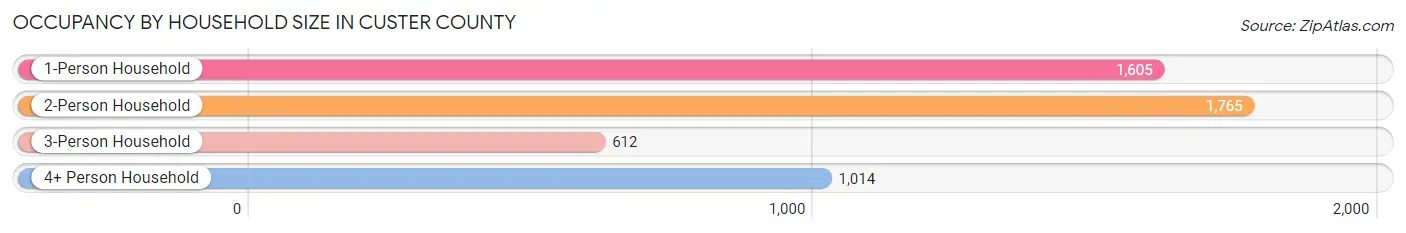
| Household Size | # Housing Units | % Housing Units |
| 1-Person Household | 1,605 | 32.1% |
| 2-Person Household | 1,765 | 35.3% |
| 3-Person Household | 612 | 12.2% |
| 4+ Person Household | 1,014 | 20.3% |
| Total Housing Units | 4,996 | 100.0% |
Occupancy by Ownership by Household Size in Custer County
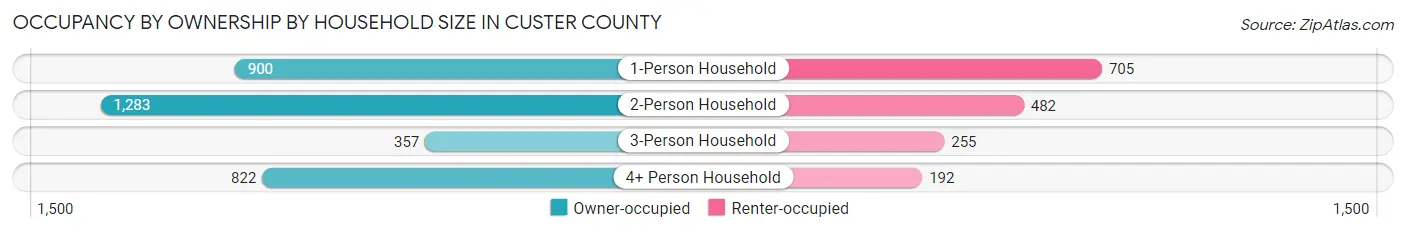
| Household Size | Owner-occupied | Renter-occupied |
| 1-Person Household | 900 (56.1%) | 705 (43.9%) |
| 2-Person Household | 1,283 (72.7%) | 482 (27.3%) |
| 3-Person Household | 357 (58.3%) | 255 (41.7%) |
| 4+ Person Household | 822 (81.1%) | 192 (18.9%) |
| Total Housing Units | 3,362 (67.3%) | 1,634 (32.7%) |
Occupancy by Educational Attainment in Custer County
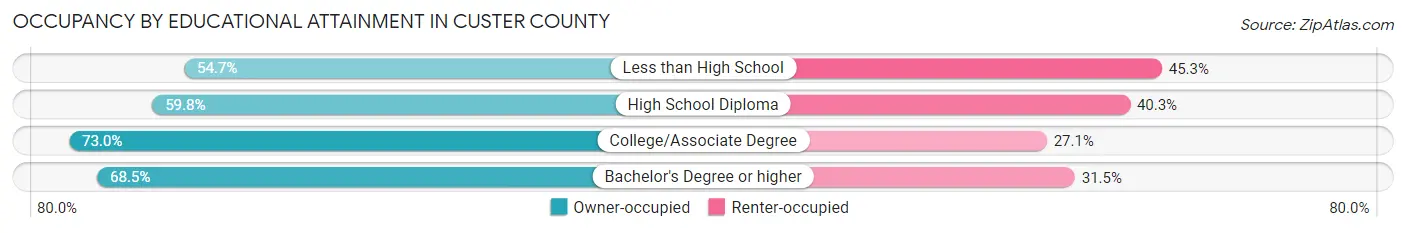
| Household Size | Owner-occupied | Renter-occupied |
| Less than High School | 99 (54.7%) | 82 (45.3%) |
| High School Diploma | 870 (59.8%) | 586 (40.3%) |
| College/Associate Degree | 1,510 (73.0%) | 560 (27.1%) |
| Bachelor's Degree or higher | 883 (68.5%) | 406 (31.5%) |
Occupancy by Age of Householder in Custer County
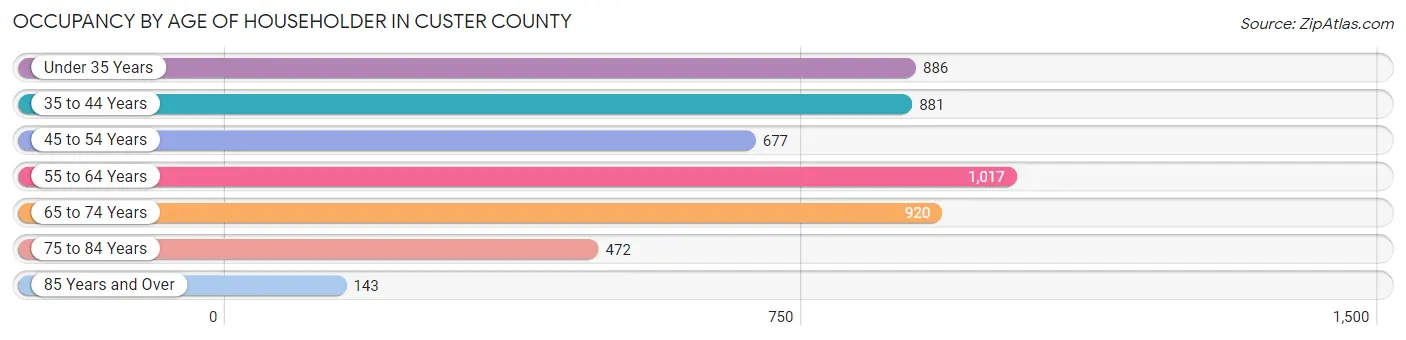
| Age Bracket | # Households | % Households |
| Under 35 Years | 886 | 17.7% |
| 35 to 44 Years | 881 | 17.6% |
| 45 to 54 Years | 677 | 13.6% |
| 55 to 64 Years | 1,017 | 20.4% |
| 65 to 74 Years | 920 | 18.4% |
| 75 to 84 Years | 472 | 9.5% |
| 85 Years and Over | 143 | 2.9% |
| Total | 4,996 | 100.0% |
Housing Finances in Custer County
Median Income by Occupancy in Custer County
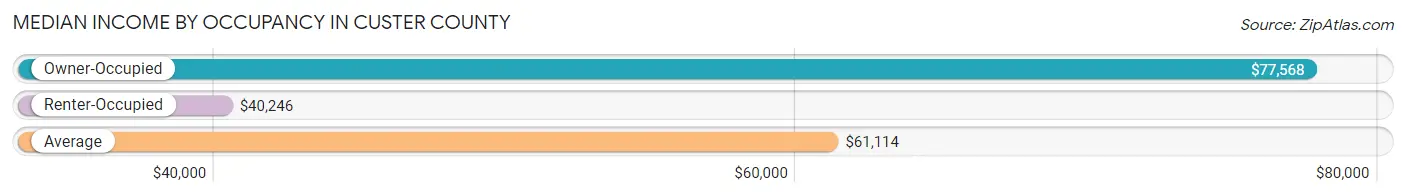
| Occupancy Type | # Households | Median Income |
| Owner-Occupied | 3,362 (67.3%) | $77,568 |
| Renter-Occupied | 1,634 (32.7%) | $40,246 |
| Average | 4,996 (100.0%) | $61,114 |
Occupancy by Householder Income Bracket in Custer County
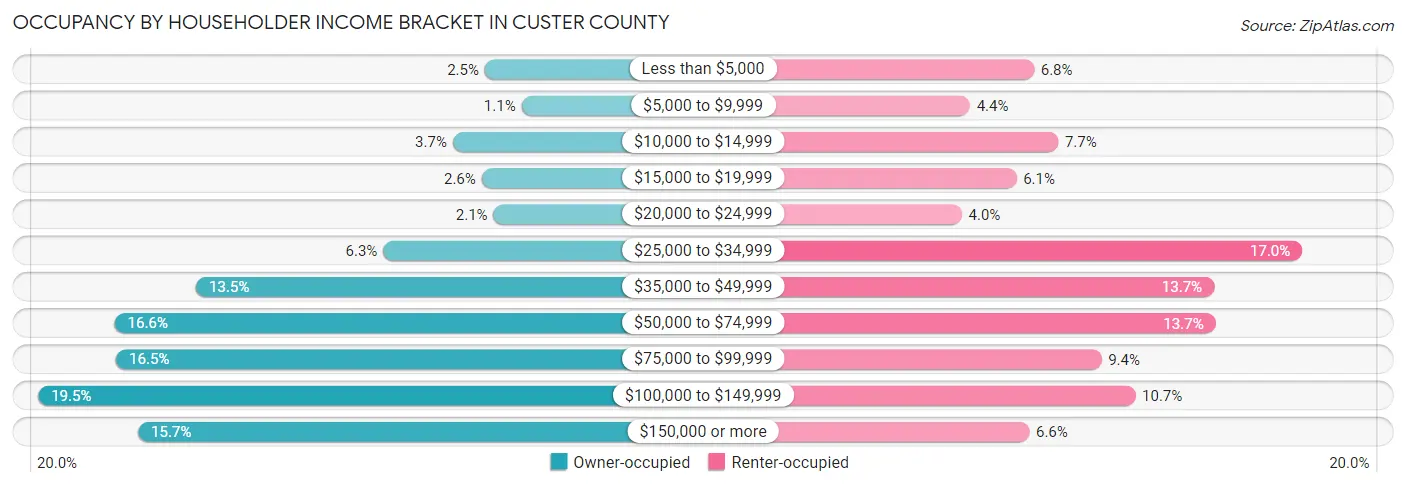
| Income Bracket | Owner-occupied | Renter-occupied |
| Less than $5,000 | 83 (2.5%) | 111 (6.8%) |
| $5,000 to $9,999 | 36 (1.1%) | 71 (4.3%) |
| $10,000 to $14,999 | 124 (3.7%) | 126 (7.7%) |
| $15,000 to $19,999 | 87 (2.6%) | 100 (6.1%) |
| $20,000 to $24,999 | 72 (2.1%) | 66 (4.0%) |
| $25,000 to $34,999 | 213 (6.3%) | 278 (17.0%) |
| $35,000 to $49,999 | 453 (13.5%) | 223 (13.7%) |
| $50,000 to $74,999 | 557 (16.6%) | 224 (13.7%) |
| $75,000 to $99,999 | 555 (16.5%) | 153 (9.4%) |
| $100,000 to $149,999 | 655 (19.5%) | 174 (10.6%) |
| $150,000 or more | 527 (15.7%) | 108 (6.6%) |
| Total | 3,362 (100.0%) | 1,634 (100.0%) |
Monthly Housing Cost Tiers in Custer County
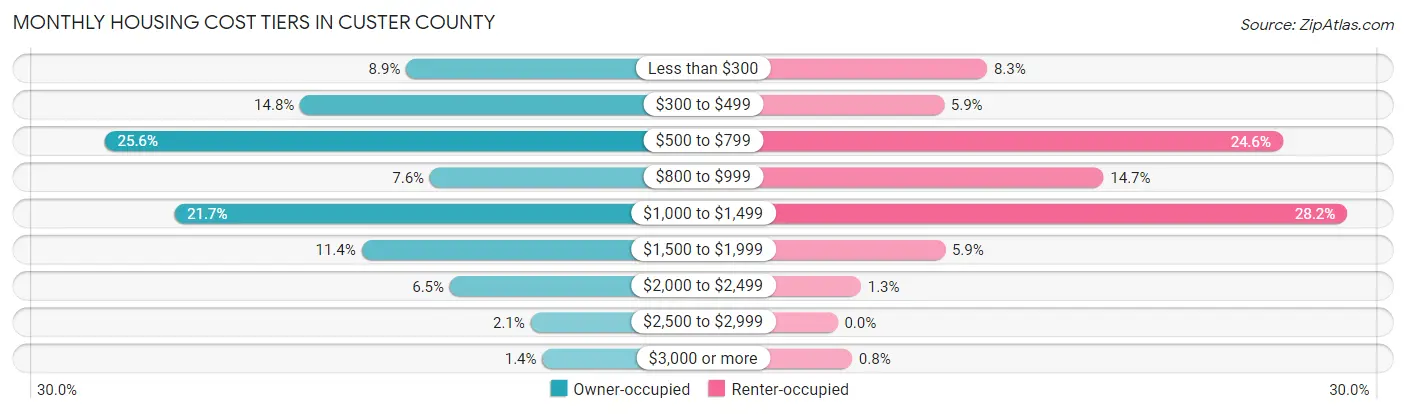
| Monthly Cost | Owner-occupied | Renter-occupied |
| Less than $300 | 300 (8.9%) | 135 (8.3%) |
| $300 to $499 | 497 (14.8%) | 96 (5.9%) |
| $500 to $799 | 860 (25.6%) | 402 (24.6%) |
| $800 to $999 | 256 (7.6%) | 240 (14.7%) |
| $1,000 to $1,499 | 731 (21.7%) | 460 (28.1%) |
| $1,500 to $1,999 | 383 (11.4%) | 97 (5.9%) |
| $2,000 to $2,499 | 219 (6.5%) | 21 (1.3%) |
| $2,500 to $2,999 | 69 (2.1%) | 0 (0.0%) |
| $3,000 or more | 47 (1.4%) | 13 (0.8%) |
| Total | 3,362 (100.0%) | 1,634 (100.0%) |
Physical Housing Characteristics in Custer County
Housing Structures in Custer County
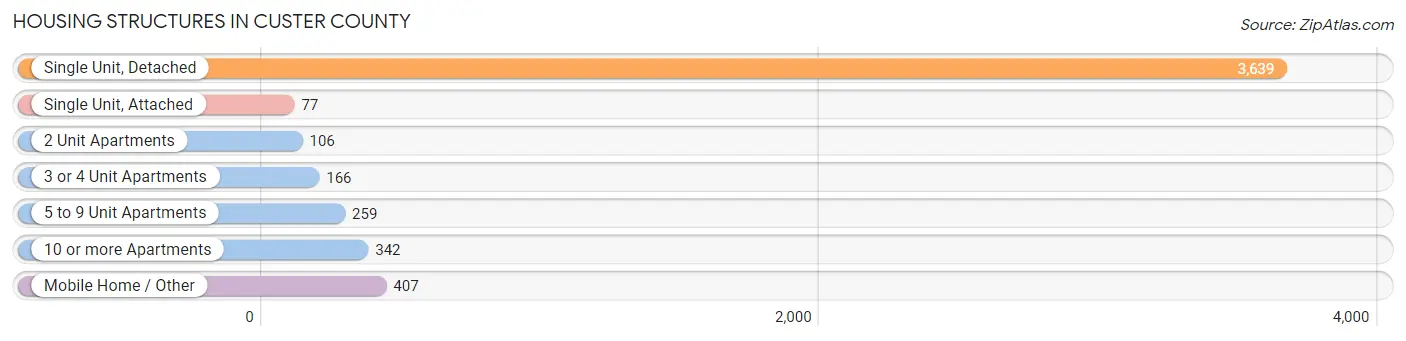
| Structure Type | # Housing Units | % Housing Units |
| Single Unit, Detached | 3,639 | 72.8% |
| Single Unit, Attached | 77 | 1.5% |
| 2 Unit Apartments | 106 | 2.1% |
| 3 or 4 Unit Apartments | 166 | 3.3% |
| 5 to 9 Unit Apartments | 259 | 5.2% |
| 10 or more Apartments | 342 | 6.9% |
| Mobile Home / Other | 407 | 8.2% |
| Total | 4,996 | 100.0% |
Housing Structures by Occupancy in Custer County
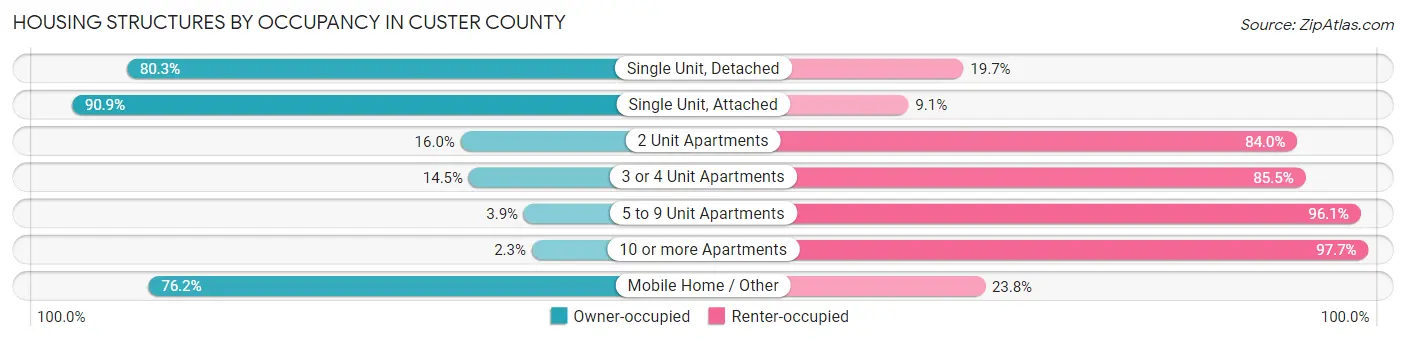
| Structure Type | Owner-occupied | Renter-occupied |
| Single Unit, Detached | 2,923 (80.3%) | 716 (19.7%) |
| Single Unit, Attached | 70 (90.9%) | 7 (9.1%) |
| 2 Unit Apartments | 17 (16.0%) | 89 (84.0%) |
| 3 or 4 Unit Apartments | 24 (14.5%) | 142 (85.5%) |
| 5 to 9 Unit Apartments | 10 (3.9%) | 249 (96.1%) |
| 10 or more Apartments | 8 (2.3%) | 334 (97.7%) |
| Mobile Home / Other | 310 (76.2%) | 97 (23.8%) |
| Total | 3,362 (67.3%) | 1,634 (32.7%) |
Housing Structures by Number of Rooms in Custer County
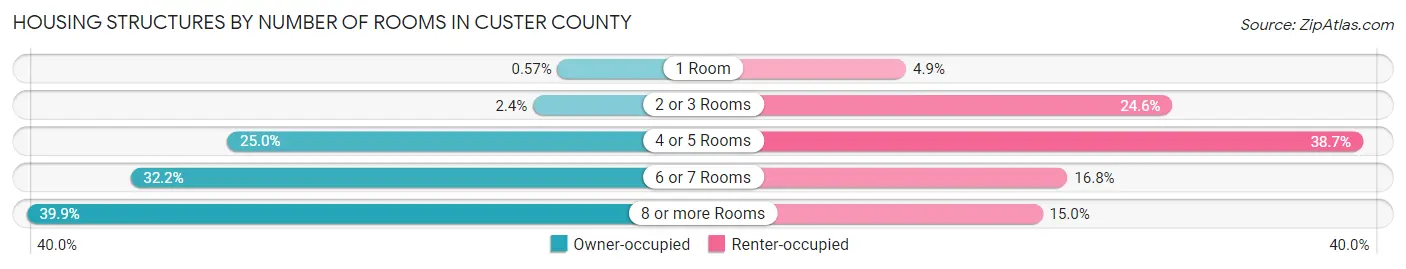
| Number of Rooms | Owner-occupied | Renter-occupied |
| 1 Room | 19 (0.6%) | 80 (4.9%) |
| 2 or 3 Rooms | 80 (2.4%) | 402 (24.6%) |
| 4 or 5 Rooms | 841 (25.0%) | 632 (38.7%) |
| 6 or 7 Rooms | 1,082 (32.2%) | 275 (16.8%) |
| 8 or more Rooms | 1,340 (39.9%) | 245 (15.0%) |
| Total | 3,362 (100.0%) | 1,634 (100.0%) |
Housing Structure by Heating Type in Custer County
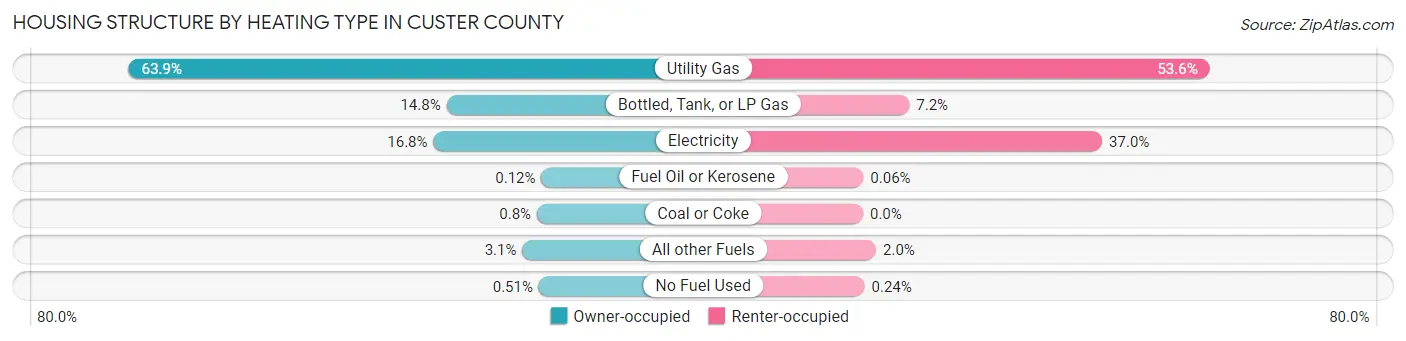
| Heating Type | Owner-occupied | Renter-occupied |
| Utility Gas | 2,149 (63.9%) | 875 (53.5%) |
| Bottled, Tank, or LP Gas | 497 (14.8%) | 117 (7.2%) |
| Electricity | 565 (16.8%) | 604 (37.0%) |
| Fuel Oil or Kerosene | 4 (0.1%) | 1 (0.1%) |
| Coal or Coke | 27 (0.8%) | 0 (0.0%) |
| All other Fuels | 103 (3.1%) | 33 (2.0%) |
| No Fuel Used | 17 (0.5%) | 4 (0.2%) |
| Total | 3,362 (100.0%) | 1,634 (100.0%) |
Household Vehicle Usage in Custer County
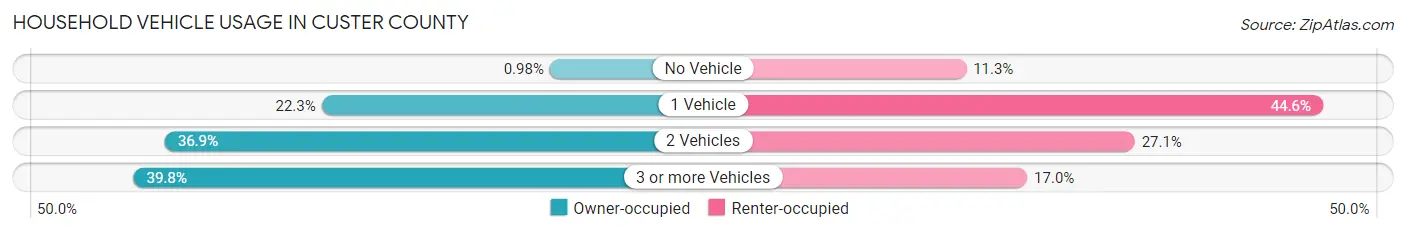
| Vehicles per Household | Owner-occupied | Renter-occupied |
| No Vehicle | 33 (1.0%) | 185 (11.3%) |
| 1 Vehicle | 749 (22.3%) | 729 (44.6%) |
| 2 Vehicles | 1,241 (36.9%) | 442 (27.1%) |
| 3 or more Vehicles | 1,339 (39.8%) | 278 (17.0%) |
| Total | 3,362 (100.0%) | 1,634 (100.0%) |
Real Estate & Mortgages in Custer County
Real Estate and Mortgage Overview in Custer County
| Characteristic | Without Mortgage | With Mortgage |
| Housing Units | 1,732 | 1,630 |
| Median Property Value | $200,200 | $202,100 |
| Median Household Income | $60,865 | $273 |
| Monthly Housing Costs | $523 | $47 |
| Real Estate Taxes | $2,010 | $34 |
Property Value by Mortgage Status in Custer County
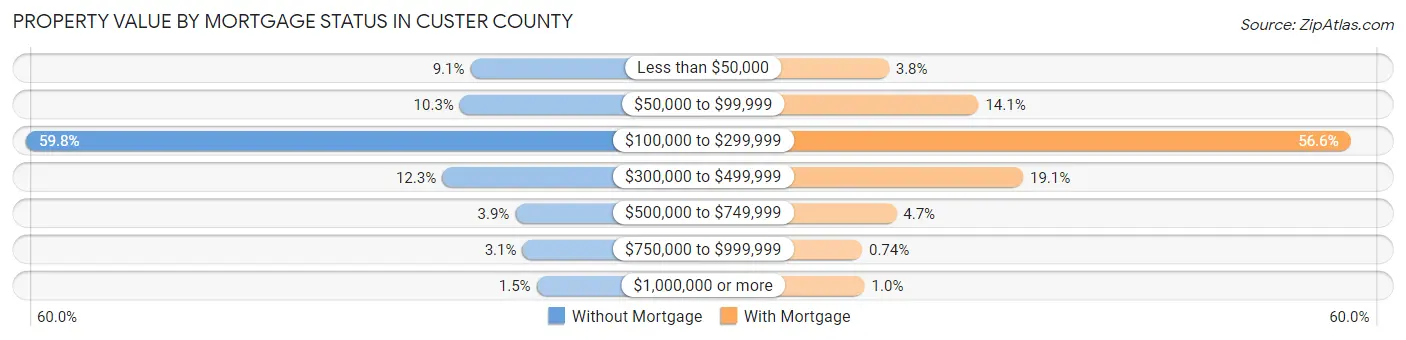
| Property Value | Without Mortgage | With Mortgage |
| Less than $50,000 | 157 (9.1%) | 62 (3.8%) |
| $50,000 to $99,999 | 178 (10.3%) | 229 (14.1%) |
| $100,000 to $299,999 | 1,036 (59.8%) | 922 (56.6%) |
| $300,000 to $499,999 | 213 (12.3%) | 312 (19.1%) |
| $500,000 to $749,999 | 68 (3.9%) | 76 (4.7%) |
| $750,000 to $999,999 | 54 (3.1%) | 12 (0.7%) |
| $1,000,000 or more | 26 (1.5%) | 17 (1.0%) |
| Total | 1,732 (100.0%) | 1,630 (100.0%) |
Household Income by Mortgage Status in Custer County
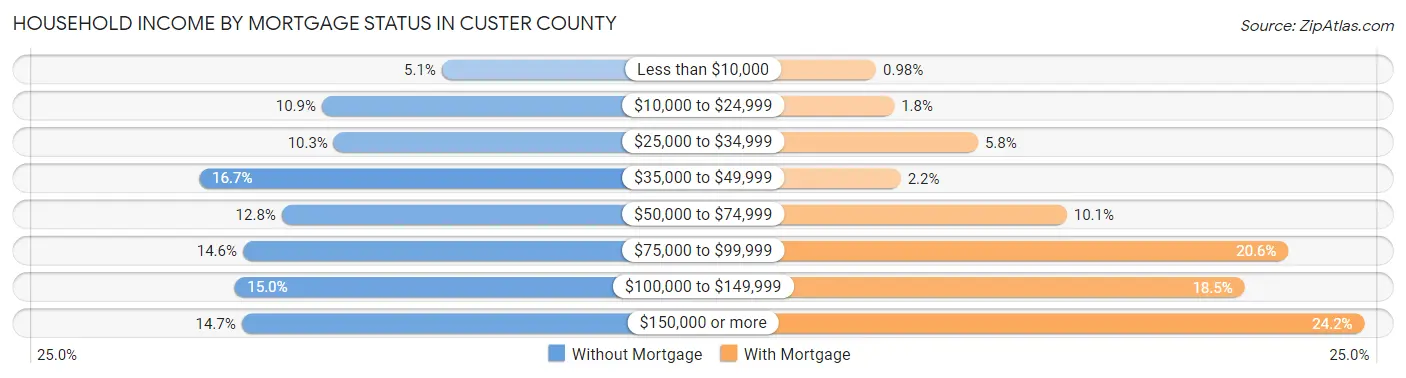
| Household Income | Without Mortgage | With Mortgage |
| Less than $10,000 | 89 (5.1%) | 16 (1.0%) |
| $10,000 to $24,999 | 188 (10.8%) | 30 (1.8%) |
| $25,000 to $34,999 | 178 (10.3%) | 95 (5.8%) |
| $35,000 to $49,999 | 289 (16.7%) | 35 (2.1%) |
| $50,000 to $74,999 | 221 (12.8%) | 164 (10.1%) |
| $75,000 to $99,999 | 253 (14.6%) | 336 (20.6%) |
| $100,000 to $149,999 | 260 (15.0%) | 302 (18.5%) |
| $150,000 or more | 254 (14.7%) | 395 (24.2%) |
| Total | 1,732 (100.0%) | 1,630 (100.0%) |
Property Value to Household Income Ratio in Custer County
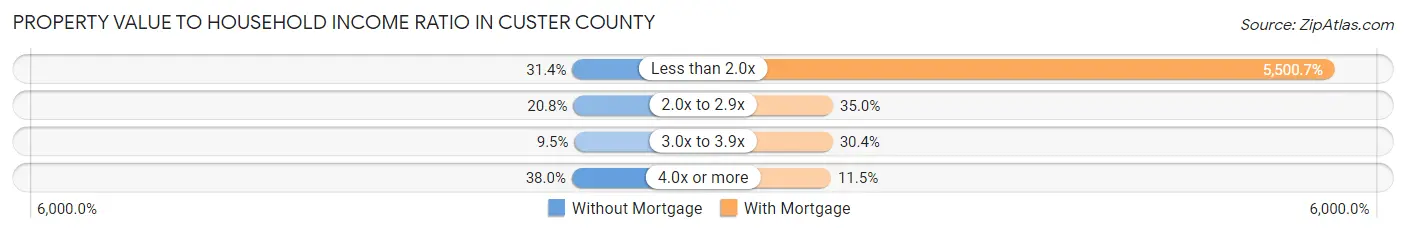
| Value-to-Income Ratio | Without Mortgage | With Mortgage |
| Less than 2.0x | 543 (31.4%) | 89,662 (5,500.7%) |
| 2.0x to 2.9x | 361 (20.8%) | 570 (35.0%) |
| 3.0x to 3.9x | 164 (9.5%) | 495 (30.4%) |
| 4.0x or more | 658 (38.0%) | 188 (11.5%) |
| Total | 1,732 (100.0%) | 1,630 (100.0%) |
Real Estate Taxes by Mortgage Status in Custer County
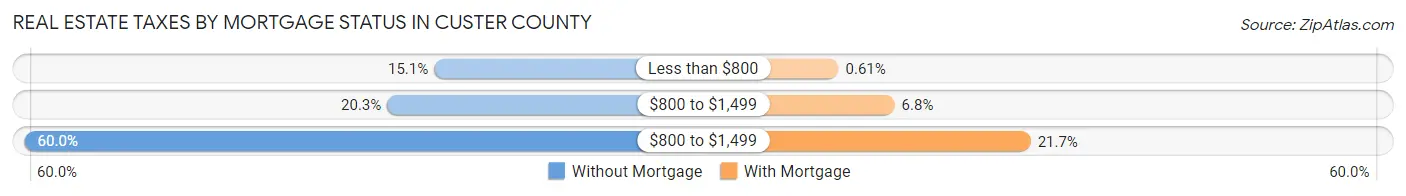
| Property Taxes | Without Mortgage | With Mortgage |
| Less than $800 | 262 (15.1%) | 10 (0.6%) |
| $800 to $1,499 | 351 (20.3%) | 110 (6.8%) |
| $800 to $1,499 | 1,039 (60.0%) | 353 (21.7%) |
| Total | 1,732 (100.0%) | 1,630 (100.0%) |
Health & Disability in Custer County
Health Insurance Coverage by Age in Custer County
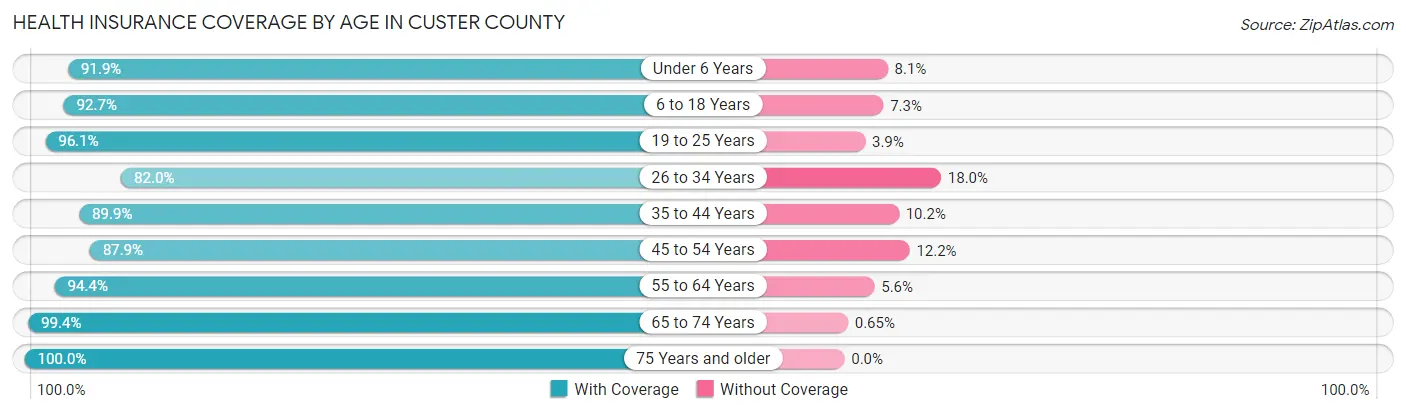
| Age Bracket | With Coverage | Without Coverage |
| Under 6 Years | 626 (91.9%) | 55 (8.1%) |
| 6 to 18 Years | 1,634 (92.7%) | 128 (7.3%) |
| 19 to 25 Years | 1,019 (96.1%) | 41 (3.9%) |
| 26 to 34 Years | 988 (82.0%) | 217 (18.0%) |
| 35 to 44 Years | 1,355 (89.8%) | 153 (10.2%) |
| 45 to 54 Years | 1,193 (87.8%) | 165 (12.1%) |
| 55 to 64 Years | 1,758 (94.4%) | 104 (5.6%) |
| 65 to 74 Years | 1,380 (99.4%) | 9 (0.6%) |
| 75 Years and older | 917 (100.0%) | 0 (0.0%) |
| Total | 10,870 (92.6%) | 872 (7.4%) |
Health Insurance Coverage by Citizenship Status in Custer County
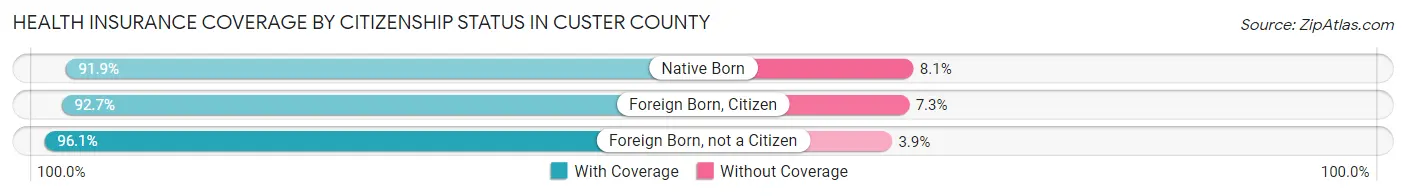
| Citizenship Status | With Coverage | Without Coverage |
| Native Born | 626 (91.9%) | 55 (8.1%) |
| Foreign Born, Citizen | 1,634 (92.7%) | 128 (7.3%) |
| Foreign Born, not a Citizen | 1,019 (96.1%) | 41 (3.9%) |
Health Insurance Coverage by Household Income in Custer County
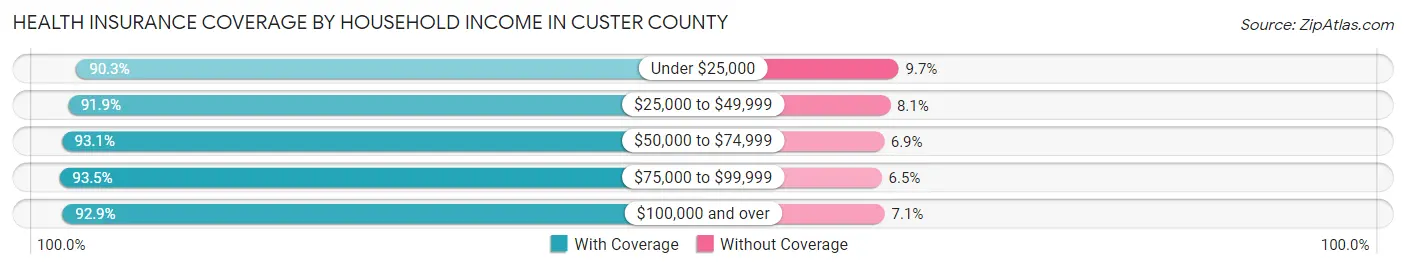
| Household Income | With Coverage | Without Coverage |
| Under $25,000 | 1,201 (90.3%) | 129 (9.7%) |
| $25,000 to $49,999 | 1,885 (91.9%) | 166 (8.1%) |
| $50,000 to $74,999 | 1,598 (93.1%) | 119 (6.9%) |
| $75,000 to $99,999 | 1,605 (93.5%) | 112 (6.5%) |
| $100,000 and over | 4,354 (92.9%) | 332 (7.1%) |
Public vs Private Health Insurance Coverage by Age in Custer County
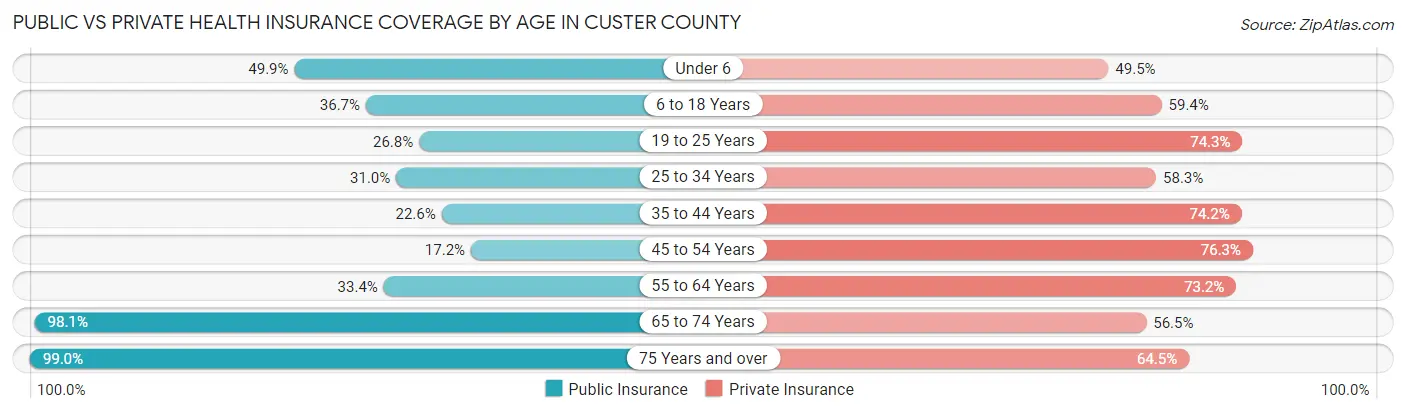
| Age Bracket | Public Insurance | Private Insurance |
| Under 6 | 340 (49.9%) | 337 (49.5%) |
| 6 to 18 Years | 646 (36.7%) | 1,046 (59.4%) |
| 19 to 25 Years | 284 (26.8%) | 788 (74.3%) |
| 25 to 34 Years | 374 (31.0%) | 703 (58.3%) |
| 35 to 44 Years | 341 (22.6%) | 1,119 (74.2%) |
| 45 to 54 Years | 233 (17.2%) | 1,036 (76.3%) |
| 55 to 64 Years | 621 (33.4%) | 1,363 (73.2%) |
| 65 to 74 Years | 1,363 (98.1%) | 785 (56.5%) |
| 75 Years and over | 908 (99.0%) | 591 (64.4%) |
| Total | 5,110 (43.5%) | 7,768 (66.2%) |
Disability Status by Sex by Age in Custer County
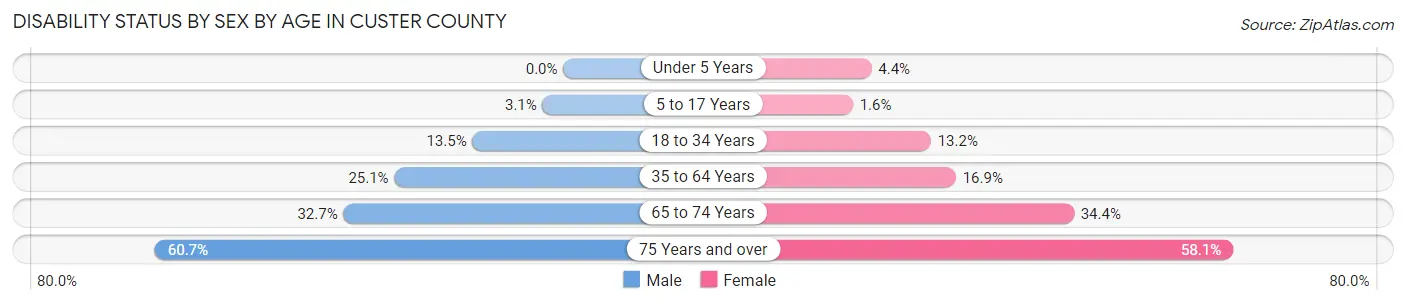
| Age Bracket | Male | Female |
| Under 5 Years | 0 (0.0%) | 13 (4.4%) |
| 5 to 17 Years | 27 (3.1%) | 14 (1.6%) |
| 18 to 34 Years | 177 (13.5%) | 142 (13.2%) |
| 35 to 64 Years | 599 (25.1%) | 396 (16.9%) |
| 65 to 74 Years | 207 (32.7%) | 260 (34.4%) |
| 75 Years and over | 242 (60.7%) | 301 (58.1%) |
Disability Class by Sex by Age in Custer County
Disability Class: Hearing Difficulty
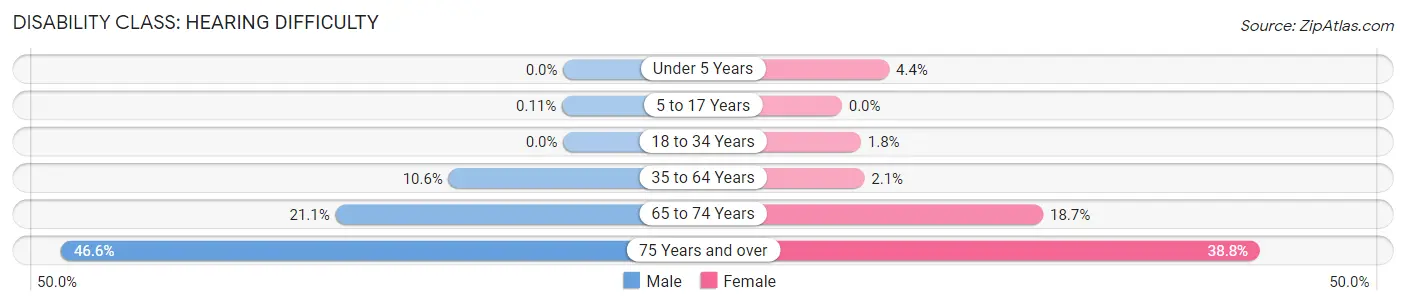
| Age Bracket | Male | Female |
| Under 5 Years | 0 (0.0%) | 13 (4.4%) |
| 5 to 17 Years | 1 (0.1%) | 0 (0.0%) |
| 18 to 34 Years | 0 (0.0%) | 19 (1.8%) |
| 35 to 64 Years | 254 (10.6%) | 49 (2.1%) |
| 65 to 74 Years | 134 (21.1%) | 141 (18.7%) |
| 75 Years and over | 186 (46.6%) | 201 (38.8%) |
Disability Class: Vision Difficulty
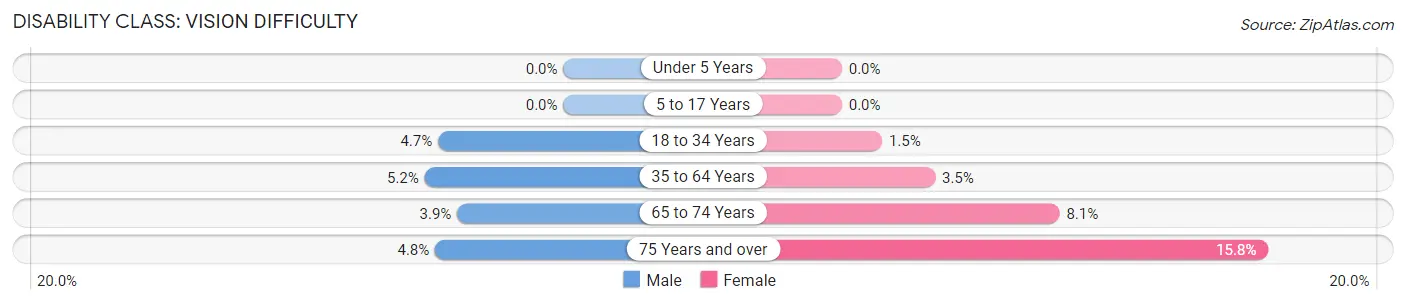
| Age Bracket | Male | Female |
| Under 5 Years | 0 (0.0%) | 0 (0.0%) |
| 5 to 17 Years | 0 (0.0%) | 0 (0.0%) |
| 18 to 34 Years | 61 (4.6%) | 16 (1.5%) |
| 35 to 64 Years | 123 (5.1%) | 81 (3.5%) |
| 65 to 74 Years | 25 (3.9%) | 61 (8.1%) |
| 75 Years and over | 19 (4.8%) | 82 (15.8%) |
Disability Class: Cognitive Difficulty
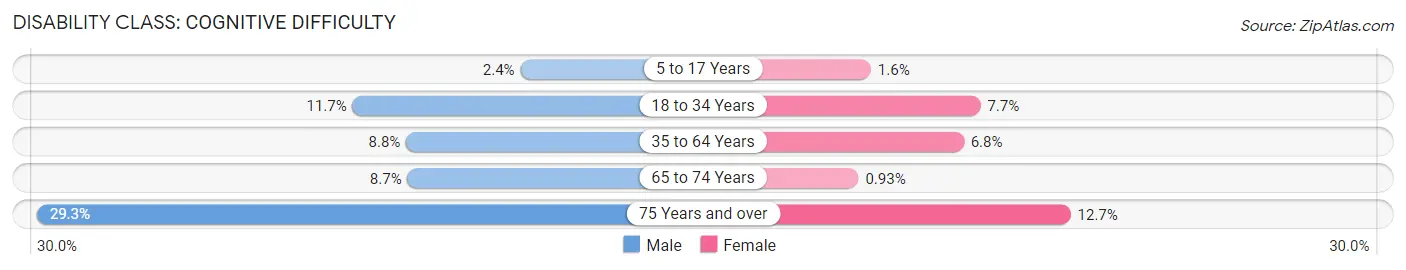
| Age Bracket | Male | Female |
| 5 to 17 Years | 21 (2.4%) | 14 (1.6%) |
| 18 to 34 Years | 154 (11.7%) | 83 (7.7%) |
| 35 to 64 Years | 209 (8.7%) | 159 (6.8%) |
| 65 to 74 Years | 55 (8.7%) | 7 (0.9%) |
| 75 Years and over | 117 (29.3%) | 66 (12.7%) |
Disability Class: Ambulatory Difficulty
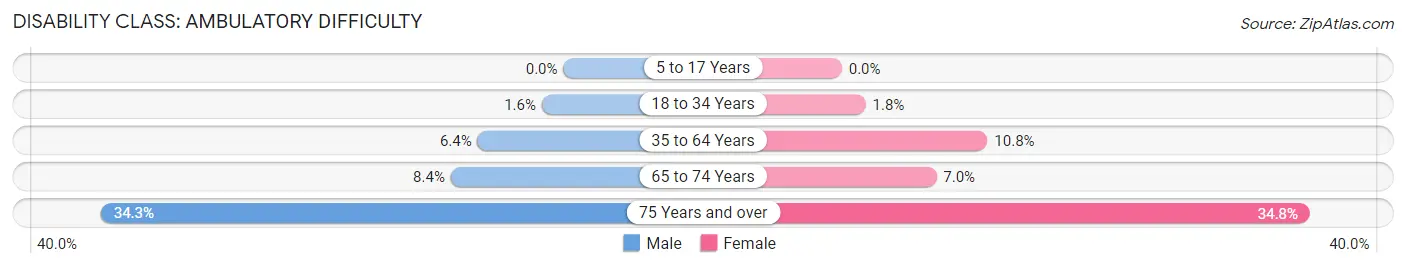
| Age Bracket | Male | Female |
| 5 to 17 Years | 0 (0.0%) | 0 (0.0%) |
| 18 to 34 Years | 21 (1.6%) | 19 (1.8%) |
| 35 to 64 Years | 152 (6.4%) | 253 (10.8%) |
| 65 to 74 Years | 53 (8.4%) | 53 (7.0%) |
| 75 Years and over | 137 (34.3%) | 180 (34.7%) |
Disability Class: Self-Care Difficulty
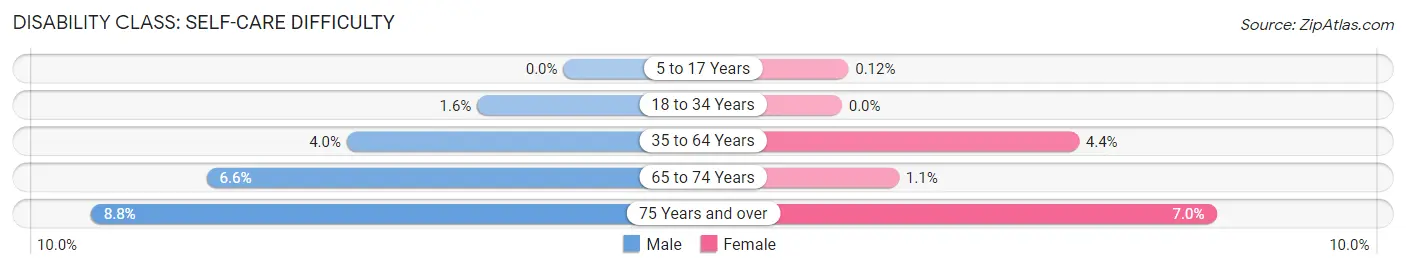
| Age Bracket | Male | Female |
| 5 to 17 Years | 0 (0.0%) | 1 (0.1%) |
| 18 to 34 Years | 21 (1.6%) | 0 (0.0%) |
| 35 to 64 Years | 96 (4.0%) | 103 (4.4%) |
| 65 to 74 Years | 42 (6.6%) | 8 (1.1%) |
| 75 Years and over | 35 (8.8%) | 36 (7.0%) |
Technology Access in Custer County
Computing Device Access in Custer County
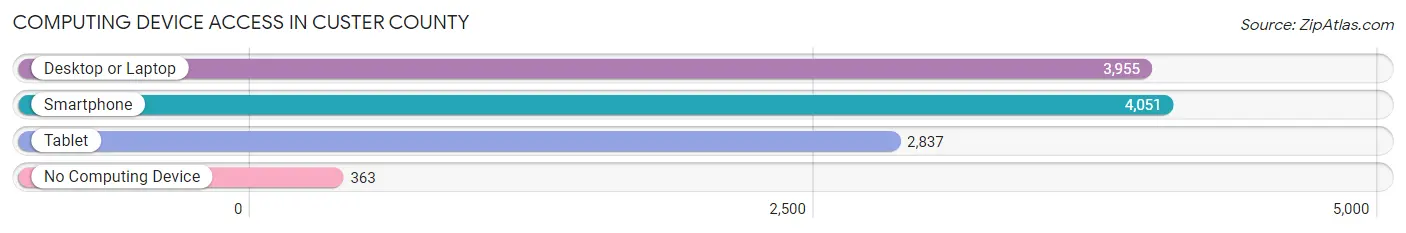
| Device Type | # Households | % Households |
| Desktop or Laptop | 3,955 | 79.2% |
| Smartphone | 4,051 | 81.1% |
| Tablet | 2,837 | 56.8% |
| No Computing Device | 363 | 7.3% |
| Total | 4,996 | 100.0% |
Internet Access in Custer County
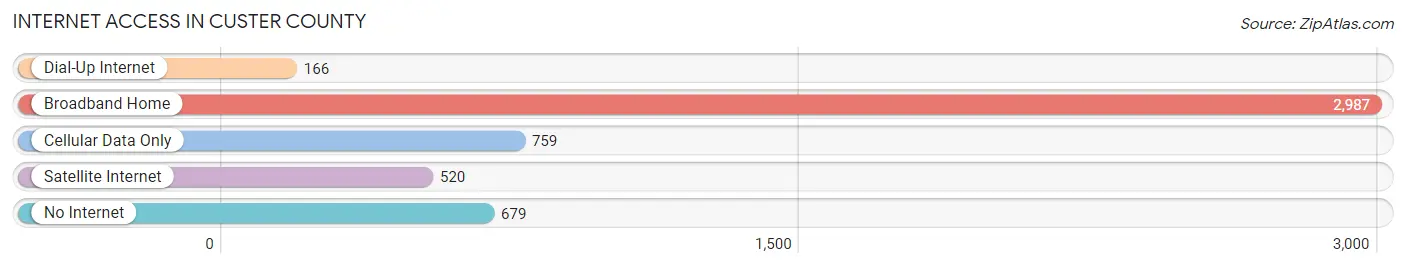
| Internet Type | # Households | % Households |
| Dial-Up Internet | 166 | 3.3% |
| Broadband Home | 2,987 | 59.8% |
| Cellular Data Only | 759 | 15.2% |
| Satellite Internet | 520 | 10.4% |
| No Internet | 679 | 13.6% |
| Total | 4,996 | 100.0% |
Custer County Summary
Custer County, Montana is located in the south-central part of the state and is bordered by Rosebud County to the north, Powder River County to the east, Big Horn County to the south, and Fallon County to the west. The county seat is Miles City, which is also the largest city in the county. Custer County covers an area of 2,845 square miles and has a population of 11,699 as of the 2020 census.
History
Custer County was established in 1877 and named after General George Armstrong Custer, who was killed at the Battle of Little Bighorn in 1876. The county was originally part of the larger Yellowstone County, which was created in 1873. The county was created to provide better government services to the area, which was then largely populated by Native Americans.
The first settlers in the area were ranchers, who began to arrive in the late 1870s. The first town in the county was Miles City, which was founded in 1876. The town was named after General Nelson A. Miles, who had led the campaign against the Sioux and Cheyenne in the area.
The county was largely agricultural in the early years, with cattle ranching being the primary industry. The Northern Pacific Railroad arrived in the area in 1881, which helped to spur economic growth. The town of Miles City quickly became the commercial center of the county, and the county seat.
Geography
Custer County is located in the south-central part of Montana and is bordered by Rosebud County to the north, Powder River County to the east, Big Horn County to the south, and Fallon County to the west. The county covers an area of 2,845 square miles and has a population of 11,699 as of the 2020 census.
The county is largely rural, with the majority of the population living in small towns and rural areas. The county is home to the Tongue River, which flows through the county from north to south. The county is also home to the Custer National Forest, which covers an area of 1,890 square miles.
Economy
The economy of Custer County is largely based on agriculture and ranching. Cattle ranching is the primary industry in the county, with the majority of the land being used for grazing. The county is also home to several large farms, which produce a variety of crops, including wheat, barley, oats, and hay.
The county is also home to several oil and gas fields, which provide jobs and revenue to the county. The county is also home to several coal mines, which provide jobs and revenue to the county.
The county is also home to several tourist attractions, including the Little Bighorn Battlefield National Monument, which is located in the county. The county is also home to several state parks, which attract visitors from around the state and country.
Demographics
As of the 2020 census, Custer County had a population of 11,699. The population is largely white, with the majority of the population being of German, Irish, and English descent. The county also has a small Native American population, with the majority of the population being of Sioux and Cheyenne descent.
The median household income in the county is $45,845, and the median home value is $179,400. The county has a poverty rate of 13.3%, which is slightly higher than the state average of 11.3%. The county also has a high unemployment rate of 6.2%, which is higher than the state average of 4.3%.
Conclusion
Custer County, Montana is located in the south-central part of the state and is bordered by Rosebud County to the north, Powder River County to the east, Big Horn County to the south, and Fallon County to the west. The county covers an area of 2,845 square miles and has a population of 11,699 as of the 2020 census. The economy of the county is largely based on agriculture and ranching, with cattle ranching being the primary industry. The county is also home to several tourist attractions, including the Little Bighorn Battlefield National Monument. The population of the county is largely white, with the majority of the population being of German, Irish, and English descent. The median household income in the county is $45,845, and the median home value is $179,400. The county has a poverty rate of 13.3%, which is slightly higher than the state average of 11.3%.
Common Questions
What is Per Capita Income in Custer County?
Per Capita income in Custer County is $34,830.
What is the Median Family Income in Custer County?
Median Family Income in Custer County is $81,549.
What is the Median Household income in Custer County?
Median Household Income in Custer County is $61,114.
What is Income or Wage Gap in Custer County?
Income or Wage Gap in Custer County is 22.4%.
Women in Custer County earn 77.6 cents for every dollar earned by a man.
What is Inequality or Gini Index in Custer County?
Inequality or Gini Index in Custer County is 0.44.
What is the Total Population of Custer County?
Total Population of Custer County is 11,957.
What is the Total Male Population of Custer County?
Total Male Population of Custer County is 6,024.
What is the Total Female Population of Custer County?
Total Female Population of Custer County is 5,933.
What is the Ratio of Males per 100 Females in Custer County?
There are 101.53 Males per 100 Females in Custer County.
What is the Ratio of Females per 100 Males in Custer County?
There are 98.49 Females per 100 Males in Custer County.
What is the Median Population Age in Custer County?
Median Population Age in Custer County is 42.8 Years.
What is the Average Family Size in Custer County
Average Family Size in Custer County is 2.9 People.
What is the Average Household Size in Custer County
Average Household Size in Custer County is 2.3 People.
How Large is the Labor Force in Custer County?
There are 6,464 People in the Labor Forcein in Custer County.
What is the Percentage of People in the Labor Force in Custer County?
65.2% of People are in the Labor Force in Custer County.
What is the Unemployment Rate in Custer County?
Unemployment Rate in Custer County is 3.3%.