Miles City, MT Map & Demographics
Miles City Map
Miles City Overview
$34,124
PER CAPITA INCOME
$80,539
AVG FAMILY INCOME
$59,578
AVG HOUSEHOLD INCOME
18.0%
WAGE / INCOME GAP [ % ]
82.0¢/ $1
WAGE / INCOME GAP [ $ ]
0.44
INEQUALITY / GINI INDEX
8,432
TOTAL POPULATION
4,258
MALE POPULATION
4,174
FEMALE POPULATION
102.01
MALES / 100 FEMALES
98.03
FEMALES / 100 MALES
42.1
MEDIAN AGE
2.8
AVG FAMILY SIZE
2.2
AVG HOUSEHOLD SIZE
4,703
LABOR FORCE [ PEOPLE ]
66.7%
PERCENT IN LABOR FORCE
4.2%
UNEMPLOYMENT RATE
Miles City Zip Codes
Miles City Area Codes
Income in Miles City
Income Overview in Miles City
Per Capita Income in Miles City is $34,124, while median incomes of families and households are $80,539 and $59,578 respectively.
| Characteristic | Number | Measure |
| Per Capita Income | 8,432 | $34,124 |
| Median Family Income | 2,047 | $80,539 |
| Mean Family Income | 2,047 | $95,224 |
| Median Household Income | 3,627 | $59,578 |
| Mean Household Income | 3,627 | $77,211 |
| Income Deficit | 2,047 | $0 |
| Wage / Income Gap (%) | 8,432 | 17.96% |
| Wage / Income Gap ($) | 8,432 | 82.04¢ per $1 |
| Gini / Inequality Index | 8,432 | 0.44 |
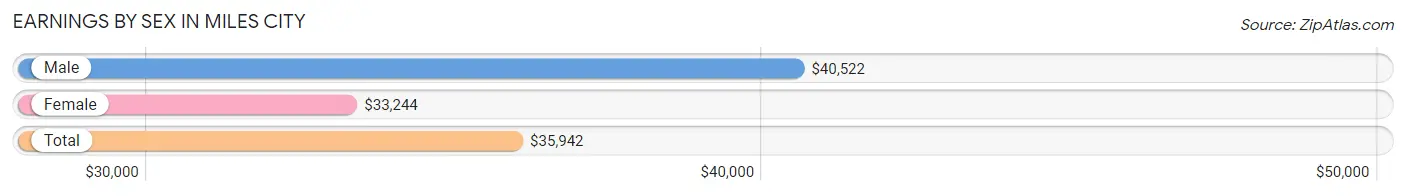
Earnings by Sex in Miles City
Average Earnings in Miles City are $35,942, $40,522 for men and $33,244 for women, a difference of 18.0%.
| Sex | Number | Average Earnings |
| Male | 2,653 (53.4%) | $40,522 |
| Female | 2,319 (46.6%) | $33,244 |
| Total | 4,972 (100.0%) | $35,942 |
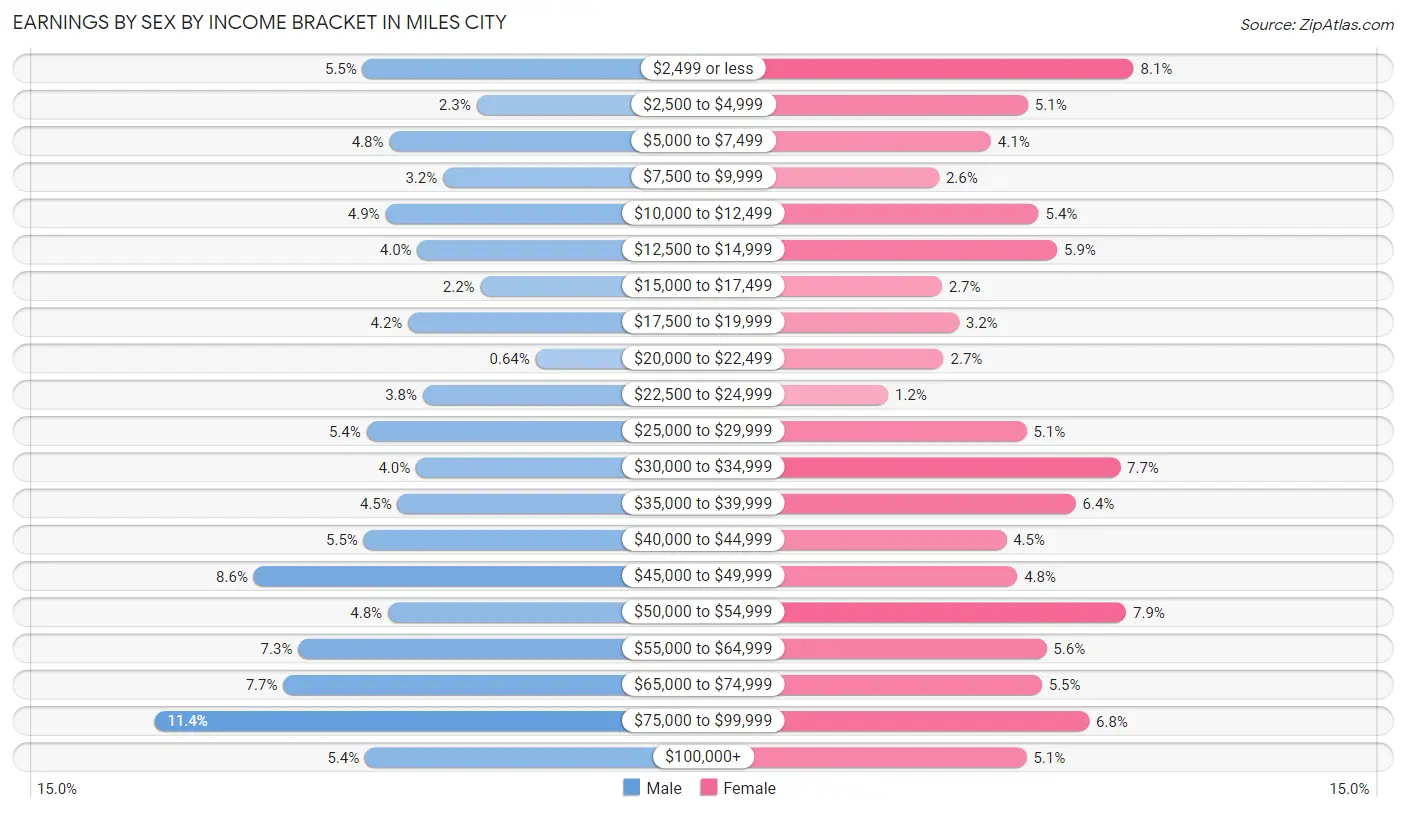
Earnings by Sex by Income Bracket in Miles City
The most common earnings brackets in Miles City are $75,000 to $99,999 for men (301 | 11.4%) and $2,499 or less for women (187 | 8.1%).
| Income | Male | Female |
| $2,499 or less | 146 (5.5%) | 187 (8.1%) |
| $2,500 to $4,999 | 61 (2.3%) | 118 (5.1%) |
| $5,000 to $7,499 | 126 (4.8%) | 94 (4.1%) |
| $7,500 to $9,999 | 86 (3.2%) | 60 (2.6%) |
| $10,000 to $12,499 | 129 (4.9%) | 125 (5.4%) |
| $12,500 to $14,999 | 105 (4.0%) | 137 (5.9%) |
| $15,000 to $17,499 | 58 (2.2%) | 62 (2.7%) |
| $17,500 to $19,999 | 112 (4.2%) | 73 (3.2%) |
| $20,000 to $22,499 | 17 (0.6%) | 63 (2.7%) |
| $22,500 to $24,999 | 101 (3.8%) | 27 (1.2%) |
| $25,000 to $29,999 | 143 (5.4%) | 117 (5.1%) |
| $30,000 to $34,999 | 106 (4.0%) | 178 (7.7%) |
| $35,000 to $39,999 | 120 (4.5%) | 149 (6.4%) |
| $40,000 to $44,999 | 145 (5.5%) | 104 (4.5%) |
| $45,000 to $49,999 | 227 (8.6%) | 111 (4.8%) |
| $50,000 to $54,999 | 127 (4.8%) | 182 (7.9%) |
| $55,000 to $64,999 | 194 (7.3%) | 130 (5.6%) |
| $65,000 to $74,999 | 205 (7.7%) | 127 (5.5%) |
| $75,000 to $99,999 | 301 (11.4%) | 158 (6.8%) |
| $100,000+ | 144 (5.4%) | 117 (5.1%) |
| Total | 2,653 (100.0%) | 2,319 (100.0%) |
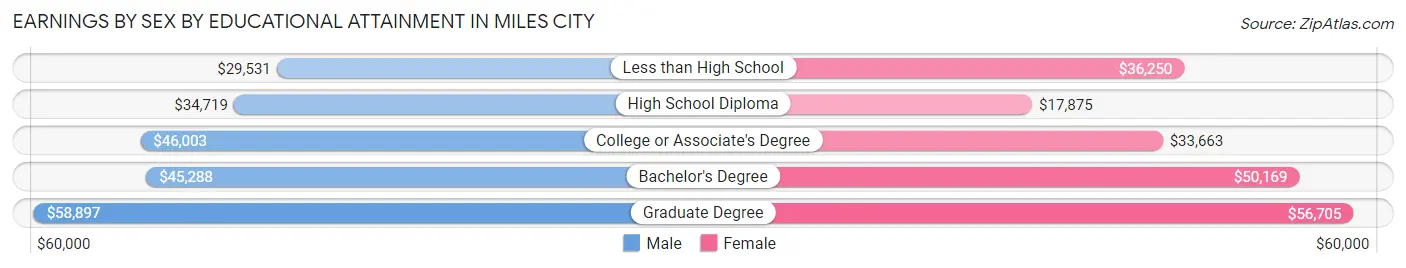
Earnings by Sex by Educational Attainment in Miles City
Average earnings in Miles City are $45,192 for men and $36,524 for women, a difference of 19.2%. Men with an educational attainment of graduate degree enjoy the highest average annual earnings of $58,897, while those with less than high school education earn the least with $29,531. Women with an educational attainment of graduate degree earn the most with the average annual earnings of $56,705, while those with high school diploma education have the smallest earnings of $17,875.
| Educational Attainment | Male Income | Female Income |
| Less than High School | $29,531 | $36,250 |
| High School Diploma | $34,719 | $17,875 |
| College or Associate's Degree | $46,003 | $33,663 |
| Bachelor's Degree | $45,288 | $50,169 |
| Graduate Degree | $58,897 | $56,705 |
| Total | $45,192 | $36,524 |
Family Income in Miles City
Family Income Brackets in Miles City
According to the Miles City family income data, there are 477 families falling into the $100,000 to $149,999 income range, which is the most common income bracket and makes up 23.3% of all families. Conversely, the less than $10,000 income bracket is the least frequent group with only 49 families (2.4%) belonging to this category.
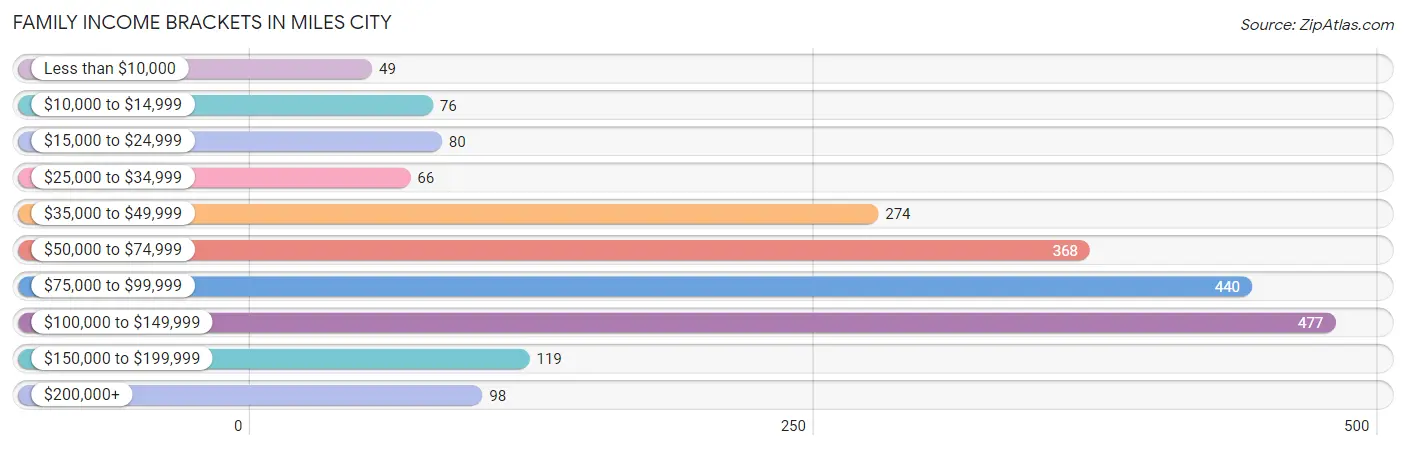
| Income Bracket | # Families | % Families |
| Less than $10,000 | 49 | 2.4% |
| $10,000 to $14,999 | 76 | 3.7% |
| $15,000 to $24,999 | 80 | 3.9% |
| $25,000 to $34,999 | 66 | 3.2% |
| $35,000 to $49,999 | 274 | 13.4% |
| $50,000 to $74,999 | 368 | 18.0% |
| $75,000 to $99,999 | 440 | 21.5% |
| $100,000 to $149,999 | 477 | 23.3% |
| $150,000 to $199,999 | 119 | 5.8% |
| $200,000+ | 98 | 4.8% |
Family Income by Famaliy Size in Miles City
7+ person families (30 | 1.5%) account for the highest median family income in Miles City with $113,333 per family, while 2-person families (1,034 | 50.5%) have the highest median income of $37,551 per family member.
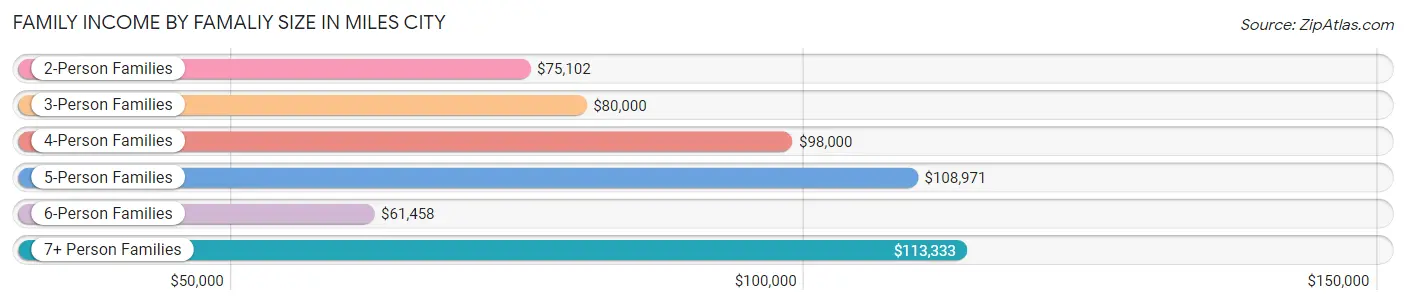
| Income Bracket | # Families | Median Income |
| 2-Person Families | 1,034 (50.5%) | $75,102 |
| 3-Person Families | 416 (20.3%) | $80,000 |
| 4-Person Families | 356 (17.4%) | $98,000 |
| 5-Person Families | 108 (5.3%) | $108,971 |
| 6-Person Families | 103 (5.0%) | $61,458 |
| 7+ Person Families | 30 (1.5%) | $113,333 |
| Total | 2,047 (100.0%) | $80,539 |
Family Income by Number of Earners in Miles City
The median family income in Miles City is $80,539, with families comprising 3+ earners (334) having the highest median family income of $119,632, while families with 1 earner (787) have the lowest median family income of $53,842, accounting for 16.3% and 38.5% of families, respectively.
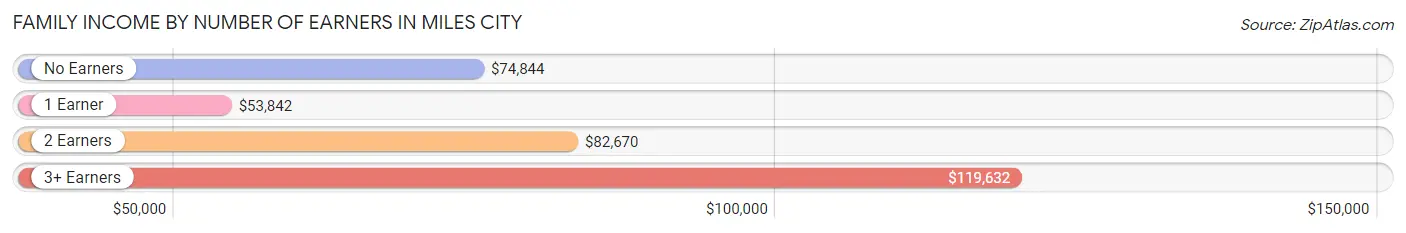
| Number of Earners | # Families | Median Income |
| No Earners | 103 (5.0%) | $74,844 |
| 1 Earner | 787 (38.5%) | $53,842 |
| 2 Earners | 823 (40.2%) | $82,670 |
| 3+ Earners | 334 (16.3%) | $119,632 |
| Total | 2,047 (100.0%) | $80,539 |
Household Income in Miles City
Household Income Brackets in Miles City
With 606 households falling in the category, the $100,000 to $149,999 income range is the most frequent in Miles City, accounting for 16.7% of all households. In contrast, only 116 households (3.2%) fall into the $200,000+ income bracket, making it the least populous group.
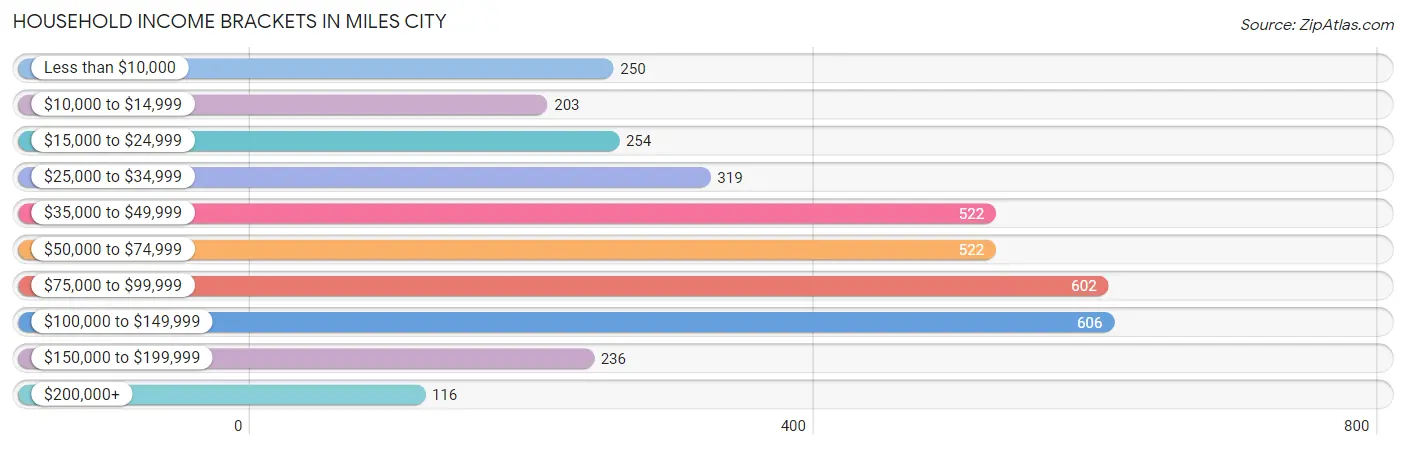
| Income Bracket | # Households | % Households |
| Less than $10,000 | 250 | 6.9% |
| $10,000 to $14,999 | 203 | 5.6% |
| $15,000 to $24,999 | 254 | 7.0% |
| $25,000 to $34,999 | 319 | 8.8% |
| $35,000 to $49,999 | 522 | 14.4% |
| $50,000 to $74,999 | 522 | 14.4% |
| $75,000 to $99,999 | 602 | 16.6% |
| $100,000 to $149,999 | 606 | 16.7% |
| $150,000 to $199,999 | 236 | 6.5% |
| $200,000+ | 116 | 3.2% |
Household Income by Householder Age in Miles City
The median household income in Miles City is $59,578, with the highest median household income of $73,333 found in the 25 to 44 years age bracket for the primary householder. A total of 1,218 households (33.6%) fall into this category. Meanwhile, the 15 to 24 years age bracket for the primary householder has the lowest median household income of $0, with 121 households (3.3%) in this group.
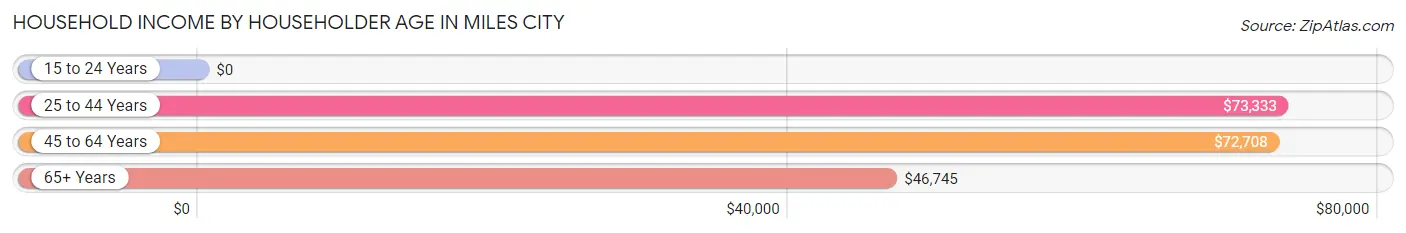
| Income Bracket | # Households | Median Income |
| 15 to 24 Years | 121 (3.3%) | $0 |
| 25 to 44 Years | 1,218 (33.6%) | $73,333 |
| 45 to 64 Years | 1,217 (33.6%) | $72,708 |
| 65+ Years | 1,071 (29.5%) | $46,745 |
| Total | 3,627 (100.0%) | $59,578 |
Poverty in Miles City
Income Below Poverty by Sex and Age in Miles City
With 13.7% poverty level for males and 11.2% for females among the residents of Miles City, 18 to 24 year old males and 15 year old females are the most vulnerable to poverty, with 110 males (26.4%) and 14 females (31.8%) in their respective age groups living below the poverty level.
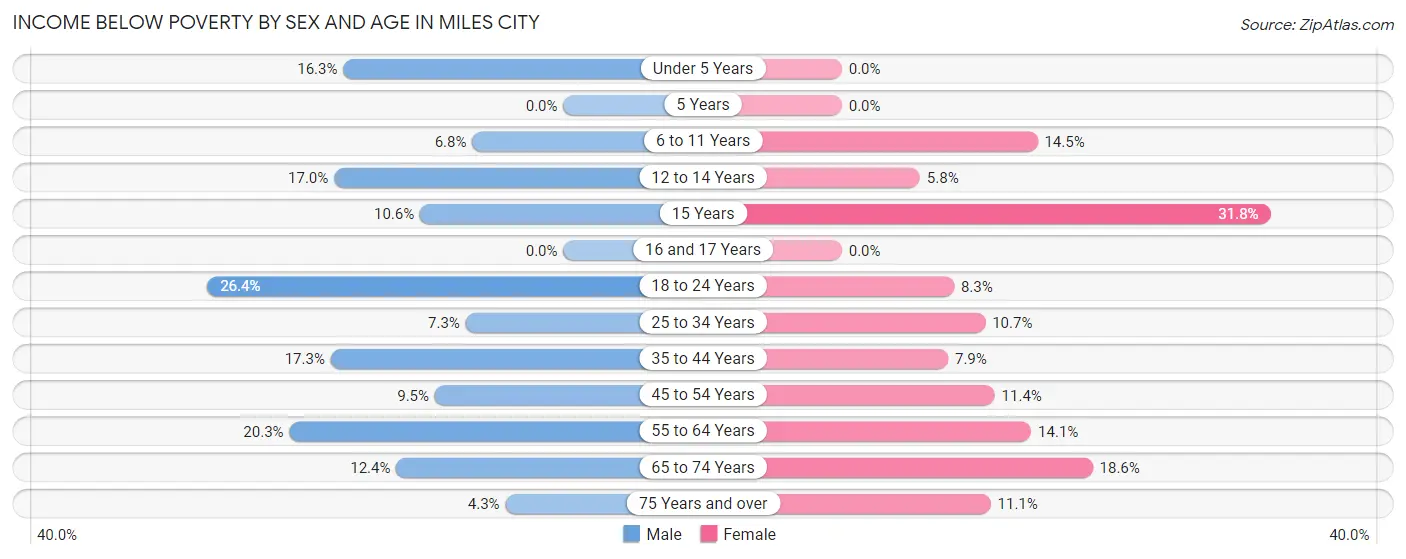
| Age Bracket | Male | Female |
| Under 5 Years | 25 (16.3%) | 0 (0.0%) |
| 5 Years | 0 (0.0%) | 0 (0.0%) |
| 6 to 11 Years | 19 (6.8%) | 34 (14.5%) |
| 12 to 14 Years | 32 (17.0%) | 8 (5.8%) |
| 15 Years | 5 (10.6%) | 14 (31.8%) |
| 16 and 17 Years | 0 (0.0%) | 0 (0.0%) |
| 18 to 24 Years | 110 (26.4%) | 18 (8.3%) |
| 25 to 34 Years | 42 (7.2%) | 51 (10.6%) |
| 35 to 44 Years | 91 (17.3%) | 39 (7.9%) |
| 45 to 54 Years | 46 (9.5%) | 58 (11.4%) |
| 55 to 64 Years | 133 (20.3%) | 90 (14.1%) |
| 65 to 74 Years | 46 (12.4%) | 92 (18.6%) |
| 75 Years and over | 12 (4.3%) | 42 (11.1%) |
| Total | 561 (13.7%) | 446 (11.2%) |
Income Above Poverty by Sex and Age in Miles City
According to the poverty statistics in Miles City, males aged 5 years and females aged under 5 years are the age groups that are most secure financially, with 100.0% of males and 100.0% of females in these age groups living above the poverty line.
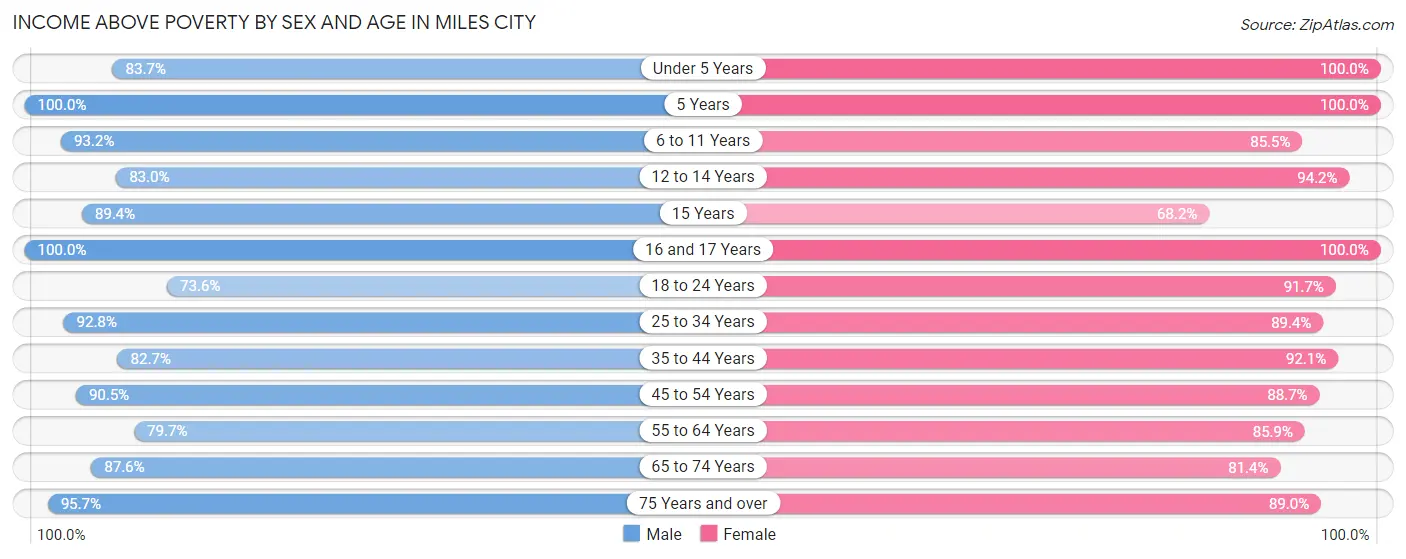
| Age Bracket | Male | Female |
| Under 5 Years | 128 (83.7%) | 201 (100.0%) |
| 5 Years | 13 (100.0%) | 33 (100.0%) |
| 6 to 11 Years | 262 (93.2%) | 200 (85.5%) |
| 12 to 14 Years | 156 (83.0%) | 130 (94.2%) |
| 15 Years | 42 (89.4%) | 30 (68.2%) |
| 16 and 17 Years | 102 (100.0%) | 117 (100.0%) |
| 18 to 24 Years | 306 (73.6%) | 198 (91.7%) |
| 25 to 34 Years | 537 (92.7%) | 428 (89.3%) |
| 35 to 44 Years | 436 (82.7%) | 455 (92.1%) |
| 45 to 54 Years | 436 (90.5%) | 453 (88.6%) |
| 55 to 64 Years | 521 (79.7%) | 550 (85.9%) |
| 65 to 74 Years | 325 (87.6%) | 402 (81.4%) |
| 75 Years and over | 267 (95.7%) | 338 (88.9%) |
| Total | 3,531 (86.3%) | 3,535 (88.8%) |
Income Below Poverty Among Married-Couple Families in Miles City
The poverty statistics for married-couple families in Miles City show that 5.5% or 87 of the total 1,569 families live below the poverty line. Families with 3 or 4 children have the highest poverty rate of 14.6%, comprising of 19 families. On the other hand, families with 5 or more children have the lowest poverty rate of 0.0%, which includes 0 families.
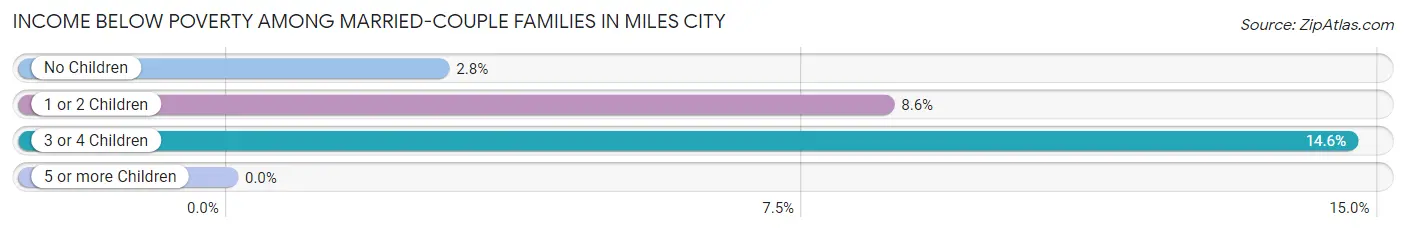
| Children | Above Poverty | Below Poverty |
| No Children | 882 (97.2%) | 25 (2.8%) |
| 1 or 2 Children | 459 (91.4%) | 43 (8.6%) |
| 3 or 4 Children | 111 (85.4%) | 19 (14.6%) |
| 5 or more Children | 30 (100.0%) | 0 (0.0%) |
| Total | 1,482 (94.5%) | 87 (5.5%) |
Income Below Poverty Among Single-Parent Households in Miles City
According to the poverty data in Miles City, 3.7% or 6 single-father households and 22.3% or 71 single-mother households are living below the poverty line. Among single-father households, those with 1 or 2 children have the highest poverty rate, with 6 households (6.9%) experiencing poverty. Likewise, among single-mother households, those with no children have the highest poverty rate, with 47 households (40.9%) falling below the poverty line.
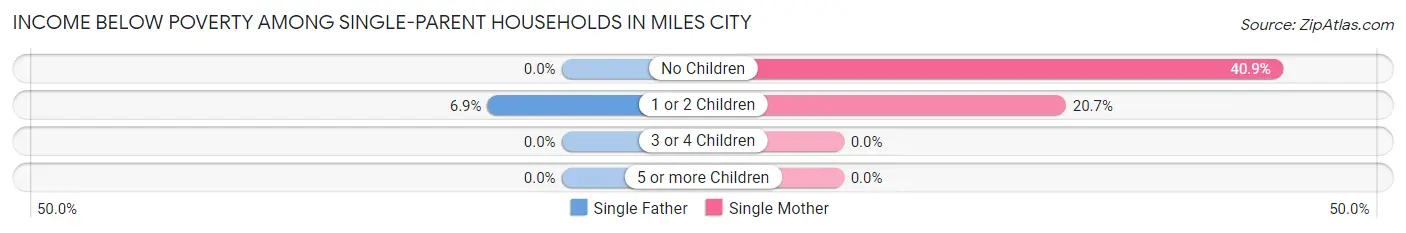
| Children | Single Father | Single Mother |
| No Children | 0 (0.0%) | 47 (40.9%) |
| 1 or 2 Children | 6 (6.9%) | 24 (20.7%) |
| 3 or 4 Children | 0 (0.0%) | 0 (0.0%) |
| 5 or more Children | 0 (0.0%) | 0 (0.0%) |
| Total | 6 (3.7%) | 71 (22.3%) |
Income Below Poverty Among Married-Couple vs Single-Parent Households in Miles City
The poverty data for Miles City shows that 87 of the married-couple family households (5.5%) and 77 of the single-parent households (16.1%) are living below the poverty level. Within the married-couple family households, those with 3 or 4 children have the highest poverty rate, with 19 households (14.6%) falling below the poverty line. Among the single-parent households, those with no children have the highest poverty rate, with 47 household (26.9%) living below poverty.
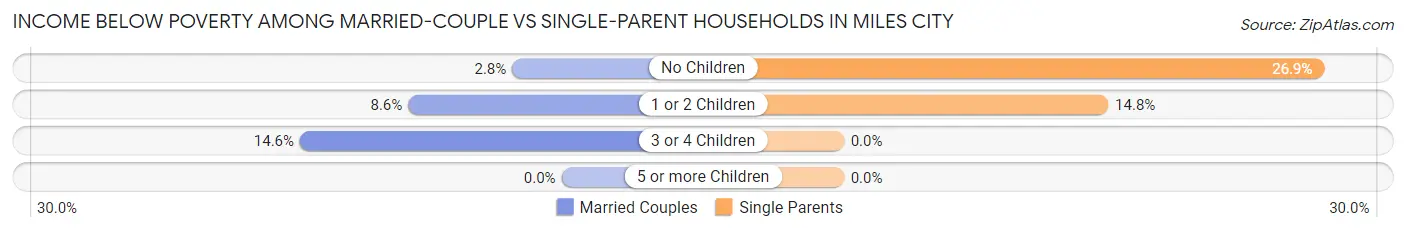
| Children | Married-Couple Families | Single-Parent Households |
| No Children | 25 (2.8%) | 47 (26.9%) |
| 1 or 2 Children | 43 (8.6%) | 30 (14.8%) |
| 3 or 4 Children | 19 (14.6%) | 0 (0.0%) |
| 5 or more Children | 0 (0.0%) | 0 (0.0%) |
| Total | 87 (5.5%) | 77 (16.1%) |
Race in Miles City
The most populous races in Miles City are White / Caucasian (7,708 | 91.4%), Two or more Races (443 | 5.2%), and Hispanic or Latino (389 | 4.6%).
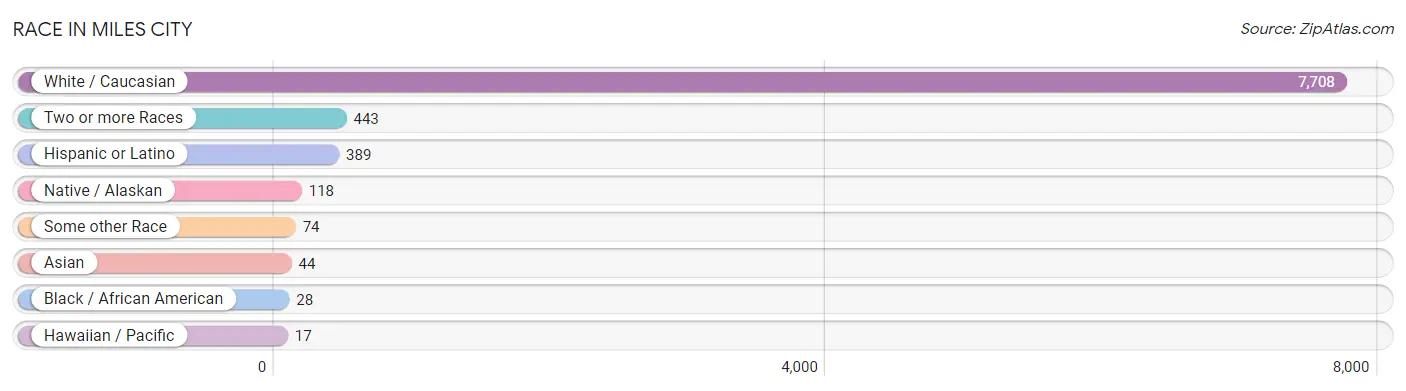
| Race | # Population | % Population |
| Asian | 44 | 0.5% |
| Black / African American | 28 | 0.3% |
| Hawaiian / Pacific | 17 | 0.2% |
| Hispanic or Latino | 389 | 4.6% |
| Native / Alaskan | 118 | 1.4% |
| White / Caucasian | 7,708 | 91.4% |
| Two or more Races | 443 | 5.2% |
| Some other Race | 74 | 0.9% |
| Total | 8,432 | 100.0% |
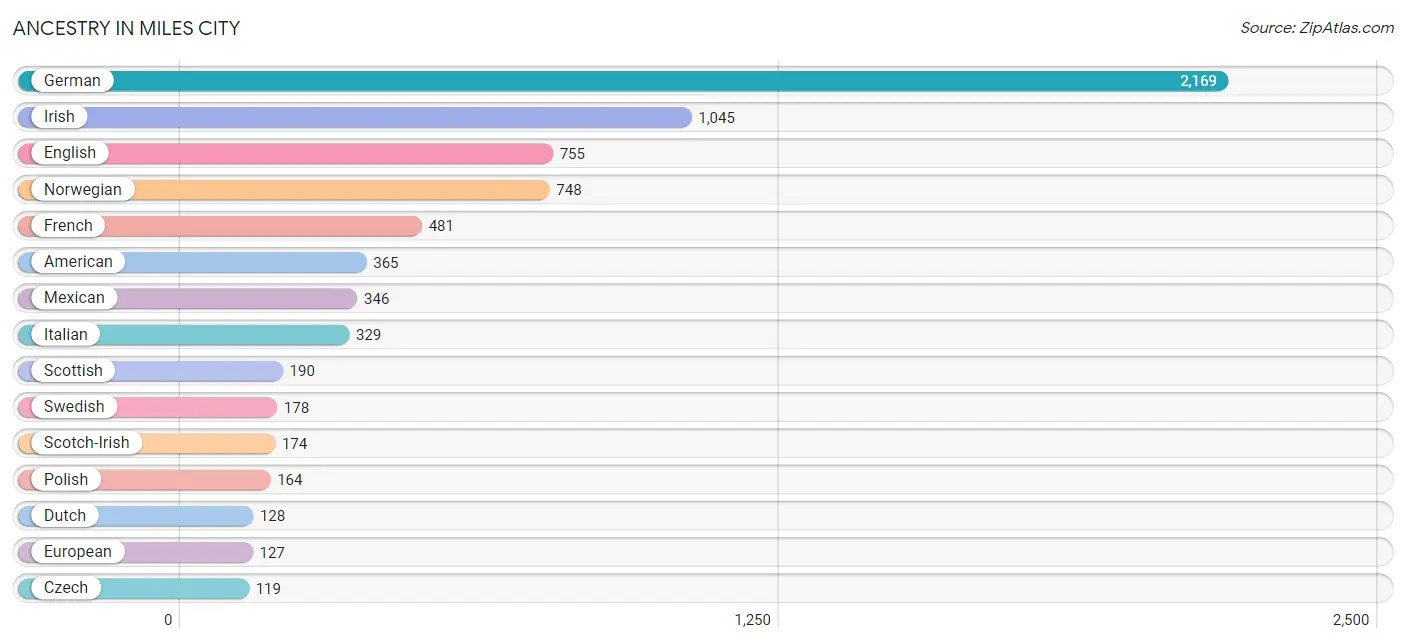
Ancestry in Miles City
The most populous ancestries reported in Miles City are German (2,169 | 25.7%), Irish (1,045 | 12.4%), English (755 | 8.9%), Norwegian (748 | 8.9%), and French (481 | 5.7%), together accounting for 61.6% of all Miles City residents.
| Ancestry | # Population | % Population |
| African | 28 | 0.3% |
| American | 365 | 4.3% |
| Armenian | 20 | 0.2% |
| Assyrian / Chaldean / Syriac | 6 | 0.1% |
| Austrian | 17 | 0.2% |
| Basque | 9 | 0.1% |
| Bhutanese | 16 | 0.2% |
| Blackfeet | 19 | 0.2% |
| British | 35 | 0.4% |
| Bulgarian | 6 | 0.1% |
| Canadian | 10 | 0.1% |
| Central American | 19 | 0.2% |
| Cherokee | 24 | 0.3% |
| Cheyenne | 86 | 1.0% |
| Chippewa | 26 | 0.3% |
| Cree | 26 | 0.3% |
| Croatian | 14 | 0.2% |
| Crow | 1 | 0.0% |
| Czech | 119 | 1.4% |
| Danish | 96 | 1.1% |
| Dominican | 8 | 0.1% |
| Dutch | 128 | 1.5% |
| English | 755 | 8.9% |
| European | 127 | 1.5% |
| Finnish | 75 | 0.9% |
| French | 481 | 5.7% |
| French Canadian | 78 | 0.9% |
| German | 2,169 | 25.7% |
| Greek | 10 | 0.1% |
| Guatemalan | 19 | 0.2% |
| Hungarian | 62 | 0.7% |
| Indian (Asian) | 17 | 0.2% |
| Iranian | 3 | 0.0% |
| Irish | 1,045 | 12.4% |
| Italian | 329 | 3.9% |
| Korean | 9 | 0.1% |
| Mexican | 346 | 4.1% |
| Native Hawaiian | 4 | 0.1% |
| Northern European | 19 | 0.2% |
| Norwegian | 748 | 8.9% |
| Polish | 164 | 1.9% |
| Portuguese | 23 | 0.3% |
| Potawatomi | 7 | 0.1% |
| Russian | 34 | 0.4% |
| Samoan | 13 | 0.2% |
| Scandinavian | 38 | 0.4% |
| Scotch-Irish | 174 | 2.1% |
| Scottish | 190 | 2.2% |
| Shoshone | 21 | 0.3% |
| Sioux | 63 | 0.7% |
| Slovak | 7 | 0.1% |
| Spaniard | 5 | 0.1% |
| Spanish | 11 | 0.1% |
| Sri Lankan | 34 | 0.4% |
| Subsaharan African | 28 | 0.3% |
| Swedish | 178 | 2.1% |
| Swiss | 30 | 0.4% |
| Ukrainian | 15 | 0.2% |
| Welsh | 104 | 1.2% |
| Yugoslavian | 60 | 0.7% | View All 60 Rows |
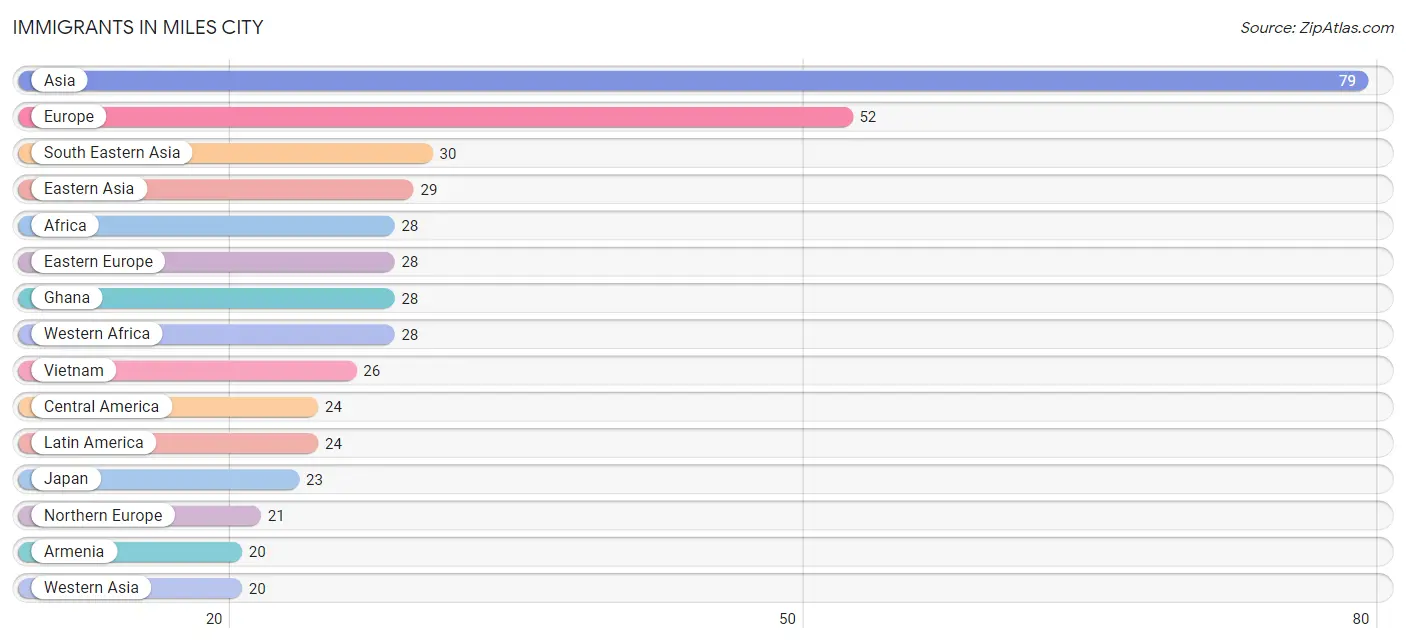
Immigrants in Miles City
The most numerous immigrant groups reported in Miles City came from Asia (79 | 0.9%), Europe (52 | 0.6%), South Eastern Asia (30 | 0.4%), Eastern Asia (29 | 0.3%), and Africa (28 | 0.3%), together accounting for 2.6% of all Miles City residents.
| Immigration Origin | # Population | % Population |
| Africa | 28 | 0.3% |
| Armenia | 20 | 0.2% |
| Asia | 79 | 0.9% |
| Australia | 3 | 0.0% |
| Canada | 6 | 0.1% |
| Central America | 24 | 0.3% |
| China | 6 | 0.1% |
| Eastern Asia | 29 | 0.3% |
| Eastern Europe | 28 | 0.3% |
| England | 4 | 0.1% |
| Europe | 52 | 0.6% |
| Germany | 3 | 0.0% |
| Ghana | 28 | 0.3% |
| Guatemala | 19 | 0.2% |
| Japan | 23 | 0.3% |
| Latin America | 24 | 0.3% |
| Mexico | 5 | 0.1% |
| Northern Europe | 21 | 0.3% |
| Oceania | 3 | 0.0% |
| Philippines | 4 | 0.1% |
| Poland | 15 | 0.2% |
| Russia | 13 | 0.2% |
| South Eastern Asia | 30 | 0.4% |
| Vietnam | 26 | 0.3% |
| Western Africa | 28 | 0.3% |
| Western Asia | 20 | 0.2% |
| Western Europe | 3 | 0.0% | View All 27 Rows |
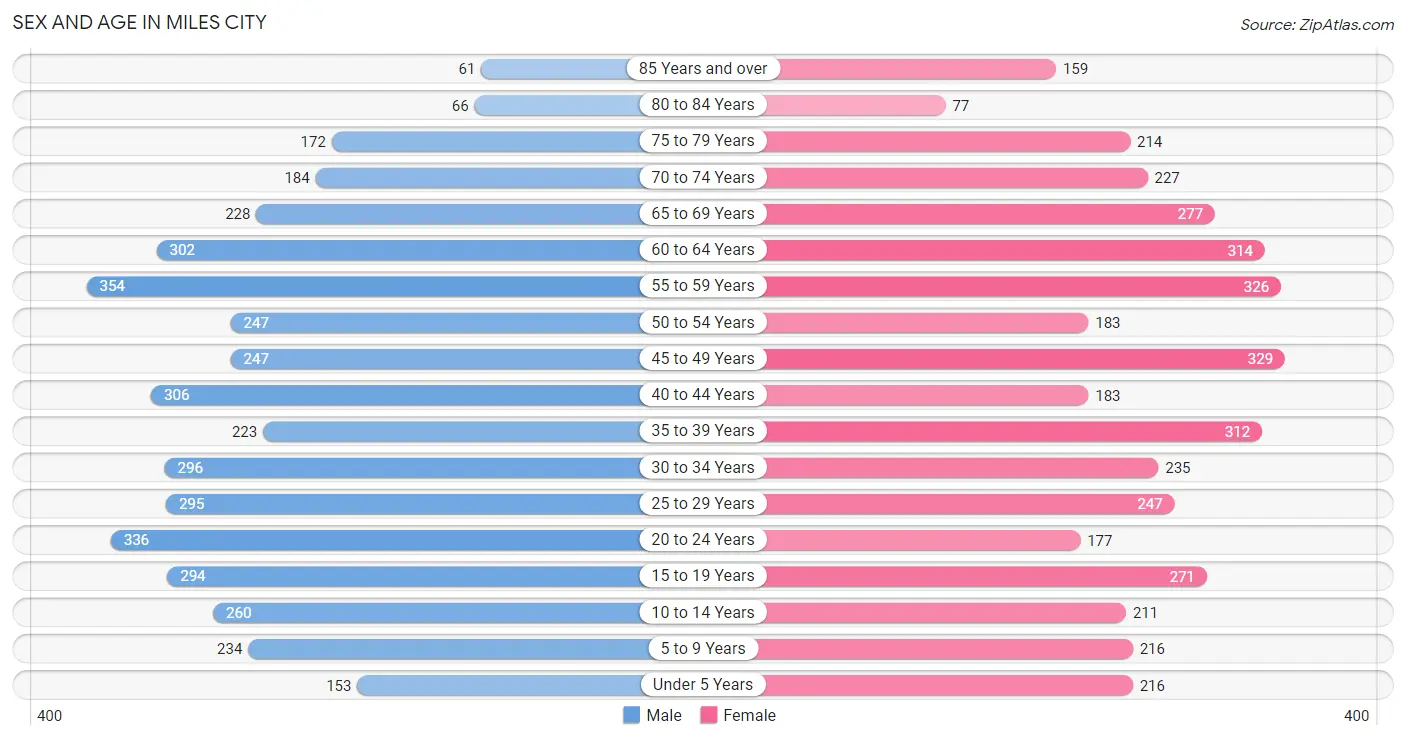
Sex and Age in Miles City
Sex and Age in Miles City
The most populous age groups in Miles City are 55 to 59 Years (354 | 8.3%) for men and 45 to 49 Years (329 | 7.9%) for women.
| Age Bracket | Male | Female |
| Under 5 Years | 153 (3.6%) | 216 (5.2%) |
| 5 to 9 Years | 234 (5.5%) | 216 (5.2%) |
| 10 to 14 Years | 260 (6.1%) | 211 (5.1%) |
| 15 to 19 Years | 294 (6.9%) | 271 (6.5%) |
| 20 to 24 Years | 336 (7.9%) | 177 (4.2%) |
| 25 to 29 Years | 295 (6.9%) | 247 (5.9%) |
| 30 to 34 Years | 296 (7.0%) | 235 (5.6%) |
| 35 to 39 Years | 223 (5.2%) | 312 (7.5%) |
| 40 to 44 Years | 306 (7.2%) | 183 (4.4%) |
| 45 to 49 Years | 247 (5.8%) | 329 (7.9%) |
| 50 to 54 Years | 247 (5.8%) | 183 (4.4%) |
| 55 to 59 Years | 354 (8.3%) | 326 (7.8%) |
| 60 to 64 Years | 302 (7.1%) | 314 (7.5%) |
| 65 to 69 Years | 228 (5.3%) | 277 (6.6%) |
| 70 to 74 Years | 184 (4.3%) | 227 (5.4%) |
| 75 to 79 Years | 172 (4.0%) | 214 (5.1%) |
| 80 to 84 Years | 66 (1.5%) | 77 (1.8%) |
| 85 Years and over | 61 (1.4%) | 159 (3.8%) |
| Total | 4,258 (100.0%) | 4,174 (100.0%) |
Families and Households in Miles City
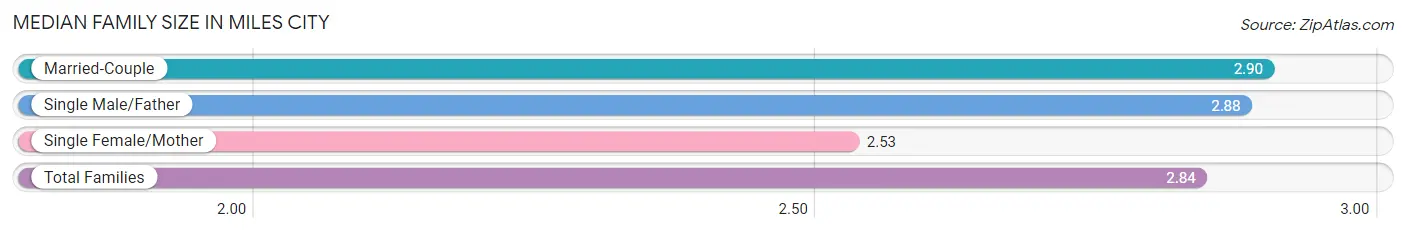
Median Family Size in Miles City
The median family size in Miles City is 2.84 persons per family, with married-couple families (1,569 | 76.6%) accounting for the largest median family size of 2.9 persons per family. On the other hand, single female/mother families (318 | 15.5%) represent the smallest median family size with 2.53 persons per family.
| Family Type | # Families | Family Size |
| Married-Couple | 1,569 (76.6%) | 2.90 |
| Single Male/Father | 160 (7.8%) | 2.88 |
| Single Female/Mother | 318 (15.5%) | 2.53 |
| Total Families | 2,047 (100.0%) | 2.84 |
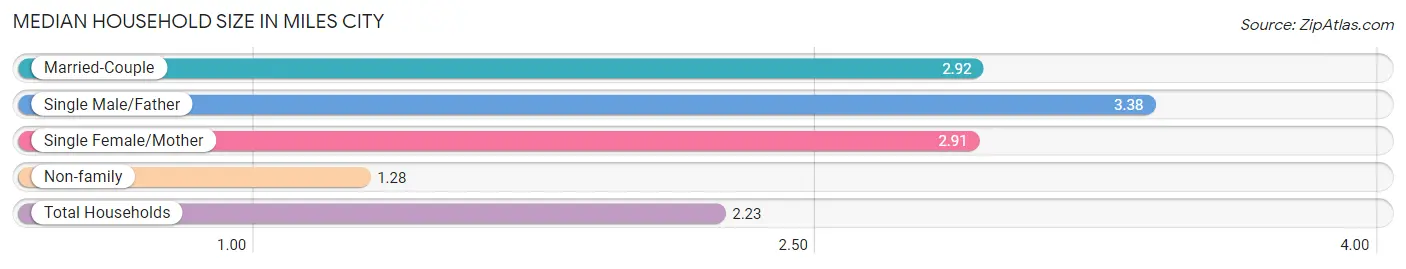
Median Household Size in Miles City
The median household size in Miles City is 2.23 persons per household, with single male/father households (160 | 4.4%) accounting for the largest median household size of 3.38 persons per household. non-family households (1,580 | 43.6%) represent the smallest median household size with 1.28 persons per household.
| Household Type | # Households | Household Size |
| Married-Couple | 1,569 (43.3%) | 2.92 |
| Single Male/Father | 160 (4.4%) | 3.38 |
| Single Female/Mother | 318 (8.8%) | 2.91 |
| Non-family | 1,580 (43.6%) | 1.28 |
| Total Households | 3,627 (100.0%) | 2.23 |
Household Size by Marriage Status in Miles City
Out of a total of 3,627 households in Miles City, 2,047 (56.4%) are family households, while 1,580 (43.6%) are nonfamily households. The most numerous type of family households are 2-person households, comprising 967, and the most common type of nonfamily households are 1-person households, comprising 1,309.
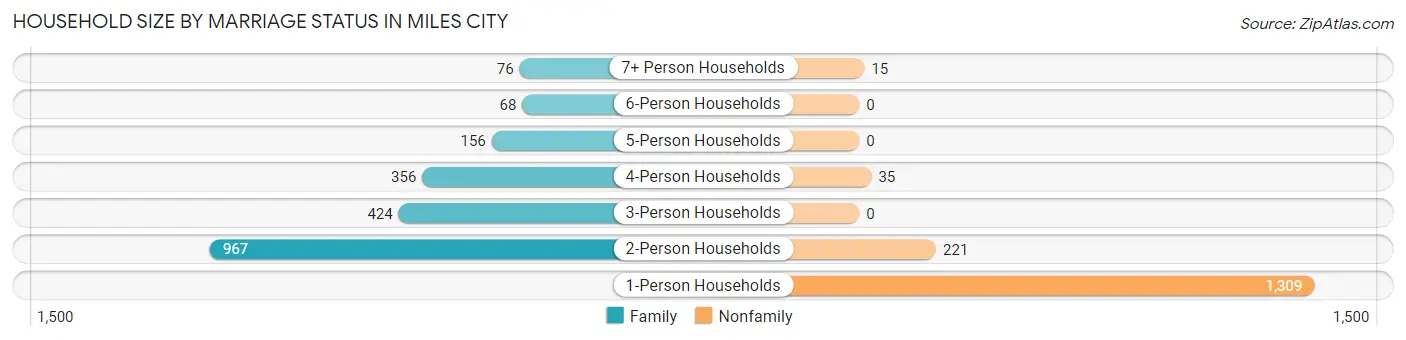
| Household Size | Family Households | Nonfamily Households |
| 1-Person Households | - | 1,309 (36.1%) |
| 2-Person Households | 967 (26.7%) | 221 (6.1%) |
| 3-Person Households | 424 (11.7%) | 0 (0.0%) |
| 4-Person Households | 356 (9.8%) | 35 (1.0%) |
| 5-Person Households | 156 (4.3%) | 0 (0.0%) |
| 6-Person Households | 68 (1.9%) | 0 (0.0%) |
| 7+ Person Households | 76 (2.1%) | 15 (0.4%) |
| Total | 2,047 (56.4%) | 1,580 (43.6%) |
Female Fertility in Miles City
Fertility by Age in Miles City
Average fertility rate in Miles City is 49.0 births per 1,000 women. Women in the age bracket of 20 to 34 years have the highest fertility rate with 77.0 births per 1,000 women. Women in the age bracket of 20 to 34 years acount for 59.3% of all women with births.
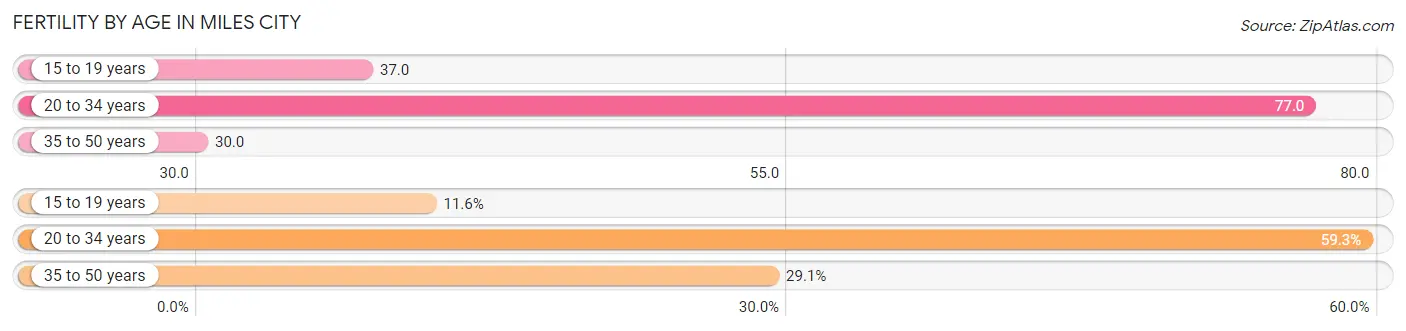
| Age Bracket | Women with Births | Births / 1,000 Women |
| 15 to 19 years | 10 (11.6%) | 37.0 |
| 20 to 34 years | 51 (59.3%) | 77.0 |
| 35 to 50 years | 25 (29.1%) | 30.0 |
| Total | 86 (100.0%) | 49.0 |
Fertility by Age by Marriage Status in Miles City
65.1% of women with births (86) in Miles City are married. The highest percentage of unmarried women with births falls into 15 to 19 years age bracket with 100.0% of them unmarried at the time of birth, while the lowest percentage of unmarried women with births belong to 35 to 50 years age bracket with 0.0% of them unmarried.
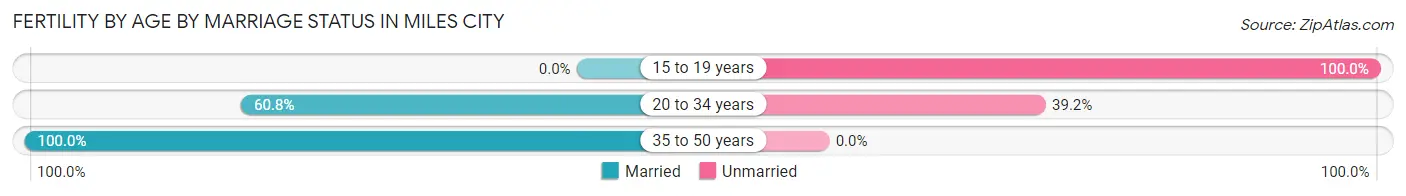
| Age Bracket | Married | Unmarried |
| 15 to 19 years | 0 (0.0%) | 10 (100.0%) |
| 20 to 34 years | 31 (60.8%) | 20 (39.2%) |
| 35 to 50 years | 25 (100.0%) | 0 (0.0%) |
| Total | 56 (65.1%) | 30 (34.9%) |
Fertility by Education in Miles City
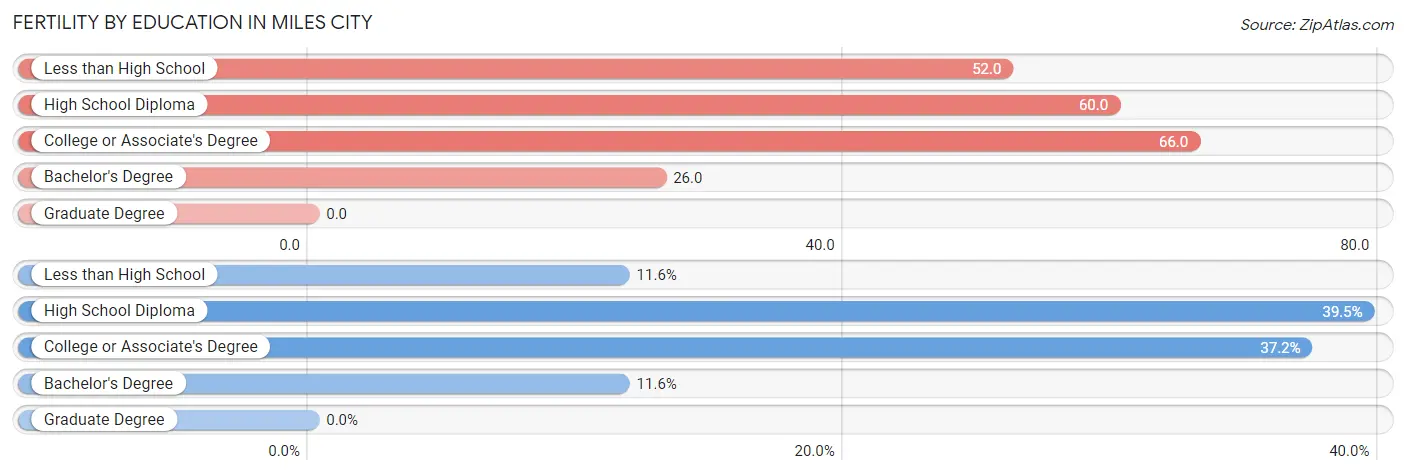
| Educational Attainment | Women with Births | Births / 1,000 Women |
| Less than High School | 10 (11.6%) | 52.0 |
| High School Diploma | 34 (39.5%) | 60.0 |
| College or Associate's Degree | 32 (37.2%) | 66.0 |
| Bachelor's Degree | 10 (11.6%) | 26.0 |
| Graduate Degree | 0 (0.0%) | 0.0 |
| Total | 86 (100.0%) | 49.0 |
Fertility by Education by Marriage Status in Miles City
34.9% of women with births in Miles City are unmarried. Women with the educational attainment of college or associate's degree are most likely to be married with 100.0% of them married at childbirth, while women with the educational attainment of less than high school are least likely to be married with 100.0% of them unmarried at childbirth.
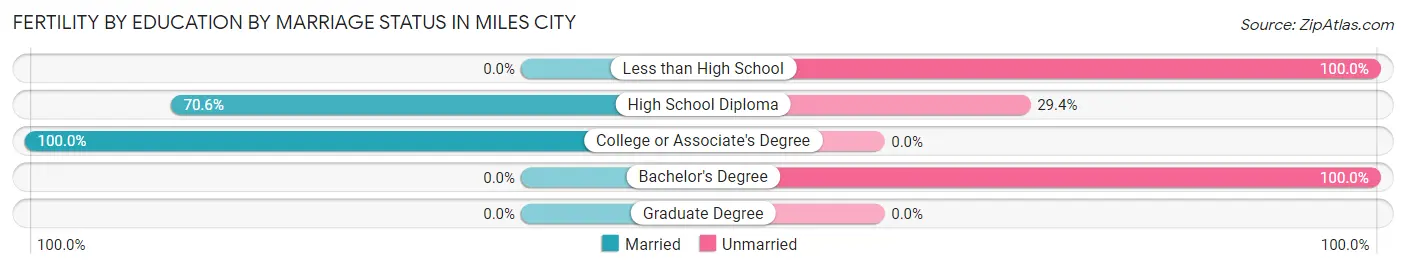
| Educational Attainment | Married | Unmarried |
| Less than High School | 0 (0.0%) | 10 (100.0%) |
| High School Diploma | 24 (70.6%) | 10 (29.4%) |
| College or Associate's Degree | 32 (100.0%) | 0 (0.0%) |
| Bachelor's Degree | 0 (0.0%) | 10 (100.0%) |
| Graduate Degree | 0 (0.0%) | 0 (0.0%) |
| Total | 56 (65.1%) | 30 (34.9%) |
Employment Characteristics in Miles City
Employment by Class of Employer in Miles City
Among the 4,419 employed individuals in Miles City, private company employees (2,671 | 60.4%), local government employees (419 | 9.5%), and not-for-profit organizations (355 | 8.0%) make up the most common classes of employment.
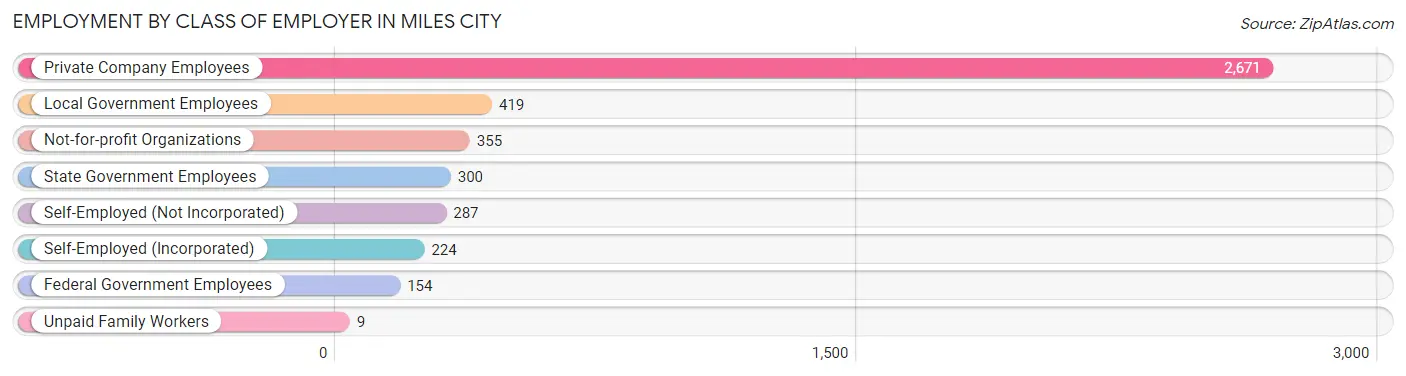
| Employer Class | # Employees | % Employees |
| Private Company Employees | 2,671 | 60.4% |
| Self-Employed (Incorporated) | 224 | 5.1% |
| Self-Employed (Not Incorporated) | 287 | 6.5% |
| Not-for-profit Organizations | 355 | 8.0% |
| Local Government Employees | 419 | 9.5% |
| State Government Employees | 300 | 6.8% |
| Federal Government Employees | 154 | 3.5% |
| Unpaid Family Workers | 9 | 0.2% |
| Total | 4,419 | 100.0% |
Employment Status by Age in Miles City
According to the labor force statistics for Miles City, out of the total population over 16 years of age (7,051), 66.7% or 4,703 individuals are in the labor force, with 4.2% or 198 of them unemployed. The age group with the highest labor force participation rate is 30 to 34 years, with 93.4% or 496 individuals in the labor force. Within the labor force, the 16 to 19 years age range has the highest percentage of unemployed individuals, with 19.0% or 55 of them being unemployed.
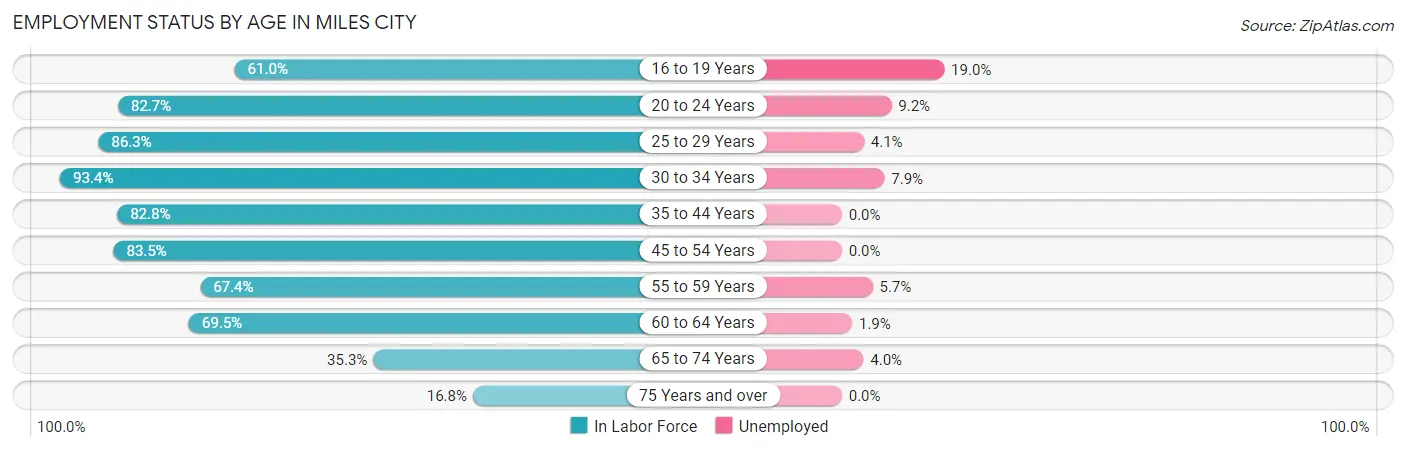
| Age Bracket | In Labor Force | Unemployed |
| 16 to 19 Years | 289 (61.0%) | 55 (19.0%) |
| 20 to 24 Years | 424 (82.7%) | 39 (9.2%) |
| 25 to 29 Years | 468 (86.3%) | 19 (4.1%) |
| 30 to 34 Years | 496 (93.4%) | 39 (7.9%) |
| 35 to 44 Years | 848 (82.8%) | 0 (0.0%) |
| 45 to 54 Years | 840 (83.5%) | 0 (0.0%) |
| 55 to 59 Years | 458 (67.4%) | 26 (5.7%) |
| 60 to 64 Years | 428 (69.5%) | 8 (1.9%) |
| 65 to 74 Years | 323 (35.3%) | 13 (4.0%) |
| 75 Years and over | 126 (16.8%) | 0 (0.0%) |
| Total | 4,703 (66.7%) | 198 (4.2%) |
Employment Status by Educational Attainment in Miles City
According to labor force statistics for Miles City, 80.4% of individuals (3,537) out of the total population between 25 and 64 years of age (4,399) are in the labor force, with 2.6% or 92 of them being unemployed. The group with the highest labor force participation rate are those with the educational attainment of bachelor's degree or higher, with 95.1% or 1,053 individuals in the labor force. Within the labor force, individuals with bachelor's degree or higher education have the highest percentage of unemployment, with 3.7% or 39 of them being unemployed.
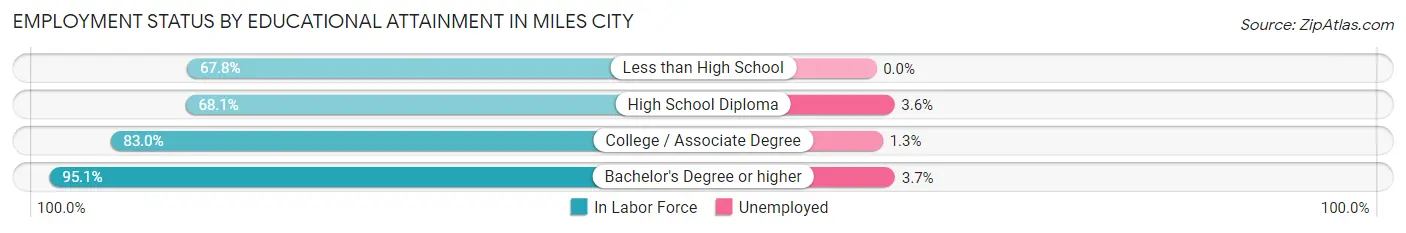
| Educational Attainment | In Labor Force | Unemployed |
| Less than High School | 166 (67.8%) | 0 (0.0%) |
| High School Diploma | 959 (68.1%) | 51 (3.6%) |
| College / Associate Degree | 1,360 (83.0%) | 21 (1.3%) |
| Bachelor's Degree or higher | 1,053 (95.1%) | 41 (3.7%) |
| Total | 3,537 (80.4%) | 114 (2.6%) |
Employment Occupations by Sex in Miles City
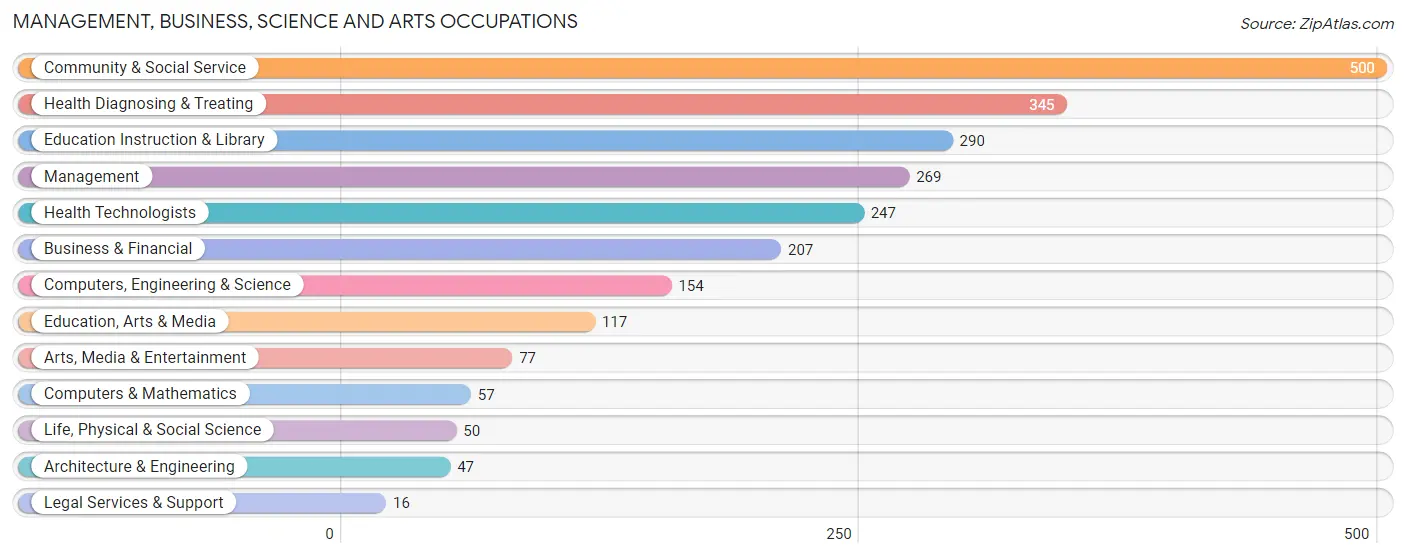
Management, Business, Science and Arts Occupations
The most common Management, Business, Science and Arts occupations in Miles City are Community & Social Service (500 | 11.1%), Health Diagnosing & Treating (345 | 7.7%), Education Instruction & Library (290 | 6.4%), Management (269 | 6.0%), and Health Technologists (247 | 5.5%).
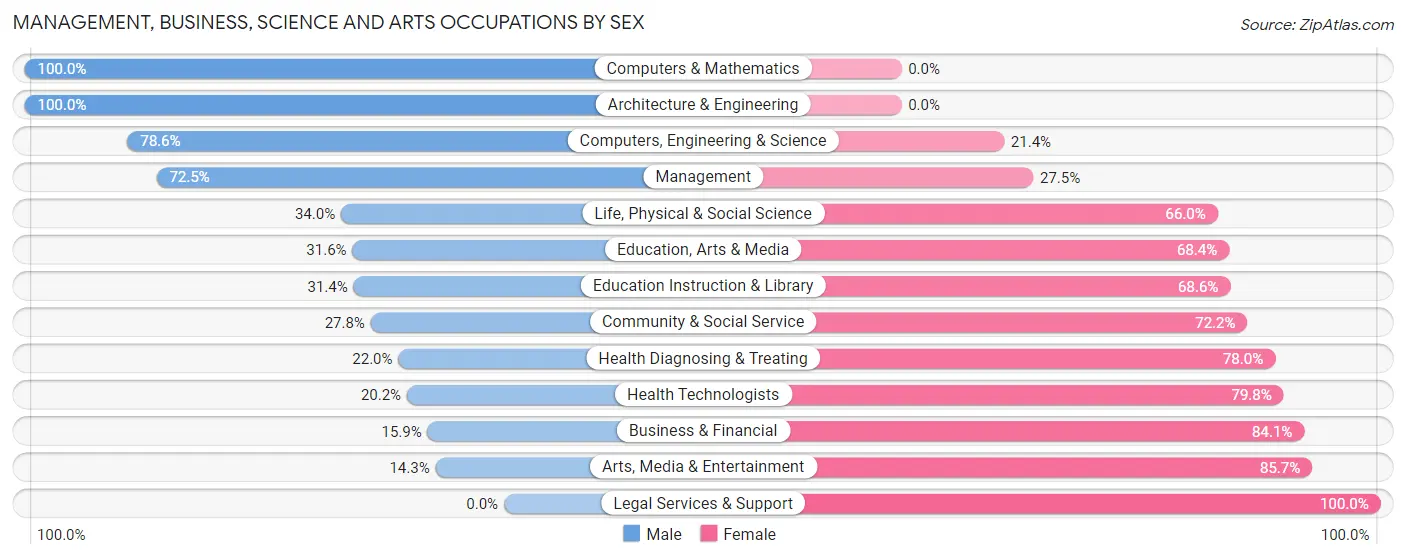
Management, Business, Science and Arts Occupations by Sex
Within the Management, Business, Science and Arts occupations in Miles City, the most male-oriented occupations are Computers & Mathematics (100.0%), Architecture & Engineering (100.0%), and Computers, Engineering & Science (78.6%), while the most female-oriented occupations are Legal Services & Support (100.0%), Arts, Media & Entertainment (85.7%), and Business & Financial (84.1%).
| Occupation | Male | Female |
| Management | 195 (72.5%) | 74 (27.5%) |
| Business & Financial | 33 (15.9%) | 174 (84.1%) |
| Computers, Engineering & Science | 121 (78.6%) | 33 (21.4%) |
| Computers & Mathematics | 57 (100.0%) | 0 (0.0%) |
| Architecture & Engineering | 47 (100.0%) | 0 (0.0%) |
| Life, Physical & Social Science | 17 (34.0%) | 33 (66.0%) |
| Community & Social Service | 139 (27.8%) | 361 (72.2%) |
| Education, Arts & Media | 37 (31.6%) | 80 (68.4%) |
| Legal Services & Support | 0 (0.0%) | 16 (100.0%) |
| Education Instruction & Library | 91 (31.4%) | 199 (68.6%) |
| Arts, Media & Entertainment | 11 (14.3%) | 66 (85.7%) |
| Health Diagnosing & Treating | 76 (22.0%) | 269 (78.0%) |
| Health Technologists | 50 (20.2%) | 197 (79.8%) |
| Total (Category) | 564 (38.2%) | 911 (61.8%) |
| Total (Overall) | 2,396 (53.2%) | 2,105 (46.8%) |
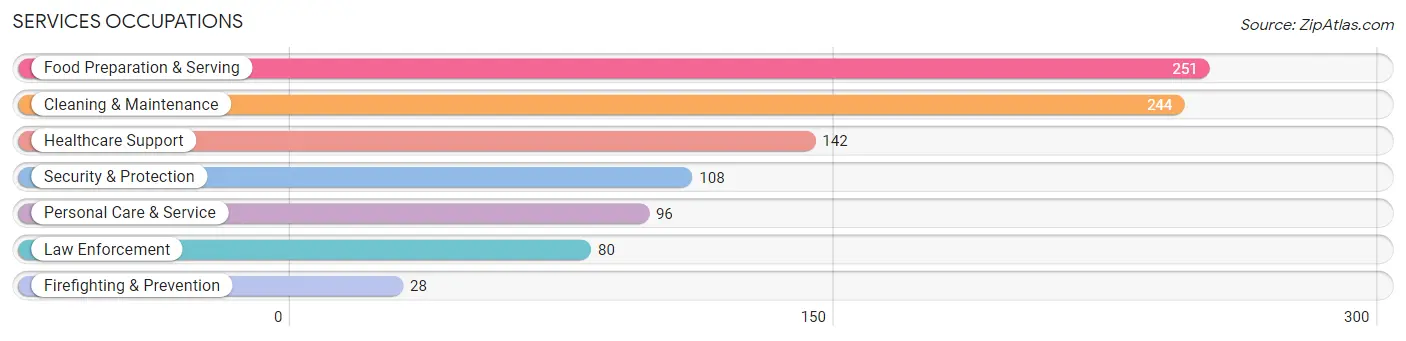
Services Occupations
The most common Services occupations in Miles City are Food Preparation & Serving (251 | 5.6%), Cleaning & Maintenance (244 | 5.4%), Healthcare Support (142 | 3.2%), Security & Protection (108 | 2.4%), and Personal Care & Service (96 | 2.1%).
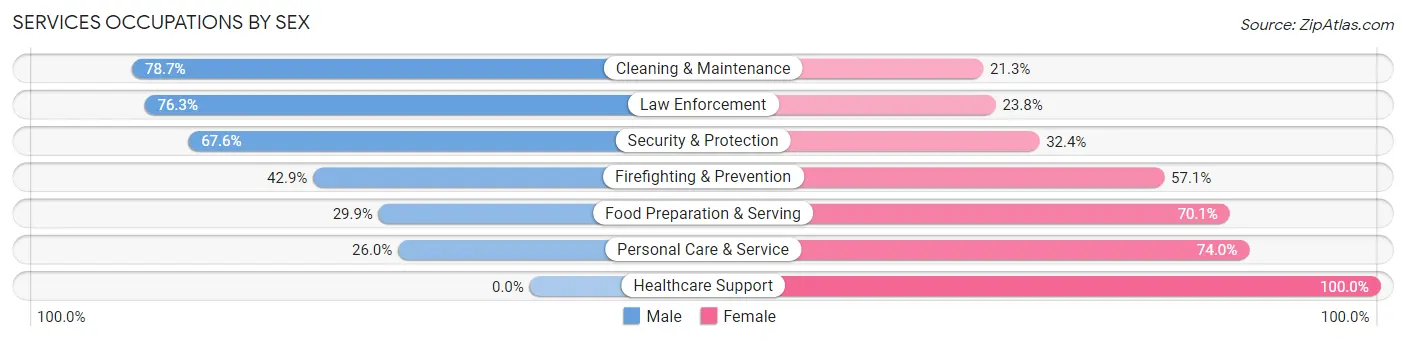
Services Occupations by Sex
Within the Services occupations in Miles City, the most male-oriented occupations are Cleaning & Maintenance (78.7%), Law Enforcement (76.2%), and Security & Protection (67.6%), while the most female-oriented occupations are Healthcare Support (100.0%), Personal Care & Service (74.0%), and Food Preparation & Serving (70.1%).
| Occupation | Male | Female |
| Healthcare Support | 0 (0.0%) | 142 (100.0%) |
| Security & Protection | 73 (67.6%) | 35 (32.4%) |
| Firefighting & Prevention | 12 (42.9%) | 16 (57.1%) |
| Law Enforcement | 61 (76.2%) | 19 (23.7%) |
| Food Preparation & Serving | 75 (29.9%) | 176 (70.1%) |
| Cleaning & Maintenance | 192 (78.7%) | 52 (21.3%) |
| Personal Care & Service | 25 (26.0%) | 71 (74.0%) |
| Total (Category) | 365 (43.4%) | 476 (56.6%) |
| Total (Overall) | 2,396 (53.2%) | 2,105 (46.8%) |
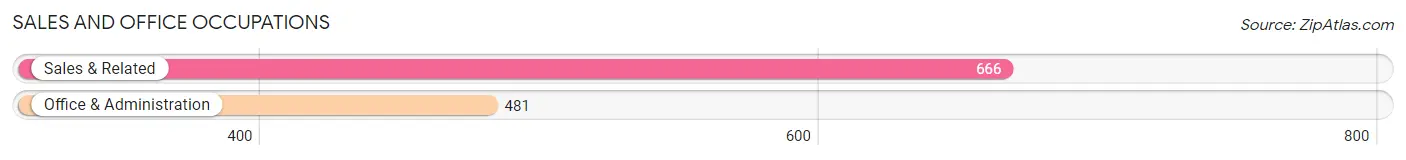
Sales and Office Occupations
The most common Sales and Office occupations in Miles City are Sales & Related (666 | 14.8%), and Office & Administration (481 | 10.7%).
Sales and Office Occupations by Sex
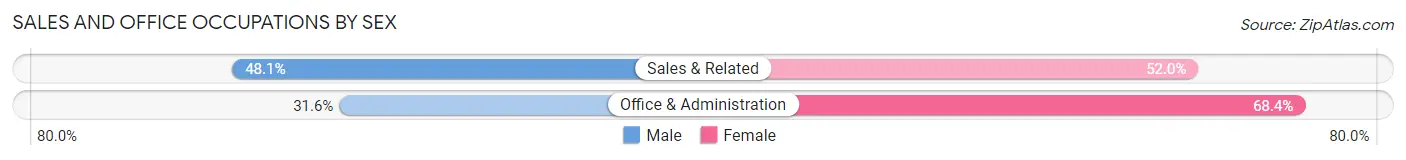
| Occupation | Male | Female |
| Sales & Related | 320 (48.0%) | 346 (51.9%) |
| Office & Administration | 152 (31.6%) | 329 (68.4%) |
| Total (Category) | 472 (41.1%) | 675 (58.9%) |
| Total (Overall) | 2,396 (53.2%) | 2,105 (46.8%) |
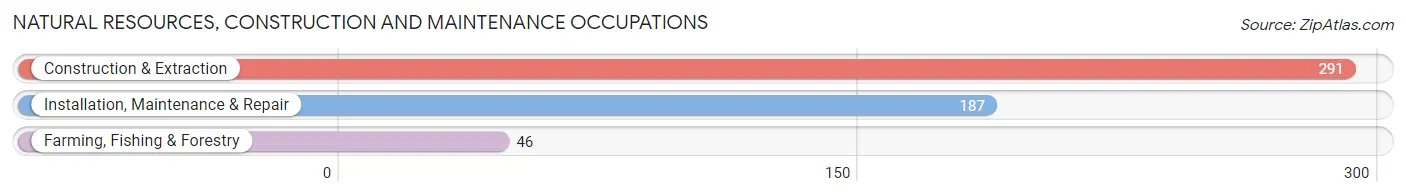
Natural Resources, Construction and Maintenance Occupations
The most common Natural Resources, Construction and Maintenance occupations in Miles City are Construction & Extraction (291 | 6.5%), Installation, Maintenance & Repair (187 | 4.2%), and Farming, Fishing & Forestry (46 | 1.0%).
Natural Resources, Construction and Maintenance Occupations by Sex
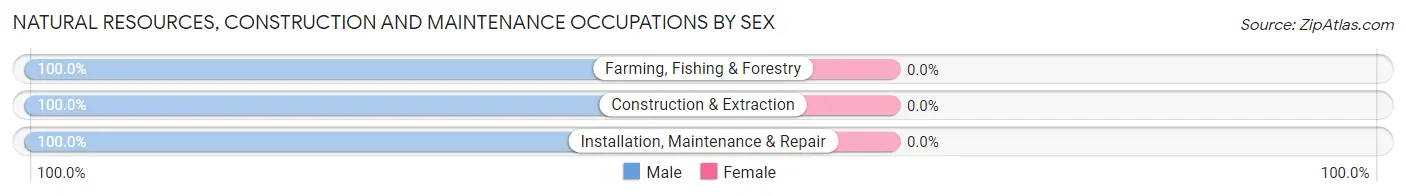
| Occupation | Male | Female |
| Farming, Fishing & Forestry | 46 (100.0%) | 0 (0.0%) |
| Construction & Extraction | 291 (100.0%) | 0 (0.0%) |
| Installation, Maintenance & Repair | 187 (100.0%) | 0 (0.0%) |
| Total (Category) | 524 (100.0%) | 0 (0.0%) |
| Total (Overall) | 2,396 (53.2%) | 2,105 (46.8%) |
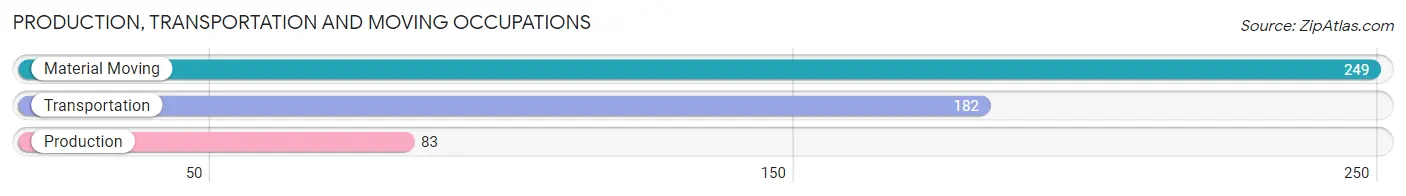
Production, Transportation and Moving Occupations
The most common Production, Transportation and Moving occupations in Miles City are Material Moving (249 | 5.5%), Transportation (182 | 4.0%), and Production (83 | 1.8%).
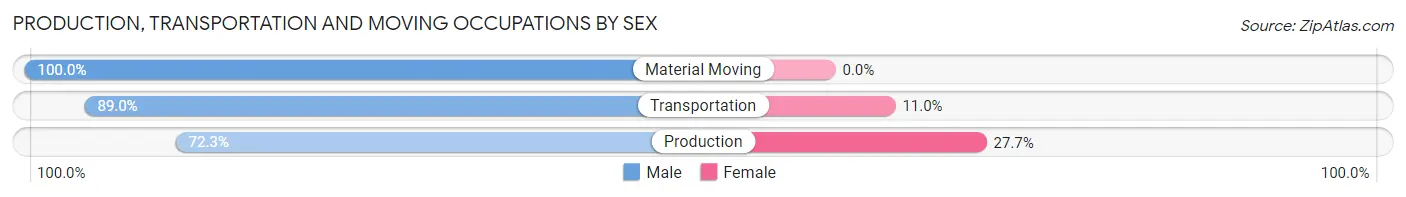
Production, Transportation and Moving Occupations by Sex
| Occupation | Male | Female |
| Production | 60 (72.3%) | 23 (27.7%) |
| Transportation | 162 (89.0%) | 20 (11.0%) |
| Material Moving | 249 (100.0%) | 0 (0.0%) |
| Total (Category) | 471 (91.6%) | 43 (8.4%) |
| Total (Overall) | 2,396 (53.2%) | 2,105 (46.8%) |
Employment Industries by Sex in Miles City
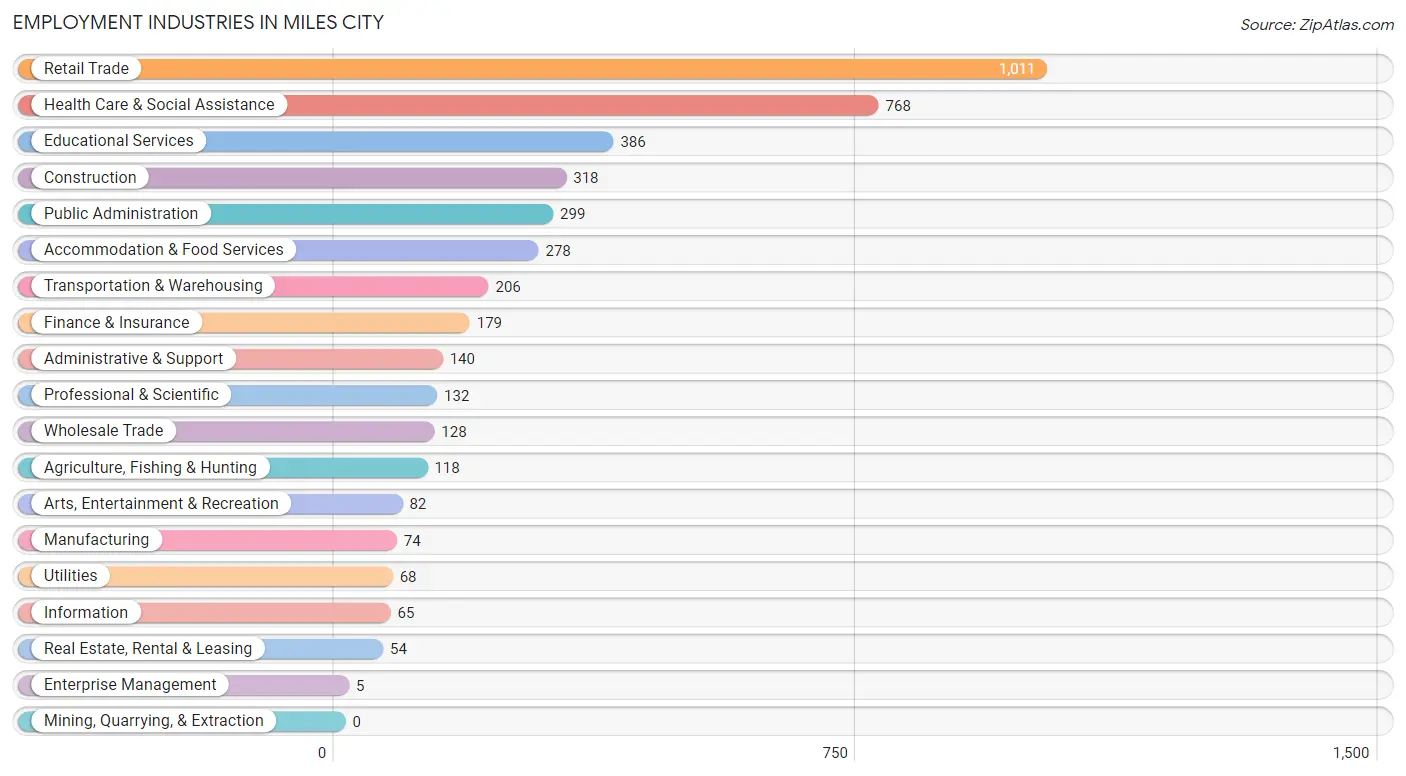
Employment Industries in Miles City
The major employment industries in Miles City include Retail Trade (1,011 | 22.5%), Health Care & Social Assistance (768 | 17.1%), Educational Services (386 | 8.6%), Construction (318 | 7.1%), and Public Administration (299 | 6.6%).
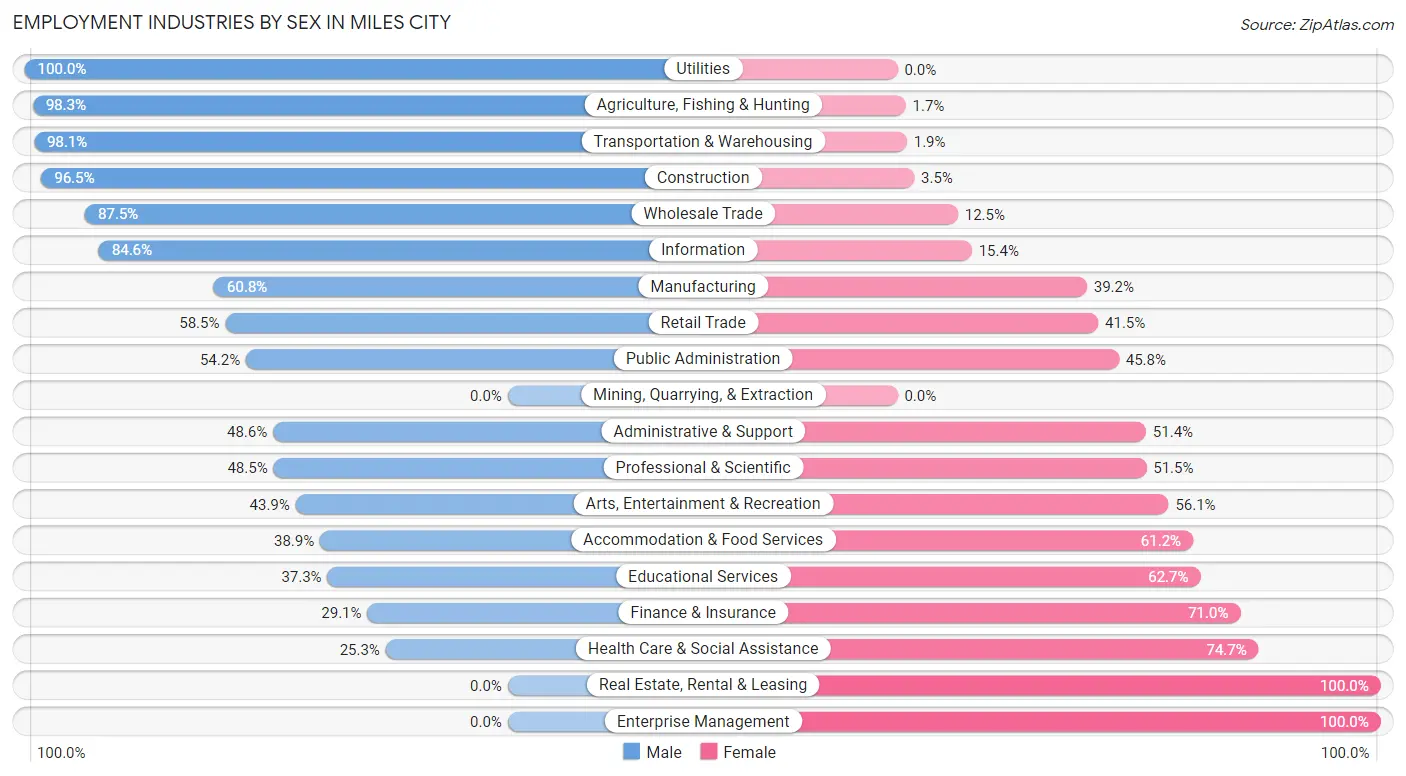
Employment Industries by Sex in Miles City
The Miles City industries that see more men than women are Utilities (100.0%), Agriculture, Fishing & Hunting (98.3%), and Transportation & Warehousing (98.1%), whereas the industries that tend to have a higher number of women are Real Estate, Rental & Leasing (100.0%), Enterprise Management (100.0%), and Health Care & Social Assistance (74.7%).
| Industry | Male | Female |
| Agriculture, Fishing & Hunting | 116 (98.3%) | 2 (1.7%) |
| Mining, Quarrying, & Extraction | 0 (0.0%) | 0 (0.0%) |
| Construction | 307 (96.5%) | 11 (3.5%) |
| Manufacturing | 45 (60.8%) | 29 (39.2%) |
| Wholesale Trade | 112 (87.5%) | 16 (12.5%) |
| Retail Trade | 591 (58.5%) | 420 (41.5%) |
| Transportation & Warehousing | 202 (98.1%) | 4 (1.9%) |
| Utilities | 68 (100.0%) | 0 (0.0%) |
| Information | 55 (84.6%) | 10 (15.4%) |
| Finance & Insurance | 52 (29.0%) | 127 (71.0%) |
| Real Estate, Rental & Leasing | 0 (0.0%) | 54 (100.0%) |
| Professional & Scientific | 64 (48.5%) | 68 (51.5%) |
| Enterprise Management | 0 (0.0%) | 5 (100.0%) |
| Administrative & Support | 68 (48.6%) | 72 (51.4%) |
| Educational Services | 144 (37.3%) | 242 (62.7%) |
| Health Care & Social Assistance | 194 (25.3%) | 574 (74.7%) |
| Arts, Entertainment & Recreation | 36 (43.9%) | 46 (56.1%) |
| Accommodation & Food Services | 108 (38.9%) | 170 (61.2%) |
| Public Administration | 162 (54.2%) | 137 (45.8%) |
| Total | 2,396 (53.2%) | 2,105 (46.8%) |
Education in Miles City
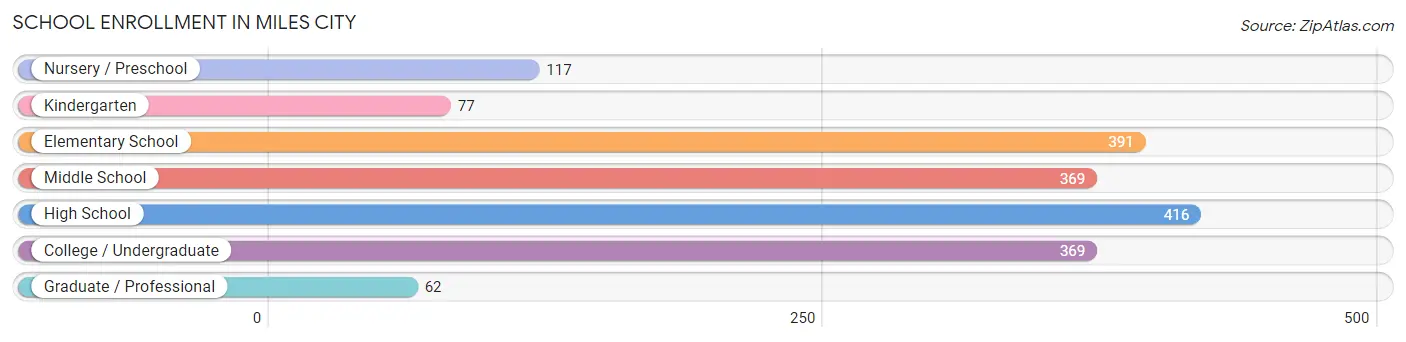
School Enrollment in Miles City
The most common levels of schooling among the 1,801 students in Miles City are high school (416 | 23.1%), elementary school (391 | 21.7%), and middle school (369 | 20.5%).
| School Level | # Students | % Students |
| Nursery / Preschool | 117 | 6.5% |
| Kindergarten | 77 | 4.3% |
| Elementary School | 391 | 21.7% |
| Middle School | 369 | 20.5% |
| High School | 416 | 23.1% |
| College / Undergraduate | 369 | 20.5% |
| Graduate / Professional | 62 | 3.4% |
| Total | 1,801 | 100.0% |
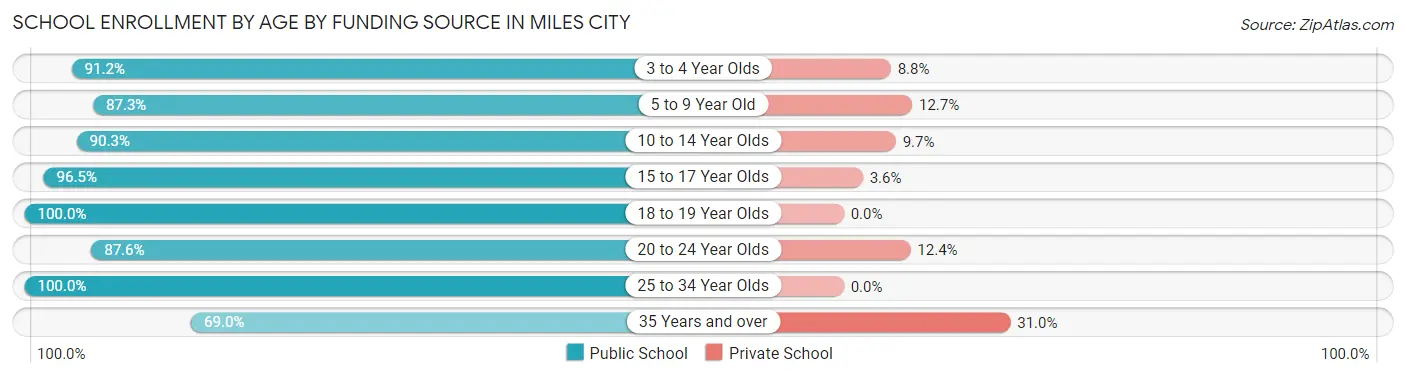
School Enrollment by Age by Funding Source in Miles City
Out of a total of 1,801 students who are enrolled in schools in Miles City, 167 (9.3%) attend a private institution, while the remaining 1,634 (90.7%) are enrolled in public schools. The age group of 35 years and over has the highest likelihood of being enrolled in private schools, with 27 (31.0% in the age bracket) enrolled. Conversely, the age group of 18 to 19 year olds has the lowest likelihood of being enrolled in a private school, with 164 (100.0% in the age bracket) attending a public institution.
| Age Bracket | Public School | Private School |
| 3 to 4 Year Olds | 104 (91.2%) | 10 (8.8%) |
| 5 to 9 Year Old | 370 (87.3%) | 54 (12.7%) |
| 10 to 14 Year Olds | 410 (90.3%) | 44 (9.7%) |
| 15 to 17 Year Olds | 299 (96.5%) | 11 (3.5%) |
| 18 to 19 Year Olds | 164 (100.0%) | 0 (0.0%) |
| 20 to 24 Year Olds | 155 (87.6%) | 22 (12.4%) |
| 25 to 34 Year Olds | 71 (100.0%) | 0 (0.0%) |
| 35 Years and over | 60 (69.0%) | 27 (31.0%) |
| Total | 1,634 (90.7%) | 167 (9.3%) |
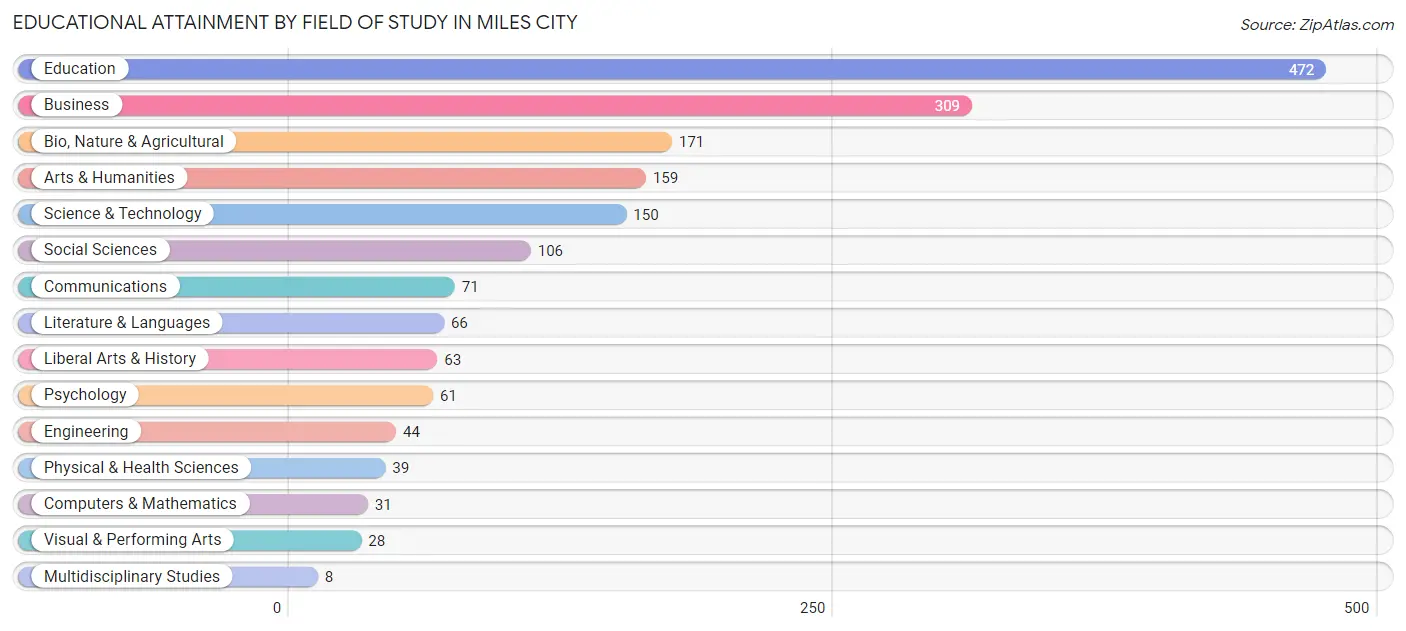
Educational Attainment by Field of Study in Miles City
Education (472 | 26.6%), business (309 | 17.4%), bio, nature & agricultural (171 | 9.6%), arts & humanities (159 | 8.9%), and science & technology (150 | 8.4%) are the most common fields of study among 1,778 individuals in Miles City who have obtained a bachelor's degree or higher.
| Field of Study | # Graduates | % Graduates |
| Computers & Mathematics | 31 | 1.7% |
| Bio, Nature & Agricultural | 171 | 9.6% |
| Physical & Health Sciences | 39 | 2.2% |
| Psychology | 61 | 3.4% |
| Social Sciences | 106 | 6.0% |
| Engineering | 44 | 2.5% |
| Multidisciplinary Studies | 8 | 0.4% |
| Science & Technology | 150 | 8.4% |
| Business | 309 | 17.4% |
| Education | 472 | 26.6% |
| Literature & Languages | 66 | 3.7% |
| Liberal Arts & History | 63 | 3.5% |
| Visual & Performing Arts | 28 | 1.6% |
| Communications | 71 | 4.0% |
| Arts & Humanities | 159 | 8.9% |
| Total | 1,778 | 100.0% |
Transportation & Commute in Miles City
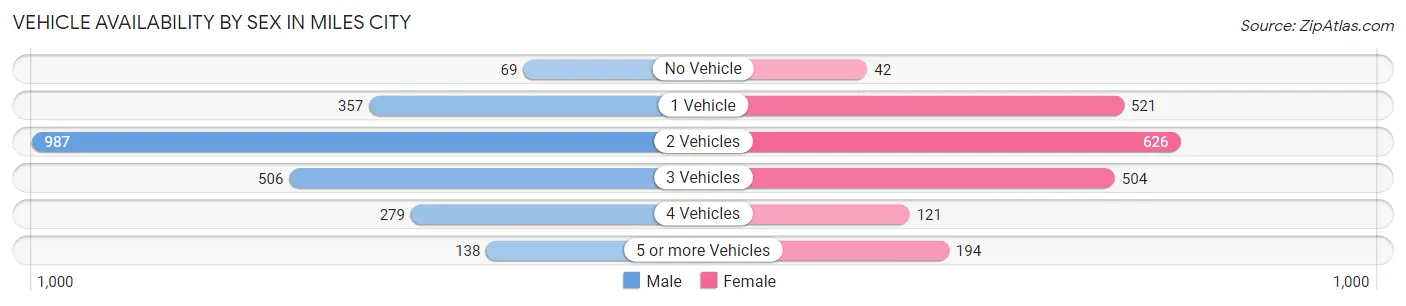
Vehicle Availability by Sex in Miles City
The most prevalent vehicle ownership categories in Miles City are males with 2 vehicles (987, accounting for 42.2%) and females with 2 vehicles (626, making up 49.1%).
| Vehicles Available | Male | Female |
| No Vehicle | 69 (2.9%) | 42 (2.1%) |
| 1 Vehicle | 357 (15.3%) | 521 (26.0%) |
| 2 Vehicles | 987 (42.2%) | 626 (31.2%) |
| 3 Vehicles | 506 (21.7%) | 504 (25.1%) |
| 4 Vehicles | 279 (11.9%) | 121 (6.0%) |
| 5 or more Vehicles | 138 (5.9%) | 194 (9.7%) |
| Total | 2,336 (100.0%) | 2,008 (100.0%) |
Commute Time in Miles City
The most frequently occuring commute durations in Miles City are 5 to 9 minutes (1,859 commuters, 42.9%), 10 to 14 minutes (885 commuters, 20.4%), and less than 5 minutes (842 commuters, 19.4%).
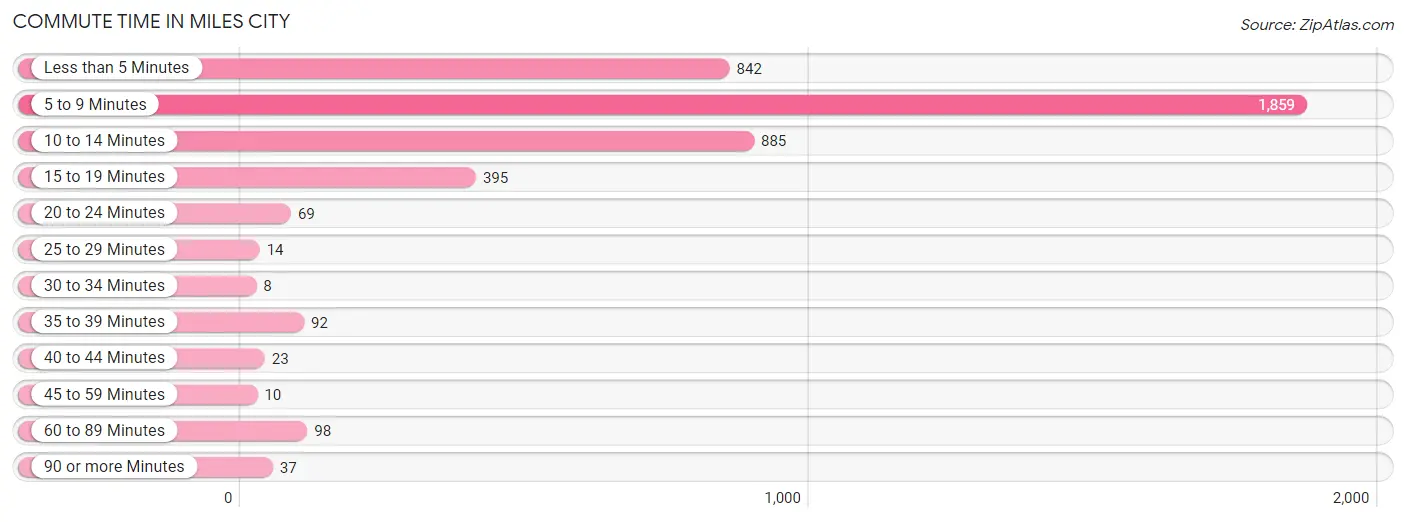
| Commute Time | # Commuters | % Commuters |
| Less than 5 Minutes | 842 | 19.4% |
| 5 to 9 Minutes | 1,859 | 42.9% |
| 10 to 14 Minutes | 885 | 20.4% |
| 15 to 19 Minutes | 395 | 9.1% |
| 20 to 24 Minutes | 69 | 1.6% |
| 25 to 29 Minutes | 14 | 0.3% |
| 30 to 34 Minutes | 8 | 0.2% |
| 35 to 39 Minutes | 92 | 2.1% |
| 40 to 44 Minutes | 23 | 0.5% |
| 45 to 59 Minutes | 10 | 0.2% |
| 60 to 89 Minutes | 98 | 2.3% |
| 90 or more Minutes | 37 | 0.9% |
Commute Time by Sex in Miles City
The most common commute times in Miles City are 5 to 9 minutes (948 commuters, 40.9%) for males and 5 to 9 minutes (911 commuters, 45.2%) for females.
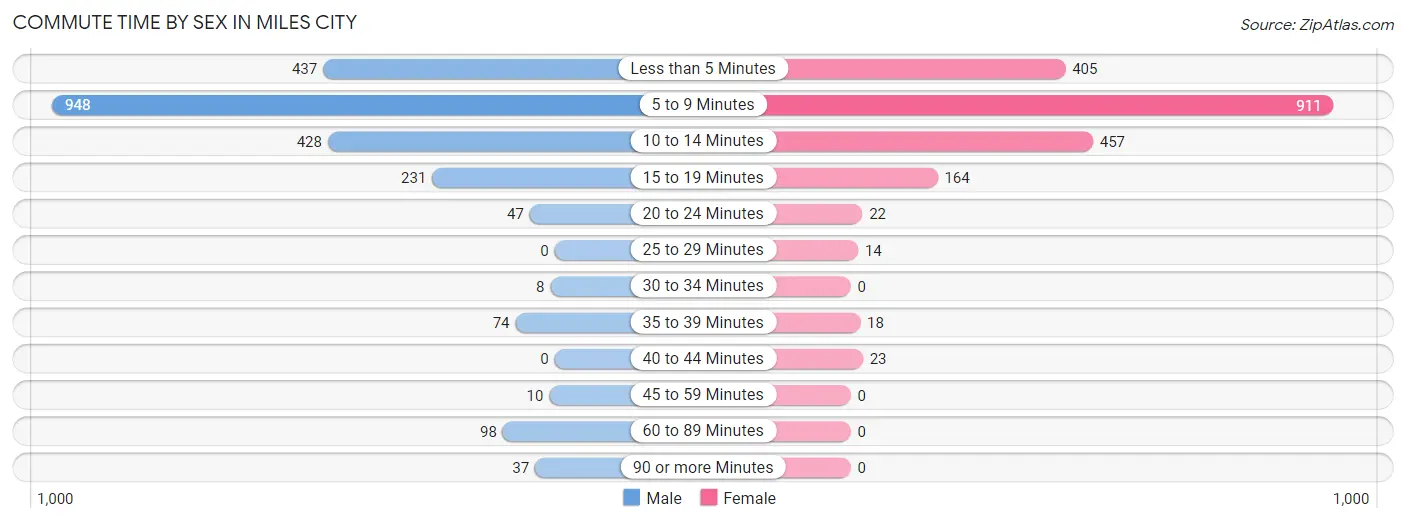
| Commute Time | Male | Female |
| Less than 5 Minutes | 437 (18.9%) | 405 (20.1%) |
| 5 to 9 Minutes | 948 (40.9%) | 911 (45.2%) |
| 10 to 14 Minutes | 428 (18.5%) | 457 (22.7%) |
| 15 to 19 Minutes | 231 (10.0%) | 164 (8.1%) |
| 20 to 24 Minutes | 47 (2.0%) | 22 (1.1%) |
| 25 to 29 Minutes | 0 (0.0%) | 14 (0.7%) |
| 30 to 34 Minutes | 8 (0.4%) | 0 (0.0%) |
| 35 to 39 Minutes | 74 (3.2%) | 18 (0.9%) |
| 40 to 44 Minutes | 0 (0.0%) | 23 (1.1%) |
| 45 to 59 Minutes | 10 (0.4%) | 0 (0.0%) |
| 60 to 89 Minutes | 98 (4.2%) | 0 (0.0%) |
| 90 or more Minutes | 37 (1.6%) | 0 (0.0%) |
Time of Departure to Work by Sex in Miles City
The most frequent times of departure to work in Miles City are 7:30 AM to 7:59 AM (459, 19.8%) for males and 7:30 AM to 7:59 AM (658, 32.7%) for females.
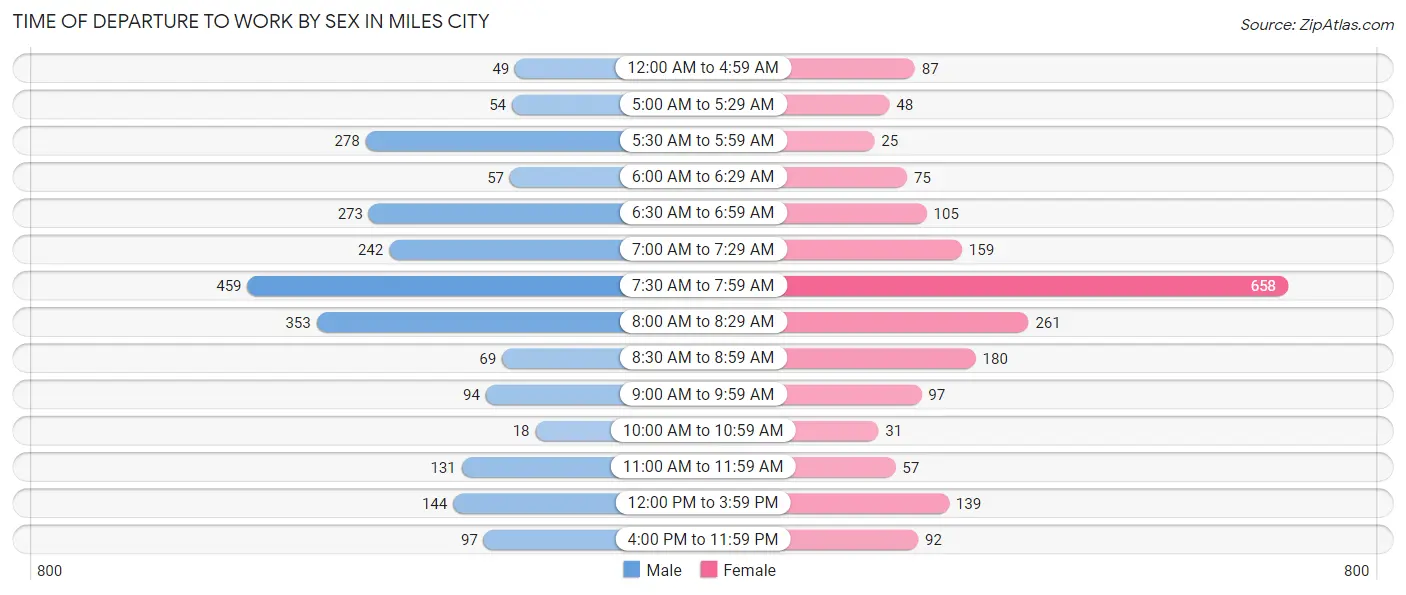
| Time of Departure | Male | Female |
| 12:00 AM to 4:59 AM | 49 (2.1%) | 87 (4.3%) |
| 5:00 AM to 5:29 AM | 54 (2.3%) | 48 (2.4%) |
| 5:30 AM to 5:59 AM | 278 (12.0%) | 25 (1.2%) |
| 6:00 AM to 6:29 AM | 57 (2.5%) | 75 (3.7%) |
| 6:30 AM to 6:59 AM | 273 (11.8%) | 105 (5.2%) |
| 7:00 AM to 7:29 AM | 242 (10.4%) | 159 (7.9%) |
| 7:30 AM to 7:59 AM | 459 (19.8%) | 658 (32.7%) |
| 8:00 AM to 8:29 AM | 353 (15.2%) | 261 (13.0%) |
| 8:30 AM to 8:59 AM | 69 (3.0%) | 180 (8.9%) |
| 9:00 AM to 9:59 AM | 94 (4.1%) | 97 (4.8%) |
| 10:00 AM to 10:59 AM | 18 (0.8%) | 31 (1.5%) |
| 11:00 AM to 11:59 AM | 131 (5.7%) | 57 (2.8%) |
| 12:00 PM to 3:59 PM | 144 (6.2%) | 139 (6.9%) |
| 4:00 PM to 11:59 PM | 97 (4.2%) | 92 (4.6%) |
| Total | 2,318 (100.0%) | 2,014 (100.0%) |
Housing Occupancy in Miles City
Occupancy by Ownership in Miles City
Of the total 3,627 dwellings in Miles City, owner-occupied units account for 2,217 (61.1%), while renter-occupied units make up 1,410 (38.9%).
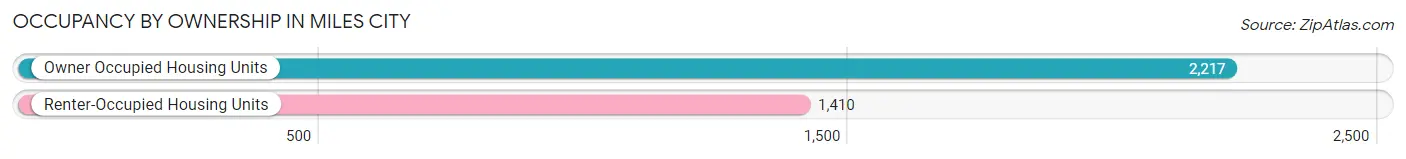
| Occupancy | # Housing Units | % Housing Units |
| Owner Occupied Housing Units | 2,217 | 61.1% |
| Renter-Occupied Housing Units | 1,410 | 38.9% |
| Total Occupied Housing Units | 3,627 | 100.0% |
Occupancy by Household Size in Miles City
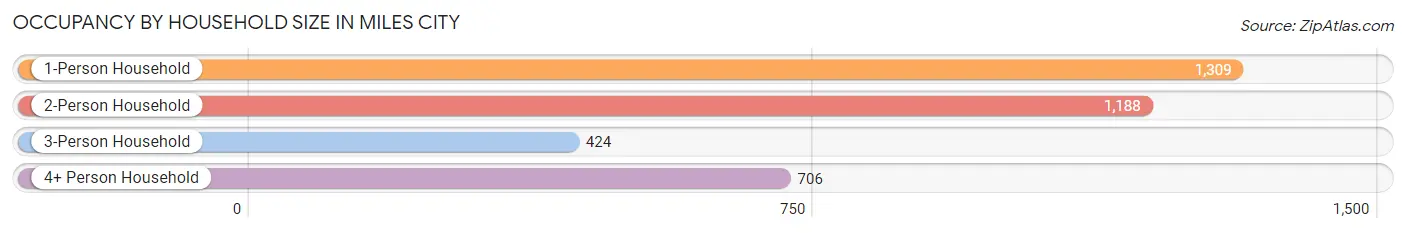
| Household Size | # Housing Units | % Housing Units |
| 1-Person Household | 1,309 | 36.1% |
| 2-Person Household | 1,188 | 32.8% |
| 3-Person Household | 424 | 11.7% |
| 4+ Person Household | 706 | 19.5% |
| Total Housing Units | 3,627 | 100.0% |
Occupancy by Ownership by Household Size in Miles City
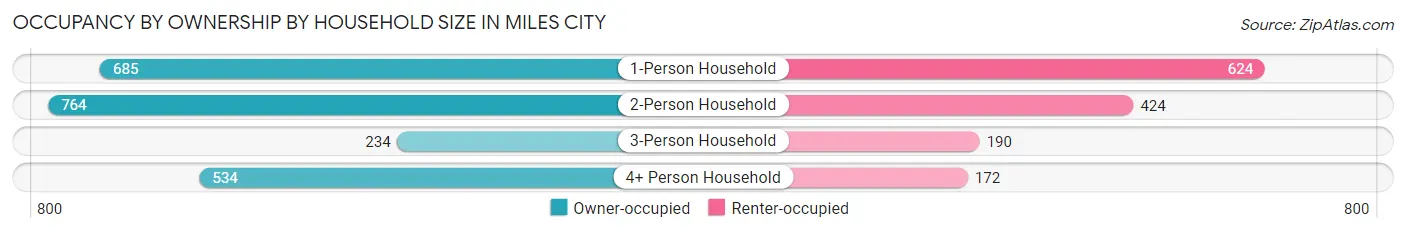
| Household Size | Owner-occupied | Renter-occupied |
| 1-Person Household | 685 (52.3%) | 624 (47.7%) |
| 2-Person Household | 764 (64.3%) | 424 (35.7%) |
| 3-Person Household | 234 (55.2%) | 190 (44.8%) |
| 4+ Person Household | 534 (75.6%) | 172 (24.4%) |
| Total Housing Units | 2,217 (61.1%) | 1,410 (38.9%) |
Occupancy by Educational Attainment in Miles City
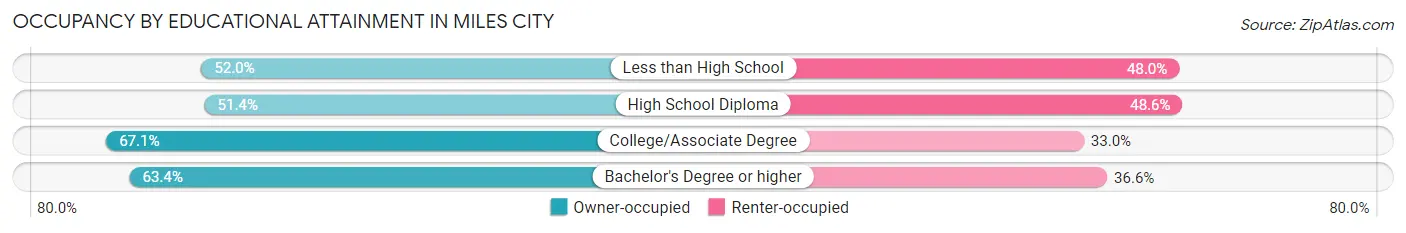
| Household Size | Owner-occupied | Renter-occupied |
| Less than High School | 53 (52.0%) | 49 (48.0%) |
| High School Diploma | 537 (51.4%) | 507 (48.6%) |
| College/Associate Degree | 1,001 (67.0%) | 492 (33.0%) |
| Bachelor's Degree or higher | 626 (63.4%) | 362 (36.6%) |
Occupancy by Age of Householder in Miles City
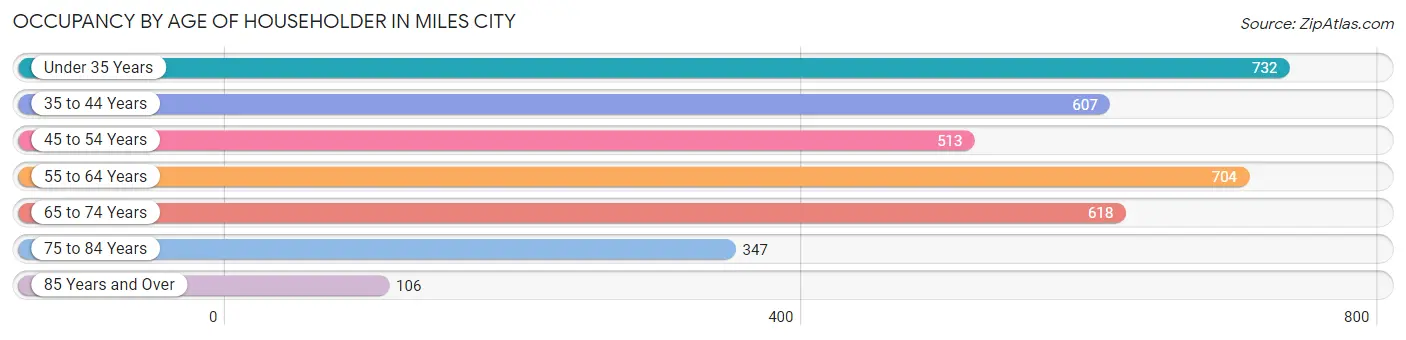
| Age Bracket | # Households | % Households |
| Under 35 Years | 732 | 20.2% |
| 35 to 44 Years | 607 | 16.7% |
| 45 to 54 Years | 513 | 14.1% |
| 55 to 64 Years | 704 | 19.4% |
| 65 to 74 Years | 618 | 17.0% |
| 75 to 84 Years | 347 | 9.6% |
| 85 Years and Over | 106 | 2.9% |
| Total | 3,627 | 100.0% |
Housing Finances in Miles City
Median Income by Occupancy in Miles City
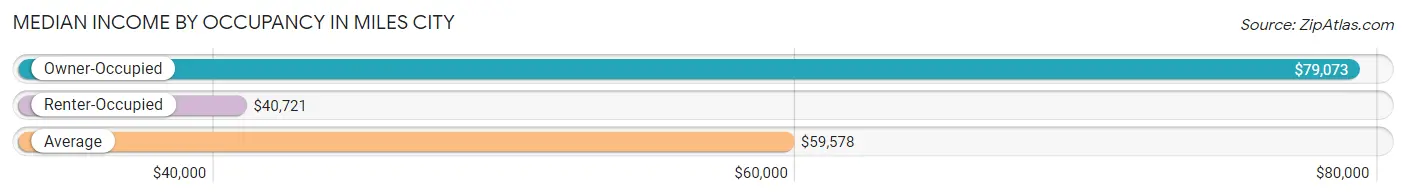
| Occupancy Type | # Households | Median Income |
| Owner-Occupied | 2,217 (61.1%) | $79,073 |
| Renter-Occupied | 1,410 (38.9%) | $40,721 |
| Average | 3,627 (100.0%) | $59,578 |
Occupancy by Householder Income Bracket in Miles City
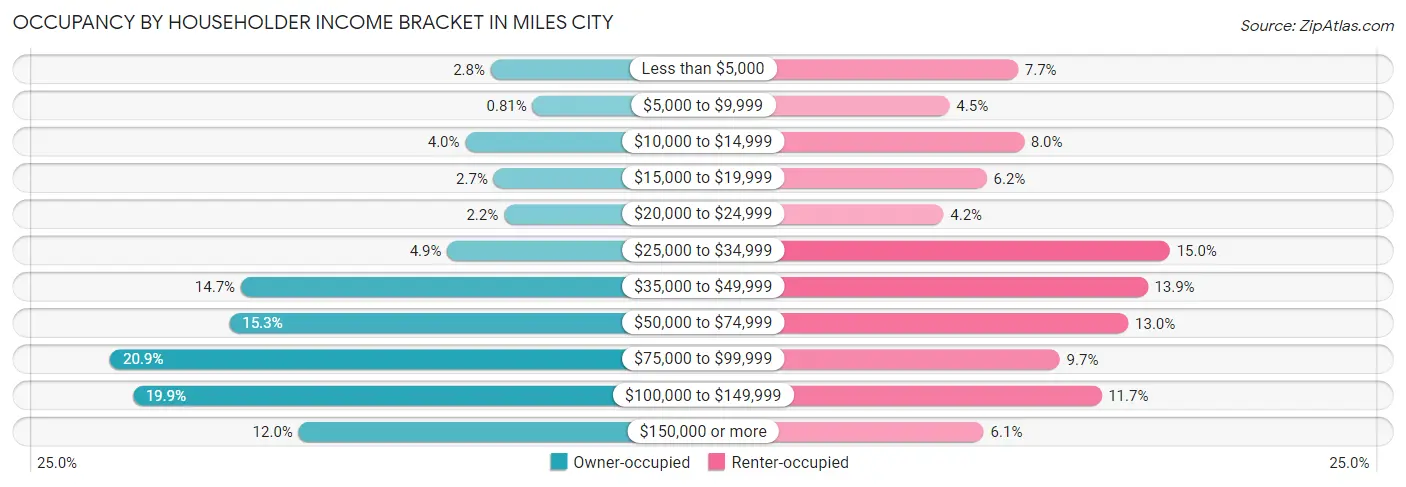
| Income Bracket | Owner-occupied | Renter-occupied |
| Less than $5,000 | 62 (2.8%) | 109 (7.7%) |
| $5,000 to $9,999 | 18 (0.8%) | 63 (4.5%) |
| $10,000 to $14,999 | 89 (4.0%) | 113 (8.0%) |
| $15,000 to $19,999 | 59 (2.7%) | 88 (6.2%) |
| $20,000 to $24,999 | 48 (2.2%) | 59 (4.2%) |
| $25,000 to $34,999 | 108 (4.9%) | 211 (15.0%) |
| $35,000 to $49,999 | 326 (14.7%) | 196 (13.9%) |
| $50,000 to $74,999 | 338 (15.2%) | 183 (13.0%) |
| $75,000 to $99,999 | 464 (20.9%) | 137 (9.7%) |
| $100,000 to $149,999 | 440 (19.9%) | 165 (11.7%) |
| $150,000 or more | 265 (11.9%) | 86 (6.1%) |
| Total | 2,217 (100.0%) | 1,410 (100.0%) |
Monthly Housing Cost Tiers in Miles City
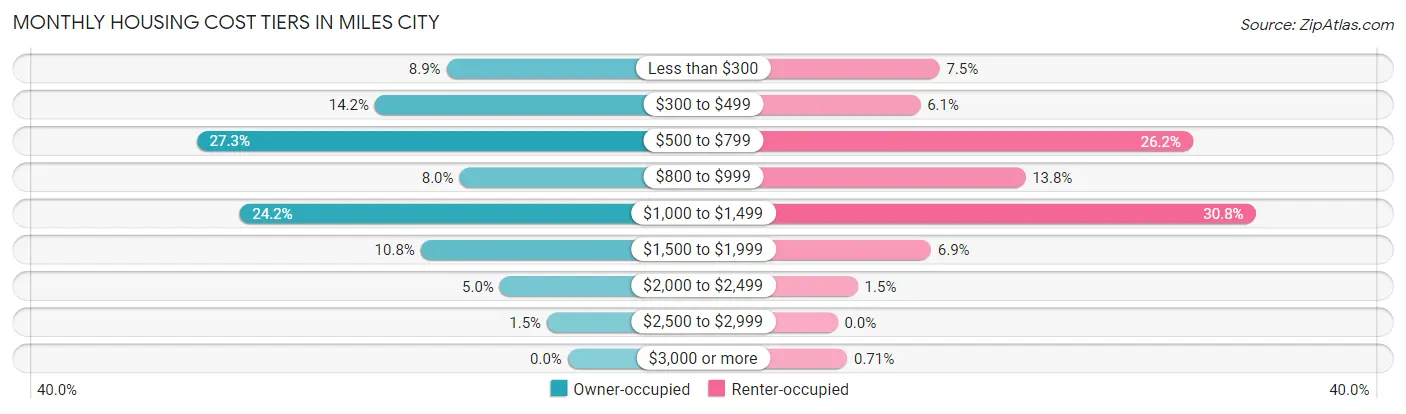
| Monthly Cost | Owner-occupied | Renter-occupied |
| Less than $300 | 198 (8.9%) | 106 (7.5%) |
| $300 to $499 | 315 (14.2%) | 86 (6.1%) |
| $500 to $799 | 606 (27.3%) | 369 (26.2%) |
| $800 to $999 | 177 (8.0%) | 195 (13.8%) |
| $1,000 to $1,499 | 536 (24.2%) | 434 (30.8%) |
| $1,500 to $1,999 | 240 (10.8%) | 97 (6.9%) |
| $2,000 to $2,499 | 111 (5.0%) | 21 (1.5%) |
| $2,500 to $2,999 | 34 (1.5%) | 0 (0.0%) |
| $3,000 or more | 0 (0.0%) | 10 (0.7%) |
| Total | 2,217 (100.0%) | 1,410 (100.0%) |
Physical Housing Characteristics in Miles City
Housing Structures in Miles City
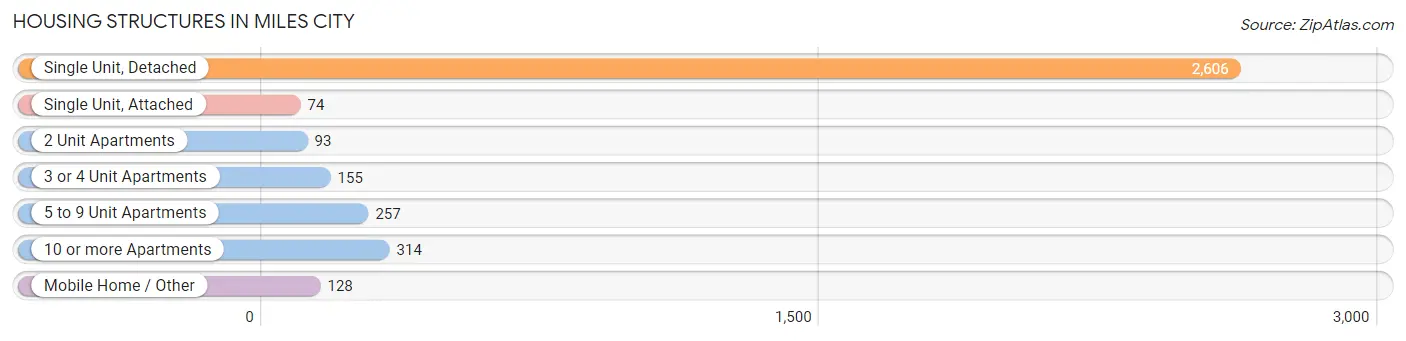
| Structure Type | # Housing Units | % Housing Units |
| Single Unit, Detached | 2,606 | 71.9% |
| Single Unit, Attached | 74 | 2.0% |
| 2 Unit Apartments | 93 | 2.6% |
| 3 or 4 Unit Apartments | 155 | 4.3% |
| 5 to 9 Unit Apartments | 257 | 7.1% |
| 10 or more Apartments | 314 | 8.7% |
| Mobile Home / Other | 128 | 3.5% |
| Total | 3,627 | 100.0% |
Housing Structures by Occupancy in Miles City
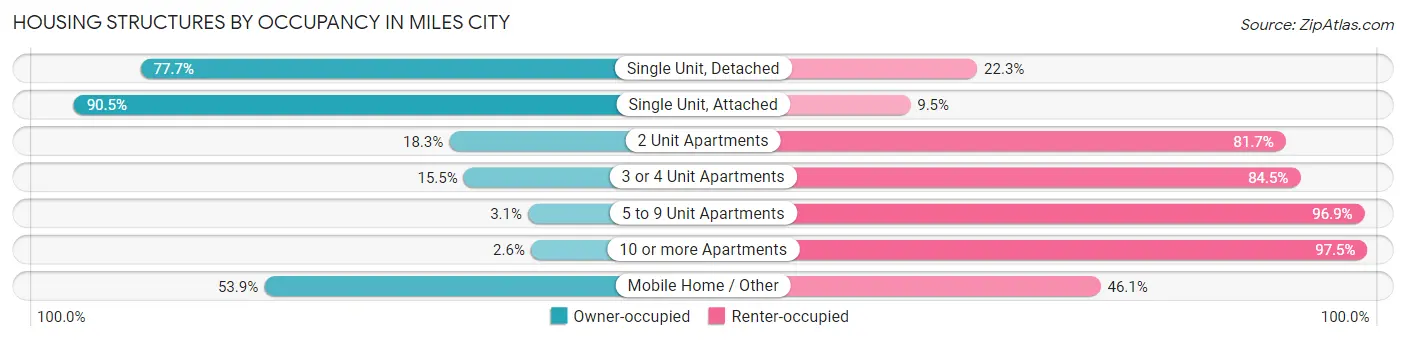
| Structure Type | Owner-occupied | Renter-occupied |
| Single Unit, Detached | 2,024 (77.7%) | 582 (22.3%) |
| Single Unit, Attached | 67 (90.5%) | 7 (9.5%) |
| 2 Unit Apartments | 17 (18.3%) | 76 (81.7%) |
| 3 or 4 Unit Apartments | 24 (15.5%) | 131 (84.5%) |
| 5 to 9 Unit Apartments | 8 (3.1%) | 249 (96.9%) |
| 10 or more Apartments | 8 (2.5%) | 306 (97.5%) |
| Mobile Home / Other | 69 (53.9%) | 59 (46.1%) |
| Total | 2,217 (61.1%) | 1,410 (38.9%) |
Housing Structures by Number of Rooms in Miles City
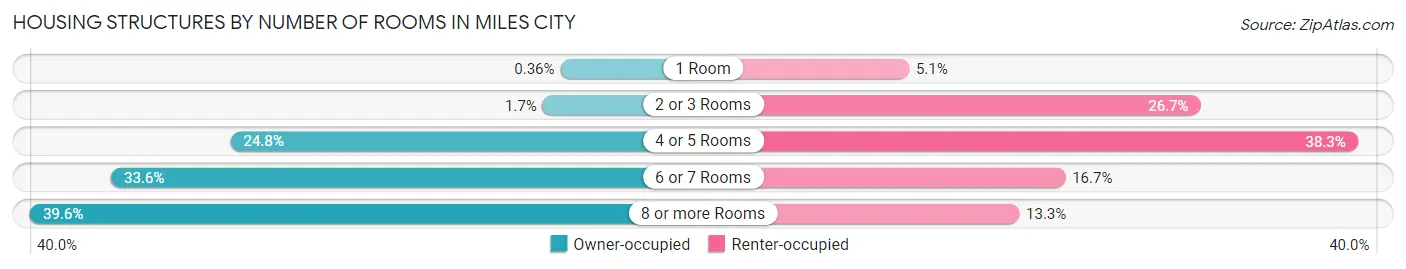
| Number of Rooms | Owner-occupied | Renter-occupied |
| 1 Room | 8 (0.4%) | 72 (5.1%) |
| 2 or 3 Rooms | 37 (1.7%) | 376 (26.7%) |
| 4 or 5 Rooms | 549 (24.8%) | 540 (38.3%) |
| 6 or 7 Rooms | 745 (33.6%) | 235 (16.7%) |
| 8 or more Rooms | 878 (39.6%) | 187 (13.3%) |
| Total | 2,217 (100.0%) | 1,410 (100.0%) |
Housing Structure by Heating Type in Miles City
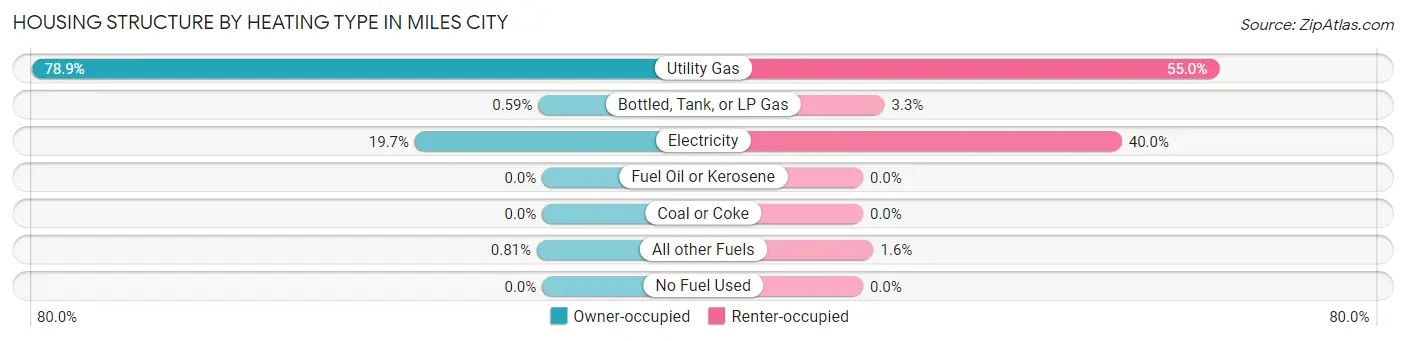
| Heating Type | Owner-occupied | Renter-occupied |
| Utility Gas | 1,750 (78.9%) | 776 (55.0%) |
| Bottled, Tank, or LP Gas | 13 (0.6%) | 47 (3.3%) |
| Electricity | 436 (19.7%) | 564 (40.0%) |
| Fuel Oil or Kerosene | 0 (0.0%) | 0 (0.0%) |
| Coal or Coke | 0 (0.0%) | 0 (0.0%) |
| All other Fuels | 18 (0.8%) | 23 (1.6%) |
| No Fuel Used | 0 (0.0%) | 0 (0.0%) |
| Total | 2,217 (100.0%) | 1,410 (100.0%) |
Household Vehicle Usage in Miles City
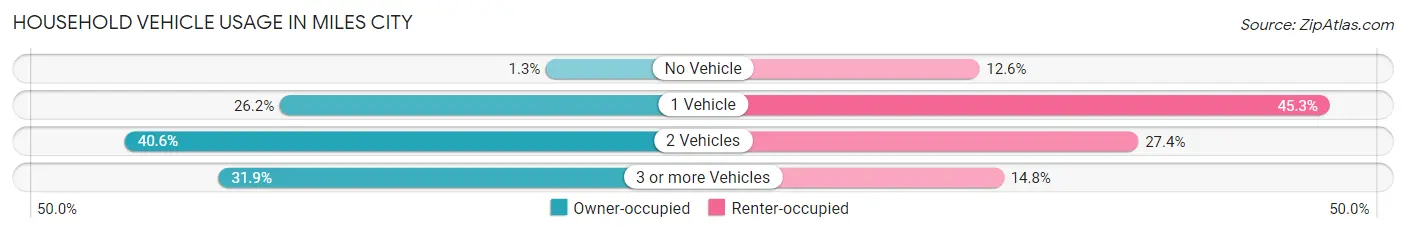
| Vehicles per Household | Owner-occupied | Renter-occupied |
| No Vehicle | 29 (1.3%) | 177 (12.6%) |
| 1 Vehicle | 580 (26.2%) | 638 (45.3%) |
| 2 Vehicles | 901 (40.6%) | 386 (27.4%) |
| 3 or more Vehicles | 707 (31.9%) | 209 (14.8%) |
| Total | 2,217 (100.0%) | 1,410 (100.0%) |
Real Estate & Mortgages in Miles City
Real Estate and Mortgage Overview in Miles City
| Characteristic | Without Mortgage | With Mortgage |
| Housing Units | 1,079 | 1,138 |
| Median Property Value | $166,300 | $177,100 |
| Median Household Income | $61,438 | $141 |
| Monthly Housing Costs | $514 | $0 |
| Real Estate Taxes | $2,135 | $29 |
Property Value by Mortgage Status in Miles City
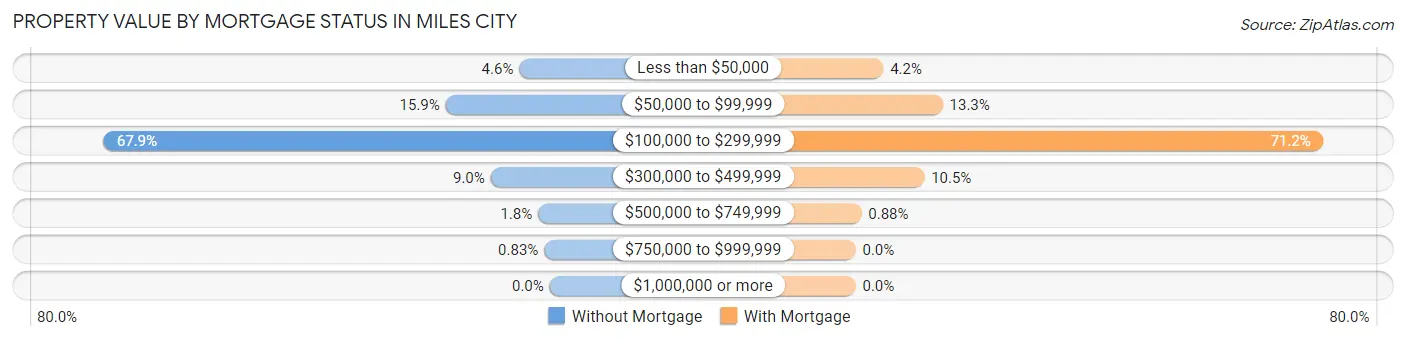
| Property Value | Without Mortgage | With Mortgage |
| Less than $50,000 | 50 (4.6%) | 48 (4.2%) |
| $50,000 to $99,999 | 171 (15.9%) | 151 (13.3%) |
| $100,000 to $299,999 | 733 (67.9%) | 810 (71.2%) |
| $300,000 to $499,999 | 97 (9.0%) | 119 (10.5%) |
| $500,000 to $749,999 | 19 (1.8%) | 10 (0.9%) |
| $750,000 to $999,999 | 9 (0.8%) | 0 (0.0%) |
| $1,000,000 or more | 0 (0.0%) | 0 (0.0%) |
| Total | 1,079 (100.0%) | 1,138 (100.0%) |
Household Income by Mortgage Status in Miles City
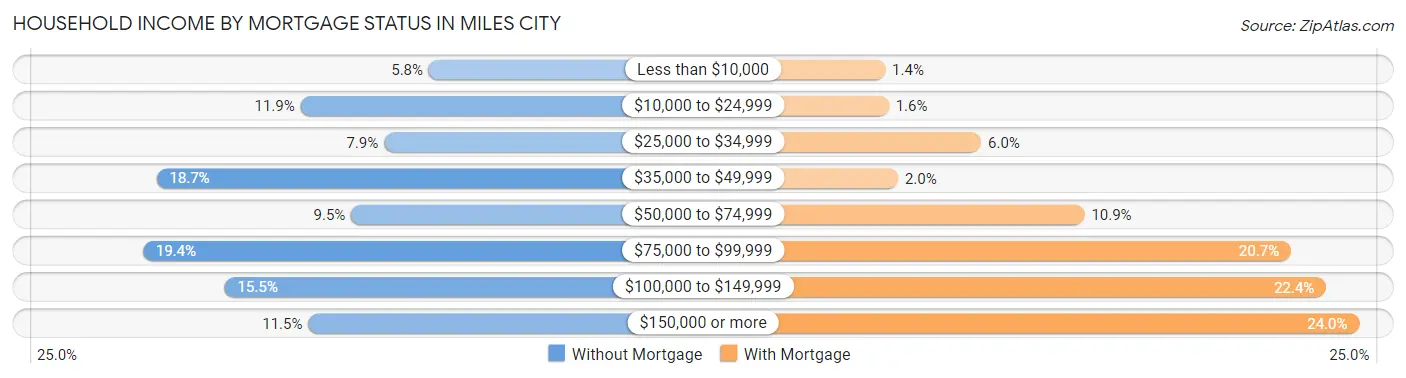
| Household Income | Without Mortgage | With Mortgage |
| Less than $10,000 | 62 (5.8%) | 16 (1.4%) |
| $10,000 to $24,999 | 128 (11.9%) | 18 (1.6%) |
| $25,000 to $34,999 | 85 (7.9%) | 68 (6.0%) |
| $35,000 to $49,999 | 202 (18.7%) | 23 (2.0%) |
| $50,000 to $74,999 | 102 (9.5%) | 124 (10.9%) |
| $75,000 to $99,999 | 209 (19.4%) | 236 (20.7%) |
| $100,000 to $149,999 | 167 (15.5%) | 255 (22.4%) |
| $150,000 or more | 124 (11.5%) | 273 (24.0%) |
| Total | 1,079 (100.0%) | 1,138 (100.0%) |
Property Value to Household Income Ratio in Miles City
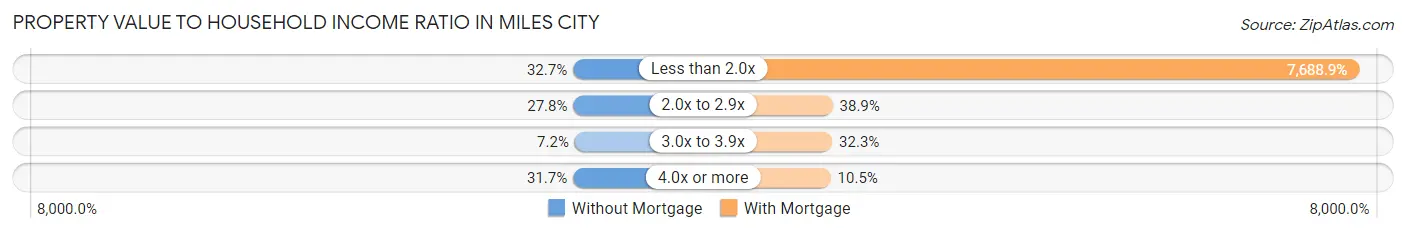
| Value-to-Income Ratio | Without Mortgage | With Mortgage |
| Less than 2.0x | 353 (32.7%) | 87,500 (7,688.9%) |
| 2.0x to 2.9x | 300 (27.8%) | 443 (38.9%) |
| 3.0x to 3.9x | 78 (7.2%) | 367 (32.3%) |
| 4.0x or more | 342 (31.7%) | 120 (10.5%) |
| Total | 1,079 (100.0%) | 1,138 (100.0%) |
Real Estate Taxes by Mortgage Status in Miles City
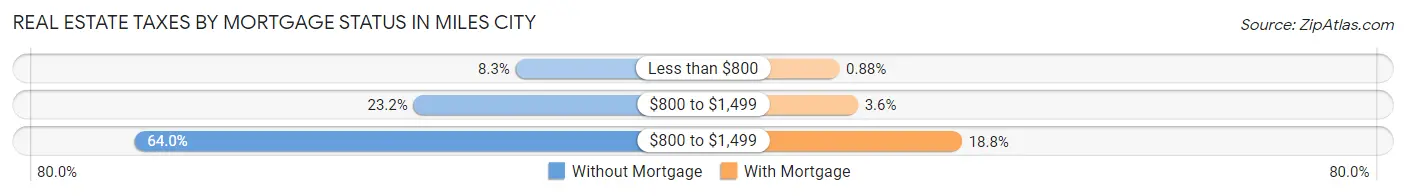
| Property Taxes | Without Mortgage | With Mortgage |
| Less than $800 | 89 (8.3%) | 10 (0.9%) |
| $800 to $1,499 | 250 (23.2%) | 41 (3.6%) |
| $800 to $1,499 | 690 (63.9%) | 214 (18.8%) |
| Total | 1,079 (100.0%) | 1,138 (100.0%) |
Health & Disability in Miles City
Health Insurance Coverage by Age in Miles City
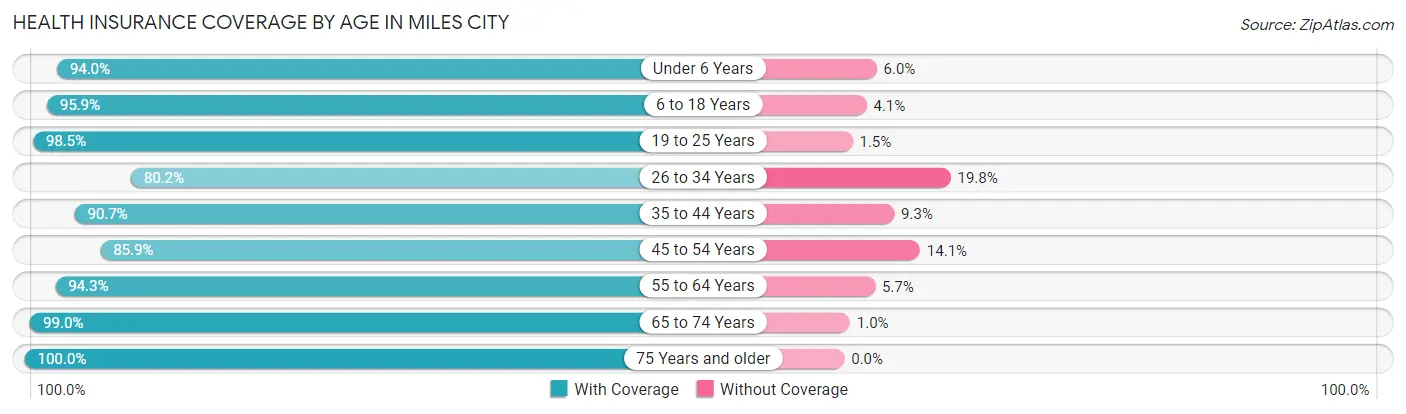
| Age Bracket | With Coverage | Without Coverage |
| Under 6 Years | 390 (94.0%) | 25 (6.0%) |
| 6 to 18 Years | 1,226 (95.9%) | 53 (4.1%) |
| 19 to 25 Years | 774 (98.5%) | 12 (1.5%) |
| 26 to 34 Years | 761 (80.2%) | 188 (19.8%) |
| 35 to 44 Years | 926 (90.7%) | 95 (9.3%) |
| 45 to 54 Years | 853 (85.9%) | 140 (14.1%) |
| 55 to 64 Years | 1,220 (94.3%) | 74 (5.7%) |
| 65 to 74 Years | 856 (99.0%) | 9 (1.0%) |
| 75 Years and older | 659 (100.0%) | 0 (0.0%) |
| Total | 7,665 (92.8%) | 596 (7.2%) |
Health Insurance Coverage by Citizenship Status in Miles City
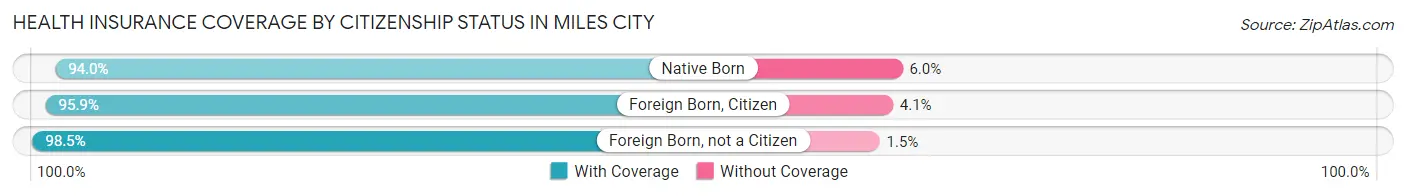
| Citizenship Status | With Coverage | Without Coverage |
| Native Born | 390 (94.0%) | 25 (6.0%) |
| Foreign Born, Citizen | 1,226 (95.9%) | 53 (4.1%) |
| Foreign Born, not a Citizen | 774 (98.5%) | 12 (1.5%) |
Health Insurance Coverage by Household Income in Miles City
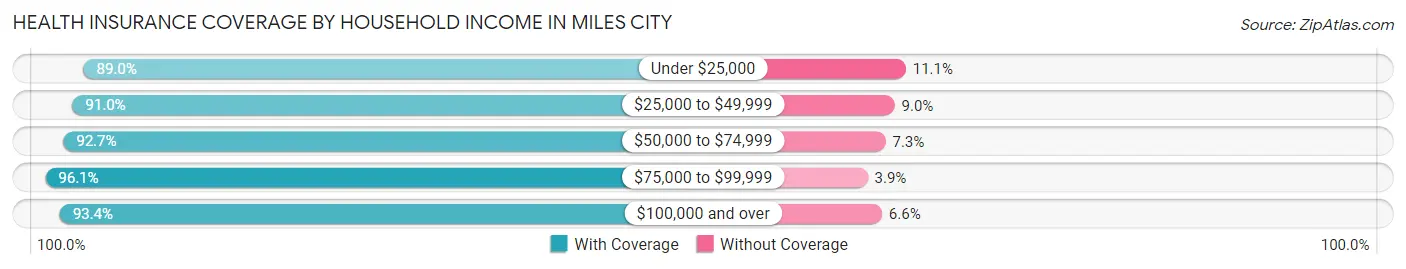
| Household Income | With Coverage | Without Coverage |
| Under $25,000 | 958 (88.9%) | 119 (11.1%) |
| $25,000 to $49,999 | 1,281 (91.0%) | 126 (9.0%) |
| $50,000 to $74,999 | 1,098 (92.7%) | 86 (7.3%) |
| $75,000 to $99,999 | 1,405 (96.1%) | 57 (3.9%) |
| $100,000 and over | 2,754 (93.4%) | 194 (6.6%) |
Public vs Private Health Insurance Coverage by Age in Miles City
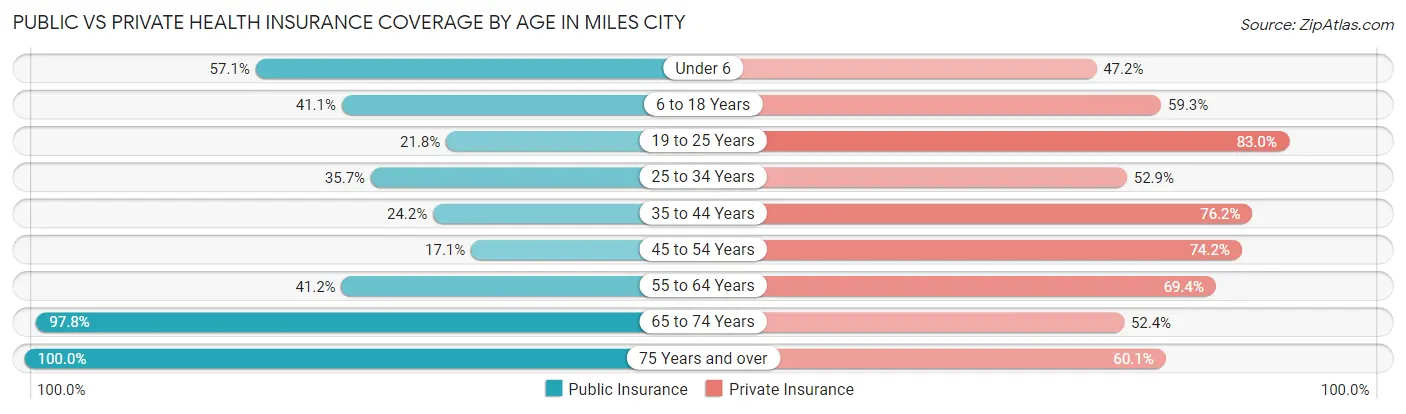
| Age Bracket | Public Insurance | Private Insurance |
| Under 6 | 237 (57.1%) | 196 (47.2%) |
| 6 to 18 Years | 526 (41.1%) | 758 (59.3%) |
| 19 to 25 Years | 171 (21.8%) | 652 (83.0%) |
| 25 to 34 Years | 339 (35.7%) | 502 (52.9%) |
| 35 to 44 Years | 247 (24.2%) | 778 (76.2%) |
| 45 to 54 Years | 170 (17.1%) | 737 (74.2%) |
| 55 to 64 Years | 533 (41.2%) | 898 (69.4%) |
| 65 to 74 Years | 846 (97.8%) | 453 (52.4%) |
| 75 Years and over | 659 (100.0%) | 396 (60.1%) |
| Total | 3,728 (45.1%) | 5,370 (65.0%) |
Disability Status by Sex by Age in Miles City
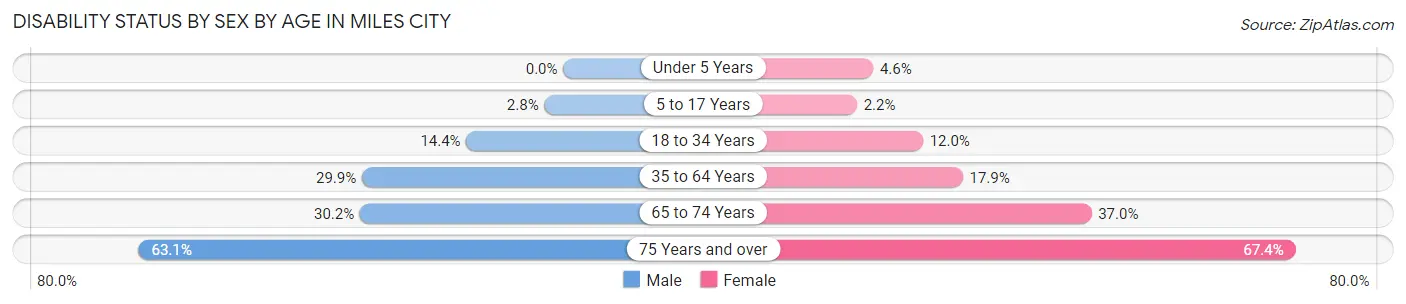
| Age Bracket | Male | Female |
| Under 5 Years | 0 (0.0%) | 10 (4.6%) |
| 5 to 17 Years | 18 (2.8%) | 13 (2.2%) |
| 18 to 34 Years | 153 (14.4%) | 92 (12.0%) |
| 35 to 64 Years | 497 (29.9%) | 295 (17.9%) |
| 65 to 74 Years | 112 (30.2%) | 183 (37.0%) |
| 75 Years and over | 176 (63.1%) | 256 (67.4%) |
Disability Class by Sex by Age in Miles City
Disability Class: Hearing Difficulty
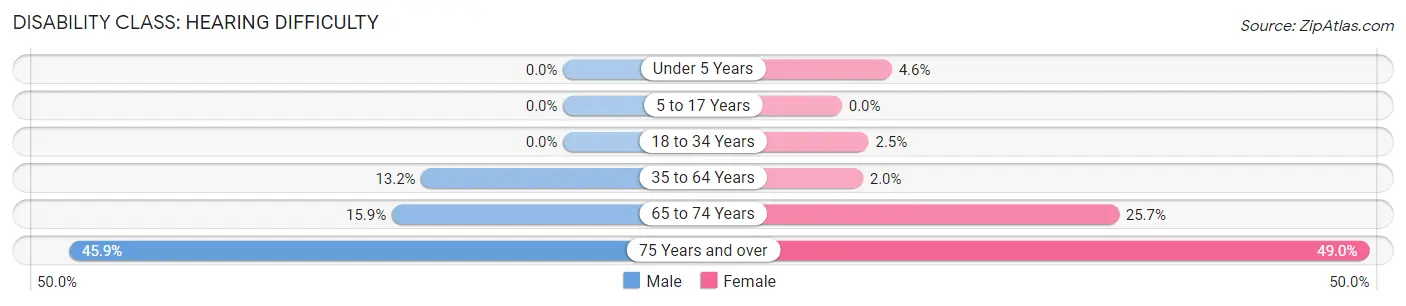
| Age Bracket | Male | Female |
| Under 5 Years | 0 (0.0%) | 10 (4.6%) |
| 5 to 17 Years | 0 (0.0%) | 0 (0.0%) |
| 18 to 34 Years | 0 (0.0%) | 19 (2.5%) |
| 35 to 64 Years | 219 (13.2%) | 32 (1.9%) |
| 65 to 74 Years | 59 (15.9%) | 127 (25.7%) |
| 75 Years and over | 128 (45.9%) | 186 (48.9%) |
Disability Class: Vision Difficulty
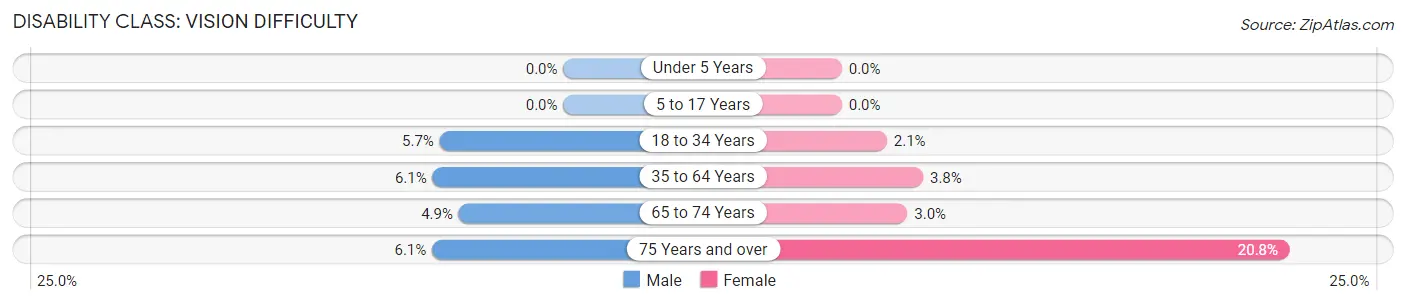
| Age Bracket | Male | Female |
| Under 5 Years | 0 (0.0%) | 0 (0.0%) |
| 5 to 17 Years | 0 (0.0%) | 0 (0.0%) |
| 18 to 34 Years | 61 (5.7%) | 16 (2.1%) |
| 35 to 64 Years | 101 (6.1%) | 62 (3.8%) |
| 65 to 74 Years | 18 (4.9%) | 15 (3.0%) |
| 75 Years and over | 17 (6.1%) | 79 (20.8%) |
Disability Class: Cognitive Difficulty
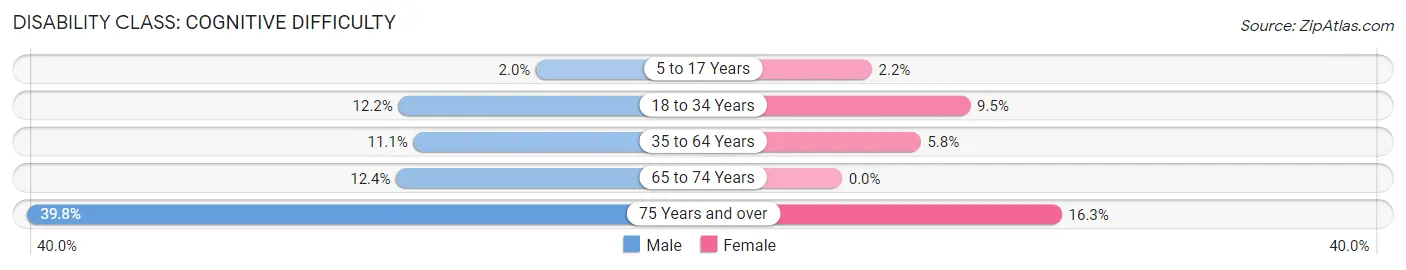
| Age Bracket | Male | Female |
| 5 to 17 Years | 13 (2.0%) | 13 (2.2%) |
| 18 to 34 Years | 130 (12.2%) | 73 (9.5%) |
| 35 to 64 Years | 185 (11.1%) | 96 (5.8%) |
| 65 to 74 Years | 46 (12.4%) | 0 (0.0%) |
| 75 Years and over | 111 (39.8%) | 62 (16.3%) |
Disability Class: Ambulatory Difficulty
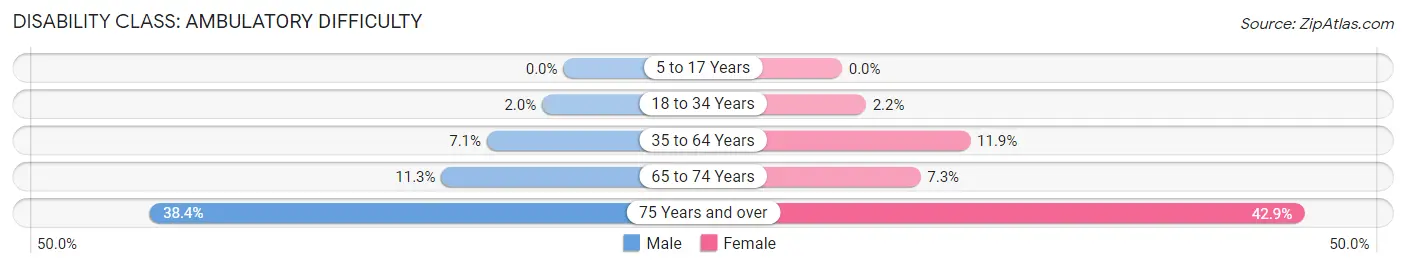
| Age Bracket | Male | Female |
| 5 to 17 Years | 0 (0.0%) | 0 (0.0%) |
| 18 to 34 Years | 21 (2.0%) | 17 (2.2%) |
| 35 to 64 Years | 118 (7.1%) | 196 (11.9%) |
| 65 to 74 Years | 42 (11.3%) | 36 (7.3%) |
| 75 Years and over | 107 (38.4%) | 163 (42.9%) |
Disability Class: Self-Care Difficulty
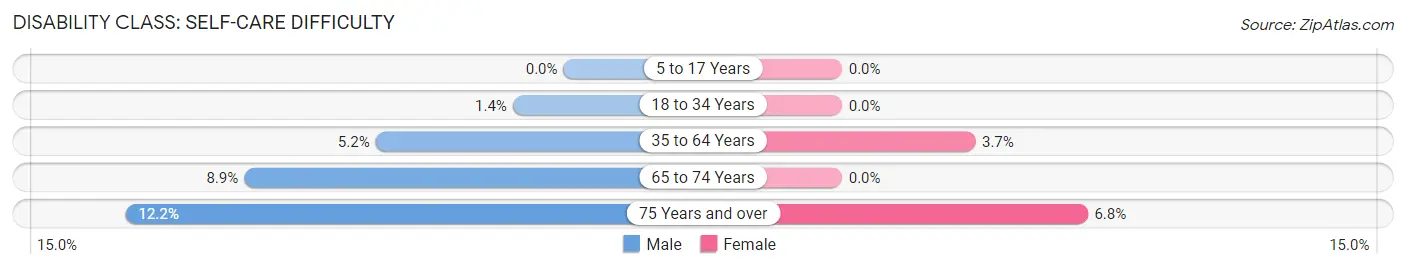
| Age Bracket | Male | Female |
| 5 to 17 Years | 0 (0.0%) | 0 (0.0%) |
| 18 to 34 Years | 15 (1.4%) | 0 (0.0%) |
| 35 to 64 Years | 87 (5.2%) | 61 (3.7%) |
| 65 to 74 Years | 33 (8.9%) | 0 (0.0%) |
| 75 Years and over | 34 (12.2%) | 26 (6.8%) |
Technology Access in Miles City
Computing Device Access in Miles City
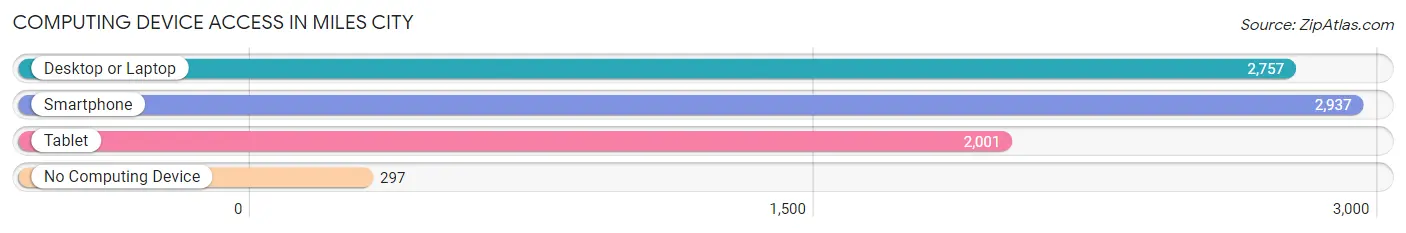
| Device Type | # Households | % Households |
| Desktop or Laptop | 2,757 | 76.0% |
| Smartphone | 2,937 | 81.0% |
| Tablet | 2,001 | 55.2% |
| No Computing Device | 297 | 8.2% |
| Total | 3,627 | 100.0% |
Internet Access in Miles City
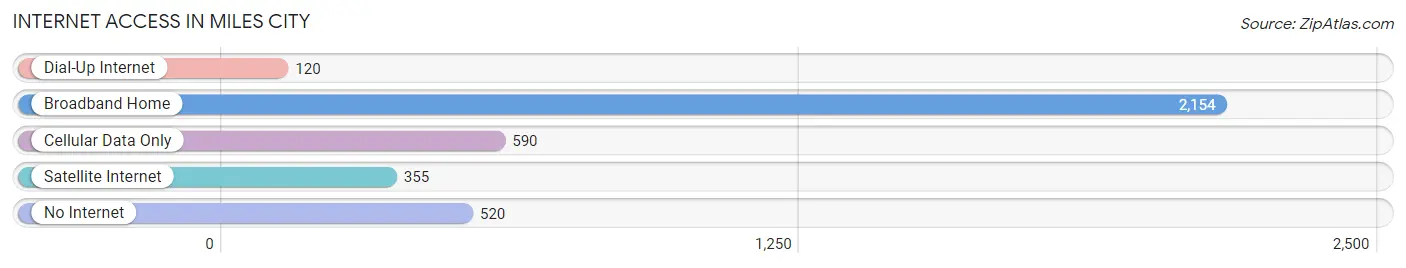
| Internet Type | # Households | % Households |
| Dial-Up Internet | 120 | 3.3% |
| Broadband Home | 2,154 | 59.4% |
| Cellular Data Only | 590 | 16.3% |
| Satellite Internet | 355 | 9.8% |
| No Internet | 520 | 14.3% |
| Total | 3,627 | 100.0% |
Miles City Summary
Miles City is a city located in the southeastern corner of Montana, United States. It is the county seat of Custer County and the largest city in the region. The city is situated on the banks of the Tongue River and is home to a population of 8,410 people as of the 2010 census.
History
Miles City was founded in 1876 by Nelson Story, a cattle baron from Bozeman, Montana. Story named the city after General Nelson A. Miles, a Civil War veteran and commander of the U.S. Army's 5th Infantry Regiment. The city was originally established as a trading post for the cattle industry and quickly grew into a bustling town.
In 1877, the Northern Pacific Railroad arrived in Miles City, connecting the city to the rest of the country. This allowed for the growth of the cattle industry and the city's population. By the early 1900s, Miles City had become a major hub for the cattle industry, with numerous ranches and stockyards located in the area.
In the late 19th century, Miles City was also home to a number of saloons and gambling halls, which attracted cowboys and other travelers from all over the region. The city was also home to a number of brothels, which were eventually shut down in the early 20th century.
Geography
Miles City is located in the southeastern corner of Montana, in the heart of the Great Plains. The city is situated on the banks of the Tongue River, which flows through the city and is a major tributary of the Yellowstone River. The city is located at an elevation of 2,845 feet (867 m) and has a total area of 8.2 square miles (21.2 km2).
The city is located in a semi-arid climate zone, with hot summers and cold winters. The average annual temperature is 48.2 °F (9 °C), with an average high of 79.2 °F (26.2 °C) in July and an average low of 17.2 °F (-8.2 °C) in January. The average annual precipitation is 13.7 inches (348 mm).
Economy
Miles City is the economic hub of southeastern Montana. The city is home to a number of industries, including agriculture, manufacturing, retail, and tourism.
Agriculture is the main economic driver in Miles City, with the city being home to a number of large ranches and farms. The city is also home to a number of manufacturing companies, including a meat packing plant, a flour mill, and a furniture factory.
Retail is also an important part of the city's economy, with a number of stores and restaurants located in the downtown area. Tourism is also a major industry in Miles City, with the city being home to a number of attractions, including the Custer County Museum, the Range Riders Museum, and the Fort Keogh National Historic Site.
Demographics
As of the 2010 census, Miles City had a population of 8,410 people. The racial makeup of the city was 92.2% White, 0.7% African American, 1.2% Native American, 0.4% Asian, 0.1% Pacific Islander, 3.3% from other races, and 2.1% from two or more races. Hispanic or Latino of any race were 6.2% of the population.
The median income for a household in Miles City was $37,917, and the median income for a family was $45,938. The per capita income for the city was $19,945. About 14.2% of families and 17.7% of the population were below the poverty line, including 24.2% of those under age 18 and 8.2% of those age 65 or over.
Common Questions
What is Per Capita Income in Miles City?
Per Capita income in Miles City is $34,124.
What is the Median Family Income in Miles City?
Median Family Income in Miles City is $80,539.
What is the Median Household income in Miles City?
Median Household Income in Miles City is $59,578.
What is Income or Wage Gap in Miles City?
Income or Wage Gap in Miles City is 18.0%.
Women in Miles City earn 82.0 cents for every dollar earned by a man.
What is Inequality or Gini Index in Miles City?
Inequality or Gini Index in Miles City is 0.44.
What is the Total Population of Miles City?
Total Population of Miles City is 8,432.
What is the Total Male Population of Miles City?
Total Male Population of Miles City is 4,258.
What is the Total Female Population of Miles City?
Total Female Population of Miles City is 4,174.
What is the Ratio of Males per 100 Females in Miles City?
There are 102.01 Males per 100 Females in Miles City.
What is the Ratio of Females per 100 Males in Miles City?
There are 98.03 Females per 100 Males in Miles City.
What is the Median Population Age in Miles City?
Median Population Age in Miles City is 42.1 Years.
What is the Average Family Size in Miles City
Average Family Size in Miles City is 2.8 People.
What is the Average Household Size in Miles City
Average Household Size in Miles City is 2.2 People.
How Large is the Labor Force in Miles City?
There are 4,703 People in the Labor Forcein in Miles City.
What is the Percentage of People in the Labor Force in Miles City?
66.7% of People are in the Labor Force in Miles City.
What is the Unemployment Rate in Miles City?
Unemployment Rate in Miles City is 4.2%.