Helena Valley West Central, MT Map & Demographics
Helena Valley West Central Map
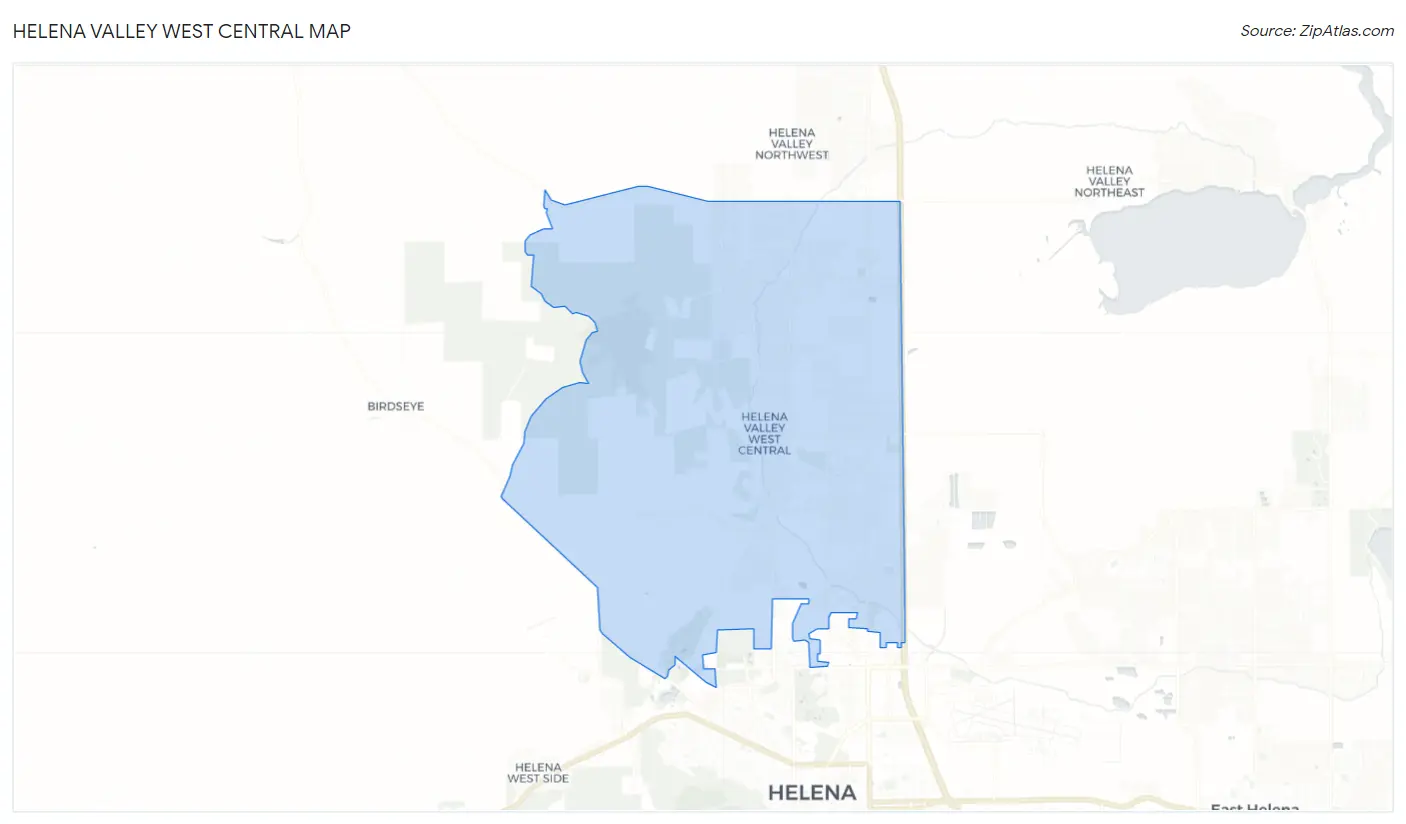
Helena Valley West Central Overview
$39,207
PER CAPITA INCOME
$102,027
AVG FAMILY INCOME
$84,846
AVG HOUSEHOLD INCOME
16.8%
WAGE / INCOME GAP [ % ]
83.2¢/ $1
WAGE / INCOME GAP [ $ ]
0.38
INEQUALITY / GINI INDEX
8,206
TOTAL POPULATION
4,404
MALE POPULATION
3,802
FEMALE POPULATION
115.83
MALES / 100 FEMALES
86.33
FEMALES / 100 MALES
40.7
MEDIAN AGE
3.1
AVG FAMILY SIZE
2.7
AVG HOUSEHOLD SIZE
4,225
LABOR FORCE [ PEOPLE ]
66.5%
PERCENT IN LABOR FORCE
5.1%
UNEMPLOYMENT RATE
Income in Helena Valley West Central
Income Overview in Helena Valley West Central
Per Capita Income in Helena Valley West Central is $39,207, while median incomes of families and households are $102,027 and $84,846 respectively.
| Characteristic | Number | Measure |
| Per Capita Income | 8,206 | $39,207 |
| Median Family Income | 2,281 | $102,027 |
| Mean Family Income | 2,281 | $122,764 |
| Median Household Income | 3,013 | $84,846 |
| Mean Household Income | 3,013 | $107,685 |
| Income Deficit | 2,281 | $0 |
| Wage / Income Gap (%) | 8,206 | 16.81% |
| Wage / Income Gap ($) | 8,206 | 83.19¢ per $1 |
| Gini / Inequality Index | 8,206 | 0.38 |
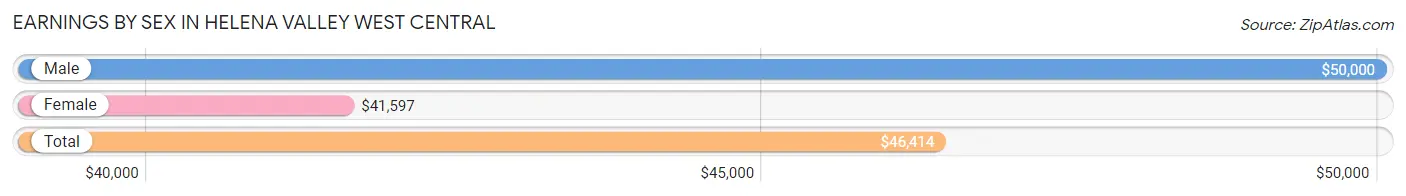
Earnings by Sex in Helena Valley West Central
Average Earnings in Helena Valley West Central are $46,414, $50,000 for men and $41,597 for women, a difference of 16.8%.
| Sex | Number | Average Earnings |
| Male | 2,326 (53.5%) | $50,000 |
| Female | 2,024 (46.5%) | $41,597 |
| Total | 4,350 (100.0%) | $46,414 |
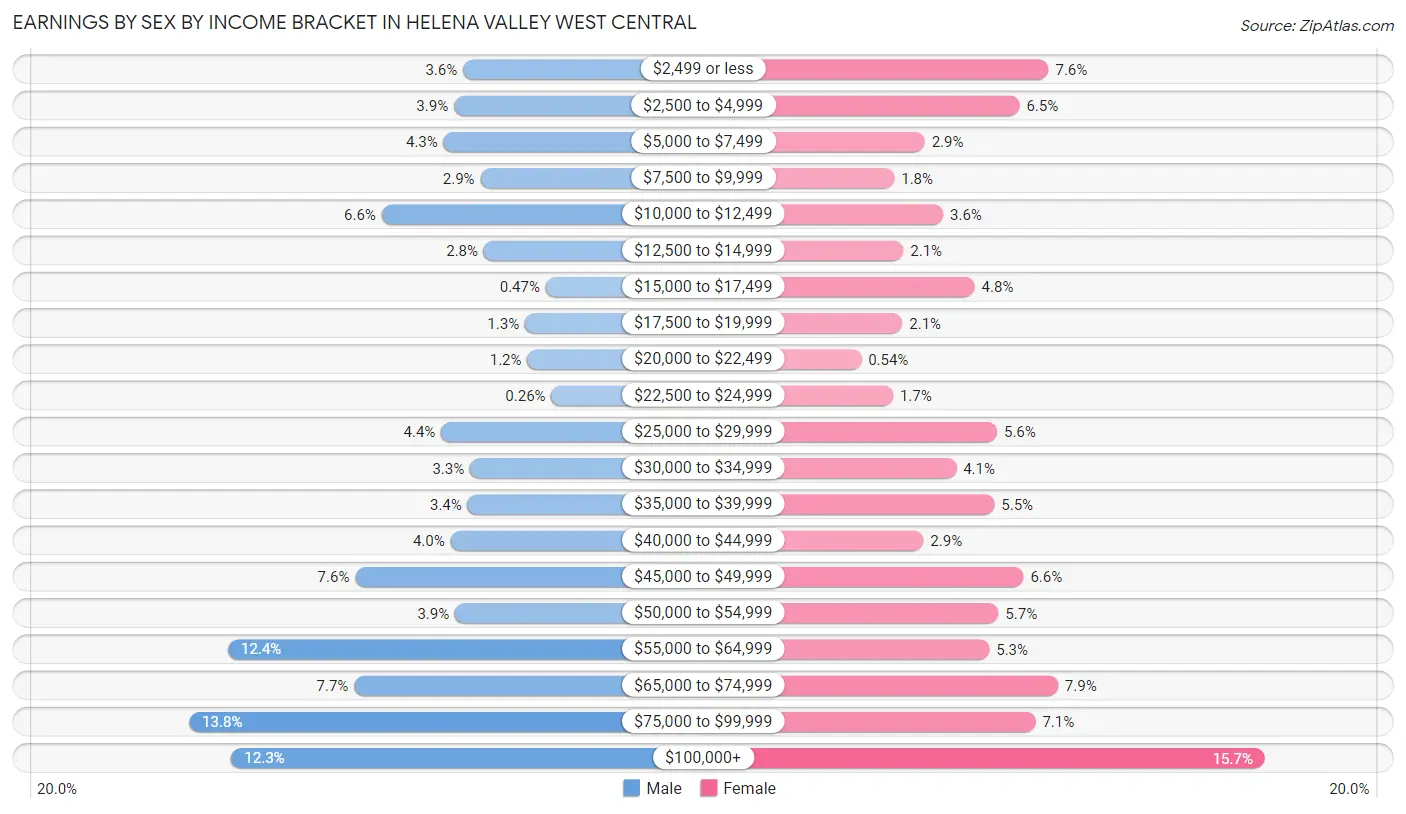
Earnings by Sex by Income Bracket in Helena Valley West Central
The most common earnings brackets in Helena Valley West Central are $75,000 to $99,999 for men (322 | 13.8%) and $100,000+ for women (317 | 15.7%).
| Income | Male | Female |
| $2,499 or less | 83 (3.6%) | 153 (7.6%) |
| $2,500 to $4,999 | 91 (3.9%) | 131 (6.5%) |
| $5,000 to $7,499 | 100 (4.3%) | 59 (2.9%) |
| $7,500 to $9,999 | 68 (2.9%) | 36 (1.8%) |
| $10,000 to $12,499 | 154 (6.6%) | 73 (3.6%) |
| $12,500 to $14,999 | 65 (2.8%) | 43 (2.1%) |
| $15,000 to $17,499 | 11 (0.5%) | 97 (4.8%) |
| $17,500 to $19,999 | 29 (1.3%) | 42 (2.1%) |
| $20,000 to $22,499 | 27 (1.2%) | 11 (0.5%) |
| $22,500 to $24,999 | 6 (0.3%) | 35 (1.7%) |
| $25,000 to $29,999 | 102 (4.4%) | 114 (5.6%) |
| $30,000 to $34,999 | 77 (3.3%) | 83 (4.1%) |
| $35,000 to $39,999 | 79 (3.4%) | 112 (5.5%) |
| $40,000 to $44,999 | 94 (4.0%) | 58 (2.9%) |
| $45,000 to $49,999 | 177 (7.6%) | 134 (6.6%) |
| $50,000 to $54,999 | 90 (3.9%) | 115 (5.7%) |
| $55,000 to $64,999 | 288 (12.4%) | 108 (5.3%) |
| $65,000 to $74,999 | 178 (7.6%) | 160 (7.9%) |
| $75,000 to $99,999 | 322 (13.8%) | 143 (7.1%) |
| $100,000+ | 285 (12.2%) | 317 (15.7%) |
| Total | 2,326 (100.0%) | 2,024 (100.0%) |
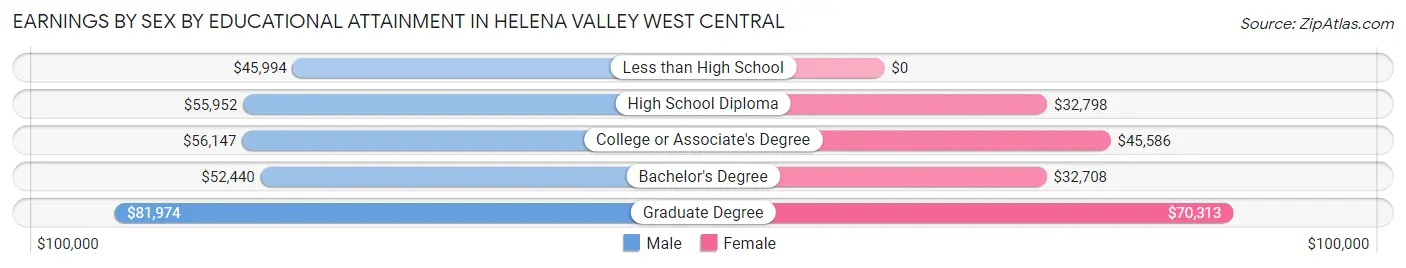
Earnings by Sex by Educational Attainment in Helena Valley West Central
Average earnings in Helena Valley West Central are $57,011 for men and $46,722 for women, a difference of 18.0%. Men with an educational attainment of graduate degree enjoy the highest average annual earnings of $81,974, while those with less than high school education earn the least with $45,994. Women with an educational attainment of graduate degree earn the most with the average annual earnings of $70,313, while those with bachelor's degree education have the smallest earnings of $32,708.
| Educational Attainment | Male Income | Female Income |
| Less than High School | $45,994 | $0 |
| High School Diploma | $55,952 | $32,798 |
| College or Associate's Degree | $56,147 | $45,586 |
| Bachelor's Degree | $52,440 | $32,708 |
| Graduate Degree | $81,974 | $70,313 |
| Total | $57,011 | $46,722 |
Family Income in Helena Valley West Central
Family Income Brackets in Helena Valley West Central
According to the Helena Valley West Central family income data, there are 634 families falling into the $100,000 to $149,999 income range, which is the most common income bracket and makes up 27.8% of all families.
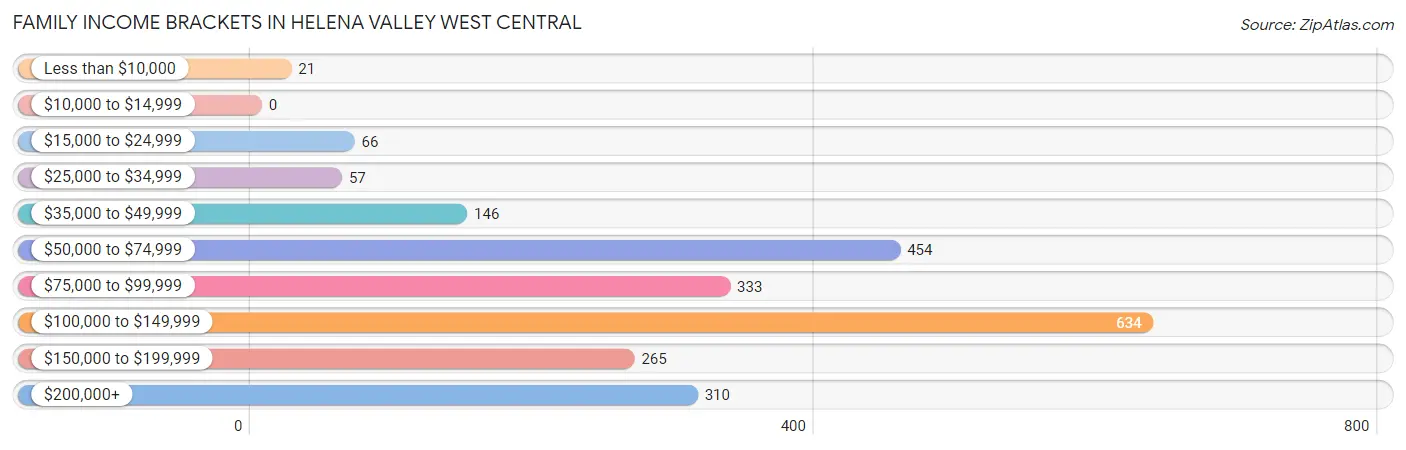
| Income Bracket | # Families | % Families |
| Less than $10,000 | 21 | 0.9% |
| $10,000 to $14,999 | 0 | 0.0% |
| $15,000 to $24,999 | 66 | 2.9% |
| $25,000 to $34,999 | 57 | 2.5% |
| $35,000 to $49,999 | 146 | 6.4% |
| $50,000 to $74,999 | 454 | 19.9% |
| $75,000 to $99,999 | 333 | 14.6% |
| $100,000 to $149,999 | 634 | 27.8% |
| $150,000 to $199,999 | 265 | 11.6% |
| $200,000+ | 310 | 13.6% |
Family Income by Famaliy Size in Helena Valley West Central
5-person families (201 | 8.8%) account for the highest median family income in Helena Valley West Central with $179,811 per family, while 2-person families (1,064 | 46.7%) have the highest median income of $48,416 per family member.
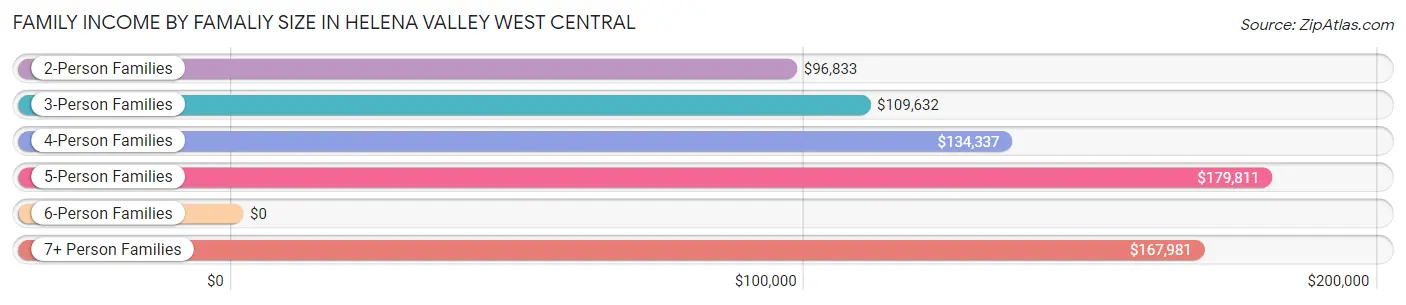
| Income Bracket | # Families | Median Income |
| 2-Person Families | 1,064 (46.7%) | $96,833 |
| 3-Person Families | 603 (26.4%) | $109,632 |
| 4-Person Families | 264 (11.6%) | $134,337 |
| 5-Person Families | 201 (8.8%) | $179,811 |
| 6-Person Families | 106 (4.6%) | $0 |
| 7+ Person Families | 43 (1.9%) | $167,981 |
| Total | 2,281 (100.0%) | $102,027 |
Family Income by Number of Earners in Helena Valley West Central
The median family income in Helena Valley West Central is $102,027, with families comprising 3+ earners (153) having the highest median family income of $156,058, while families with 1 earner (502) have the lowest median family income of $77,292, accounting for 6.7% and 22.0% of families, respectively.
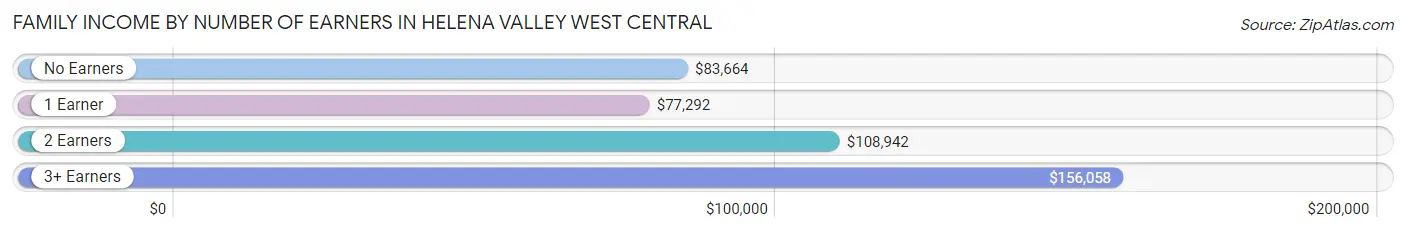
| Number of Earners | # Families | Median Income |
| No Earners | 319 (14.0%) | $83,664 |
| 1 Earner | 502 (22.0%) | $77,292 |
| 2 Earners | 1,307 (57.3%) | $108,942 |
| 3+ Earners | 153 (6.7%) | $156,058 |
| Total | 2,281 (100.0%) | $102,027 |
Household Income in Helena Valley West Central
Household Income Brackets in Helena Valley West Central
With 720 households falling in the category, the $100,000 to $149,999 income range is the most frequent in Helena Valley West Central, accounting for 23.9% of all households.
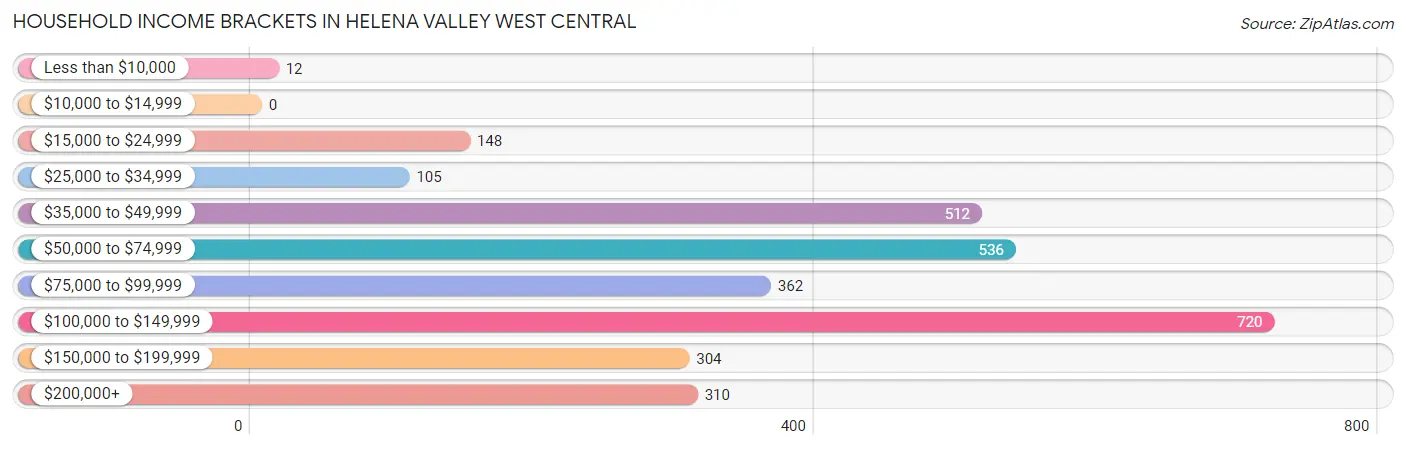
| Income Bracket | # Households | % Households |
| Less than $10,000 | 12 | 0.4% |
| $10,000 to $14,999 | 0 | 0.0% |
| $15,000 to $24,999 | 148 | 4.9% |
| $25,000 to $34,999 | 105 | 3.5% |
| $35,000 to $49,999 | 512 | 17.0% |
| $50,000 to $74,999 | 536 | 17.8% |
| $75,000 to $99,999 | 362 | 12.0% |
| $100,000 to $149,999 | 720 | 23.9% |
| $150,000 to $199,999 | 304 | 10.1% |
| $200,000+ | 310 | 10.3% |
Household Income by Householder Age in Helena Valley West Central
The median household income in Helena Valley West Central is $84,846, with the highest median household income of $100,500 found in the 45 to 64 years age bracket for the primary householder. A total of 1,244 households (41.3%) fall into this category. Meanwhile, the 15 to 24 years age bracket for the primary householder has the lowest median household income of $39,000, with 44 households (1.5%) in this group.
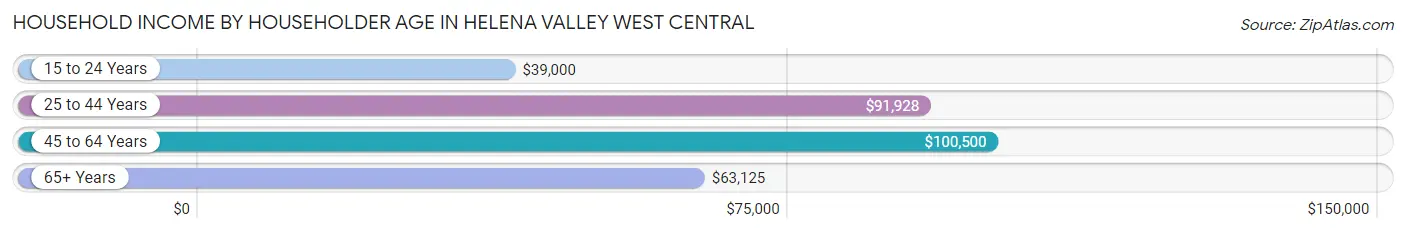
| Income Bracket | # Households | Median Income |
| 15 to 24 Years | 44 (1.5%) | $39,000 |
| 25 to 44 Years | 911 (30.2%) | $91,928 |
| 45 to 64 Years | 1,244 (41.3%) | $100,500 |
| 65+ Years | 814 (27.0%) | $63,125 |
| Total | 3,013 (100.0%) | $84,846 |
Poverty in Helena Valley West Central
Income Below Poverty by Sex and Age in Helena Valley West Central
With 5.0% poverty level for males and 2.8% for females among the residents of Helena Valley West Central, 12 to 14 year old males and 75 year old and over females are the most vulnerable to poverty, with 60 males (28.8%) and 49 females (33.1%) in their respective age groups living below the poverty level.
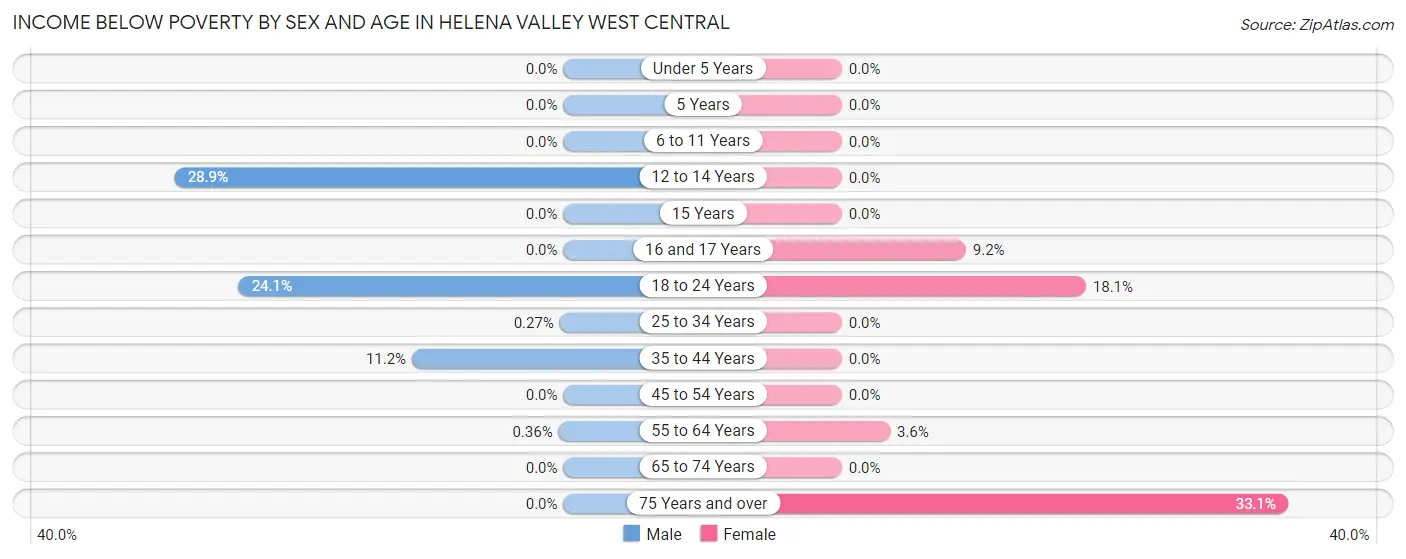
| Age Bracket | Male | Female |
| Under 5 Years | 0 (0.0%) | 0 (0.0%) |
| 5 Years | 0 (0.0%) | 0 (0.0%) |
| 6 to 11 Years | 0 (0.0%) | 0 (0.0%) |
| 12 to 14 Years | 60 (28.8%) | 0 (0.0%) |
| 15 Years | 0 (0.0%) | 0 (0.0%) |
| 16 and 17 Years | 0 (0.0%) | 7 (9.2%) |
| 18 to 24 Years | 87 (24.1%) | 29 (18.1%) |
| 25 to 34 Years | 1 (0.3%) | 0 (0.0%) |
| 35 to 44 Years | 67 (11.2%) | 0 (0.0%) |
| 45 to 54 Years | 0 (0.0%) | 0 (0.0%) |
| 55 to 64 Years | 2 (0.4%) | 20 (3.6%) |
| 65 to 74 Years | 0 (0.0%) | 0 (0.0%) |
| 75 Years and over | 0 (0.0%) | 49 (33.1%) |
| Total | 217 (5.0%) | 105 (2.8%) |
Income Above Poverty by Sex and Age in Helena Valley West Central
According to the poverty statistics in Helena Valley West Central, males aged under 5 years and females aged under 5 years are the age groups that are most secure financially, with 100.0% of males and 100.0% of females in these age groups living above the poverty line.
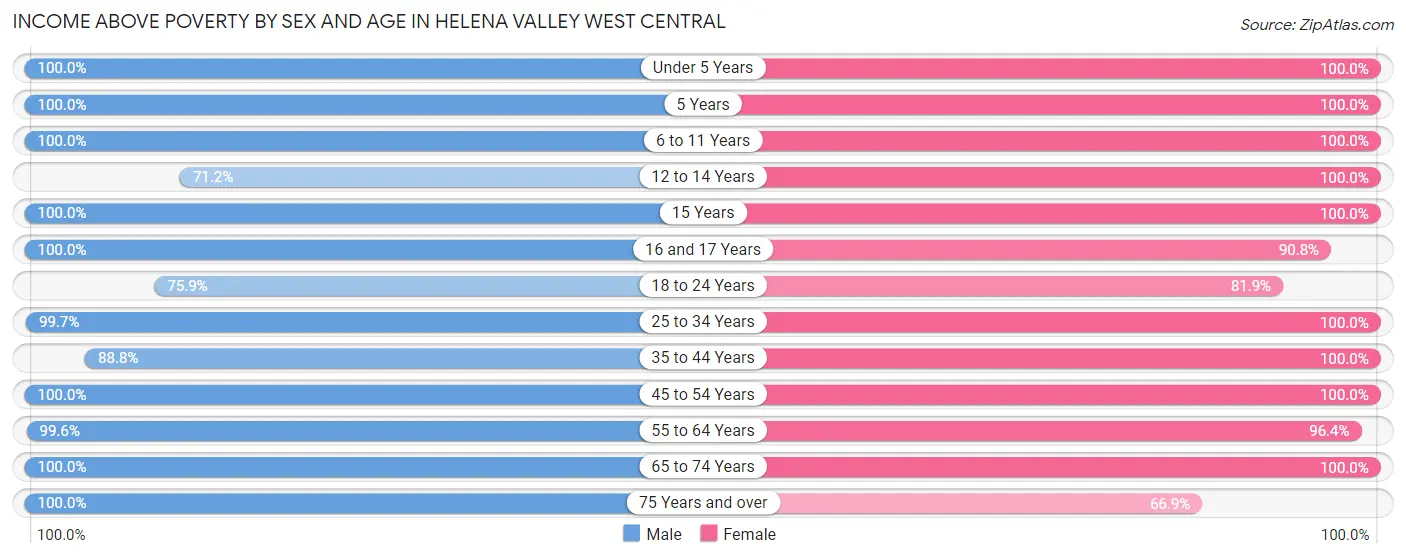
| Age Bracket | Male | Female |
| Under 5 Years | 323 (100.0%) | 188 (100.0%) |
| 5 Years | 76 (100.0%) | 22 (100.0%) |
| 6 to 11 Years | 279 (100.0%) | 419 (100.0%) |
| 12 to 14 Years | 148 (71.2%) | 183 (100.0%) |
| 15 Years | 43 (100.0%) | 71 (100.0%) |
| 16 and 17 Years | 182 (100.0%) | 69 (90.8%) |
| 18 to 24 Years | 274 (75.9%) | 131 (81.9%) |
| 25 to 34 Years | 369 (99.7%) | 340 (100.0%) |
| 35 to 44 Years | 529 (88.8%) | 599 (100.0%) |
| 45 to 54 Years | 449 (100.0%) | 527 (100.0%) |
| 55 to 64 Years | 555 (99.6%) | 538 (96.4%) |
| 65 to 74 Years | 556 (100.0%) | 501 (100.0%) |
| 75 Years and over | 369 (100.0%) | 99 (66.9%) |
| Total | 4,152 (95.0%) | 3,687 (97.2%) |
Income Below Poverty Among Married-Couple Families in Helena Valley West Central
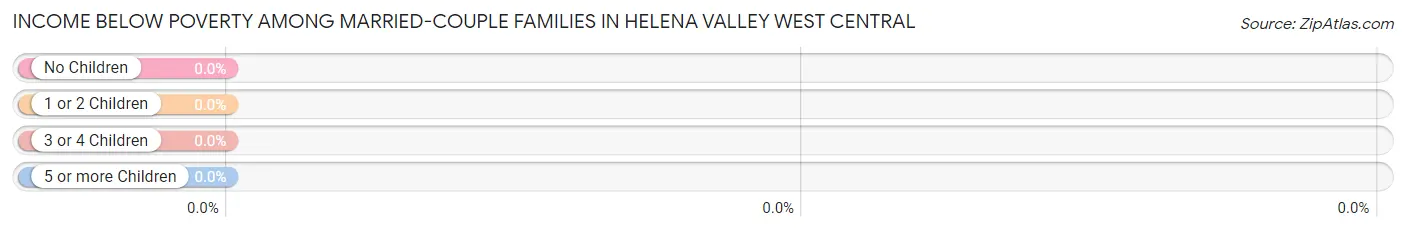
| Children | Above Poverty | Below Poverty |
| No Children | 1,041 (100.0%) | 0 (0.0%) |
| 1 or 2 Children | 548 (100.0%) | 0 (0.0%) |
| 3 or 4 Children | 222 (100.0%) | 0 (0.0%) |
| 5 or more Children | 43 (100.0%) | 0 (0.0%) |
| Total | 1,854 (100.0%) | 0 (0.0%) |
Income Below Poverty Among Single-Parent Households in Helena Valley West Central
According to the poverty data in Helena Valley West Central, 40.1% or 67 single-father households and 7.7% or 20 single-mother households are living below the poverty line. Among single-father households, those with 1 or 2 children have the highest poverty rate, with 67 households (66.3%) experiencing poverty. Likewise, among single-mother households, those with no children have the highest poverty rate, with 20 households (22.7%) falling below the poverty line.
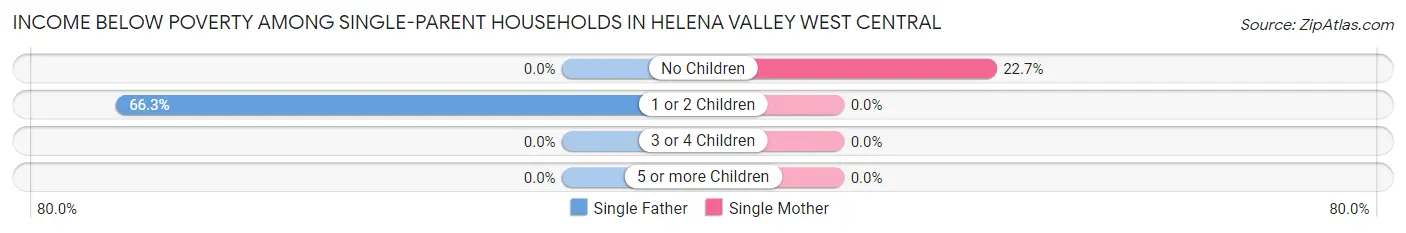
| Children | Single Father | Single Mother |
| No Children | 0 (0.0%) | 20 (22.7%) |
| 1 or 2 Children | 67 (66.3%) | 0 (0.0%) |
| 3 or 4 Children | 0 (0.0%) | 0 (0.0%) |
| 5 or more Children | 0 (0.0%) | 0 (0.0%) |
| Total | 67 (40.1%) | 20 (7.7%) |
Income Below Poverty Among Married-Couple vs Single-Parent Households in Helena Valley West Central
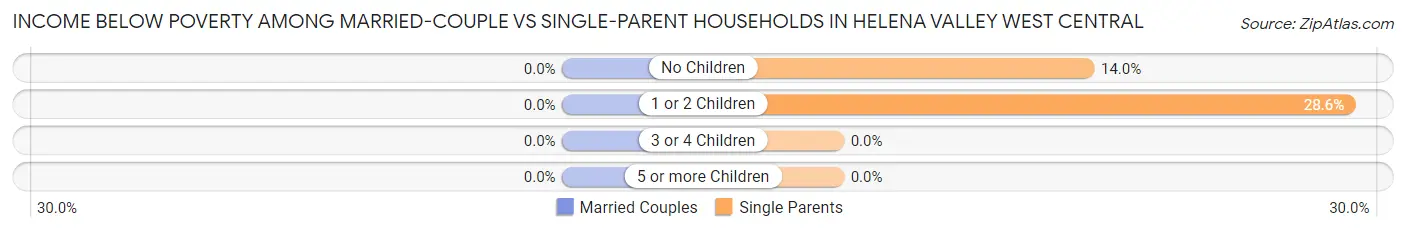
| Children | Married-Couple Families | Single-Parent Households |
| No Children | 0 (0.0%) | 20 (14.0%) |
| 1 or 2 Children | 0 (0.0%) | 67 (28.6%) |
| 3 or 4 Children | 0 (0.0%) | 0 (0.0%) |
| 5 or more Children | 0 (0.0%) | 0 (0.0%) |
| Total | 0 (0.0%) | 87 (20.4%) |
Race in Helena Valley West Central
The most populous races in Helena Valley West Central are White / Caucasian (7,255 | 88.4%), Two or more Races (855 | 10.4%), and Hispanic or Latino (398 | 4.9%).
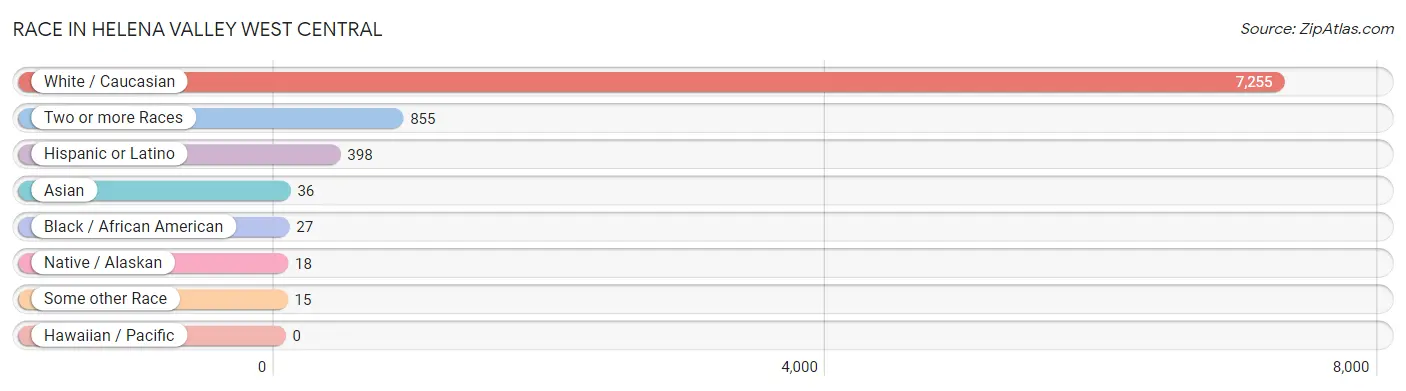
| Race | # Population | % Population |
| Asian | 36 | 0.4% |
| Black / African American | 27 | 0.3% |
| Hawaiian / Pacific | 0 | 0.0% |
| Hispanic or Latino | 398 | 4.9% |
| Native / Alaskan | 18 | 0.2% |
| White / Caucasian | 7,255 | 88.4% |
| Two or more Races | 855 | 10.4% |
| Some other Race | 15 | 0.2% |
| Total | 8,206 | 100.0% |
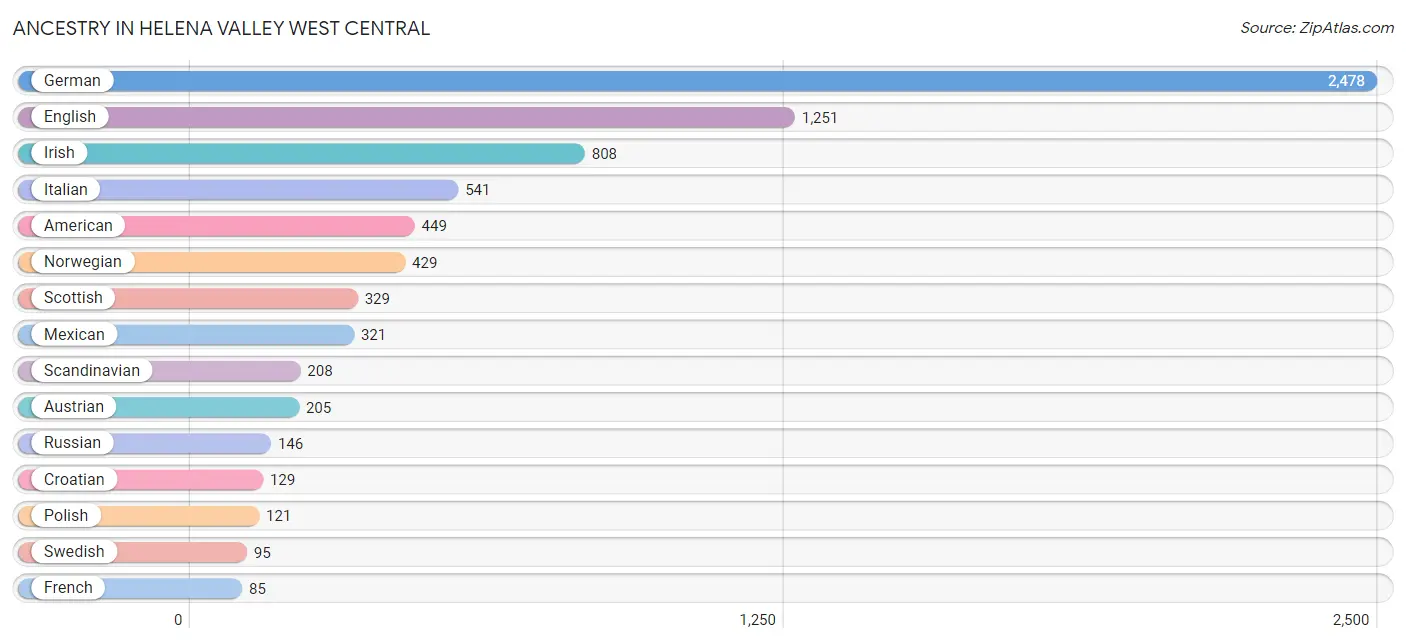
Ancestry in Helena Valley West Central
The most populous ancestries reported in Helena Valley West Central are German (2,478 | 30.2%), English (1,251 | 15.2%), Irish (808 | 9.9%), Italian (541 | 6.6%), and American (449 | 5.5%), together accounting for 67.3% of all Helena Valley West Central residents.
| Ancestry | # Population | % Population |
| African | 7 | 0.1% |
| American | 449 | 5.5% |
| Armenian | 22 | 0.3% |
| Austrian | 205 | 2.5% |
| Belgian | 7 | 0.1% |
| Bhutanese | 24 | 0.3% |
| British | 66 | 0.8% |
| Burmese | 29 | 0.4% |
| Central American Indian | 17 | 0.2% |
| Cherokee | 10 | 0.1% |
| Chippewa | 2 | 0.0% |
| Croatian | 129 | 1.6% |
| Cuban | 7 | 0.1% |
| Czech | 63 | 0.8% |
| Czechoslovakian | 7 | 0.1% |
| Danish | 40 | 0.5% |
| Dutch | 59 | 0.7% |
| English | 1,251 | 15.2% |
| European | 43 | 0.5% |
| Finnish | 39 | 0.5% |
| French | 85 | 1.0% |
| French Canadian | 30 | 0.4% |
| German | 2,478 | 30.2% |
| Hungarian | 54 | 0.7% |
| Indian (Asian) | 30 | 0.4% |
| Indonesian | 7 | 0.1% |
| Inupiat | 8 | 0.1% |
| Irish | 808 | 9.9% |
| Italian | 541 | 6.6% |
| Korean | 55 | 0.7% |
| Laotian | 30 | 0.4% |
| Latvian | 8 | 0.1% |
| Lithuanian | 44 | 0.5% |
| Luxembourger | 4 | 0.1% |
| Mexican | 321 | 3.9% |
| Native Hawaiian | 12 | 0.2% |
| Navajo | 2 | 0.0% |
| Northern European | 17 | 0.2% |
| Norwegian | 429 | 5.2% |
| Pennsylvania German | 8 | 0.1% |
| Polish | 121 | 1.5% |
| Portuguese | 31 | 0.4% |
| Puerto Rican | 17 | 0.2% |
| Russian | 146 | 1.8% |
| Scandinavian | 208 | 2.5% |
| Scotch-Irish | 64 | 0.8% |
| Scottish | 329 | 4.0% |
| Seminole | 6 | 0.1% |
| Sioux | 11 | 0.1% |
| Slavic | 36 | 0.4% |
| Slovene | 22 | 0.3% |
| Spanish | 53 | 0.6% |
| Subsaharan African | 7 | 0.1% |
| Swedish | 95 | 1.2% |
| Swiss | 53 | 0.6% |
| Thai | 4 | 0.1% |
| Tlingit-Haida | 18 | 0.2% |
| Ukrainian | 38 | 0.5% |
| Welsh | 57 | 0.7% | View All 59 Rows |
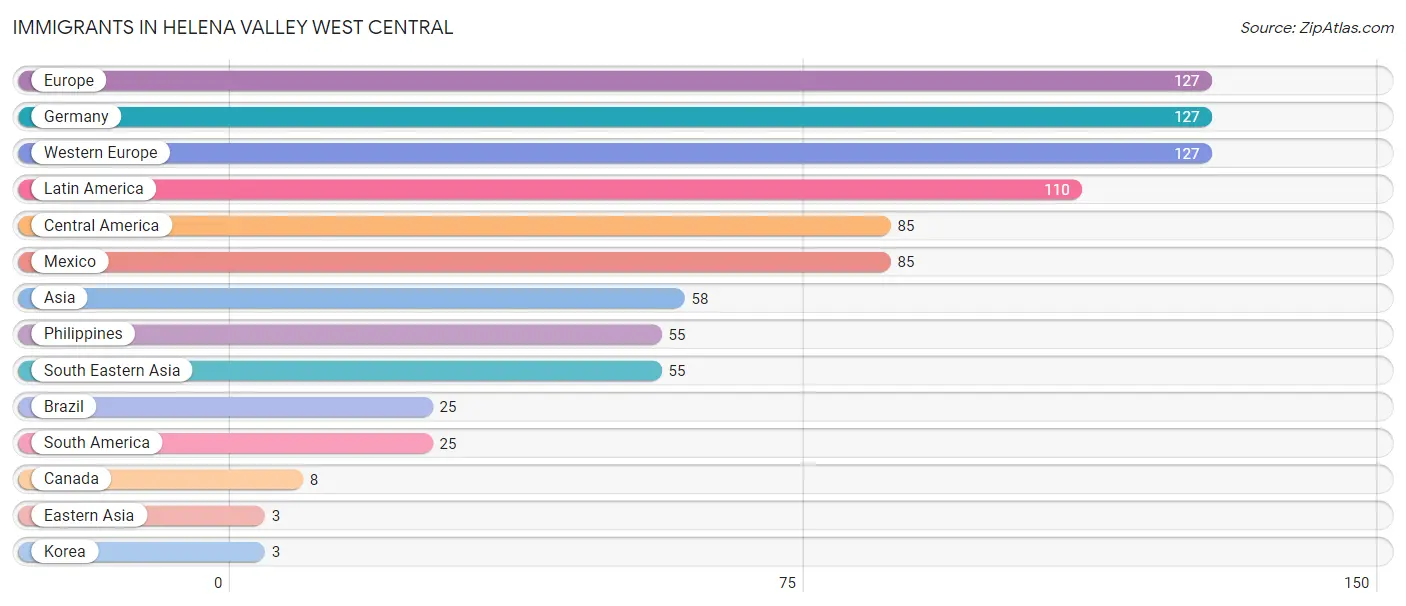
Immigrants in Helena Valley West Central
The most numerous immigrant groups reported in Helena Valley West Central came from Europe (127 | 1.5%), Germany (127 | 1.5%), Western Europe (127 | 1.5%), Latin America (110 | 1.3%), and Central America (85 | 1.0%), together accounting for 7.0% of all Helena Valley West Central residents.
| Immigration Origin | # Population | % Population |
| Asia | 58 | 0.7% |
| Brazil | 25 | 0.3% |
| Canada | 8 | 0.1% |
| Central America | 85 | 1.0% |
| Eastern Asia | 3 | 0.0% |
| Europe | 127 | 1.5% |
| Germany | 127 | 1.5% |
| Korea | 3 | 0.0% |
| Latin America | 110 | 1.3% |
| Mexico | 85 | 1.0% |
| Philippines | 55 | 0.7% |
| South America | 25 | 0.3% |
| South Eastern Asia | 55 | 0.7% |
| Western Europe | 127 | 1.5% | View All 14 Rows |
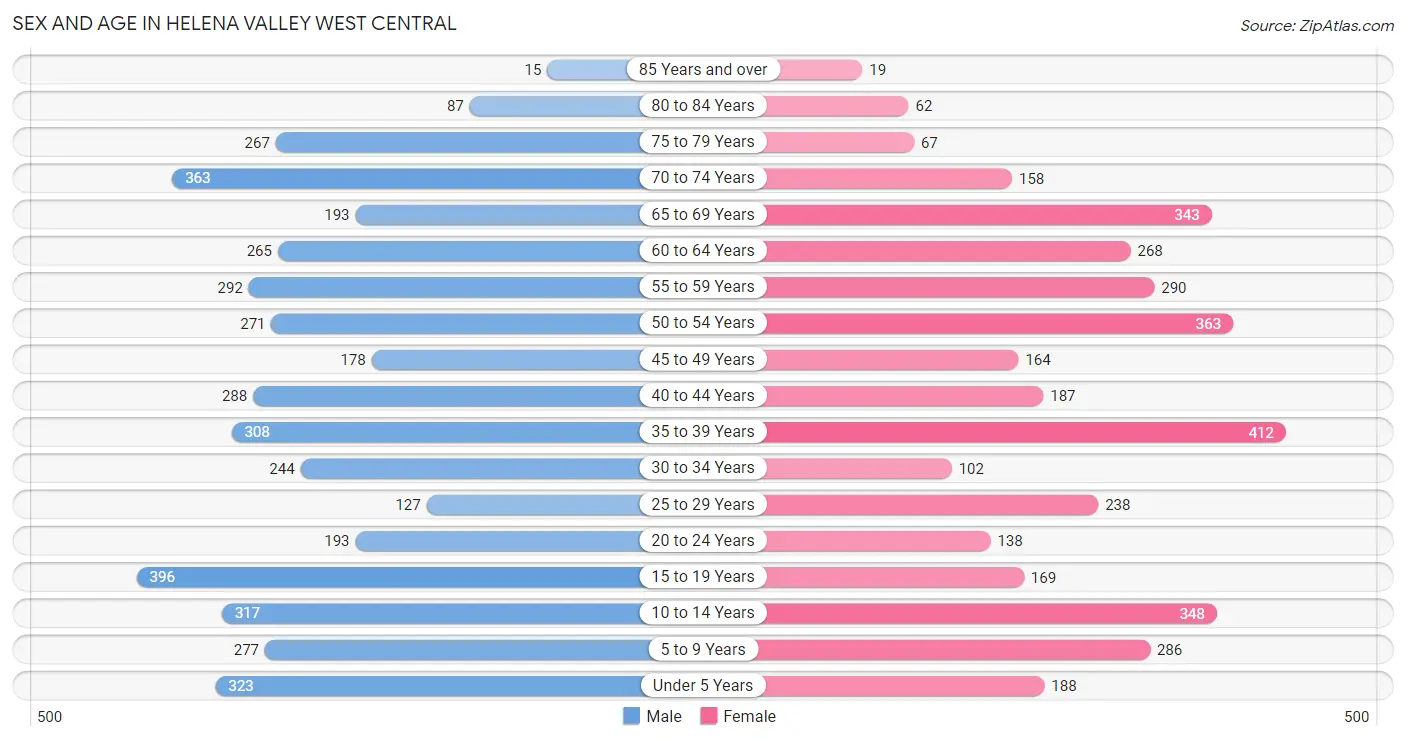
Sex and Age in Helena Valley West Central
Sex and Age in Helena Valley West Central
The most populous age groups in Helena Valley West Central are 15 to 19 Years (396 | 9.0%) for men and 35 to 39 Years (412 | 10.8%) for women.
| Age Bracket | Male | Female |
| Under 5 Years | 323 (7.3%) | 188 (4.9%) |
| 5 to 9 Years | 277 (6.3%) | 286 (7.5%) |
| 10 to 14 Years | 317 (7.2%) | 348 (9.1%) |
| 15 to 19 Years | 396 (9.0%) | 169 (4.4%) |
| 20 to 24 Years | 193 (4.4%) | 138 (3.6%) |
| 25 to 29 Years | 127 (2.9%) | 238 (6.3%) |
| 30 to 34 Years | 244 (5.5%) | 102 (2.7%) |
| 35 to 39 Years | 308 (7.0%) | 412 (10.8%) |
| 40 to 44 Years | 288 (6.5%) | 187 (4.9%) |
| 45 to 49 Years | 178 (4.0%) | 164 (4.3%) |
| 50 to 54 Years | 271 (6.1%) | 363 (9.6%) |
| 55 to 59 Years | 292 (6.6%) | 290 (7.6%) |
| 60 to 64 Years | 265 (6.0%) | 268 (7.0%) |
| 65 to 69 Years | 193 (4.4%) | 343 (9.0%) |
| 70 to 74 Years | 363 (8.2%) | 158 (4.2%) |
| 75 to 79 Years | 267 (6.1%) | 67 (1.8%) |
| 80 to 84 Years | 87 (2.0%) | 62 (1.6%) |
| 85 Years and over | 15 (0.3%) | 19 (0.5%) |
| Total | 4,404 (100.0%) | 3,802 (100.0%) |
Families and Households in Helena Valley West Central
Median Family Size in Helena Valley West Central
The median family size in Helena Valley West Central is 3.12 persons per family, with married-couple families (1,854 | 81.3%) accounting for the largest median family size of 3.17 persons per family. On the other hand, single male/father families (167 | 7.3%) represent the smallest median family size with 2.72 persons per family.
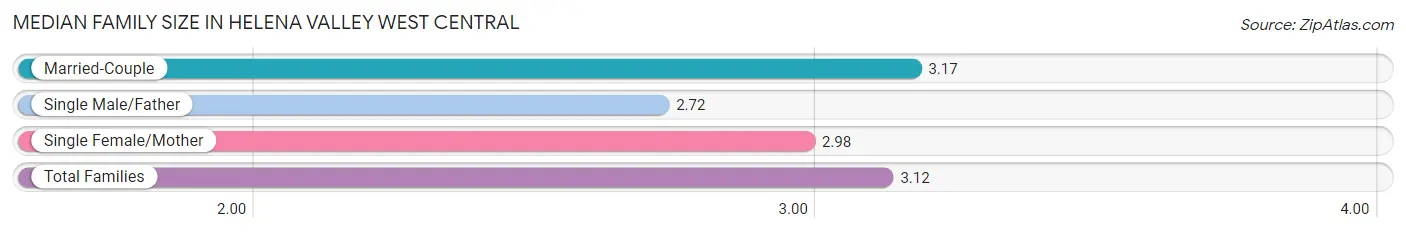
| Family Type | # Families | Family Size |
| Married-Couple | 1,854 (81.3%) | 3.17 |
| Single Male/Father | 167 (7.3%) | 2.72 |
| Single Female/Mother | 260 (11.4%) | 2.98 |
| Total Families | 2,281 (100.0%) | 3.12 |
Median Household Size in Helena Valley West Central
The median household size in Helena Valley West Central is 2.72 persons per household, with single male/father households (167 | 5.5%) accounting for the largest median household size of 3.29 persons per household. non-family households (732 | 24.3%) represent the smallest median household size with 1.21 persons per household.
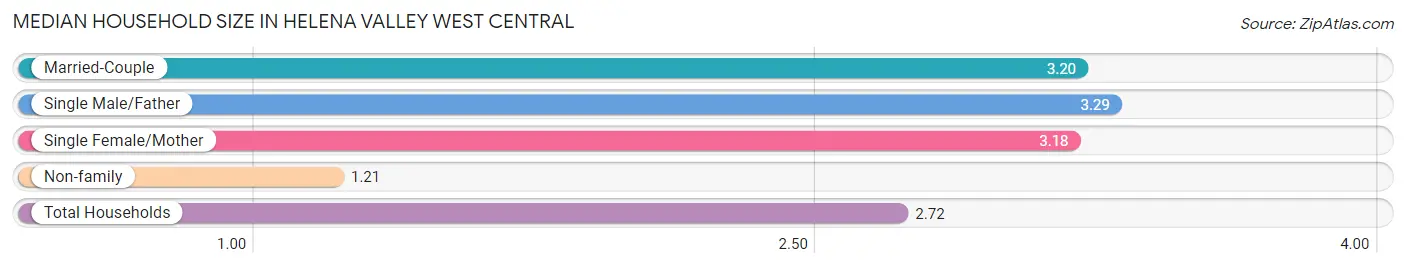
| Household Type | # Households | Household Size |
| Married-Couple | 1,854 (61.5%) | 3.20 |
| Single Male/Father | 167 (5.5%) | 3.29 |
| Single Female/Mother | 260 (8.6%) | 3.18 |
| Non-family | 732 (24.3%) | 1.21 |
| Total Households | 3,013 (100.0%) | 2.72 |
Household Size by Marriage Status in Helena Valley West Central
Out of a total of 3,013 households in Helena Valley West Central, 2,281 (75.7%) are family households, while 732 (24.3%) are nonfamily households. The most numerous type of family households are 2-person households, comprising 1,031, and the most common type of nonfamily households are 1-person households, comprising 615.
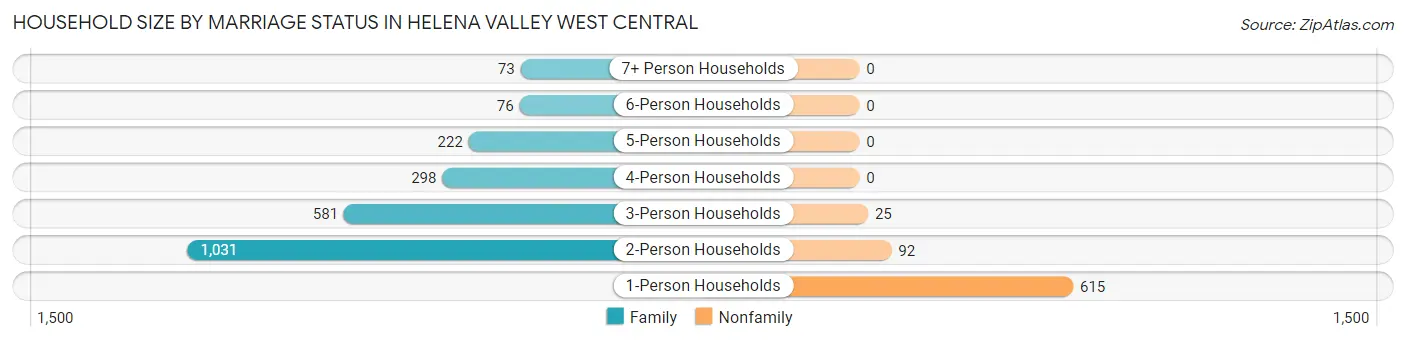
| Household Size | Family Households | Nonfamily Households |
| 1-Person Households | - | 615 (20.4%) |
| 2-Person Households | 1,031 (34.2%) | 92 (3.0%) |
| 3-Person Households | 581 (19.3%) | 25 (0.8%) |
| 4-Person Households | 298 (9.9%) | 0 (0.0%) |
| 5-Person Households | 222 (7.4%) | 0 (0.0%) |
| 6-Person Households | 76 (2.5%) | 0 (0.0%) |
| 7+ Person Households | 73 (2.4%) | 0 (0.0%) |
| Total | 2,281 (75.7%) | 732 (24.3%) |
Female Fertility in Helena Valley West Central
Fertility by Age in Helena Valley West Central
Average fertility rate in Helena Valley West Central is 87.0 births per 1,000 women. Women in the age bracket of 20 to 34 years have the highest fertility rate with 136.0 births per 1,000 women. Women in the age bracket of 20 to 34 years acount for 51.2% of all women with births.
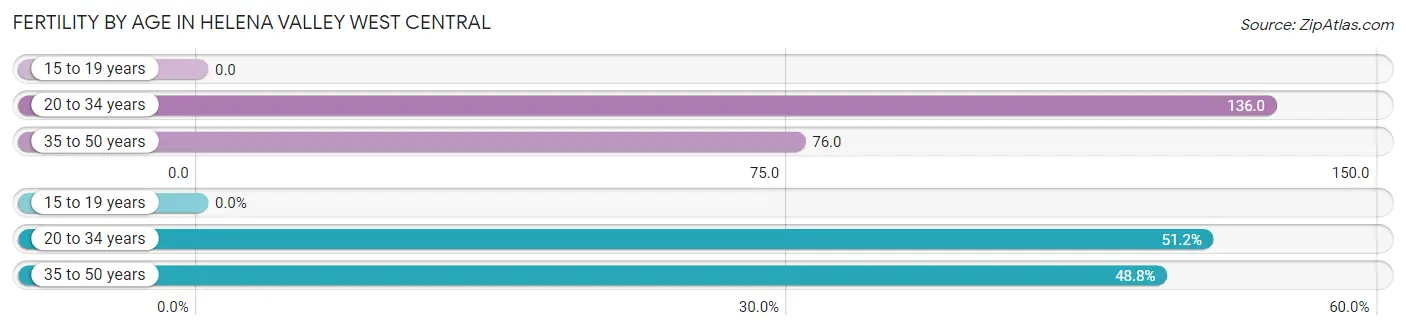
| Age Bracket | Women with Births | Births / 1,000 Women |
| 15 to 19 years | 0 (0.0%) | 0.0 |
| 20 to 34 years | 65 (51.2%) | 136.0 |
| 35 to 50 years | 62 (48.8%) | 76.0 |
| Total | 127 (100.0%) | 87.0 |
Fertility by Age by Marriage Status in Helena Valley West Central
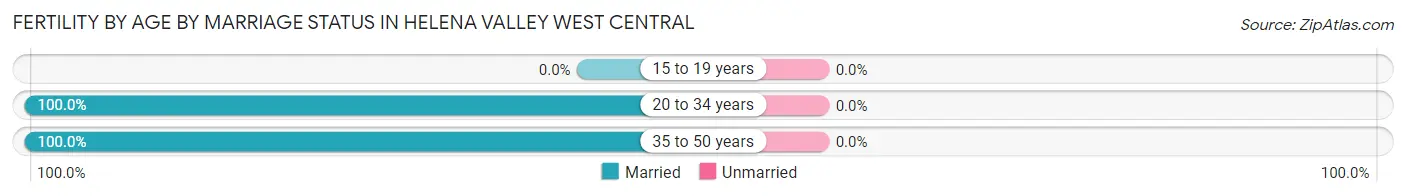
| Age Bracket | Married | Unmarried |
| 15 to 19 years | 0 (0.0%) | 0 (0.0%) |
| 20 to 34 years | 65 (100.0%) | 0 (0.0%) |
| 35 to 50 years | 62 (100.0%) | 0 (0.0%) |
| Total | 127 (100.0%) | 0 (0.0%) |
Fertility by Education in Helena Valley West Central
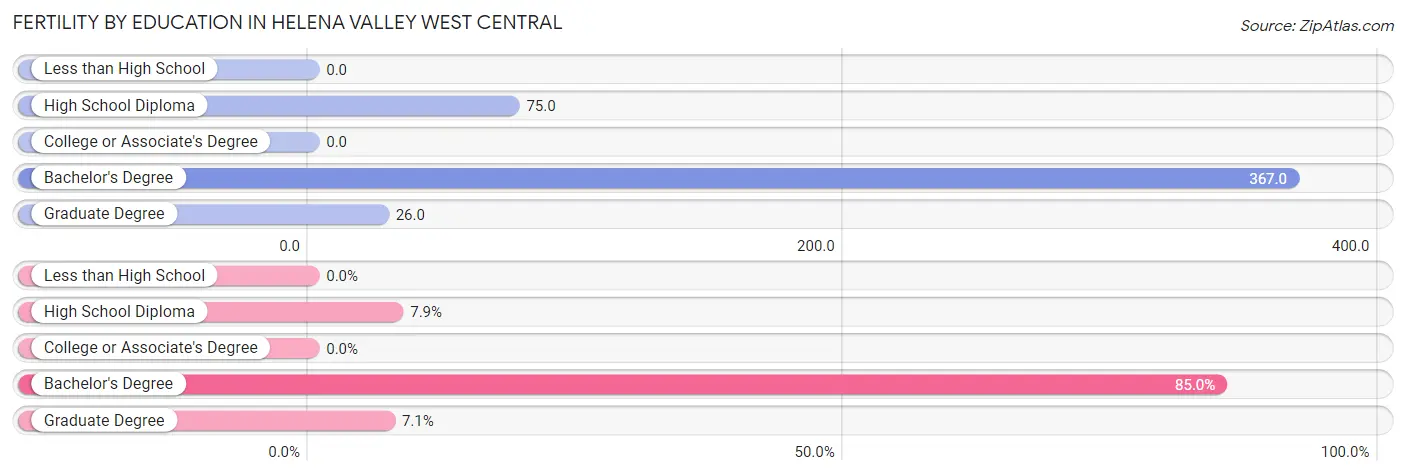
| Educational Attainment | Women with Births | Births / 1,000 Women |
| Less than High School | 0 (0.0%) | 0.0 |
| High School Diploma | 10 (7.9%) | 75.0 |
| College or Associate's Degree | 0 (0.0%) | 0.0 |
| Bachelor's Degree | 108 (85.0%) | 367.0 |
| Graduate Degree | 9 (7.1%) | 26.0 |
| Total | 127 (100.0%) | 87.0 |
Fertility by Education by Marriage Status in Helena Valley West Central
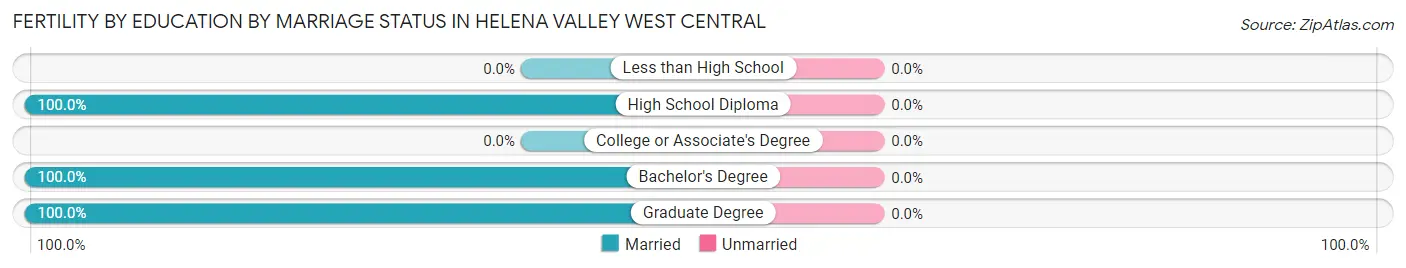
| Educational Attainment | Married | Unmarried |
| Less than High School | 0 (0.0%) | 0 (0.0%) |
| High School Diploma | 10 (100.0%) | 0 (0.0%) |
| College or Associate's Degree | 0 (0.0%) | 0 (0.0%) |
| Bachelor's Degree | 108 (100.0%) | 0 (0.0%) |
| Graduate Degree | 9 (100.0%) | 0 (0.0%) |
| Total | 127 (100.0%) | 0 (0.0%) |
Employment Characteristics in Helena Valley West Central
Employment by Class of Employer in Helena Valley West Central
Among the 4,003 employed individuals in Helena Valley West Central, private company employees (1,659 | 41.4%), state government employees (594 | 14.8%), and not-for-profit organizations (540 | 13.5%) make up the most common classes of employment.
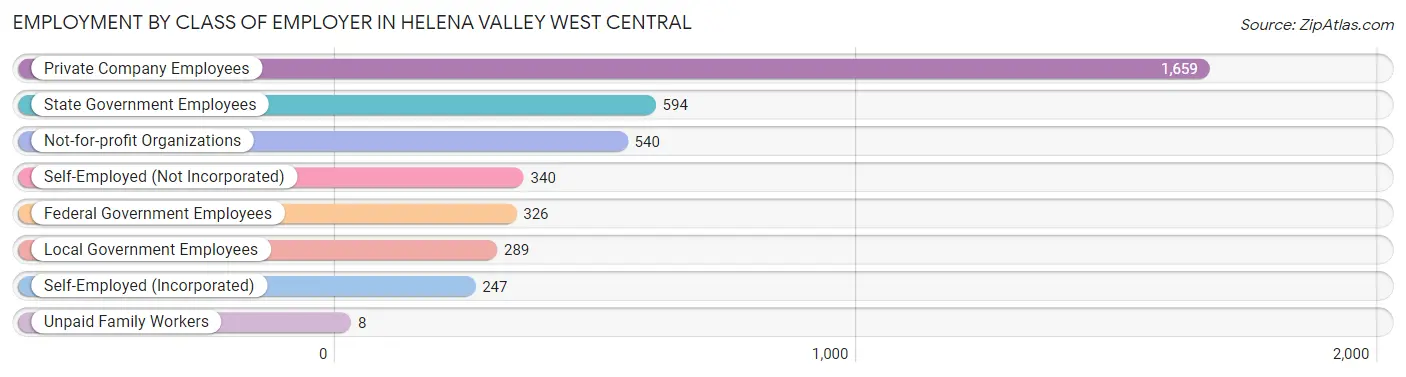
| Employer Class | # Employees | % Employees |
| Private Company Employees | 1,659 | 41.4% |
| Self-Employed (Incorporated) | 247 | 6.2% |
| Self-Employed (Not Incorporated) | 340 | 8.5% |
| Not-for-profit Organizations | 540 | 13.5% |
| Local Government Employees | 289 | 7.2% |
| State Government Employees | 594 | 14.8% |
| Federal Government Employees | 326 | 8.1% |
| Unpaid Family Workers | 8 | 0.2% |
| Total | 4,003 | 100.0% |
Employment Status by Age in Helena Valley West Central
According to the labor force statistics for Helena Valley West Central, out of the total population over 16 years of age (6,353), 66.5% or 4,225 individuals are in the labor force, with 5.1% or 215 of them unemployed. The age group with the highest labor force participation rate is 20 to 24 years, with 95.8% or 317 individuals in the labor force. Within the labor force, the 16 to 19 years age range has the highest percentage of unemployed individuals, with 24.7% or 74 of them being unemployed.
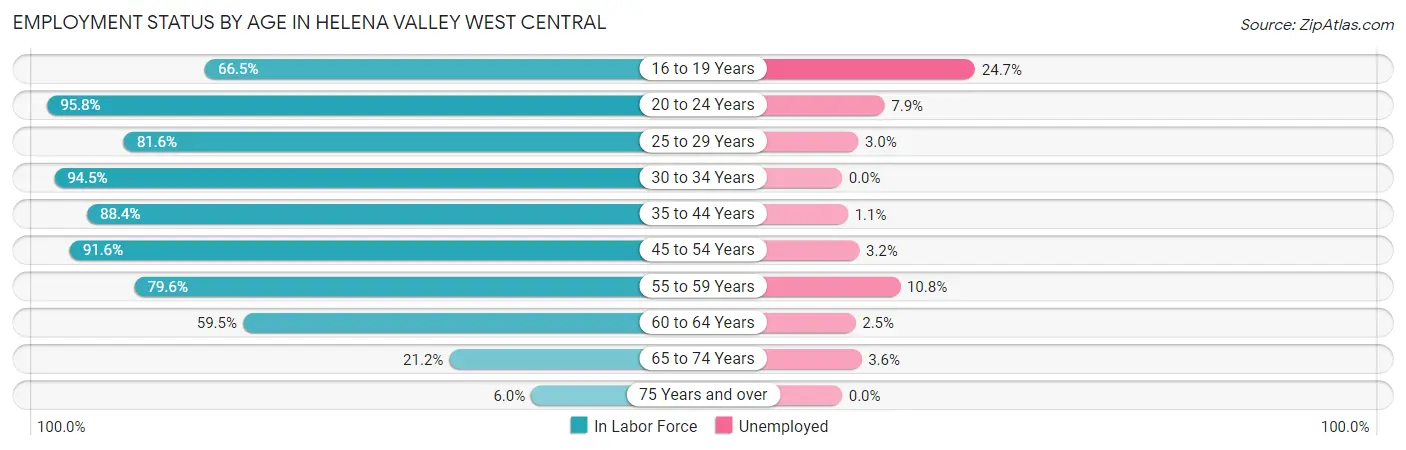
| Age Bracket | In Labor Force | Unemployed |
| 16 to 19 Years | 300 (66.5%) | 74 (24.7%) |
| 20 to 24 Years | 317 (95.8%) | 25 (7.9%) |
| 25 to 29 Years | 298 (81.6%) | 9 (3.0%) |
| 30 to 34 Years | 327 (94.5%) | 0 (0.0%) |
| 35 to 44 Years | 1,056 (88.4%) | 12 (1.1%) |
| 45 to 54 Years | 894 (91.6%) | 29 (3.2%) |
| 55 to 59 Years | 463 (79.6%) | 50 (10.8%) |
| 60 to 64 Years | 317 (59.5%) | 8 (2.5%) |
| 65 to 74 Years | 224 (21.2%) | 8 (3.6%) |
| 75 Years and over | 31 (6.0%) | 0 (0.0%) |
| Total | 4,225 (66.5%) | 215 (5.1%) |
Employment Status by Educational Attainment in Helena Valley West Central
According to labor force statistics for Helena Valley West Central, 83.9% of individuals (3,353) out of the total population between 25 and 64 years of age (3,997) are in the labor force, with 3.2% or 107 of them being unemployed. The group with the highest labor force participation rate are those with the educational attainment of bachelor's degree or higher, with 85.9% or 1,503 individuals in the labor force. Within the labor force, individuals with less than high school education have the highest percentage of unemployment, with 17.2% or 20 of them being unemployed.
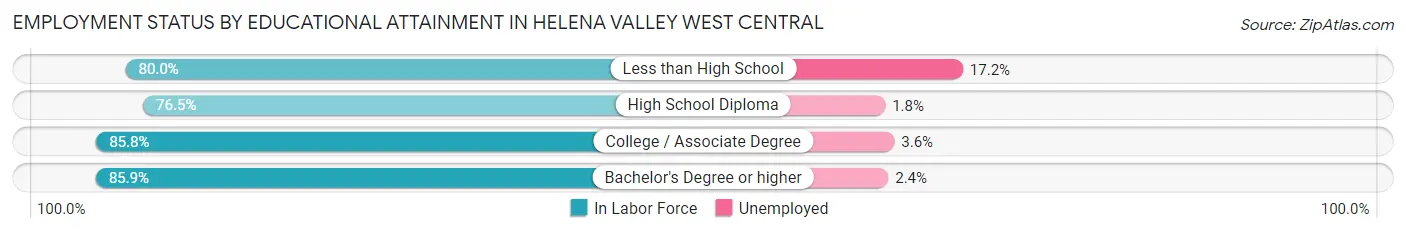
| Educational Attainment | In Labor Force | Unemployed |
| Less than High School | 116 (80.0%) | 25 (17.2%) |
| High School Diploma | 565 (76.5%) | 13 (1.8%) |
| College / Associate Degree | 1,169 (85.8%) | 49 (3.6%) |
| Bachelor's Degree or higher | 1,503 (85.9%) | 42 (2.4%) |
| Total | 3,353 (83.9%) | 128 (3.2%) |
Employment Occupations by Sex in Helena Valley West Central
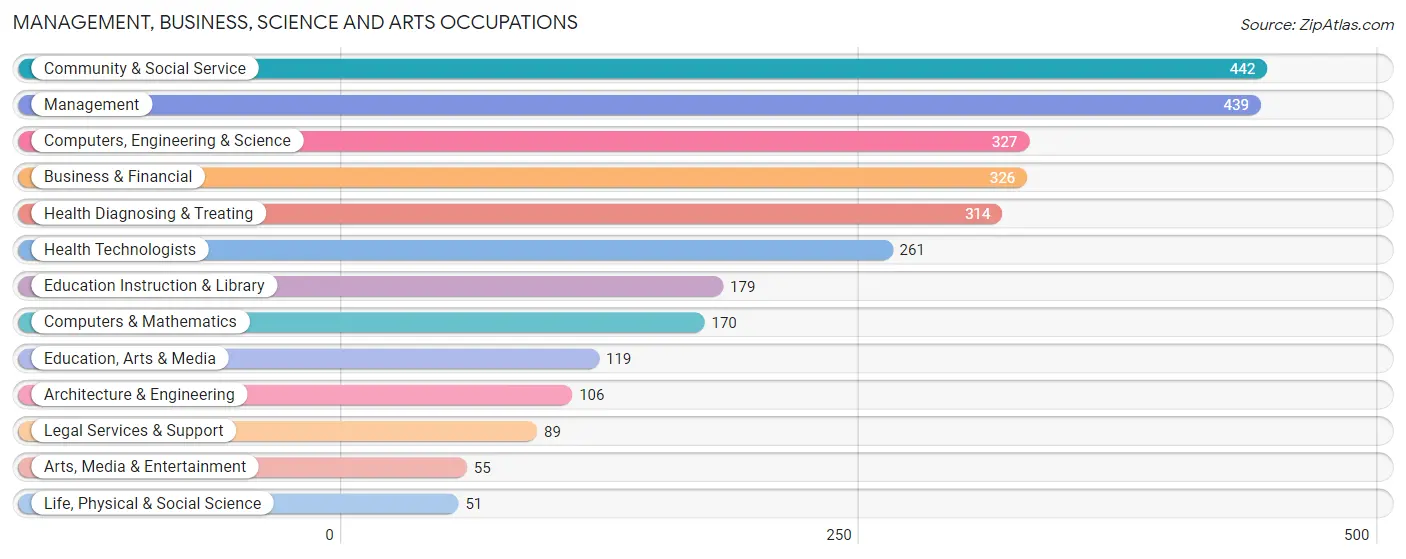
Management, Business, Science and Arts Occupations
The most common Management, Business, Science and Arts occupations in Helena Valley West Central are Community & Social Service (442 | 11.0%), Management (439 | 10.9%), Computers, Engineering & Science (327 | 8.2%), Business & Financial (326 | 8.1%), and Health Diagnosing & Treating (314 | 7.8%).
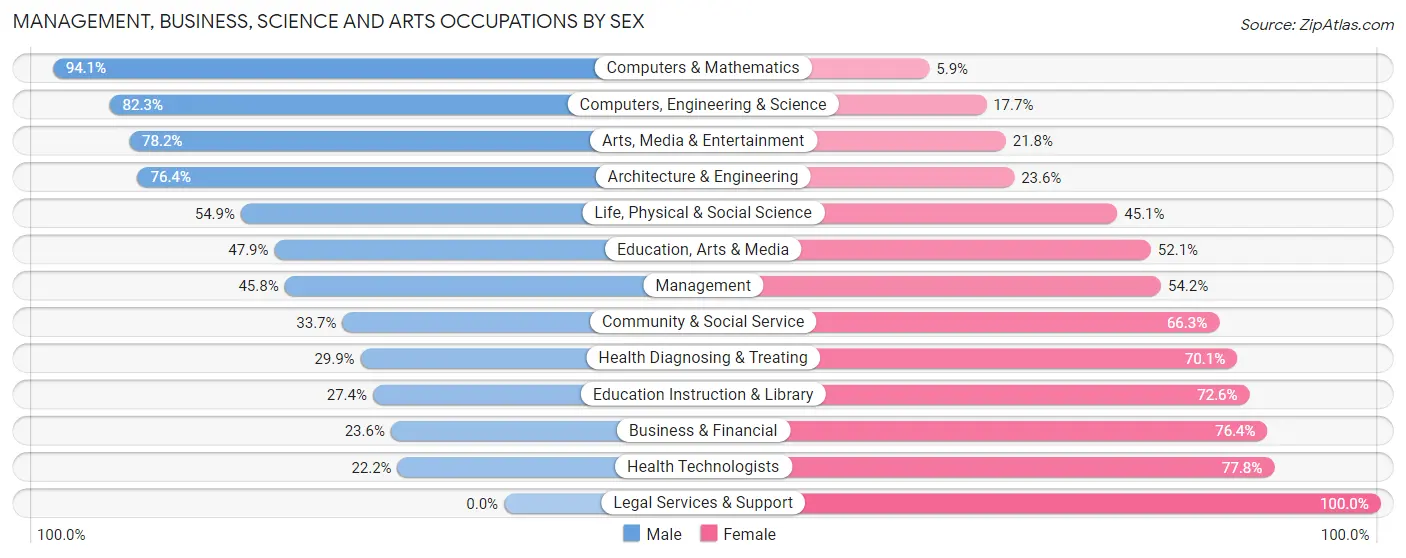
Management, Business, Science and Arts Occupations by Sex
Within the Management, Business, Science and Arts occupations in Helena Valley West Central, the most male-oriented occupations are Computers & Mathematics (94.1%), Computers, Engineering & Science (82.3%), and Arts, Media & Entertainment (78.2%), while the most female-oriented occupations are Legal Services & Support (100.0%), Health Technologists (77.8%), and Business & Financial (76.4%).
| Occupation | Male | Female |
| Management | 201 (45.8%) | 238 (54.2%) |
| Business & Financial | 77 (23.6%) | 249 (76.4%) |
| Computers, Engineering & Science | 269 (82.3%) | 58 (17.7%) |
| Computers & Mathematics | 160 (94.1%) | 10 (5.9%) |
| Architecture & Engineering | 81 (76.4%) | 25 (23.6%) |
| Life, Physical & Social Science | 28 (54.9%) | 23 (45.1%) |
| Community & Social Service | 149 (33.7%) | 293 (66.3%) |
| Education, Arts & Media | 57 (47.9%) | 62 (52.1%) |
| Legal Services & Support | 0 (0.0%) | 89 (100.0%) |
| Education Instruction & Library | 49 (27.4%) | 130 (72.6%) |
| Arts, Media & Entertainment | 43 (78.2%) | 12 (21.8%) |
| Health Diagnosing & Treating | 94 (29.9%) | 220 (70.1%) |
| Health Technologists | 58 (22.2%) | 203 (77.8%) |
| Total (Category) | 790 (42.7%) | 1,058 (57.3%) |
| Total (Overall) | 2,165 (54.0%) | 1,847 (46.0%) |
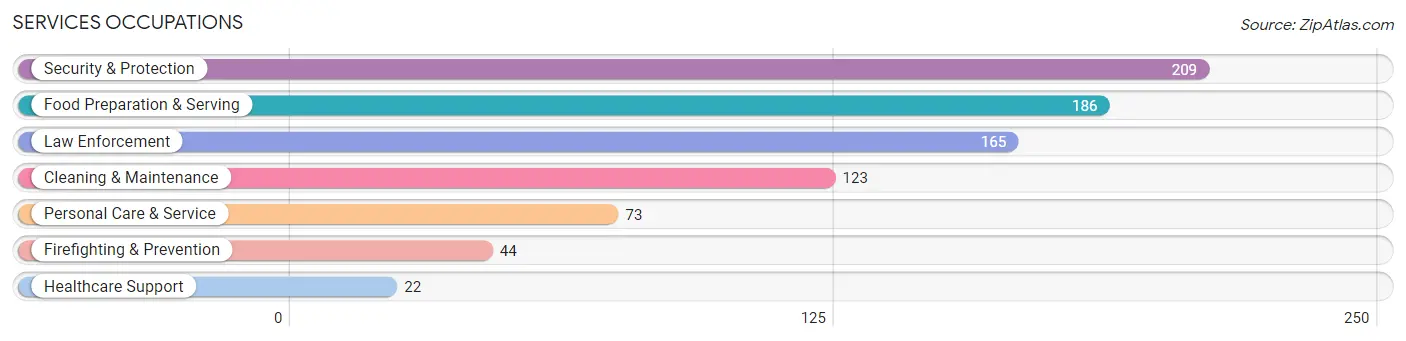
Services Occupations
The most common Services occupations in Helena Valley West Central are Security & Protection (209 | 5.2%), Food Preparation & Serving (186 | 4.6%), Law Enforcement (165 | 4.1%), Cleaning & Maintenance (123 | 3.1%), and Personal Care & Service (73 | 1.8%).
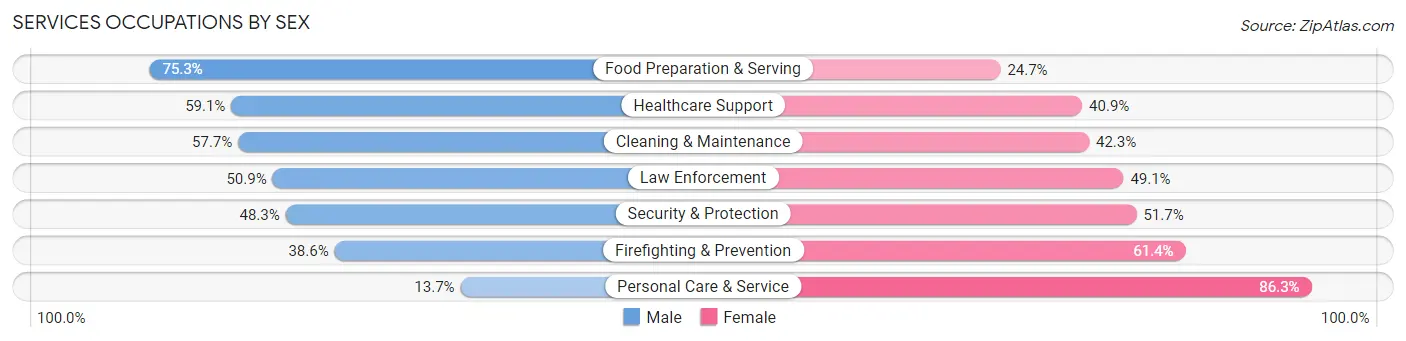
Services Occupations by Sex
Within the Services occupations in Helena Valley West Central, the most male-oriented occupations are Food Preparation & Serving (75.3%), Healthcare Support (59.1%), and Cleaning & Maintenance (57.7%), while the most female-oriented occupations are Personal Care & Service (86.3%), Firefighting & Prevention (61.4%), and Security & Protection (51.7%).
| Occupation | Male | Female |
| Healthcare Support | 13 (59.1%) | 9 (40.9%) |
| Security & Protection | 101 (48.3%) | 108 (51.7%) |
| Firefighting & Prevention | 17 (38.6%) | 27 (61.4%) |
| Law Enforcement | 84 (50.9%) | 81 (49.1%) |
| Food Preparation & Serving | 140 (75.3%) | 46 (24.7%) |
| Cleaning & Maintenance | 71 (57.7%) | 52 (42.3%) |
| Personal Care & Service | 10 (13.7%) | 63 (86.3%) |
| Total (Category) | 335 (54.6%) | 278 (45.4%) |
| Total (Overall) | 2,165 (54.0%) | 1,847 (46.0%) |
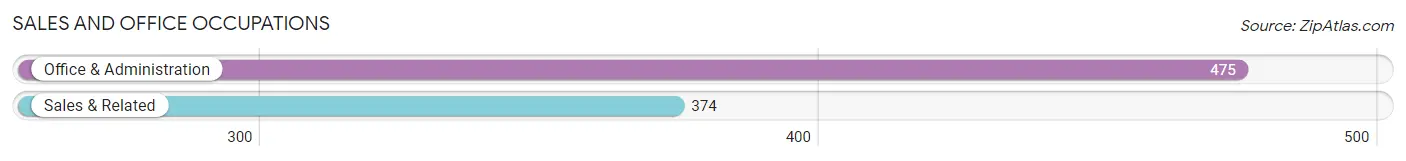
Sales and Office Occupations
The most common Sales and Office occupations in Helena Valley West Central are Office & Administration (475 | 11.8%), and Sales & Related (374 | 9.3%).
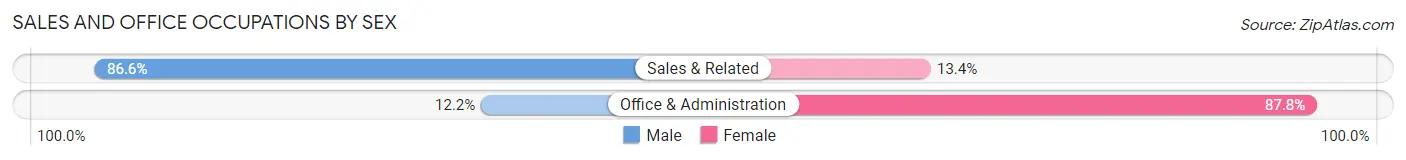
Sales and Office Occupations by Sex
| Occupation | Male | Female |
| Sales & Related | 324 (86.6%) | 50 (13.4%) |
| Office & Administration | 58 (12.2%) | 417 (87.8%) |
| Total (Category) | 382 (45.0%) | 467 (55.0%) |
| Total (Overall) | 2,165 (54.0%) | 1,847 (46.0%) |
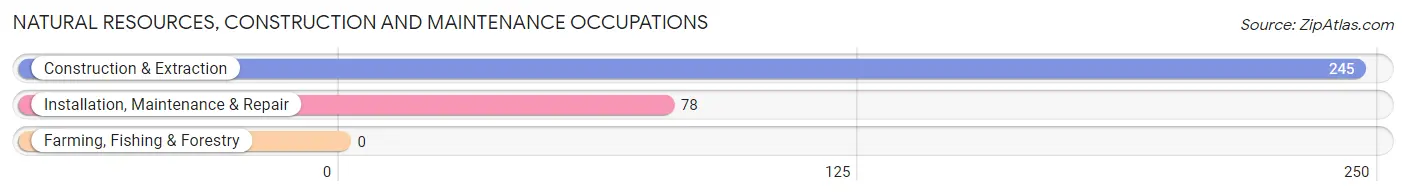
Natural Resources, Construction and Maintenance Occupations
The most common Natural Resources, Construction and Maintenance occupations in Helena Valley West Central are Construction & Extraction (245 | 6.1%), and Installation, Maintenance & Repair (78 | 1.9%).
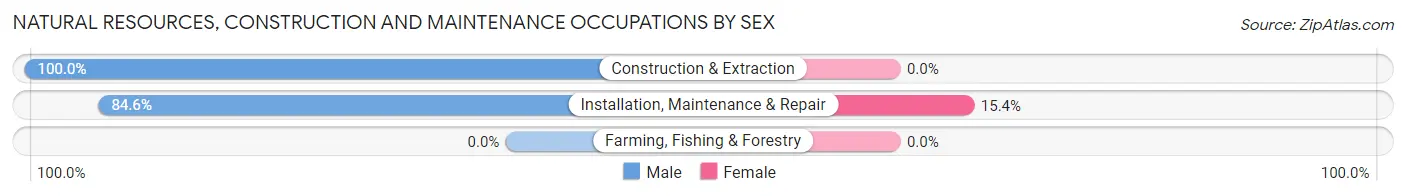
Natural Resources, Construction and Maintenance Occupations by Sex
| Occupation | Male | Female |
| Farming, Fishing & Forestry | 0 (0.0%) | 0 (0.0%) |
| Construction & Extraction | 245 (100.0%) | 0 (0.0%) |
| Installation, Maintenance & Repair | 66 (84.6%) | 12 (15.4%) |
| Total (Category) | 311 (96.3%) | 12 (3.7%) |
| Total (Overall) | 2,165 (54.0%) | 1,847 (46.0%) |
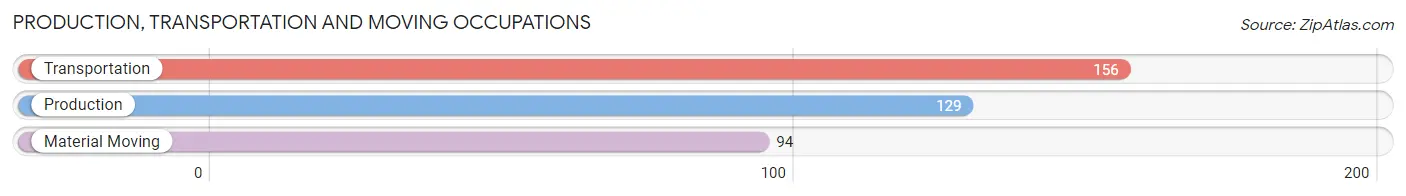
Production, Transportation and Moving Occupations
The most common Production, Transportation and Moving occupations in Helena Valley West Central are Transportation (156 | 3.9%), Production (129 | 3.2%), and Material Moving (94 | 2.3%).
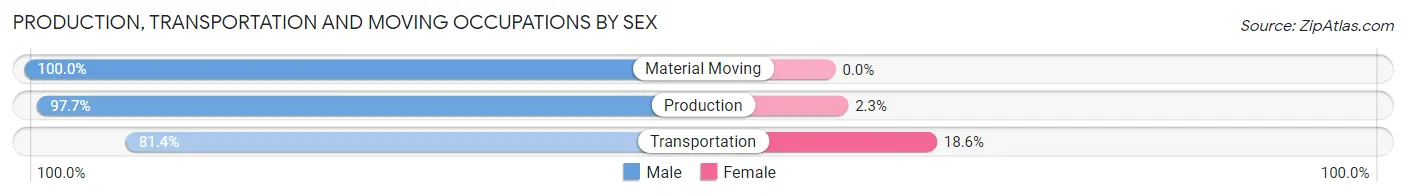
Production, Transportation and Moving Occupations by Sex
| Occupation | Male | Female |
| Production | 126 (97.7%) | 3 (2.3%) |
| Transportation | 127 (81.4%) | 29 (18.6%) |
| Material Moving | 94 (100.0%) | 0 (0.0%) |
| Total (Category) | 347 (91.6%) | 32 (8.4%) |
| Total (Overall) | 2,165 (54.0%) | 1,847 (46.0%) |
Employment Industries by Sex in Helena Valley West Central
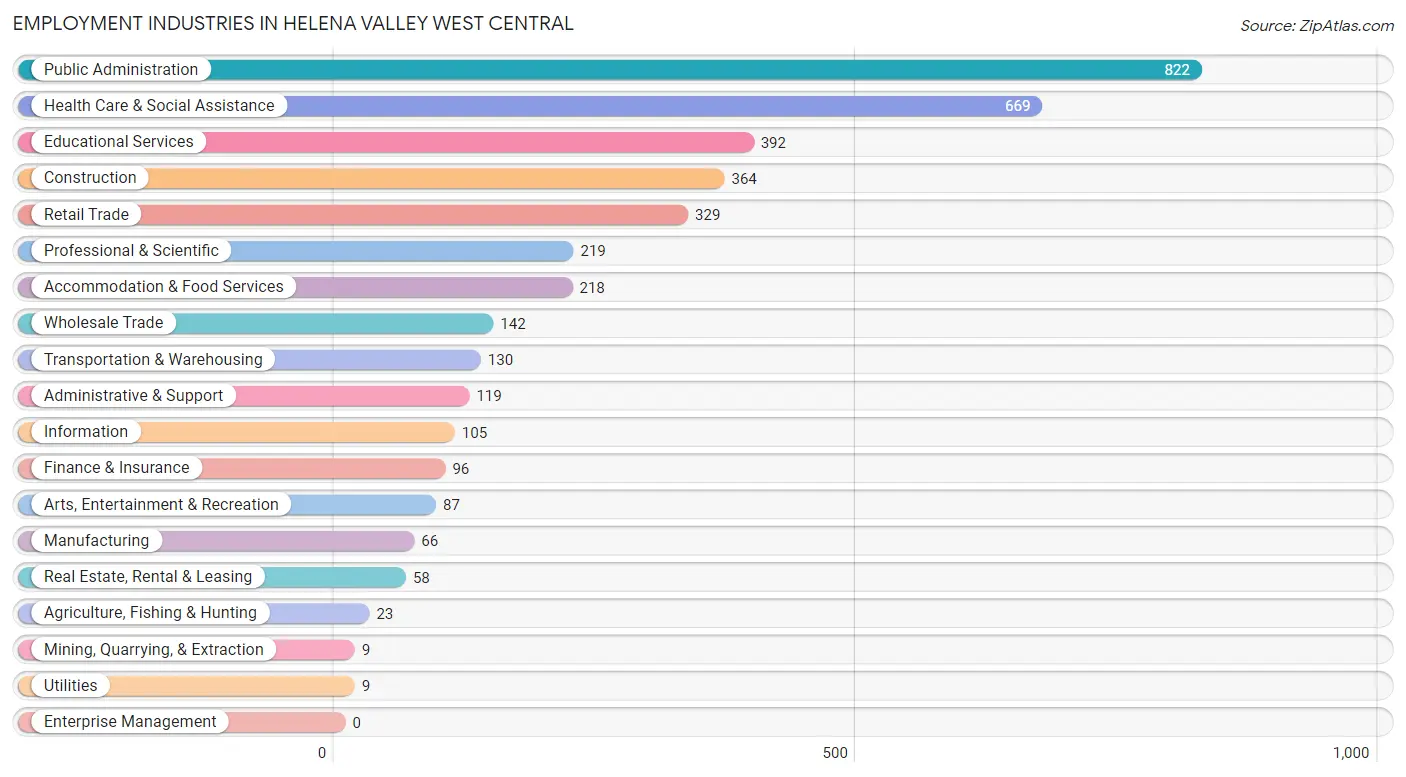
Employment Industries in Helena Valley West Central
The major employment industries in Helena Valley West Central include Public Administration (822 | 20.5%), Health Care & Social Assistance (669 | 16.7%), Educational Services (392 | 9.8%), Construction (364 | 9.1%), and Retail Trade (329 | 8.2%).
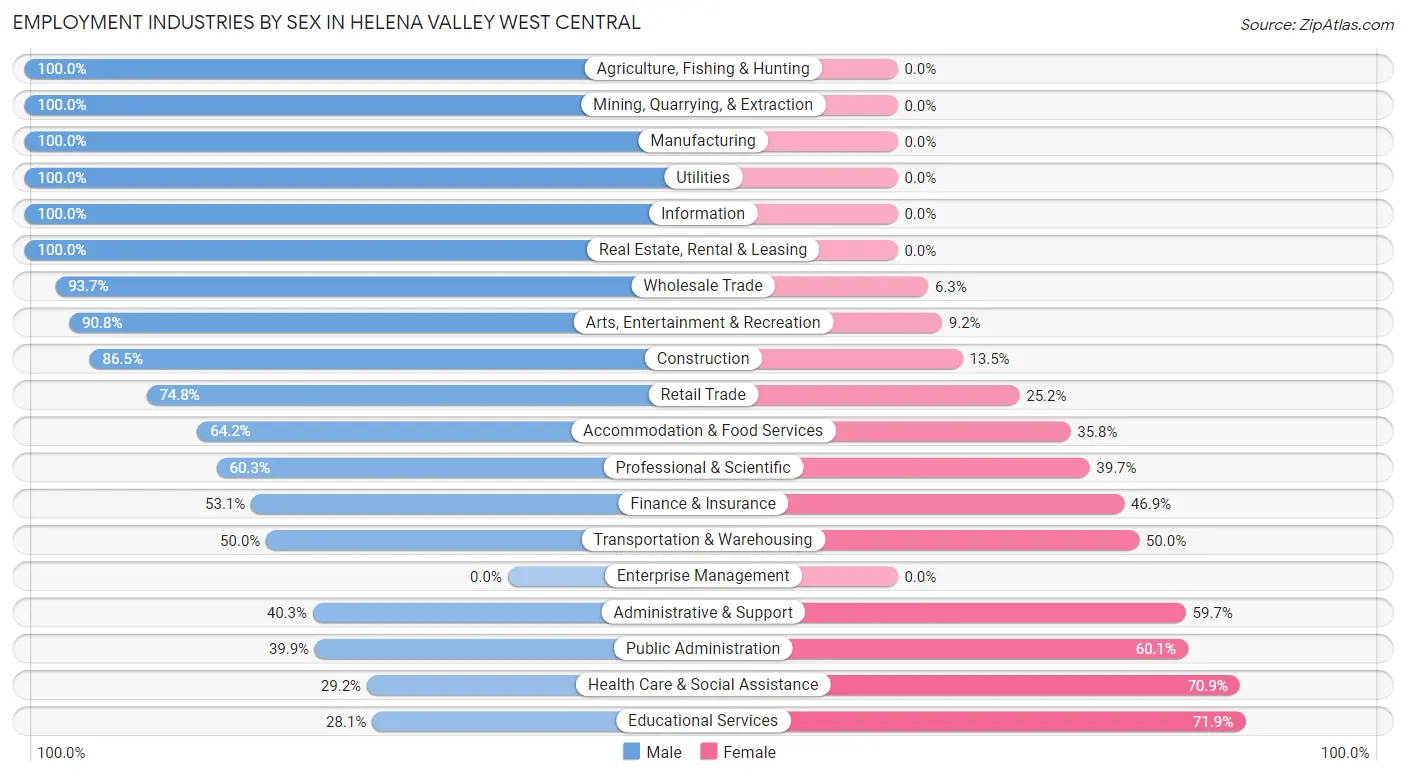
Employment Industries by Sex in Helena Valley West Central
The Helena Valley West Central industries that see more men than women are Agriculture, Fishing & Hunting (100.0%), Mining, Quarrying, & Extraction (100.0%), and Manufacturing (100.0%), whereas the industries that tend to have a higher number of women are Educational Services (71.9%), Health Care & Social Assistance (70.9%), and Public Administration (60.1%).
| Industry | Male | Female |
| Agriculture, Fishing & Hunting | 23 (100.0%) | 0 (0.0%) |
| Mining, Quarrying, & Extraction | 9 (100.0%) | 0 (0.0%) |
| Construction | 315 (86.5%) | 49 (13.5%) |
| Manufacturing | 66 (100.0%) | 0 (0.0%) |
| Wholesale Trade | 133 (93.7%) | 9 (6.3%) |
| Retail Trade | 246 (74.8%) | 83 (25.2%) |
| Transportation & Warehousing | 65 (50.0%) | 65 (50.0%) |
| Utilities | 9 (100.0%) | 0 (0.0%) |
| Information | 105 (100.0%) | 0 (0.0%) |
| Finance & Insurance | 51 (53.1%) | 45 (46.9%) |
| Real Estate, Rental & Leasing | 58 (100.0%) | 0 (0.0%) |
| Professional & Scientific | 132 (60.3%) | 87 (39.7%) |
| Enterprise Management | 0 (0.0%) | 0 (0.0%) |
| Administrative & Support | 48 (40.3%) | 71 (59.7%) |
| Educational Services | 110 (28.1%) | 282 (71.9%) |
| Health Care & Social Assistance | 195 (29.1%) | 474 (70.9%) |
| Arts, Entertainment & Recreation | 79 (90.8%) | 8 (9.2%) |
| Accommodation & Food Services | 140 (64.2%) | 78 (35.8%) |
| Public Administration | 328 (39.9%) | 494 (60.1%) |
| Total | 2,165 (54.0%) | 1,847 (46.0%) |
Education in Helena Valley West Central
School Enrollment in Helena Valley West Central
The most common levels of schooling among the 2,223 students in Helena Valley West Central are middle school (578 | 26.0%), high school (414 | 18.6%), and college / undergraduate (392 | 17.6%).
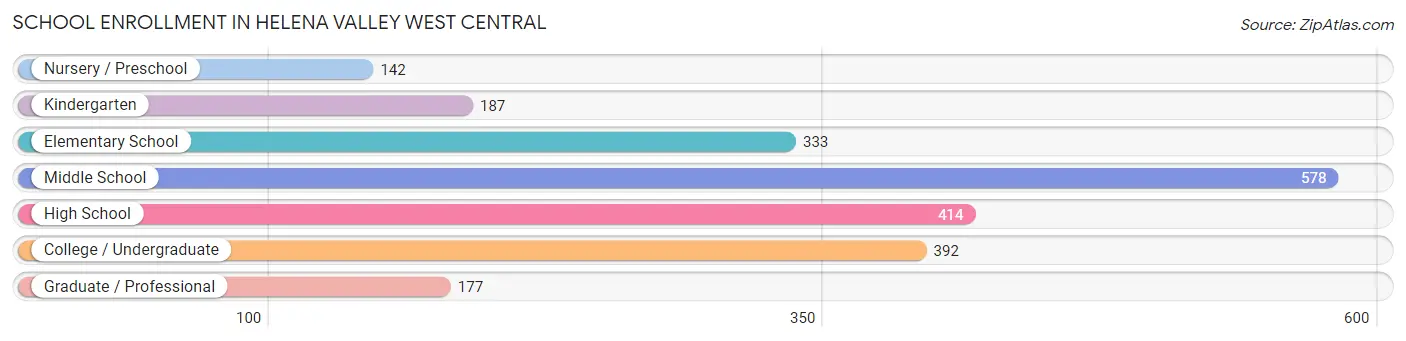
| School Level | # Students | % Students |
| Nursery / Preschool | 142 | 6.4% |
| Kindergarten | 187 | 8.4% |
| Elementary School | 333 | 15.0% |
| Middle School | 578 | 26.0% |
| High School | 414 | 18.6% |
| College / Undergraduate | 392 | 17.6% |
| Graduate / Professional | 177 | 8.0% |
| Total | 2,223 | 100.0% |
School Enrollment by Age by Funding Source in Helena Valley West Central
Out of a total of 2,223 students who are enrolled in schools in Helena Valley West Central, 362 (16.3%) attend a private institution, while the remaining 1,861 (83.7%) are enrolled in public schools. The age group of 3 to 4 year olds has the highest likelihood of being enrolled in private schools, with 61 (46.9% in the age bracket) enrolled. Conversely, the age group of 10 to 14 year olds has the lowest likelihood of being enrolled in a private school, with 611 (91.9% in the age bracket) attending a public institution.
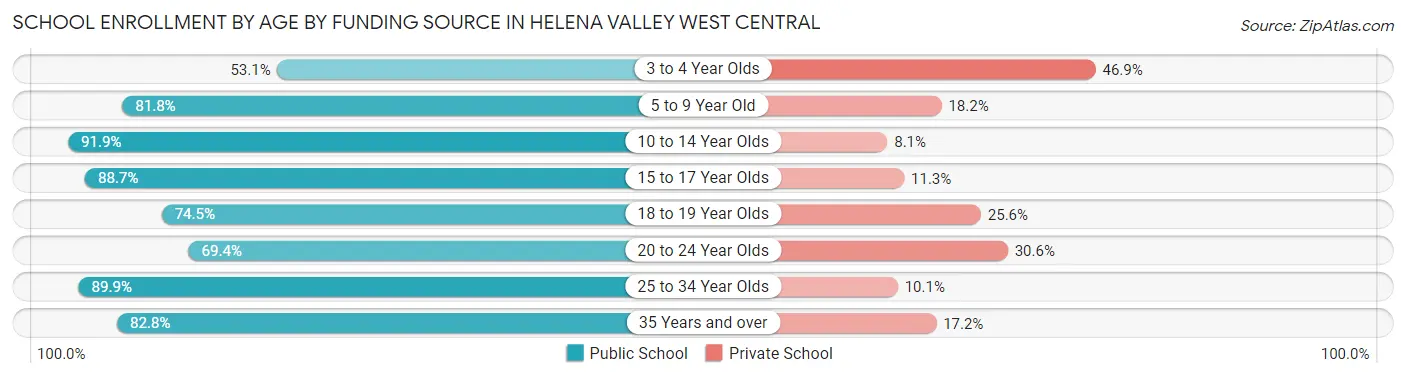
| Age Bracket | Public School | Private School |
| 3 to 4 Year Olds | 69 (53.1%) | 61 (46.9%) |
| 5 to 9 Year Old | 404 (81.8%) | 90 (18.2%) |
| 10 to 14 Year Olds | 611 (91.9%) | 54 (8.1%) |
| 15 to 17 Year Olds | 268 (88.7%) | 34 (11.3%) |
| 18 to 19 Year Olds | 102 (74.5%) | 35 (25.6%) |
| 20 to 24 Year Olds | 75 (69.4%) | 33 (30.6%) |
| 25 to 34 Year Olds | 134 (89.9%) | 15 (10.1%) |
| 35 Years and over | 197 (82.8%) | 41 (17.2%) |
| Total | 1,861 (83.7%) | 362 (16.3%) |
Educational Attainment by Field of Study in Helena Valley West Central
Science & technology (448 | 18.2%), business (349 | 14.2%), education (265 | 10.7%), arts & humanities (245 | 9.9%), and bio, nature & agricultural (235 | 9.5%) are the most common fields of study among 2,464 individuals in Helena Valley West Central who have obtained a bachelor's degree or higher.
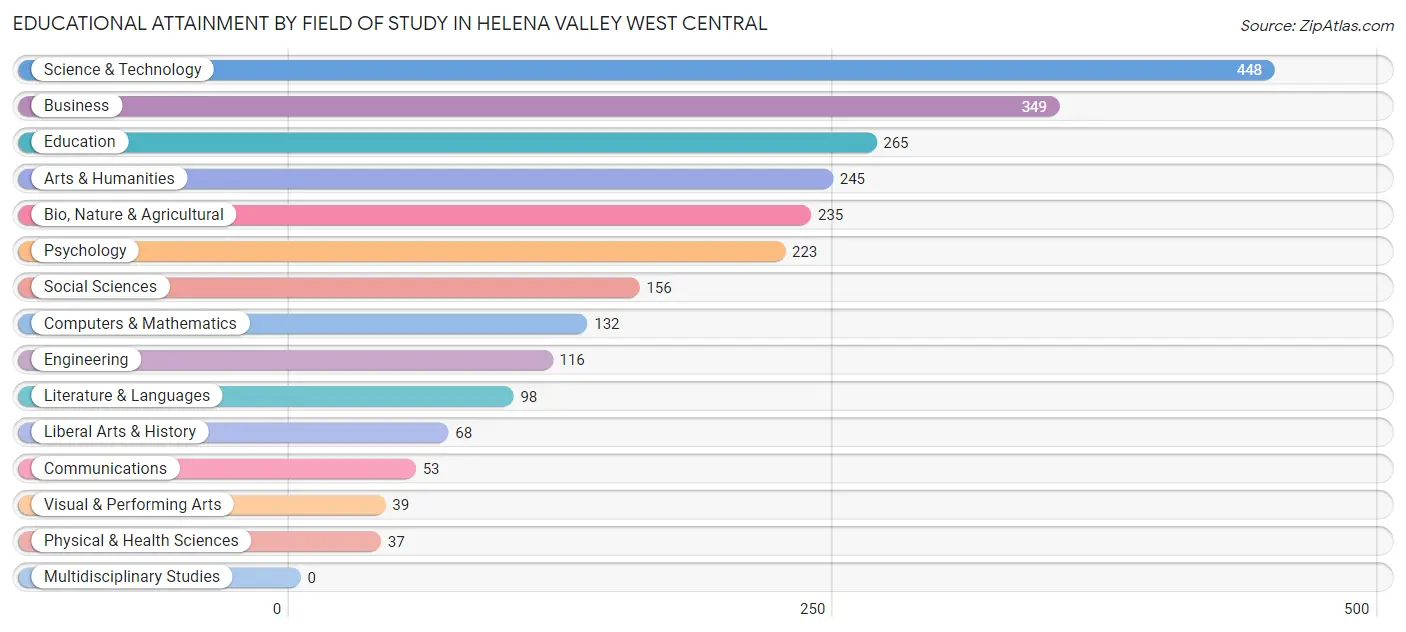
| Field of Study | # Graduates | % Graduates |
| Computers & Mathematics | 132 | 5.4% |
| Bio, Nature & Agricultural | 235 | 9.5% |
| Physical & Health Sciences | 37 | 1.5% |
| Psychology | 223 | 9.0% |
| Social Sciences | 156 | 6.3% |
| Engineering | 116 | 4.7% |
| Multidisciplinary Studies | 0 | 0.0% |
| Science & Technology | 448 | 18.2% |
| Business | 349 | 14.2% |
| Education | 265 | 10.7% |
| Literature & Languages | 98 | 4.0% |
| Liberal Arts & History | 68 | 2.8% |
| Visual & Performing Arts | 39 | 1.6% |
| Communications | 53 | 2.1% |
| Arts & Humanities | 245 | 9.9% |
| Total | 2,464 | 100.0% |
Transportation & Commute in Helena Valley West Central
Vehicle Availability by Sex in Helena Valley West Central
The most prevalent vehicle ownership categories in Helena Valley West Central are males with 2 vehicles (858, accounting for 39.7%) and females with 2 vehicles (803, making up 46.8%).
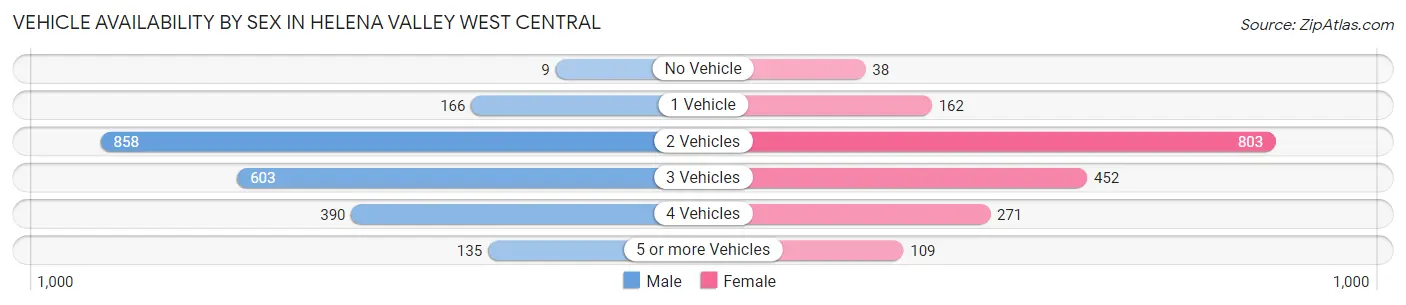
| Vehicles Available | Male | Female |
| No Vehicle | 9 (0.4%) | 38 (2.1%) |
| 1 Vehicle | 166 (7.7%) | 162 (8.8%) |
| 2 Vehicles | 858 (39.7%) | 803 (43.8%) |
| 3 Vehicles | 603 (27.9%) | 452 (24.6%) |
| 4 Vehicles | 390 (18.0%) | 271 (14.8%) |
| 5 or more Vehicles | 135 (6.2%) | 109 (5.9%) |
| Total | 2,161 (100.0%) | 1,835 (100.0%) |
Commute Time in Helena Valley West Central
The most frequently occuring commute durations in Helena Valley West Central are 15 to 19 minutes (1,297 commuters, 35.6%), 10 to 14 minutes (824 commuters, 22.6%), and 20 to 24 minutes (431 commuters, 11.8%).
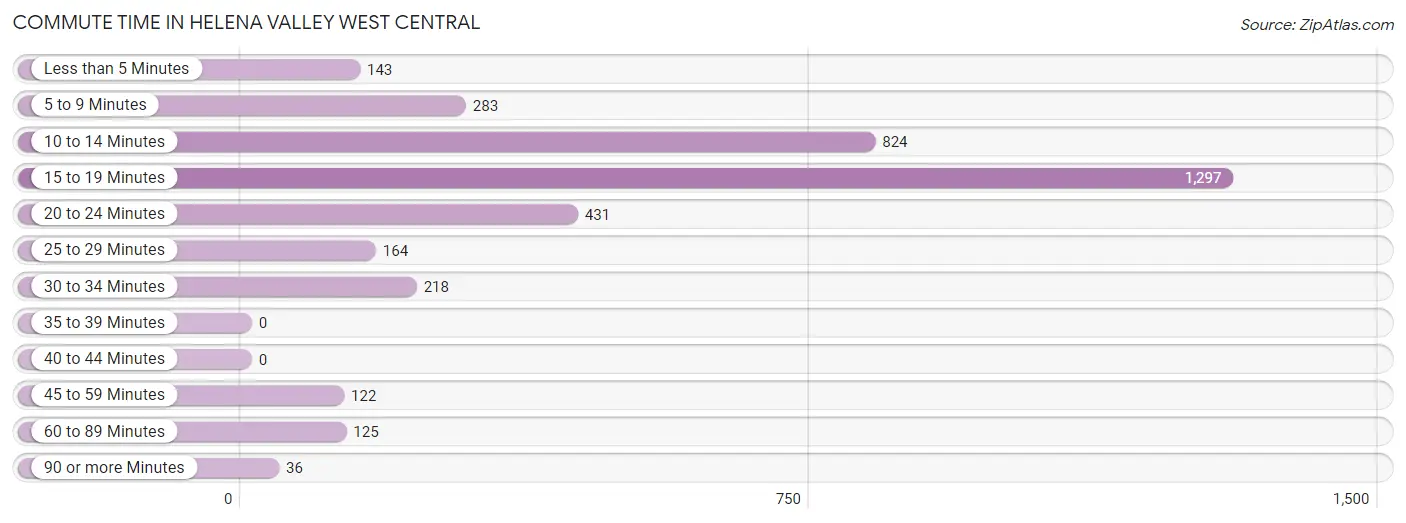
| Commute Time | # Commuters | % Commuters |
| Less than 5 Minutes | 143 | 3.9% |
| 5 to 9 Minutes | 283 | 7.8% |
| 10 to 14 Minutes | 824 | 22.6% |
| 15 to 19 Minutes | 1,297 | 35.6% |
| 20 to 24 Minutes | 431 | 11.8% |
| 25 to 29 Minutes | 164 | 4.5% |
| 30 to 34 Minutes | 218 | 6.0% |
| 35 to 39 Minutes | 0 | 0.0% |
| 40 to 44 Minutes | 0 | 0.0% |
| 45 to 59 Minutes | 122 | 3.4% |
| 60 to 89 Minutes | 125 | 3.4% |
| 90 or more Minutes | 36 | 1.0% |
Commute Time by Sex in Helena Valley West Central
The most common commute times in Helena Valley West Central are 15 to 19 minutes (547 commuters, 27.9%) for males and 15 to 19 minutes (750 commuters, 44.6%) for females.
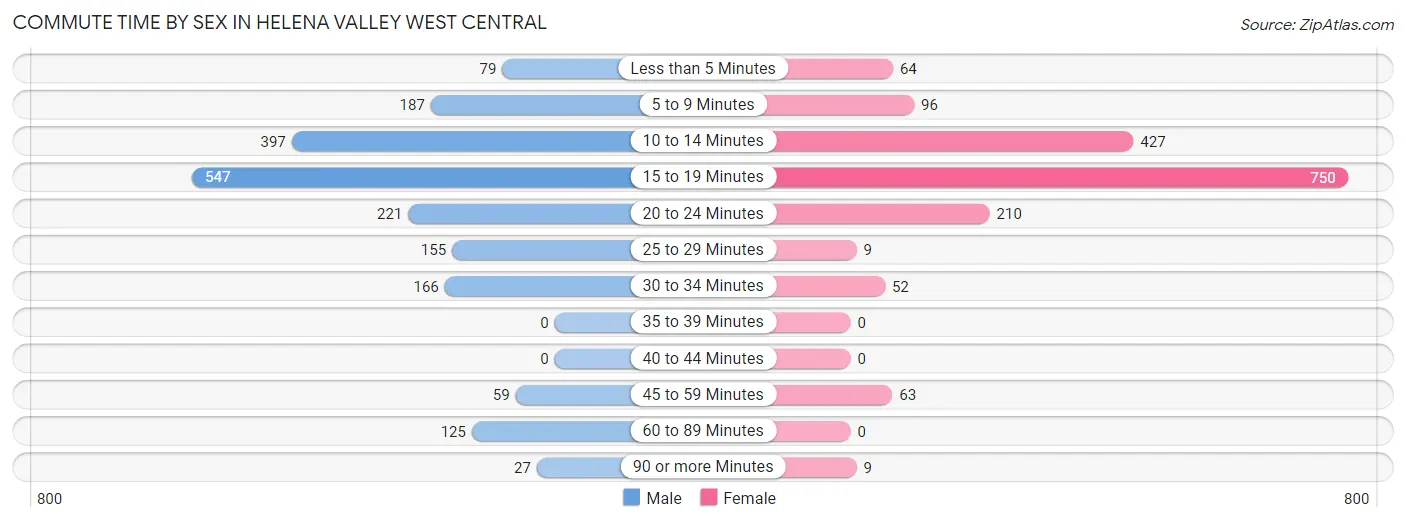
| Commute Time | Male | Female |
| Less than 5 Minutes | 79 (4.0%) | 64 (3.8%) |
| 5 to 9 Minutes | 187 (9.5%) | 96 (5.7%) |
| 10 to 14 Minutes | 397 (20.2%) | 427 (25.4%) |
| 15 to 19 Minutes | 547 (27.9%) | 750 (44.6%) |
| 20 to 24 Minutes | 221 (11.3%) | 210 (12.5%) |
| 25 to 29 Minutes | 155 (7.9%) | 9 (0.5%) |
| 30 to 34 Minutes | 166 (8.5%) | 52 (3.1%) |
| 35 to 39 Minutes | 0 (0.0%) | 0 (0.0%) |
| 40 to 44 Minutes | 0 (0.0%) | 0 (0.0%) |
| 45 to 59 Minutes | 59 (3.0%) | 63 (3.7%) |
| 60 to 89 Minutes | 125 (6.4%) | 0 (0.0%) |
| 90 or more Minutes | 27 (1.4%) | 9 (0.5%) |
Time of Departure to Work by Sex in Helena Valley West Central
The most frequent times of departure to work in Helena Valley West Central are 7:30 AM to 7:59 AM (540, 27.5%) for males and 7:00 AM to 7:29 AM (390, 23.2%) for females.
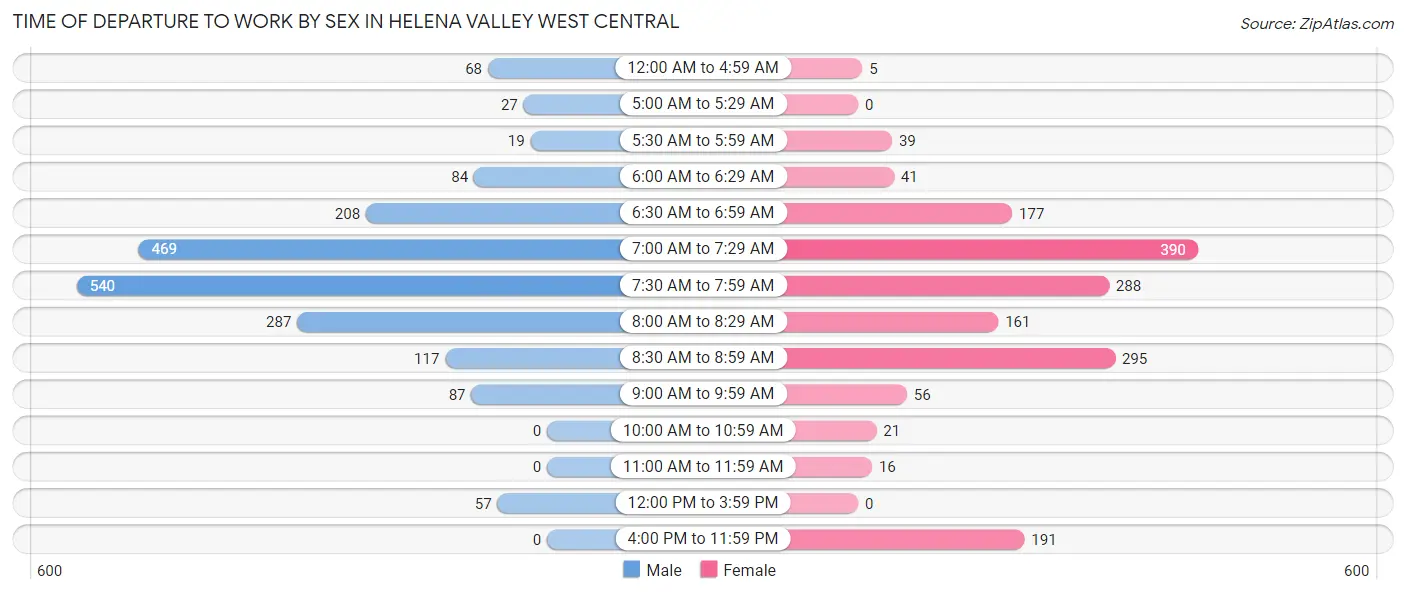
| Time of Departure | Male | Female |
| 12:00 AM to 4:59 AM | 68 (3.5%) | 5 (0.3%) |
| 5:00 AM to 5:29 AM | 27 (1.4%) | 0 (0.0%) |
| 5:30 AM to 5:59 AM | 19 (1.0%) | 39 (2.3%) |
| 6:00 AM to 6:29 AM | 84 (4.3%) | 41 (2.4%) |
| 6:30 AM to 6:59 AM | 208 (10.6%) | 177 (10.5%) |
| 7:00 AM to 7:29 AM | 469 (23.9%) | 390 (23.2%) |
| 7:30 AM to 7:59 AM | 540 (27.5%) | 288 (17.1%) |
| 8:00 AM to 8:29 AM | 287 (14.6%) | 161 (9.6%) |
| 8:30 AM to 8:59 AM | 117 (6.0%) | 295 (17.6%) |
| 9:00 AM to 9:59 AM | 87 (4.4%) | 56 (3.3%) |
| 10:00 AM to 10:59 AM | 0 (0.0%) | 21 (1.3%) |
| 11:00 AM to 11:59 AM | 0 (0.0%) | 16 (0.9%) |
| 12:00 PM to 3:59 PM | 57 (2.9%) | 0 (0.0%) |
| 4:00 PM to 11:59 PM | 0 (0.0%) | 191 (11.4%) |
| Total | 1,963 (100.0%) | 1,680 (100.0%) |
Housing Occupancy in Helena Valley West Central
Occupancy by Ownership in Helena Valley West Central
Of the total 3,013 dwellings in Helena Valley West Central, owner-occupied units account for 2,448 (81.2%), while renter-occupied units make up 565 (18.8%).
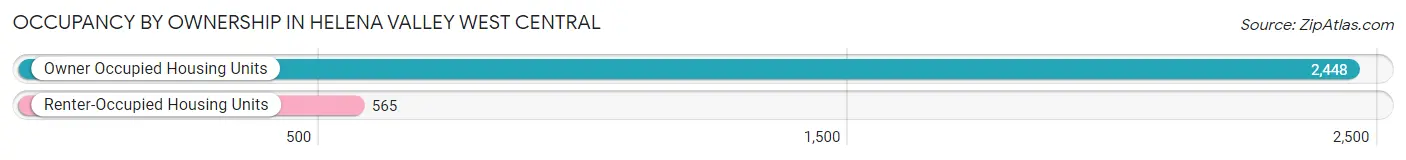
| Occupancy | # Housing Units | % Housing Units |
| Owner Occupied Housing Units | 2,448 | 81.2% |
| Renter-Occupied Housing Units | 565 | 18.8% |
| Total Occupied Housing Units | 3,013 | 100.0% |
Occupancy by Household Size in Helena Valley West Central
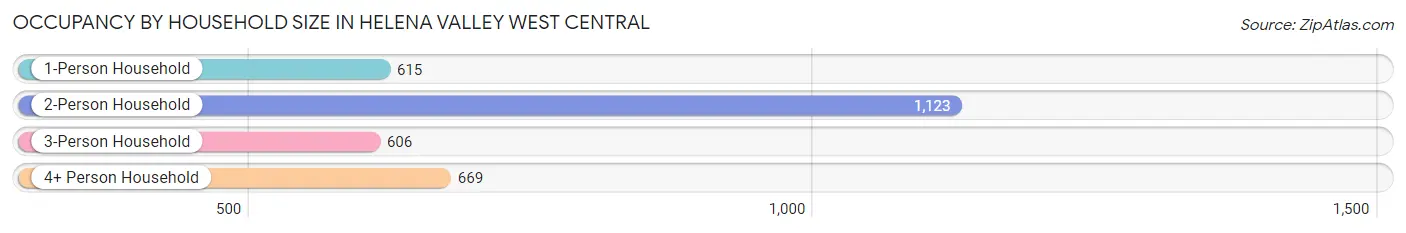
| Household Size | # Housing Units | % Housing Units |
| 1-Person Household | 615 | 20.4% |
| 2-Person Household | 1,123 | 37.3% |
| 3-Person Household | 606 | 20.1% |
| 4+ Person Household | 669 | 22.2% |
| Total Housing Units | 3,013 | 100.0% |
Occupancy by Ownership by Household Size in Helena Valley West Central
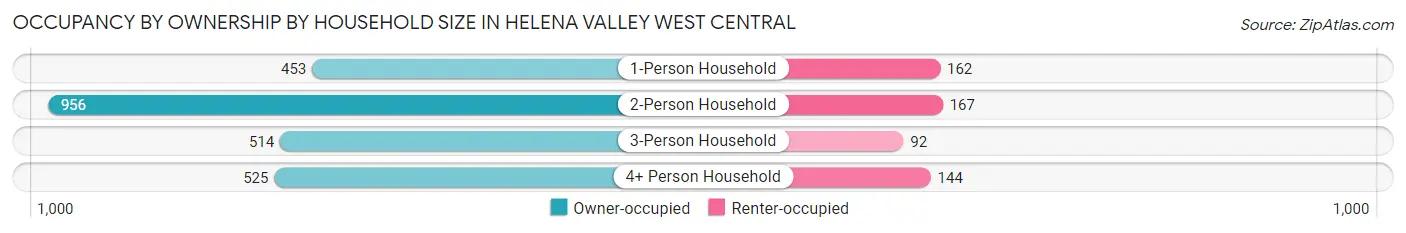
| Household Size | Owner-occupied | Renter-occupied |
| 1-Person Household | 453 (73.7%) | 162 (26.3%) |
| 2-Person Household | 956 (85.1%) | 167 (14.9%) |
| 3-Person Household | 514 (84.8%) | 92 (15.2%) |
| 4+ Person Household | 525 (78.5%) | 144 (21.5%) |
| Total Housing Units | 2,448 (81.2%) | 565 (18.8%) |
Occupancy by Educational Attainment in Helena Valley West Central
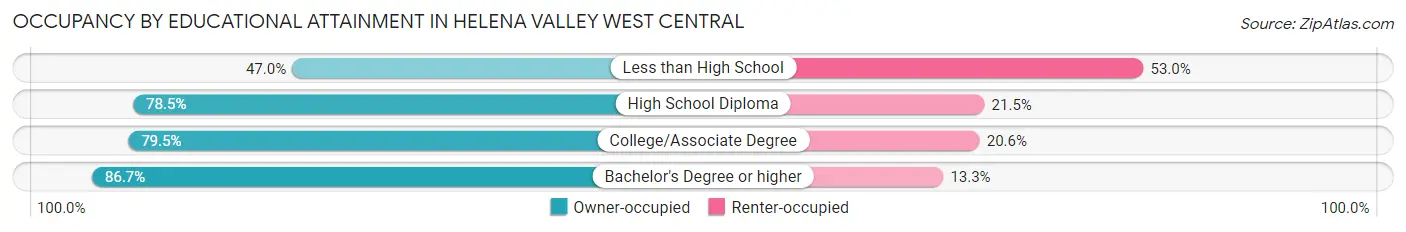
| Household Size | Owner-occupied | Renter-occupied |
| Less than High School | 39 (47.0%) | 44 (53.0%) |
| High School Diploma | 489 (78.5%) | 134 (21.5%) |
| College/Associate Degree | 874 (79.4%) | 226 (20.5%) |
| Bachelor's Degree or higher | 1,046 (86.7%) | 161 (13.3%) |
Occupancy by Age of Householder in Helena Valley West Central
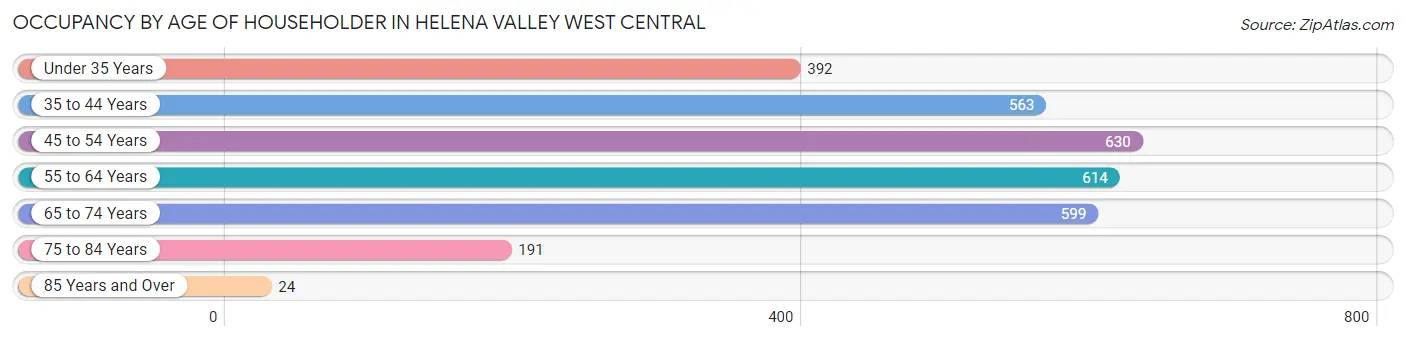
| Age Bracket | # Households | % Households |
| Under 35 Years | 392 | 13.0% |
| 35 to 44 Years | 563 | 18.7% |
| 45 to 54 Years | 630 | 20.9% |
| 55 to 64 Years | 614 | 20.4% |
| 65 to 74 Years | 599 | 19.9% |
| 75 to 84 Years | 191 | 6.3% |
| 85 Years and Over | 24 | 0.8% |
| Total | 3,013 | 100.0% |
Housing Finances in Helena Valley West Central
Median Income by Occupancy in Helena Valley West Central
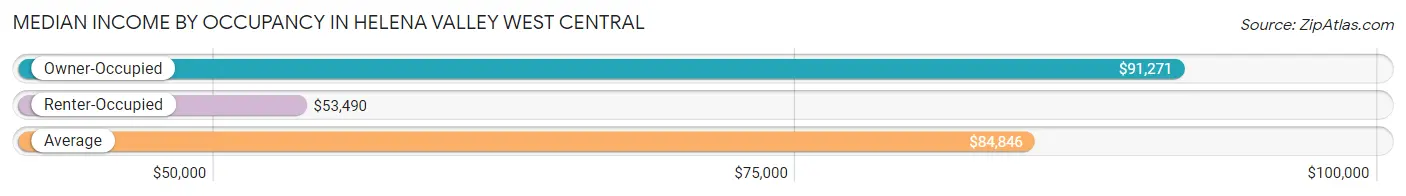
| Occupancy Type | # Households | Median Income |
| Owner-Occupied | 2,448 (81.2%) | $91,271 |
| Renter-Occupied | 565 (18.8%) | $53,490 |
| Average | 3,013 (100.0%) | $84,846 |
Occupancy by Householder Income Bracket in Helena Valley West Central
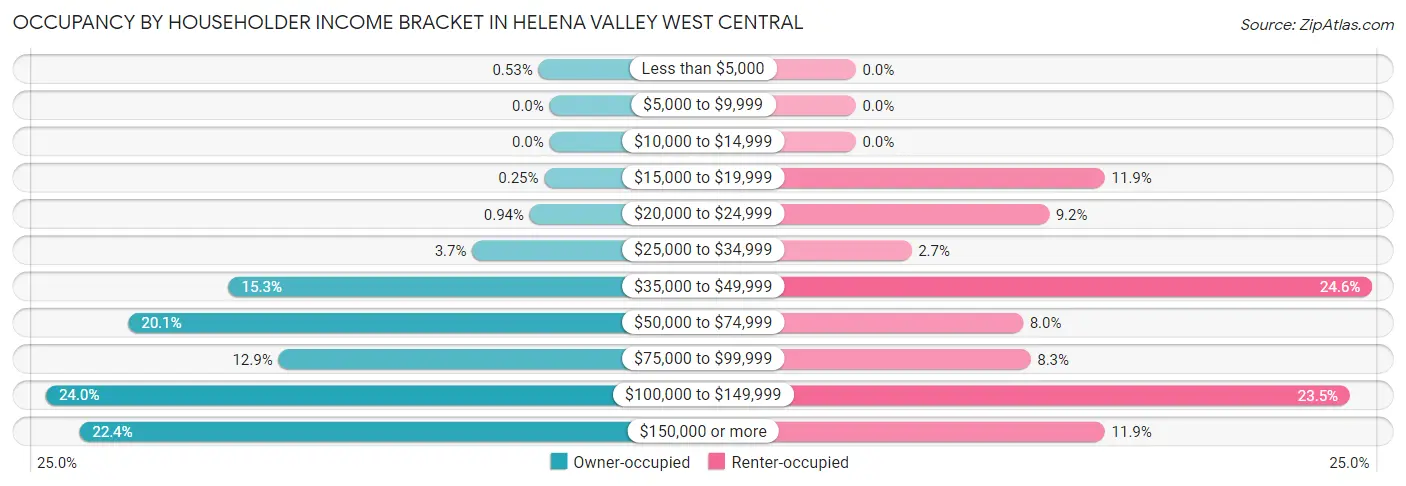
| Income Bracket | Owner-occupied | Renter-occupied |
| Less than $5,000 | 13 (0.5%) | 0 (0.0%) |
| $5,000 to $9,999 | 0 (0.0%) | 0 (0.0%) |
| $10,000 to $14,999 | 0 (0.0%) | 0 (0.0%) |
| $15,000 to $19,999 | 6 (0.3%) | 67 (11.9%) |
| $20,000 to $24,999 | 23 (0.9%) | 52 (9.2%) |
| $25,000 to $34,999 | 90 (3.7%) | 15 (2.6%) |
| $35,000 to $49,999 | 374 (15.3%) | 139 (24.6%) |
| $50,000 to $74,999 | 491 (20.1%) | 45 (8.0%) |
| $75,000 to $99,999 | 316 (12.9%) | 47 (8.3%) |
| $100,000 to $149,999 | 587 (24.0%) | 133 (23.5%) |
| $150,000 or more | 548 (22.4%) | 67 (11.9%) |
| Total | 2,448 (100.0%) | 565 (100.0%) |
Monthly Housing Cost Tiers in Helena Valley West Central
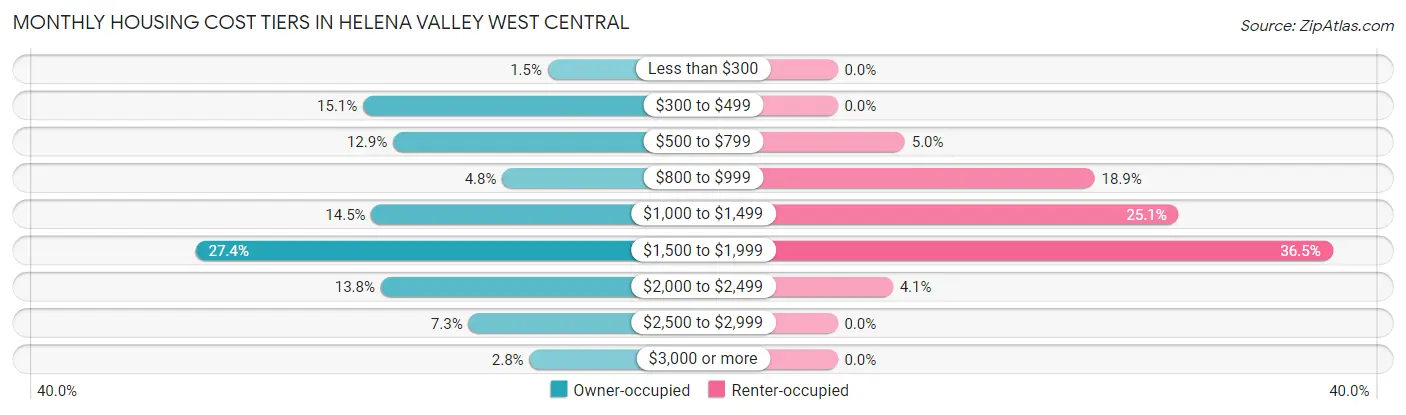
| Monthly Cost | Owner-occupied | Renter-occupied |
| Less than $300 | 36 (1.5%) | 0 (0.0%) |
| $300 to $499 | 369 (15.1%) | 0 (0.0%) |
| $500 to $799 | 315 (12.9%) | 28 (5.0%) |
| $800 to $999 | 118 (4.8%) | 107 (18.9%) |
| $1,000 to $1,499 | 354 (14.5%) | 142 (25.1%) |
| $1,500 to $1,999 | 671 (27.4%) | 206 (36.5%) |
| $2,000 to $2,499 | 337 (13.8%) | 23 (4.1%) |
| $2,500 to $2,999 | 179 (7.3%) | 0 (0.0%) |
| $3,000 or more | 69 (2.8%) | 0 (0.0%) |
| Total | 2,448 (100.0%) | 565 (100.0%) |
Physical Housing Characteristics in Helena Valley West Central
Housing Structures in Helena Valley West Central
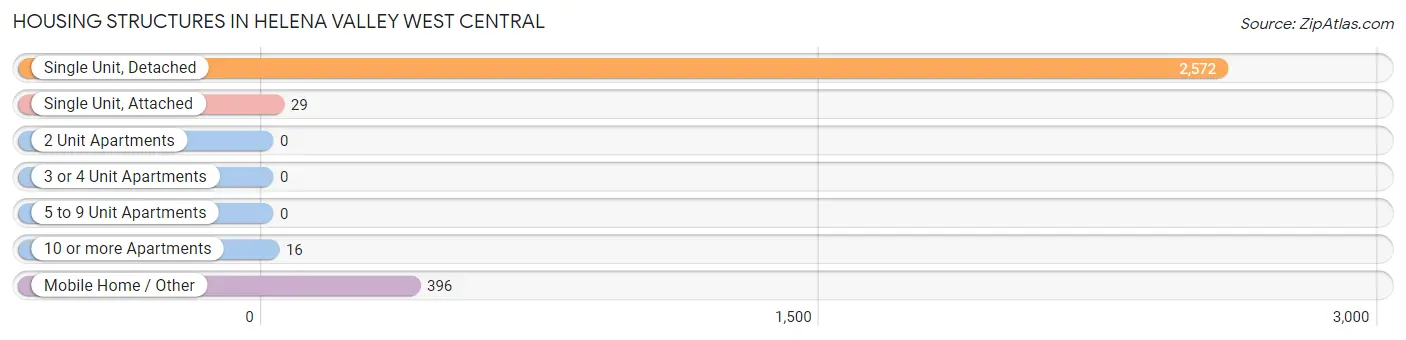
| Structure Type | # Housing Units | % Housing Units |
| Single Unit, Detached | 2,572 | 85.4% |
| Single Unit, Attached | 29 | 1.0% |
| 2 Unit Apartments | 0 | 0.0% |
| 3 or 4 Unit Apartments | 0 | 0.0% |
| 5 to 9 Unit Apartments | 0 | 0.0% |
| 10 or more Apartments | 16 | 0.5% |
| Mobile Home / Other | 396 | 13.1% |
| Total | 3,013 | 100.0% |
Housing Structures by Occupancy in Helena Valley West Central
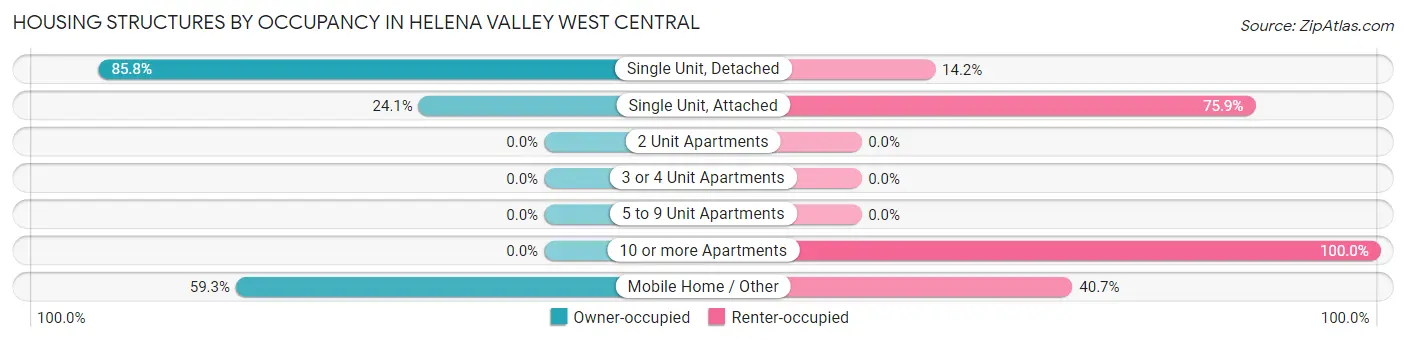
| Structure Type | Owner-occupied | Renter-occupied |
| Single Unit, Detached | 2,206 (85.8%) | 366 (14.2%) |
| Single Unit, Attached | 7 (24.1%) | 22 (75.9%) |
| 2 Unit Apartments | 0 (0.0%) | 0 (0.0%) |
| 3 or 4 Unit Apartments | 0 (0.0%) | 0 (0.0%) |
| 5 to 9 Unit Apartments | 0 (0.0%) | 0 (0.0%) |
| 10 or more Apartments | 0 (0.0%) | 16 (100.0%) |
| Mobile Home / Other | 235 (59.3%) | 161 (40.7%) |
| Total | 2,448 (81.2%) | 565 (18.8%) |
Housing Structures by Number of Rooms in Helena Valley West Central
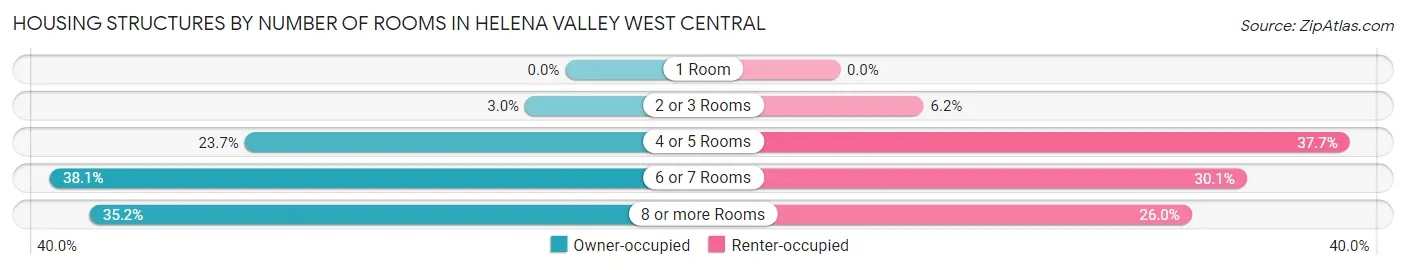
| Number of Rooms | Owner-occupied | Renter-occupied |
| 1 Room | 0 (0.0%) | 0 (0.0%) |
| 2 or 3 Rooms | 73 (3.0%) | 35 (6.2%) |
| 4 or 5 Rooms | 581 (23.7%) | 213 (37.7%) |
| 6 or 7 Rooms | 933 (38.1%) | 170 (30.1%) |
| 8 or more Rooms | 861 (35.2%) | 147 (26.0%) |
| Total | 2,448 (100.0%) | 565 (100.0%) |
Housing Structure by Heating Type in Helena Valley West Central
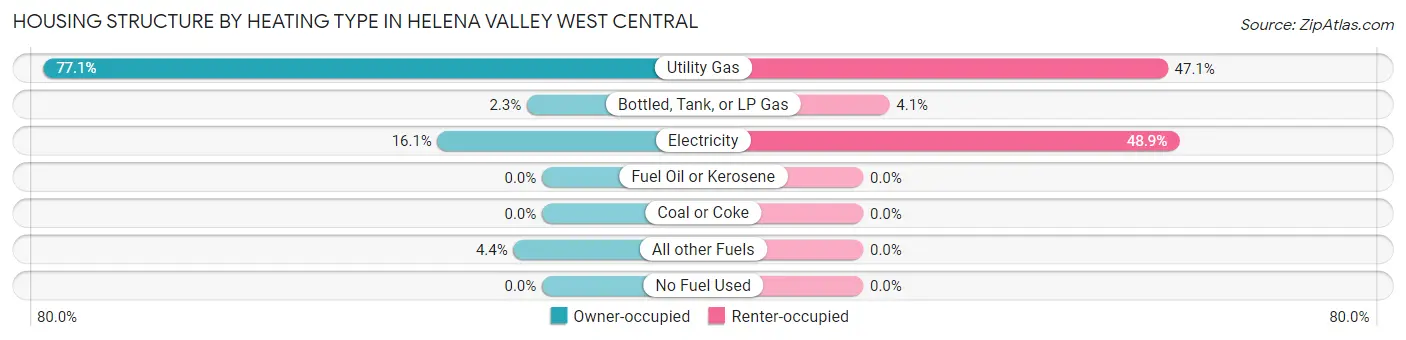
| Heating Type | Owner-occupied | Renter-occupied |
| Utility Gas | 1,888 (77.1%) | 266 (47.1%) |
| Bottled, Tank, or LP Gas | 57 (2.3%) | 23 (4.1%) |
| Electricity | 395 (16.1%) | 276 (48.8%) |
| Fuel Oil or Kerosene | 0 (0.0%) | 0 (0.0%) |
| Coal or Coke | 0 (0.0%) | 0 (0.0%) |
| All other Fuels | 108 (4.4%) | 0 (0.0%) |
| No Fuel Used | 0 (0.0%) | 0 (0.0%) |
| Total | 2,448 (100.0%) | 565 (100.0%) |
Household Vehicle Usage in Helena Valley West Central
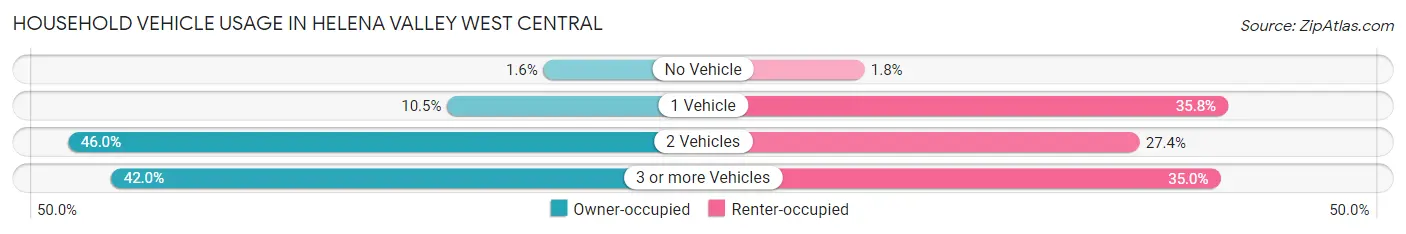
| Vehicles per Household | Owner-occupied | Renter-occupied |
| No Vehicle | 38 (1.5%) | 10 (1.8%) |
| 1 Vehicle | 258 (10.5%) | 202 (35.7%) |
| 2 Vehicles | 1,125 (46.0%) | 155 (27.4%) |
| 3 or more Vehicles | 1,027 (41.9%) | 198 (35.0%) |
| Total | 2,448 (100.0%) | 565 (100.0%) |
Real Estate & Mortgages in Helena Valley West Central
Real Estate and Mortgage Overview in Helena Valley West Central
| Characteristic | Without Mortgage | With Mortgage |
| Housing Units | 808 | 1,640 |
| Median Property Value | $280,100 | $353,600 |
| Median Household Income | $62,344 | $487 |
| Monthly Housing Costs | $500 | $69 |
| Real Estate Taxes | $2,484 | $10 |
Property Value by Mortgage Status in Helena Valley West Central
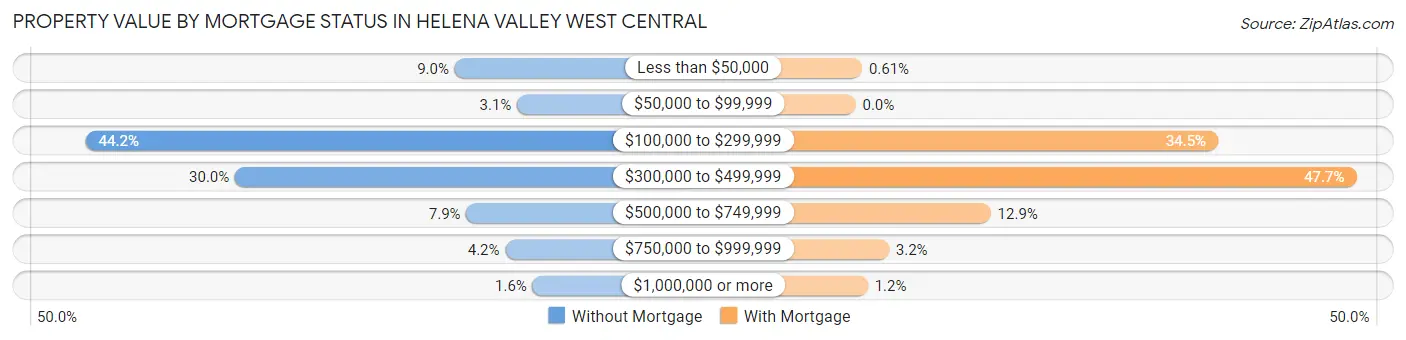
| Property Value | Without Mortgage | With Mortgage |
| Less than $50,000 | 73 (9.0%) | 10 (0.6%) |
| $50,000 to $99,999 | 25 (3.1%) | 0 (0.0%) |
| $100,000 to $299,999 | 357 (44.2%) | 566 (34.5%) |
| $300,000 to $499,999 | 242 (29.9%) | 782 (47.7%) |
| $500,000 to $749,999 | 64 (7.9%) | 211 (12.9%) |
| $750,000 to $999,999 | 34 (4.2%) | 52 (3.2%) |
| $1,000,000 or more | 13 (1.6%) | 19 (1.2%) |
| Total | 808 (100.0%) | 1,640 (100.0%) |
Household Income by Mortgage Status in Helena Valley West Central
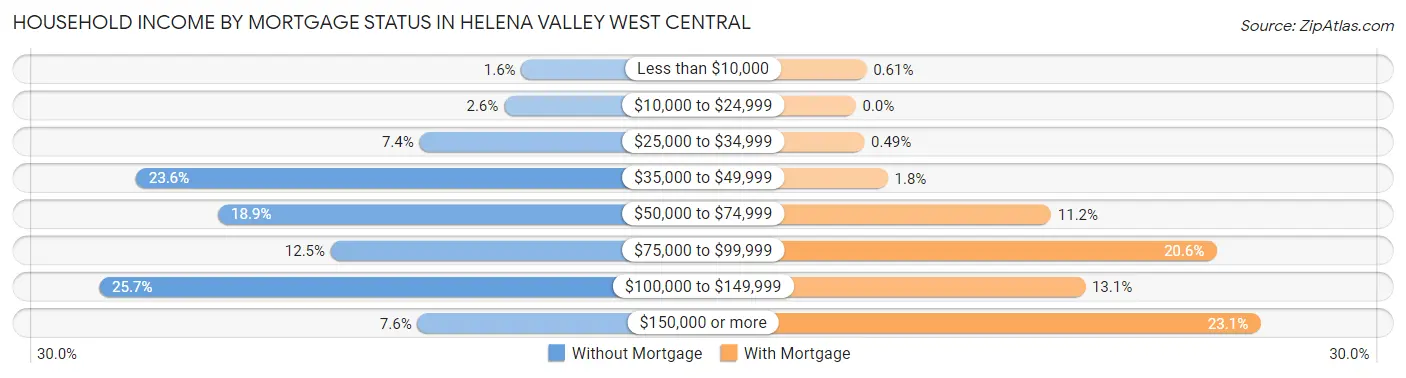
| Household Income | Without Mortgage | With Mortgage |
| Less than $10,000 | 13 (1.6%) | 10 (0.6%) |
| $10,000 to $24,999 | 21 (2.6%) | 0 (0.0%) |
| $25,000 to $34,999 | 60 (7.4%) | 8 (0.5%) |
| $35,000 to $49,999 | 191 (23.6%) | 30 (1.8%) |
| $50,000 to $74,999 | 153 (18.9%) | 183 (11.2%) |
| $75,000 to $99,999 | 101 (12.5%) | 338 (20.6%) |
| $100,000 to $149,999 | 208 (25.7%) | 215 (13.1%) |
| $150,000 or more | 61 (7.5%) | 379 (23.1%) |
| Total | 808 (100.0%) | 1,640 (100.0%) |
Property Value to Household Income Ratio in Helena Valley West Central
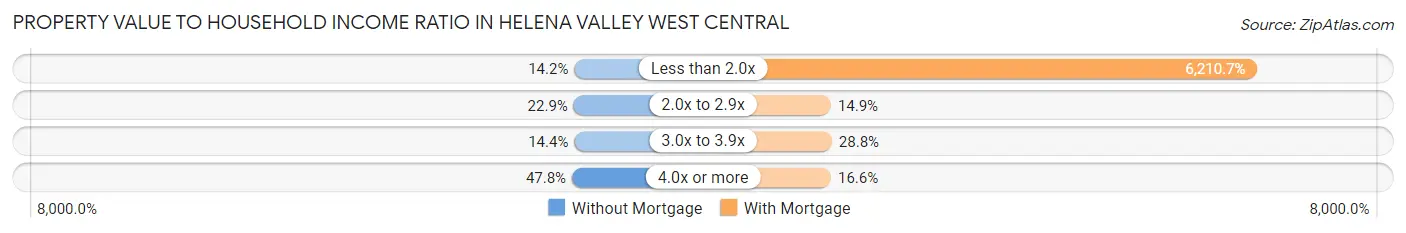
| Value-to-Income Ratio | Without Mortgage | With Mortgage |
| Less than 2.0x | 115 (14.2%) | 101,855 (6,210.7%) |
| 2.0x to 2.9x | 185 (22.9%) | 244 (14.9%) |
| 3.0x to 3.9x | 116 (14.4%) | 473 (28.8%) |
| 4.0x or more | 386 (47.8%) | 272 (16.6%) |
| Total | 808 (100.0%) | 1,640 (100.0%) |
Real Estate Taxes by Mortgage Status in Helena Valley West Central
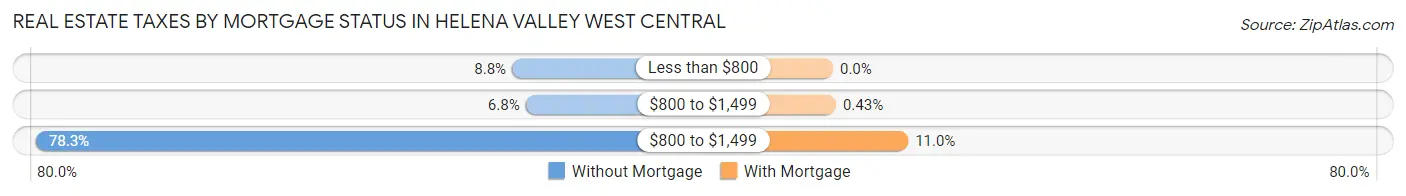
| Property Taxes | Without Mortgage | With Mortgage |
| Less than $800 | 71 (8.8%) | 0 (0.0%) |
| $800 to $1,499 | 55 (6.8%) | 7 (0.4%) |
| $800 to $1,499 | 633 (78.3%) | 180 (11.0%) |
| Total | 808 (100.0%) | 1,640 (100.0%) |
Health & Disability in Helena Valley West Central
Health Insurance Coverage by Age in Helena Valley West Central
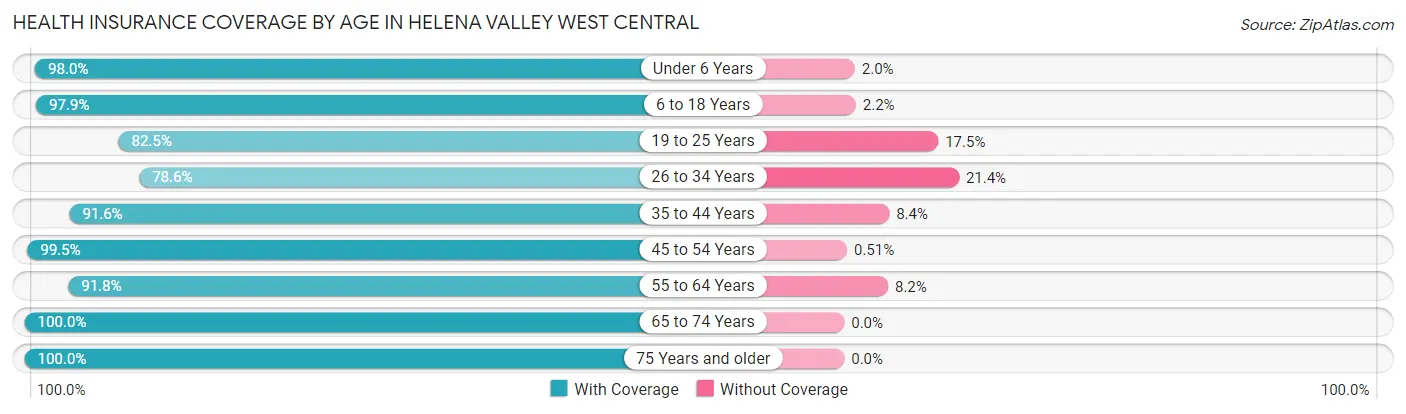
| Age Bracket | With Coverage | Without Coverage |
| Under 6 Years | 597 (98.0%) | 12 (2.0%) |
| 6 to 18 Years | 1,590 (97.9%) | 35 (2.1%) |
| 19 to 25 Years | 339 (82.5%) | 72 (17.5%) |
| 26 to 34 Years | 548 (78.6%) | 149 (21.4%) |
| 35 to 44 Years | 1,095 (91.6%) | 100 (8.4%) |
| 45 to 54 Years | 971 (99.5%) | 5 (0.5%) |
| 55 to 64 Years | 1,024 (91.8%) | 91 (8.2%) |
| 65 to 74 Years | 1,057 (100.0%) | 0 (0.0%) |
| 75 Years and older | 517 (100.0%) | 0 (0.0%) |
| Total | 7,738 (94.3%) | 464 (5.7%) |
Health Insurance Coverage by Citizenship Status in Helena Valley West Central
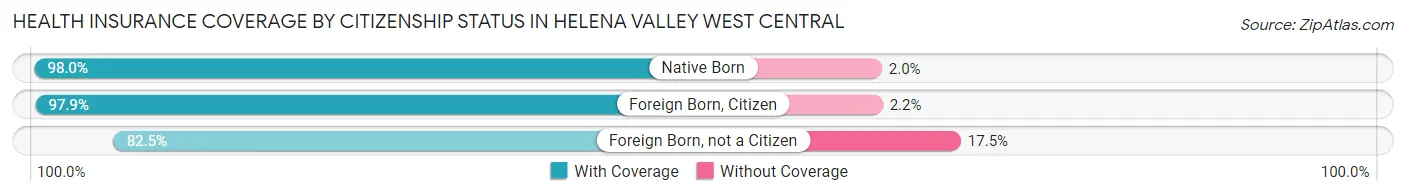
| Citizenship Status | With Coverage | Without Coverage |
| Native Born | 597 (98.0%) | 12 (2.0%) |
| Foreign Born, Citizen | 1,590 (97.9%) | 35 (2.1%) |
| Foreign Born, not a Citizen | 339 (82.5%) | 72 (17.5%) |
Health Insurance Coverage by Household Income in Helena Valley West Central
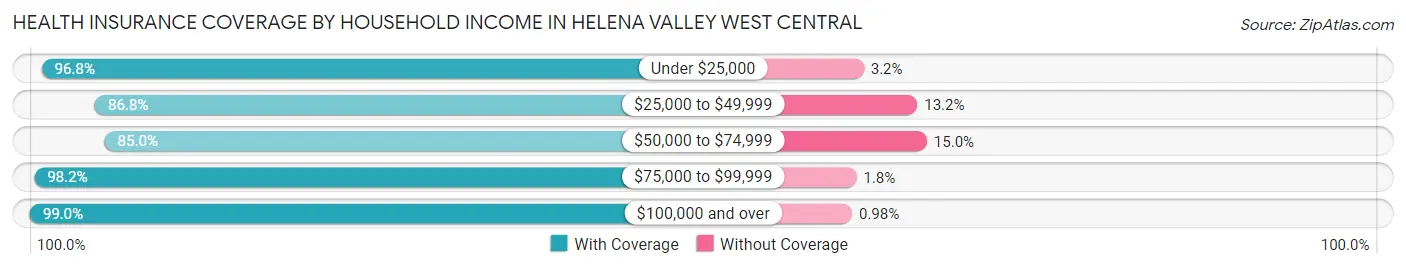
| Household Income | With Coverage | Without Coverage |
| Under $25,000 | 274 (96.8%) | 9 (3.2%) |
| $25,000 to $49,999 | 966 (86.8%) | 147 (13.2%) |
| $50,000 to $74,999 | 1,410 (85.0%) | 249 (15.0%) |
| $75,000 to $99,999 | 1,029 (98.2%) | 19 (1.8%) |
| $100,000 and over | 4,049 (99.0%) | 40 (1.0%) |
Public vs Private Health Insurance Coverage by Age in Helena Valley West Central
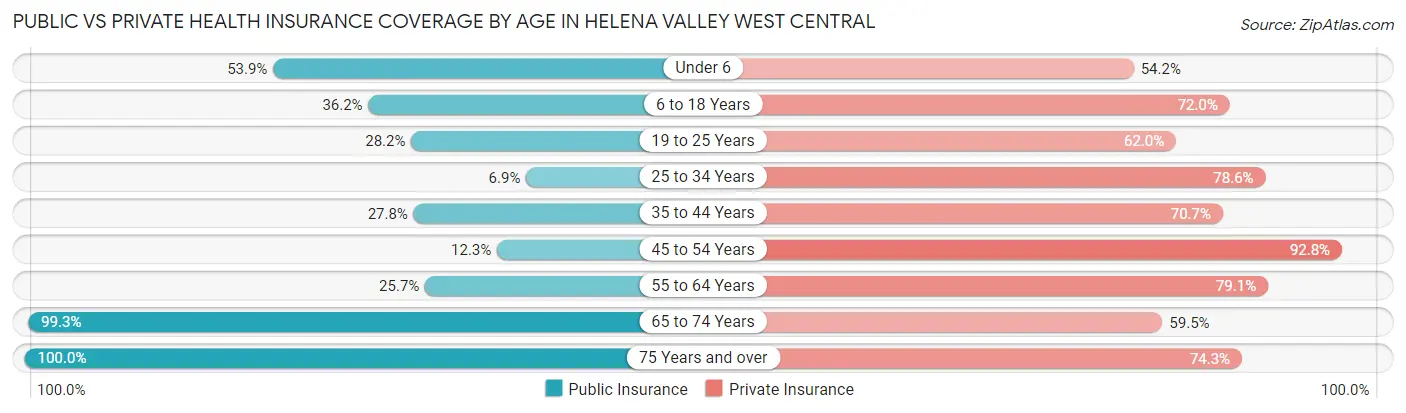
| Age Bracket | Public Insurance | Private Insurance |
| Under 6 | 328 (53.9%) | 330 (54.2%) |
| 6 to 18 Years | 588 (36.2%) | 1,170 (72.0%) |
| 19 to 25 Years | 116 (28.2%) | 255 (62.0%) |
| 25 to 34 Years | 48 (6.9%) | 548 (78.6%) |
| 35 to 44 Years | 332 (27.8%) | 845 (70.7%) |
| 45 to 54 Years | 120 (12.3%) | 906 (92.8%) |
| 55 to 64 Years | 286 (25.7%) | 882 (79.1%) |
| 65 to 74 Years | 1,050 (99.3%) | 629 (59.5%) |
| 75 Years and over | 517 (100.0%) | 384 (74.3%) |
| Total | 3,385 (41.3%) | 5,949 (72.5%) |
Disability Status by Sex by Age in Helena Valley West Central
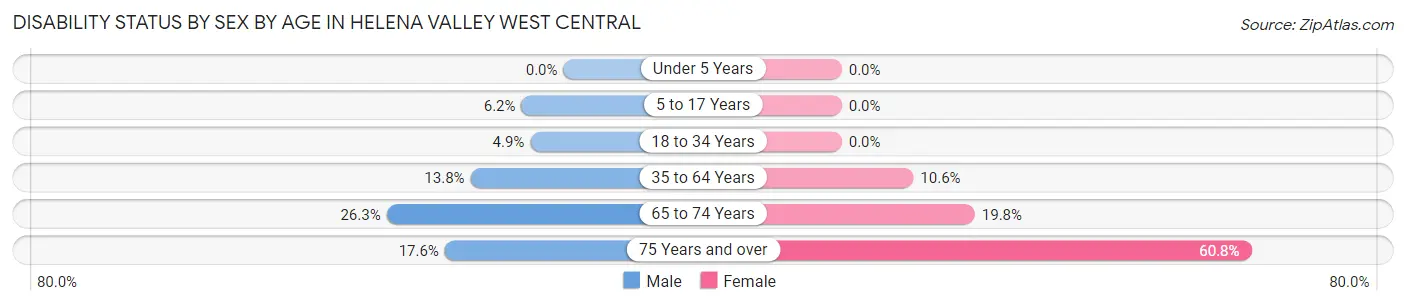
| Age Bracket | Male | Female |
| Under 5 Years | 0 (0.0%) | 0 (0.0%) |
| 5 to 17 Years | 51 (6.2%) | 0 (0.0%) |
| 18 to 34 Years | 36 (4.9%) | 0 (0.0%) |
| 35 to 64 Years | 221 (13.8%) | 179 (10.6%) |
| 65 to 74 Years | 146 (26.3%) | 99 (19.8%) |
| 75 Years and over | 65 (17.6%) | 90 (60.8%) |
Disability Class by Sex by Age in Helena Valley West Central
Disability Class: Hearing Difficulty
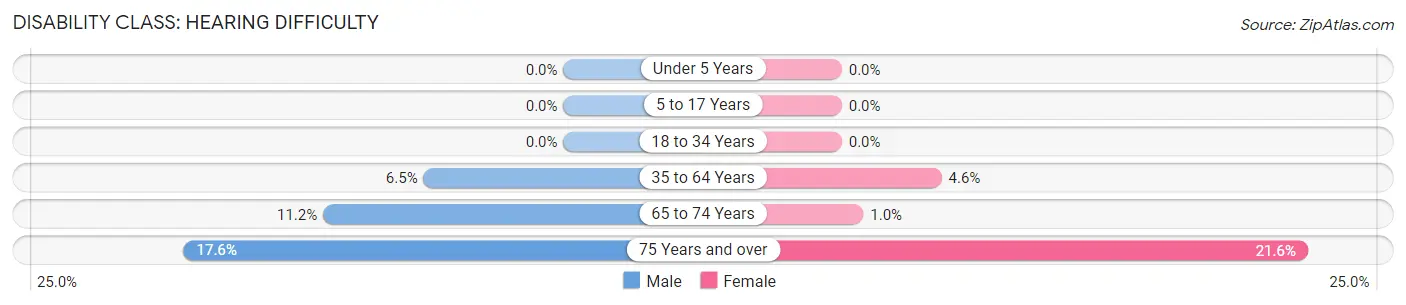
| Age Bracket | Male | Female |
| Under 5 Years | 0 (0.0%) | 0 (0.0%) |
| 5 to 17 Years | 0 (0.0%) | 0 (0.0%) |
| 18 to 34 Years | 0 (0.0%) | 0 (0.0%) |
| 35 to 64 Years | 104 (6.5%) | 78 (4.6%) |
| 65 to 74 Years | 62 (11.2%) | 5 (1.0%) |
| 75 Years and over | 65 (17.6%) | 32 (21.6%) |
Disability Class: Vision Difficulty
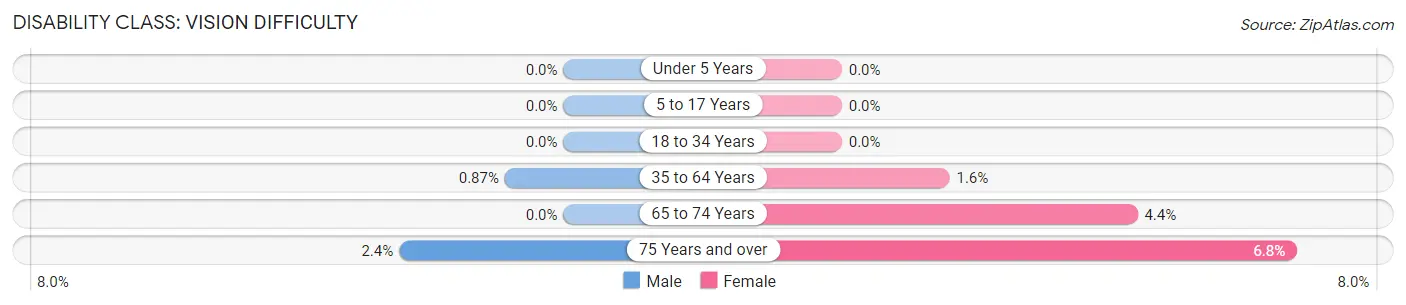
| Age Bracket | Male | Female |
| Under 5 Years | 0 (0.0%) | 0 (0.0%) |
| 5 to 17 Years | 0 (0.0%) | 0 (0.0%) |
| 18 to 34 Years | 0 (0.0%) | 0 (0.0%) |
| 35 to 64 Years | 14 (0.9%) | 27 (1.6%) |
| 65 to 74 Years | 0 (0.0%) | 22 (4.4%) |
| 75 Years and over | 9 (2.4%) | 10 (6.8%) |
Disability Class: Cognitive Difficulty
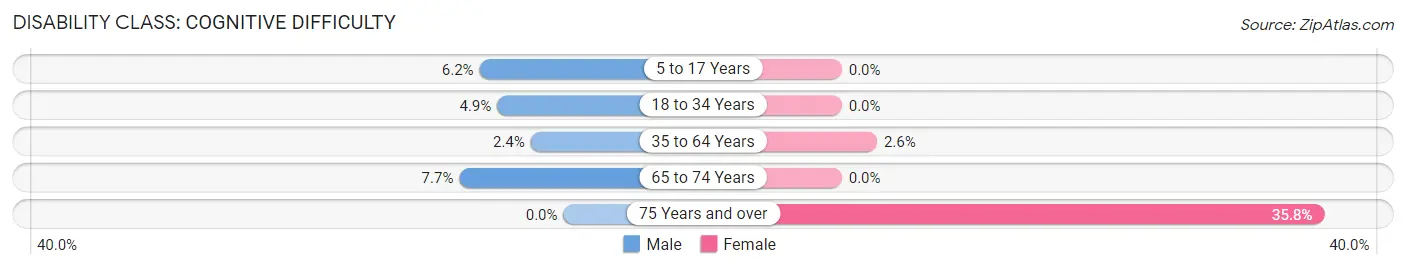
| Age Bracket | Male | Female |
| 5 to 17 Years | 51 (6.2%) | 0 (0.0%) |
| 18 to 34 Years | 36 (4.9%) | 0 (0.0%) |
| 35 to 64 Years | 39 (2.4%) | 44 (2.6%) |
| 65 to 74 Years | 43 (7.7%) | 0 (0.0%) |
| 75 Years and over | 0 (0.0%) | 53 (35.8%) |
Disability Class: Ambulatory Difficulty
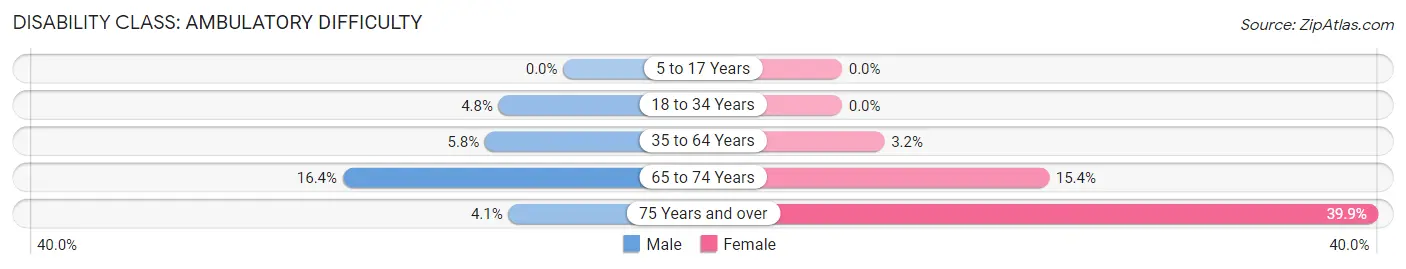
| Age Bracket | Male | Female |
| 5 to 17 Years | 0 (0.0%) | 0 (0.0%) |
| 18 to 34 Years | 35 (4.8%) | 0 (0.0%) |
| 35 to 64 Years | 93 (5.8%) | 53 (3.2%) |
| 65 to 74 Years | 91 (16.4%) | 77 (15.4%) |
| 75 Years and over | 15 (4.1%) | 59 (39.9%) |
Disability Class: Self-Care Difficulty
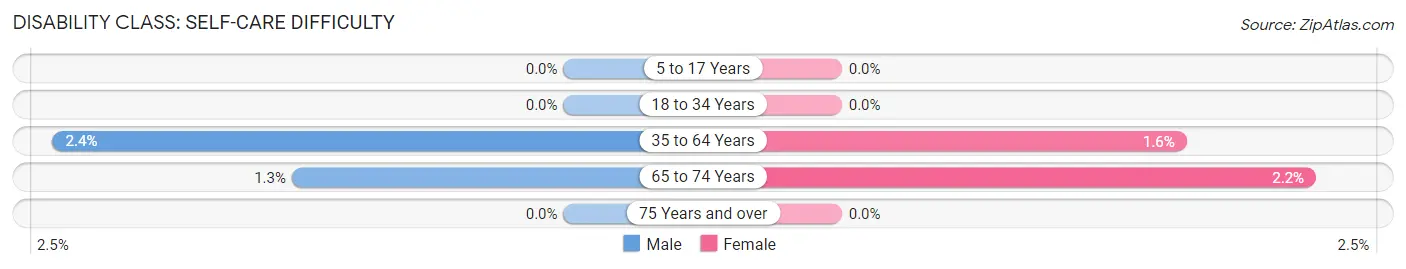
| Age Bracket | Male | Female |
| 5 to 17 Years | 0 (0.0%) | 0 (0.0%) |
| 18 to 34 Years | 0 (0.0%) | 0 (0.0%) |
| 35 to 64 Years | 38 (2.4%) | 27 (1.6%) |
| 65 to 74 Years | 7 (1.3%) | 11 (2.2%) |
| 75 Years and over | 0 (0.0%) | 0 (0.0%) |
Technology Access in Helena Valley West Central
Computing Device Access in Helena Valley West Central
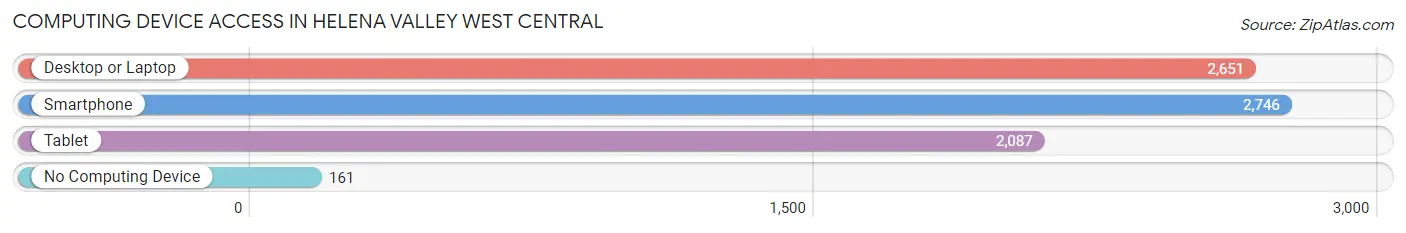
| Device Type | # Households | % Households |
| Desktop or Laptop | 2,651 | 88.0% |
| Smartphone | 2,746 | 91.1% |
| Tablet | 2,087 | 69.3% |
| No Computing Device | 161 | 5.3% |
| Total | 3,013 | 100.0% |
Internet Access in Helena Valley West Central
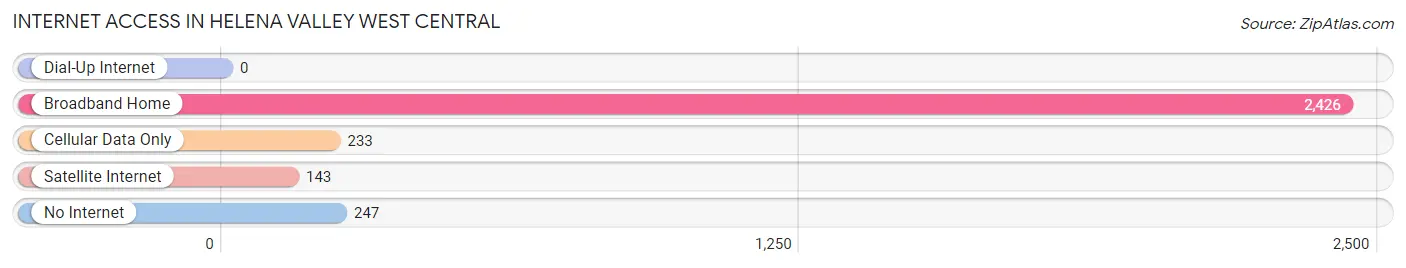
| Internet Type | # Households | % Households |
| Dial-Up Internet | 0 | 0.0% |
| Broadband Home | 2,426 | 80.5% |
| Cellular Data Only | 233 | 7.7% |
| Satellite Internet | 143 | 4.8% |
| No Internet | 247 | 8.2% |
| Total | 3,013 | 100.0% |
Helena Valley West Central Summary
Helena Valley West Central is a census-designated place (CDP) located in Lewis and Clark County, Montana. It is situated in the Helena Valley, approximately 8 miles west of the city of Helena. The CDP has a total area of 8.3 square miles, all of which is land. As of the 2010 census, the population of Helena Valley West Central was 1,945.
Geography
Helena Valley West Central is located in the Helena Valley, which is part of the larger Rocky Mountain Front. The CDP is situated in the foothills of the Rocky Mountains, approximately 8 miles west of the city of Helena. The CDP has a total area of 8.3 square miles, all of which is land. The terrain is mostly flat, with some rolling hills. The area is characterized by open grasslands and sagebrush.
Climate
Helena Valley West Central has a semi-arid climate, with hot summers and cold winters. The average annual temperature is 44.3°F, with an average high of 68.2°F in July and an average low of 20.4°F in January. The average annual precipitation is 13.3 inches, with an average of 24.3 inches of snowfall per year.
Demographics
As of the 2010 census, the population of Helena Valley West Central was 1,945. The racial makeup of the CDP was 94.2% White, 0.7% African American, 1.2% Native American, 0.7% Asian, 0.1% Pacific Islander, 0.9% from other races, and 2.2% from two or more races. Hispanic or Latino of any race were 3.2% of the population.
Economy
The economy of Helena Valley West Central is largely based on agriculture and tourism. The area is home to several farms and ranches, which produce a variety of crops and livestock. Tourism is also an important part of the local economy, with visitors coming to the area to enjoy the scenic beauty and outdoor activities.
The CDP is also home to several businesses, including restaurants, retail stores, and service providers. The area is served by several major highways, including Interstate 15 and US Highway 12.
Education
Helena Valley West Central is served by the Helena Public Schools district. The district operates several elementary, middle, and high schools in the area. The CDP is also home to several private schools, including St. John's Lutheran School and Helena Christian School.
Conclusion
Helena Valley West Central is a census-designated place located in Lewis and Clark County, Montana. It is situated in the Helena Valley, approximately 8 miles west of the city of Helena. The CDP has a total area of 8.3 square miles, all of which is land. As of the 2010 census, the population of Helena Valley West Central was 1,945. The economy of the CDP is largely based on agriculture and tourism, and the area is served by several major highways. The CDP is served by the Helena Public Schools district, as well as several private schools.
Common Questions
What is Per Capita Income in Helena Valley West Central?
Per Capita income in Helena Valley West Central is $39,207.
What is the Median Family Income in Helena Valley West Central?
Median Family Income in Helena Valley West Central is $102,027.
What is the Median Household income in Helena Valley West Central?
Median Household Income in Helena Valley West Central is $84,846.
What is Income or Wage Gap in Helena Valley West Central?
Income or Wage Gap in Helena Valley West Central is 16.8%.
Women in Helena Valley West Central earn 83.2 cents for every dollar earned by a man.
What is Inequality or Gini Index in Helena Valley West Central?
Inequality or Gini Index in Helena Valley West Central is 0.38.
What is the Total Population of Helena Valley West Central?
Total Population of Helena Valley West Central is 8,206.
What is the Total Male Population of Helena Valley West Central?
Total Male Population of Helena Valley West Central is 4,404.
What is the Total Female Population of Helena Valley West Central?
Total Female Population of Helena Valley West Central is 3,802.
What is the Ratio of Males per 100 Females in Helena Valley West Central?
There are 115.83 Males per 100 Females in Helena Valley West Central.
What is the Ratio of Females per 100 Males in Helena Valley West Central?
There are 86.33 Females per 100 Males in Helena Valley West Central.
What is the Median Population Age in Helena Valley West Central?
Median Population Age in Helena Valley West Central is 40.7 Years.
What is the Average Family Size in Helena Valley West Central
Average Family Size in Helena Valley West Central is 3.1 People.
What is the Average Household Size in Helena Valley West Central
Average Household Size in Helena Valley West Central is 2.7 People.
How Large is the Labor Force in Helena Valley West Central?
There are 4,225 People in the Labor Forcein in Helena Valley West Central.
What is the Percentage of People in the Labor Force in Helena Valley West Central?
66.5% of People are in the Labor Force in Helena Valley West Central.
What is the Unemployment Rate in Helena Valley West Central?
Unemployment Rate in Helena Valley West Central is 5.1%.