Butte Silver Bow balance, MT Map & Demographics
Butte Silver Bow balance Map
Butte Silver Bow balance Overview
$35,110
PER CAPITA INCOME
$74,671
AVG FAMILY INCOME
$56,522
AVG HOUSEHOLD INCOME
26.6%
WAGE / INCOME GAP [ % ]
73.4¢/ $1
WAGE / INCOME GAP [ $ ]
$10,741
FAMILY INCOME DEFICIT
0.50
INEQUALITY / GINI INDEX
34,638
TOTAL POPULATION
17,813
MALE POPULATION
16,825
FEMALE POPULATION
105.87
MALES / 100 FEMALES
94.45
FEMALES / 100 MALES
40.2
MEDIAN AGE
3.1
AVG FAMILY SIZE
2.3
AVG HOUSEHOLD SIZE
16,975
LABOR FORCE [ PEOPLE ]
60.1%
PERCENT IN LABOR FORCE
4.5%
UNEMPLOYMENT RATE
Income in Butte Silver Bow balance
Income Overview in Butte Silver Bow balance
Per Capita Income in Butte Silver Bow balance is $35,110, while median incomes of families and households are $74,671 and $56,522 respectively.
| Characteristic | Number | Measure |
| Per Capita Income | 34,638 | $35,110 |
| Median Family Income | 7,931 | $74,671 |
| Mean Family Income | 7,931 | $104,956 |
| Median Household Income | 14,775 | $56,522 |
| Mean Household Income | 14,775 | $79,558 |
| Income Deficit | 7,931 | $10,741 |
| Wage / Income Gap (%) | 34,638 | 26.59% |
| Wage / Income Gap ($) | 34,638 | 73.41¢ per $1 |
| Gini / Inequality Index | 34,638 | 0.50 |
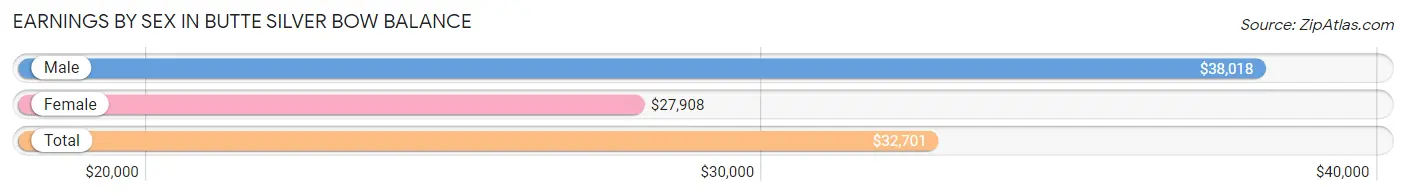
Earnings by Sex in Butte Silver Bow balance
Average Earnings in Butte Silver Bow balance are $32,701, $38,018 for men and $27,908 for women, a difference of 26.6%.
| Sex | Number | Average Earnings |
| Male | 10,035 (54.1%) | $38,018 |
| Female | 8,527 (45.9%) | $27,908 |
| Total | 18,562 (100.0%) | $32,701 |
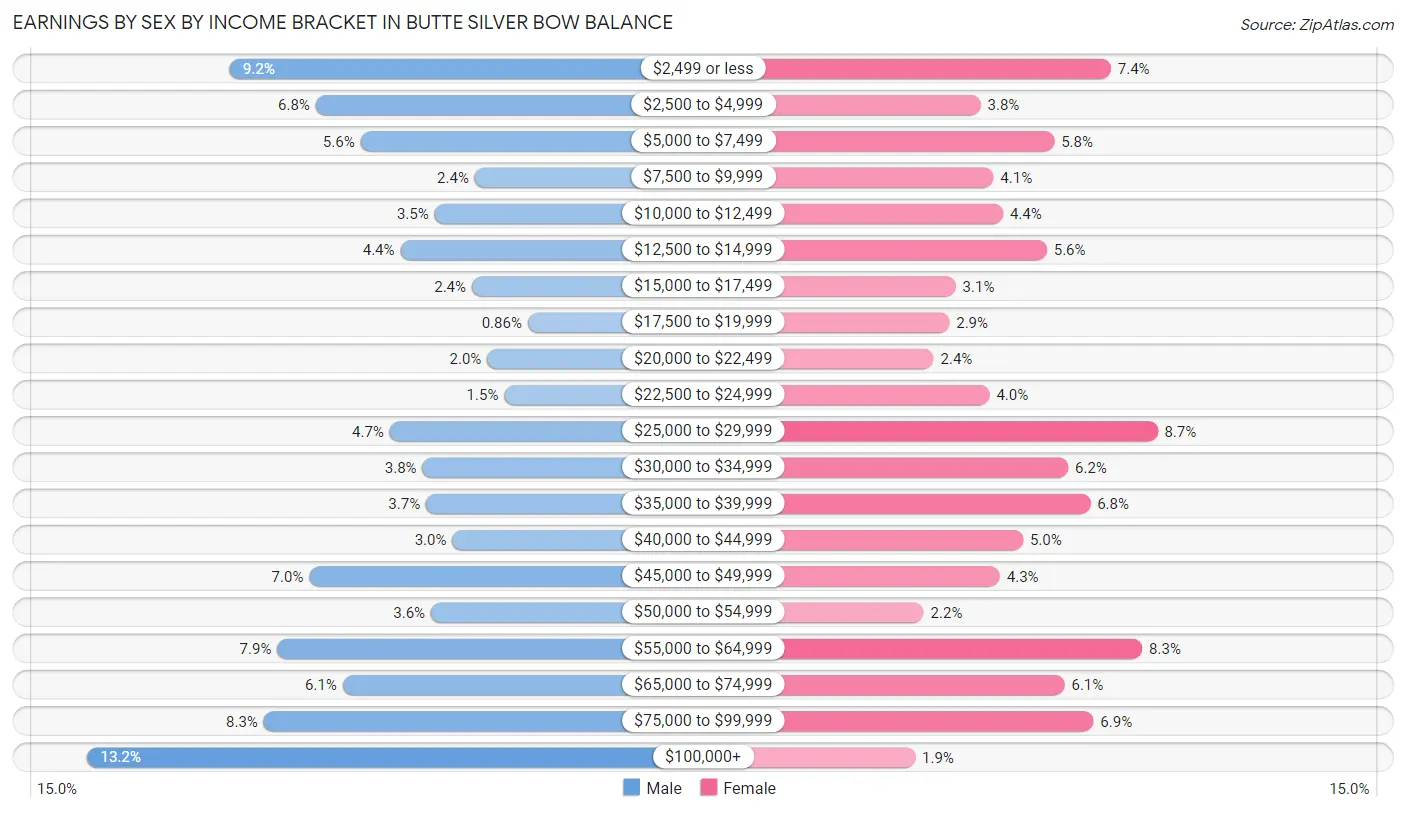
Earnings by Sex by Income Bracket in Butte Silver Bow balance
The most common earnings brackets in Butte Silver Bow balance are $100,000+ for men (1,328 | 13.2%) and $25,000 to $29,999 for women (744 | 8.7%).
| Income | Male | Female |
| $2,499 or less | 926 (9.2%) | 633 (7.4%) |
| $2,500 to $4,999 | 684 (6.8%) | 321 (3.8%) |
| $5,000 to $7,499 | 558 (5.6%) | 497 (5.8%) |
| $7,500 to $9,999 | 236 (2.4%) | 351 (4.1%) |
| $10,000 to $12,499 | 349 (3.5%) | 374 (4.4%) |
| $12,500 to $14,999 | 446 (4.4%) | 479 (5.6%) |
| $15,000 to $17,499 | 244 (2.4%) | 261 (3.1%) |
| $17,500 to $19,999 | 86 (0.9%) | 246 (2.9%) |
| $20,000 to $22,499 | 201 (2.0%) | 208 (2.4%) |
| $22,500 to $24,999 | 153 (1.5%) | 342 (4.0%) |
| $25,000 to $29,999 | 476 (4.7%) | 744 (8.7%) |
| $30,000 to $34,999 | 383 (3.8%) | 530 (6.2%) |
| $35,000 to $39,999 | 373 (3.7%) | 583 (6.8%) |
| $40,000 to $44,999 | 299 (3.0%) | 422 (5.0%) |
| $45,000 to $49,999 | 702 (7.0%) | 367 (4.3%) |
| $50,000 to $54,999 | 359 (3.6%) | 184 (2.2%) |
| $55,000 to $64,999 | 793 (7.9%) | 708 (8.3%) |
| $65,000 to $74,999 | 608 (6.1%) | 522 (6.1%) |
| $75,000 to $99,999 | 831 (8.3%) | 591 (6.9%) |
| $100,000+ | 1,328 (13.2%) | 164 (1.9%) |
| Total | 10,035 (100.0%) | 8,527 (100.0%) |
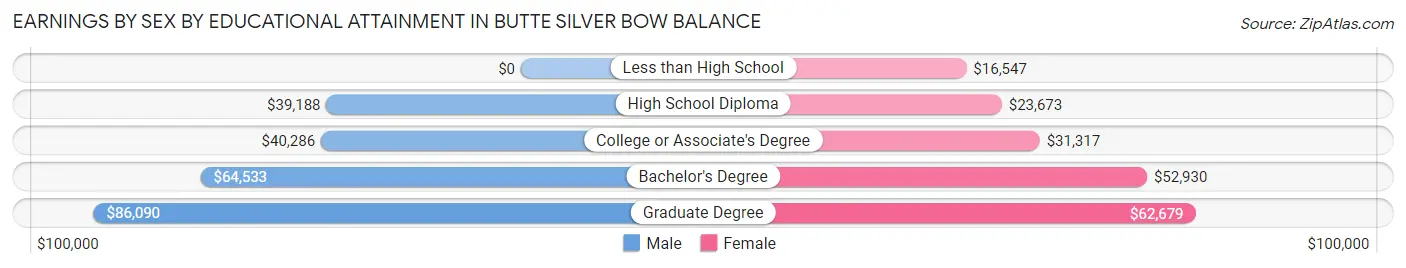
Earnings by Sex by Educational Attainment in Butte Silver Bow balance
Average earnings in Butte Silver Bow balance are $48,139 for men and $33,301 for women, a difference of 30.8%. Men with an educational attainment of graduate degree enjoy the highest average annual earnings of $86,090, while those with high school diploma education earn the least with $39,188. Women with an educational attainment of graduate degree earn the most with the average annual earnings of $62,679, while those with less than high school education have the smallest earnings of $16,547.
| Educational Attainment | Male Income | Female Income |
| Less than High School | - | - |
| High School Diploma | $39,188 | $23,673 |
| College or Associate's Degree | $40,286 | $31,317 |
| Bachelor's Degree | $64,533 | $52,930 |
| Graduate Degree | $86,090 | $62,679 |
| Total | $48,139 | $33,301 |
Family Income in Butte Silver Bow balance
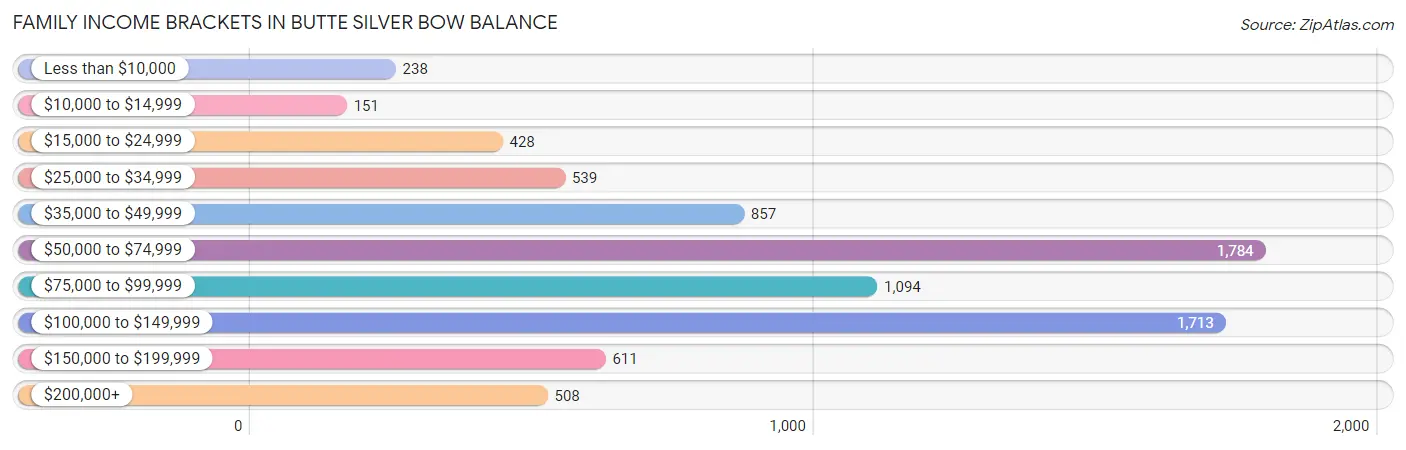
Family Income Brackets in Butte Silver Bow balance
According to the Butte Silver Bow balance family income data, there are 1,784 families falling into the $50,000 to $74,999 income range, which is the most common income bracket and makes up 22.5% of all families. Conversely, the $10,000 to $14,999 income bracket is the least frequent group with only 151 families (1.9%) belonging to this category.
| Income Bracket | # Families | % Families |
| Less than $10,000 | 238 | 3.0% |
| $10,000 to $14,999 | 151 | 1.9% |
| $15,000 to $24,999 | 428 | 5.4% |
| $25,000 to $34,999 | 539 | 6.8% |
| $35,000 to $49,999 | 857 | 10.8% |
| $50,000 to $74,999 | 1,784 | 22.5% |
| $75,000 to $99,999 | 1,094 | 13.8% |
| $100,000 to $149,999 | 1,713 | 21.6% |
| $150,000 to $199,999 | 611 | 7.7% |
| $200,000+ | 508 | 6.4% |
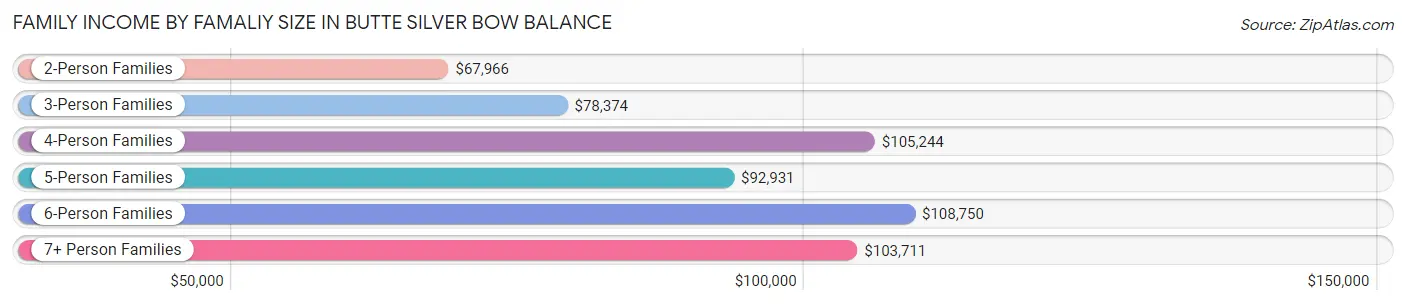
Family Income by Famaliy Size in Butte Silver Bow balance
6-person families (138 | 1.7%) account for the highest median family income in Butte Silver Bow balance with $108,750 per family, while 2-person families (4,151 | 52.3%) have the highest median income of $33,983 per family member.
| Income Bracket | # Families | Median Income |
| 2-Person Families | 4,151 (52.3%) | $67,966 |
| 3-Person Families | 1,537 (19.4%) | $78,374 |
| 4-Person Families | 1,514 (19.1%) | $105,244 |
| 5-Person Families | 544 (6.9%) | $92,931 |
| 6-Person Families | 138 (1.7%) | $108,750 |
| 7+ Person Families | 47 (0.6%) | $103,711 |
| Total | 7,931 (100.0%) | $74,671 |
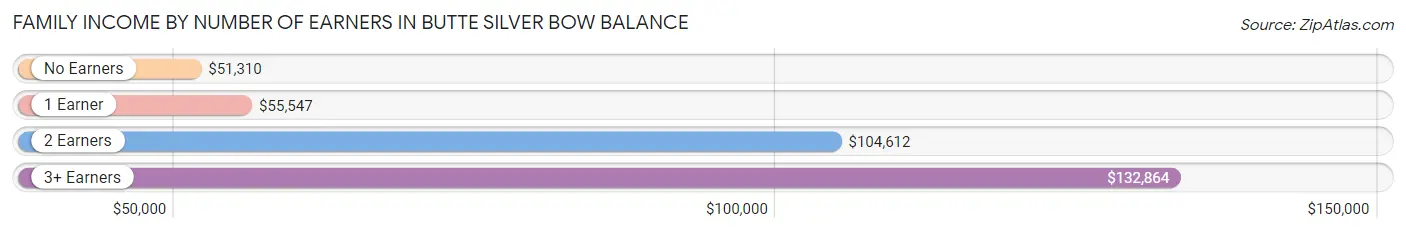
Family Income by Number of Earners in Butte Silver Bow balance
The median family income in Butte Silver Bow balance is $74,671, with families comprising 3+ earners (838) having the highest median family income of $132,864, while families with no earners (1,320) have the lowest median family income of $51,310, accounting for 10.6% and 16.6% of families, respectively.
| Number of Earners | # Families | Median Income |
| No Earners | 1,320 (16.6%) | $51,310 |
| 1 Earner | 2,587 (32.6%) | $55,547 |
| 2 Earners | 3,186 (40.2%) | $104,612 |
| 3+ Earners | 838 (10.6%) | $132,864 |
| Total | 7,931 (100.0%) | $74,671 |
Household Income in Butte Silver Bow balance
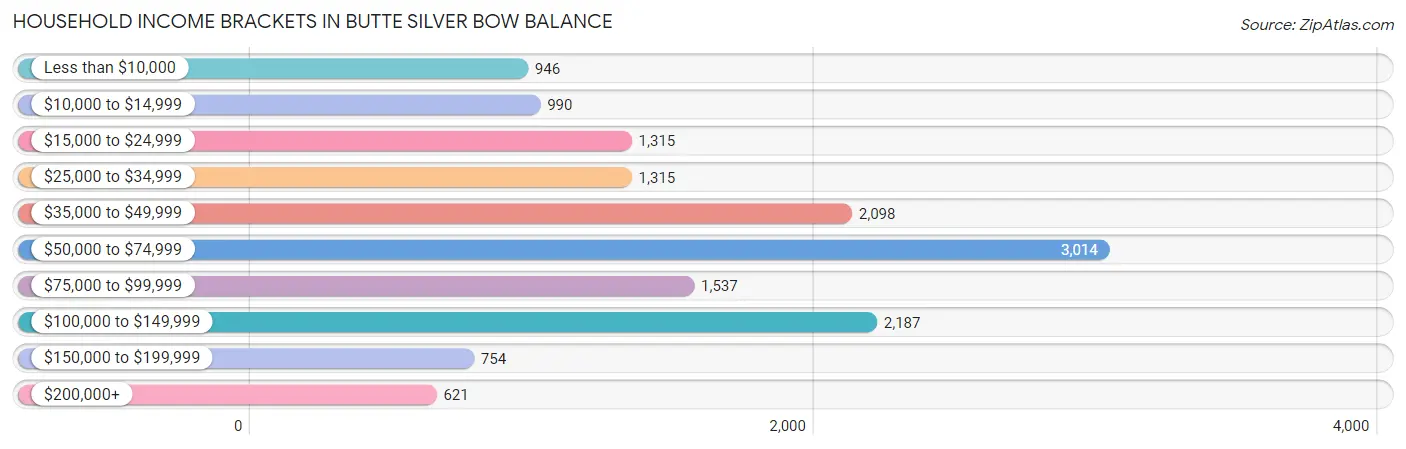
Household Income Brackets in Butte Silver Bow balance
With 3,014 households falling in the category, the $50,000 to $74,999 income range is the most frequent in Butte Silver Bow balance, accounting for 20.4% of all households. In contrast, only 621 households (4.2%) fall into the $200,000+ income bracket, making it the least populous group.
| Income Bracket | # Households | % Households |
| Less than $10,000 | 946 | 6.4% |
| $10,000 to $14,999 | 990 | 6.7% |
| $15,000 to $24,999 | 1,315 | 8.9% |
| $25,000 to $34,999 | 1,315 | 8.9% |
| $35,000 to $49,999 | 2,098 | 14.2% |
| $50,000 to $74,999 | 3,014 | 20.4% |
| $75,000 to $99,999 | 1,537 | 10.4% |
| $100,000 to $149,999 | 2,187 | 14.8% |
| $150,000 to $199,999 | 754 | 5.1% |
| $200,000+ | 621 | 4.2% |
Household Income by Householder Age in Butte Silver Bow balance
The median household income in Butte Silver Bow balance is $56,522, with the highest median household income of $70,188 found in the 45 to 64 years age bracket for the primary householder. A total of 5,154 households (34.9%) fall into this category. Meanwhile, the 15 to 24 years age bracket for the primary householder has the lowest median household income of $39,552, with 947 households (6.4%) in this group.
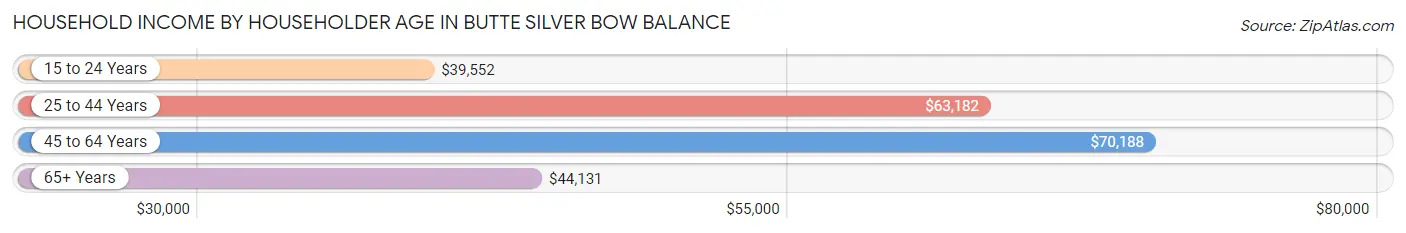
| Income Bracket | # Households | Median Income |
| 15 to 24 Years | 947 (6.4%) | $39,552 |
| 25 to 44 Years | 4,150 (28.1%) | $63,182 |
| 45 to 64 Years | 5,154 (34.9%) | $70,188 |
| 65+ Years | 4,524 (30.6%) | $44,131 |
| Total | 14,775 (100.0%) | $56,522 |
Poverty in Butte Silver Bow balance
Income Below Poverty by Sex and Age in Butte Silver Bow balance
With 15.7% poverty level for males and 15.8% for females among the residents of Butte Silver Bow balance, 5 year old males and 5 year old females are the most vulnerable to poverty, with 59 males (43.1%) and 26 females (60.5%) in their respective age groups living below the poverty level.
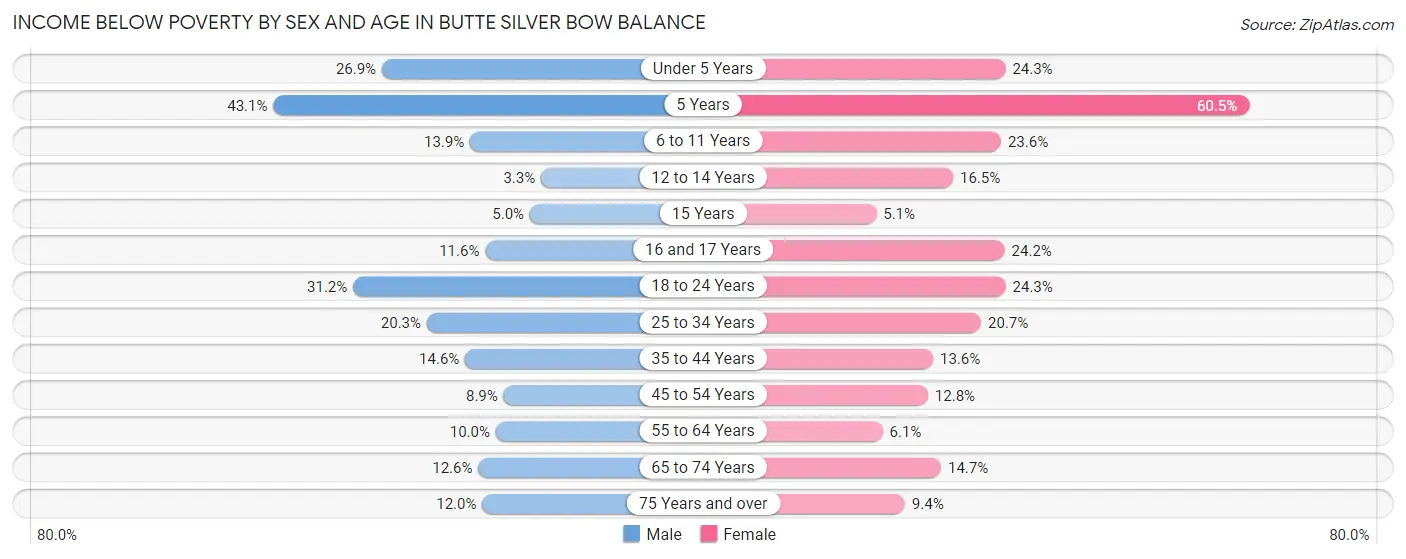
| Age Bracket | Male | Female |
| Under 5 Years | 274 (26.9%) | 217 (24.3%) |
| 5 Years | 59 (43.1%) | 26 (60.5%) |
| 6 to 11 Years | 158 (13.9%) | 291 (23.6%) |
| 12 to 14 Years | 23 (3.3%) | 93 (16.5%) |
| 15 Years | 14 (5.0%) | 11 (5.1%) |
| 16 and 17 Years | 34 (11.6%) | 81 (24.2%) |
| 18 to 24 Years | 595 (31.2%) | 391 (24.3%) |
| 25 to 34 Years | 440 (20.3%) | 415 (20.7%) |
| 35 to 44 Years | 314 (14.6%) | 249 (13.6%) |
| 45 to 54 Years | 179 (8.9%) | 232 (12.8%) |
| 55 to 64 Years | 239 (10.0%) | 142 (6.1%) |
| 65 to 74 Years | 247 (12.6%) | 301 (14.7%) |
| 75 Years and over | 132 (12.0%) | 125 (9.4%) |
| Total | 2,708 (15.7%) | 2,574 (15.8%) |
Income Above Poverty by Sex and Age in Butte Silver Bow balance
According to the poverty statistics in Butte Silver Bow balance, males aged 12 to 14 years and females aged 15 years are the age groups that are most secure financially, with 96.7% of males and 94.9% of females in these age groups living above the poverty line.
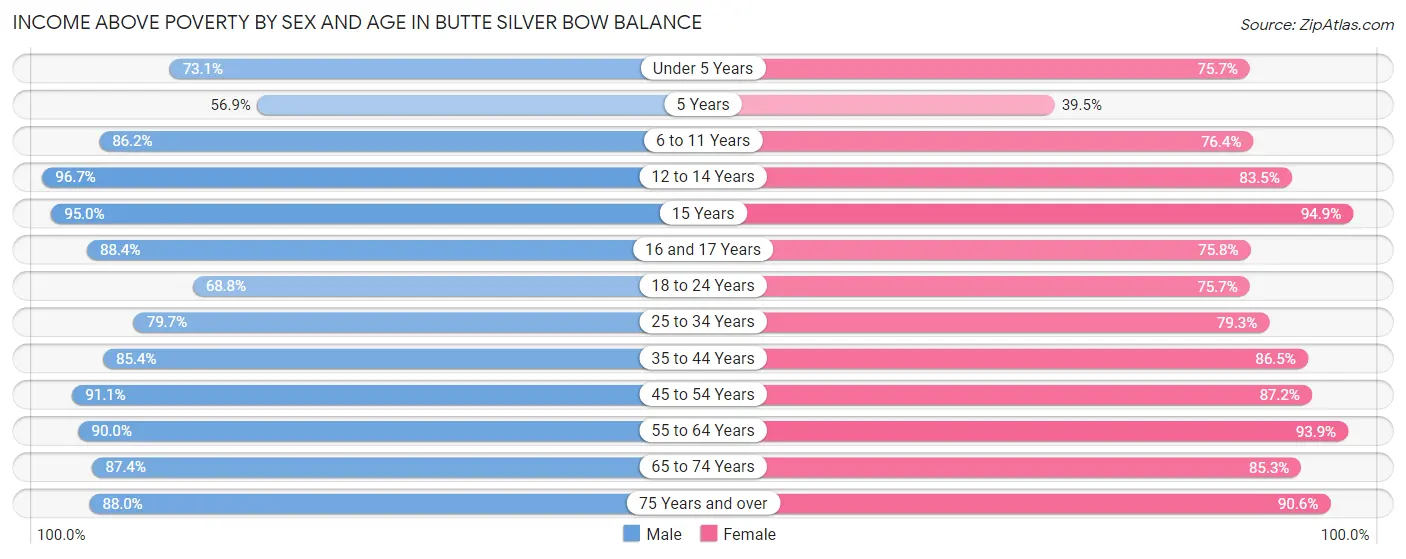
| Age Bracket | Male | Female |
| Under 5 Years | 743 (73.1%) | 676 (75.7%) |
| 5 Years | 78 (56.9%) | 17 (39.5%) |
| 6 to 11 Years | 983 (86.2%) | 940 (76.4%) |
| 12 to 14 Years | 671 (96.7%) | 470 (83.5%) |
| 15 Years | 268 (95.0%) | 204 (94.9%) |
| 16 and 17 Years | 259 (88.4%) | 254 (75.8%) |
| 18 to 24 Years | 1,311 (68.8%) | 1,216 (75.7%) |
| 25 to 34 Years | 1,731 (79.7%) | 1,591 (79.3%) |
| 35 to 44 Years | 1,840 (85.4%) | 1,589 (86.5%) |
| 45 to 54 Years | 1,840 (91.1%) | 1,582 (87.2%) |
| 55 to 64 Years | 2,145 (90.0%) | 2,200 (93.9%) |
| 65 to 74 Years | 1,709 (87.4%) | 1,741 (85.3%) |
| 75 Years and over | 964 (88.0%) | 1,209 (90.6%) |
| Total | 14,542 (84.3%) | 13,689 (84.2%) |
Income Below Poverty Among Married-Couple Families in Butte Silver Bow balance
The poverty statistics for married-couple families in Butte Silver Bow balance show that 3.5% or 212 of the total 6,072 families live below the poverty line. Families with 3 or 4 children have the highest poverty rate of 5.7%, comprising of 25 families. On the other hand, families with 5 or more children have the lowest poverty rate of 0.0%, which includes 0 families.
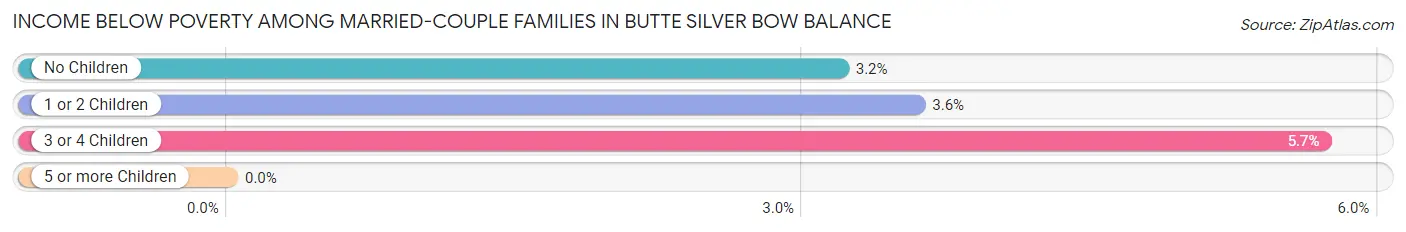
| Children | Above Poverty | Below Poverty |
| No Children | 3,702 (96.8%) | 122 (3.2%) |
| 1 or 2 Children | 1,744 (96.4%) | 65 (3.6%) |
| 3 or 4 Children | 413 (94.3%) | 25 (5.7%) |
| 5 or more Children | 1 (100.0%) | 0 (0.0%) |
| Total | 5,860 (96.5%) | 212 (3.5%) |
Income Below Poverty Among Single-Parent Households in Butte Silver Bow balance
According to the poverty data in Butte Silver Bow balance, 22.8% or 156 single-father households and 27.7% or 326 single-mother households are living below the poverty line. Among single-father households, those with 1 or 2 children have the highest poverty rate, with 117 households (43.2%) experiencing poverty. Likewise, among single-mother households, those with 3 or 4 children have the highest poverty rate, with 110 households (62.2%) falling below the poverty line.
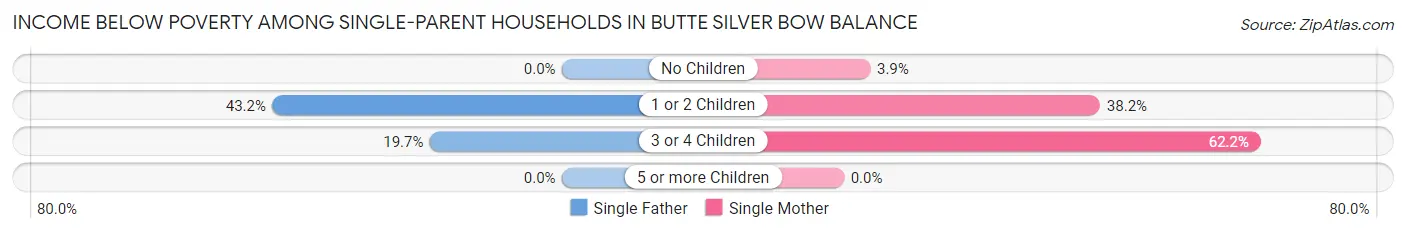
| Children | Single Father | Single Mother |
| No Children | 0 (0.0%) | 19 (3.9%) |
| 1 or 2 Children | 117 (43.2%) | 197 (38.2%) |
| 3 or 4 Children | 39 (19.7%) | 110 (62.2%) |
| 5 or more Children | 0 (0.0%) | 0 (0.0%) |
| Total | 156 (22.8%) | 326 (27.7%) |
Income Below Poverty Among Married-Couple vs Single-Parent Households in Butte Silver Bow balance
The poverty data for Butte Silver Bow balance shows that 212 of the married-couple family households (3.5%) and 482 of the single-parent households (25.9%) are living below the poverty level. Within the married-couple family households, those with 3 or 4 children have the highest poverty rate, with 25 households (5.7%) falling below the poverty line. Among the single-parent households, those with 1 or 2 children have the highest poverty rate, with 314 household (39.9%) living below poverty.

| Children | Married-Couple Families | Single-Parent Households |
| No Children | 122 (3.2%) | 19 (2.7%) |
| 1 or 2 Children | 65 (3.6%) | 314 (39.9%) |
| 3 or 4 Children | 25 (5.7%) | 149 (39.7%) |
| 5 or more Children | 0 (0.0%) | 0 (0.0%) |
| Total | 212 (3.5%) | 482 (25.9%) |
Race in Butte Silver Bow balance
The most populous races in Butte Silver Bow balance are White / Caucasian (32,013 | 92.4%), Hispanic or Latino (1,629 | 4.7%), and Two or more Races (1,560 | 4.5%).
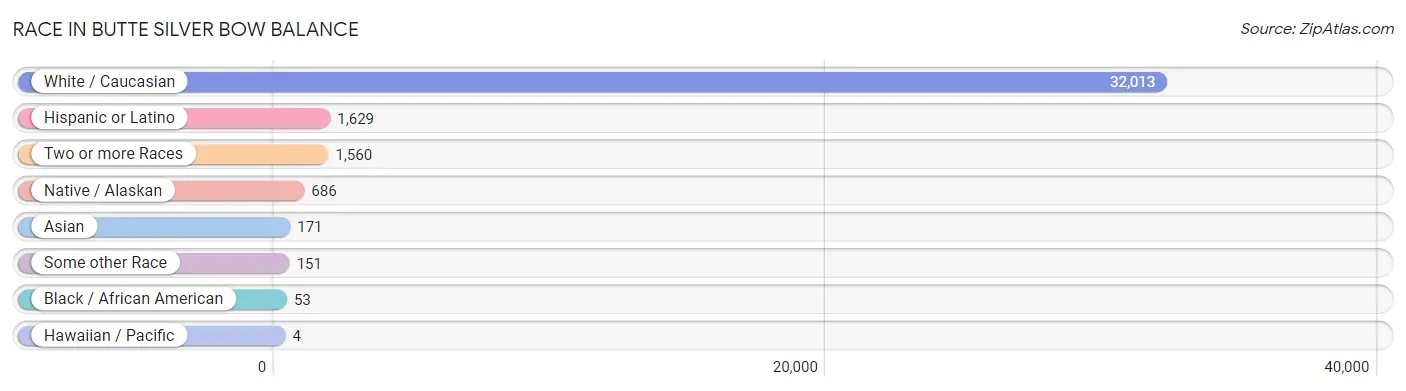
| Race | # Population | % Population |
| Asian | 171 | 0.5% |
| Black / African American | 53 | 0.2% |
| Hawaiian / Pacific | 4 | 0.0% |
| Hispanic or Latino | 1,629 | 4.7% |
| Native / Alaskan | 686 | 2.0% |
| White / Caucasian | 32,013 | 92.4% |
| Two or more Races | 1,560 | 4.5% |
| Some other Race | 151 | 0.4% |
| Total | 34,638 | 100.0% |
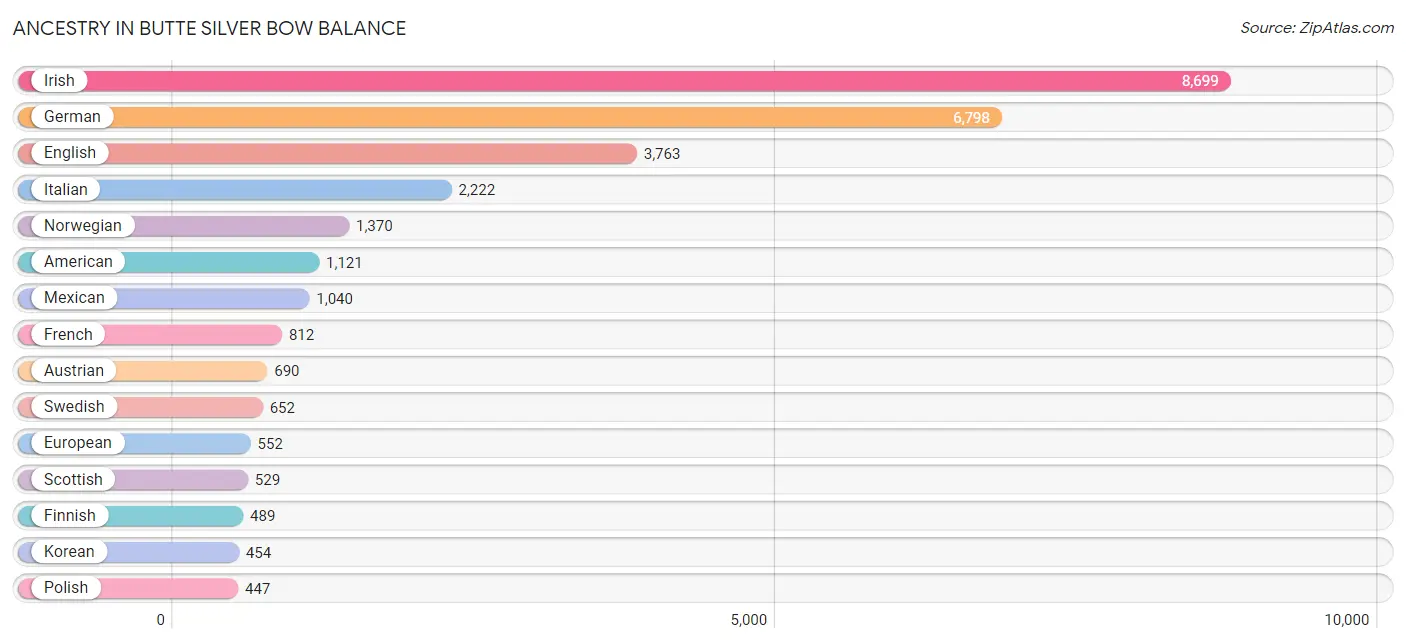
Ancestry in Butte Silver Bow balance
The most populous ancestries reported in Butte Silver Bow balance are Irish (8,699 | 25.1%), German (6,798 | 19.6%), English (3,763 | 10.9%), Italian (2,222 | 6.4%), and Norwegian (1,370 | 4.0%), together accounting for 66.0% of all Butte Silver Bow balance residents.
| Ancestry | # Population | % Population |
| African | 13 | 0.0% |
| American | 1,121 | 3.2% |
| Apache | 8 | 0.0% |
| Arab | 236 | 0.7% |
| Armenian | 17 | 0.1% |
| Austrian | 690 | 2.0% |
| Basque | 3 | 0.0% |
| Belgian | 34 | 0.1% |
| Bhutanese | 65 | 0.2% |
| Blackfeet | 208 | 0.6% |
| British | 172 | 0.5% |
| Bulgarian | 7 | 0.0% |
| Burmese | 58 | 0.2% |
| Canadian | 49 | 0.1% |
| Celtic | 1 | 0.0% |
| Central American | 70 | 0.2% |
| Cherokee | 74 | 0.2% |
| Cheyenne | 68 | 0.2% |
| Chippewa | 97 | 0.3% |
| Choctaw | 35 | 0.1% |
| Cree | 102 | 0.3% |
| Creek | 27 | 0.1% |
| Croatian | 225 | 0.6% |
| Cuban | 48 | 0.1% |
| Czech | 152 | 0.4% |
| Danish | 290 | 0.8% |
| Dominican | 5 | 0.0% |
| Dutch | 407 | 1.2% |
| Eastern European | 15 | 0.0% |
| English | 3,763 | 10.9% |
| European | 552 | 1.6% |
| Finnish | 489 | 1.4% |
| French | 812 | 2.3% |
| French Canadian | 313 | 0.9% |
| German | 6,798 | 19.6% |
| German Russian | 11 | 0.0% |
| Greek | 53 | 0.2% |
| Honduran | 6 | 0.0% |
| Hungarian | 61 | 0.2% |
| Indian (Asian) | 45 | 0.1% |
| Iranian | 2 | 0.0% |
| Irish | 8,699 | 25.1% |
| Iroquois | 17 | 0.1% |
| Italian | 2,222 | 6.4% |
| Korean | 454 | 1.3% |
| Lebanese | 121 | 0.4% |
| Lithuanian | 28 | 0.1% |
| Mexican | 1,040 | 3.0% |
| Native Hawaiian | 73 | 0.2% |
| Navajo | 10 | 0.0% |
| Northern European | 212 | 0.6% |
| Norwegian | 1,370 | 4.0% |
| Pakistani | 32 | 0.1% |
| Panamanian | 64 | 0.2% |
| Polish | 447 | 1.3% |
| Portuguese | 35 | 0.1% |
| Puerto Rican | 10 | 0.0% |
| Russian | 51 | 0.2% |
| Samoan | 4 | 0.0% |
| Scandinavian | 193 | 0.6% |
| Scotch-Irish | 259 | 0.7% |
| Scottish | 529 | 1.5% |
| Serbian | 63 | 0.2% |
| Shoshone | 64 | 0.2% |
| Sioux | 11 | 0.0% |
| Slavic | 223 | 0.6% |
| Slovak | 162 | 0.5% |
| Slovene | 86 | 0.3% |
| Spaniard | 52 | 0.2% |
| Spanish | 213 | 0.6% |
| Sri Lankan | 2 | 0.0% |
| Subsaharan African | 13 | 0.0% |
| Swedish | 652 | 1.9% |
| Swiss | 52 | 0.2% |
| Turkish | 26 | 0.1% |
| Ukrainian | 54 | 0.2% |
| Welsh | 327 | 0.9% |
| Yugoslavian | 353 | 1.0% | View All 78 Rows |
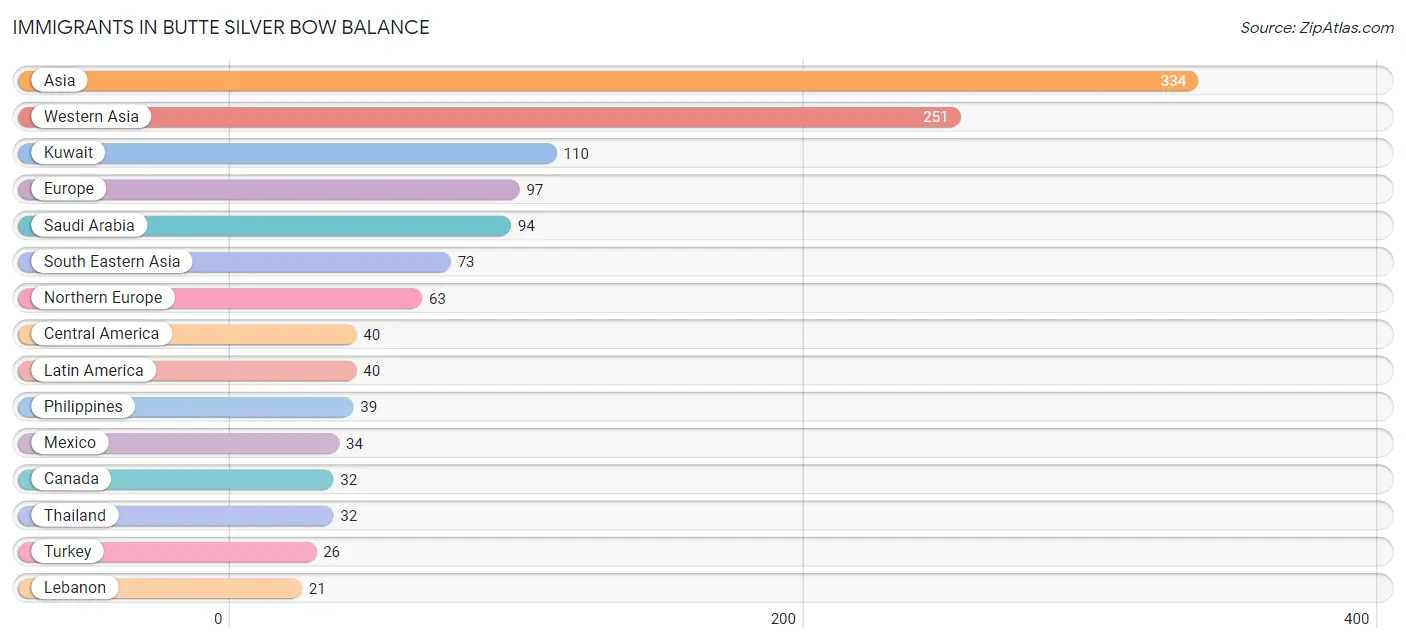
Immigrants in Butte Silver Bow balance
The most numerous immigrant groups reported in Butte Silver Bow balance came from Asia (334 | 1.0%), Western Asia (251 | 0.7%), Kuwait (110 | 0.3%), Europe (97 | 0.3%), and Saudi Arabia (94 | 0.3%), together accounting for 2.6% of all Butte Silver Bow balance residents.
| Immigration Origin | # Population | % Population |
| Africa | 13 | 0.0% |
| Asia | 334 | 1.0% |
| Canada | 32 | 0.1% |
| Central America | 40 | 0.1% |
| Croatia | 8 | 0.0% |
| Eastern Asia | 7 | 0.0% |
| Eastern Europe | 15 | 0.0% |
| Europe | 97 | 0.3% |
| France | 19 | 0.1% |
| Ghana | 13 | 0.0% |
| Honduras | 6 | 0.0% |
| India | 1 | 0.0% |
| Iran | 2 | 0.0% |
| Korea | 7 | 0.0% |
| Kuwait | 110 | 0.3% |
| Latin America | 40 | 0.1% |
| Lebanon | 21 | 0.1% |
| Mexico | 34 | 0.1% |
| Northern Europe | 63 | 0.2% |
| Philippines | 39 | 0.1% |
| Russia | 7 | 0.0% |
| Saudi Arabia | 94 | 0.3% |
| Scotland | 10 | 0.0% |
| South Central Asia | 3 | 0.0% |
| South Eastern Asia | 73 | 0.2% |
| Thailand | 32 | 0.1% |
| Turkey | 26 | 0.1% |
| Vietnam | 2 | 0.0% |
| Western Africa | 13 | 0.0% |
| Western Asia | 251 | 0.7% |
| Western Europe | 19 | 0.1% | View All 31 Rows |
Sex and Age in Butte Silver Bow balance
Sex and Age in Butte Silver Bow balance
The most populous age groups in Butte Silver Bow balance are 20 to 24 Years (1,590 | 8.9%) for men and 60 to 64 Years (1,328 | 7.9%) for women.
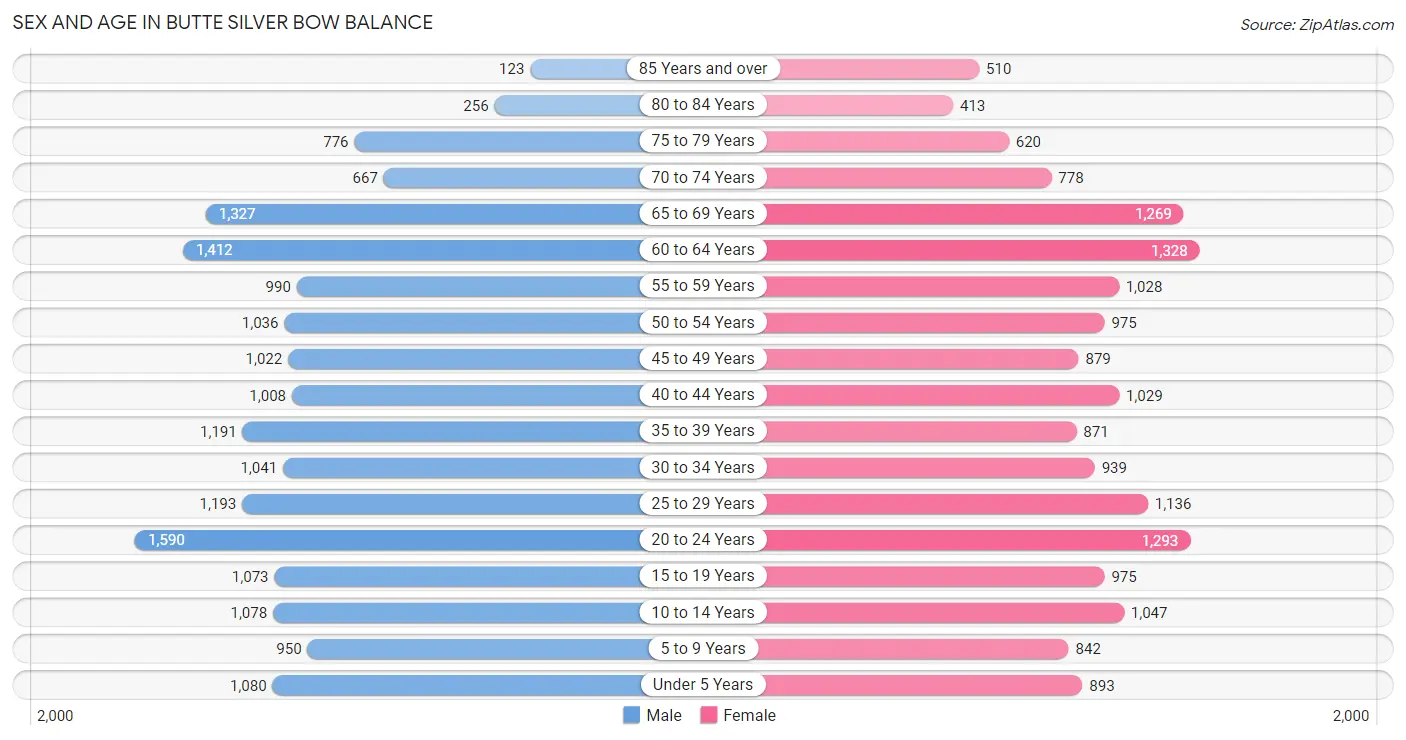
| Age Bracket | Male | Female |
| Under 5 Years | 1,080 (6.1%) | 893 (5.3%) |
| 5 to 9 Years | 950 (5.3%) | 842 (5.0%) |
| 10 to 14 Years | 1,078 (6.0%) | 1,047 (6.2%) |
| 15 to 19 Years | 1,073 (6.0%) | 975 (5.8%) |
| 20 to 24 Years | 1,590 (8.9%) | 1,293 (7.7%) |
| 25 to 29 Years | 1,193 (6.7%) | 1,136 (6.8%) |
| 30 to 34 Years | 1,041 (5.8%) | 939 (5.6%) |
| 35 to 39 Years | 1,191 (6.7%) | 871 (5.2%) |
| 40 to 44 Years | 1,008 (5.7%) | 1,029 (6.1%) |
| 45 to 49 Years | 1,022 (5.7%) | 879 (5.2%) |
| 50 to 54 Years | 1,036 (5.8%) | 975 (5.8%) |
| 55 to 59 Years | 990 (5.6%) | 1,028 (6.1%) |
| 60 to 64 Years | 1,412 (7.9%) | 1,328 (7.9%) |
| 65 to 69 Years | 1,327 (7.4%) | 1,269 (7.5%) |
| 70 to 74 Years | 667 (3.7%) | 778 (4.6%) |
| 75 to 79 Years | 776 (4.4%) | 620 (3.7%) |
| 80 to 84 Years | 256 (1.4%) | 413 (2.5%) |
| 85 Years and over | 123 (0.7%) | 510 (3.0%) |
| Total | 17,813 (100.0%) | 16,825 (100.0%) |
Families and Households in Butte Silver Bow balance
Median Family Size in Butte Silver Bow balance
The median family size in Butte Silver Bow balance is 3.08 persons per family, with single female/mother families (1,176 | 14.8%) accounting for the largest median family size of 3.37 persons per family. On the other hand, single male/father families (683 | 8.6%) represent the smallest median family size with 2.99 persons per family.
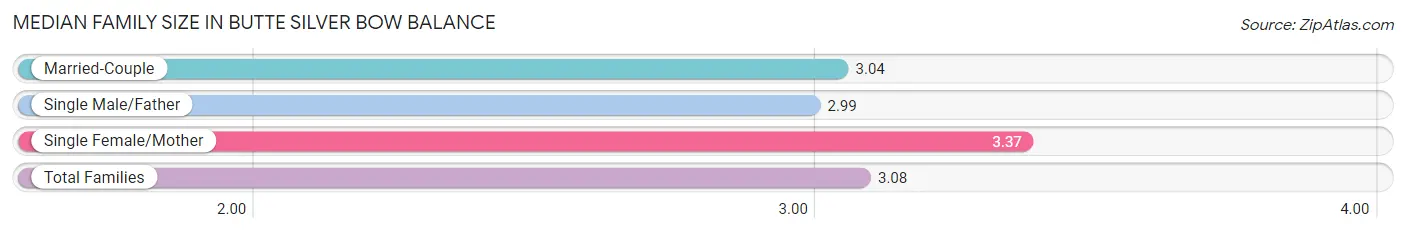
| Family Type | # Families | Family Size |
| Married-Couple | 6,072 (76.6%) | 3.04 |
| Single Male/Father | 683 (8.6%) | 2.99 |
| Single Female/Mother | 1,176 (14.8%) | 3.37 |
| Total Families | 7,931 (100.0%) | 3.08 |
Median Household Size in Butte Silver Bow balance
The median household size in Butte Silver Bow balance is 2.26 persons per household, with single female/mother households (1,176 | 8.0%) accounting for the largest median household size of 3.56 persons per household. non-family households (6,844 | 46.3%) represent the smallest median household size with 1.21 persons per household.
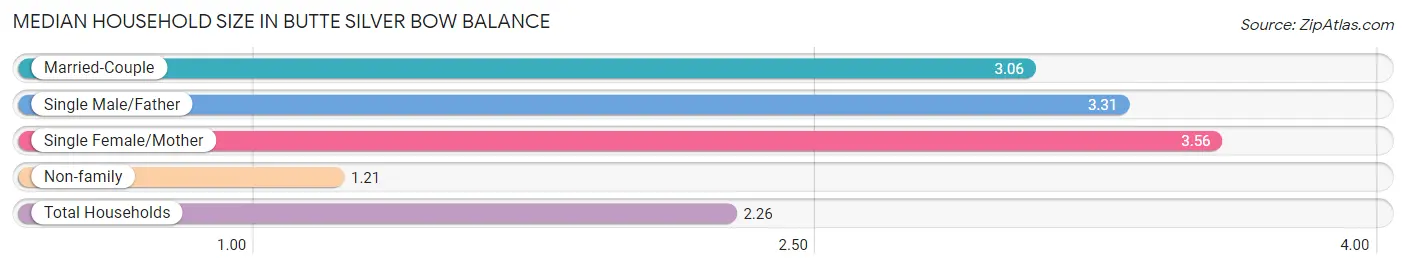
| Household Type | # Households | Household Size |
| Married-Couple | 6,072 (41.1%) | 3.06 |
| Single Male/Father | 683 (4.6%) | 3.31 |
| Single Female/Mother | 1,176 (8.0%) | 3.56 |
| Non-family | 6,844 (46.3%) | 1.21 |
| Total Households | 14,775 (100.0%) | 2.26 |
Household Size by Marriage Status in Butte Silver Bow balance
Out of a total of 14,775 households in Butte Silver Bow balance, 7,931 (53.7%) are family households, while 6,844 (46.3%) are nonfamily households. The most numerous type of family households are 2-person households, comprising 4,003, and the most common type of nonfamily households are 1-person households, comprising 5,814.
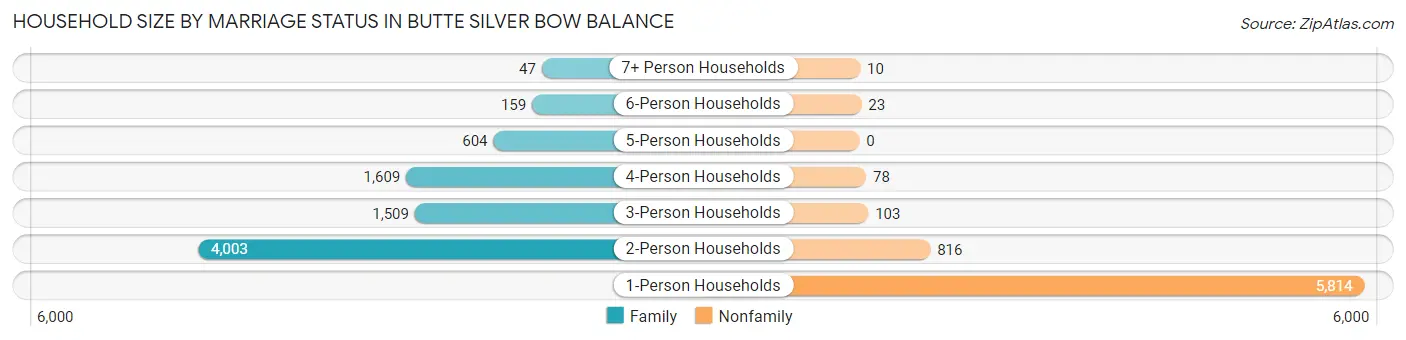
| Household Size | Family Households | Nonfamily Households |
| 1-Person Households | - | 5,814 (39.4%) |
| 2-Person Households | 4,003 (27.1%) | 816 (5.5%) |
| 3-Person Households | 1,509 (10.2%) | 103 (0.7%) |
| 4-Person Households | 1,609 (10.9%) | 78 (0.5%) |
| 5-Person Households | 604 (4.1%) | 0 (0.0%) |
| 6-Person Households | 159 (1.1%) | 23 (0.2%) |
| 7+ Person Households | 47 (0.3%) | 10 (0.1%) |
| Total | 7,931 (53.7%) | 6,844 (46.3%) |
Female Fertility in Butte Silver Bow balance
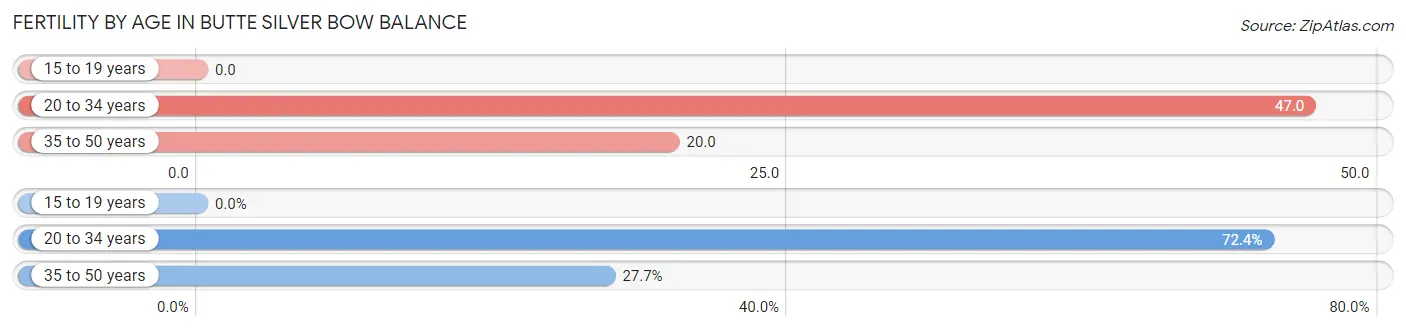
Fertility by Age in Butte Silver Bow balance
Average fertility rate in Butte Silver Bow balance is 29.0 births per 1,000 women. Women in the age bracket of 20 to 34 years have the highest fertility rate with 47.0 births per 1,000 women. Women in the age bracket of 20 to 34 years acount for 72.4% of all women with births.
| Age Bracket | Women with Births | Births / 1,000 Women |
| 15 to 19 years | 0 (0.0%) | 0.0 |
| 20 to 34 years | 157 (72.4%) | 47.0 |
| 35 to 50 years | 60 (27.7%) | 20.0 |
| Total | 217 (100.0%) | 29.0 |
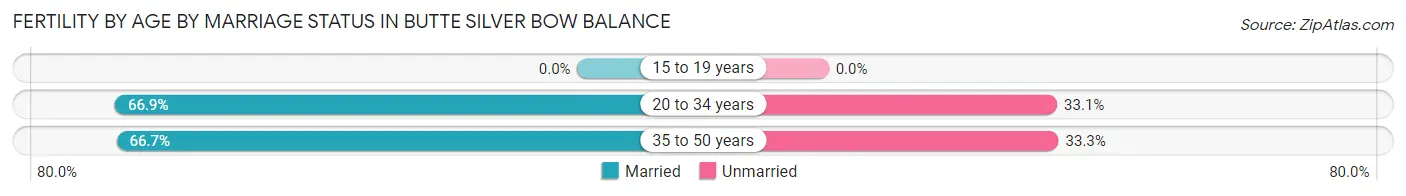
Fertility by Age by Marriage Status in Butte Silver Bow balance
66.8% of women with births (217) in Butte Silver Bow balance are married. The highest percentage of unmarried women with births falls into 35 to 50 years age bracket with 33.3% of them unmarried at the time of birth, while the lowest percentage of unmarried women with births belong to 20 to 34 years age bracket with 33.1% of them unmarried.
| Age Bracket | Married | Unmarried |
| 15 to 19 years | 0 (0.0%) | 0 (0.0%) |
| 20 to 34 years | 105 (66.9%) | 52 (33.1%) |
| 35 to 50 years | 40 (66.7%) | 20 (33.3%) |
| Total | 145 (66.8%) | 72 (33.2%) |
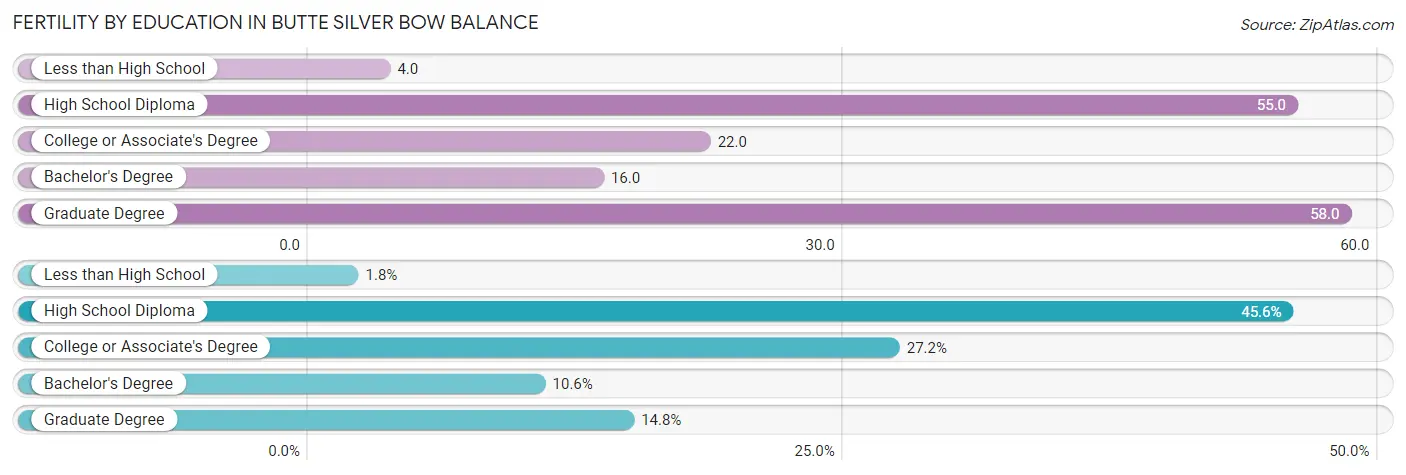
Fertility by Education in Butte Silver Bow balance
Average fertility rate in Butte Silver Bow balance is 29.0 births per 1,000 women. Women with the education attainment of graduate degree have the highest fertility rate of 58.0 births per 1,000 women, while women with the education attainment of less than high school have the lowest fertility at 4.0 births per 1,000 women. Women with the education attainment of high school diploma represent 45.6% of all women with births.
| Educational Attainment | Women with Births | Births / 1,000 Women |
| Less than High School | 4 (1.8%) | 4.0 |
| High School Diploma | 99 (45.6%) | 55.0 |
| College or Associate's Degree | 59 (27.2%) | 22.0 |
| Bachelor's Degree | 23 (10.6%) | 16.0 |
| Graduate Degree | 32 (14.7%) | 58.0 |
| Total | 217 (100.0%) | 29.0 |
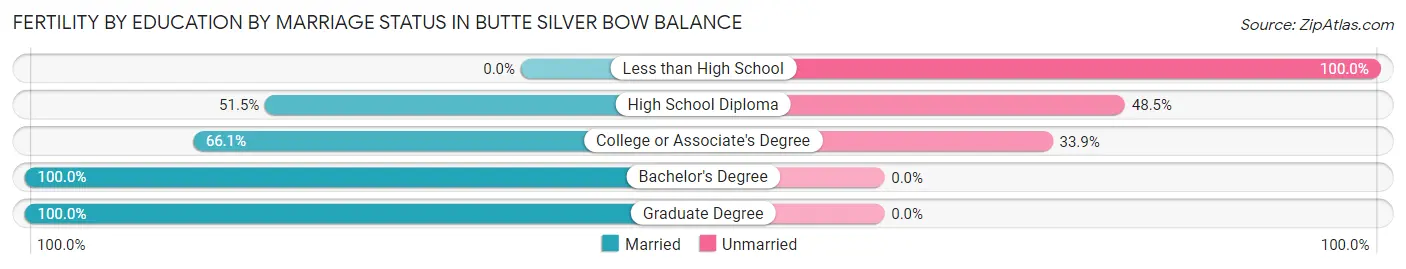
Fertility by Education by Marriage Status in Butte Silver Bow balance
33.2% of women with births in Butte Silver Bow balance are unmarried. Women with the educational attainment of bachelor's degree are most likely to be married with 100.0% of them married at childbirth, while women with the educational attainment of less than high school are least likely to be married with 100.0% of them unmarried at childbirth.
| Educational Attainment | Married | Unmarried |
| Less than High School | 0 (0.0%) | 4 (100.0%) |
| High School Diploma | 51 (51.5%) | 48 (48.5%) |
| College or Associate's Degree | 39 (66.1%) | 20 (33.9%) |
| Bachelor's Degree | 23 (100.0%) | 0 (0.0%) |
| Graduate Degree | 32 (100.0%) | 0 (0.0%) |
| Total | 145 (66.8%) | 72 (33.2%) |
Employment Characteristics in Butte Silver Bow balance
Employment by Class of Employer in Butte Silver Bow balance
Among the 15,995 employed individuals in Butte Silver Bow balance, private company employees (9,487 | 59.3%), not-for-profit organizations (1,996 | 12.5%), and local government employees (1,149 | 7.2%) make up the most common classes of employment.
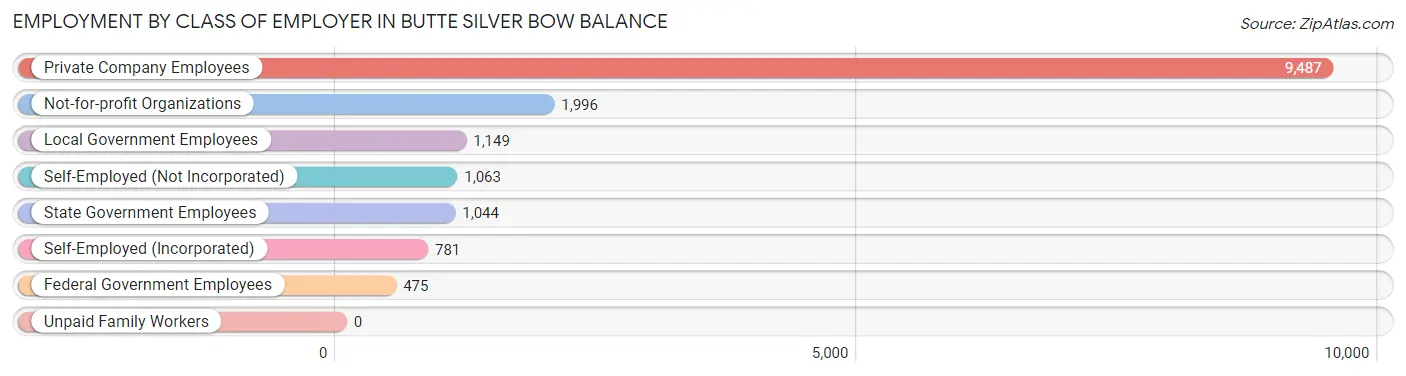
| Employer Class | # Employees | % Employees |
| Private Company Employees | 9,487 | 59.3% |
| Self-Employed (Incorporated) | 781 | 4.9% |
| Self-Employed (Not Incorporated) | 1,063 | 6.7% |
| Not-for-profit Organizations | 1,996 | 12.5% |
| Local Government Employees | 1,149 | 7.2% |
| State Government Employees | 1,044 | 6.5% |
| Federal Government Employees | 475 | 3.0% |
| Unpaid Family Workers | 0 | 0.0% |
| Total | 15,995 | 100.0% |
Employment Status by Age in Butte Silver Bow balance
According to the labor force statistics for Butte Silver Bow balance, out of the total population over 16 years of age (28,244), 60.1% or 16,975 individuals are in the labor force, with 4.5% or 764 of them unemployed. The age group with the highest labor force participation rate is 20 to 24 years, with 84.4% or 2,433 individuals in the labor force. Within the labor force, the 16 to 19 years age range has the highest percentage of unemployed individuals, with 19.2% or 124 of them being unemployed.
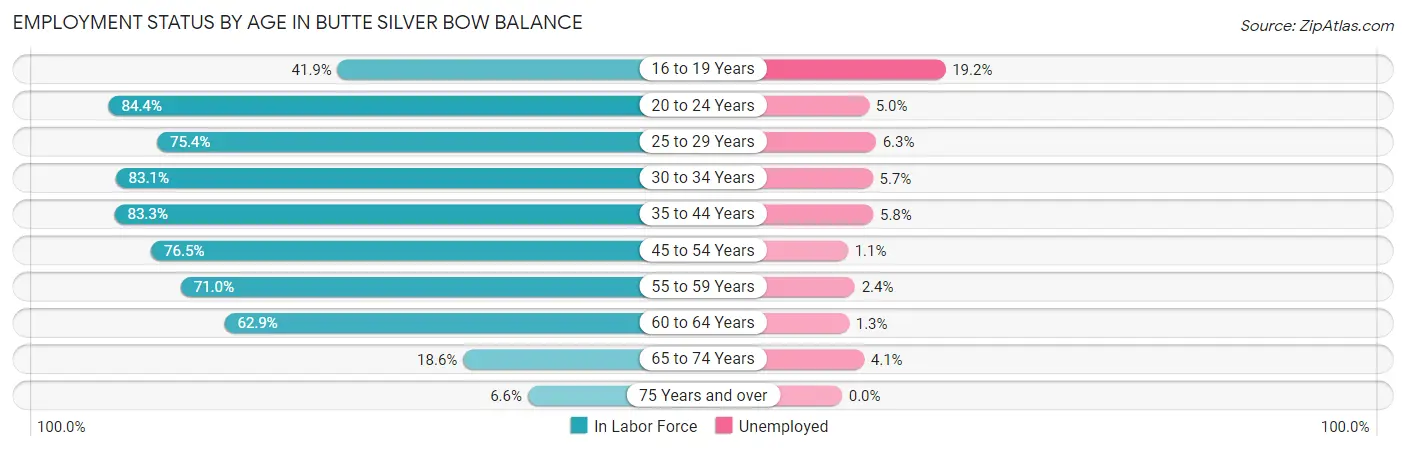
| Age Bracket | In Labor Force | Unemployed |
| 16 to 19 Years | 647 (41.9%) | 124 (19.2%) |
| 20 to 24 Years | 2,433 (84.4%) | 122 (5.0%) |
| 25 to 29 Years | 1,756 (75.4%) | 111 (6.3%) |
| 30 to 34 Years | 1,645 (83.1%) | 94 (5.7%) |
| 35 to 44 Years | 3,414 (83.3%) | 198 (5.8%) |
| 45 to 54 Years | 2,993 (76.5%) | 33 (1.1%) |
| 55 to 59 Years | 1,433 (71.0%) | 34 (2.4%) |
| 60 to 64 Years | 1,723 (62.9%) | 22 (1.3%) |
| 65 to 74 Years | 752 (18.6%) | 31 (4.1%) |
| 75 Years and over | 178 (6.6%) | 0 (0.0%) |
| Total | 16,975 (60.1%) | 764 (4.5%) |
Employment Status by Educational Attainment in Butte Silver Bow balance
According to labor force statistics for Butte Silver Bow balance, 75.9% of individuals (12,962) out of the total population between 25 and 64 years of age (17,078) are in the labor force, with 3.8% or 493 of them being unemployed. The group with the highest labor force participation rate are those with the educational attainment of bachelor's degree or higher, with 86.9% or 4,241 individuals in the labor force. Within the labor force, individuals with high school diploma education have the highest percentage of unemployment, with 5.9% or 225 of them being unemployed.
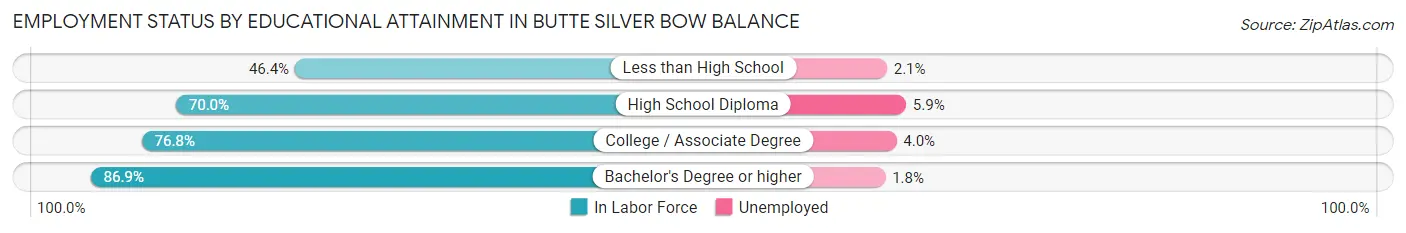
| Educational Attainment | In Labor Force | Unemployed |
| Less than High School | 419 (46.4%) | 19 (2.1%) |
| High School Diploma | 3,820 (70.0%) | 322 (5.9%) |
| College / Associate Degree | 4,484 (76.8%) | 234 (4.0%) |
| Bachelor's Degree or higher | 4,241 (86.9%) | 88 (1.8%) |
| Total | 12,962 (75.9%) | 649 (3.8%) |
Employment Occupations by Sex in Butte Silver Bow balance
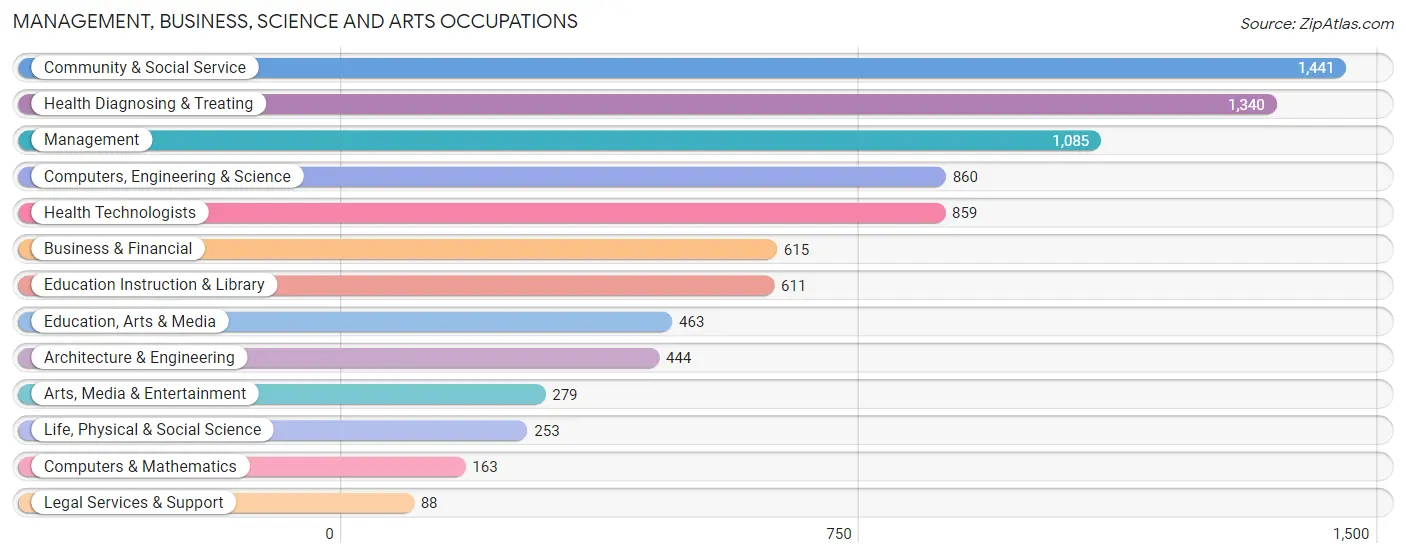
Management, Business, Science and Arts Occupations
The most common Management, Business, Science and Arts occupations in Butte Silver Bow balance are Community & Social Service (1,441 | 8.9%), Health Diagnosing & Treating (1,340 | 8.3%), Management (1,085 | 6.7%), Computers, Engineering & Science (860 | 5.3%), and Health Technologists (859 | 5.3%).
Management, Business, Science and Arts Occupations by Sex
Within the Management, Business, Science and Arts occupations in Butte Silver Bow balance, the most male-oriented occupations are Architecture & Engineering (94.6%), Legal Services & Support (69.3%), and Computers, Engineering & Science (68.1%), while the most female-oriented occupations are Education Instruction & Library (82.0%), Health Technologists (81.6%), and Health Diagnosing & Treating (81.1%).
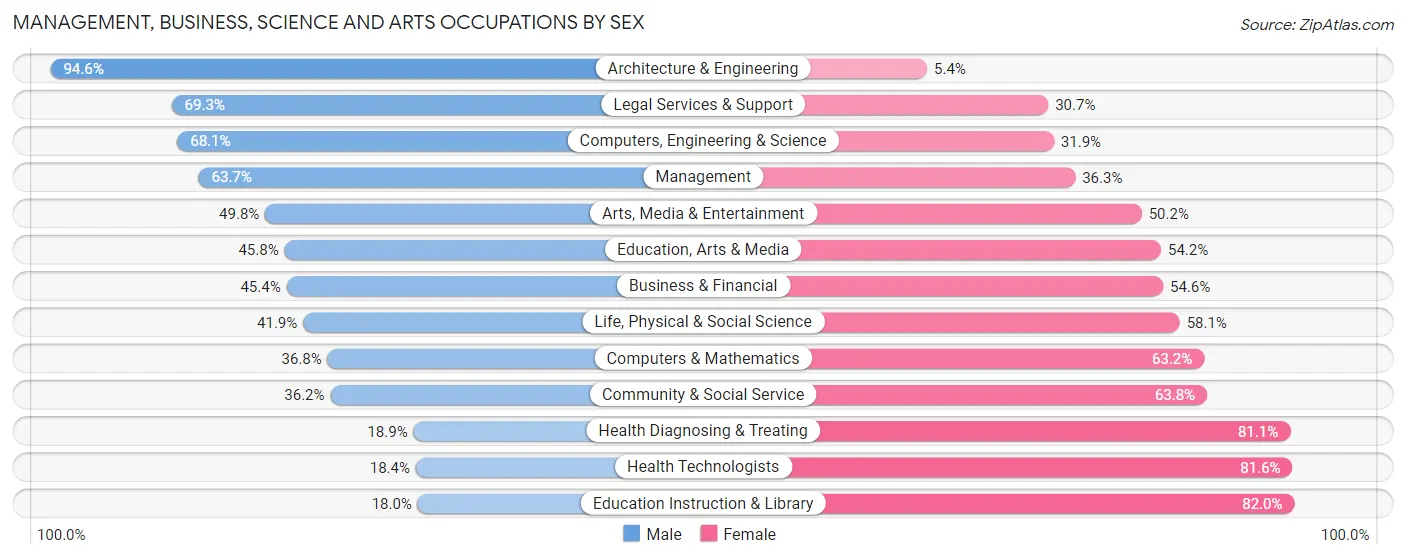
| Occupation | Male | Female |
| Management | 691 (63.7%) | 394 (36.3%) |
| Business & Financial | 279 (45.4%) | 336 (54.6%) |
| Computers, Engineering & Science | 586 (68.1%) | 274 (31.9%) |
| Computers & Mathematics | 60 (36.8%) | 103 (63.2%) |
| Architecture & Engineering | 420 (94.6%) | 24 (5.4%) |
| Life, Physical & Social Science | 106 (41.9%) | 147 (58.1%) |
| Community & Social Service | 522 (36.2%) | 919 (63.8%) |
| Education, Arts & Media | 212 (45.8%) | 251 (54.2%) |
| Legal Services & Support | 61 (69.3%) | 27 (30.7%) |
| Education Instruction & Library | 110 (18.0%) | 501 (82.0%) |
| Arts, Media & Entertainment | 139 (49.8%) | 140 (50.2%) |
| Health Diagnosing & Treating | 253 (18.9%) | 1,087 (81.1%) |
| Health Technologists | 158 (18.4%) | 701 (81.6%) |
| Total (Category) | 2,331 (43.6%) | 3,010 (56.4%) |
| Total (Overall) | 8,589 (53.2%) | 7,550 (46.8%) |
Services Occupations
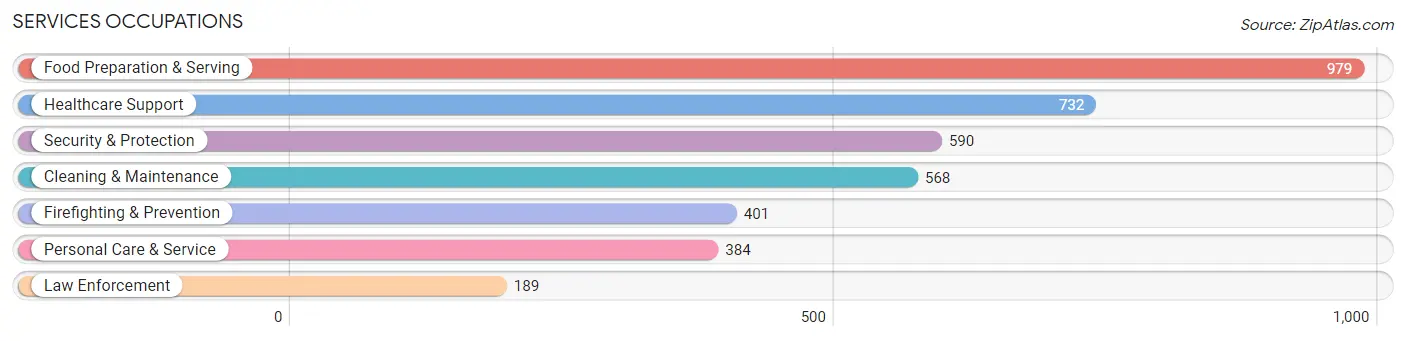
The most common Services occupations in Butte Silver Bow balance are Food Preparation & Serving (979 | 6.1%), Healthcare Support (732 | 4.5%), Security & Protection (590 | 3.7%), Cleaning & Maintenance (568 | 3.5%), and Firefighting & Prevention (401 | 2.5%).
Services Occupations by Sex
Within the Services occupations in Butte Silver Bow balance, the most male-oriented occupations are Law Enforcement (87.8%), Cleaning & Maintenance (85.9%), and Food Preparation & Serving (61.0%), while the most female-oriented occupations are Healthcare Support (79.6%), Personal Care & Service (59.6%), and Firefighting & Prevention (56.6%).
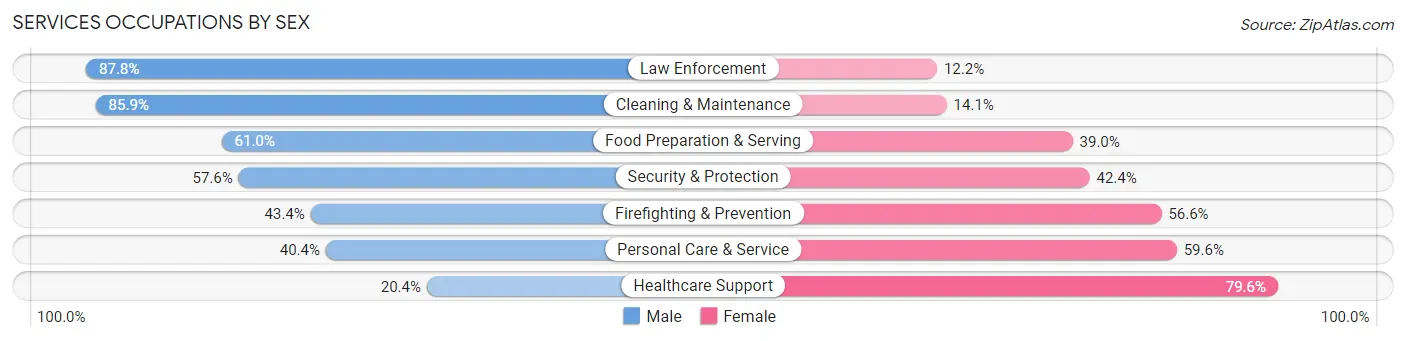
| Occupation | Male | Female |
| Healthcare Support | 149 (20.4%) | 583 (79.6%) |
| Security & Protection | 340 (57.6%) | 250 (42.4%) |
| Firefighting & Prevention | 174 (43.4%) | 227 (56.6%) |
| Law Enforcement | 166 (87.8%) | 23 (12.2%) |
| Food Preparation & Serving | 597 (61.0%) | 382 (39.0%) |
| Cleaning & Maintenance | 488 (85.9%) | 80 (14.1%) |
| Personal Care & Service | 155 (40.4%) | 229 (59.6%) |
| Total (Category) | 1,729 (53.1%) | 1,524 (46.9%) |
| Total (Overall) | 8,589 (53.2%) | 7,550 (46.8%) |
Sales and Office Occupations
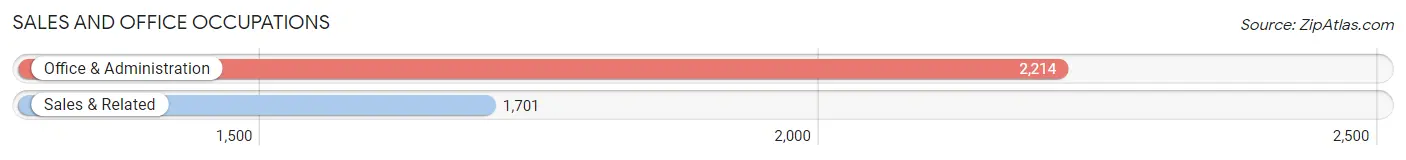
The most common Sales and Office occupations in Butte Silver Bow balance are Office & Administration (2,214 | 13.7%), and Sales & Related (1,701 | 10.5%).
Sales and Office Occupations by Sex
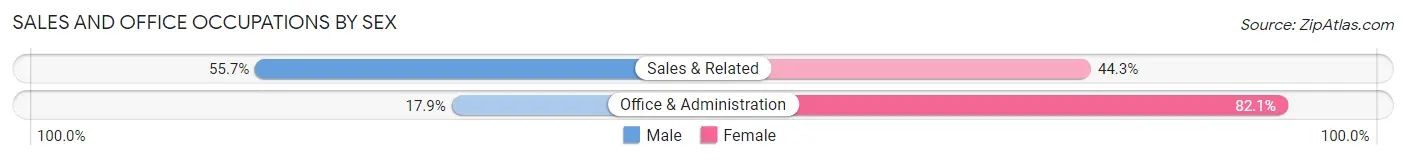
| Occupation | Male | Female |
| Sales & Related | 947 (55.7%) | 754 (44.3%) |
| Office & Administration | 396 (17.9%) | 1,818 (82.1%) |
| Total (Category) | 1,343 (34.3%) | 2,572 (65.7%) |
| Total (Overall) | 8,589 (53.2%) | 7,550 (46.8%) |
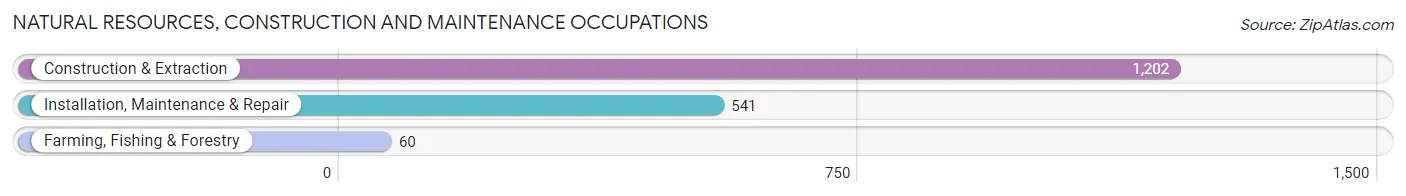
Natural Resources, Construction and Maintenance Occupations
The most common Natural Resources, Construction and Maintenance occupations in Butte Silver Bow balance are Construction & Extraction (1,202 | 7.4%), Installation, Maintenance & Repair (541 | 3.4%), and Farming, Fishing & Forestry (60 | 0.4%).
Natural Resources, Construction and Maintenance Occupations by Sex
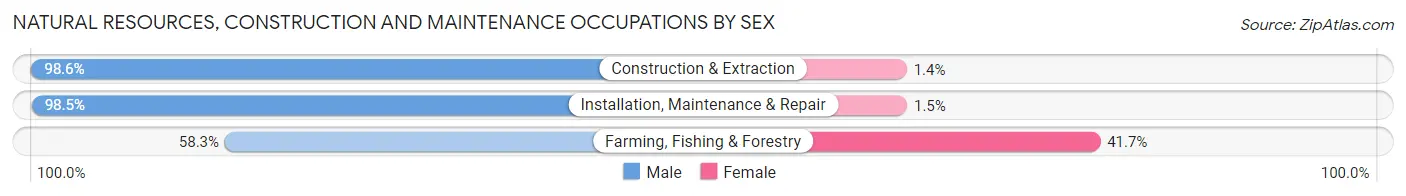
| Occupation | Male | Female |
| Farming, Fishing & Forestry | 35 (58.3%) | 25 (41.7%) |
| Construction & Extraction | 1,185 (98.6%) | 17 (1.4%) |
| Installation, Maintenance & Repair | 533 (98.5%) | 8 (1.5%) |
| Total (Category) | 1,753 (97.2%) | 50 (2.8%) |
| Total (Overall) | 8,589 (53.2%) | 7,550 (46.8%) |
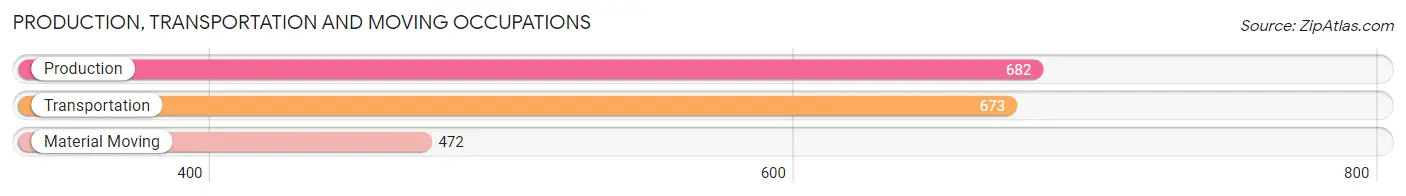
Production, Transportation and Moving Occupations
The most common Production, Transportation and Moving occupations in Butte Silver Bow balance are Production (682 | 4.2%), Transportation (673 | 4.2%), and Material Moving (472 | 2.9%).
Production, Transportation and Moving Occupations by Sex
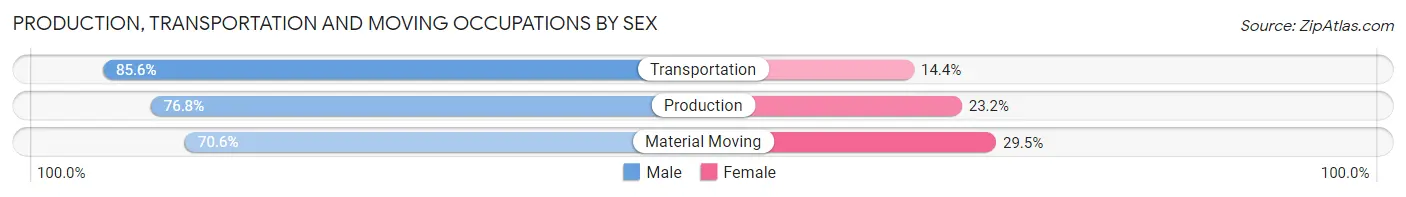
| Occupation | Male | Female |
| Production | 524 (76.8%) | 158 (23.2%) |
| Transportation | 576 (85.6%) | 97 (14.4%) |
| Material Moving | 333 (70.6%) | 139 (29.4%) |
| Total (Category) | 1,433 (78.4%) | 394 (21.6%) |
| Total (Overall) | 8,589 (53.2%) | 7,550 (46.8%) |
Employment Industries by Sex in Butte Silver Bow balance
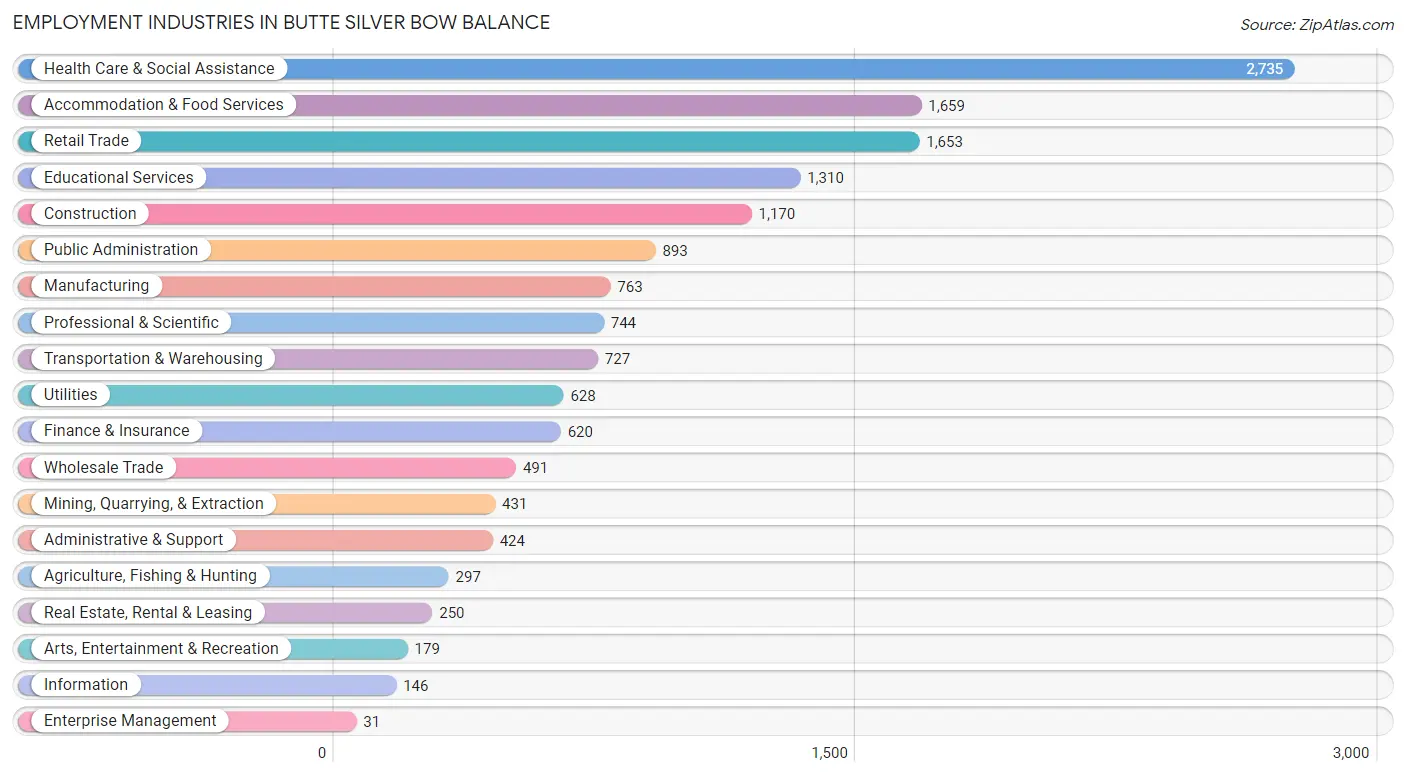
Employment Industries in Butte Silver Bow balance
The major employment industries in Butte Silver Bow balance include Health Care & Social Assistance (2,735 | 17.0%), Accommodation & Food Services (1,659 | 10.3%), Retail Trade (1,653 | 10.2%), Educational Services (1,310 | 8.1%), and Construction (1,170 | 7.2%).
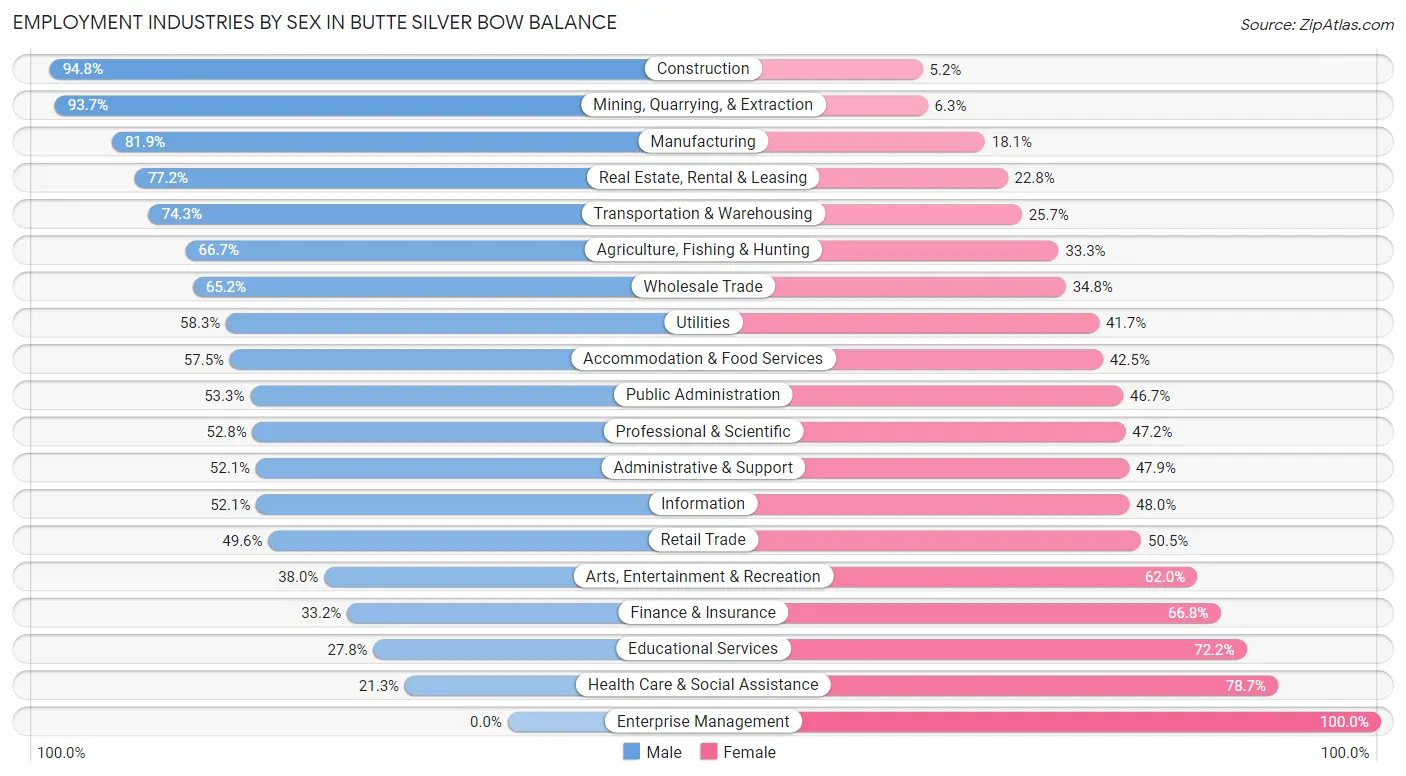
Employment Industries by Sex in Butte Silver Bow balance
The Butte Silver Bow balance industries that see more men than women are Construction (94.8%), Mining, Quarrying, & Extraction (93.7%), and Manufacturing (81.9%), whereas the industries that tend to have a higher number of women are Enterprise Management (100.0%), Health Care & Social Assistance (78.7%), and Educational Services (72.2%).
| Industry | Male | Female |
| Agriculture, Fishing & Hunting | 198 (66.7%) | 99 (33.3%) |
| Mining, Quarrying, & Extraction | 404 (93.7%) | 27 (6.3%) |
| Construction | 1,109 (94.8%) | 61 (5.2%) |
| Manufacturing | 625 (81.9%) | 138 (18.1%) |
| Wholesale Trade | 320 (65.2%) | 171 (34.8%) |
| Retail Trade | 819 (49.5%) | 834 (50.4%) |
| Transportation & Warehousing | 540 (74.3%) | 187 (25.7%) |
| Utilities | 366 (58.3%) | 262 (41.7%) |
| Information | 76 (52.0%) | 70 (47.9%) |
| Finance & Insurance | 206 (33.2%) | 414 (66.8%) |
| Real Estate, Rental & Leasing | 193 (77.2%) | 57 (22.8%) |
| Professional & Scientific | 393 (52.8%) | 351 (47.2%) |
| Enterprise Management | 0 (0.0%) | 31 (100.0%) |
| Administrative & Support | 221 (52.1%) | 203 (47.9%) |
| Educational Services | 364 (27.8%) | 946 (72.2%) |
| Health Care & Social Assistance | 582 (21.3%) | 2,153 (78.7%) |
| Arts, Entertainment & Recreation | 68 (38.0%) | 111 (62.0%) |
| Accommodation & Food Services | 954 (57.5%) | 705 (42.5%) |
| Public Administration | 476 (53.3%) | 417 (46.7%) |
| Total | 8,589 (53.2%) | 7,550 (46.8%) |
Education in Butte Silver Bow balance
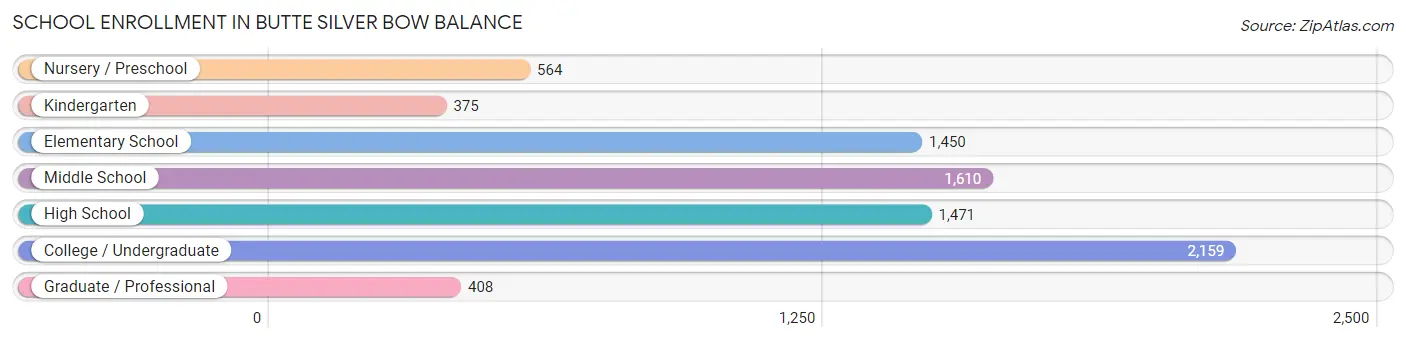
School Enrollment in Butte Silver Bow balance
The most common levels of schooling among the 8,037 students in Butte Silver Bow balance are college / undergraduate (2,159 | 26.9%), middle school (1,610 | 20.0%), and high school (1,471 | 18.3%).
| School Level | # Students | % Students |
| Nursery / Preschool | 564 | 7.0% |
| Kindergarten | 375 | 4.7% |
| Elementary School | 1,450 | 18.0% |
| Middle School | 1,610 | 20.0% |
| High School | 1,471 | 18.3% |
| College / Undergraduate | 2,159 | 26.9% |
| Graduate / Professional | 408 | 5.1% |
| Total | 8,037 | 100.0% |
School Enrollment by Age by Funding Source in Butte Silver Bow balance
Out of a total of 8,037 students who are enrolled in schools in Butte Silver Bow balance, 981 (12.2%) attend a private institution, while the remaining 7,056 (87.8%) are enrolled in public schools. The age group of 3 to 4 year olds has the highest likelihood of being enrolled in private schools, with 296 (60.2% in the age bracket) enrolled. Conversely, the age group of 20 to 24 year olds has the lowest likelihood of being enrolled in a private school, with 1,416 (99.6% in the age bracket) attending a public institution.
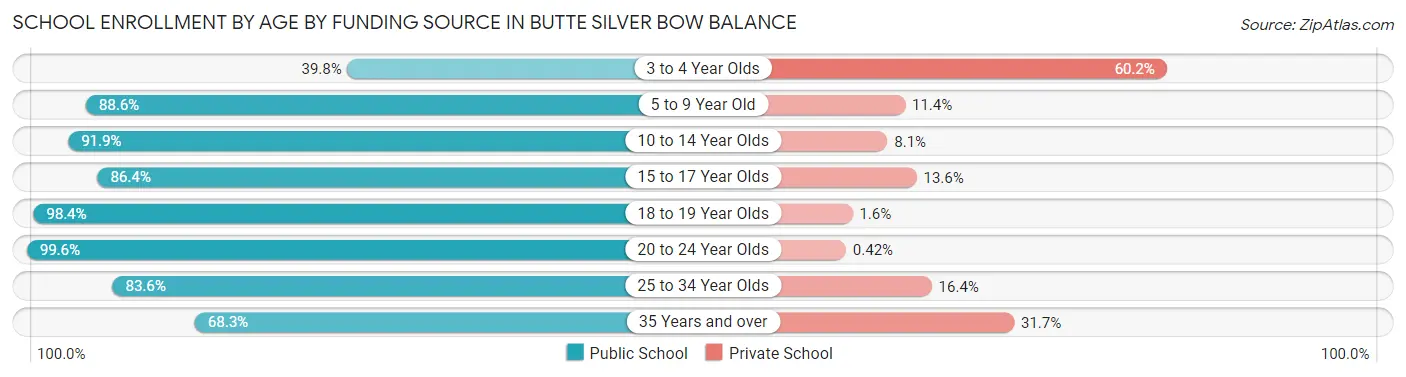
| Age Bracket | Public School | Private School |
| 3 to 4 Year Olds | 196 (39.8%) | 296 (60.2%) |
| 5 to 9 Year Old | 1,464 (88.6%) | 189 (11.4%) |
| 10 to 14 Year Olds | 1,843 (91.9%) | 163 (8.1%) |
| 15 to 17 Year Olds | 929 (86.4%) | 146 (13.6%) |
| 18 to 19 Year Olds | 659 (98.4%) | 11 (1.6%) |
| 20 to 24 Year Olds | 1,416 (99.6%) | 6 (0.4%) |
| 25 to 34 Year Olds | 306 (83.6%) | 60 (16.4%) |
| 35 Years and over | 241 (68.3%) | 112 (31.7%) |
| Total | 7,056 (87.8%) | 981 (12.2%) |
Educational Attainment by Field of Study in Butte Silver Bow balance
Education (1,266 | 16.8%), business (1,236 | 16.4%), science & technology (1,049 | 13.9%), engineering (732 | 9.7%), and computers & mathematics (594 | 7.9%) are the most common fields of study among 7,555 individuals in Butte Silver Bow balance who have obtained a bachelor's degree or higher.
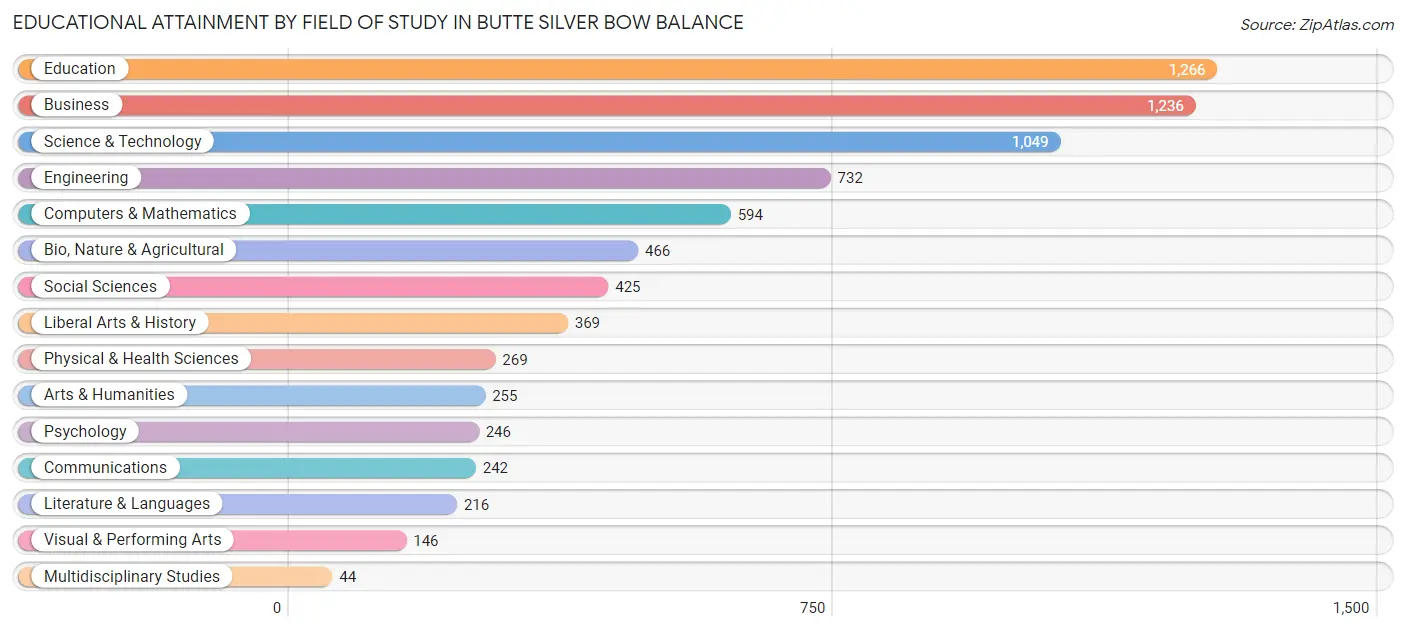
| Field of Study | # Graduates | % Graduates |
| Computers & Mathematics | 594 | 7.9% |
| Bio, Nature & Agricultural | 466 | 6.2% |
| Physical & Health Sciences | 269 | 3.6% |
| Psychology | 246 | 3.3% |
| Social Sciences | 425 | 5.6% |
| Engineering | 732 | 9.7% |
| Multidisciplinary Studies | 44 | 0.6% |
| Science & Technology | 1,049 | 13.9% |
| Business | 1,236 | 16.4% |
| Education | 1,266 | 16.8% |
| Literature & Languages | 216 | 2.9% |
| Liberal Arts & History | 369 | 4.9% |
| Visual & Performing Arts | 146 | 1.9% |
| Communications | 242 | 3.2% |
| Arts & Humanities | 255 | 3.4% |
| Total | 7,555 | 100.0% |
Transportation & Commute in Butte Silver Bow balance
Vehicle Availability by Sex in Butte Silver Bow balance
The most prevalent vehicle ownership categories in Butte Silver Bow balance are males with 2 vehicles (3,003, accounting for 35.8%) and females with 2 vehicles (2,279, making up 40.9%).
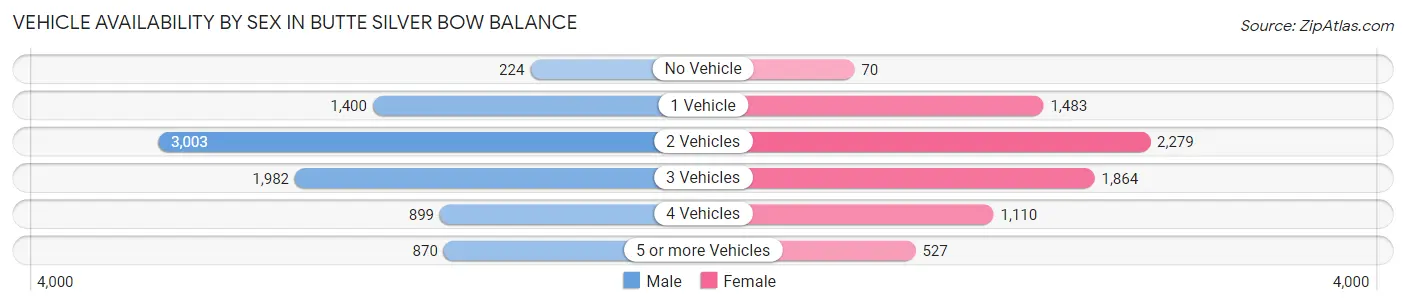
| Vehicles Available | Male | Female |
| No Vehicle | 224 (2.7%) | 70 (0.9%) |
| 1 Vehicle | 1,400 (16.7%) | 1,483 (20.2%) |
| 2 Vehicles | 3,003 (35.8%) | 2,279 (31.1%) |
| 3 Vehicles | 1,982 (23.7%) | 1,864 (25.4%) |
| 4 Vehicles | 899 (10.7%) | 1,110 (15.1%) |
| 5 or more Vehicles | 870 (10.4%) | 527 (7.2%) |
| Total | 8,378 (100.0%) | 7,333 (100.0%) |
Commute Time in Butte Silver Bow balance
The most frequently occuring commute durations in Butte Silver Bow balance are 10 to 14 minutes (3,825 commuters, 25.6%), 5 to 9 minutes (3,029 commuters, 20.3%), and 15 to 19 minutes (2,878 commuters, 19.3%).
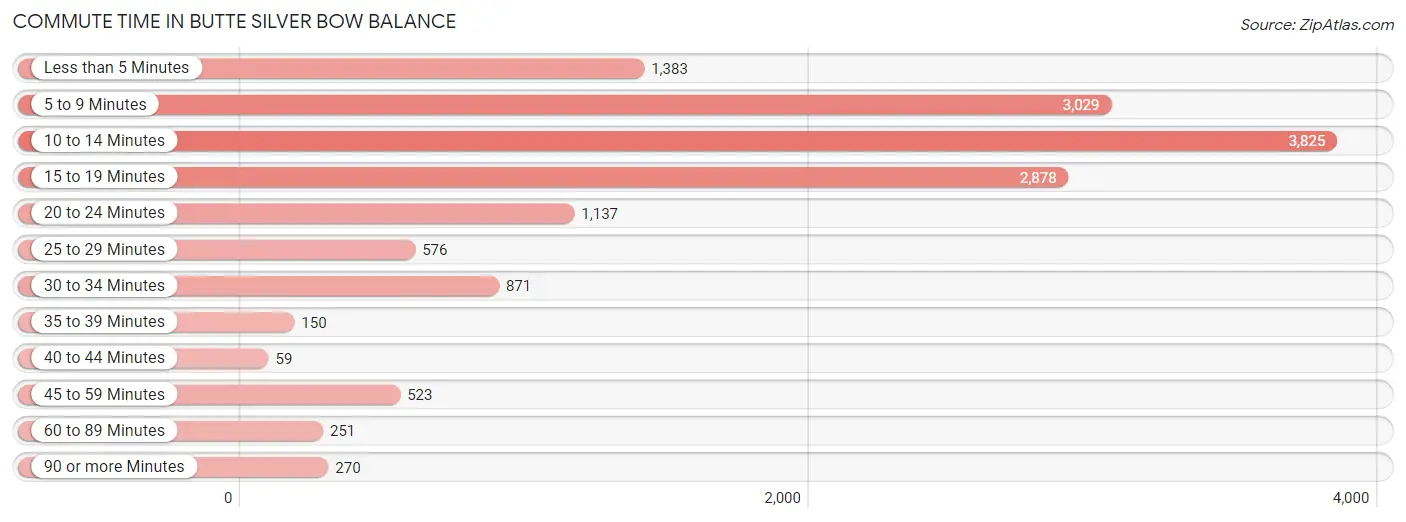
| Commute Time | # Commuters | % Commuters |
| Less than 5 Minutes | 1,383 | 9.2% |
| 5 to 9 Minutes | 3,029 | 20.3% |
| 10 to 14 Minutes | 3,825 | 25.6% |
| 15 to 19 Minutes | 2,878 | 19.3% |
| 20 to 24 Minutes | 1,137 | 7.6% |
| 25 to 29 Minutes | 576 | 3.8% |
| 30 to 34 Minutes | 871 | 5.8% |
| 35 to 39 Minutes | 150 | 1.0% |
| 40 to 44 Minutes | 59 | 0.4% |
| 45 to 59 Minutes | 523 | 3.5% |
| 60 to 89 Minutes | 251 | 1.7% |
| 90 or more Minutes | 270 | 1.8% |
Commute Time by Sex in Butte Silver Bow balance
The most common commute times in Butte Silver Bow balance are 10 to 14 minutes (2,120 commuters, 26.1%) for males and 10 to 14 minutes (1,705 commuters, 24.9%) for females.
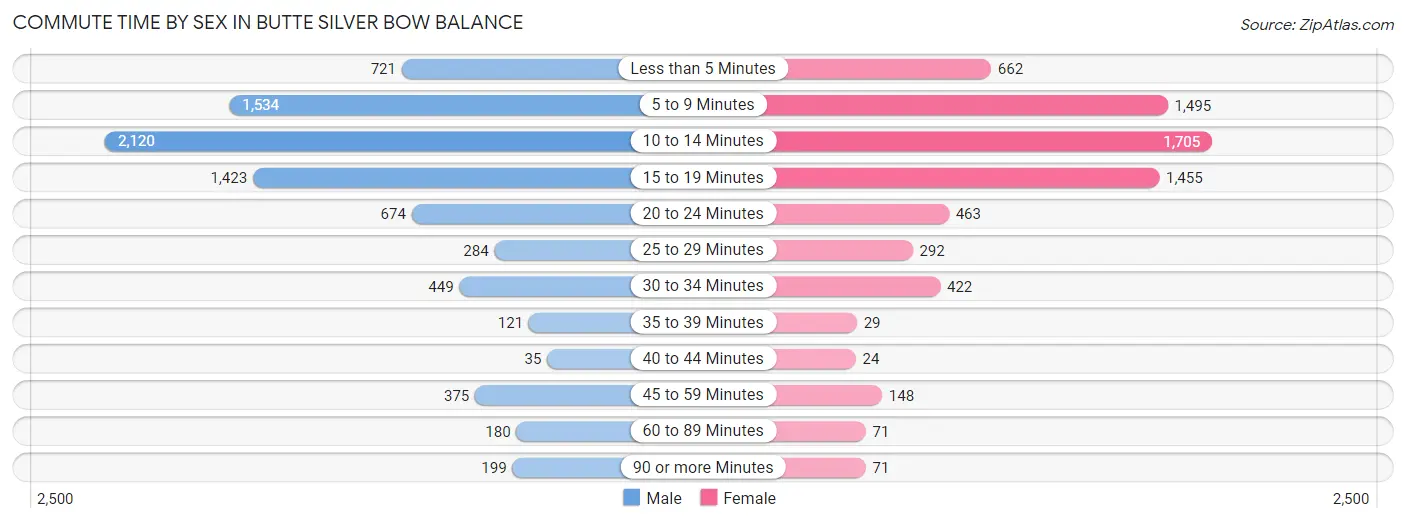
| Commute Time | Male | Female |
| Less than 5 Minutes | 721 (8.9%) | 662 (9.7%) |
| 5 to 9 Minutes | 1,534 (18.9%) | 1,495 (21.9%) |
| 10 to 14 Minutes | 2,120 (26.1%) | 1,705 (24.9%) |
| 15 to 19 Minutes | 1,423 (17.5%) | 1,455 (21.3%) |
| 20 to 24 Minutes | 674 (8.3%) | 463 (6.8%) |
| 25 to 29 Minutes | 284 (3.5%) | 292 (4.3%) |
| 30 to 34 Minutes | 449 (5.5%) | 422 (6.2%) |
| 35 to 39 Minutes | 121 (1.5%) | 29 (0.4%) |
| 40 to 44 Minutes | 35 (0.4%) | 24 (0.4%) |
| 45 to 59 Minutes | 375 (4.6%) | 148 (2.2%) |
| 60 to 89 Minutes | 180 (2.2%) | 71 (1.0%) |
| 90 or more Minutes | 199 (2.5%) | 71 (1.0%) |
Time of Departure to Work by Sex in Butte Silver Bow balance
The most frequent times of departure to work in Butte Silver Bow balance are 7:30 AM to 7:59 AM (1,427, 17.6%) for males and 7:30 AM to 7:59 AM (1,561, 22.8%) for females.
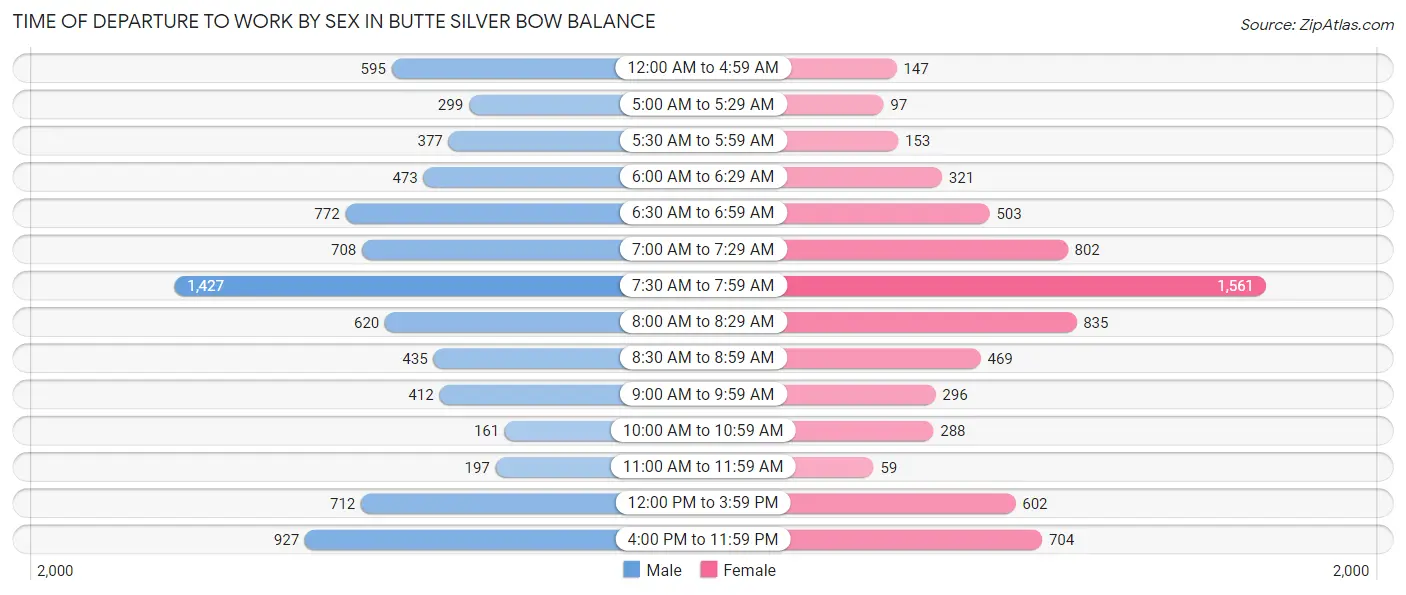
| Time of Departure | Male | Female |
| 12:00 AM to 4:59 AM | 595 (7.3%) | 147 (2.1%) |
| 5:00 AM to 5:29 AM | 299 (3.7%) | 97 (1.4%) |
| 5:30 AM to 5:59 AM | 377 (4.6%) | 153 (2.2%) |
| 6:00 AM to 6:29 AM | 473 (5.8%) | 321 (4.7%) |
| 6:30 AM to 6:59 AM | 772 (9.5%) | 503 (7.4%) |
| 7:00 AM to 7:29 AM | 708 (8.7%) | 802 (11.7%) |
| 7:30 AM to 7:59 AM | 1,427 (17.6%) | 1,561 (22.8%) |
| 8:00 AM to 8:29 AM | 620 (7.6%) | 835 (12.2%) |
| 8:30 AM to 8:59 AM | 435 (5.4%) | 469 (6.9%) |
| 9:00 AM to 9:59 AM | 412 (5.1%) | 296 (4.3%) |
| 10:00 AM to 10:59 AM | 161 (2.0%) | 288 (4.2%) |
| 11:00 AM to 11:59 AM | 197 (2.4%) | 59 (0.9%) |
| 12:00 PM to 3:59 PM | 712 (8.8%) | 602 (8.8%) |
| 4:00 PM to 11:59 PM | 927 (11.4%) | 704 (10.3%) |
| Total | 8,115 (100.0%) | 6,837 (100.0%) |
Housing Occupancy in Butte Silver Bow balance
Occupancy by Ownership in Butte Silver Bow balance
Of the total 14,775 dwellings in Butte Silver Bow balance, owner-occupied units account for 10,368 (70.2%), while renter-occupied units make up 4,407 (29.8%).
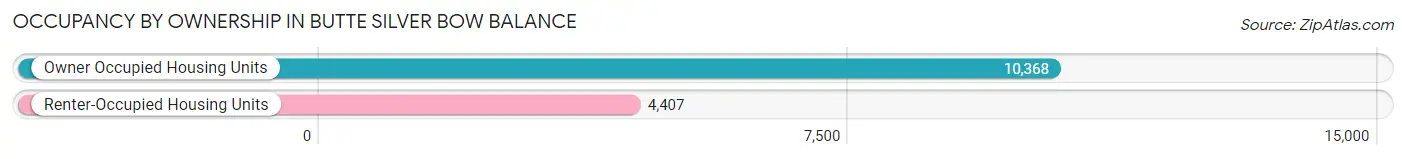
| Occupancy | # Housing Units | % Housing Units |
| Owner Occupied Housing Units | 10,368 | 70.2% |
| Renter-Occupied Housing Units | 4,407 | 29.8% |
| Total Occupied Housing Units | 14,775 | 100.0% |
Occupancy by Household Size in Butte Silver Bow balance
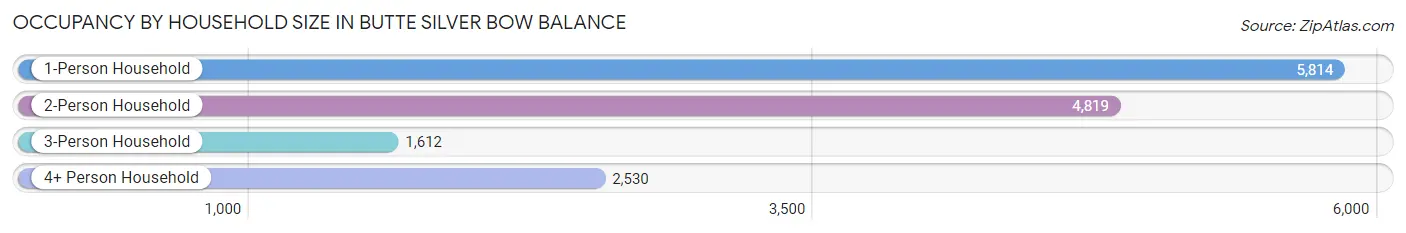
| Household Size | # Housing Units | % Housing Units |
| 1-Person Household | 5,814 | 39.4% |
| 2-Person Household | 4,819 | 32.6% |
| 3-Person Household | 1,612 | 10.9% |
| 4+ Person Household | 2,530 | 17.1% |
| Total Housing Units | 14,775 | 100.0% |
Occupancy by Ownership by Household Size in Butte Silver Bow balance
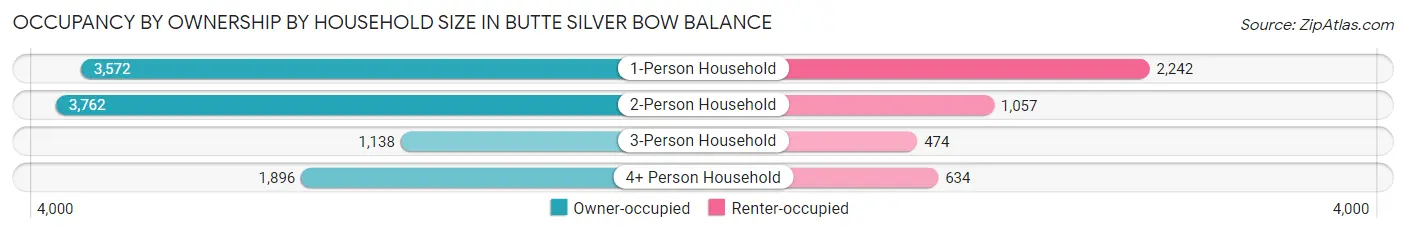
| Household Size | Owner-occupied | Renter-occupied |
| 1-Person Household | 3,572 (61.4%) | 2,242 (38.6%) |
| 2-Person Household | 3,762 (78.1%) | 1,057 (21.9%) |
| 3-Person Household | 1,138 (70.6%) | 474 (29.4%) |
| 4+ Person Household | 1,896 (74.9%) | 634 (25.1%) |
| Total Housing Units | 10,368 (70.2%) | 4,407 (29.8%) |
Occupancy by Educational Attainment in Butte Silver Bow balance
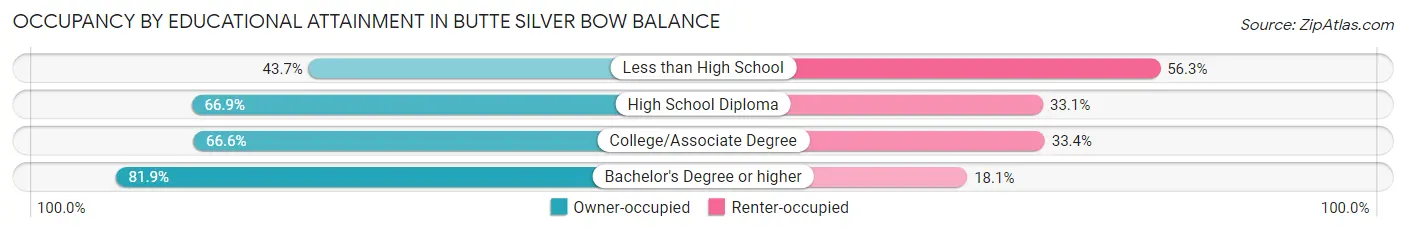
| Household Size | Owner-occupied | Renter-occupied |
| Less than High School | 342 (43.7%) | 441 (56.3%) |
| High School Diploma | 2,969 (66.9%) | 1,468 (33.1%) |
| College/Associate Degree | 3,345 (66.6%) | 1,680 (33.4%) |
| Bachelor's Degree or higher | 3,712 (81.9%) | 818 (18.1%) |
Occupancy by Age of Householder in Butte Silver Bow balance
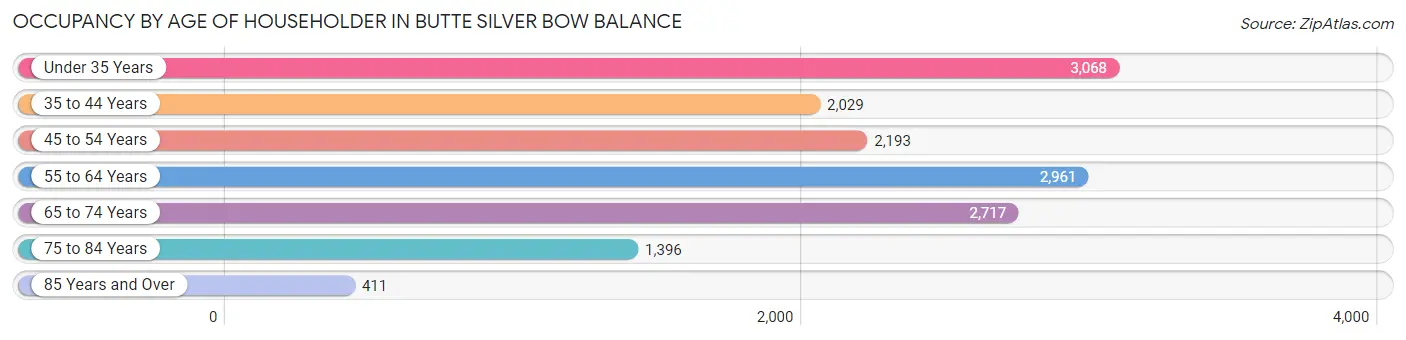
| Age Bracket | # Households | % Households |
| Under 35 Years | 3,068 | 20.8% |
| 35 to 44 Years | 2,029 | 13.7% |
| 45 to 54 Years | 2,193 | 14.8% |
| 55 to 64 Years | 2,961 | 20.0% |
| 65 to 74 Years | 2,717 | 18.4% |
| 75 to 84 Years | 1,396 | 9.5% |
| 85 Years and Over | 411 | 2.8% |
| Total | 14,775 | 100.0% |
Housing Finances in Butte Silver Bow balance
Median Income by Occupancy in Butte Silver Bow balance
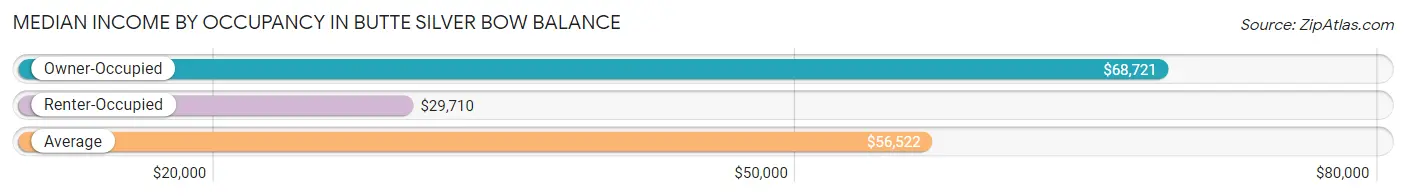
| Occupancy Type | # Households | Median Income |
| Owner-Occupied | 10,368 (70.2%) | $68,721 |
| Renter-Occupied | 4,407 (29.8%) | $29,710 |
| Average | 14,775 (100.0%) | $56,522 |
Occupancy by Householder Income Bracket in Butte Silver Bow balance
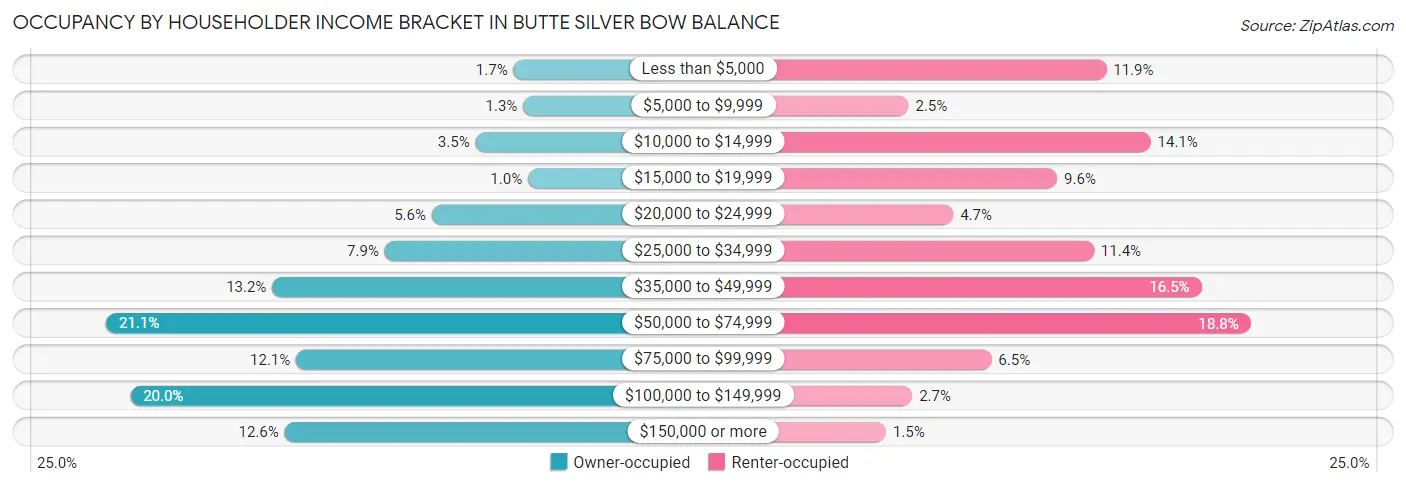
| Income Bracket | Owner-occupied | Renter-occupied |
| Less than $5,000 | 178 (1.7%) | 526 (11.9%) |
| $5,000 to $9,999 | 131 (1.3%) | 111 (2.5%) |
| $10,000 to $14,999 | 366 (3.5%) | 619 (14.1%) |
| $15,000 to $19,999 | 107 (1.0%) | 423 (9.6%) |
| $20,000 to $24,999 | 582 (5.6%) | 205 (4.6%) |
| $25,000 to $34,999 | 814 (7.9%) | 500 (11.4%) |
| $35,000 to $49,999 | 1,370 (13.2%) | 726 (16.5%) |
| $50,000 to $74,999 | 2,190 (21.1%) | 829 (18.8%) |
| $75,000 to $99,999 | 1,251 (12.1%) | 285 (6.5%) |
| $100,000 to $149,999 | 2,071 (20.0%) | 119 (2.7%) |
| $150,000 or more | 1,308 (12.6%) | 64 (1.5%) |
| Total | 10,368 (100.0%) | 4,407 (100.0%) |
Monthly Housing Cost Tiers in Butte Silver Bow balance
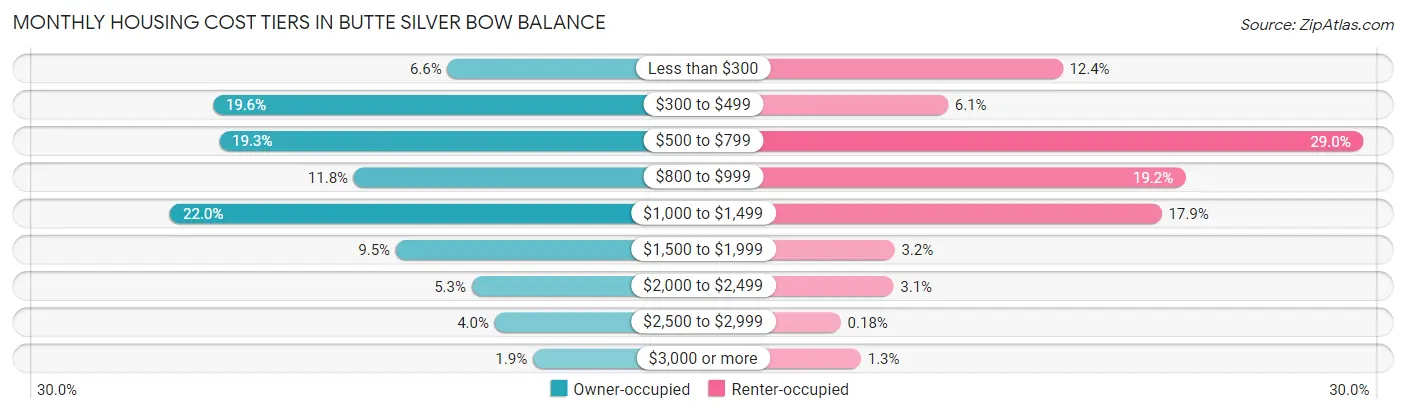
| Monthly Cost | Owner-occupied | Renter-occupied |
| Less than $300 | 688 (6.6%) | 548 (12.4%) |
| $300 to $499 | 2,032 (19.6%) | 269 (6.1%) |
| $500 to $799 | 1,997 (19.3%) | 1,278 (29.0%) |
| $800 to $999 | 1,224 (11.8%) | 846 (19.2%) |
| $1,000 to $1,499 | 2,277 (22.0%) | 789 (17.9%) |
| $1,500 to $1,999 | 984 (9.5%) | 139 (3.2%) |
| $2,000 to $2,499 | 549 (5.3%) | 136 (3.1%) |
| $2,500 to $2,999 | 418 (4.0%) | 8 (0.2%) |
| $3,000 or more | 199 (1.9%) | 57 (1.3%) |
| Total | 10,368 (100.0%) | 4,407 (100.0%) |
Physical Housing Characteristics in Butte Silver Bow balance
Housing Structures in Butte Silver Bow balance
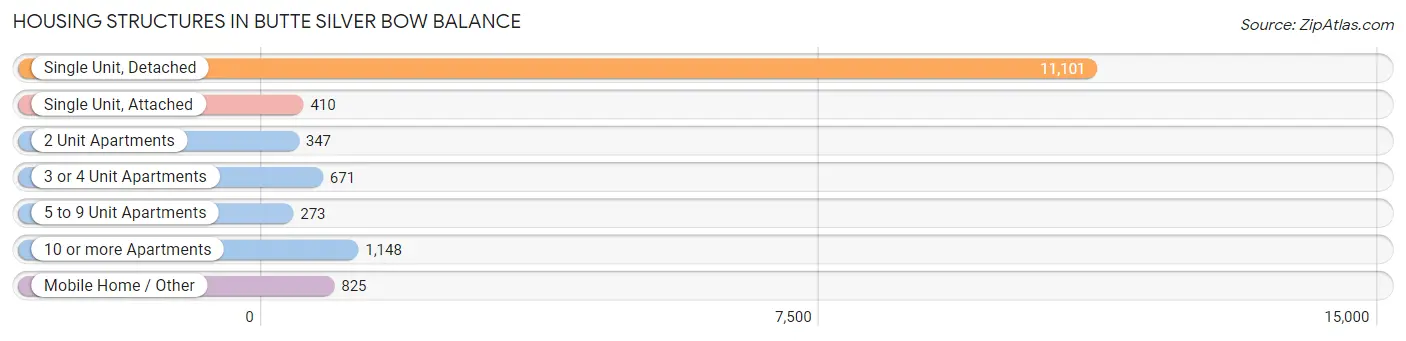
| Structure Type | # Housing Units | % Housing Units |
| Single Unit, Detached | 11,101 | 75.1% |
| Single Unit, Attached | 410 | 2.8% |
| 2 Unit Apartments | 347 | 2.4% |
| 3 or 4 Unit Apartments | 671 | 4.5% |
| 5 to 9 Unit Apartments | 273 | 1.8% |
| 10 or more Apartments | 1,148 | 7.8% |
| Mobile Home / Other | 825 | 5.6% |
| Total | 14,775 | 100.0% |
Housing Structures by Occupancy in Butte Silver Bow balance
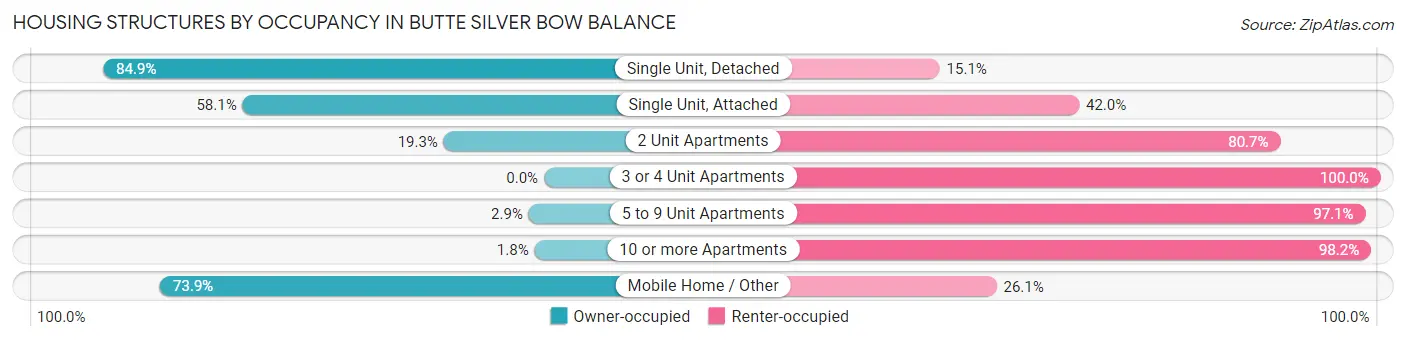
| Structure Type | Owner-occupied | Renter-occupied |
| Single Unit, Detached | 9,424 (84.9%) | 1,677 (15.1%) |
| Single Unit, Attached | 238 (58.1%) | 172 (41.9%) |
| 2 Unit Apartments | 67 (19.3%) | 280 (80.7%) |
| 3 or 4 Unit Apartments | 0 (0.0%) | 671 (100.0%) |
| 5 to 9 Unit Apartments | 8 (2.9%) | 265 (97.1%) |
| 10 or more Apartments | 21 (1.8%) | 1,127 (98.2%) |
| Mobile Home / Other | 610 (73.9%) | 215 (26.1%) |
| Total | 10,368 (70.2%) | 4,407 (29.8%) |
Housing Structures by Number of Rooms in Butte Silver Bow balance
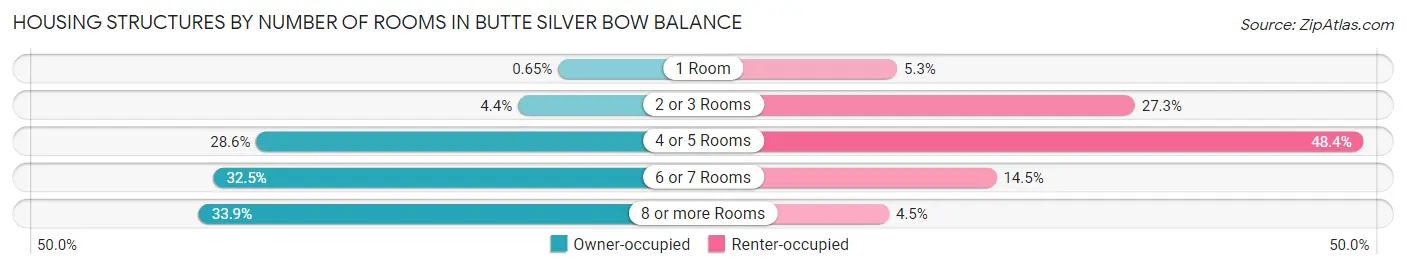
| Number of Rooms | Owner-occupied | Renter-occupied |
| 1 Room | 67 (0.6%) | 233 (5.3%) |
| 2 or 3 Rooms | 453 (4.4%) | 1,202 (27.3%) |
| 4 or 5 Rooms | 2,962 (28.6%) | 2,134 (48.4%) |
| 6 or 7 Rooms | 3,373 (32.5%) | 638 (14.5%) |
| 8 or more Rooms | 3,513 (33.9%) | 200 (4.5%) |
| Total | 10,368 (100.0%) | 4,407 (100.0%) |
Housing Structure by Heating Type in Butte Silver Bow balance
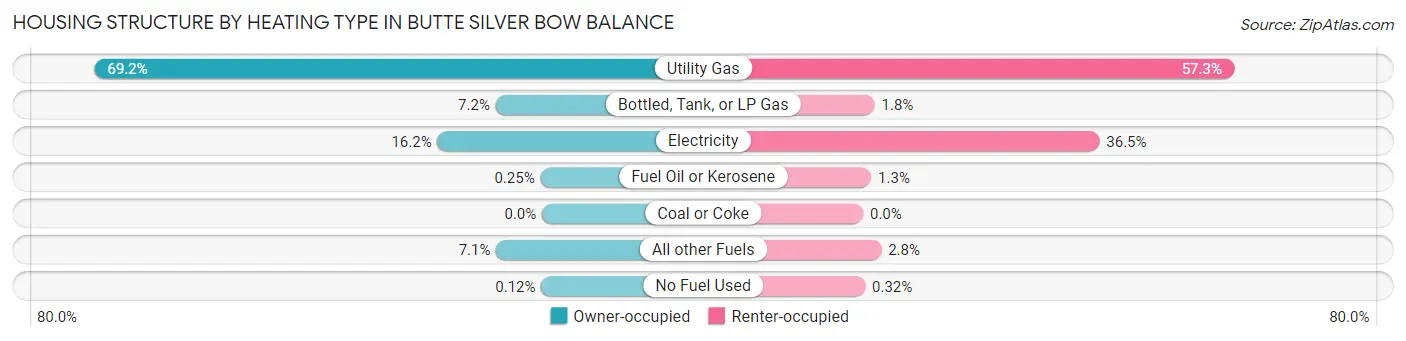
| Heating Type | Owner-occupied | Renter-occupied |
| Utility Gas | 7,176 (69.2%) | 2,525 (57.3%) |
| Bottled, Tank, or LP Gas | 743 (7.2%) | 79 (1.8%) |
| Electricity | 1,677 (16.2%) | 1,610 (36.5%) |
| Fuel Oil or Kerosene | 26 (0.3%) | 55 (1.3%) |
| Coal or Coke | 0 (0.0%) | 0 (0.0%) |
| All other Fuels | 734 (7.1%) | 124 (2.8%) |
| No Fuel Used | 12 (0.1%) | 14 (0.3%) |
| Total | 10,368 (100.0%) | 4,407 (100.0%) |
Household Vehicle Usage in Butte Silver Bow balance
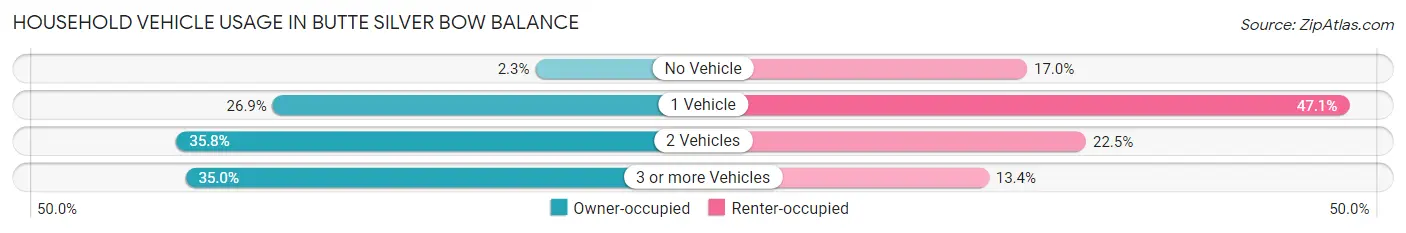
| Vehicles per Household | Owner-occupied | Renter-occupied |
| No Vehicle | 242 (2.3%) | 749 (17.0%) |
| 1 Vehicle | 2,784 (26.9%) | 2,074 (47.1%) |
| 2 Vehicles | 3,715 (35.8%) | 992 (22.5%) |
| 3 or more Vehicles | 3,627 (35.0%) | 592 (13.4%) |
| Total | 10,368 (100.0%) | 4,407 (100.0%) |
Real Estate & Mortgages in Butte Silver Bow balance
Real Estate and Mortgage Overview in Butte Silver Bow balance
| Characteristic | Without Mortgage | With Mortgage |
| Housing Units | 4,648 | 5,720 |
| Median Property Value | $167,800 | $215,900 |
| Median Household Income | $57,472 | $977 |
| Monthly Housing Costs | $472 | $199 |
| Real Estate Taxes | $2,063 | $110 |
Property Value by Mortgage Status in Butte Silver Bow balance
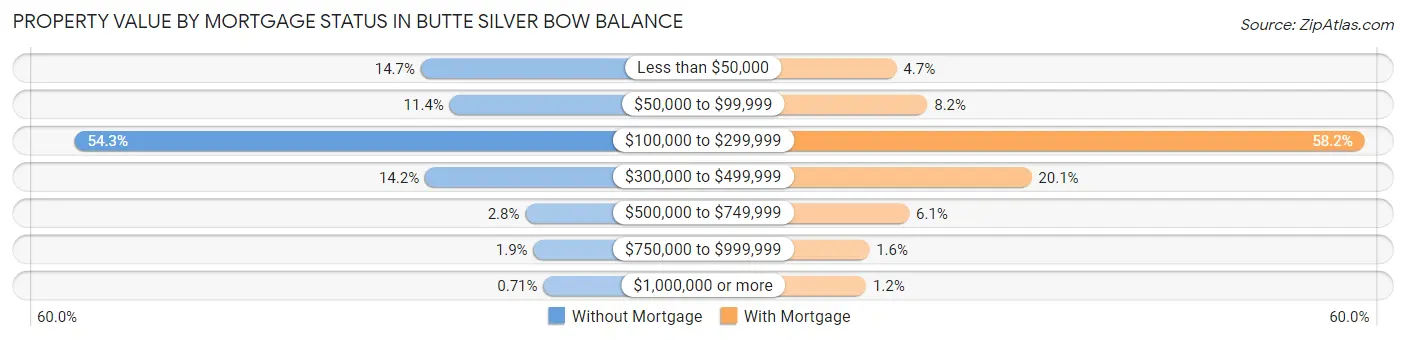
| Property Value | Without Mortgage | With Mortgage |
| Less than $50,000 | 684 (14.7%) | 267 (4.7%) |
| $50,000 to $99,999 | 531 (11.4%) | 469 (8.2%) |
| $100,000 to $299,999 | 2,523 (54.3%) | 3,327 (58.2%) |
| $300,000 to $499,999 | 662 (14.2%) | 1,150 (20.1%) |
| $500,000 to $749,999 | 129 (2.8%) | 350 (6.1%) |
| $750,000 to $999,999 | 86 (1.8%) | 89 (1.6%) |
| $1,000,000 or more | 33 (0.7%) | 68 (1.2%) |
| Total | 4,648 (100.0%) | 5,720 (100.0%) |
Household Income by Mortgage Status in Butte Silver Bow balance
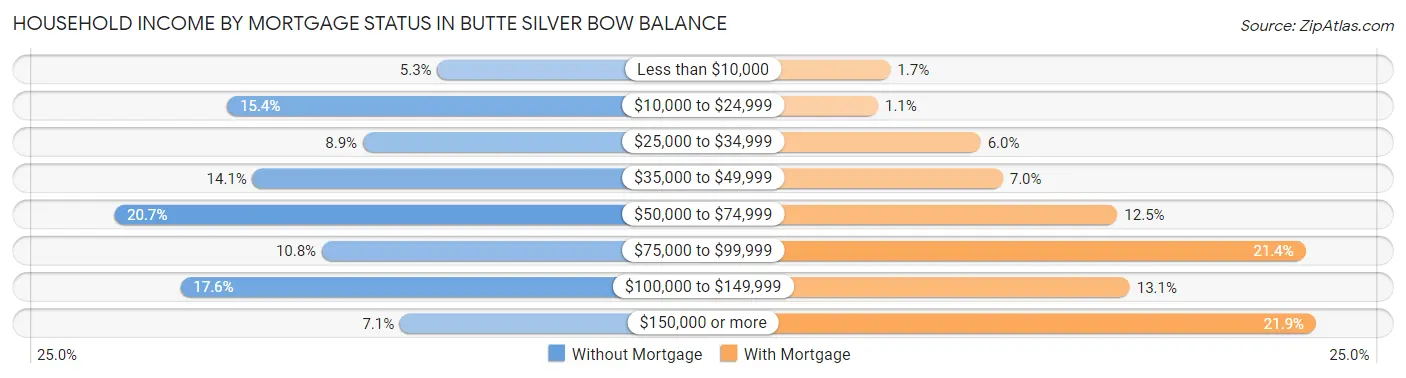
| Household Income | Without Mortgage | With Mortgage |
| Less than $10,000 | 248 (5.3%) | 95 (1.7%) |
| $10,000 to $24,999 | 714 (15.4%) | 61 (1.1%) |
| $25,000 to $34,999 | 413 (8.9%) | 341 (6.0%) |
| $35,000 to $49,999 | 657 (14.1%) | 401 (7.0%) |
| $50,000 to $74,999 | 964 (20.7%) | 713 (12.5%) |
| $75,000 to $99,999 | 504 (10.8%) | 1,226 (21.4%) |
| $100,000 to $149,999 | 817 (17.6%) | 747 (13.1%) |
| $150,000 or more | 331 (7.1%) | 1,254 (21.9%) |
| Total | 4,648 (100.0%) | 5,720 (100.0%) |
Property Value to Household Income Ratio in Butte Silver Bow balance
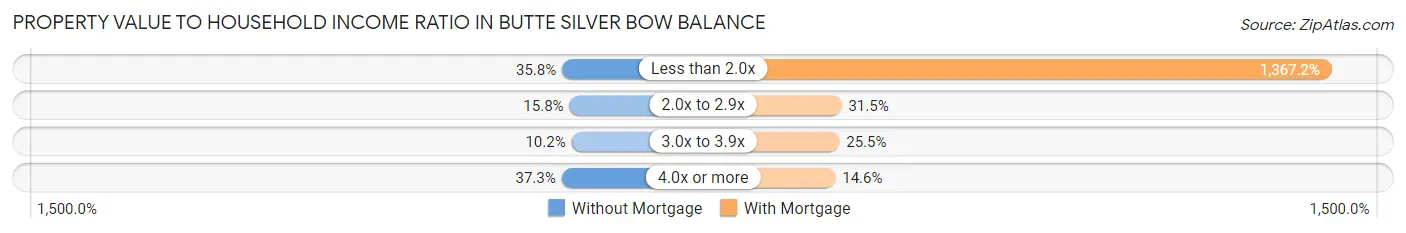
| Value-to-Income Ratio | Without Mortgage | With Mortgage |
| Less than 2.0x | 1,665 (35.8%) | 78,206 (1,367.2%) |
| 2.0x to 2.9x | 735 (15.8%) | 1,800 (31.5%) |
| 3.0x to 3.9x | 476 (10.2%) | 1,461 (25.5%) |
| 4.0x or more | 1,733 (37.3%) | 832 (14.5%) |
| Total | 4,648 (100.0%) | 5,720 (100.0%) |
Real Estate Taxes by Mortgage Status in Butte Silver Bow balance
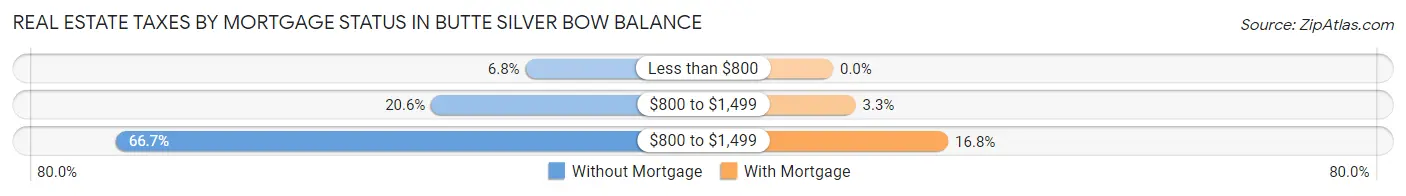
| Property Taxes | Without Mortgage | With Mortgage |
| Less than $800 | 317 (6.8%) | 0 (0.0%) |
| $800 to $1,499 | 957 (20.6%) | 189 (3.3%) |
| $800 to $1,499 | 3,099 (66.7%) | 962 (16.8%) |
| Total | 4,648 (100.0%) | 5,720 (100.0%) |
Health & Disability in Butte Silver Bow balance
Health Insurance Coverage by Age in Butte Silver Bow balance
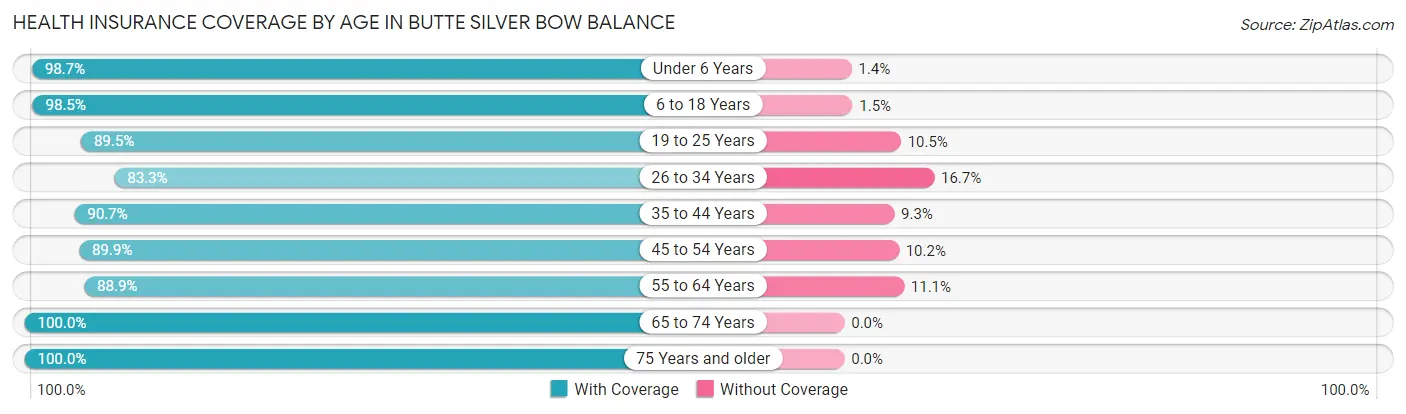
| Age Bracket | With Coverage | Without Coverage |
| Under 6 Years | 2,124 (98.7%) | 29 (1.3%) |
| 6 to 18 Years | 5,268 (98.5%) | 80 (1.5%) |
| 19 to 25 Years | 3,248 (89.5%) | 382 (10.5%) |
| 26 to 34 Years | 3,110 (83.3%) | 625 (16.7%) |
| 35 to 44 Years | 3,621 (90.7%) | 371 (9.3%) |
| 45 to 54 Years | 3,444 (89.8%) | 389 (10.2%) |
| 55 to 64 Years | 4,201 (88.9%) | 525 (11.1%) |
| 65 to 74 Years | 3,998 (100.0%) | 0 (0.0%) |
| 75 Years and older | 2,430 (100.0%) | 0 (0.0%) |
| Total | 31,444 (92.9%) | 2,401 (7.1%) |
Health Insurance Coverage by Citizenship Status in Butte Silver Bow balance
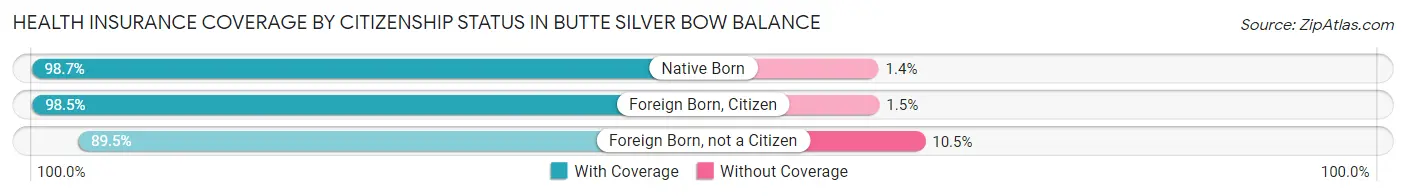
| Citizenship Status | With Coverage | Without Coverage |
| Native Born | 2,124 (98.7%) | 29 (1.3%) |
| Foreign Born, Citizen | 5,268 (98.5%) | 80 (1.5%) |
| Foreign Born, not a Citizen | 3,248 (89.5%) | 382 (10.5%) |
Health Insurance Coverage by Household Income in Butte Silver Bow balance
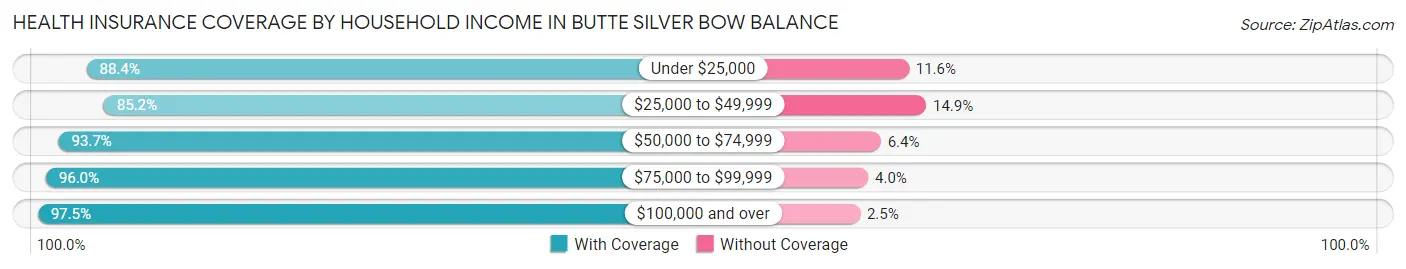
| Household Income | With Coverage | Without Coverage |
| Under $25,000 | 4,508 (88.4%) | 592 (11.6%) |
| $25,000 to $49,999 | 5,173 (85.2%) | 902 (14.8%) |
| $50,000 to $74,999 | 6,665 (93.6%) | 452 (6.4%) |
| $75,000 to $99,999 | 3,973 (96.0%) | 165 (4.0%) |
| $100,000 and over | 10,559 (97.5%) | 267 (2.5%) |
Public vs Private Health Insurance Coverage by Age in Butte Silver Bow balance
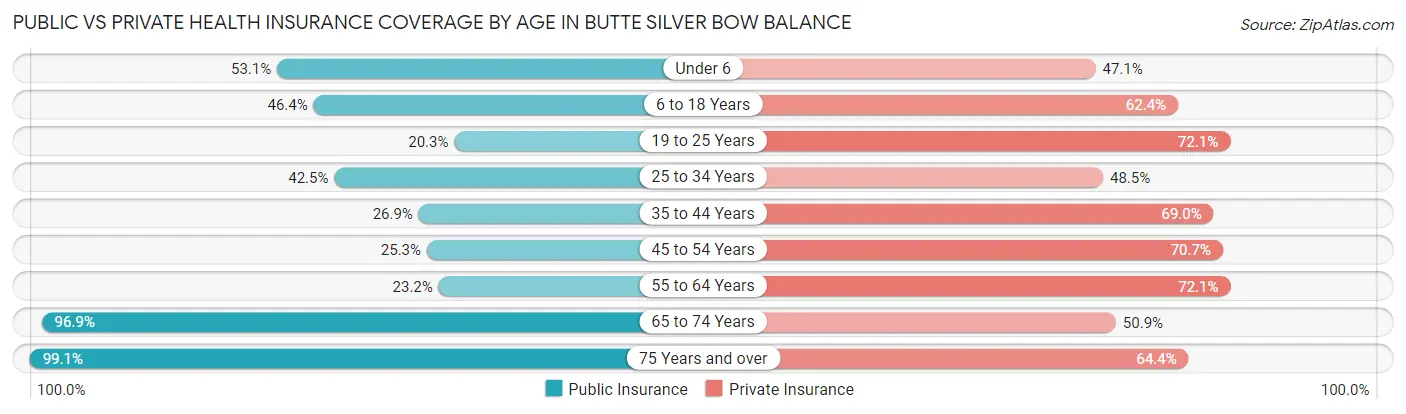
| Age Bracket | Public Insurance | Private Insurance |
| Under 6 | 1,144 (53.1%) | 1,014 (47.1%) |
| 6 to 18 Years | 2,480 (46.4%) | 3,336 (62.4%) |
| 19 to 25 Years | 735 (20.3%) | 2,616 (72.1%) |
| 25 to 34 Years | 1,588 (42.5%) | 1,811 (48.5%) |
| 35 to 44 Years | 1,072 (26.9%) | 2,754 (69.0%) |
| 45 to 54 Years | 971 (25.3%) | 2,710 (70.7%) |
| 55 to 64 Years | 1,094 (23.2%) | 3,408 (72.1%) |
| 65 to 74 Years | 3,872 (96.9%) | 2,034 (50.9%) |
| 75 Years and over | 2,407 (99.1%) | 1,564 (64.4%) |
| Total | 15,363 (45.4%) | 21,247 (62.8%) |
Disability Status by Sex by Age in Butte Silver Bow balance
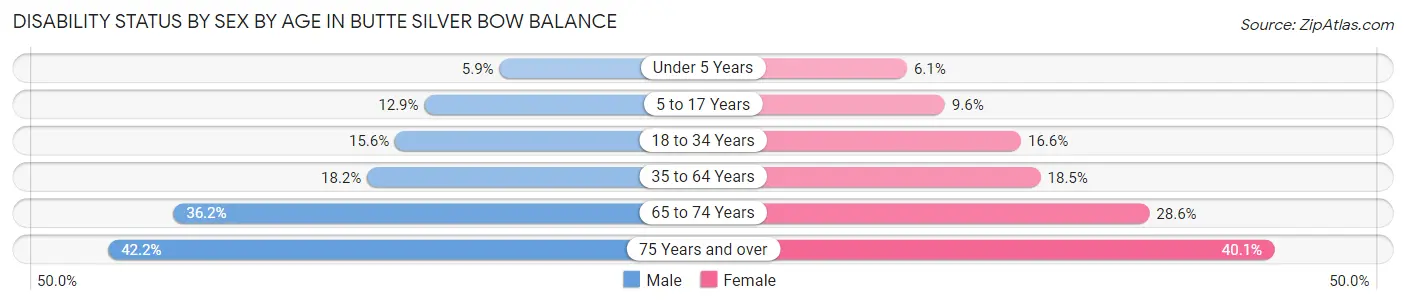
| Age Bracket | Male | Female |
| Under 5 Years | 64 (5.9%) | 54 (6.0%) |
| 5 to 17 Years | 334 (12.9%) | 232 (9.6%) |
| 18 to 34 Years | 657 (15.6%) | 611 (16.6%) |
| 35 to 64 Years | 1,194 (18.2%) | 1,106 (18.4%) |
| 65 to 74 Years | 708 (36.2%) | 583 (28.5%) |
| 75 Years and over | 463 (42.2%) | 535 (40.1%) |
Disability Class by Sex by Age in Butte Silver Bow balance
Disability Class: Hearing Difficulty
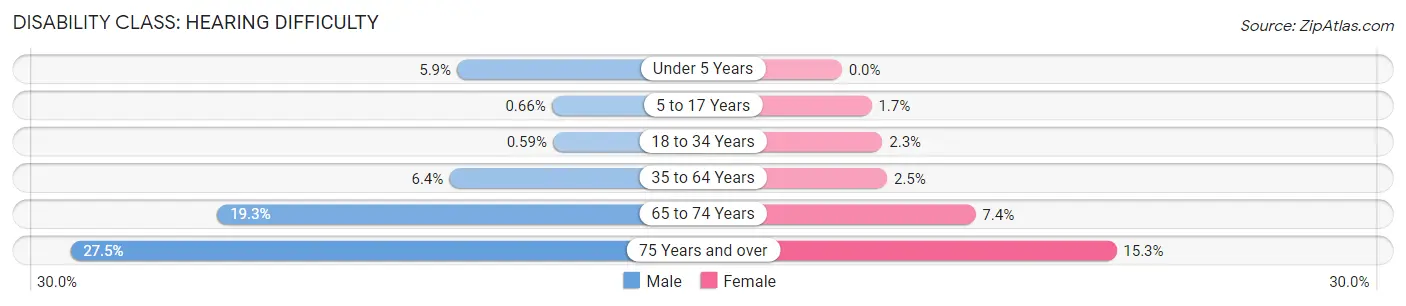
| Age Bracket | Male | Female |
| Under 5 Years | 64 (5.9%) | 0 (0.0%) |
| 5 to 17 Years | 17 (0.7%) | 40 (1.7%) |
| 18 to 34 Years | 25 (0.6%) | 83 (2.3%) |
| 35 to 64 Years | 417 (6.4%) | 151 (2.5%) |
| 65 to 74 Years | 377 (19.3%) | 152 (7.4%) |
| 75 Years and over | 301 (27.5%) | 204 (15.3%) |
Disability Class: Vision Difficulty
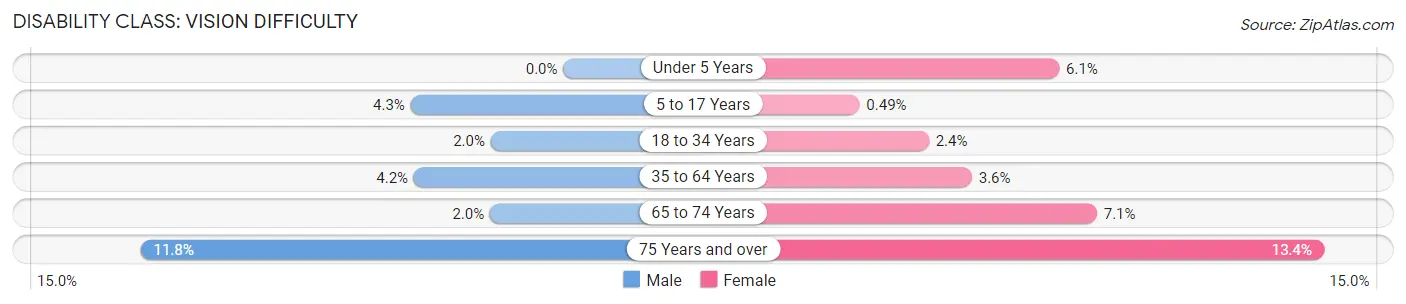
| Age Bracket | Male | Female |
| Under 5 Years | 0 (0.0%) | 54 (6.0%) |
| 5 to 17 Years | 110 (4.3%) | 12 (0.5%) |
| 18 to 34 Years | 85 (2.0%) | 89 (2.4%) |
| 35 to 64 Years | 273 (4.2%) | 217 (3.6%) |
| 65 to 74 Years | 40 (2.0%) | 145 (7.1%) |
| 75 Years and over | 129 (11.8%) | 179 (13.4%) |
Disability Class: Cognitive Difficulty
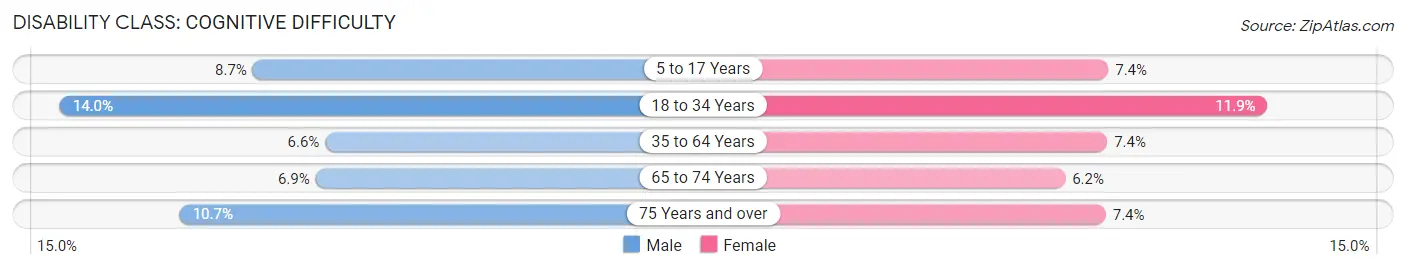
| Age Bracket | Male | Female |
| 5 to 17 Years | 224 (8.6%) | 180 (7.4%) |
| 18 to 34 Years | 590 (14.0%) | 435 (11.8%) |
| 35 to 64 Years | 435 (6.6%) | 443 (7.4%) |
| 65 to 74 Years | 135 (6.9%) | 127 (6.2%) |
| 75 Years and over | 117 (10.7%) | 98 (7.3%) |
Disability Class: Ambulatory Difficulty
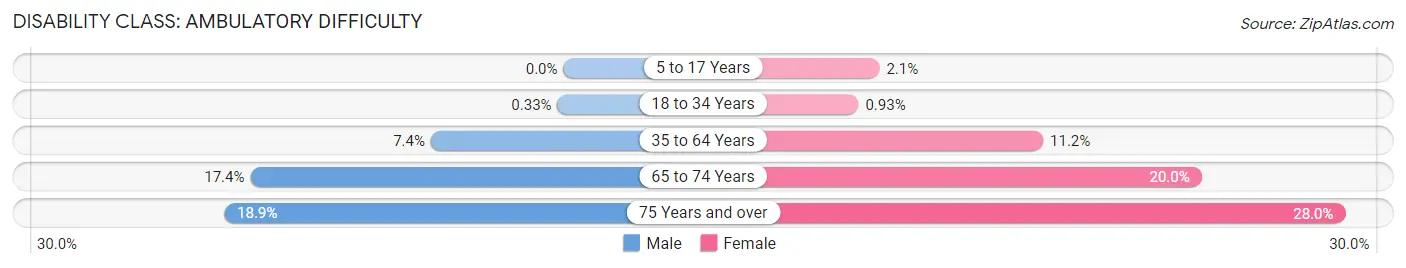
| Age Bracket | Male | Female |
| 5 to 17 Years | 0 (0.0%) | 51 (2.1%) |
| 18 to 34 Years | 14 (0.3%) | 34 (0.9%) |
| 35 to 64 Years | 484 (7.4%) | 672 (11.2%) |
| 65 to 74 Years | 341 (17.4%) | 409 (20.0%) |
| 75 Years and over | 207 (18.9%) | 374 (28.0%) |
Disability Class: Self-Care Difficulty
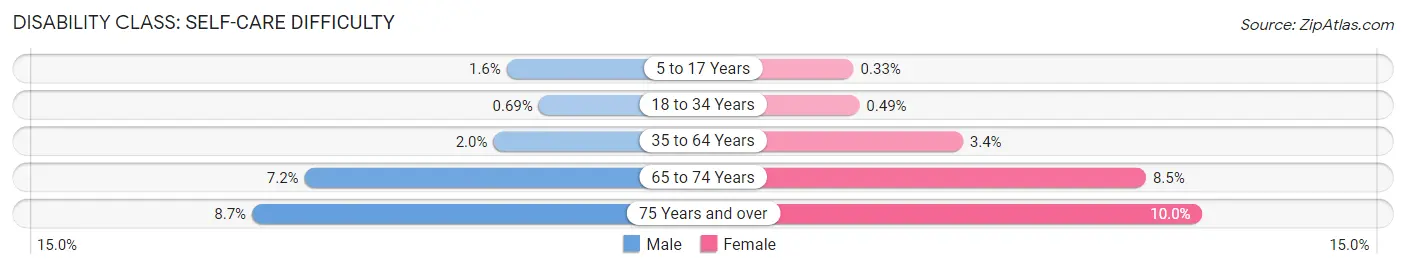
| Age Bracket | Male | Female |
| 5 to 17 Years | 41 (1.6%) | 8 (0.3%) |
| 18 to 34 Years | 29 (0.7%) | 18 (0.5%) |
| 35 to 64 Years | 128 (1.9%) | 202 (3.4%) |
| 65 to 74 Years | 141 (7.2%) | 173 (8.5%) |
| 75 Years and over | 95 (8.7%) | 134 (10.0%) |
Technology Access in Butte Silver Bow balance
Computing Device Access in Butte Silver Bow balance
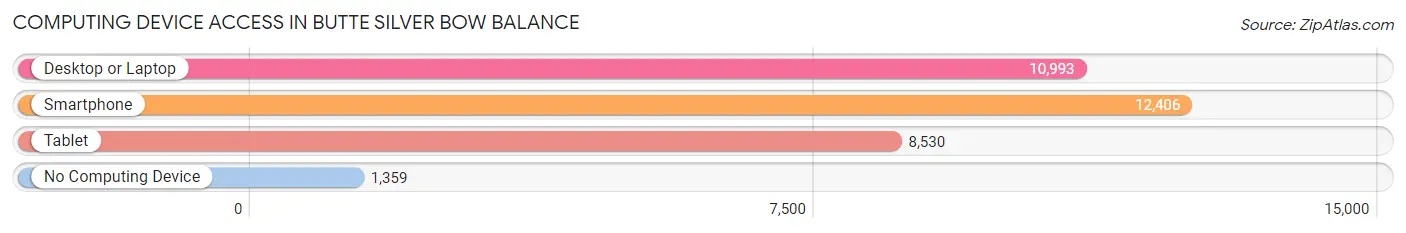
| Device Type | # Households | % Households |
| Desktop or Laptop | 10,993 | 74.4% |
| Smartphone | 12,406 | 84.0% |
| Tablet | 8,530 | 57.7% |
| No Computing Device | 1,359 | 9.2% |
| Total | 14,775 | 100.0% |
Internet Access in Butte Silver Bow balance

| Internet Type | # Households | % Households |
| Dial-Up Internet | 229 | 1.5% |
| Broadband Home | 8,448 | 57.2% |
| Cellular Data Only | 2,630 | 17.8% |
| Satellite Internet | 1,562 | 10.6% |
| No Internet | 2,247 | 15.2% |
| Total | 14,775 | 100.0% |
Butte Silver Bow balance Summary
Butte-Silver Bow, Montana is a city-county located in the southwestern part of the state. It is the largest city in Montana, with a population of 33,892 as of the 2010 census. The city-county is located in the Rocky Mountains, and is home to the Continental Divide. It is also the county seat of Silver Bow County.
History
Butte-Silver Bow has a long and rich history. The area was first inhabited by Native American tribes, including the Shoshone, Blackfeet, and Crow. The first European settlers arrived in the area in the late 1800s, and the city of Butte was founded in 1864. The city was named after the nearby Butte Mountains, and quickly became a major mining center. The city was incorporated in 1881, and the county of Silver Bow was created in 1883.
The city of Butte quickly grew in size and importance, and by the early 1900s it was the largest city in Montana. The city was home to a large number of immigrants, including Irish, Italian, and Chinese. The city was also home to a large number of labor unions, and was a major center of labor activism.
The city of Butte-Silver Bow was created in 1977, when the city of Butte and the county of Silver Bow merged. The merger was intended to create a more efficient government, and to reduce the cost of providing services to the citizens of the area.
Geography
Butte-Silver Bow is located in the southwestern part of Montana, in the Rocky Mountains. The city is located at an elevation of 5,567 feet, and is the highest city in the state. The city is located in the Continental Divide, and is home to the headwaters of the Missouri River.
The city is located in a valley, surrounded by mountains. The city is located near the Big Hole River, and is home to several lakes, including Silver Bow Lake and Butte Lake. The city is also home to several parks, including the Butte-Silver Bow Historic District and the Butte-Silver Bow National Historic Landmark.
Economy
Butte-Silver Bow has a diverse economy, with a variety of industries. The city is home to several large employers, including the Montana Resources copper mine, the Montana Power Company, and the Montana Rail Link. The city is also home to several smaller businesses, including restaurants, retail stores, and manufacturing companies.
The city is also home to several educational institutions, including Montana Tech, the University of Montana-Western, and Montana State University-Northern. The city is also home to several hospitals, including St. James Healthcare and the Butte-Silver Bow Medical Center.
Demographics
As of the 2010 census, the population of Butte-Silver Bow was 33,892. The population is made up of a variety of ethnic and racial groups, including White (87.3%), Native American (3.2%), Asian (1.3%), African American (1.2%), and Hispanic or Latino (2.2%). The median household income in the city is $37,945, and the median home value is $150,000. The city has a poverty rate of 17.3%.
Common Questions
What is Per Capita Income in Butte Silver Bow balance?
Per Capita income in Butte Silver Bow balance is $35,110.
What is the Median Family Income in Butte Silver Bow balance?
Median Family Income in Butte Silver Bow balance is $74,671.
What is the Median Household income in Butte Silver Bow balance?
Median Household Income in Butte Silver Bow balance is $56,522.
What is Income or Wage Gap in Butte Silver Bow balance?
Income or Wage Gap in Butte Silver Bow balance is 26.6%.
Women in Butte Silver Bow balance earn 73.4 cents for every dollar earned by a man.
What is Family Income Deficit in Butte Silver Bow balance?
Family Income Deficit in Butte Silver Bow balance is $10,741.
Families that are below poverty line in Butte Silver Bow balance earn $10,741 less on average than the poverty threshold level.
What is Inequality or Gini Index in Butte Silver Bow balance?
Inequality or Gini Index in Butte Silver Bow balance is 0.50.
What is the Total Population of Butte Silver Bow balance?
Total Population of Butte Silver Bow balance is 34,638.
What is the Total Male Population of Butte Silver Bow balance?
Total Male Population of Butte Silver Bow balance is 17,813.
What is the Total Female Population of Butte Silver Bow balance?
Total Female Population of Butte Silver Bow balance is 16,825.
What is the Ratio of Males per 100 Females in Butte Silver Bow balance?
There are 105.87 Males per 100 Females in Butte Silver Bow balance.
What is the Ratio of Females per 100 Males in Butte Silver Bow balance?
There are 94.45 Females per 100 Males in Butte Silver Bow balance.
What is the Median Population Age in Butte Silver Bow balance?
Median Population Age in Butte Silver Bow balance is 40.2 Years.
What is the Average Family Size in Butte Silver Bow balance
Average Family Size in Butte Silver Bow balance is 3.1 People.
What is the Average Household Size in Butte Silver Bow balance
Average Household Size in Butte Silver Bow balance is 2.3 People.
How Large is the Labor Force in Butte Silver Bow balance?
There are 16,975 People in the Labor Forcein in Butte Silver Bow balance.
What is the Percentage of People in the Labor Force in Butte Silver Bow balance?
60.1% of People are in the Labor Force in Butte Silver Bow balance.
What is the Unemployment Rate in Butte Silver Bow balance?
Unemployment Rate in Butte Silver Bow balance is 4.5%.