Stillwater County, MT Map & Demographics
Stillwater County Map
Stillwater County Overview
$45,245
PER CAPITA INCOME
$95,190
AVG FAMILY INCOME
$78,380
AVG HOUSEHOLD INCOME
47.6%
WAGE / INCOME GAP [ % ]
52.4¢/ $1
WAGE / INCOME GAP [ $ ]
0.45
INEQUALITY / GINI INDEX
8,978
TOTAL POPULATION
4,560
MALE POPULATION
4,418
FEMALE POPULATION
103.21
MALES / 100 FEMALES
96.89
FEMALES / 100 MALES
48.0
MEDIAN AGE
2.9
AVG FAMILY SIZE
2.3
AVG HOUSEHOLD SIZE
4,410
LABOR FORCE [ PEOPLE ]
59.8%
PERCENT IN LABOR FORCE
2.6%
UNEMPLOYMENT RATE
Stillwater County Area Codes
Income in Stillwater County
Income Overview in Stillwater County
Per Capita Income in Stillwater County is $45,245, while median incomes of families and households are $95,190 and $78,380 respectively.
| Characteristic | Number | Measure |
| Per Capita Income | 8,978 | $45,245 |
| Median Family Income | 2,603 | $95,190 |
| Mean Family Income | 2,603 | $119,458 |
| Median Household Income | 3,801 | $78,380 |
| Mean Household Income | 3,801 | $103,635 |
| Income Deficit | 2,603 | $0 |
| Wage / Income Gap (%) | 8,978 | 47.63% |
| Wage / Income Gap ($) | 8,978 | 52.37¢ per $1 |
| Gini / Inequality Index | 8,978 | 0.45 |
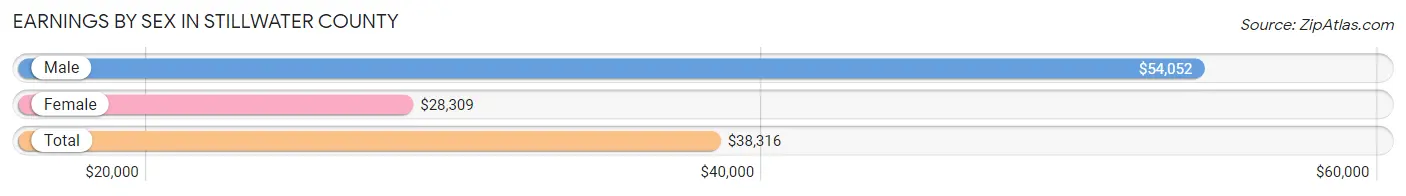
Earnings by Sex in Stillwater County
Average Earnings in Stillwater County are $38,316, $54,052 for men and $28,309 for women, a difference of 47.6%.
| Sex | Number | Average Earnings |
| Male | 2,680 (56.6%) | $54,052 |
| Female | 2,055 (43.4%) | $28,309 |
| Total | 4,735 (100.0%) | $38,316 |
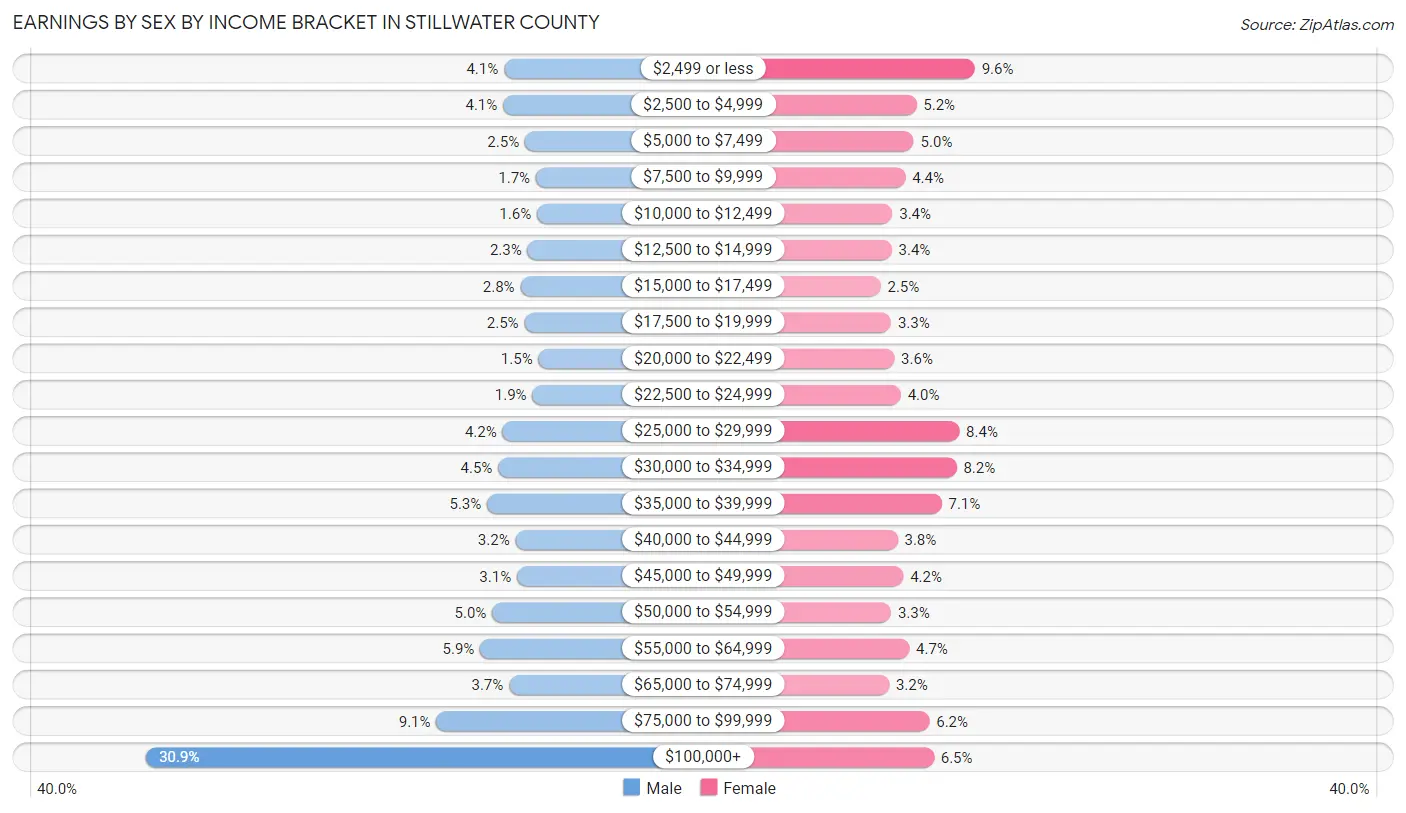
Earnings by Sex by Income Bracket in Stillwater County
The most common earnings brackets in Stillwater County are $100,000+ for men (828 | 30.9%) and $2,499 or less for women (197 | 9.6%).
| Income | Male | Female |
| $2,499 or less | 109 (4.1%) | 197 (9.6%) |
| $2,500 to $4,999 | 111 (4.1%) | 107 (5.2%) |
| $5,000 to $7,499 | 67 (2.5%) | 103 (5.0%) |
| $7,500 to $9,999 | 45 (1.7%) | 90 (4.4%) |
| $10,000 to $12,499 | 43 (1.6%) | 70 (3.4%) |
| $12,500 to $14,999 | 62 (2.3%) | 69 (3.4%) |
| $15,000 to $17,499 | 76 (2.8%) | 52 (2.5%) |
| $17,500 to $19,999 | 68 (2.5%) | 68 (3.3%) |
| $20,000 to $22,499 | 40 (1.5%) | 73 (3.5%) |
| $22,500 to $24,999 | 52 (1.9%) | 83 (4.0%) |
| $25,000 to $29,999 | 112 (4.2%) | 173 (8.4%) |
| $30,000 to $34,999 | 121 (4.5%) | 169 (8.2%) |
| $35,000 to $39,999 | 143 (5.3%) | 146 (7.1%) |
| $40,000 to $44,999 | 86 (3.2%) | 78 (3.8%) |
| $45,000 to $49,999 | 83 (3.1%) | 87 (4.2%) |
| $50,000 to $54,999 | 133 (5.0%) | 68 (3.3%) |
| $55,000 to $64,999 | 157 (5.9%) | 96 (4.7%) |
| $65,000 to $74,999 | 99 (3.7%) | 65 (3.2%) |
| $75,000 to $99,999 | 245 (9.1%) | 127 (6.2%) |
| $100,000+ | 828 (30.9%) | 134 (6.5%) |
| Total | 2,680 (100.0%) | 2,055 (100.0%) |
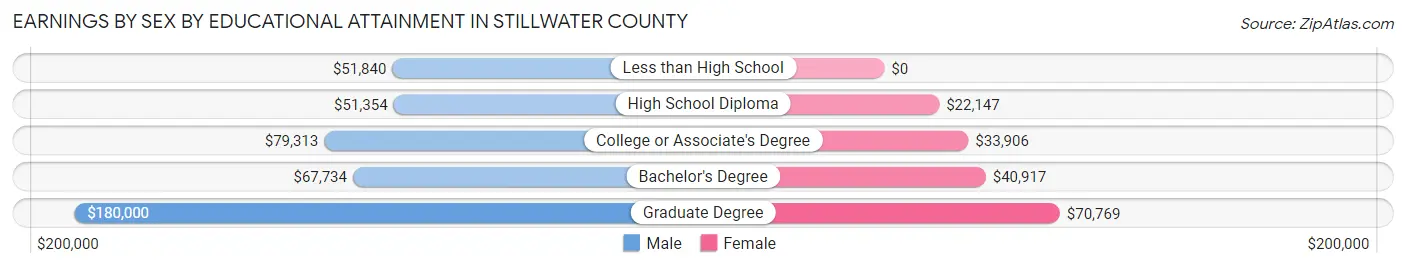
Earnings by Sex by Educational Attainment in Stillwater County
Average earnings in Stillwater County are $66,528 for men and $30,854 for women, a difference of 53.6%. Men with an educational attainment of graduate degree enjoy the highest average annual earnings of $180,000, while those with high school diploma education earn the least with $51,354. Women with an educational attainment of graduate degree earn the most with the average annual earnings of $70,769, while those with high school diploma education have the smallest earnings of $22,147.
| Educational Attainment | Male Income | Female Income |
| Less than High School | $51,840 | $0 |
| High School Diploma | $51,354 | $22,147 |
| College or Associate's Degree | $79,313 | $33,906 |
| Bachelor's Degree | $67,734 | $40,917 |
| Graduate Degree | $180,000 | $70,769 |
| Total | $66,528 | $30,854 |
Family Income in Stillwater County
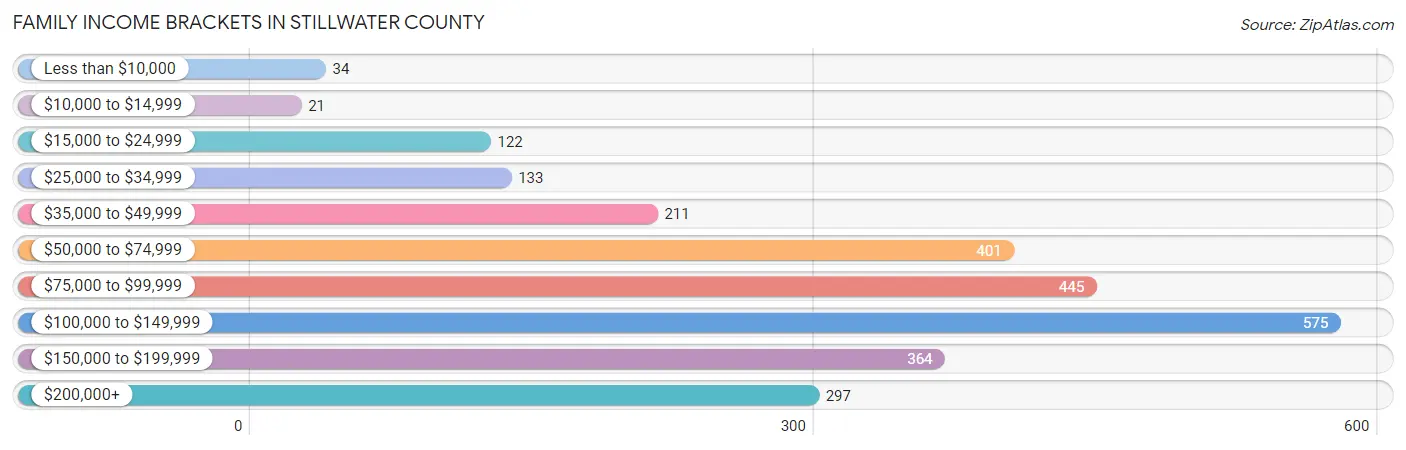
Family Income Brackets in Stillwater County
According to the Stillwater County family income data, there are 575 families falling into the $100,000 to $149,999 income range, which is the most common income bracket and makes up 22.1% of all families. Conversely, the $10,000 to $14,999 income bracket is the least frequent group with only 21 families (0.8%) belonging to this category.
| Income Bracket | # Families | % Families |
| Less than $10,000 | 34 | 1.3% |
| $10,000 to $14,999 | 21 | 0.8% |
| $15,000 to $24,999 | 122 | 4.7% |
| $25,000 to $34,999 | 133 | 5.1% |
| $35,000 to $49,999 | 211 | 8.1% |
| $50,000 to $74,999 | 401 | 15.4% |
| $75,000 to $99,999 | 445 | 17.1% |
| $100,000 to $149,999 | 575 | 22.1% |
| $150,000 to $199,999 | 364 | 14.0% |
| $200,000+ | 297 | 11.4% |
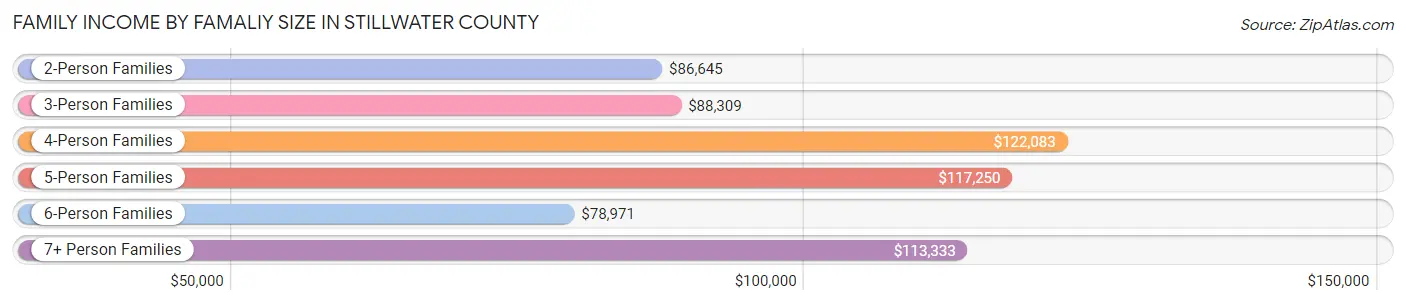
Family Income by Famaliy Size in Stillwater County
4-person families (385 | 14.8%) account for the highest median family income in Stillwater County with $122,083 per family, while 2-person families (1,613 | 62.0%) have the highest median income of $43,322 per family member.
| Income Bracket | # Families | Median Income |
| 2-Person Families | 1,613 (62.0%) | $86,645 |
| 3-Person Families | 293 (11.3%) | $88,309 |
| 4-Person Families | 385 (14.8%) | $122,083 |
| 5-Person Families | 212 (8.1%) | $117,250 |
| 6-Person Families | 30 (1.1%) | $78,971 |
| 7+ Person Families | 70 (2.7%) | $113,333 |
| Total | 2,603 (100.0%) | $95,190 |
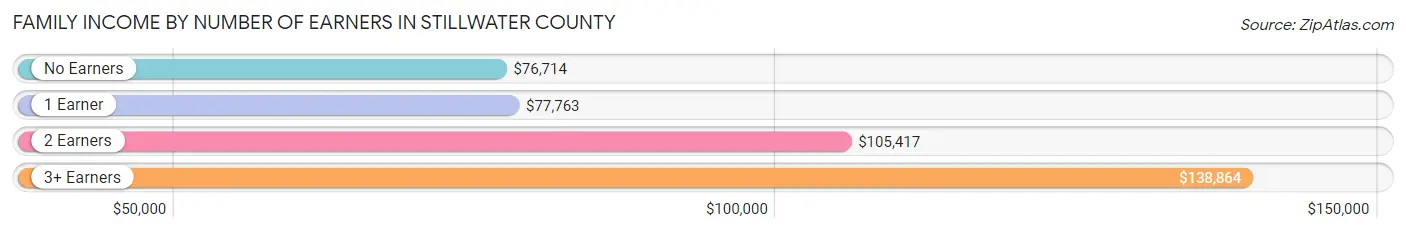
Family Income by Number of Earners in Stillwater County
The median family income in Stillwater County is $95,190, with families comprising 3+ earners (182) having the highest median family income of $138,864, while families with no earners (538) have the lowest median family income of $76,714, accounting for 7.0% and 20.7% of families, respectively.
| Number of Earners | # Families | Median Income |
| No Earners | 538 (20.7%) | $76,714 |
| 1 Earner | 760 (29.2%) | $77,763 |
| 2 Earners | 1,123 (43.1%) | $105,417 |
| 3+ Earners | 182 (7.0%) | $138,864 |
| Total | 2,603 (100.0%) | $95,190 |
Household Income in Stillwater County
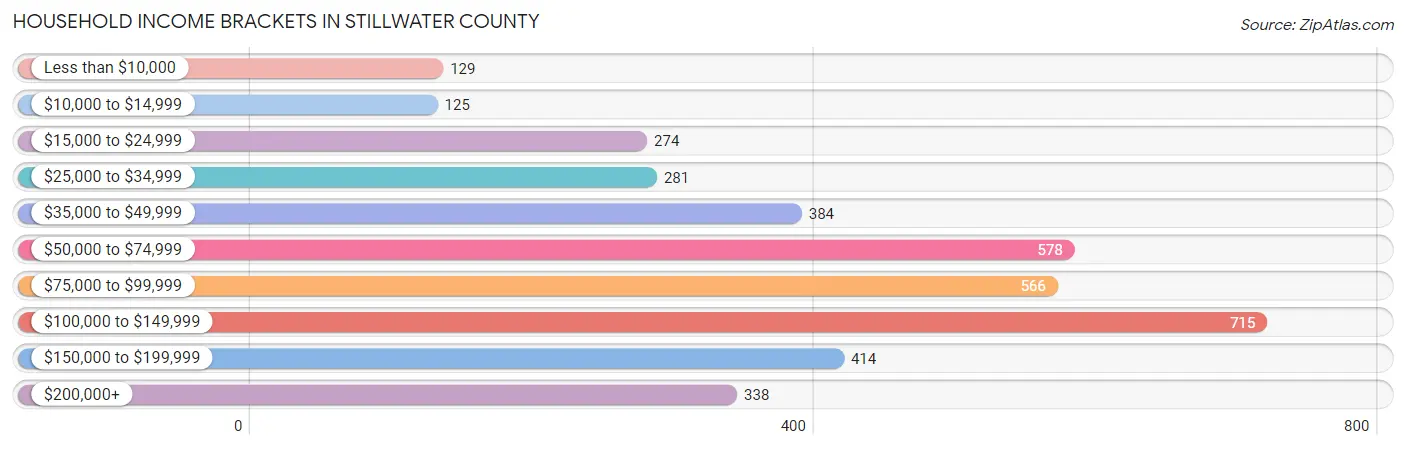
Household Income Brackets in Stillwater County
With 715 households falling in the category, the $100,000 to $149,999 income range is the most frequent in Stillwater County, accounting for 18.8% of all households. In contrast, only 125 households (3.3%) fall into the $10,000 to $14,999 income bracket, making it the least populous group.
| Income Bracket | # Households | % Households |
| Less than $10,000 | 129 | 3.4% |
| $10,000 to $14,999 | 125 | 3.3% |
| $15,000 to $24,999 | 274 | 7.2% |
| $25,000 to $34,999 | 281 | 7.4% |
| $35,000 to $49,999 | 384 | 10.1% |
| $50,000 to $74,999 | 578 | 15.2% |
| $75,000 to $99,999 | 566 | 14.9% |
| $100,000 to $149,999 | 715 | 18.8% |
| $150,000 to $199,999 | 414 | 10.9% |
| $200,000+ | 338 | 8.9% |
Household Income by Householder Age in Stillwater County
The median household income in Stillwater County is $78,380, with the highest median household income of $95,531 found in the 45 to 64 years age bracket for the primary householder. A total of 1,501 households (39.5%) fall into this category. Meanwhile, the 15 to 24 years age bracket for the primary householder has the lowest median household income of $0, with 156 households (4.1%) in this group.
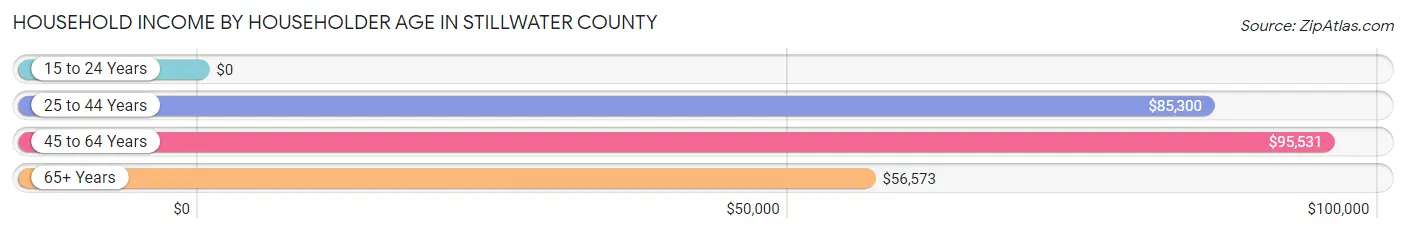
| Income Bracket | # Households | Median Income |
| 15 to 24 Years | 156 (4.1%) | $0 |
| 25 to 44 Years | 808 (21.3%) | $85,300 |
| 45 to 64 Years | 1,501 (39.5%) | $95,531 |
| 65+ Years | 1,336 (35.1%) | $56,573 |
| Total | 3,801 (100.0%) | $78,380 |
Poverty in Stillwater County
Income Below Poverty by Sex and Age in Stillwater County
With 6.8% poverty level for males and 9.3% for females among the residents of Stillwater County, 15 year old males and 45 to 54 year old females are the most vulnerable to poverty, with 12 males (19.7%) and 99 females (16.8%) in their respective age groups living below the poverty level.
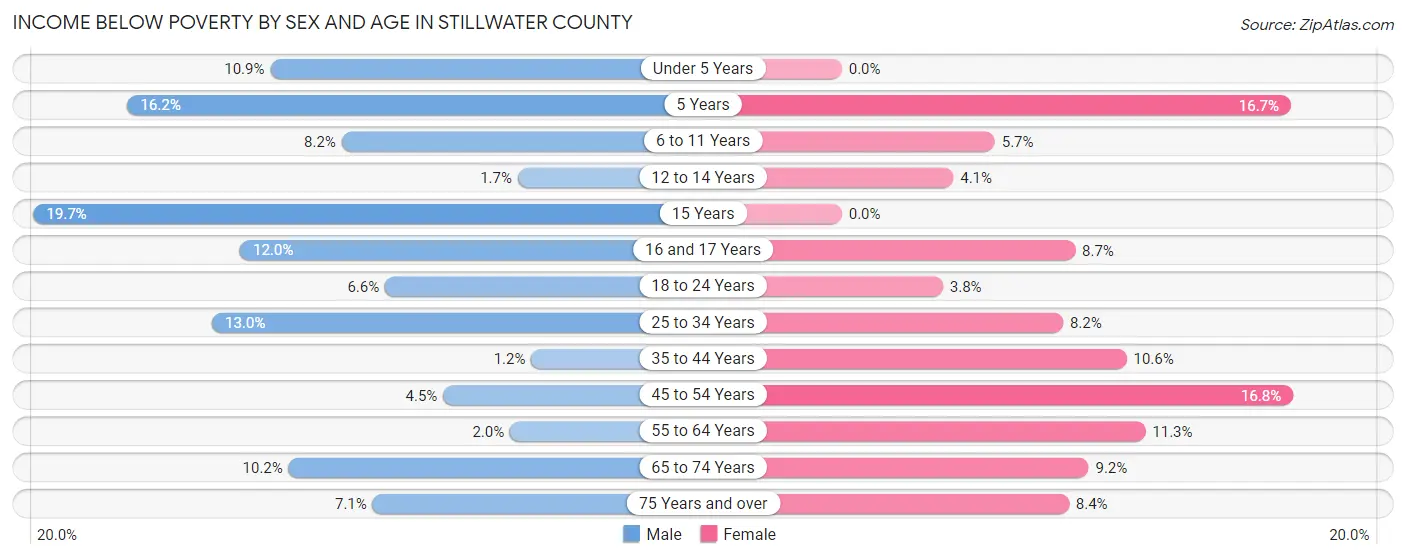
| Age Bracket | Male | Female |
| Under 5 Years | 21 (10.9%) | 0 (0.0%) |
| 5 Years | 11 (16.2%) | 6 (16.7%) |
| 6 to 11 Years | 27 (8.2%) | 20 (5.7%) |
| 12 to 14 Years | 2 (1.7%) | 7 (4.1%) |
| 15 Years | 12 (19.7%) | 0 (0.0%) |
| 16 and 17 Years | 15 (12.0%) | 11 (8.7%) |
| 18 to 24 Years | 21 (6.6%) | 10 (3.7%) |
| 25 to 34 Years | 51 (13.0%) | 32 (8.2%) |
| 35 to 44 Years | 6 (1.2%) | 50 (10.6%) |
| 45 to 54 Years | 24 (4.5%) | 99 (16.8%) |
| 55 to 64 Years | 15 (2.0%) | 79 (11.3%) |
| 65 to 74 Years | 76 (10.2%) | 62 (9.2%) |
| 75 Years and over | 26 (7.1%) | 30 (8.4%) |
| Total | 307 (6.8%) | 406 (9.3%) |
Income Above Poverty by Sex and Age in Stillwater County
According to the poverty statistics in Stillwater County, males aged 35 to 44 years and females aged under 5 years are the age groups that are most secure financially, with 98.8% of males and 100.0% of females in these age groups living above the poverty line.
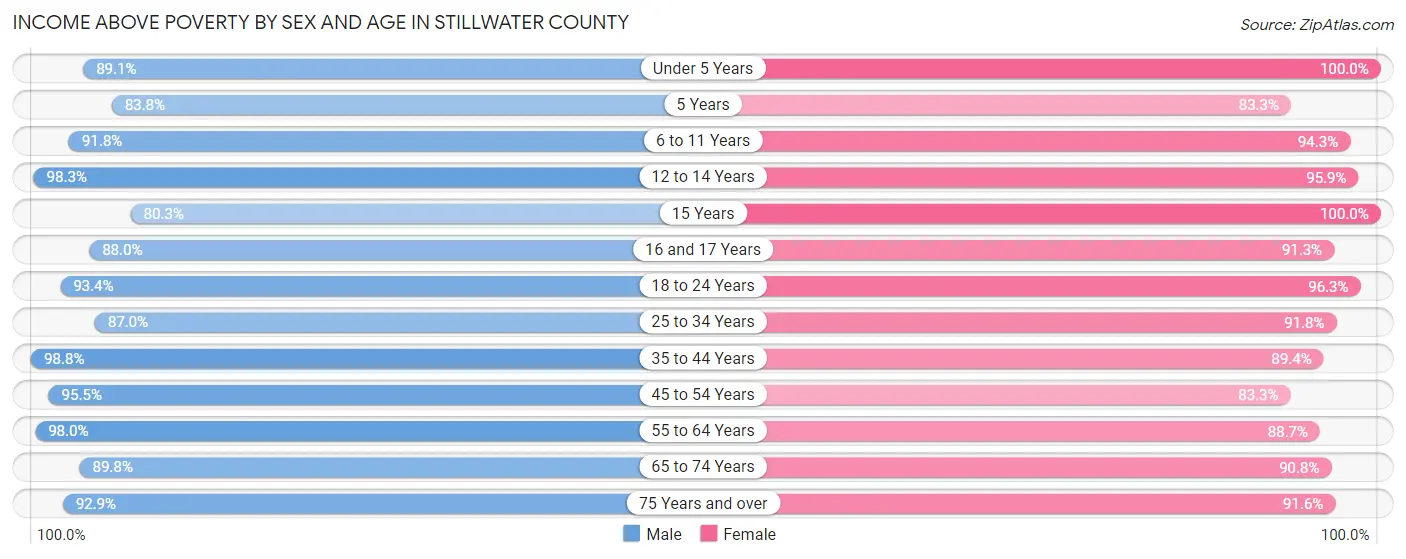
| Age Bracket | Male | Female |
| Under 5 Years | 172 (89.1%) | 173 (100.0%) |
| 5 Years | 57 (83.8%) | 30 (83.3%) |
| 6 to 11 Years | 301 (91.8%) | 332 (94.3%) |
| 12 to 14 Years | 116 (98.3%) | 162 (95.9%) |
| 15 Years | 49 (80.3%) | 69 (100.0%) |
| 16 and 17 Years | 110 (88.0%) | 116 (91.3%) |
| 18 to 24 Years | 296 (93.4%) | 257 (96.3%) |
| 25 to 34 Years | 340 (87.0%) | 358 (91.8%) |
| 35 to 44 Years | 499 (98.8%) | 423 (89.4%) |
| 45 to 54 Years | 514 (95.5%) | 492 (83.3%) |
| 55 to 64 Years | 741 (98.0%) | 622 (88.7%) |
| 65 to 74 Years | 669 (89.8%) | 615 (90.8%) |
| 75 Years and over | 341 (92.9%) | 326 (91.6%) |
| Total | 4,205 (93.2%) | 3,975 (90.7%) |
Income Below Poverty Among Married-Couple Families in Stillwater County
The poverty statistics for married-couple families in Stillwater County show that 2.2% or 50 of the total 2,237 families live below the poverty line. Families with 1 or 2 children have the highest poverty rate of 4.7%, comprising of 22 families. On the other hand, families with 3 or 4 children have the lowest poverty rate of 0.0%, which includes 0 families.
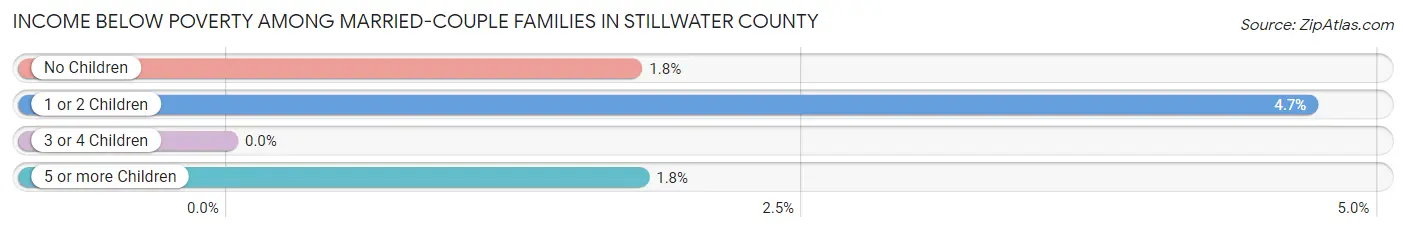
| Children | Above Poverty | Below Poverty |
| No Children | 1,510 (98.2%) | 27 (1.8%) |
| 1 or 2 Children | 446 (95.3%) | 22 (4.7%) |
| 3 or 4 Children | 176 (100.0%) | 0 (0.0%) |
| 5 or more Children | 55 (98.2%) | 1 (1.8%) |
| Total | 2,187 (97.8%) | 50 (2.2%) |
Income Below Poverty Among Single-Parent Households in Stillwater County
According to the poverty data in Stillwater County, 2.8% or 2 single-father households and 33.0% or 97 single-mother households are living below the poverty line. Among single-father households, those with 1 or 2 children have the highest poverty rate, with 2 households (5.1%) experiencing poverty. Likewise, among single-mother households, those with 3 or 4 children have the highest poverty rate, with 16 households (44.4%) falling below the poverty line.
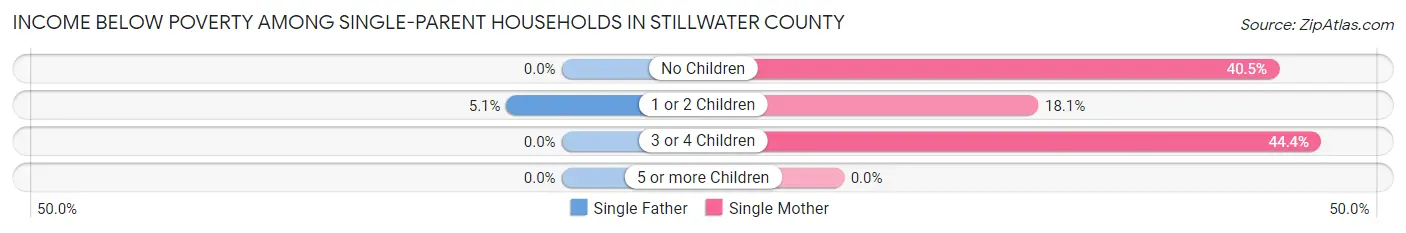
| Children | Single Father | Single Mother |
| No Children | 0 (0.0%) | 62 (40.5%) |
| 1 or 2 Children | 2 (5.1%) | 19 (18.1%) |
| 3 or 4 Children | 0 (0.0%) | 16 (44.4%) |
| 5 or more Children | 0 (0.0%) | 0 (0.0%) |
| Total | 2 (2.8%) | 97 (33.0%) |
Income Below Poverty Among Married-Couple vs Single-Parent Households in Stillwater County
The poverty data for Stillwater County shows that 50 of the married-couple family households (2.2%) and 99 of the single-parent households (27.1%) are living below the poverty level. Within the married-couple family households, those with 1 or 2 children have the highest poverty rate, with 22 households (4.7%) falling below the poverty line. Among the single-parent households, those with 3 or 4 children have the highest poverty rate, with 16 household (44.4%) living below poverty.
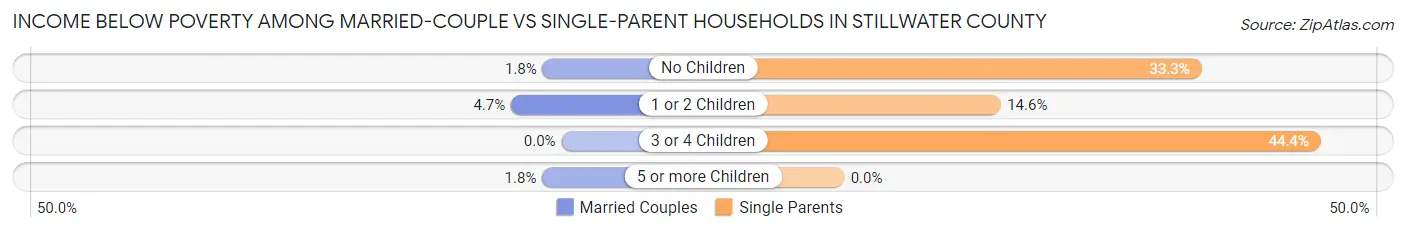
| Children | Married-Couple Families | Single-Parent Households |
| No Children | 27 (1.8%) | 62 (33.3%) |
| 1 or 2 Children | 22 (4.7%) | 21 (14.6%) |
| 3 or 4 Children | 0 (0.0%) | 16 (44.4%) |
| 5 or more Children | 1 (1.8%) | 0 (0.0%) |
| Total | 50 (2.2%) | 99 (27.1%) |
Race in Stillwater County
The most populous races in Stillwater County are White / Caucasian (8,380 | 93.3%), Hispanic or Latino (379 | 4.2%), and Two or more Races (379 | 4.2%).
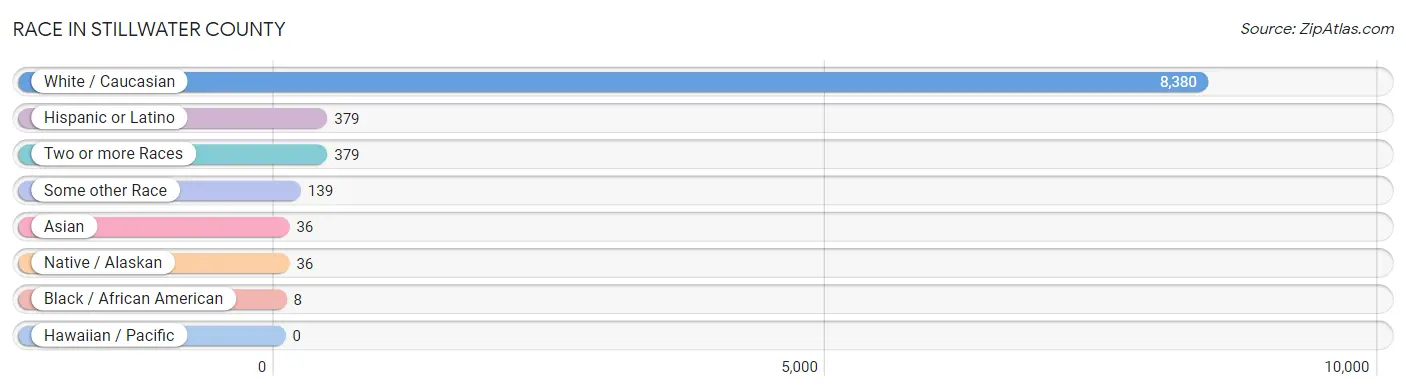
| Race | # Population | % Population |
| Asian | 36 | 0.4% |
| Black / African American | 8 | 0.1% |
| Hawaiian / Pacific | 0 | 0.0% |
| Hispanic or Latino | 379 | 4.2% |
| Native / Alaskan | 36 | 0.4% |
| White / Caucasian | 8,380 | 93.3% |
| Two or more Races | 379 | 4.2% |
| Some other Race | 139 | 1.5% |
| Total | 8,978 | 100.0% |
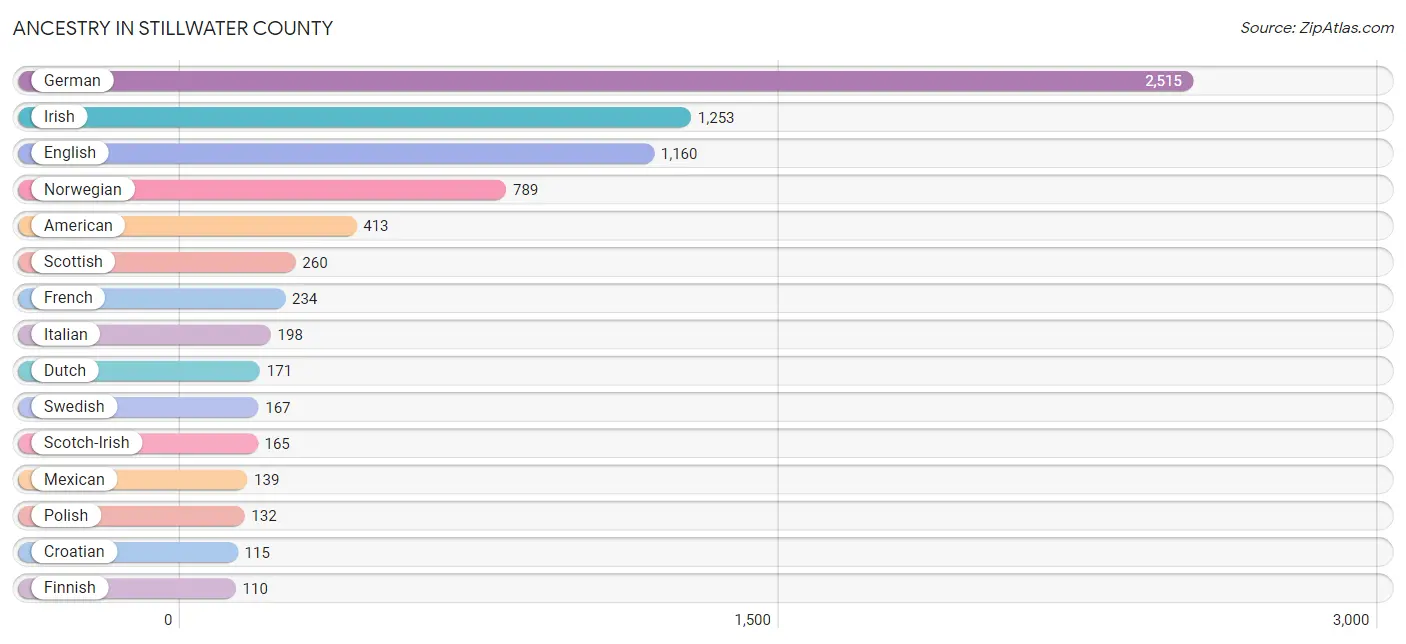
Ancestry in Stillwater County
The most populous ancestries reported in Stillwater County are German (2,515 | 28.0%), Irish (1,253 | 14.0%), English (1,160 | 12.9%), Norwegian (789 | 8.8%), and American (413 | 4.6%), together accounting for 68.3% of all Stillwater County residents.
| Ancestry | # Population | % Population |
| African | 41 | 0.5% |
| American | 413 | 4.6% |
| Austrian | 26 | 0.3% |
| Basque | 13 | 0.1% |
| Belgian | 14 | 0.2% |
| Bhutanese | 40 | 0.4% |
| Blackfeet | 6 | 0.1% |
| British | 38 | 0.4% |
| Canadian | 14 | 0.2% |
| Cherokee | 76 | 0.9% |
| Chippewa | 39 | 0.4% |
| Croatian | 115 | 1.3% |
| Crow | 7 | 0.1% |
| Czech | 59 | 0.7% |
| Czechoslovakian | 20 | 0.2% |
| Danish | 35 | 0.4% |
| Dutch | 171 | 1.9% |
| Eastern European | 5 | 0.1% |
| English | 1,160 | 12.9% |
| European | 90 | 1.0% |
| Finnish | 110 | 1.2% |
| French | 234 | 2.6% |
| French American Indian | 2 | 0.0% |
| French Canadian | 58 | 0.6% |
| German | 2,515 | 28.0% |
| German Russian | 5 | 0.1% |
| Hungarian | 34 | 0.4% |
| Indian (Asian) | 35 | 0.4% |
| Iranian | 37 | 0.4% |
| Irish | 1,253 | 14.0% |
| Italian | 198 | 2.2% |
| Korean | 7 | 0.1% |
| Mexican | 139 | 1.5% |
| Northern European | 22 | 0.3% |
| Norwegian | 789 | 8.8% |
| Polish | 132 | 1.5% |
| Portuguese | 6 | 0.1% |
| Potawatomi | 2 | 0.0% |
| Puerto Rican | 55 | 0.6% |
| Russian | 110 | 1.2% |
| Scandinavian | 105 | 1.2% |
| Scotch-Irish | 165 | 1.8% |
| Scottish | 260 | 2.9% |
| Shoshone | 3 | 0.0% |
| Sioux | 18 | 0.2% |
| Slovak | 9 | 0.1% |
| Slovene | 1 | 0.0% |
| Spaniard | 13 | 0.1% |
| Subsaharan African | 41 | 0.5% |
| Swedish | 167 | 1.9% |
| Swiss | 53 | 0.6% |
| Ukrainian | 3 | 0.0% |
| Welsh | 87 | 1.0% |
| Yugoslavian | 14 | 0.2% | View All 54 Rows |
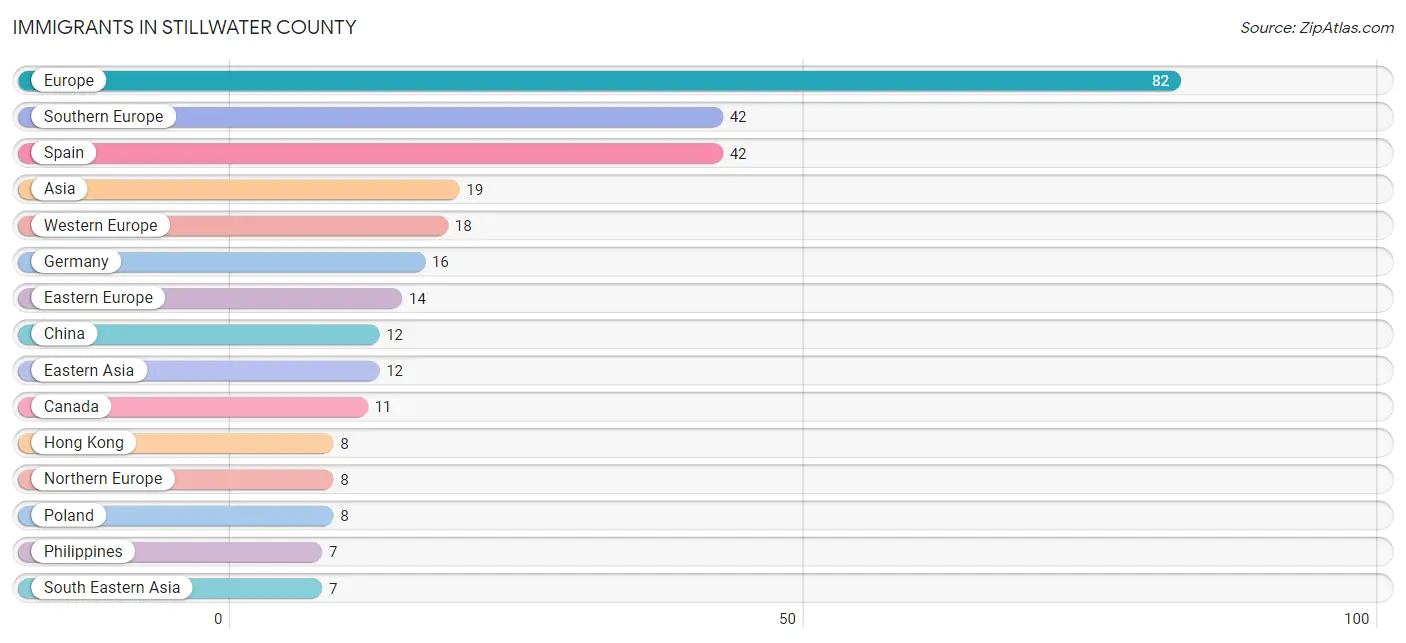
Immigrants in Stillwater County
The most numerous immigrant groups reported in Stillwater County came from Europe (82 | 0.9%), Southern Europe (42 | 0.5%), Spain (42 | 0.5%), Asia (19 | 0.2%), and Western Europe (18 | 0.2%), together accounting for 2.3% of all Stillwater County residents.
| Immigration Origin | # Population | % Population |
| Asia | 19 | 0.2% |
| Canada | 11 | 0.1% |
| China | 12 | 0.1% |
| Eastern Asia | 12 | 0.1% |
| Eastern Europe | 14 | 0.2% |
| Europe | 82 | 0.9% |
| Germany | 16 | 0.2% |
| Hong Kong | 8 | 0.1% |
| Hungary | 6 | 0.1% |
| Northern Europe | 8 | 0.1% |
| Philippines | 7 | 0.1% |
| Poland | 8 | 0.1% |
| Scotland | 2 | 0.0% |
| South Eastern Asia | 7 | 0.1% |
| Southern Europe | 42 | 0.5% |
| Spain | 42 | 0.5% |
| Switzerland | 2 | 0.0% |
| Western Europe | 18 | 0.2% | View All 18 Rows |
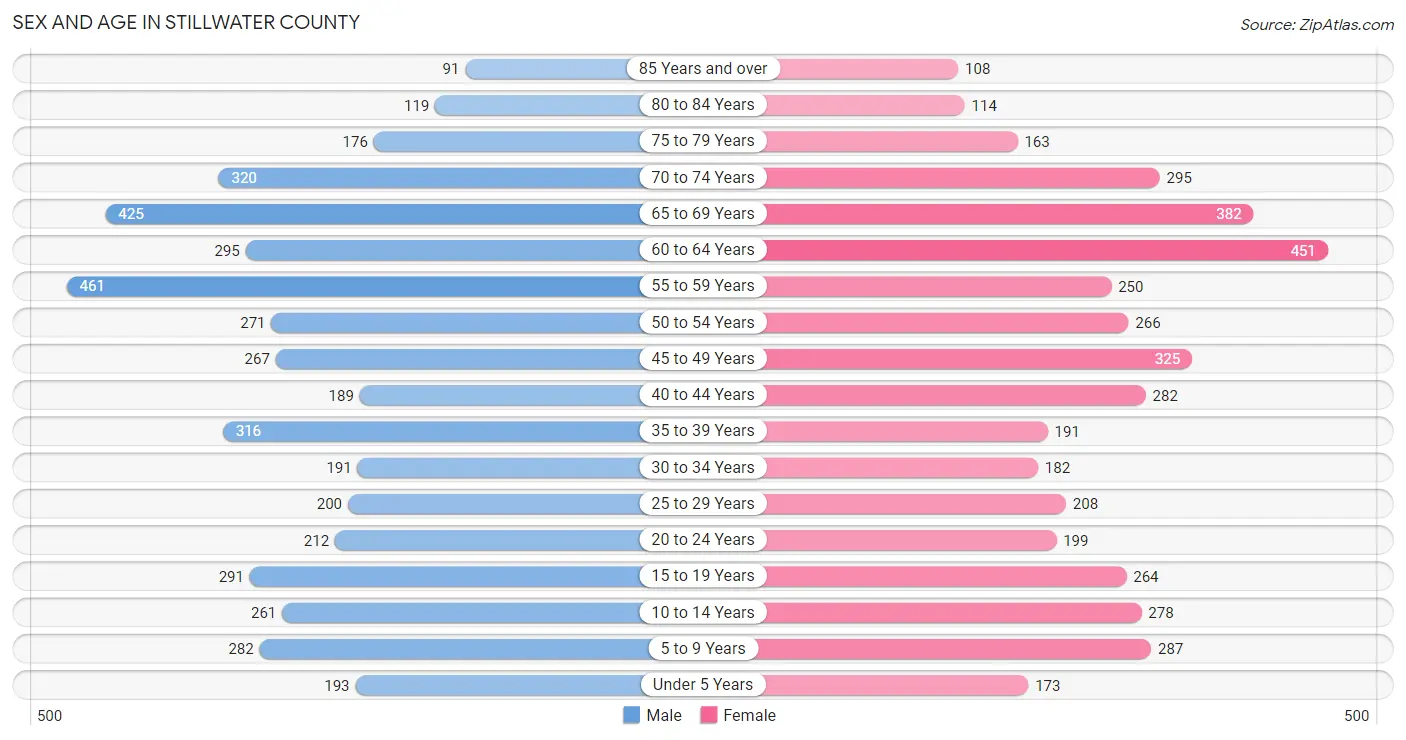
Sex and Age in Stillwater County
Sex and Age in Stillwater County
The most populous age groups in Stillwater County are 55 to 59 Years (461 | 10.1%) for men and 60 to 64 Years (451 | 10.2%) for women.
| Age Bracket | Male | Female |
| Under 5 Years | 193 (4.2%) | 173 (3.9%) |
| 5 to 9 Years | 282 (6.2%) | 287 (6.5%) |
| 10 to 14 Years | 261 (5.7%) | 278 (6.3%) |
| 15 to 19 Years | 291 (6.4%) | 264 (6.0%) |
| 20 to 24 Years | 212 (4.6%) | 199 (4.5%) |
| 25 to 29 Years | 200 (4.4%) | 208 (4.7%) |
| 30 to 34 Years | 191 (4.2%) | 182 (4.1%) |
| 35 to 39 Years | 316 (6.9%) | 191 (4.3%) |
| 40 to 44 Years | 189 (4.1%) | 282 (6.4%) |
| 45 to 49 Years | 267 (5.9%) | 325 (7.4%) |
| 50 to 54 Years | 271 (5.9%) | 266 (6.0%) |
| 55 to 59 Years | 461 (10.1%) | 250 (5.7%) |
| 60 to 64 Years | 295 (6.5%) | 451 (10.2%) |
| 65 to 69 Years | 425 (9.3%) | 382 (8.6%) |
| 70 to 74 Years | 320 (7.0%) | 295 (6.7%) |
| 75 to 79 Years | 176 (3.9%) | 163 (3.7%) |
| 80 to 84 Years | 119 (2.6%) | 114 (2.6%) |
| 85 Years and over | 91 (2.0%) | 108 (2.4%) |
| Total | 4,560 (100.0%) | 4,418 (100.0%) |
Families and Households in Stillwater County
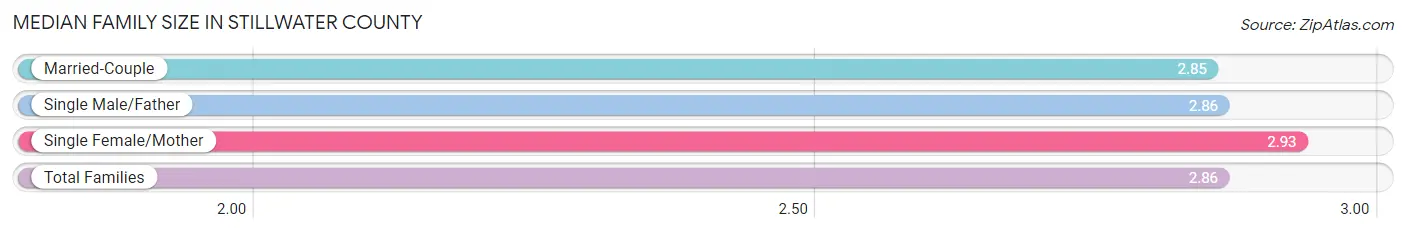
Median Family Size in Stillwater County
The median family size in Stillwater County is 2.86 persons per family, with single female/mother families (294 | 11.3%) accounting for the largest median family size of 2.93 persons per family. On the other hand, married-couple families (2,237 | 85.9%) represent the smallest median family size with 2.85 persons per family.
| Family Type | # Families | Family Size |
| Married-Couple | 2,237 (85.9%) | 2.85 |
| Single Male/Father | 72 (2.8%) | 2.86 |
| Single Female/Mother | 294 (11.3%) | 2.93 |
| Total Families | 2,603 (100.0%) | 2.86 |
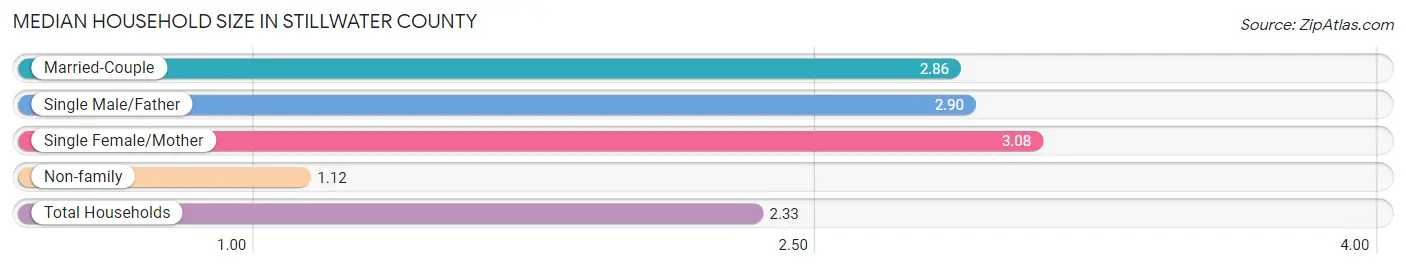
Median Household Size in Stillwater County
The median household size in Stillwater County is 2.33 persons per household, with single female/mother households (294 | 7.7%) accounting for the largest median household size of 3.08 persons per household. non-family households (1,198 | 31.5%) represent the smallest median household size with 1.12 persons per household.
| Household Type | # Households | Household Size |
| Married-Couple | 2,237 (58.9%) | 2.86 |
| Single Male/Father | 72 (1.9%) | 2.90 |
| Single Female/Mother | 294 (7.7%) | 3.08 |
| Non-family | 1,198 (31.5%) | 1.12 |
| Total Households | 3,801 (100.0%) | 2.33 |
Household Size by Marriage Status in Stillwater County
Out of a total of 3,801 households in Stillwater County, 2,603 (68.5%) are family households, while 1,198 (31.5%) are nonfamily households. The most numerous type of family households are 2-person households, comprising 1,572, and the most common type of nonfamily households are 1-person households, comprising 1,054.
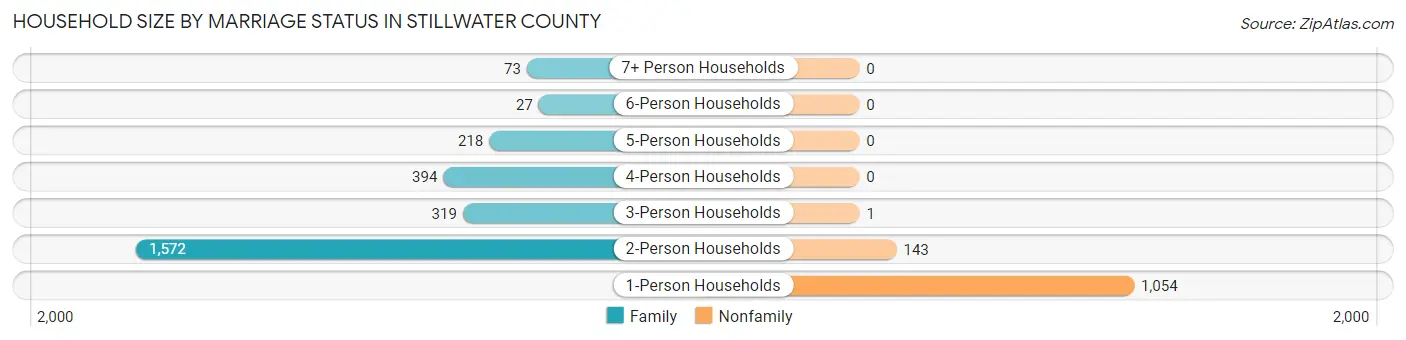
| Household Size | Family Households | Nonfamily Households |
| 1-Person Households | - | 1,054 (27.7%) |
| 2-Person Households | 1,572 (41.4%) | 143 (3.8%) |
| 3-Person Households | 319 (8.4%) | 1 (0.0%) |
| 4-Person Households | 394 (10.4%) | 0 (0.0%) |
| 5-Person Households | 218 (5.7%) | 0 (0.0%) |
| 6-Person Households | 27 (0.7%) | 0 (0.0%) |
| 7+ Person Households | 73 (1.9%) | 0 (0.0%) |
| Total | 2,603 (68.5%) | 1,198 (31.5%) |
Female Fertility in Stillwater County
Fertility by Age in Stillwater County
Average fertility rate in Stillwater County is 54.0 births per 1,000 women. Women in the age bracket of 20 to 34 years have the highest fertility rate with 141.0 births per 1,000 women. Women in the age bracket of 20 to 34 years acount for 90.2% of all women with births.
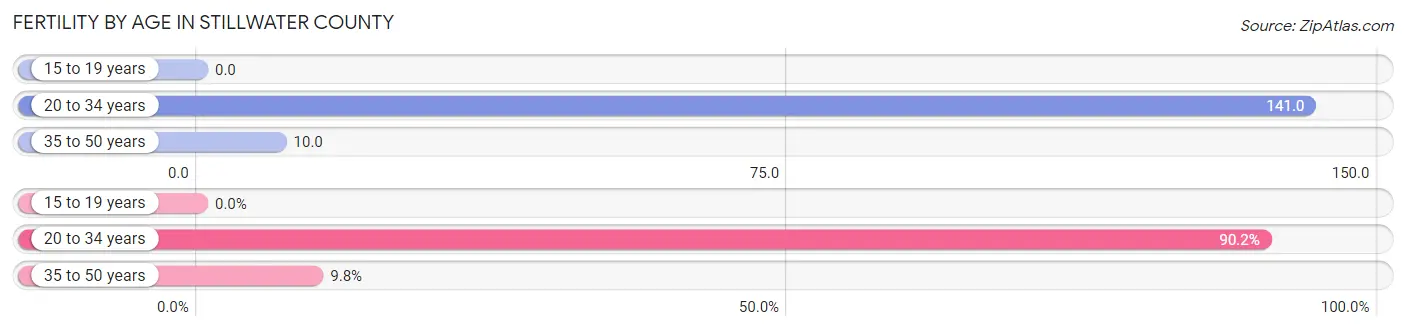
| Age Bracket | Women with Births | Births / 1,000 Women |
| 15 to 19 years | 0 (0.0%) | 0.0 |
| 20 to 34 years | 83 (90.2%) | 141.0 |
| 35 to 50 years | 9 (9.8%) | 10.0 |
| Total | 92 (100.0%) | 54.0 |
Fertility by Age by Marriage Status in Stillwater County
95.7% of women with births (92) in Stillwater County are married. The highest percentage of unmarried women with births falls into 35 to 50 years age bracket with 22.2% of them unmarried at the time of birth, while the lowest percentage of unmarried women with births belong to 20 to 34 years age bracket with 2.4% of them unmarried.
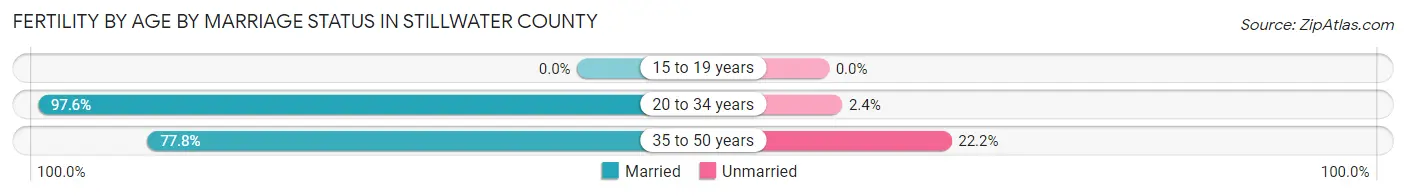
| Age Bracket | Married | Unmarried |
| 15 to 19 years | 0 (0.0%) | 0 (0.0%) |
| 20 to 34 years | 81 (97.6%) | 2 (2.4%) |
| 35 to 50 years | 7 (77.8%) | 2 (22.2%) |
| Total | 88 (95.7%) | 4 (4.3%) |
Fertility by Education in Stillwater County
Average fertility rate in Stillwater County is 54.0 births per 1,000 women. Women with the education attainment of high school diploma have the highest fertility rate of 88.0 births per 1,000 women, while women with the education attainment of bachelor's degree have the lowest fertility at 20.0 births per 1,000 women. Women with the education attainment of high school diploma represent 39.1% of all women with births.
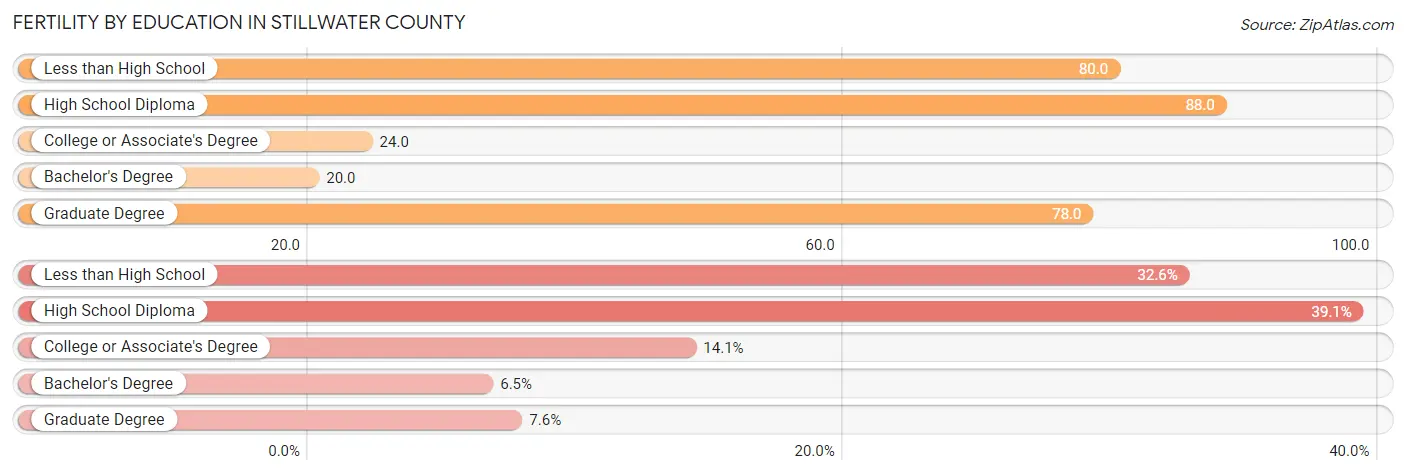
| Educational Attainment | Women with Births | Births / 1,000 Women |
| Less than High School | 30 (32.6%) | 80.0 |
| High School Diploma | 36 (39.1%) | 88.0 |
| College or Associate's Degree | 13 (14.1%) | 24.0 |
| Bachelor's Degree | 6 (6.5%) | 20.0 |
| Graduate Degree | 7 (7.6%) | 78.0 |
| Total | 92 (100.0%) | 54.0 |
Fertility by Education by Marriage Status in Stillwater County
4.3% of women with births in Stillwater County are unmarried. Women with the educational attainment of less than high school are most likely to be married with 100.0% of them married at childbirth, while women with the educational attainment of bachelor's degree are least likely to be married with 33.3% of them unmarried at childbirth.
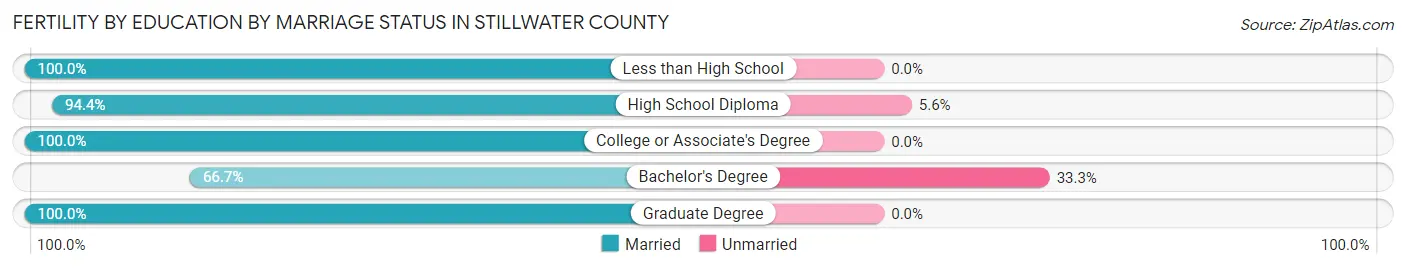
| Educational Attainment | Married | Unmarried |
| Less than High School | 30 (100.0%) | 0 (0.0%) |
| High School Diploma | 34 (94.4%) | 2 (5.6%) |
| College or Associate's Degree | 13 (100.0%) | 0 (0.0%) |
| Bachelor's Degree | 4 (66.7%) | 2 (33.3%) |
| Graduate Degree | 7 (100.0%) | 0 (0.0%) |
| Total | 88 (95.7%) | 4 (4.3%) |
Employment Characteristics in Stillwater County
Employment by Class of Employer in Stillwater County
Among the 4,243 employed individuals in Stillwater County, private company employees (2,695 | 63.5%), local government employees (432 | 10.2%), and self-employed (not incorporated) (386 | 9.1%) make up the most common classes of employment.
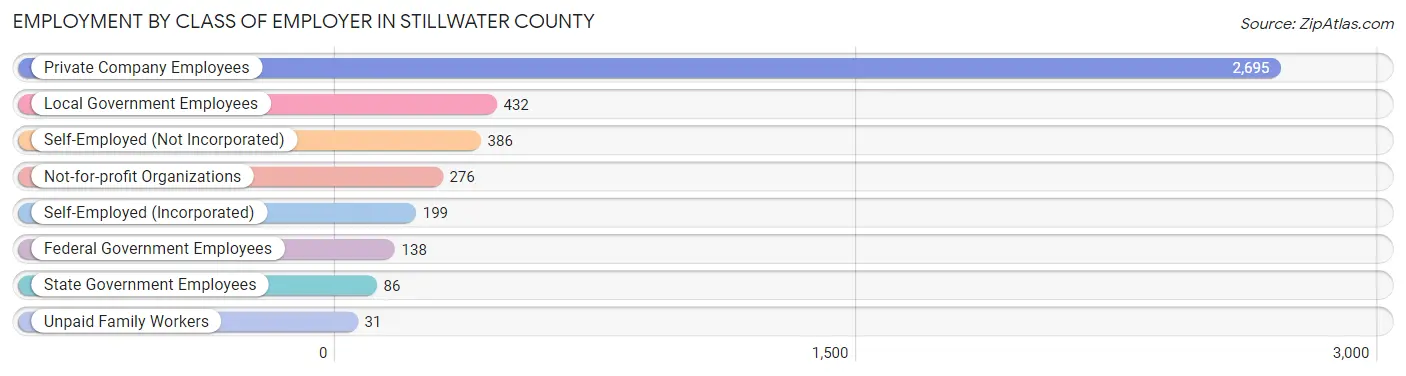
| Employer Class | # Employees | % Employees |
| Private Company Employees | 2,695 | 63.5% |
| Self-Employed (Incorporated) | 199 | 4.7% |
| Self-Employed (Not Incorporated) | 386 | 9.1% |
| Not-for-profit Organizations | 276 | 6.5% |
| Local Government Employees | 432 | 10.2% |
| State Government Employees | 86 | 2.0% |
| Federal Government Employees | 138 | 3.3% |
| Unpaid Family Workers | 31 | 0.7% |
| Total | 4,243 | 100.0% |
Employment Status by Age in Stillwater County
According to the labor force statistics for Stillwater County, out of the total population over 16 years of age (7,374), 59.8% or 4,410 individuals are in the labor force, with 2.6% or 115 of them unemployed. The age group with the highest labor force participation rate is 20 to 24 years, with 90.8% or 373 individuals in the labor force. Within the labor force, the 25 to 29 years age range has the highest percentage of unemployed individuals, with 7.9% or 28 of them being unemployed.
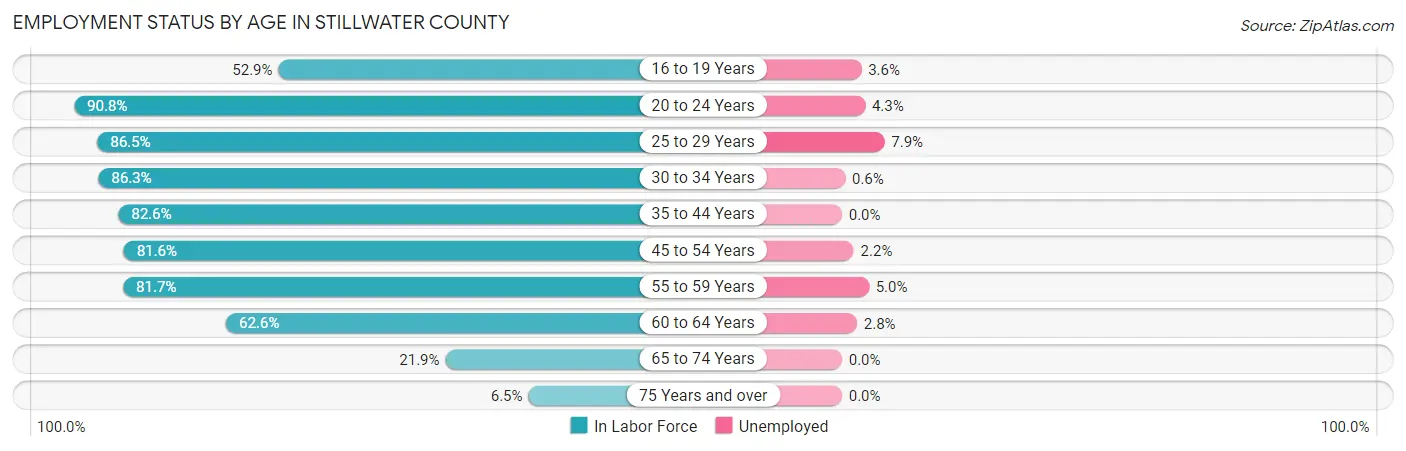
| Age Bracket | In Labor Force | Unemployed |
| 16 to 19 Years | 225 (52.9%) | 8 (3.6%) |
| 20 to 24 Years | 373 (90.8%) | 16 (4.3%) |
| 25 to 29 Years | 353 (86.5%) | 28 (7.9%) |
| 30 to 34 Years | 322 (86.3%) | 2 (0.6%) |
| 35 to 44 Years | 808 (82.6%) | 0 (0.0%) |
| 45 to 54 Years | 921 (81.6%) | 20 (2.2%) |
| 55 to 59 Years | 581 (81.7%) | 29 (5.0%) |
| 60 to 64 Years | 467 (62.6%) | 13 (2.8%) |
| 65 to 74 Years | 311 (21.9%) | 0 (0.0%) |
| 75 Years and over | 50 (6.5%) | 0 (0.0%) |
| Total | 4,410 (59.8%) | 115 (2.6%) |
Employment Status by Educational Attainment in Stillwater County
According to labor force statistics for Stillwater County, 79.4% of individuals (3,450) out of the total population between 25 and 64 years of age (4,345) are in the labor force, with 2.7% or 93 of them being unemployed. The group with the highest labor force participation rate are those with the educational attainment of high school diploma, with 85.2% or 1,235 individuals in the labor force. Within the labor force, individuals with less than high school education have the highest percentage of unemployment, with 12.4% or 27 of them being unemployed.
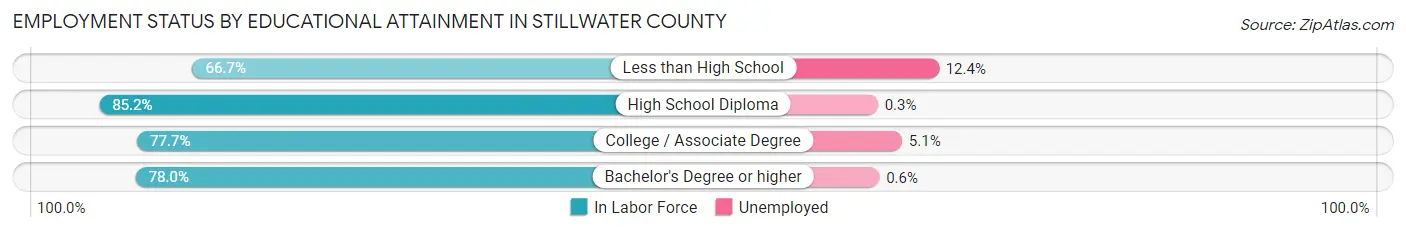
| Educational Attainment | In Labor Force | Unemployed |
| Less than High School | 218 (66.7%) | 41 (12.4%) |
| High School Diploma | 1,235 (85.2%) | 4 (0.3%) |
| College / Associate Degree | 1,104 (77.7%) | 72 (5.1%) |
| Bachelor's Degree or higher | 895 (78.0%) | 7 (0.6%) |
| Total | 3,450 (79.4%) | 117 (2.7%) |
Employment Occupations by Sex in Stillwater County
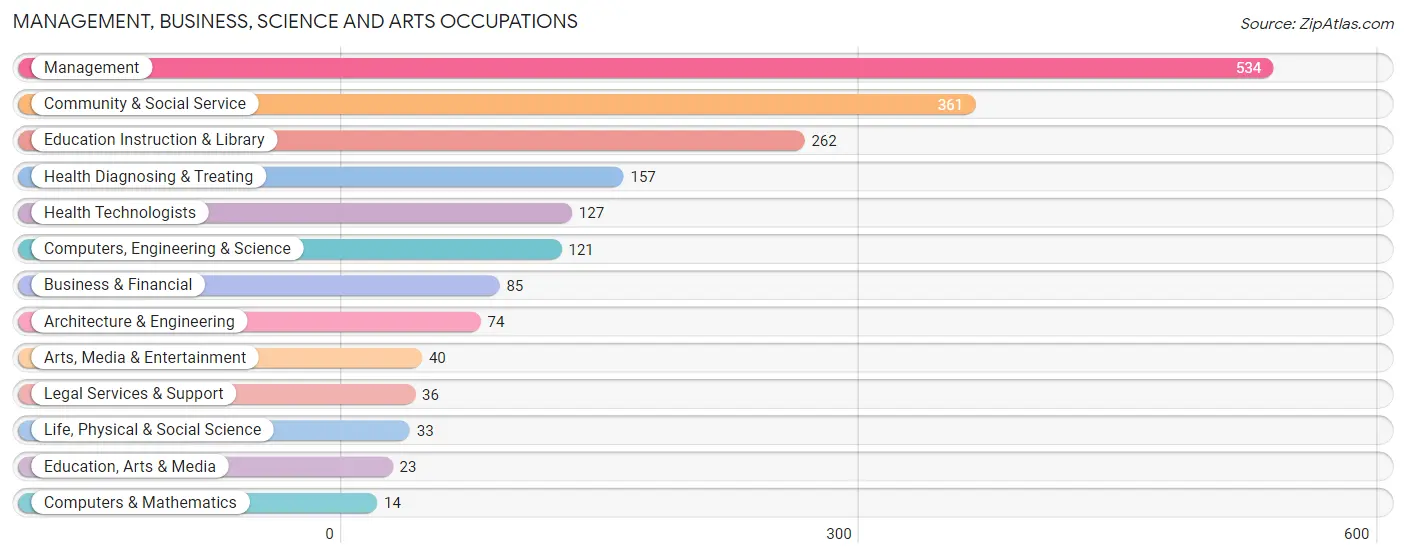
Management, Business, Science and Arts Occupations
The most common Management, Business, Science and Arts occupations in Stillwater County are Management (534 | 12.5%), Community & Social Service (361 | 8.5%), Education Instruction & Library (262 | 6.1%), Health Diagnosing & Treating (157 | 3.7%), and Health Technologists (127 | 3.0%).
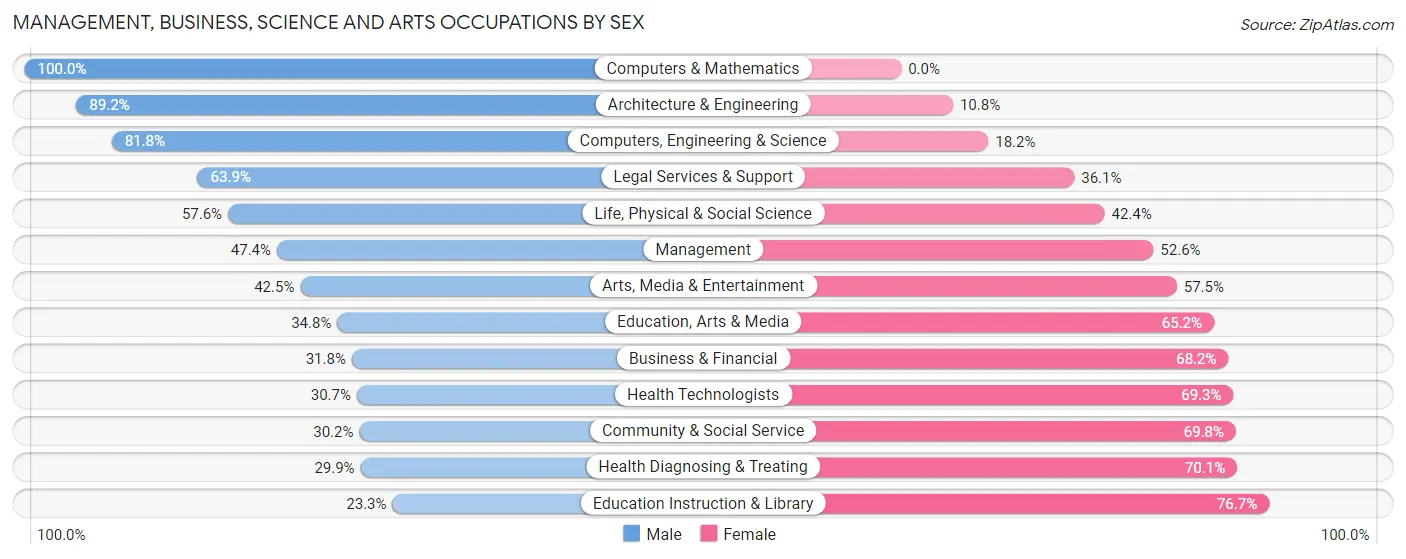
Management, Business, Science and Arts Occupations by Sex
Within the Management, Business, Science and Arts occupations in Stillwater County, the most male-oriented occupations are Computers & Mathematics (100.0%), Architecture & Engineering (89.2%), and Computers, Engineering & Science (81.8%), while the most female-oriented occupations are Education Instruction & Library (76.7%), Health Diagnosing & Treating (70.1%), and Community & Social Service (69.8%).
| Occupation | Male | Female |
| Management | 253 (47.4%) | 281 (52.6%) |
| Business & Financial | 27 (31.8%) | 58 (68.2%) |
| Computers, Engineering & Science | 99 (81.8%) | 22 (18.2%) |
| Computers & Mathematics | 14 (100.0%) | 0 (0.0%) |
| Architecture & Engineering | 66 (89.2%) | 8 (10.8%) |
| Life, Physical & Social Science | 19 (57.6%) | 14 (42.4%) |
| Community & Social Service | 109 (30.2%) | 252 (69.8%) |
| Education, Arts & Media | 8 (34.8%) | 15 (65.2%) |
| Legal Services & Support | 23 (63.9%) | 13 (36.1%) |
| Education Instruction & Library | 61 (23.3%) | 201 (76.7%) |
| Arts, Media & Entertainment | 17 (42.5%) | 23 (57.5%) |
| Health Diagnosing & Treating | 47 (29.9%) | 110 (70.1%) |
| Health Technologists | 39 (30.7%) | 88 (69.3%) |
| Total (Category) | 535 (42.5%) | 723 (57.5%) |
| Total (Overall) | 2,454 (57.5%) | 1,815 (42.5%) |
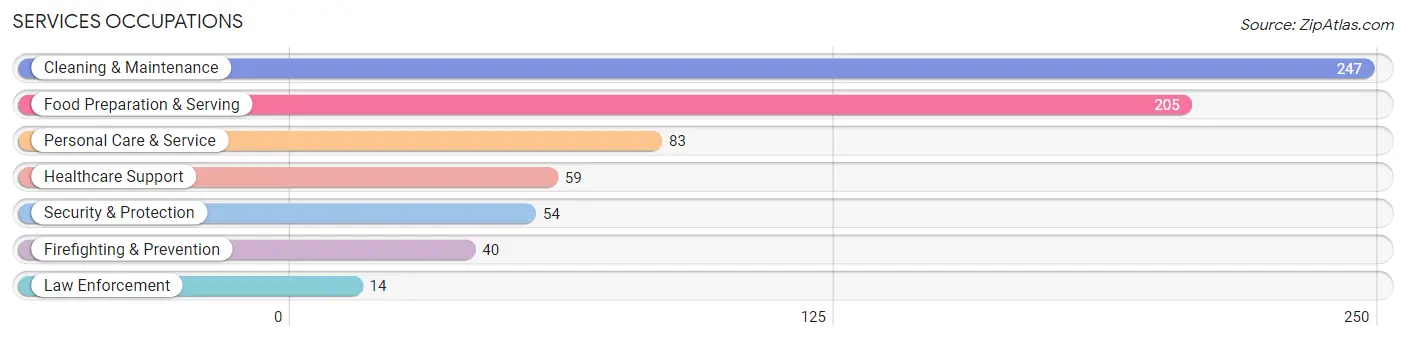
Services Occupations
The most common Services occupations in Stillwater County are Cleaning & Maintenance (247 | 5.8%), Food Preparation & Serving (205 | 4.8%), Personal Care & Service (83 | 1.9%), Healthcare Support (59 | 1.4%), and Security & Protection (54 | 1.3%).
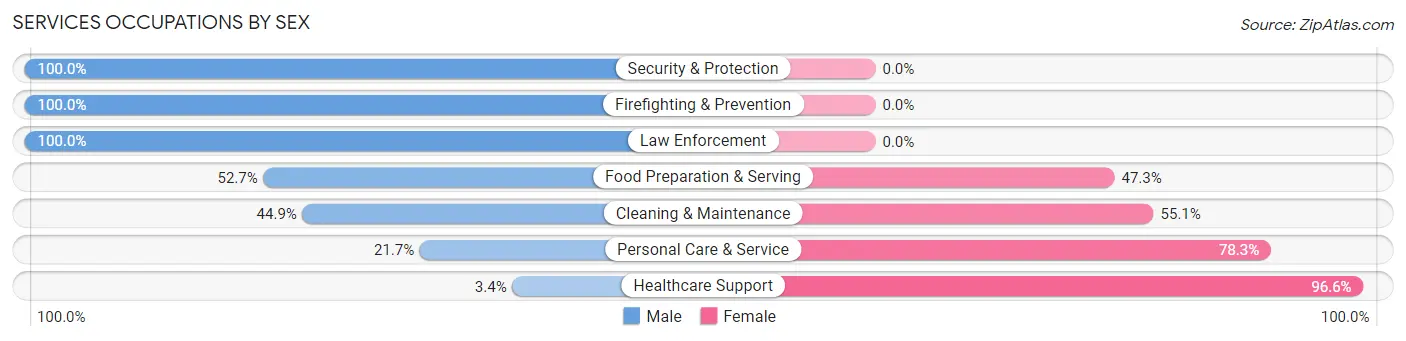
Services Occupations by Sex
Within the Services occupations in Stillwater County, the most male-oriented occupations are Security & Protection (100.0%), Firefighting & Prevention (100.0%), and Law Enforcement (100.0%), while the most female-oriented occupations are Healthcare Support (96.6%), Personal Care & Service (78.3%), and Cleaning & Maintenance (55.1%).
| Occupation | Male | Female |
| Healthcare Support | 2 (3.4%) | 57 (96.6%) |
| Security & Protection | 54 (100.0%) | 0 (0.0%) |
| Firefighting & Prevention | 40 (100.0%) | 0 (0.0%) |
| Law Enforcement | 14 (100.0%) | 0 (0.0%) |
| Food Preparation & Serving | 108 (52.7%) | 97 (47.3%) |
| Cleaning & Maintenance | 111 (44.9%) | 136 (55.1%) |
| Personal Care & Service | 18 (21.7%) | 65 (78.3%) |
| Total (Category) | 293 (45.2%) | 355 (54.8%) |
| Total (Overall) | 2,454 (57.5%) | 1,815 (42.5%) |
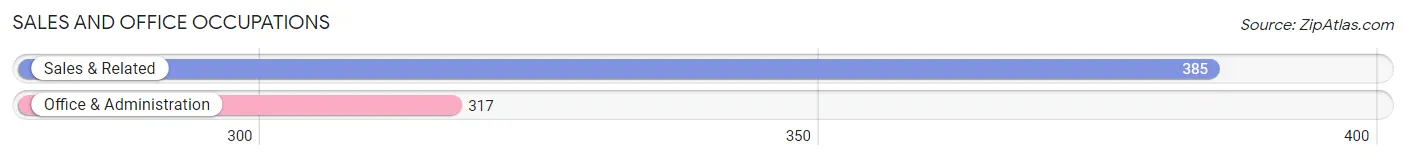
Sales and Office Occupations
The most common Sales and Office occupations in Stillwater County are Sales & Related (385 | 9.0%), and Office & Administration (317 | 7.4%).
Sales and Office Occupations by Sex
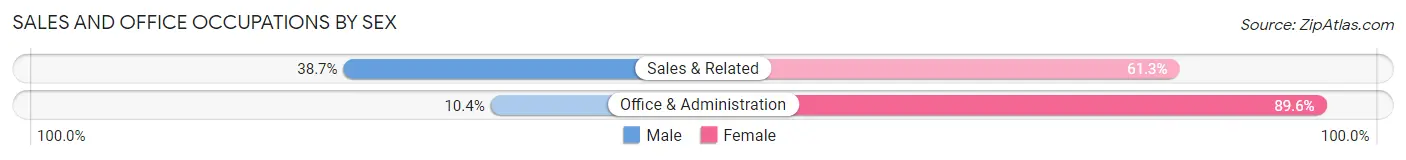
| Occupation | Male | Female |
| Sales & Related | 149 (38.7%) | 236 (61.3%) |
| Office & Administration | 33 (10.4%) | 284 (89.6%) |
| Total (Category) | 182 (25.9%) | 520 (74.1%) |
| Total (Overall) | 2,454 (57.5%) | 1,815 (42.5%) |
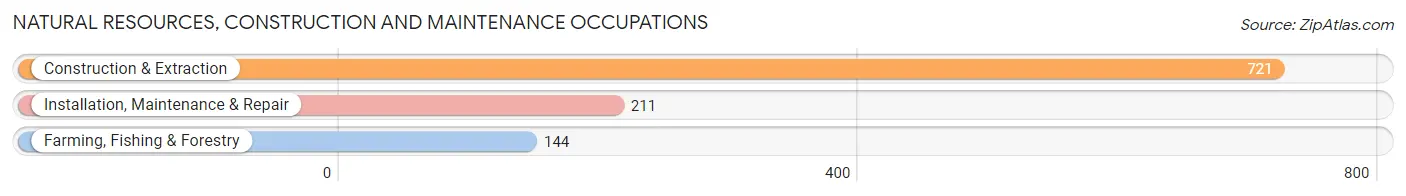
Natural Resources, Construction and Maintenance Occupations
The most common Natural Resources, Construction and Maintenance occupations in Stillwater County are Construction & Extraction (721 | 16.9%), Installation, Maintenance & Repair (211 | 4.9%), and Farming, Fishing & Forestry (144 | 3.4%).
Natural Resources, Construction and Maintenance Occupations by Sex
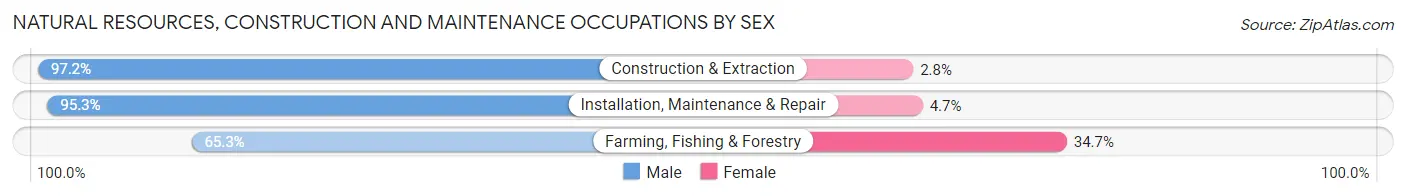
| Occupation | Male | Female |
| Farming, Fishing & Forestry | 94 (65.3%) | 50 (34.7%) |
| Construction & Extraction | 701 (97.2%) | 20 (2.8%) |
| Installation, Maintenance & Repair | 201 (95.3%) | 10 (4.7%) |
| Total (Category) | 996 (92.6%) | 80 (7.4%) |
| Total (Overall) | 2,454 (57.5%) | 1,815 (42.5%) |
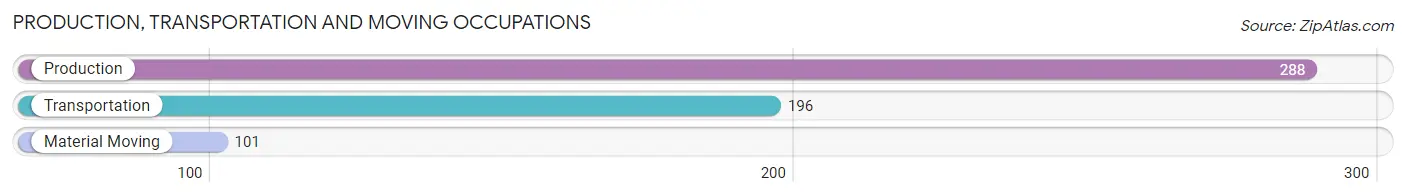
Production, Transportation and Moving Occupations
The most common Production, Transportation and Moving occupations in Stillwater County are Production (288 | 6.8%), Transportation (196 | 4.6%), and Material Moving (101 | 2.4%).
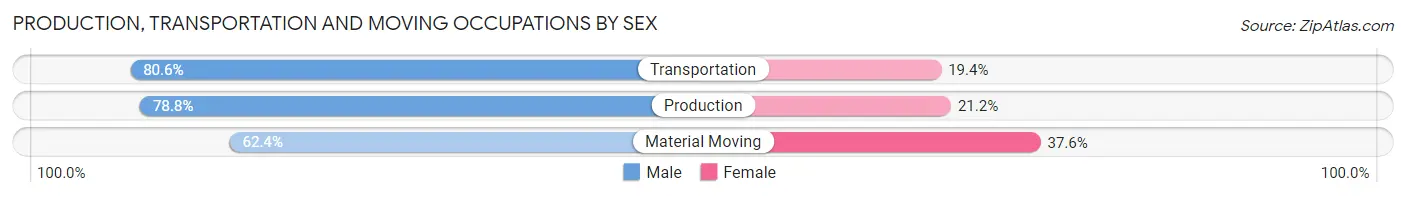
Production, Transportation and Moving Occupations by Sex
| Occupation | Male | Female |
| Production | 227 (78.8%) | 61 (21.2%) |
| Transportation | 158 (80.6%) | 38 (19.4%) |
| Material Moving | 63 (62.4%) | 38 (37.6%) |
| Total (Category) | 448 (76.6%) | 137 (23.4%) |
| Total (Overall) | 2,454 (57.5%) | 1,815 (42.5%) |
Employment Industries by Sex in Stillwater County
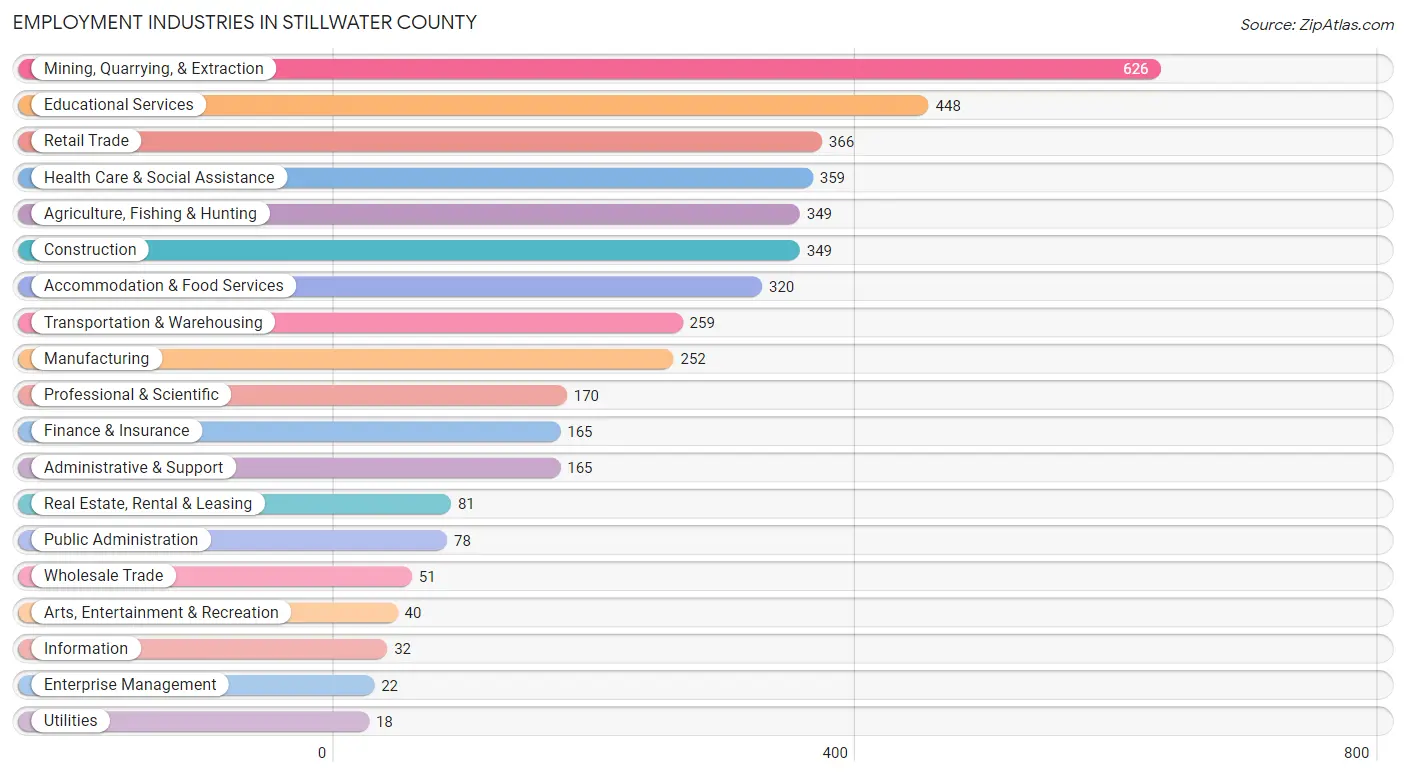
Employment Industries in Stillwater County
The major employment industries in Stillwater County include Mining, Quarrying, & Extraction (626 | 14.7%), Educational Services (448 | 10.5%), Retail Trade (366 | 8.6%), Health Care & Social Assistance (359 | 8.4%), and Agriculture, Fishing & Hunting (349 | 8.2%).
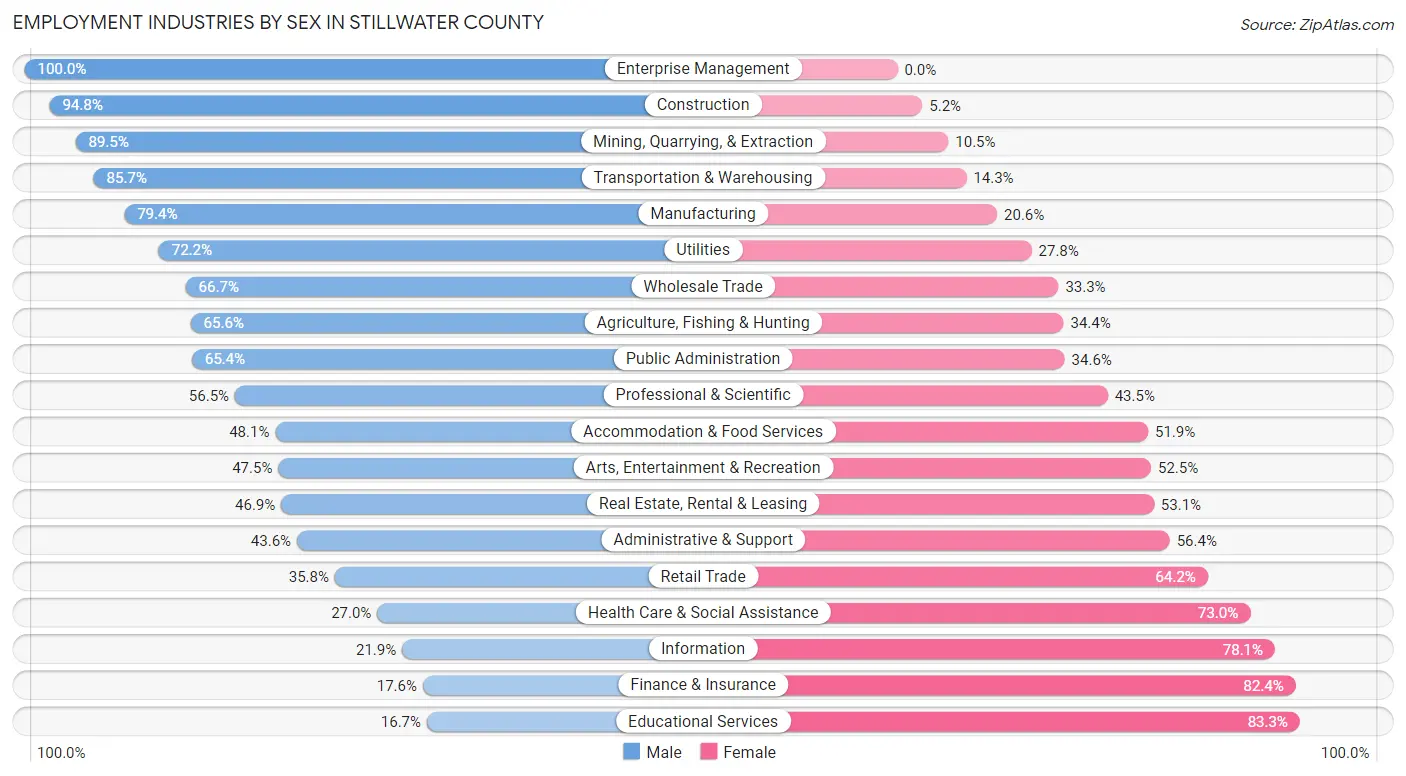
Employment Industries by Sex in Stillwater County
The Stillwater County industries that see more men than women are Enterprise Management (100.0%), Construction (94.8%), and Mining, Quarrying, & Extraction (89.5%), whereas the industries that tend to have a higher number of women are Educational Services (83.3%), Finance & Insurance (82.4%), and Information (78.1%).
| Industry | Male | Female |
| Agriculture, Fishing & Hunting | 229 (65.6%) | 120 (34.4%) |
| Mining, Quarrying, & Extraction | 560 (89.5%) | 66 (10.5%) |
| Construction | 331 (94.8%) | 18 (5.2%) |
| Manufacturing | 200 (79.4%) | 52 (20.6%) |
| Wholesale Trade | 34 (66.7%) | 17 (33.3%) |
| Retail Trade | 131 (35.8%) | 235 (64.2%) |
| Transportation & Warehousing | 222 (85.7%) | 37 (14.3%) |
| Utilities | 13 (72.2%) | 5 (27.8%) |
| Information | 7 (21.9%) | 25 (78.1%) |
| Finance & Insurance | 29 (17.6%) | 136 (82.4%) |
| Real Estate, Rental & Leasing | 38 (46.9%) | 43 (53.1%) |
| Professional & Scientific | 96 (56.5%) | 74 (43.5%) |
| Enterprise Management | 22 (100.0%) | 0 (0.0%) |
| Administrative & Support | 72 (43.6%) | 93 (56.4%) |
| Educational Services | 75 (16.7%) | 373 (83.3%) |
| Health Care & Social Assistance | 97 (27.0%) | 262 (73.0%) |
| Arts, Entertainment & Recreation | 19 (47.5%) | 21 (52.5%) |
| Accommodation & Food Services | 154 (48.1%) | 166 (51.9%) |
| Public Administration | 51 (65.4%) | 27 (34.6%) |
| Total | 2,454 (57.5%) | 1,815 (42.5%) |
Education in Stillwater County
School Enrollment in Stillwater County
The most common levels of schooling among the 1,771 students in Stillwater County are high school (484 | 27.3%), elementary school (470 | 26.5%), and middle school (410 | 23.2%).
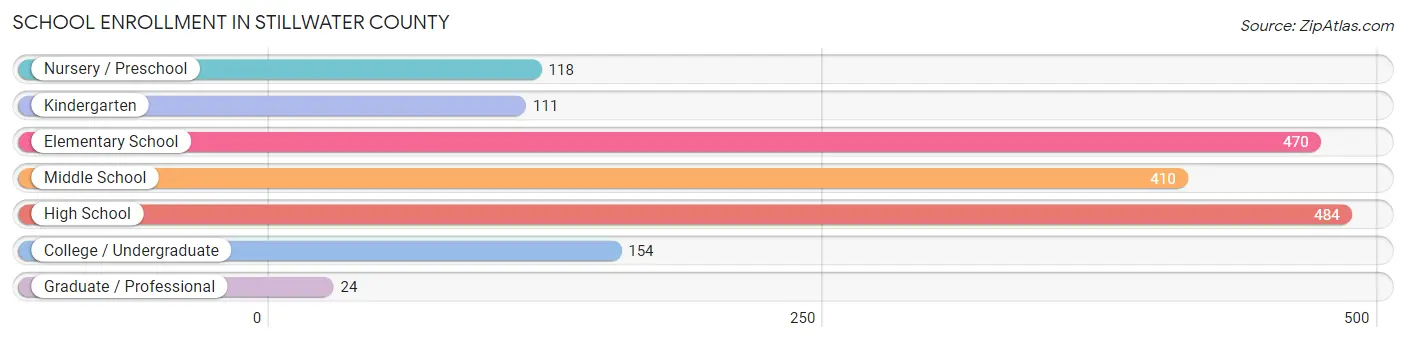
| School Level | # Students | % Students |
| Nursery / Preschool | 118 | 6.7% |
| Kindergarten | 111 | 6.3% |
| Elementary School | 470 | 26.5% |
| Middle School | 410 | 23.2% |
| High School | 484 | 27.3% |
| College / Undergraduate | 154 | 8.7% |
| Graduate / Professional | 24 | 1.4% |
| Total | 1,771 | 100.0% |
School Enrollment by Age by Funding Source in Stillwater County
Out of a total of 1,771 students who are enrolled in schools in Stillwater County, 292 (16.5%) attend a private institution, while the remaining 1,479 (83.5%) are enrolled in public schools. The age group of 25 to 34 year olds has the highest likelihood of being enrolled in private schools, with 8 (88.9% in the age bracket) enrolled. Conversely, the age group of 18 to 19 year olds has the lowest likelihood of being enrolled in a private school, with 119 (100.0% in the age bracket) attending a public institution.
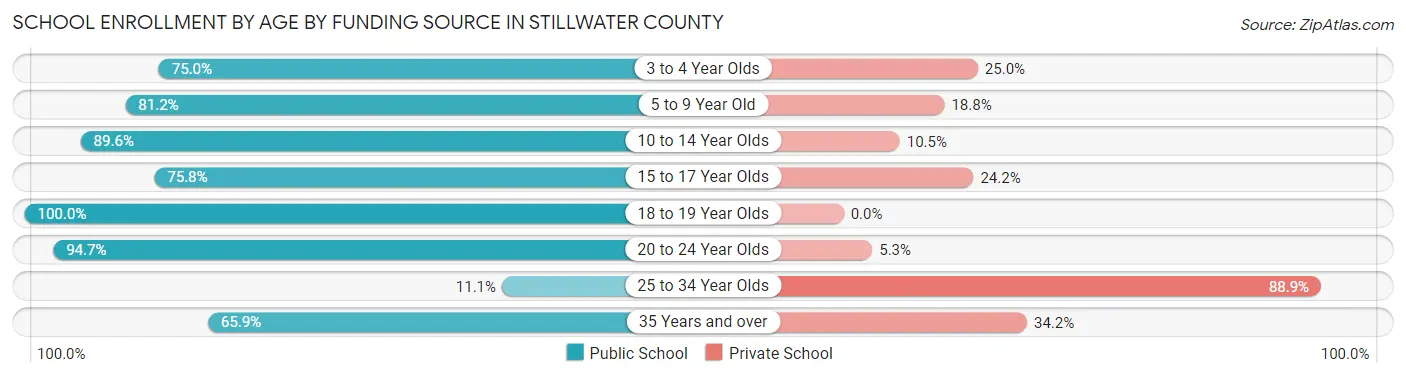
| Age Bracket | Public School | Private School |
| 3 to 4 Year Olds | 63 (75.0%) | 21 (25.0%) |
| 5 to 9 Year Old | 441 (81.2%) | 102 (18.8%) |
| 10 to 14 Year Olds | 480 (89.5%) | 56 (10.4%) |
| 15 to 17 Year Olds | 276 (75.8%) | 88 (24.2%) |
| 18 to 19 Year Olds | 119 (100.0%) | 0 (0.0%) |
| 20 to 24 Year Olds | 71 (94.7%) | 4 (5.3%) |
| 25 to 34 Year Olds | 1 (11.1%) | 8 (88.9%) |
| 35 Years and over | 27 (65.8%) | 14 (34.2%) |
| Total | 1,479 (83.5%) | 292 (16.5%) |
Educational Attainment by Field of Study in Stillwater County
Business (377 | 17.9%), education (363 | 17.2%), science & technology (318 | 15.1%), bio, nature & agricultural (255 | 12.1%), and liberal arts & history (143 | 6.8%) are the most common fields of study among 2,110 individuals in Stillwater County who have obtained a bachelor's degree or higher.
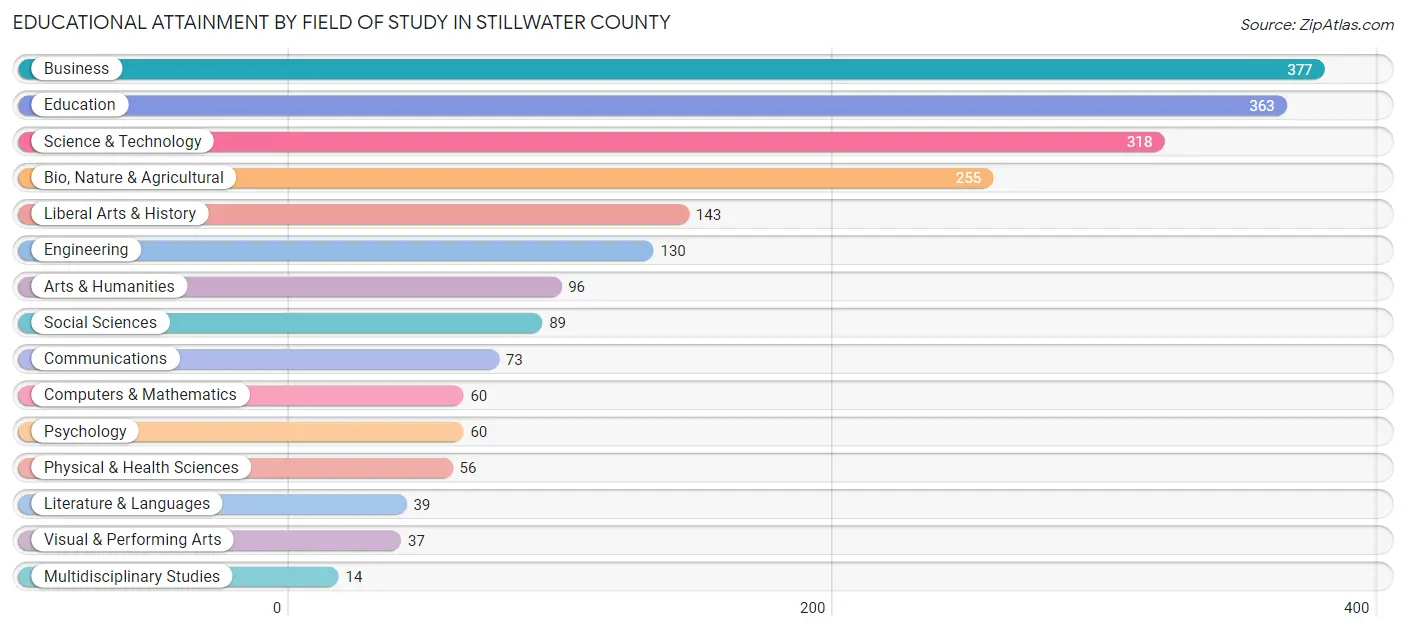
| Field of Study | # Graduates | % Graduates |
| Computers & Mathematics | 60 | 2.8% |
| Bio, Nature & Agricultural | 255 | 12.1% |
| Physical & Health Sciences | 56 | 2.6% |
| Psychology | 60 | 2.8% |
| Social Sciences | 89 | 4.2% |
| Engineering | 130 | 6.2% |
| Multidisciplinary Studies | 14 | 0.7% |
| Science & Technology | 318 | 15.1% |
| Business | 377 | 17.9% |
| Education | 363 | 17.2% |
| Literature & Languages | 39 | 1.8% |
| Liberal Arts & History | 143 | 6.8% |
| Visual & Performing Arts | 37 | 1.8% |
| Communications | 73 | 3.5% |
| Arts & Humanities | 96 | 4.5% |
| Total | 2,110 | 100.0% |
Transportation & Commute in Stillwater County
Vehicle Availability by Sex in Stillwater County
The most prevalent vehicle ownership categories in Stillwater County are males with 2 vehicles (871, accounting for 36.0%) and females with 2 vehicles (648, making up 49.7%).
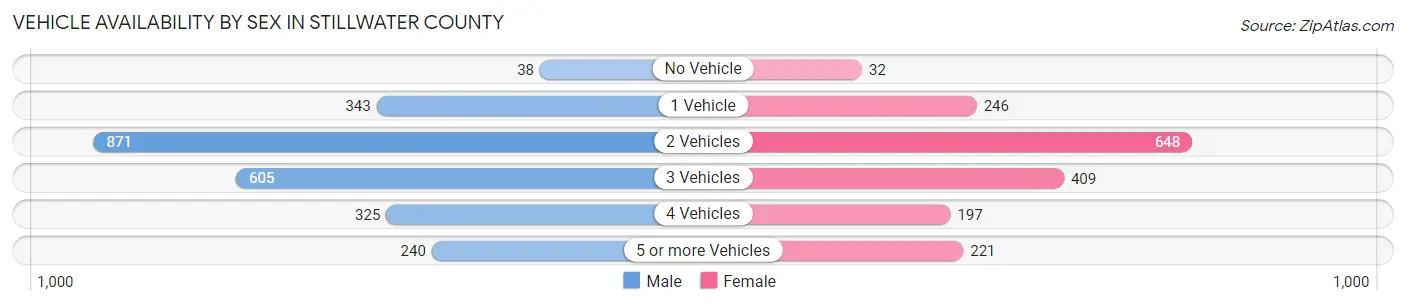
| Vehicles Available | Male | Female |
| No Vehicle | 38 (1.6%) | 32 (1.8%) |
| 1 Vehicle | 343 (14.2%) | 246 (14.0%) |
| 2 Vehicles | 871 (36.0%) | 648 (37.0%) |
| 3 Vehicles | 605 (25.0%) | 409 (23.3%) |
| 4 Vehicles | 325 (13.4%) | 197 (11.2%) |
| 5 or more Vehicles | 240 (9.9%) | 221 (12.6%) |
| Total | 2,422 (100.0%) | 1,753 (100.0%) |
Commute Time in Stillwater County
The most frequently occuring commute durations in Stillwater County are 5 to 9 minutes (550 commuters, 14.0%), less than 5 minutes (510 commuters, 12.9%), and 45 to 59 minutes (470 commuters, 11.9%).
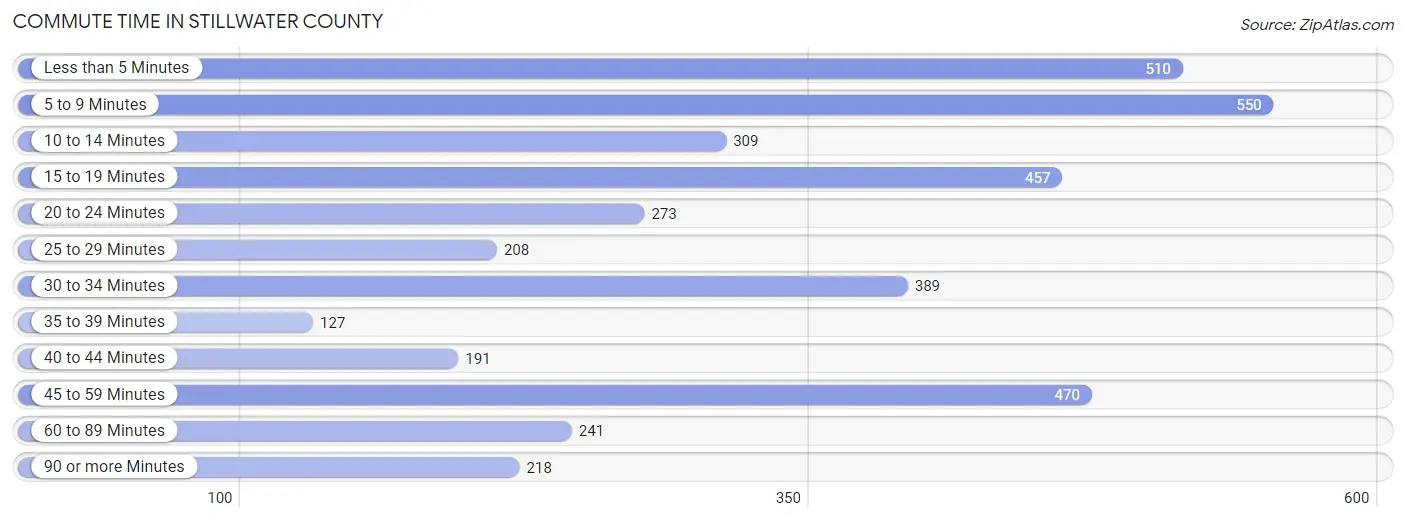
| Commute Time | # Commuters | % Commuters |
| Less than 5 Minutes | 510 | 12.9% |
| 5 to 9 Minutes | 550 | 14.0% |
| 10 to 14 Minutes | 309 | 7.8% |
| 15 to 19 Minutes | 457 | 11.6% |
| 20 to 24 Minutes | 273 | 6.9% |
| 25 to 29 Minutes | 208 | 5.3% |
| 30 to 34 Minutes | 389 | 9.9% |
| 35 to 39 Minutes | 127 | 3.2% |
| 40 to 44 Minutes | 191 | 4.8% |
| 45 to 59 Minutes | 470 | 11.9% |
| 60 to 89 Minutes | 241 | 6.1% |
| 90 or more Minutes | 218 | 5.5% |
Commute Time by Sex in Stillwater County
The most common commute times in Stillwater County are 45 to 59 minutes (352 commuters, 15.2%) for males and 5 to 9 minutes (299 commuters, 18.4%) for females.
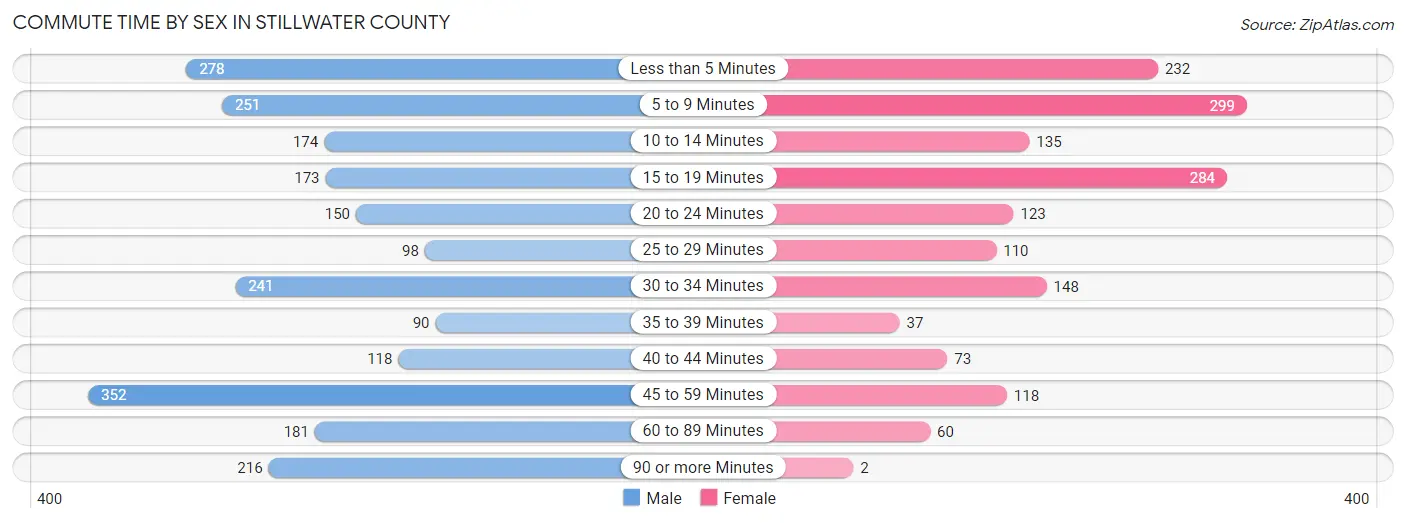
| Commute Time | Male | Female |
| Less than 5 Minutes | 278 (12.0%) | 232 (14.3%) |
| 5 to 9 Minutes | 251 (10.8%) | 299 (18.4%) |
| 10 to 14 Minutes | 174 (7.5%) | 135 (8.3%) |
| 15 to 19 Minutes | 173 (7.4%) | 284 (17.5%) |
| 20 to 24 Minutes | 150 (6.5%) | 123 (7.6%) |
| 25 to 29 Minutes | 98 (4.2%) | 110 (6.8%) |
| 30 to 34 Minutes | 241 (10.4%) | 148 (9.1%) |
| 35 to 39 Minutes | 90 (3.9%) | 37 (2.3%) |
| 40 to 44 Minutes | 118 (5.1%) | 73 (4.5%) |
| 45 to 59 Minutes | 352 (15.2%) | 118 (7.3%) |
| 60 to 89 Minutes | 181 (7.8%) | 60 (3.7%) |
| 90 or more Minutes | 216 (9.3%) | 2 (0.1%) |
Time of Departure to Work by Sex in Stillwater County
The most frequent times of departure to work in Stillwater County are 7:00 AM to 7:29 AM (359, 15.5%) for males and 7:30 AM to 7:59 AM (296, 18.3%) for females.
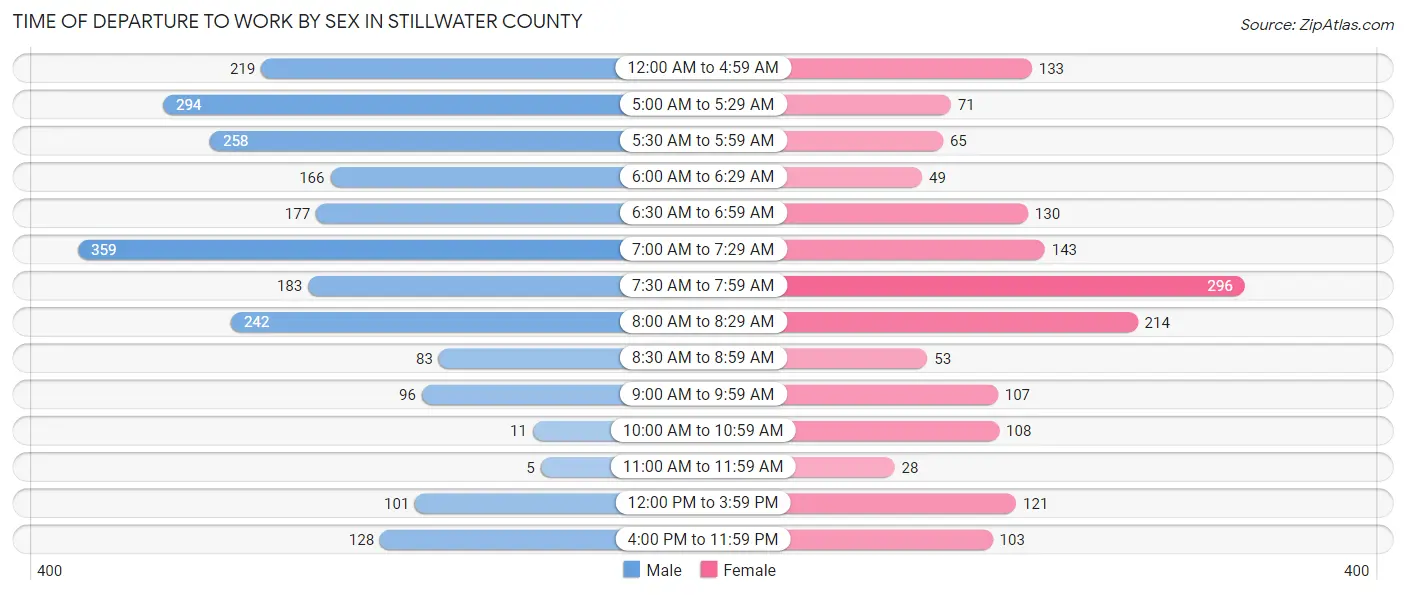
| Time of Departure | Male | Female |
| 12:00 AM to 4:59 AM | 219 (9.4%) | 133 (8.2%) |
| 5:00 AM to 5:29 AM | 294 (12.7%) | 71 (4.4%) |
| 5:30 AM to 5:59 AM | 258 (11.1%) | 65 (4.0%) |
| 6:00 AM to 6:29 AM | 166 (7.1%) | 49 (3.0%) |
| 6:30 AM to 6:59 AM | 177 (7.6%) | 130 (8.0%) |
| 7:00 AM to 7:29 AM | 359 (15.5%) | 143 (8.8%) |
| 7:30 AM to 7:59 AM | 183 (7.9%) | 296 (18.3%) |
| 8:00 AM to 8:29 AM | 242 (10.4%) | 214 (13.2%) |
| 8:30 AM to 8:59 AM | 83 (3.6%) | 53 (3.3%) |
| 9:00 AM to 9:59 AM | 96 (4.1%) | 107 (6.6%) |
| 10:00 AM to 10:59 AM | 11 (0.5%) | 108 (6.7%) |
| 11:00 AM to 11:59 AM | 5 (0.2%) | 28 (1.7%) |
| 12:00 PM to 3:59 PM | 101 (4.3%) | 121 (7.5%) |
| 4:00 PM to 11:59 PM | 128 (5.5%) | 103 (6.4%) |
| Total | 2,322 (100.0%) | 1,621 (100.0%) |
Housing Occupancy in Stillwater County
Occupancy by Ownership in Stillwater County
Of the total 3,801 dwellings in Stillwater County, owner-occupied units account for 3,182 (83.7%), while renter-occupied units make up 619 (16.3%).
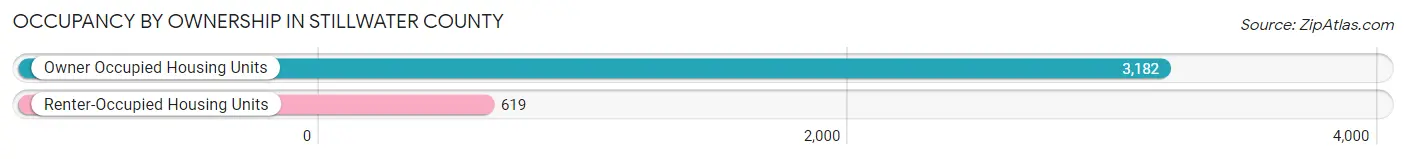
| Occupancy | # Housing Units | % Housing Units |
| Owner Occupied Housing Units | 3,182 | 83.7% |
| Renter-Occupied Housing Units | 619 | 16.3% |
| Total Occupied Housing Units | 3,801 | 100.0% |
Occupancy by Household Size in Stillwater County
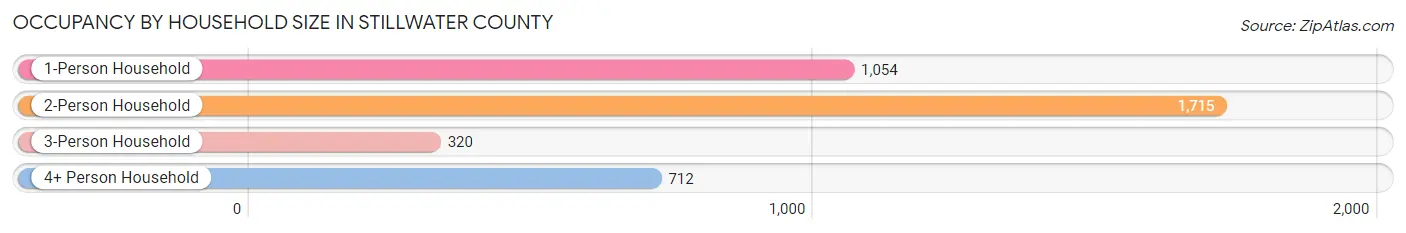
| Household Size | # Housing Units | % Housing Units |
| 1-Person Household | 1,054 | 27.7% |
| 2-Person Household | 1,715 | 45.1% |
| 3-Person Household | 320 | 8.4% |
| 4+ Person Household | 712 | 18.7% |
| Total Housing Units | 3,801 | 100.0% |
Occupancy by Ownership by Household Size in Stillwater County
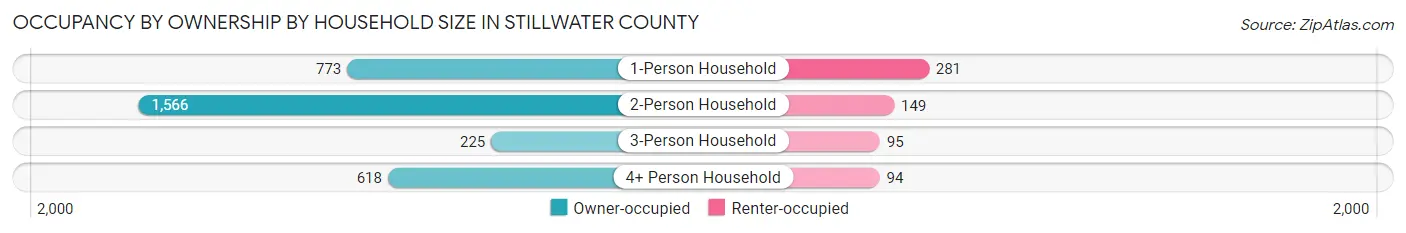
| Household Size | Owner-occupied | Renter-occupied |
| 1-Person Household | 773 (73.3%) | 281 (26.7%) |
| 2-Person Household | 1,566 (91.3%) | 149 (8.7%) |
| 3-Person Household | 225 (70.3%) | 95 (29.7%) |
| 4+ Person Household | 618 (86.8%) | 94 (13.2%) |
| Total Housing Units | 3,182 (83.7%) | 619 (16.3%) |
Occupancy by Educational Attainment in Stillwater County
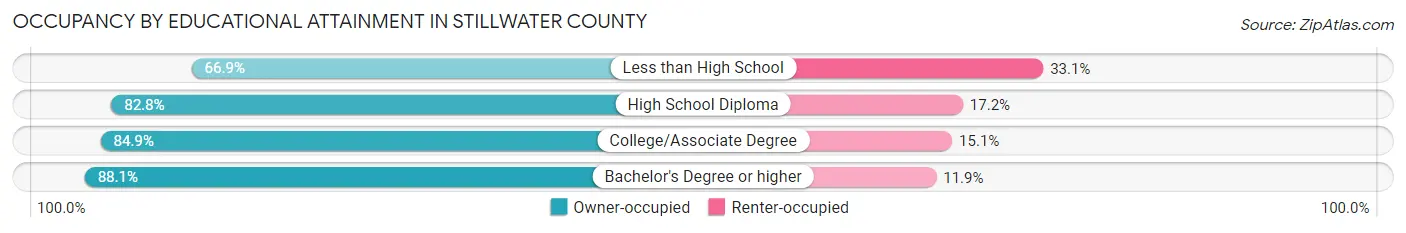
| Household Size | Owner-occupied | Renter-occupied |
| Less than High School | 214 (66.9%) | 106 (33.1%) |
| High School Diploma | 900 (82.8%) | 187 (17.2%) |
| College/Associate Degree | 1,093 (84.9%) | 194 (15.1%) |
| Bachelor's Degree or higher | 975 (88.1%) | 132 (11.9%) |
Occupancy by Age of Householder in Stillwater County
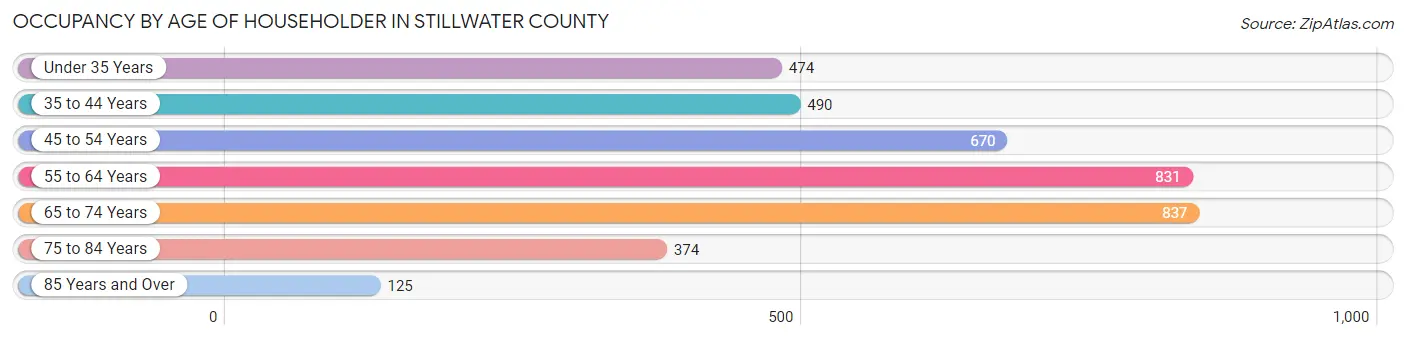
| Age Bracket | # Households | % Households |
| Under 35 Years | 474 | 12.5% |
| 35 to 44 Years | 490 | 12.9% |
| 45 to 54 Years | 670 | 17.6% |
| 55 to 64 Years | 831 | 21.9% |
| 65 to 74 Years | 837 | 22.0% |
| 75 to 84 Years | 374 | 9.8% |
| 85 Years and Over | 125 | 3.3% |
| Total | 3,801 | 100.0% |
Housing Finances in Stillwater County
Median Income by Occupancy in Stillwater County
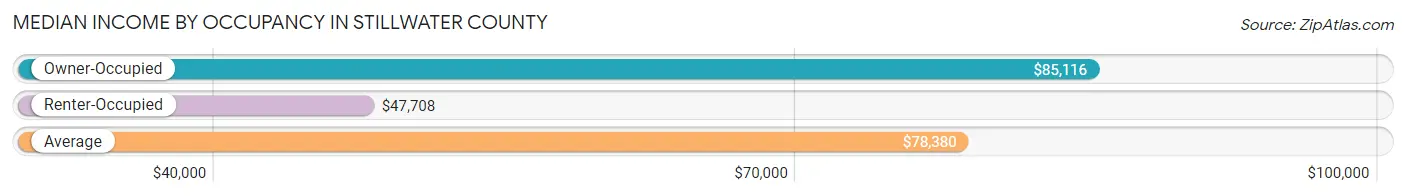
| Occupancy Type | # Households | Median Income |
| Owner-Occupied | 3,182 (83.7%) | $85,116 |
| Renter-Occupied | 619 (16.3%) | $47,708 |
| Average | 3,801 (100.0%) | $78,380 |
Occupancy by Householder Income Bracket in Stillwater County
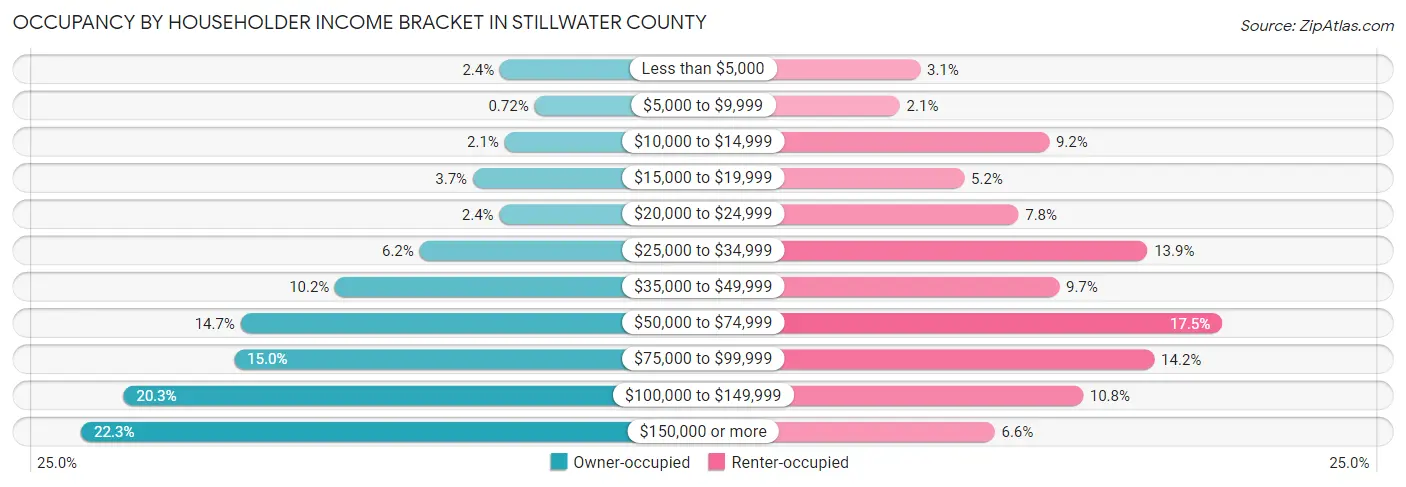
| Income Bracket | Owner-occupied | Renter-occupied |
| Less than $5,000 | 75 (2.4%) | 19 (3.1%) |
| $5,000 to $9,999 | 23 (0.7%) | 13 (2.1%) |
| $10,000 to $14,999 | 68 (2.1%) | 57 (9.2%) |
| $15,000 to $19,999 | 116 (3.6%) | 32 (5.2%) |
| $20,000 to $24,999 | 76 (2.4%) | 48 (7.7%) |
| $25,000 to $34,999 | 197 (6.2%) | 86 (13.9%) |
| $35,000 to $49,999 | 325 (10.2%) | 60 (9.7%) |
| $50,000 to $74,999 | 468 (14.7%) | 108 (17.4%) |
| $75,000 to $99,999 | 478 (15.0%) | 88 (14.2%) |
| $100,000 to $149,999 | 646 (20.3%) | 67 (10.8%) |
| $150,000 or more | 710 (22.3%) | 41 (6.6%) |
| Total | 3,182 (100.0%) | 619 (100.0%) |
Monthly Housing Cost Tiers in Stillwater County
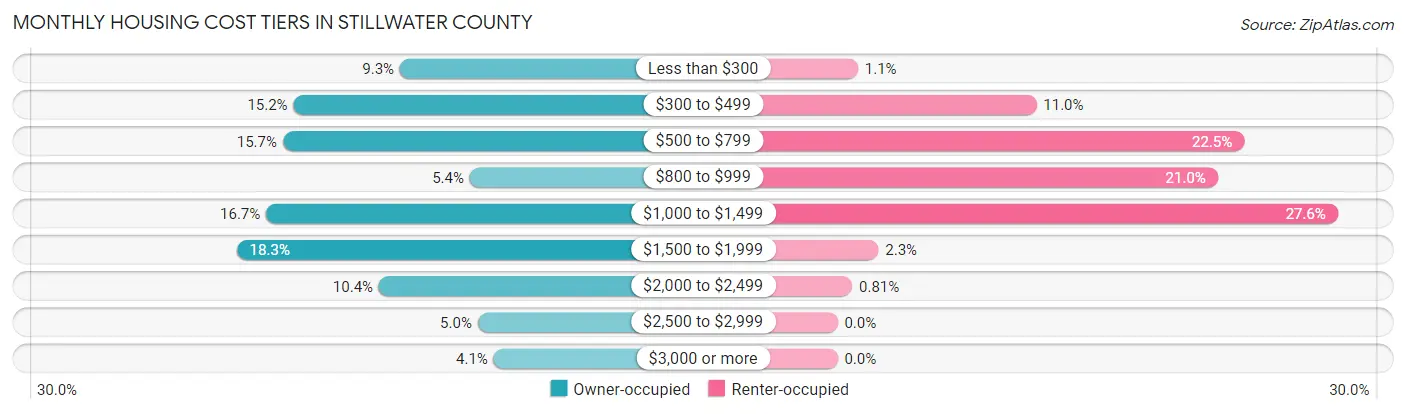
| Monthly Cost | Owner-occupied | Renter-occupied |
| Less than $300 | 295 (9.3%) | 7 (1.1%) |
| $300 to $499 | 482 (15.1%) | 68 (11.0%) |
| $500 to $799 | 501 (15.7%) | 139 (22.5%) |
| $800 to $999 | 172 (5.4%) | 130 (21.0%) |
| $1,000 to $1,499 | 530 (16.7%) | 171 (27.6%) |
| $1,500 to $1,999 | 582 (18.3%) | 14 (2.3%) |
| $2,000 to $2,499 | 332 (10.4%) | 5 (0.8%) |
| $2,500 to $2,999 | 158 (5.0%) | 0 (0.0%) |
| $3,000 or more | 130 (4.1%) | 0 (0.0%) |
| Total | 3,182 (100.0%) | 619 (100.0%) |
Physical Housing Characteristics in Stillwater County
Housing Structures in Stillwater County
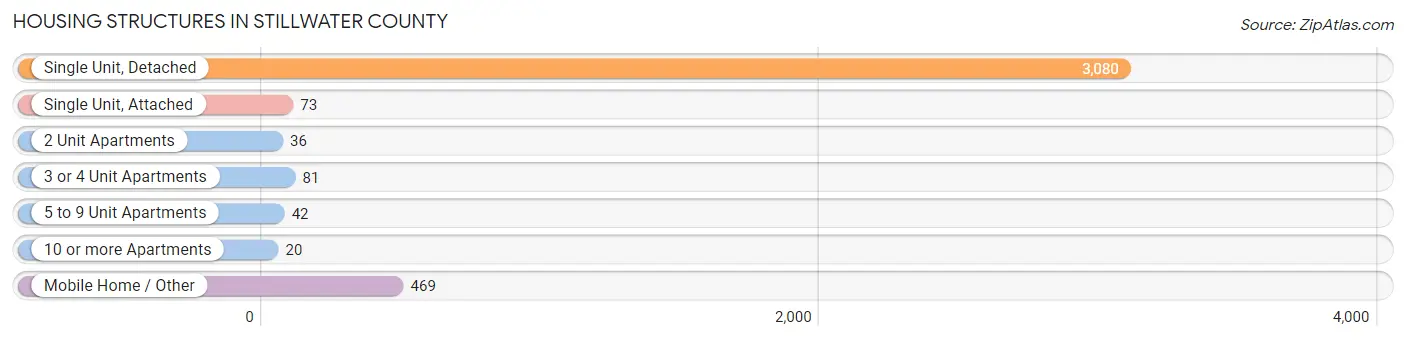
| Structure Type | # Housing Units | % Housing Units |
| Single Unit, Detached | 3,080 | 81.0% |
| Single Unit, Attached | 73 | 1.9% |
| 2 Unit Apartments | 36 | 0.9% |
| 3 or 4 Unit Apartments | 81 | 2.1% |
| 5 to 9 Unit Apartments | 42 | 1.1% |
| 10 or more Apartments | 20 | 0.5% |
| Mobile Home / Other | 469 | 12.3% |
| Total | 3,801 | 100.0% |
Housing Structures by Occupancy in Stillwater County
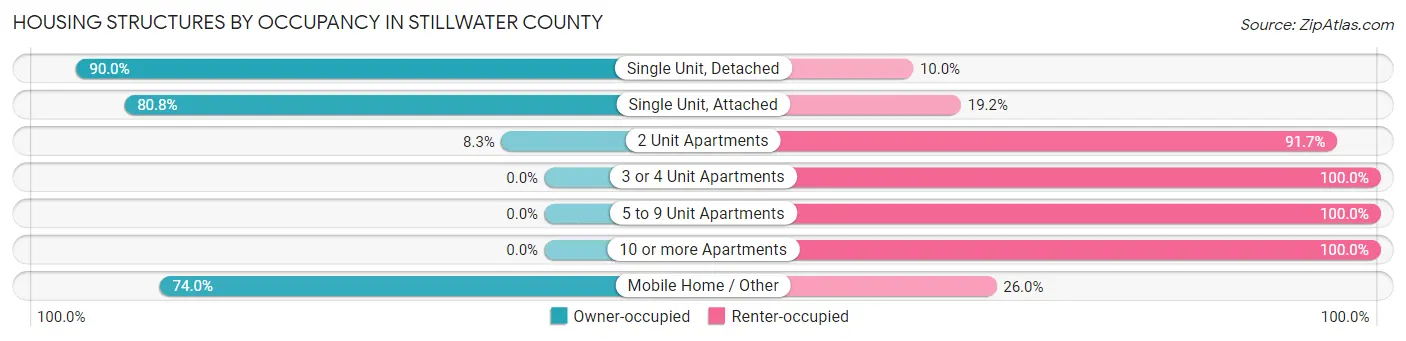
| Structure Type | Owner-occupied | Renter-occupied |
| Single Unit, Detached | 2,773 (90.0%) | 307 (10.0%) |
| Single Unit, Attached | 59 (80.8%) | 14 (19.2%) |
| 2 Unit Apartments | 3 (8.3%) | 33 (91.7%) |
| 3 or 4 Unit Apartments | 0 (0.0%) | 81 (100.0%) |
| 5 to 9 Unit Apartments | 0 (0.0%) | 42 (100.0%) |
| 10 or more Apartments | 0 (0.0%) | 20 (100.0%) |
| Mobile Home / Other | 347 (74.0%) | 122 (26.0%) |
| Total | 3,182 (83.7%) | 619 (16.3%) |
Housing Structures by Number of Rooms in Stillwater County
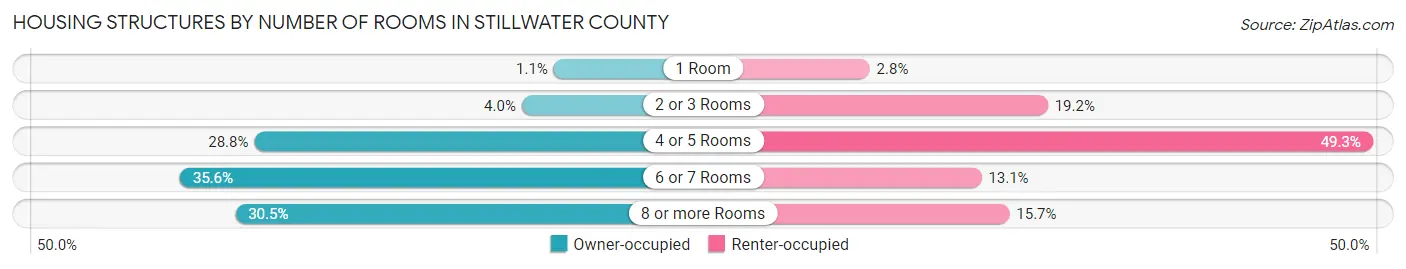
| Number of Rooms | Owner-occupied | Renter-occupied |
| 1 Room | 34 (1.1%) | 17 (2.8%) |
| 2 or 3 Rooms | 128 (4.0%) | 119 (19.2%) |
| 4 or 5 Rooms | 915 (28.8%) | 305 (49.3%) |
| 6 or 7 Rooms | 1,134 (35.6%) | 81 (13.1%) |
| 8 or more Rooms | 971 (30.5%) | 97 (15.7%) |
| Total | 3,182 (100.0%) | 619 (100.0%) |
Housing Structure by Heating Type in Stillwater County
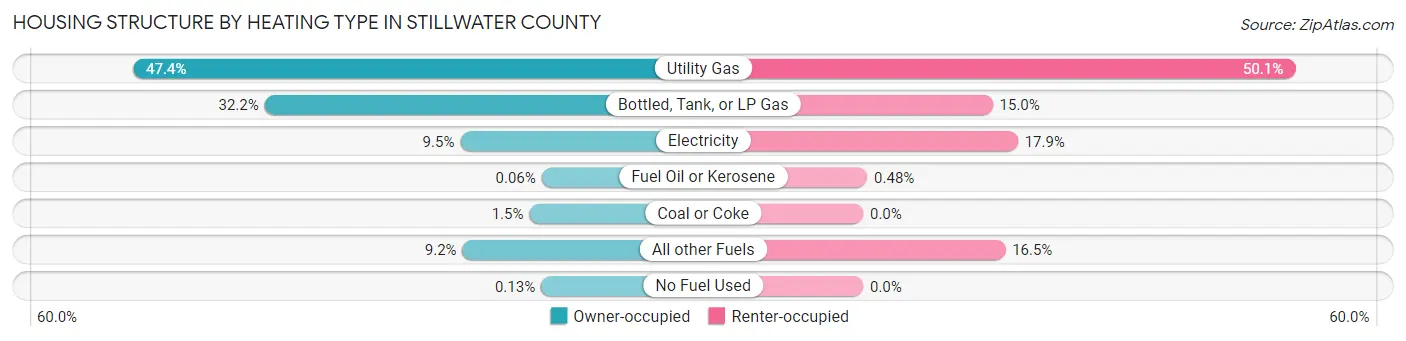
| Heating Type | Owner-occupied | Renter-occupied |
| Utility Gas | 1,509 (47.4%) | 310 (50.1%) |
| Bottled, Tank, or LP Gas | 1,024 (32.2%) | 93 (15.0%) |
| Electricity | 302 (9.5%) | 111 (17.9%) |
| Fuel Oil or Kerosene | 2 (0.1%) | 3 (0.5%) |
| Coal or Coke | 47 (1.5%) | 0 (0.0%) |
| All other Fuels | 294 (9.2%) | 102 (16.5%) |
| No Fuel Used | 4 (0.1%) | 0 (0.0%) |
| Total | 3,182 (100.0%) | 619 (100.0%) |
Household Vehicle Usage in Stillwater County
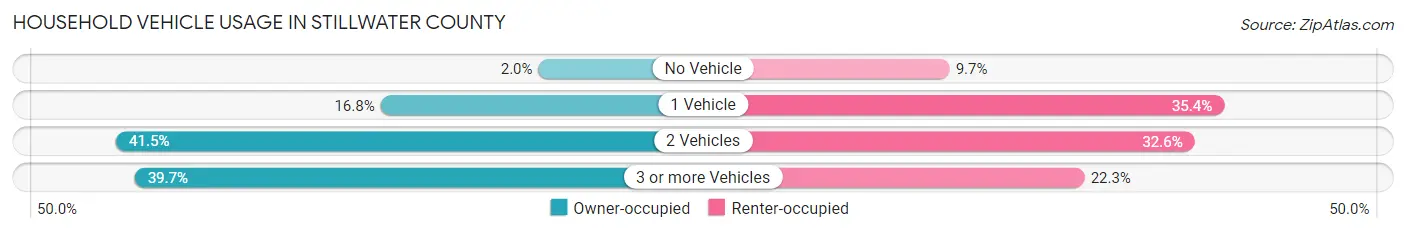
| Vehicles per Household | Owner-occupied | Renter-occupied |
| No Vehicle | 65 (2.0%) | 60 (9.7%) |
| 1 Vehicle | 534 (16.8%) | 219 (35.4%) |
| 2 Vehicles | 1,319 (41.4%) | 202 (32.6%) |
| 3 or more Vehicles | 1,264 (39.7%) | 138 (22.3%) |
| Total | 3,182 (100.0%) | 619 (100.0%) |
Real Estate & Mortgages in Stillwater County
Real Estate and Mortgage Overview in Stillwater County
| Characteristic | Without Mortgage | With Mortgage |
| Housing Units | 1,418 | 1,764 |
| Median Property Value | $306,900 | $322,400 |
| Median Household Income | $58,895 | $470 |
| Monthly Housing Costs | $482 | $130 |
| Real Estate Taxes | $1,805 | $9 |
Property Value by Mortgage Status in Stillwater County
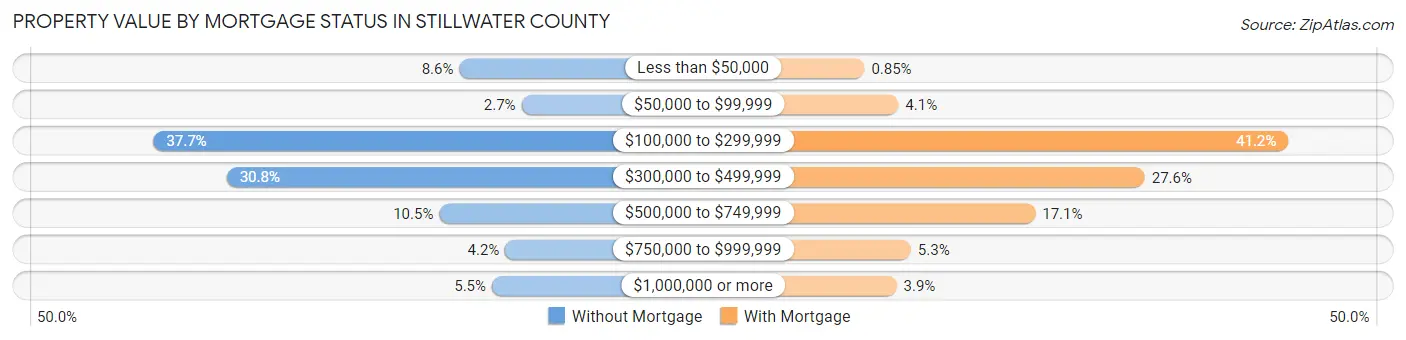
| Property Value | Without Mortgage | With Mortgage |
| Less than $50,000 | 122 (8.6%) | 15 (0.9%) |
| $50,000 to $99,999 | 38 (2.7%) | 72 (4.1%) |
| $100,000 to $299,999 | 535 (37.7%) | 727 (41.2%) |
| $300,000 to $499,999 | 436 (30.7%) | 486 (27.6%) |
| $500,000 to $749,999 | 149 (10.5%) | 302 (17.1%) |
| $750,000 to $999,999 | 60 (4.2%) | 93 (5.3%) |
| $1,000,000 or more | 78 (5.5%) | 69 (3.9%) |
| Total | 1,418 (100.0%) | 1,764 (100.0%) |
Household Income by Mortgage Status in Stillwater County
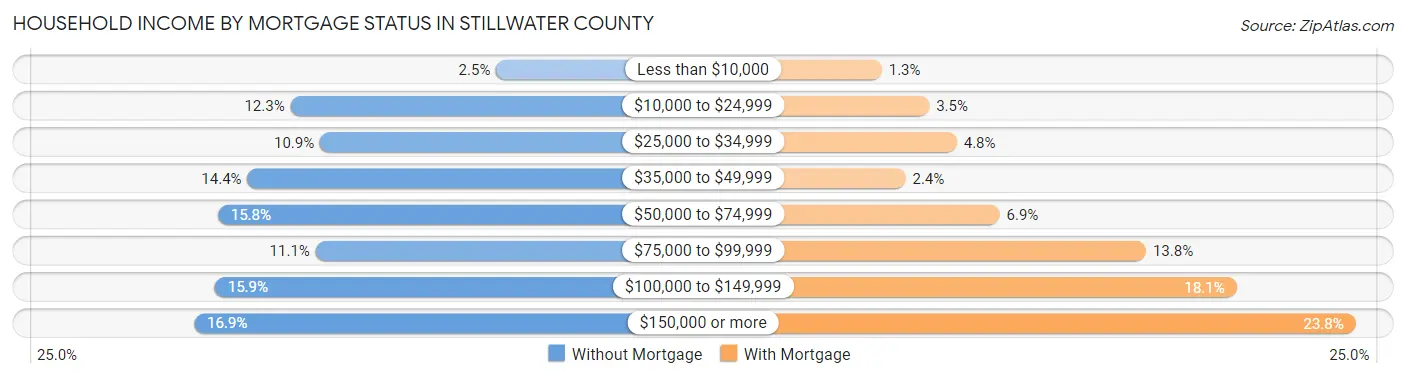
| Household Income | Without Mortgage | With Mortgage |
| Less than $10,000 | 36 (2.5%) | 22 (1.3%) |
| $10,000 to $24,999 | 175 (12.3%) | 62 (3.5%) |
| $25,000 to $34,999 | 155 (10.9%) | 85 (4.8%) |
| $35,000 to $49,999 | 204 (14.4%) | 42 (2.4%) |
| $50,000 to $74,999 | 224 (15.8%) | 121 (6.9%) |
| $75,000 to $99,999 | 158 (11.1%) | 244 (13.8%) |
| $100,000 to $149,999 | 226 (15.9%) | 320 (18.1%) |
| $150,000 or more | 240 (16.9%) | 420 (23.8%) |
| Total | 1,418 (100.0%) | 1,764 (100.0%) |
Property Value to Household Income Ratio in Stillwater County
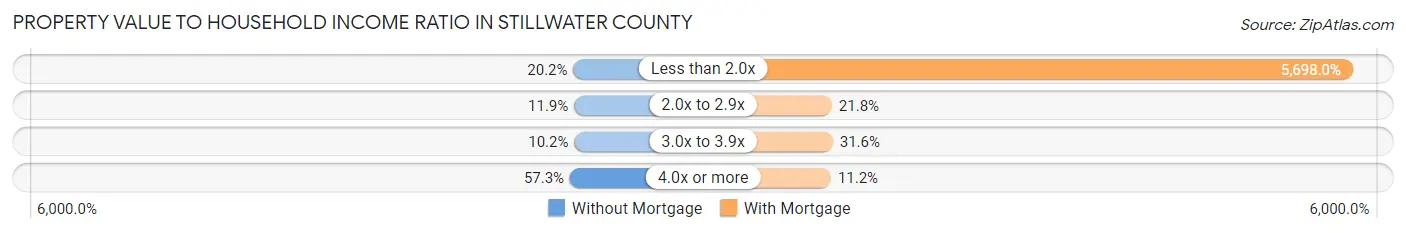
| Value-to-Income Ratio | Without Mortgage | With Mortgage |
| Less than 2.0x | 286 (20.2%) | 100,513 (5,698.0%) |
| 2.0x to 2.9x | 169 (11.9%) | 384 (21.8%) |
| 3.0x to 3.9x | 145 (10.2%) | 558 (31.6%) |
| 4.0x or more | 812 (57.3%) | 197 (11.2%) |
| Total | 1,418 (100.0%) | 1,764 (100.0%) |
Real Estate Taxes by Mortgage Status in Stillwater County
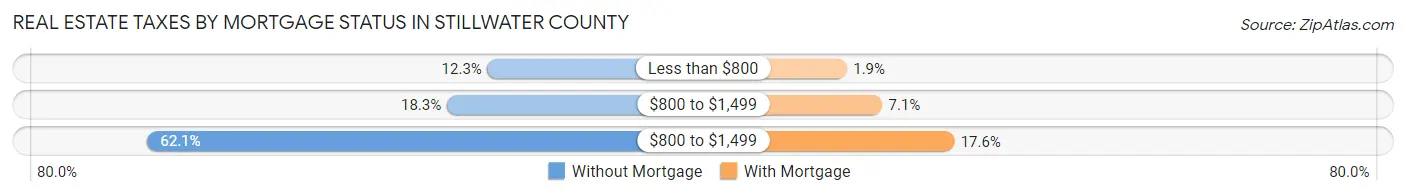
| Property Taxes | Without Mortgage | With Mortgage |
| Less than $800 | 175 (12.3%) | 34 (1.9%) |
| $800 to $1,499 | 259 (18.3%) | 125 (7.1%) |
| $800 to $1,499 | 880 (62.1%) | 311 (17.6%) |
| Total | 1,418 (100.0%) | 1,764 (100.0%) |
Health & Disability in Stillwater County
Health Insurance Coverage by Age in Stillwater County
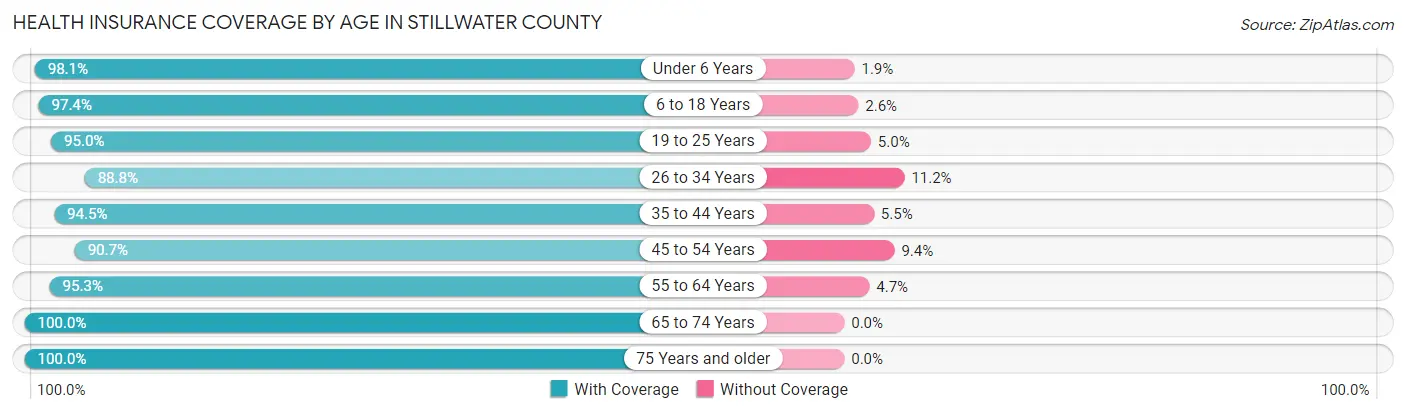
| Age Bracket | With Coverage | Without Coverage |
| Under 6 Years | 461 (98.1%) | 9 (1.9%) |
| 6 to 18 Years | 1,448 (97.4%) | 39 (2.6%) |
| 19 to 25 Years | 498 (95.0%) | 26 (5.0%) |
| 26 to 34 Years | 657 (88.8%) | 83 (11.2%) |
| 35 to 44 Years | 924 (94.5%) | 54 (5.5%) |
| 45 to 54 Years | 999 (90.6%) | 103 (9.3%) |
| 55 to 64 Years | 1,389 (95.3%) | 68 (4.7%) |
| 65 to 74 Years | 1,422 (100.0%) | 0 (0.0%) |
| 75 Years and older | 723 (100.0%) | 0 (0.0%) |
| Total | 8,521 (95.7%) | 382 (4.3%) |
Health Insurance Coverage by Citizenship Status in Stillwater County
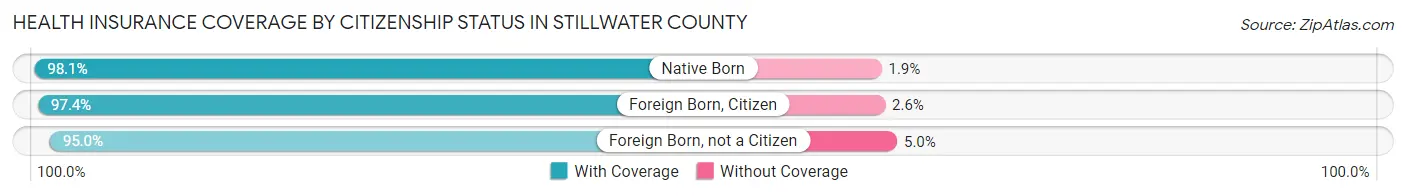
| Citizenship Status | With Coverage | Without Coverage |
| Native Born | 461 (98.1%) | 9 (1.9%) |
| Foreign Born, Citizen | 1,448 (97.4%) | 39 (2.6%) |
| Foreign Born, not a Citizen | 498 (95.0%) | 26 (5.0%) |
Health Insurance Coverage by Household Income in Stillwater County
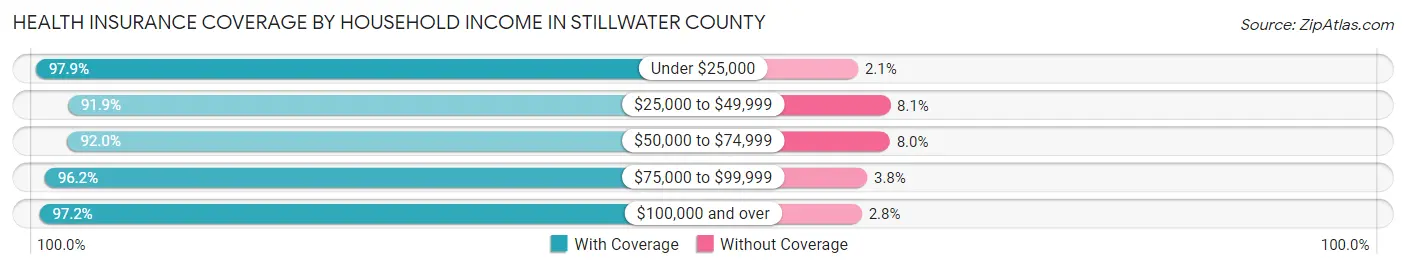
| Household Income | With Coverage | Without Coverage |
| Under $25,000 | 796 (97.9%) | 17 (2.1%) |
| $25,000 to $49,999 | 1,065 (91.9%) | 94 (8.1%) |
| $50,000 to $74,999 | 1,166 (92.0%) | 102 (8.0%) |
| $75,000 to $99,999 | 1,270 (96.2%) | 50 (3.8%) |
| $100,000 and over | 4,147 (97.2%) | 119 (2.8%) |
Public vs Private Health Insurance Coverage by Age in Stillwater County
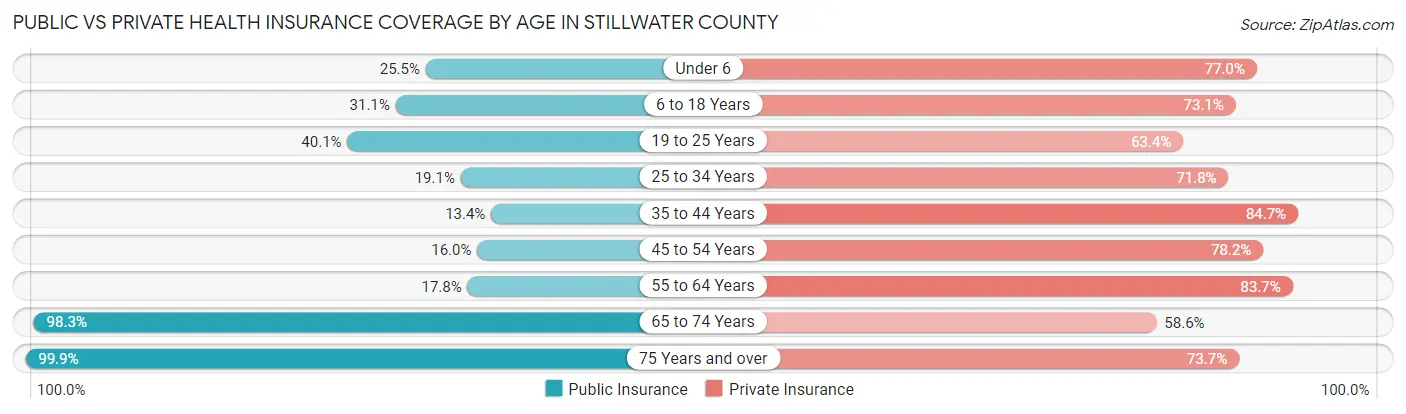
| Age Bracket | Public Insurance | Private Insurance |
| Under 6 | 120 (25.5%) | 362 (77.0%) |
| 6 to 18 Years | 463 (31.1%) | 1,087 (73.1%) |
| 19 to 25 Years | 210 (40.1%) | 332 (63.4%) |
| 25 to 34 Years | 141 (19.1%) | 531 (71.8%) |
| 35 to 44 Years | 131 (13.4%) | 828 (84.7%) |
| 45 to 54 Years | 176 (16.0%) | 862 (78.2%) |
| 55 to 64 Years | 259 (17.8%) | 1,219 (83.7%) |
| 65 to 74 Years | 1,398 (98.3%) | 833 (58.6%) |
| 75 Years and over | 722 (99.9%) | 533 (73.7%) |
| Total | 3,620 (40.7%) | 6,587 (74.0%) |
Disability Status by Sex by Age in Stillwater County
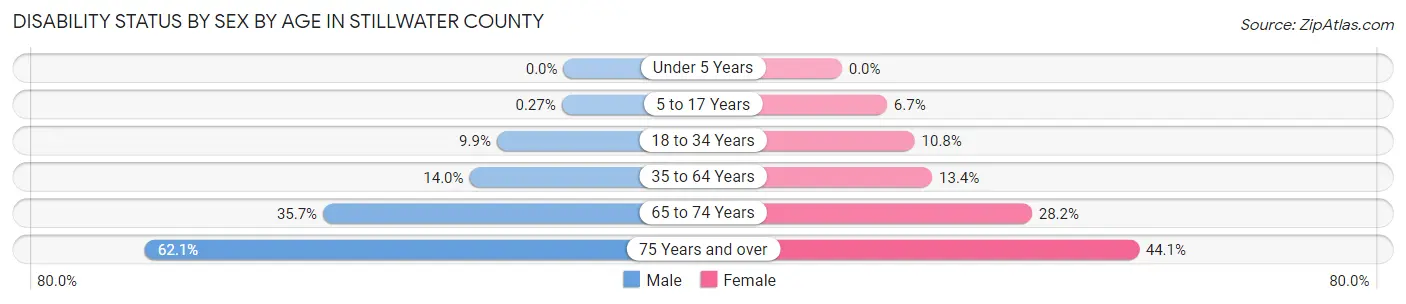
| Age Bracket | Male | Female |
| Under 5 Years | 0 (0.0%) | 0 (0.0%) |
| 5 to 17 Years | 2 (0.3%) | 51 (6.7%) |
| 18 to 34 Years | 70 (9.9%) | 71 (10.8%) |
| 35 to 64 Years | 248 (14.0%) | 236 (13.4%) |
| 65 to 74 Years | 266 (35.7%) | 191 (28.2%) |
| 75 Years and over | 228 (62.1%) | 157 (44.1%) |
Disability Class by Sex by Age in Stillwater County
Disability Class: Hearing Difficulty
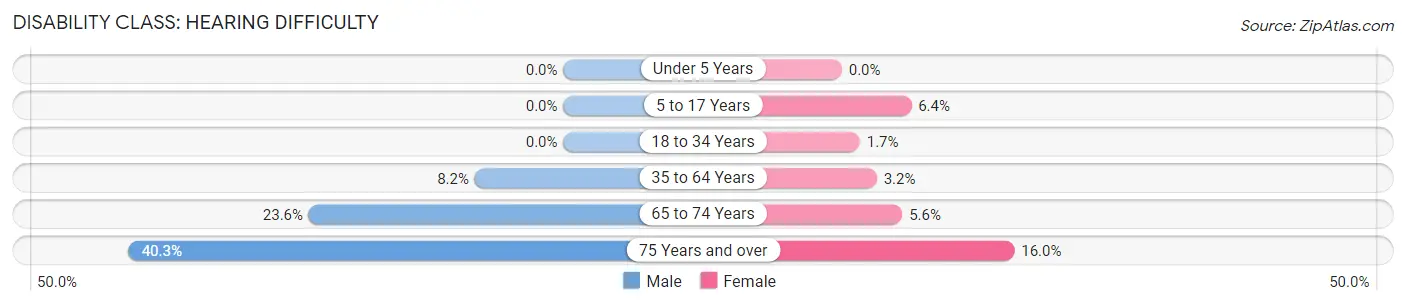
| Age Bracket | Male | Female |
| Under 5 Years | 0 (0.0%) | 0 (0.0%) |
| 5 to 17 Years | 0 (0.0%) | 49 (6.4%) |
| 18 to 34 Years | 0 (0.0%) | 11 (1.7%) |
| 35 to 64 Years | 146 (8.2%) | 57 (3.2%) |
| 65 to 74 Years | 176 (23.6%) | 38 (5.6%) |
| 75 Years and over | 148 (40.3%) | 57 (16.0%) |
Disability Class: Vision Difficulty
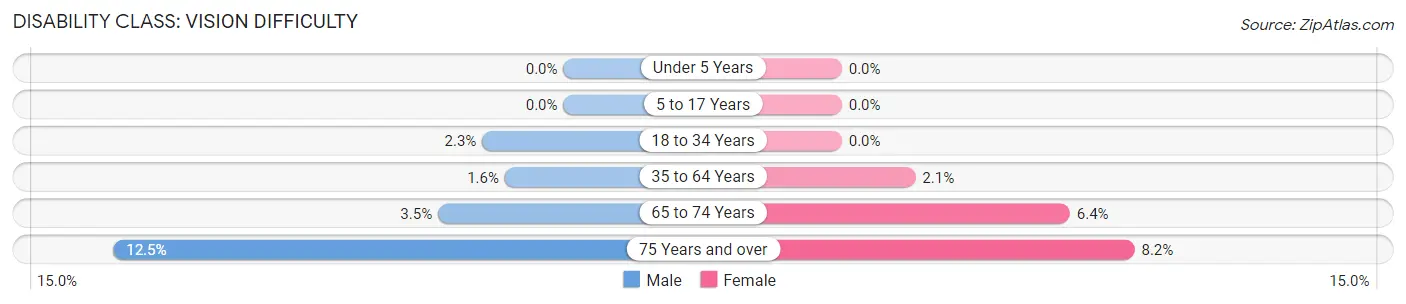
| Age Bracket | Male | Female |
| Under 5 Years | 0 (0.0%) | 0 (0.0%) |
| 5 to 17 Years | 0 (0.0%) | 0 (0.0%) |
| 18 to 34 Years | 16 (2.3%) | 0 (0.0%) |
| 35 to 64 Years | 29 (1.6%) | 36 (2.1%) |
| 65 to 74 Years | 26 (3.5%) | 43 (6.4%) |
| 75 Years and over | 46 (12.5%) | 29 (8.2%) |
Disability Class: Cognitive Difficulty
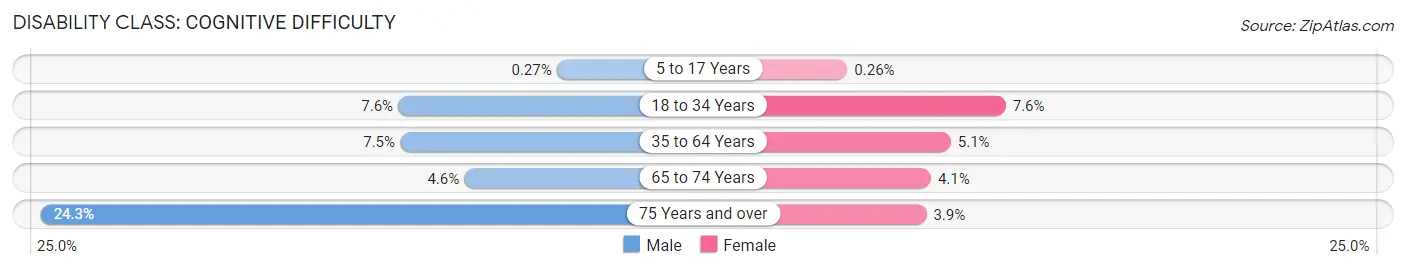
| Age Bracket | Male | Female |
| 5 to 17 Years | 2 (0.3%) | 2 (0.3%) |
| 18 to 34 Years | 54 (7.6%) | 50 (7.6%) |
| 35 to 64 Years | 134 (7.5%) | 89 (5.1%) |
| 65 to 74 Years | 34 (4.6%) | 28 (4.1%) |
| 75 Years and over | 89 (24.2%) | 14 (3.9%) |
Disability Class: Ambulatory Difficulty
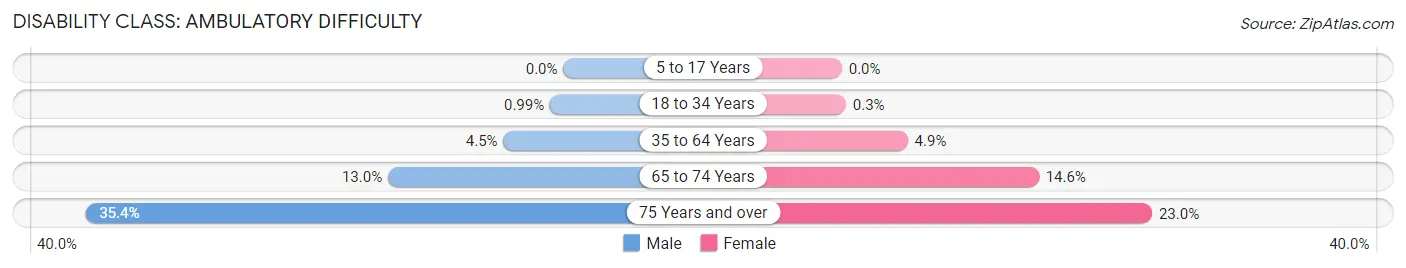
| Age Bracket | Male | Female |
| 5 to 17 Years | 0 (0.0%) | 0 (0.0%) |
| 18 to 34 Years | 7 (1.0%) | 2 (0.3%) |
| 35 to 64 Years | 79 (4.4%) | 86 (4.9%) |
| 65 to 74 Years | 97 (13.0%) | 99 (14.6%) |
| 75 Years and over | 130 (35.4%) | 82 (23.0%) |
Disability Class: Self-Care Difficulty
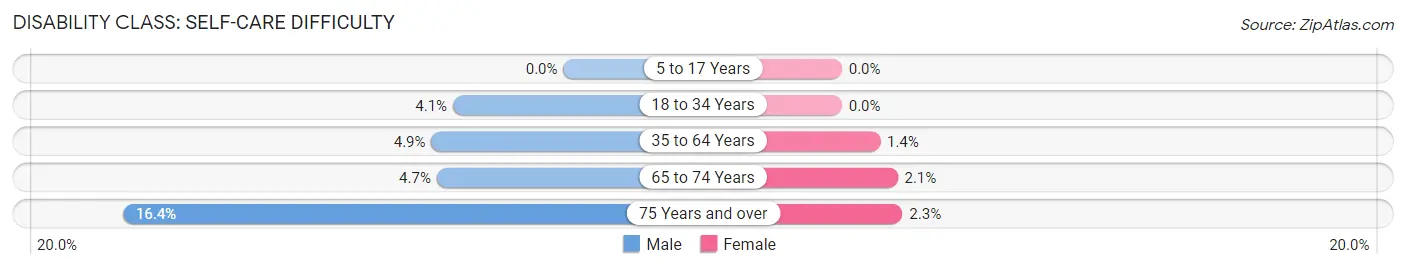
| Age Bracket | Male | Female |
| 5 to 17 Years | 0 (0.0%) | 0 (0.0%) |
| 18 to 34 Years | 29 (4.1%) | 0 (0.0%) |
| 35 to 64 Years | 87 (4.9%) | 25 (1.4%) |
| 65 to 74 Years | 35 (4.7%) | 14 (2.1%) |
| 75 Years and over | 60 (16.4%) | 8 (2.2%) |
Technology Access in Stillwater County
Computing Device Access in Stillwater County
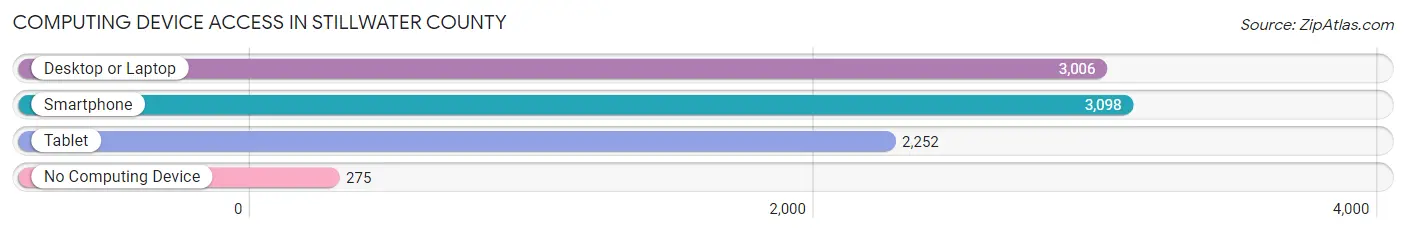
| Device Type | # Households | % Households |
| Desktop or Laptop | 3,006 | 79.1% |
| Smartphone | 3,098 | 81.5% |
| Tablet | 2,252 | 59.3% |
| No Computing Device | 275 | 7.2% |
| Total | 3,801 | 100.0% |
Internet Access in Stillwater County
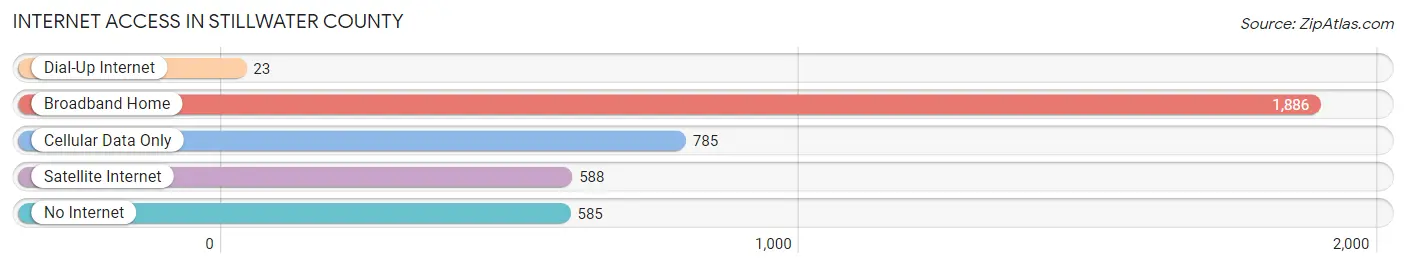
| Internet Type | # Households | % Households |
| Dial-Up Internet | 23 | 0.6% |
| Broadband Home | 1,886 | 49.6% |
| Cellular Data Only | 785 | 20.6% |
| Satellite Internet | 588 | 15.5% |
| No Internet | 585 | 15.4% |
| Total | 3,801 | 100.0% |
Stillwater County Summary
Situated in the southeastern corner of Montana, Stillwater County is a rural county with a population of 8,195 as of the 2010 census. The county seat is Columbus, and the largest city is Absarokee. The county was established in 1913 and named after the Stillwater River, which flows through the county.
Geography
Stillwater County is located in the southeastern corner of Montana, bordered by Carbon County to the north, Yellowstone County to the east, Sweet Grass County to the south, and Park County to the west. The county covers an area of 1,845 square miles, of which 1,843 square miles is land and 2 square miles is water. The county is located in the Yellowstone Valley, with the Stillwater River running through it. The county is mostly mountainous, with the Beartooth Mountains to the west and the Absaroka Range to the east. The highest point in the county is Granite Peak, which has an elevation of 12,807 feet.
Economy
Agriculture is the main economic activity in Stillwater County. The county is home to a variety of crops, including wheat, barley, oats, hay, and alfalfa. Livestock production is also important, with cattle, sheep, and horses being raised in the county. Mining is also an important part of the economy, with coal, gold, and silver being mined in the county. Tourism is also an important part of the economy, with the Beartooth Mountains and the Stillwater River providing opportunities for outdoor recreation.
Demographics
As of the 2010 census, there were 8,195 people, 3,093 households, and 2,097 families living in Stillwater County. The population density was 4.4 people per square mile. The racial makeup of the county was 95.3% White, 0.3% African American, 1.2% Native American, 0.3% Asian, 0.1% Pacific Islander, 0.7% from other races, and 2.1% from two or more races. Hispanic or Latino of any race were 2.7% of the population.
The median income for a household in the county was $37,917, and the median income for a family was $45,938. The per capita income for the county was $18,945. About 11.2% of families and 14.7% of the population were below the poverty line, including 19.2% of those under age 18 and 8.2% of those age 65 or over.
Conclusion
Stillwater County is a rural county located in the southeastern corner of Montana. The county is home to a variety of agricultural and mining activities, as well as tourism opportunities. The population of the county is mostly white, with a small percentage of Native Americans, African Americans, and other races. The median income for households and families is lower than the state average, and the poverty rate is higher than the state average. Despite these challenges, Stillwater County is a vibrant and diverse community with a rich history and culture.
Common Questions
What is Per Capita Income in Stillwater County?
Per Capita income in Stillwater County is $45,245.
What is the Median Family Income in Stillwater County?
Median Family Income in Stillwater County is $95,190.
What is the Median Household income in Stillwater County?
Median Household Income in Stillwater County is $78,380.
What is Income or Wage Gap in Stillwater County?
Income or Wage Gap in Stillwater County is 47.6%.
Women in Stillwater County earn 52.4 cents for every dollar earned by a man.
What is Inequality or Gini Index in Stillwater County?
Inequality or Gini Index in Stillwater County is 0.45.
What is the Total Population of Stillwater County?
Total Population of Stillwater County is 8,978.
What is the Total Male Population of Stillwater County?
Total Male Population of Stillwater County is 4,560.
What is the Total Female Population of Stillwater County?
Total Female Population of Stillwater County is 4,418.
What is the Ratio of Males per 100 Females in Stillwater County?
There are 103.21 Males per 100 Females in Stillwater County.
What is the Ratio of Females per 100 Males in Stillwater County?
There are 96.89 Females per 100 Males in Stillwater County.
What is the Median Population Age in Stillwater County?
Median Population Age in Stillwater County is 48.0 Years.
What is the Average Family Size in Stillwater County
Average Family Size in Stillwater County is 2.9 People.
What is the Average Household Size in Stillwater County
Average Household Size in Stillwater County is 2.3 People.
How Large is the Labor Force in Stillwater County?
There are 4,410 People in the Labor Forcein in Stillwater County.
What is the Percentage of People in the Labor Force in Stillwater County?
59.8% of People are in the Labor Force in Stillwater County.
What is the Unemployment Rate in Stillwater County?
Unemployment Rate in Stillwater County is 2.6%.