Powell County, MT Map & Demographics
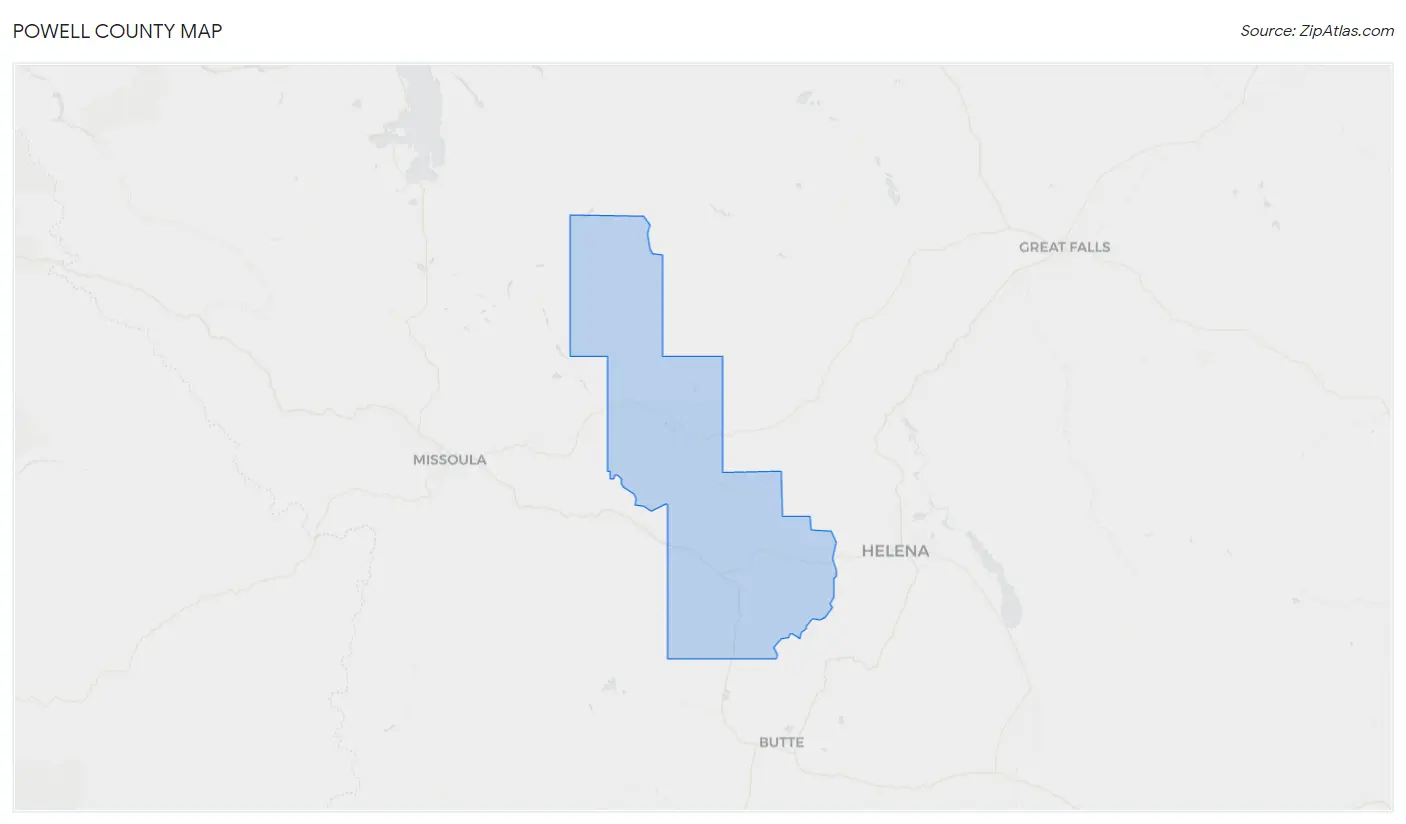
Powell County Map
Powell County Overview
$29,675
PER CAPITA INCOME
$66,725
AVG FAMILY INCOME
$60,994
AVG HOUSEHOLD INCOME
14.9%
WAGE / INCOME GAP [ % ]
85.1¢/ $1
WAGE / INCOME GAP [ $ ]
0.46
INEQUALITY / GINI INDEX
6,998
TOTAL POPULATION
4,455
MALE POPULATION
2,543
FEMALE POPULATION
175.19
MALES / 100 FEMALES
57.08
FEMALES / 100 MALES
45.5
MEDIAN AGE
2.8
AVG FAMILY SIZE
2.3
AVG HOUSEHOLD SIZE
2,662
LABOR FORCE [ PEOPLE ]
43.8%
PERCENT IN LABOR FORCE
4.8%
UNEMPLOYMENT RATE
Powell County Area Codes
Income in Powell County
Income Overview in Powell County
Per Capita Income in Powell County is $29,675, while median incomes of families and households are $66,725 and $60,994 respectively.
| Characteristic | Number | Measure |
| Per Capita Income | 6,998 | $29,675 |
| Median Family Income | 1,527 | $66,725 |
| Mean Family Income | 1,527 | $93,150 |
| Median Household Income | 2,298 | $60,994 |
| Mean Household Income | 2,298 | $79,002 |
| Income Deficit | 1,527 | $0 |
| Wage / Income Gap (%) | 6,998 | 14.86% |
| Wage / Income Gap ($) | 6,998 | 85.14¢ per $1 |
| Gini / Inequality Index | 6,998 | 0.46 |
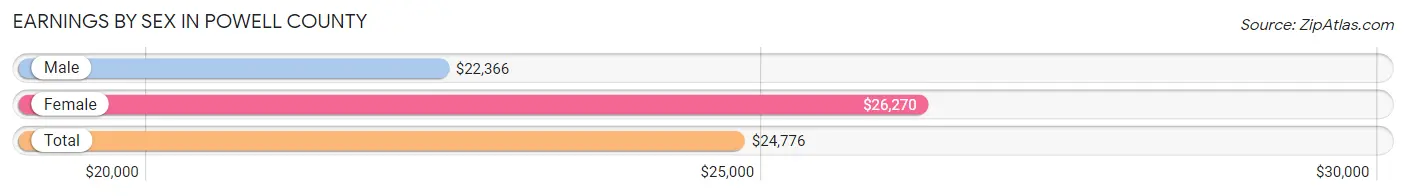
Earnings by Sex in Powell County
Average Earnings in Powell County are $24,776, $22,366 for men and $26,270 for women, a difference of 14.9%.
| Sex | Number | Average Earnings |
| Male | 2,858 (72.0%) | $22,366 |
| Female | 1,113 (28.0%) | $26,270 |
| Total | 3,971 (100.0%) | $24,776 |
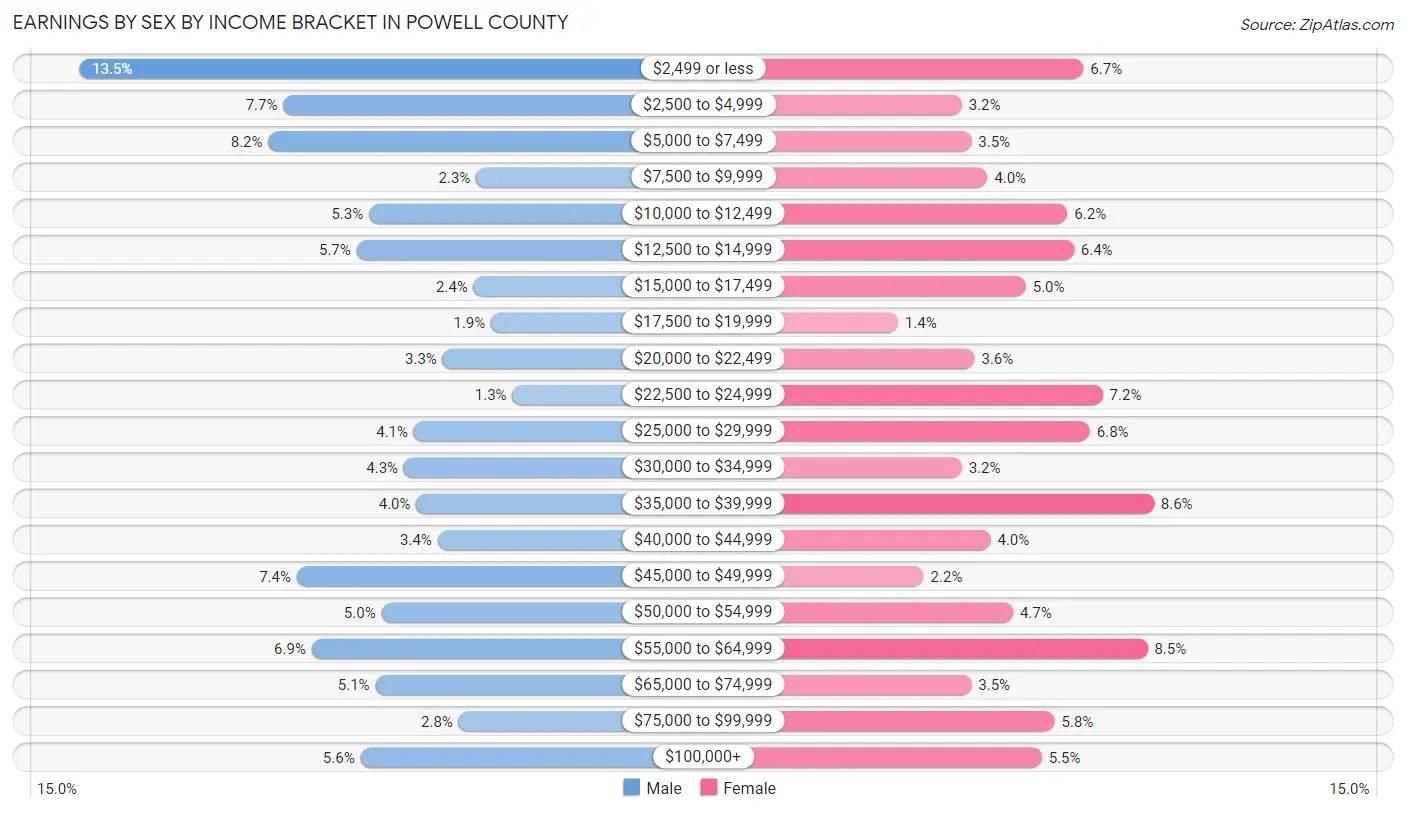
Earnings by Sex by Income Bracket in Powell County
The most common earnings brackets in Powell County are $2,499 or less for men (385 | 13.5%) and $35,000 to $39,999 for women (96 | 8.6%).
| Income | Male | Female |
| $2,499 or less | 385 (13.5%) | 74 (6.7%) |
| $2,500 to $4,999 | 221 (7.7%) | 36 (3.2%) |
| $5,000 to $7,499 | 233 (8.2%) | 39 (3.5%) |
| $7,500 to $9,999 | 66 (2.3%) | 44 (4.0%) |
| $10,000 to $12,499 | 152 (5.3%) | 69 (6.2%) |
| $12,500 to $14,999 | 162 (5.7%) | 71 (6.4%) |
| $15,000 to $17,499 | 68 (2.4%) | 56 (5.0%) |
| $17,500 to $19,999 | 54 (1.9%) | 16 (1.4%) |
| $20,000 to $22,499 | 93 (3.3%) | 40 (3.6%) |
| $22,500 to $24,999 | 37 (1.3%) | 80 (7.2%) |
| $25,000 to $29,999 | 116 (4.1%) | 76 (6.8%) |
| $30,000 to $34,999 | 124 (4.3%) | 36 (3.2%) |
| $35,000 to $39,999 | 114 (4.0%) | 96 (8.6%) |
| $40,000 to $44,999 | 97 (3.4%) | 45 (4.0%) |
| $45,000 to $49,999 | 210 (7.3%) | 24 (2.2%) |
| $50,000 to $54,999 | 142 (5.0%) | 52 (4.7%) |
| $55,000 to $64,999 | 198 (6.9%) | 94 (8.5%) |
| $65,000 to $74,999 | 147 (5.1%) | 39 (3.5%) |
| $75,000 to $99,999 | 80 (2.8%) | 65 (5.8%) |
| $100,000+ | 159 (5.6%) | 61 (5.5%) |
| Total | 2,858 (100.0%) | 1,113 (100.0%) |
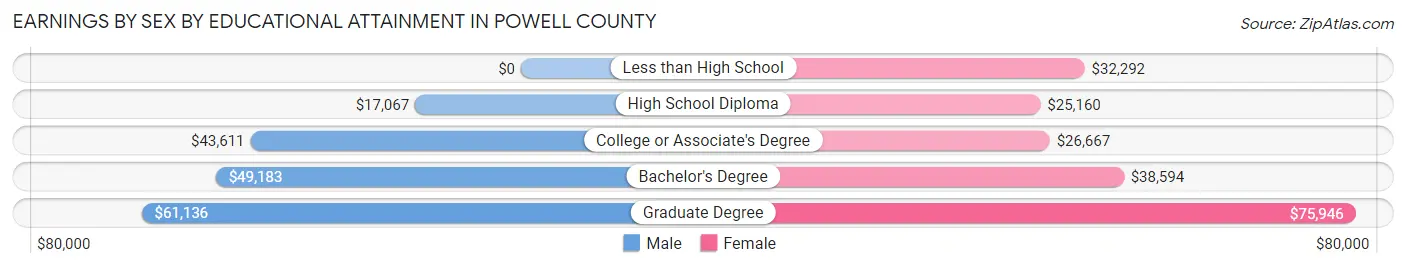
Earnings by Sex by Educational Attainment in Powell County
Average earnings in Powell County are $28,926 for men and $29,196 for women, a difference of 0.9%. Men with an educational attainment of graduate degree enjoy the highest average annual earnings of $61,136, while those with high school diploma education earn the least with $17,067. Women with an educational attainment of graduate degree earn the most with the average annual earnings of $75,946, while those with high school diploma education have the smallest earnings of $25,160.
| Educational Attainment | Male Income | Female Income |
| Less than High School | - | - |
| High School Diploma | $17,067 | $25,160 |
| College or Associate's Degree | $43,611 | $26,667 |
| Bachelor's Degree | $49,183 | $38,594 |
| Graduate Degree | $61,136 | $75,946 |
| Total | $28,926 | $29,196 |
Family Income in Powell County
Family Income Brackets in Powell County
According to the Powell County family income data, there are 292 families falling into the $25,000 to $34,999 income range, which is the most common income bracket and makes up 19.1% of all families. Conversely, the $10,000 to $14,999 income bracket is the least frequent group with only 2 families (0.1%) belonging to this category.
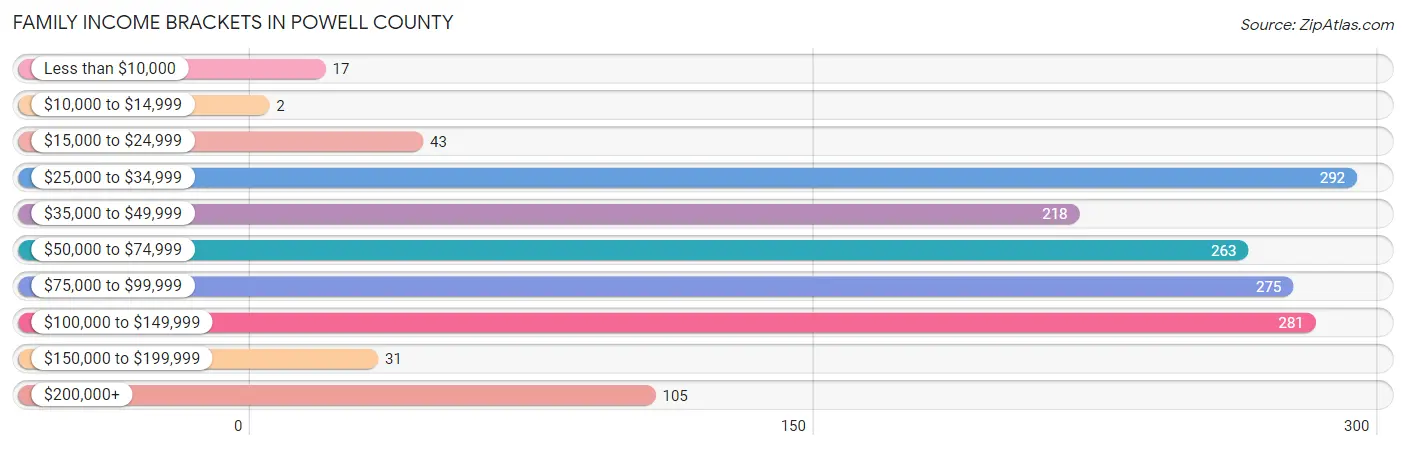
| Income Bracket | # Families | % Families |
| Less than $10,000 | 17 | 1.1% |
| $10,000 to $14,999 | 2 | 0.1% |
| $15,000 to $24,999 | 43 | 2.8% |
| $25,000 to $34,999 | 292 | 19.1% |
| $35,000 to $49,999 | 218 | 14.3% |
| $50,000 to $74,999 | 263 | 17.2% |
| $75,000 to $99,999 | 275 | 18.0% |
| $100,000 to $149,999 | 281 | 18.4% |
| $150,000 to $199,999 | 31 | 2.0% |
| $200,000+ | 105 | 6.9% |
Family Income by Famaliy Size in Powell County
7+ person families (36 | 2.4%) account for the highest median family income in Powell County with $128,068 per family, while 3-person families (180 | 11.8%) have the highest median income of $35,417 per family member.
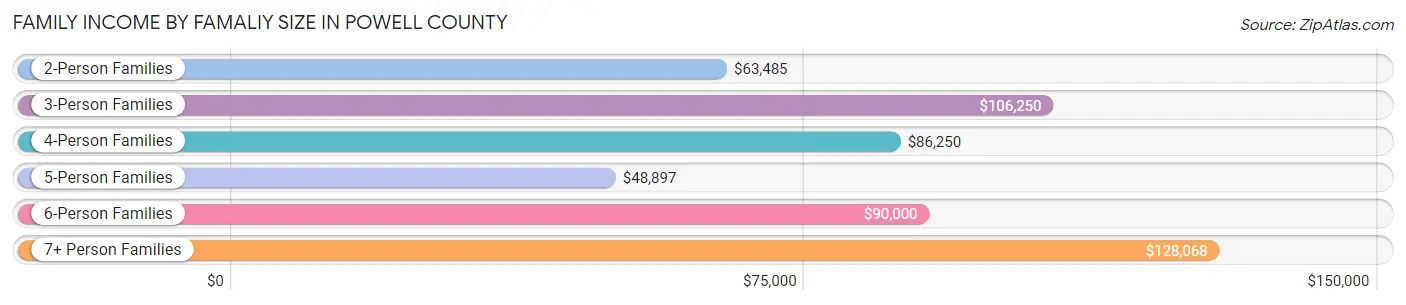
| Income Bracket | # Families | Median Income |
| 2-Person Families | 1,076 (70.5%) | $63,485 |
| 3-Person Families | 180 (11.8%) | $106,250 |
| 4-Person Families | 171 (11.2%) | $86,250 |
| 5-Person Families | 58 (3.8%) | $48,897 |
| 6-Person Families | 6 (0.4%) | $90,000 |
| 7+ Person Families | 36 (2.4%) | $128,068 |
| Total | 1,527 (100.0%) | $66,725 |
Family Income by Number of Earners in Powell County
The median family income in Powell County is $66,725, with families comprising 3+ earners (67) having the highest median family income of $110,313, while families with no earners (313) have the lowest median family income of $35,125, accounting for 4.4% and 20.5% of families, respectively.
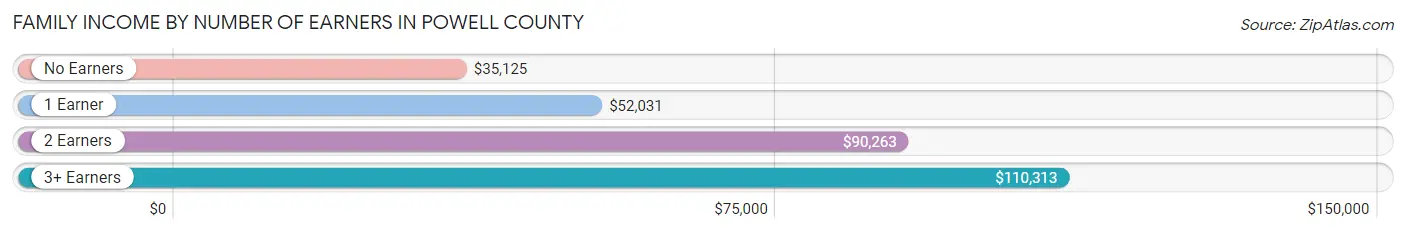
| Number of Earners | # Families | Median Income |
| No Earners | 313 (20.5%) | $35,125 |
| 1 Earner | 505 (33.1%) | $52,031 |
| 2 Earners | 642 (42.0%) | $90,263 |
| 3+ Earners | 67 (4.4%) | $110,313 |
| Total | 1,527 (100.0%) | $66,725 |
Household Income in Powell County
Household Income Brackets in Powell County
With 460 households falling in the category, the $50,000 to $74,999 income range is the most frequent in Powell County, accounting for 20.0% of all households. In contrast, only 53 households (2.3%) fall into the $150,000 to $199,999 income bracket, making it the least populous group.
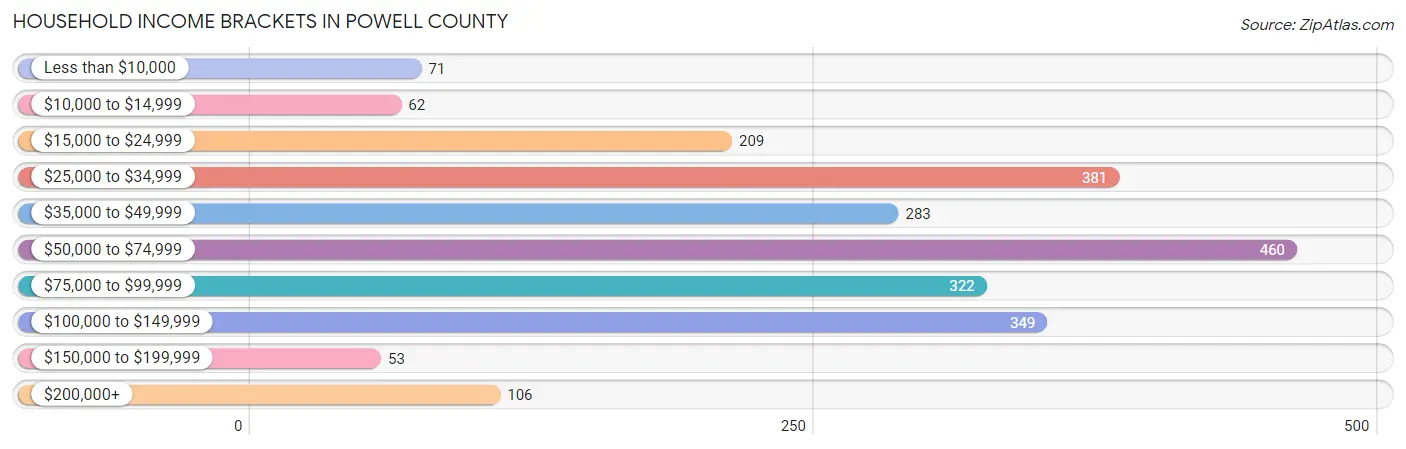
| Income Bracket | # Households | % Households |
| Less than $10,000 | 71 | 3.1% |
| $10,000 to $14,999 | 62 | 2.7% |
| $15,000 to $24,999 | 209 | 9.1% |
| $25,000 to $34,999 | 381 | 16.6% |
| $35,000 to $49,999 | 283 | 12.3% |
| $50,000 to $74,999 | 460 | 20.0% |
| $75,000 to $99,999 | 322 | 14.0% |
| $100,000 to $149,999 | 349 | 15.2% |
| $150,000 to $199,999 | 53 | 2.3% |
| $200,000+ | 106 | 4.6% |
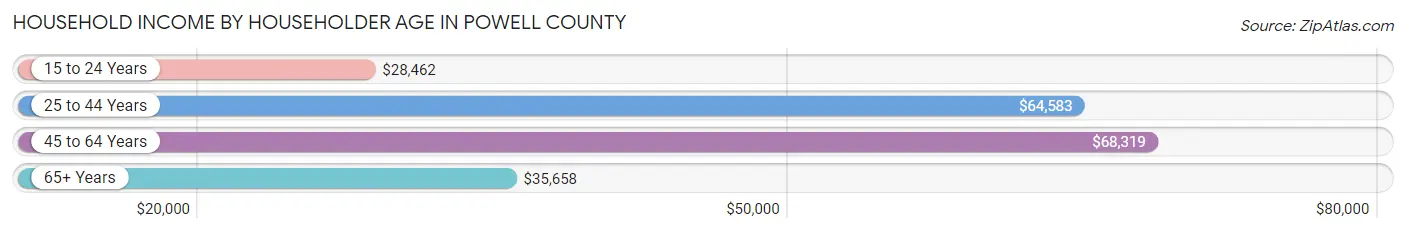
Household Income by Householder Age in Powell County
The median household income in Powell County is $60,994, with the highest median household income of $68,319 found in the 45 to 64 years age bracket for the primary householder. A total of 909 households (39.6%) fall into this category. Meanwhile, the 15 to 24 years age bracket for the primary householder has the lowest median household income of $28,462, with 60 households (2.6%) in this group.
| Income Bracket | # Households | Median Income |
| 15 to 24 Years | 60 (2.6%) | $28,462 |
| 25 to 44 Years | 529 (23.0%) | $64,583 |
| 45 to 64 Years | 909 (39.6%) | $68,319 |
| 65+ Years | 800 (34.8%) | $35,658 |
| Total | 2,298 (100.0%) | $60,994 |
Poverty in Powell County
Income Below Poverty by Sex and Age in Powell County
With 5.2% poverty level for males and 5.2% for females among the residents of Powell County, under 5 year old males and 6 to 11 year old females are the most vulnerable to poverty, with 24 males (17.8%) and 12 females (9.0%) in their respective age groups living below the poverty level.
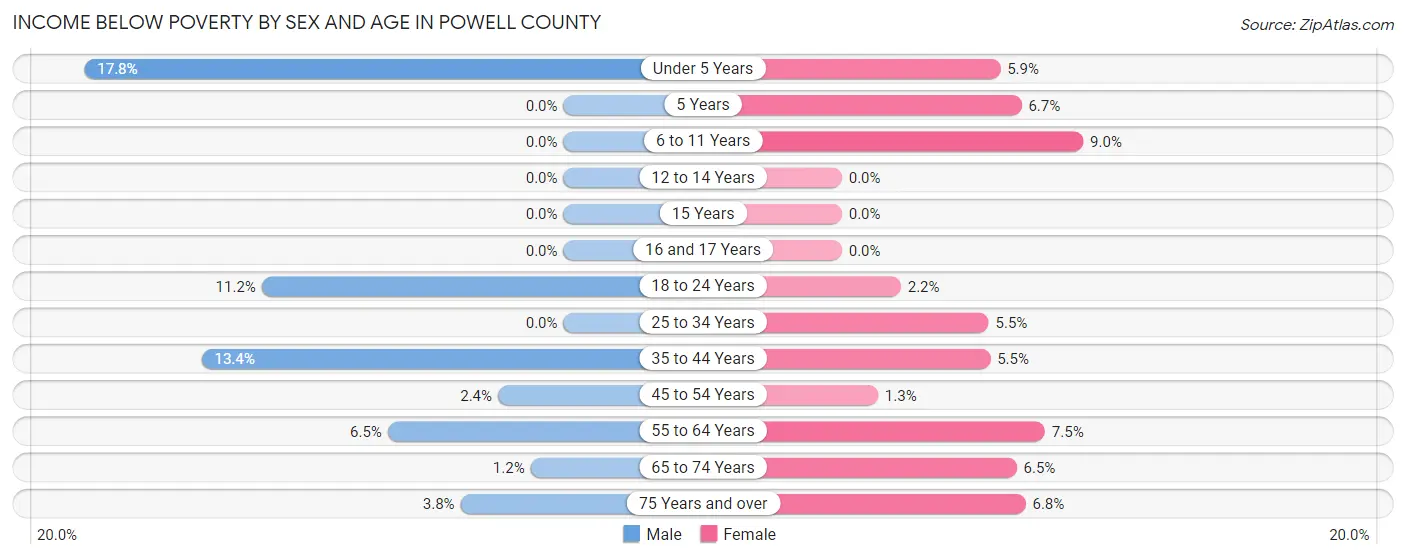
| Age Bracket | Male | Female |
| Under 5 Years | 24 (17.8%) | 7 (5.9%) |
| 5 Years | 0 (0.0%) | 1 (6.7%) |
| 6 to 11 Years | 0 (0.0%) | 12 (9.0%) |
| 12 to 14 Years | 0 (0.0%) | 0 (0.0%) |
| 15 Years | 0 (0.0%) | 0 (0.0%) |
| 16 and 17 Years | 0 (0.0%) | 0 (0.0%) |
| 18 to 24 Years | 29 (11.2%) | 3 (2.2%) |
| 25 to 34 Years | 0 (0.0%) | 11 (5.4%) |
| 35 to 44 Years | 38 (13.4%) | 14 (5.5%) |
| 45 to 54 Years | 10 (2.4%) | 4 (1.3%) |
| 55 to 64 Years | 30 (6.5%) | 31 (7.5%) |
| 65 to 74 Years | 5 (1.2%) | 24 (6.5%) |
| 75 Years and over | 10 (3.8%) | 18 (6.8%) |
| Total | 146 (5.2%) | 125 (5.2%) |
Income Above Poverty by Sex and Age in Powell County
According to the poverty statistics in Powell County, males aged 5 years and females aged 12 to 14 years are the age groups that are most secure financially, with 100.0% of males and 100.0% of females in these age groups living above the poverty line.
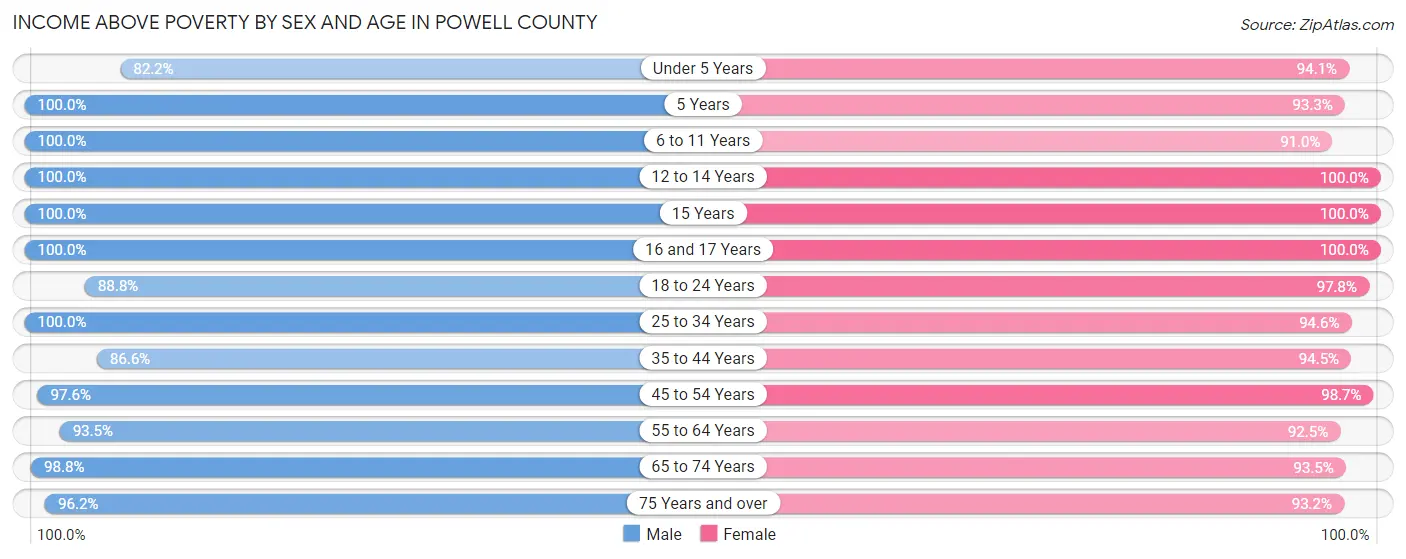
| Age Bracket | Male | Female |
| Under 5 Years | 111 (82.2%) | 112 (94.1%) |
| 5 Years | 35 (100.0%) | 14 (93.3%) |
| 6 to 11 Years | 104 (100.0%) | 122 (91.0%) |
| 12 to 14 Years | 82 (100.0%) | 67 (100.0%) |
| 15 Years | 7 (100.0%) | 51 (100.0%) |
| 16 and 17 Years | 31 (100.0%) | 66 (100.0%) |
| 18 to 24 Years | 230 (88.8%) | 134 (97.8%) |
| 25 to 34 Years | 309 (100.0%) | 191 (94.6%) |
| 35 to 44 Years | 245 (86.6%) | 240 (94.5%) |
| 45 to 54 Years | 402 (97.6%) | 294 (98.7%) |
| 55 to 64 Years | 430 (93.5%) | 380 (92.5%) |
| 65 to 74 Years | 406 (98.8%) | 346 (93.5%) |
| 75 Years and over | 252 (96.2%) | 246 (93.2%) |
| Total | 2,644 (94.8%) | 2,263 (94.8%) |
Income Below Poverty Among Married-Couple Families in Powell County
The poverty statistics for married-couple families in Powell County show that 0.1% or 1 of the total 1,230 families live below the poverty line. Families with no children have the highest poverty rate of 0.1%, comprising of 1 families. On the other hand, families with 1 or 2 children have the lowest poverty rate of 0.0%, which includes 0 families.
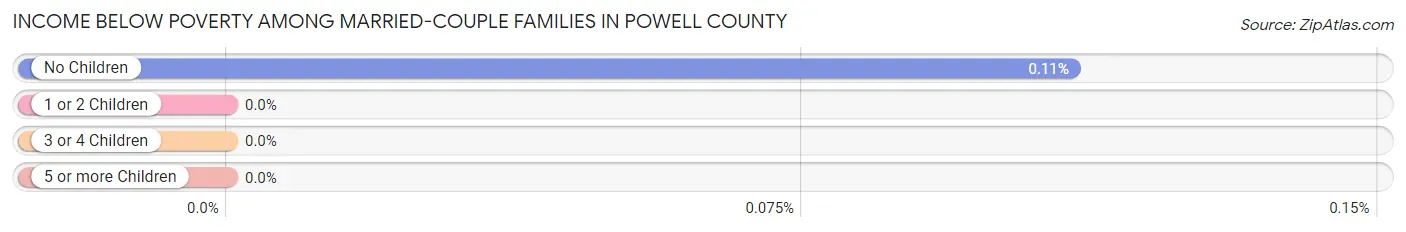
| Children | Above Poverty | Below Poverty |
| No Children | 942 (99.9%) | 1 (0.1%) |
| 1 or 2 Children | 195 (100.0%) | 0 (0.0%) |
| 3 or 4 Children | 61 (100.0%) | 0 (0.0%) |
| 5 or more Children | 31 (100.0%) | 0 (0.0%) |
| Total | 1,229 (99.9%) | 1 (0.1%) |
Income Below Poverty Among Single-Parent Households in Powell County
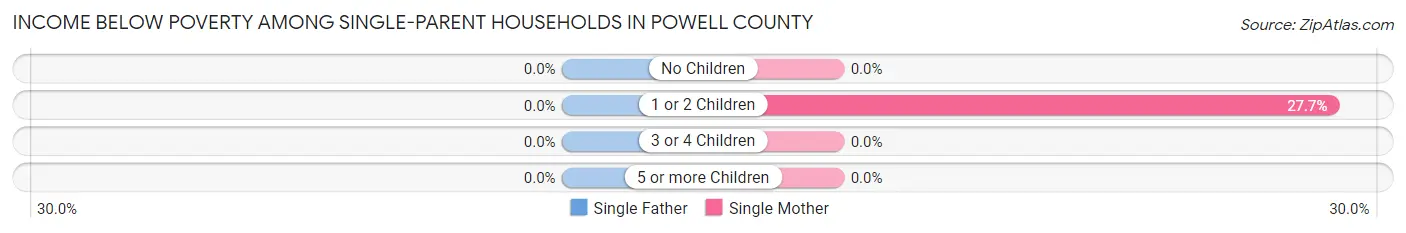
| Children | Single Father | Single Mother |
| No Children | 0 (0.0%) | 0 (0.0%) |
| 1 or 2 Children | 0 (0.0%) | 18 (27.7%) |
| 3 or 4 Children | 0 (0.0%) | 0 (0.0%) |
| 5 or more Children | 0 (0.0%) | 0 (0.0%) |
| Total | 0 (0.0%) | 18 (10.7%) |
Income Below Poverty Among Married-Couple vs Single-Parent Households in Powell County
The poverty data for Powell County shows that 1 of the married-couple family households (0.1%) and 18 of the single-parent households (6.1%) are living below the poverty level. Within the married-couple family households, those with no children have the highest poverty rate, with 1 households (0.1%) falling below the poverty line. Among the single-parent households, those with 1 or 2 children have the highest poverty rate, with 18 household (12.1%) living below poverty.
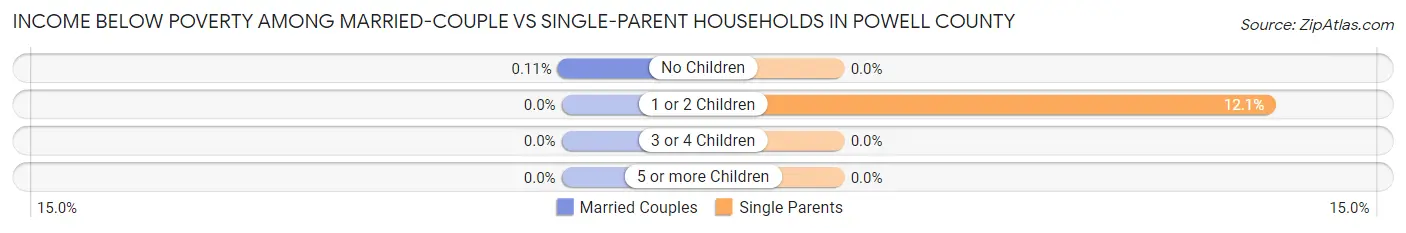
| Children | Married-Couple Families | Single-Parent Households |
| No Children | 1 (0.1%) | 0 (0.0%) |
| 1 or 2 Children | 0 (0.0%) | 18 (12.1%) |
| 3 or 4 Children | 0 (0.0%) | 0 (0.0%) |
| 5 or more Children | 0 (0.0%) | 0 (0.0%) |
| Total | 1 (0.1%) | 18 (6.1%) |
Race in Powell County
The most populous races in Powell County are White / Caucasian (6,190 | 88.4%), Native / Alaskan (342 | 4.9%), and Two or more Races (272 | 3.9%).
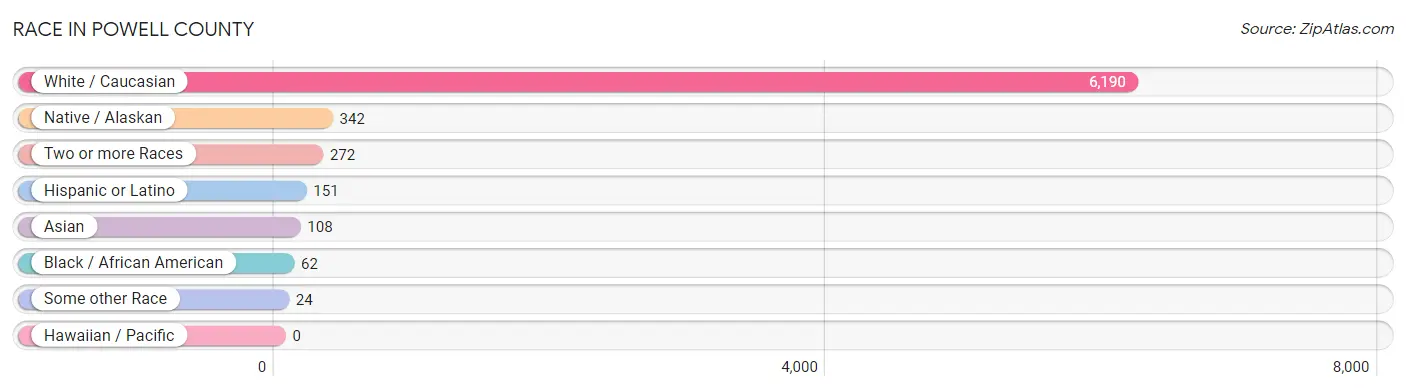
| Race | # Population | % Population |
| Asian | 108 | 1.5% |
| Black / African American | 62 | 0.9% |
| Hawaiian / Pacific | 0 | 0.0% |
| Hispanic or Latino | 151 | 2.2% |
| Native / Alaskan | 342 | 4.9% |
| White / Caucasian | 6,190 | 88.4% |
| Two or more Races | 272 | 3.9% |
| Some other Race | 24 | 0.3% |
| Total | 6,998 | 100.0% |
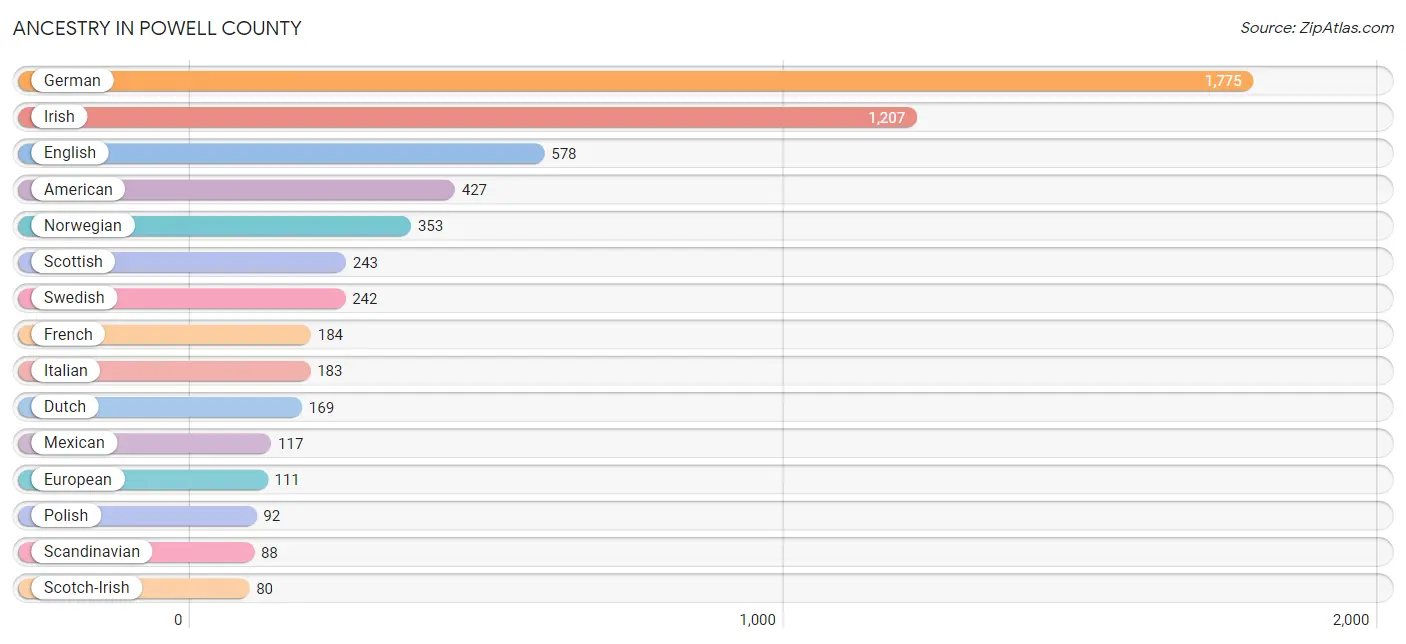
Ancestry in Powell County
The most populous ancestries reported in Powell County are German (1,775 | 25.4%), Irish (1,207 | 17.2%), English (578 | 8.3%), American (427 | 6.1%), and Norwegian (353 | 5.0%), together accounting for 62.0% of all Powell County residents.
| Ancestry | # Population | % Population |
| American | 427 | 6.1% |
| Apache | 9 | 0.1% |
| Arapaho | 3 | 0.0% |
| Armenian | 1 | 0.0% |
| Austrian | 15 | 0.2% |
| Belgian | 19 | 0.3% |
| Blackfeet | 79 | 1.1% |
| Bolivian | 7 | 0.1% |
| British | 19 | 0.3% |
| Celtic | 1 | 0.0% |
| Central American | 5 | 0.1% |
| Cherokee | 37 | 0.5% |
| Cheyenne | 42 | 0.6% |
| Chippewa | 27 | 0.4% |
| Choctaw | 3 | 0.0% |
| Colombian | 3 | 0.0% |
| Comanche | 5 | 0.1% |
| Cree | 30 | 0.4% |
| Creek | 4 | 0.1% |
| Croatian | 1 | 0.0% |
| Crow | 39 | 0.6% |
| Czech | 11 | 0.2% |
| Czechoslovakian | 9 | 0.1% |
| Danish | 27 | 0.4% |
| Delaware | 4 | 0.1% |
| Dutch | 169 | 2.4% |
| English | 578 | 8.3% |
| Ethiopian | 29 | 0.4% |
| European | 111 | 1.6% |
| Finnish | 8 | 0.1% |
| French | 184 | 2.6% |
| French Canadian | 34 | 0.5% |
| German | 1,775 | 25.4% |
| Greek | 11 | 0.2% |
| Haitian | 15 | 0.2% |
| Hopi | 3 | 0.0% |
| Indian (Asian) | 47 | 0.7% |
| Irish | 1,207 | 17.2% |
| Italian | 183 | 2.6% |
| Korean | 59 | 0.8% |
| Lithuanian | 14 | 0.2% |
| Mexican | 117 | 1.7% |
| Nicaraguan | 1 | 0.0% |
| Northern European | 11 | 0.2% |
| Norwegian | 353 | 5.0% |
| Pima | 5 | 0.1% |
| Polish | 92 | 1.3% |
| Portuguese | 10 | 0.1% |
| Potawatomi | 4 | 0.1% |
| Puget Sound Salish | 27 | 0.4% |
| Romanian | 4 | 0.1% |
| Russian | 40 | 0.6% |
| Salvadoran | 4 | 0.1% |
| Scandinavian | 88 | 1.3% |
| Scotch-Irish | 80 | 1.1% |
| Scottish | 243 | 3.5% |
| Serbian | 22 | 0.3% |
| Shoshone | 3 | 0.0% |
| Sioux | 9 | 0.1% |
| Slavic | 1 | 0.0% |
| Slovak | 11 | 0.2% |
| South American | 10 | 0.1% |
| Spaniard | 14 | 0.2% |
| Spanish | 5 | 0.1% |
| Subsaharan African | 29 | 0.4% |
| Swedish | 242 | 3.5% |
| Swiss | 12 | 0.2% |
| Ukrainian | 21 | 0.3% |
| Welsh | 34 | 0.5% | View All 69 Rows |
Immigrants in Powell County
The most numerous immigrant groups reported in Powell County came from Asia (61 | 0.9%), South Eastern Asia (59 | 0.8%), Philippines (55 | 0.8%), Europe (24 | 0.3%), and Northern Europe (19 | 0.3%), together accounting for 3.1% of all Powell County residents.
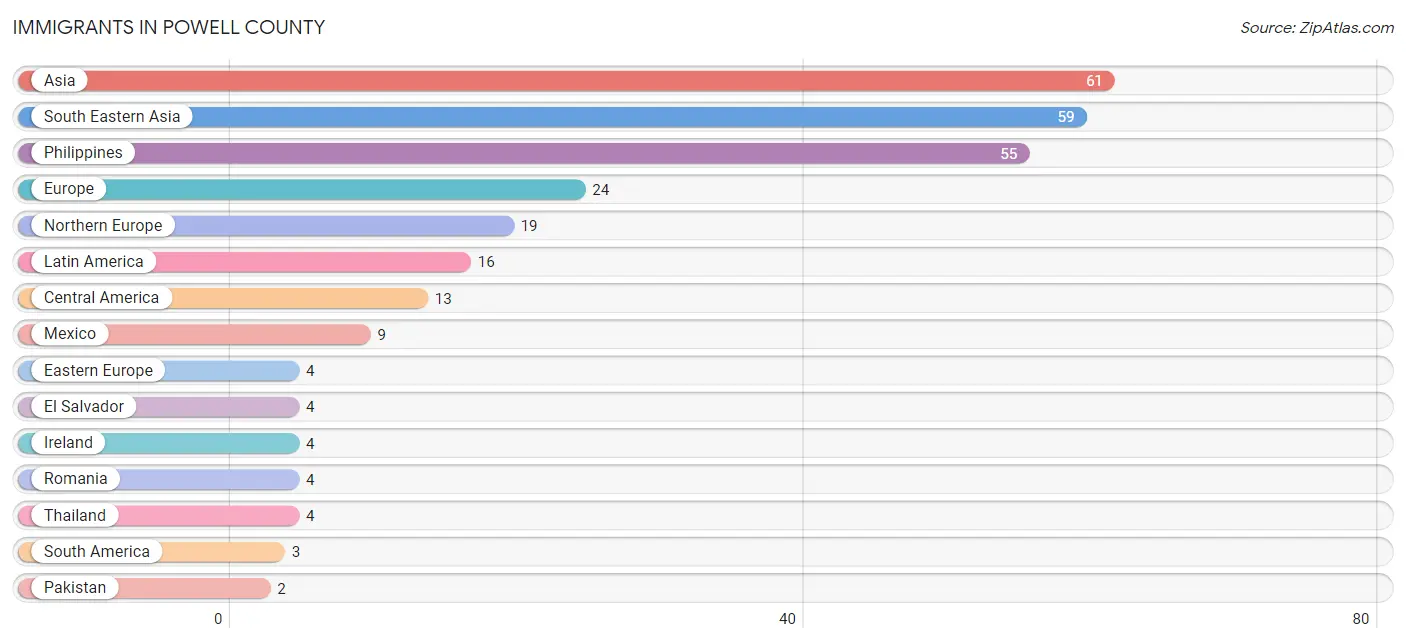
| Immigration Origin | # Population | % Population |
| Asia | 61 | 0.9% |
| Central America | 13 | 0.2% |
| Eastern Europe | 4 | 0.1% |
| El Salvador | 4 | 0.1% |
| Europe | 24 | 0.3% |
| Ireland | 4 | 0.1% |
| Latin America | 16 | 0.2% |
| Mexico | 9 | 0.1% |
| Northern Europe | 19 | 0.3% |
| Pakistan | 2 | 0.0% |
| Philippines | 55 | 0.8% |
| Romania | 4 | 0.1% |
| South America | 3 | 0.0% |
| South Central Asia | 2 | 0.0% |
| South Eastern Asia | 59 | 0.8% |
| Switzerland | 1 | 0.0% |
| Thailand | 4 | 0.1% |
| Western Europe | 1 | 0.0% | View All 18 Rows |
Sex and Age in Powell County
Sex and Age in Powell County
The most populous age groups in Powell County are 35 to 39 Years (446 | 10.0%) for men and 15 to 19 Years (223 | 8.8%) for women.
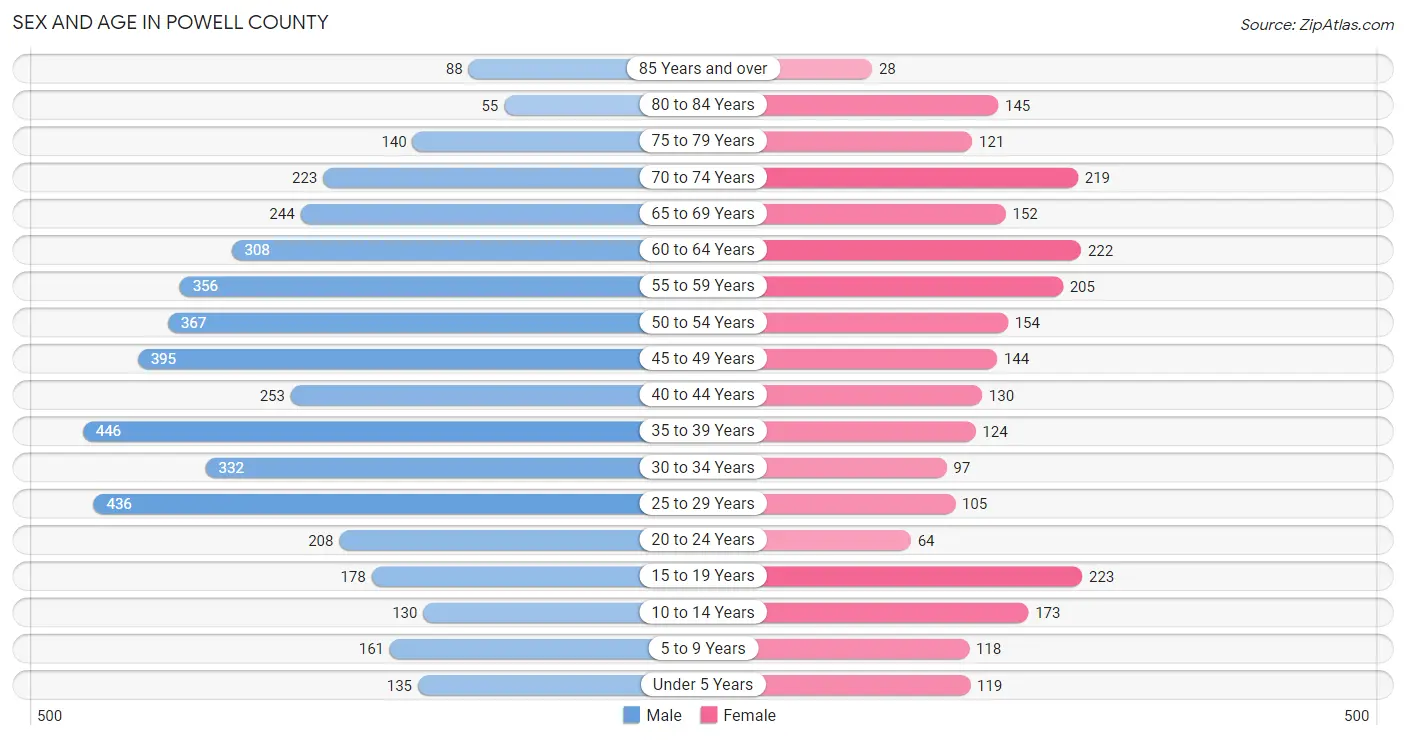
| Age Bracket | Male | Female |
| Under 5 Years | 135 (3.0%) | 119 (4.7%) |
| 5 to 9 Years | 161 (3.6%) | 118 (4.6%) |
| 10 to 14 Years | 130 (2.9%) | 173 (6.8%) |
| 15 to 19 Years | 178 (4.0%) | 223 (8.8%) |
| 20 to 24 Years | 208 (4.7%) | 64 (2.5%) |
| 25 to 29 Years | 436 (9.8%) | 105 (4.1%) |
| 30 to 34 Years | 332 (7.4%) | 97 (3.8%) |
| 35 to 39 Years | 446 (10.0%) | 124 (4.9%) |
| 40 to 44 Years | 253 (5.7%) | 130 (5.1%) |
| 45 to 49 Years | 395 (8.9%) | 144 (5.7%) |
| 50 to 54 Years | 367 (8.2%) | 154 (6.1%) |
| 55 to 59 Years | 356 (8.0%) | 205 (8.1%) |
| 60 to 64 Years | 308 (6.9%) | 222 (8.7%) |
| 65 to 69 Years | 244 (5.5%) | 152 (6.0%) |
| 70 to 74 Years | 223 (5.0%) | 219 (8.6%) |
| 75 to 79 Years | 140 (3.1%) | 121 (4.8%) |
| 80 to 84 Years | 55 (1.2%) | 145 (5.7%) |
| 85 Years and over | 88 (2.0%) | 28 (1.1%) |
| Total | 4,455 (100.0%) | 2,543 (100.0%) |
Families and Households in Powell County
Median Family Size in Powell County
The median family size in Powell County is 2.75 persons per family, with married-couple families (1,230 | 80.5%) accounting for the largest median family size of 2.89 persons per family. On the other hand, single male/father families (129 | 8.5%) represent the smallest median family size with 1.91 persons per family.
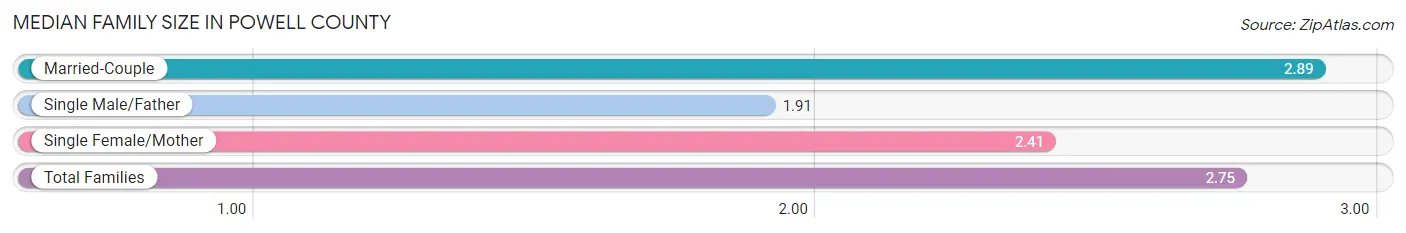
| Family Type | # Families | Family Size |
| Married-Couple | 1,230 (80.5%) | 2.89 |
| Single Male/Father | 129 (8.5%) | 1.91 |
| Single Female/Mother | 168 (11.0%) | 2.41 |
| Total Families | 1,527 (100.0%) | 2.75 |
Median Household Size in Powell County
The median household size in Powell County is 2.31 persons per household, with single male/father households (129 | 5.6%) accounting for the largest median household size of 3.34 persons per household. non-family households (771 | 33.6%) represent the smallest median household size with 1.18 persons per household.
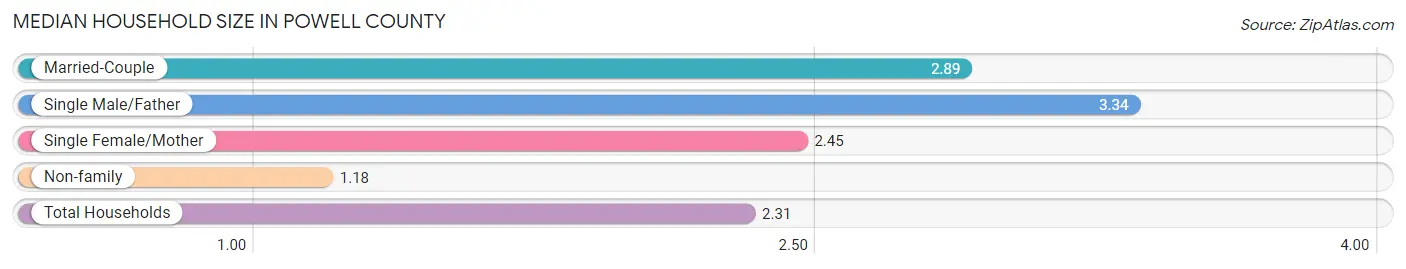
| Household Type | # Households | Household Size |
| Married-Couple | 1,230 (53.5%) | 2.89 |
| Single Male/Father | 129 (5.6%) | 3.34 |
| Single Female/Mother | 168 (7.3%) | 2.45 |
| Non-family | 771 (33.6%) | 1.18 |
| Total Households | 2,298 (100.0%) | 2.31 |
Household Size by Marriage Status in Powell County
Out of a total of 2,298 households in Powell County, 1,527 (66.4%) are family households, while 771 (33.6%) are nonfamily households. The most numerous type of family households are 2-person households, comprising 987, and the most common type of nonfamily households are 1-person households, comprising 666.
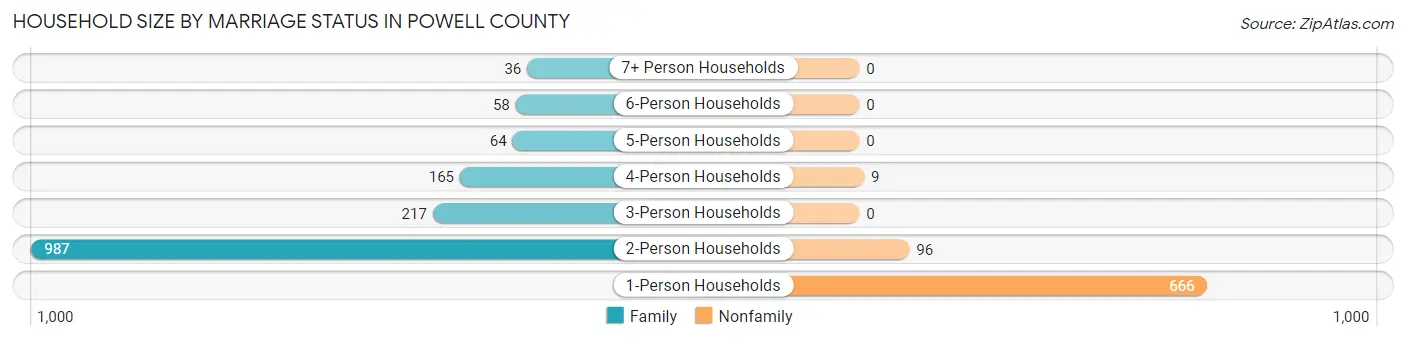
| Household Size | Family Households | Nonfamily Households |
| 1-Person Households | - | 666 (29.0%) |
| 2-Person Households | 987 (42.9%) | 96 (4.2%) |
| 3-Person Households | 217 (9.4%) | 0 (0.0%) |
| 4-Person Households | 165 (7.2%) | 9 (0.4%) |
| 5-Person Households | 64 (2.8%) | 0 (0.0%) |
| 6-Person Households | 58 (2.5%) | 0 (0.0%) |
| 7+ Person Households | 36 (1.6%) | 0 (0.0%) |
| Total | 1,527 (66.4%) | 771 (33.6%) |
Female Fertility in Powell County
Fertility by Age in Powell County
Average fertility rate in Powell County is 27.0 births per 1,000 women. Women in the age bracket of 20 to 34 years have the highest fertility rate with 45.0 births per 1,000 women. Women in the age bracket of 20 to 34 years acount for 50.0% of all women with births.
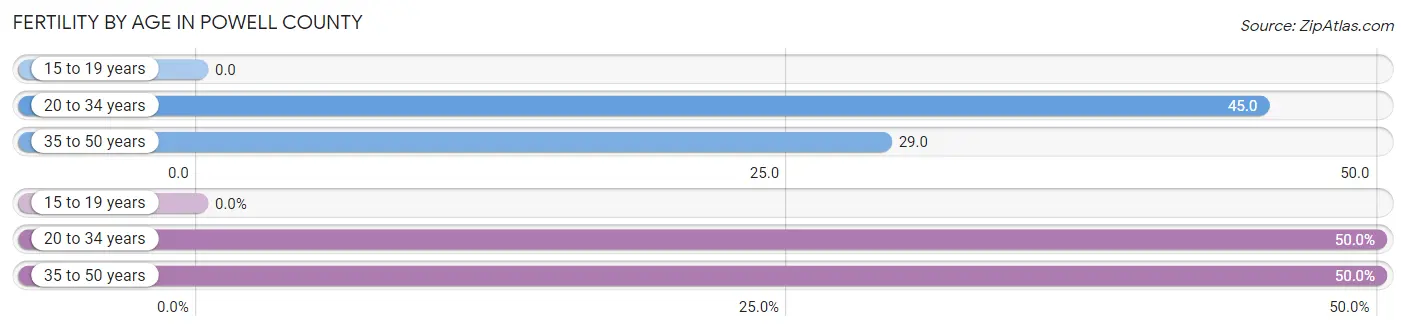
| Age Bracket | Women with Births | Births / 1,000 Women |
| 15 to 19 years | 0 (0.0%) | 0.0 |
| 20 to 34 years | 12 (50.0%) | 45.0 |
| 35 to 50 years | 12 (50.0%) | 29.0 |
| Total | 24 (100.0%) | 27.0 |
Fertility by Age by Marriage Status in Powell County
66.7% of women with births (24) in Powell County are married. The highest percentage of unmarried women with births falls into 20 to 34 years age bracket with 66.7% of them unmarried at the time of birth, while the lowest percentage of unmarried women with births belong to 35 to 50 years age bracket with 0.0% of them unmarried.
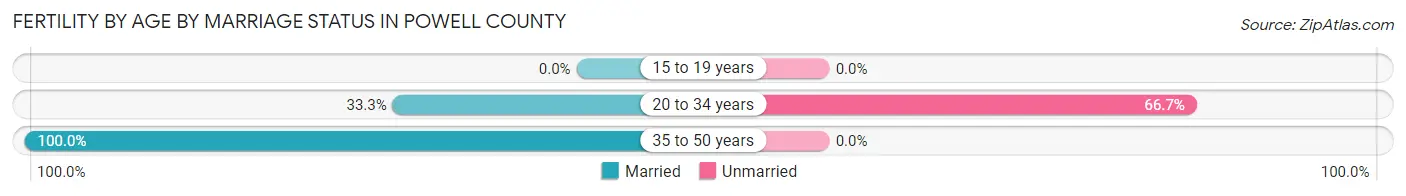
| Age Bracket | Married | Unmarried |
| 15 to 19 years | 0 (0.0%) | 0 (0.0%) |
| 20 to 34 years | 4 (33.3%) | 8 (66.7%) |
| 35 to 50 years | 12 (100.0%) | 0 (0.0%) |
| Total | 16 (66.7%) | 8 (33.3%) |
Fertility by Education in Powell County
Average fertility rate in Powell County is 27.0 births per 1,000 women. Women with the education attainment of graduate degree have the highest fertility rate of 192.0 births per 1,000 women, while women with the education attainment of less than high school have the lowest fertility at 4.0 births per 1,000 women. Women with the education attainment of graduate degree represent 41.7% of all women with births.
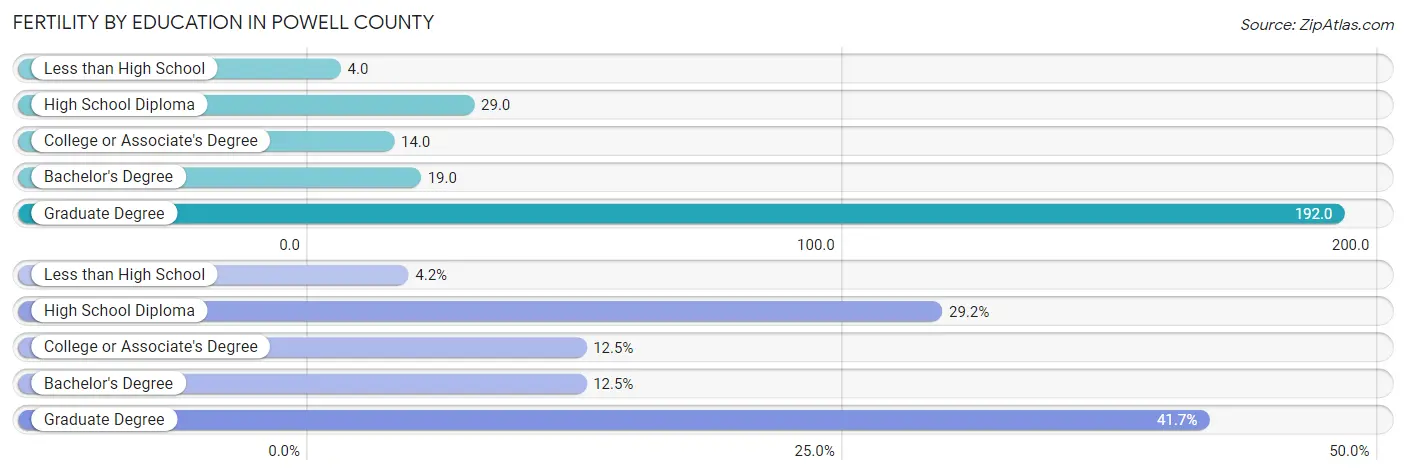
| Educational Attainment | Women with Births | Births / 1,000 Women |
| Less than High School | 1 (4.2%) | 4.0 |
| High School Diploma | 7 (29.2%) | 29.0 |
| College or Associate's Degree | 3 (12.5%) | 14.0 |
| Bachelor's Degree | 3 (12.5%) | 19.0 |
| Graduate Degree | 10 (41.7%) | 192.0 |
| Total | 24 (100.0%) | 27.0 |
Fertility by Education by Marriage Status in Powell County
33.3% of women with births in Powell County are unmarried. Women with the educational attainment of less than high school are most likely to be married with 100.0% of them married at childbirth, while women with the educational attainment of college or associate's degree are least likely to be married with 100.0% of them unmarried at childbirth.
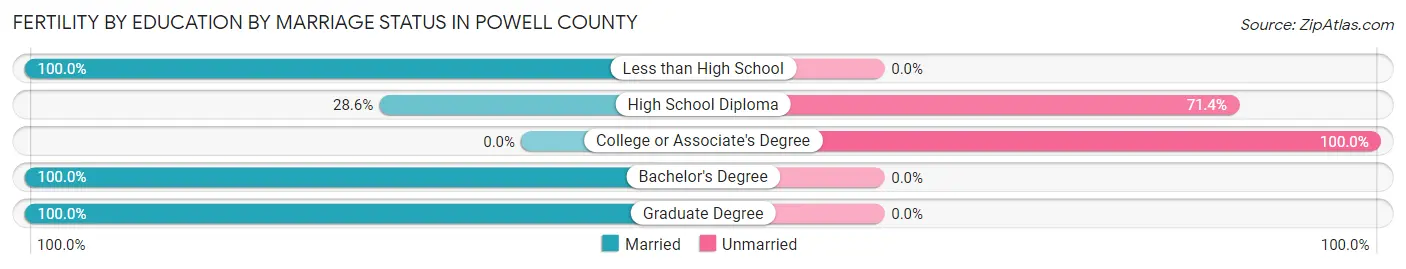
| Educational Attainment | Married | Unmarried |
| Less than High School | 1 (100.0%) | 0 (0.0%) |
| High School Diploma | 2 (28.6%) | 5 (71.4%) |
| College or Associate's Degree | 0 (0.0%) | 3 (100.0%) |
| Bachelor's Degree | 3 (100.0%) | 0 (0.0%) |
| Graduate Degree | 10 (100.0%) | 0 (0.0%) |
| Total | 16 (66.7%) | 8 (33.3%) |
Employment Characteristics in Powell County
Employment by Class of Employer in Powell County
Among the 2,415 employed individuals in Powell County, private company employees (1,402 | 58.1%), state government employees (267 | 11.1%), and local government employees (202 | 8.4%) make up the most common classes of employment.
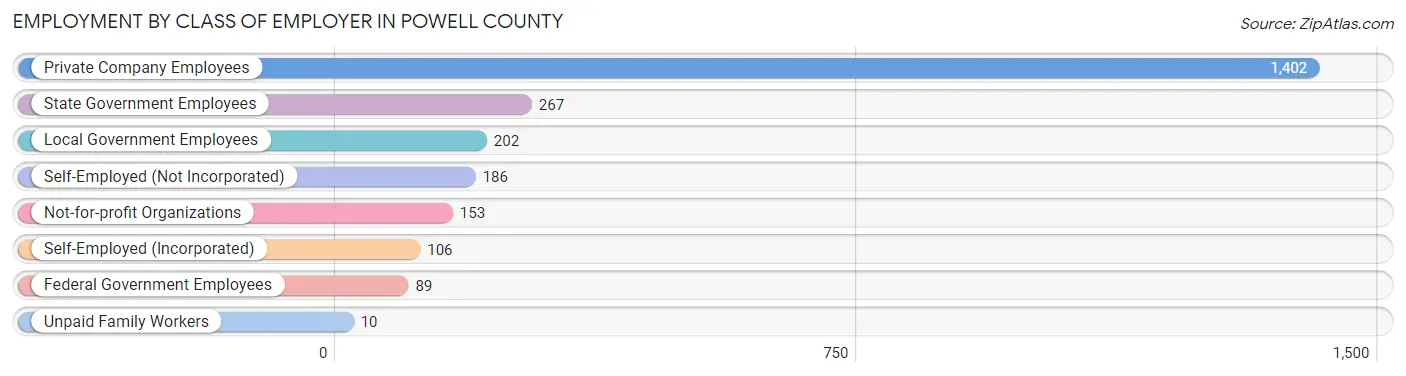
| Employer Class | # Employees | % Employees |
| Private Company Employees | 1,402 | 58.1% |
| Self-Employed (Incorporated) | 106 | 4.4% |
| Self-Employed (Not Incorporated) | 186 | 7.7% |
| Not-for-profit Organizations | 153 | 6.3% |
| Local Government Employees | 202 | 8.4% |
| State Government Employees | 267 | 11.1% |
| Federal Government Employees | 89 | 3.7% |
| Unpaid Family Workers | 10 | 0.4% |
| Total | 2,415 | 100.0% |
Employment Status by Age in Powell County
According to the labor force statistics for Powell County, out of the total population over 16 years of age (6,078), 43.8% or 2,662 individuals are in the labor force, with 4.8% or 128 of them unemployed. The age group with the highest labor force participation rate is 55 to 59 years, with 65.4% or 367 individuals in the labor force. Within the labor force, the 16 to 19 years age range has the highest percentage of unemployed individuals, with 26.6% or 46 of them being unemployed.
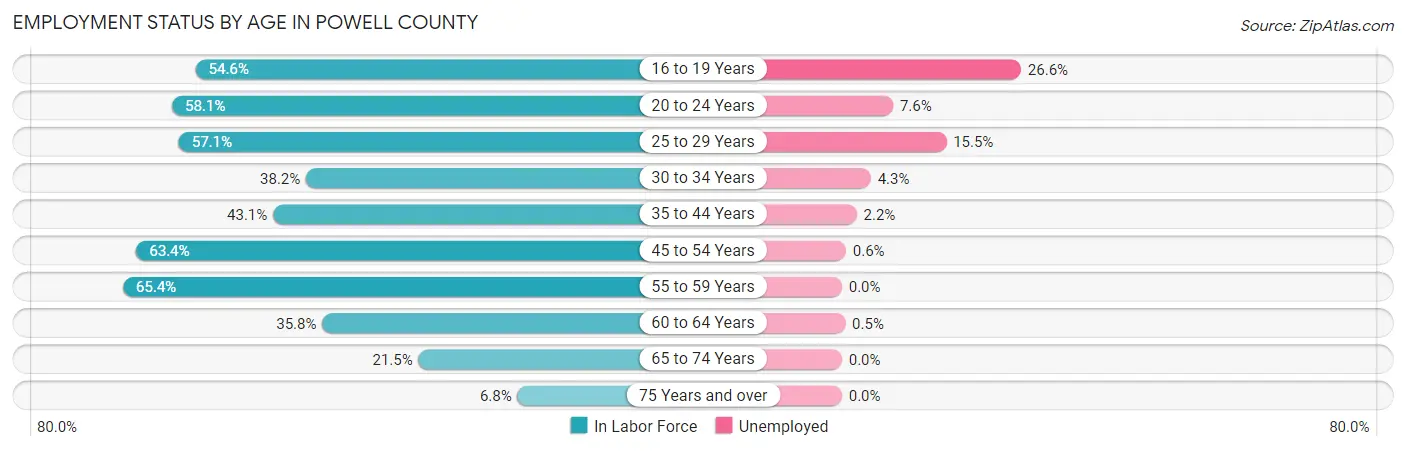
| Age Bracket | In Labor Force | Unemployed |
| 16 to 19 Years | 173 (54.6%) | 46 (26.6%) |
| 20 to 24 Years | 158 (58.1%) | 12 (7.6%) |
| 25 to 29 Years | 309 (57.1%) | 48 (15.5%) |
| 30 to 34 Years | 164 (38.2%) | 7 (4.3%) |
| 35 to 44 Years | 411 (43.1%) | 9 (2.2%) |
| 45 to 54 Years | 672 (63.4%) | 4 (0.6%) |
| 55 to 59 Years | 367 (65.4%) | 0 (0.0%) |
| 60 to 64 Years | 190 (35.8%) | 1 (0.5%) |
| 65 to 74 Years | 180 (21.5%) | 0 (0.0%) |
| 75 Years and over | 39 (6.8%) | 0 (0.0%) |
| Total | 2,662 (43.8%) | 128 (4.8%) |
Employment Status by Educational Attainment in Powell County
According to labor force statistics for Powell County, 51.9% of individuals (2,114) out of the total population between 25 and 64 years of age (4,074) are in the labor force, with 3.3% or 70 of them being unemployed. The group with the highest labor force participation rate are those with the educational attainment of bachelor's degree or higher, with 90.8% or 721 individuals in the labor force. Within the labor force, individuals with less than high school education have the highest percentage of unemployment, with 11.4% or 8 of them being unemployed.
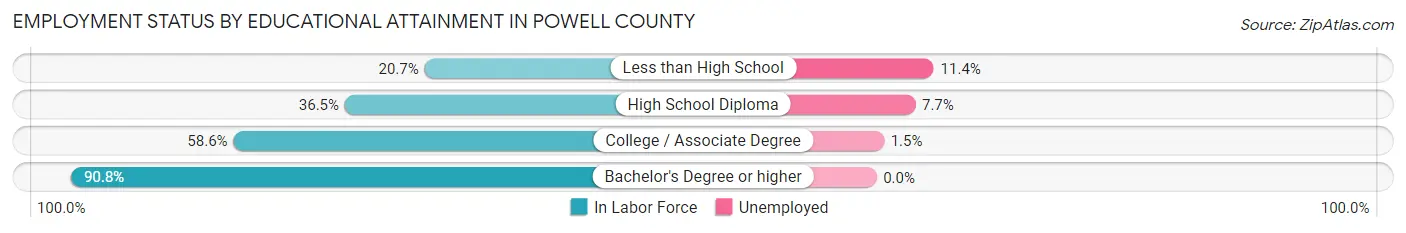
| Educational Attainment | In Labor Force | Unemployed |
| Less than High School | 70 (20.7%) | 39 (11.4%) |
| High School Diploma | 664 (36.5%) | 140 (7.7%) |
| College / Associate Degree | 659 (58.6%) | 17 (1.5%) |
| Bachelor's Degree or higher | 721 (90.8%) | 0 (0.0%) |
| Total | 2,114 (51.9%) | 134 (3.3%) |
Employment Occupations by Sex in Powell County
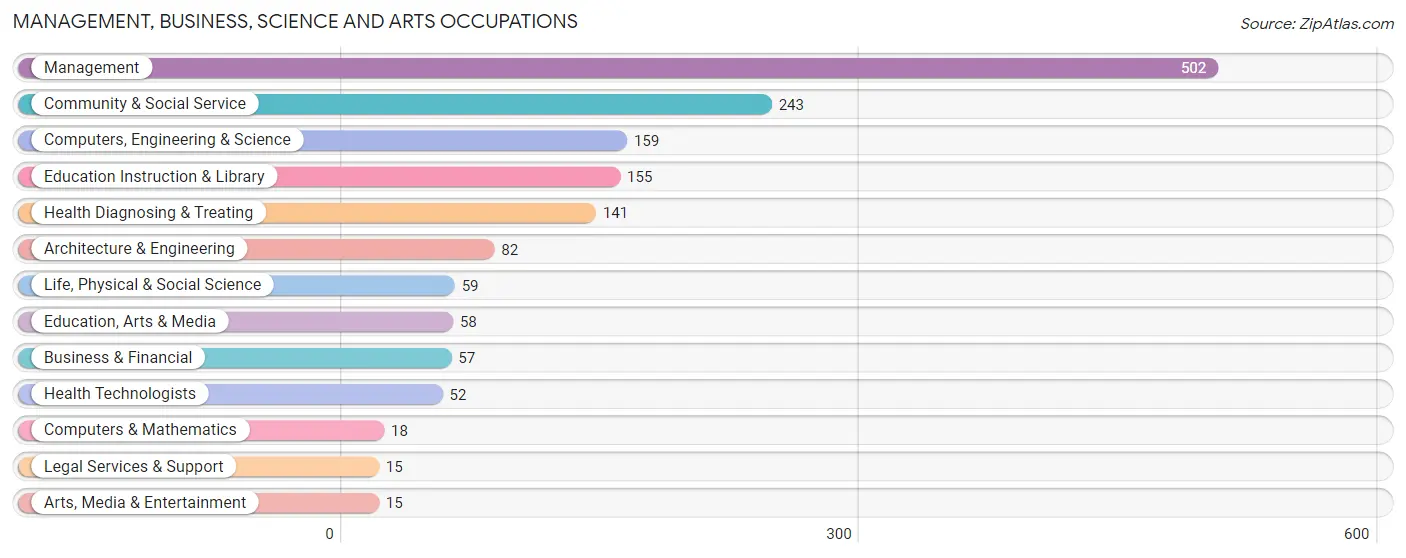
Management, Business, Science and Arts Occupations
The most common Management, Business, Science and Arts occupations in Powell County are Management (502 | 19.8%), Community & Social Service (243 | 9.6%), Computers, Engineering & Science (159 | 6.3%), Education Instruction & Library (155 | 6.1%), and Health Diagnosing & Treating (141 | 5.6%).
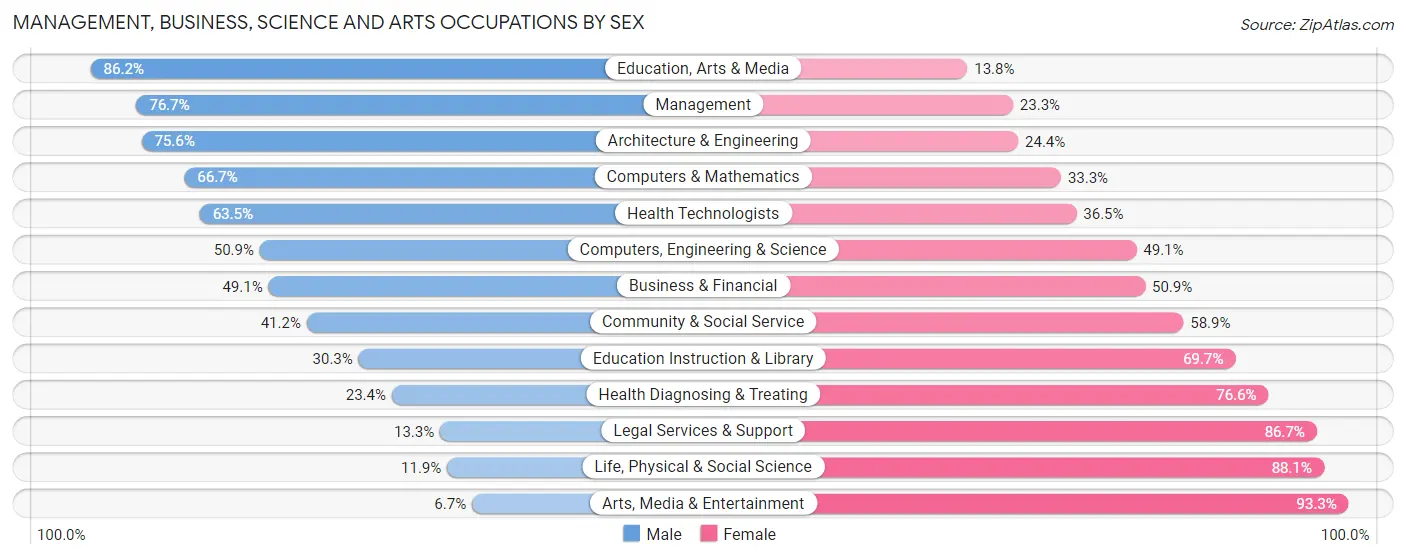
Management, Business, Science and Arts Occupations by Sex
Within the Management, Business, Science and Arts occupations in Powell County, the most male-oriented occupations are Education, Arts & Media (86.2%), Management (76.7%), and Architecture & Engineering (75.6%), while the most female-oriented occupations are Arts, Media & Entertainment (93.3%), Life, Physical & Social Science (88.1%), and Legal Services & Support (86.7%).
| Occupation | Male | Female |
| Management | 385 (76.7%) | 117 (23.3%) |
| Business & Financial | 28 (49.1%) | 29 (50.9%) |
| Computers, Engineering & Science | 81 (50.9%) | 78 (49.1%) |
| Computers & Mathematics | 12 (66.7%) | 6 (33.3%) |
| Architecture & Engineering | 62 (75.6%) | 20 (24.4%) |
| Life, Physical & Social Science | 7 (11.9%) | 52 (88.1%) |
| Community & Social Service | 100 (41.1%) | 143 (58.9%) |
| Education, Arts & Media | 50 (86.2%) | 8 (13.8%) |
| Legal Services & Support | 2 (13.3%) | 13 (86.7%) |
| Education Instruction & Library | 47 (30.3%) | 108 (69.7%) |
| Arts, Media & Entertainment | 1 (6.7%) | 14 (93.3%) |
| Health Diagnosing & Treating | 33 (23.4%) | 108 (76.6%) |
| Health Technologists | 33 (63.5%) | 19 (36.5%) |
| Total (Category) | 627 (56.9%) | 475 (43.1%) |
| Total (Overall) | 1,501 (59.2%) | 1,034 (40.8%) |
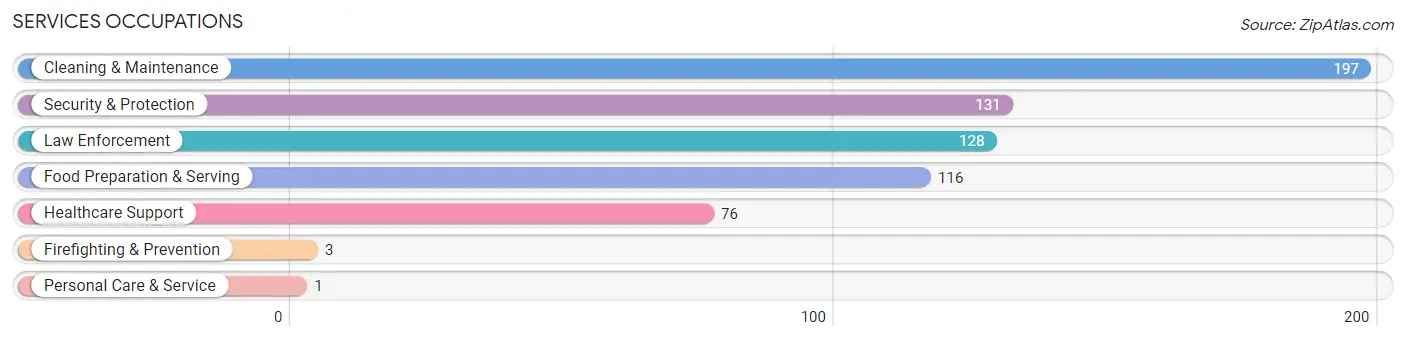
Services Occupations
The most common Services occupations in Powell County are Cleaning & Maintenance (197 | 7.8%), Security & Protection (131 | 5.2%), Law Enforcement (128 | 5.1%), Food Preparation & Serving (116 | 4.6%), and Healthcare Support (76 | 3.0%).
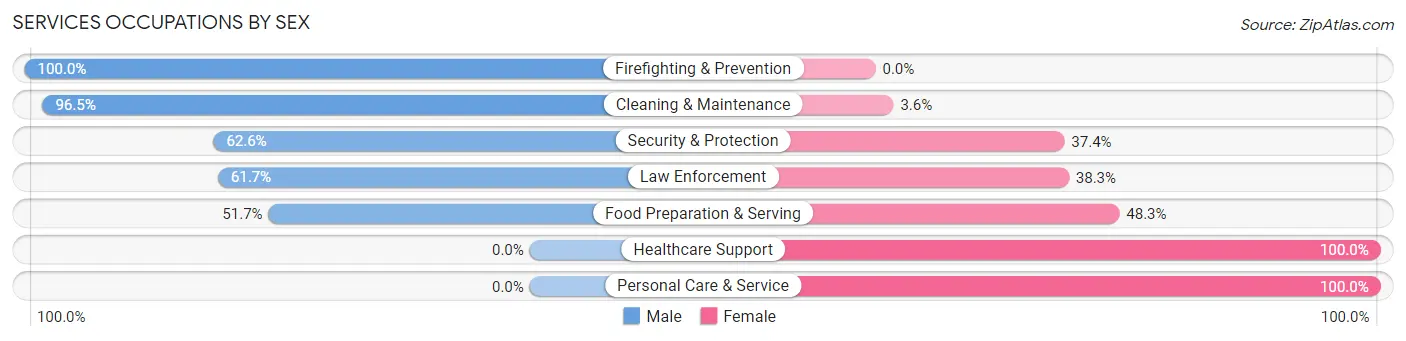
Services Occupations by Sex
Within the Services occupations in Powell County, the most male-oriented occupations are Firefighting & Prevention (100.0%), Cleaning & Maintenance (96.5%), and Security & Protection (62.6%), while the most female-oriented occupations are Healthcare Support (100.0%), Personal Care & Service (100.0%), and Food Preparation & Serving (48.3%).
| Occupation | Male | Female |
| Healthcare Support | 0 (0.0%) | 76 (100.0%) |
| Security & Protection | 82 (62.6%) | 49 (37.4%) |
| Firefighting & Prevention | 3 (100.0%) | 0 (0.0%) |
| Law Enforcement | 79 (61.7%) | 49 (38.3%) |
| Food Preparation & Serving | 60 (51.7%) | 56 (48.3%) |
| Cleaning & Maintenance | 190 (96.5%) | 7 (3.5%) |
| Personal Care & Service | 0 (0.0%) | 1 (100.0%) |
| Total (Category) | 332 (63.7%) | 189 (36.3%) |
| Total (Overall) | 1,501 (59.2%) | 1,034 (40.8%) |
Sales and Office Occupations
The most common Sales and Office occupations in Powell County are Office & Administration (239 | 9.4%), and Sales & Related (218 | 8.6%).

Sales and Office Occupations by Sex

| Occupation | Male | Female |
| Sales & Related | 130 (59.6%) | 88 (40.4%) |
| Office & Administration | 16 (6.7%) | 223 (93.3%) |
| Total (Category) | 146 (32.0%) | 311 (68.0%) |
| Total (Overall) | 1,501 (59.2%) | 1,034 (40.8%) |
Natural Resources, Construction and Maintenance Occupations
The most common Natural Resources, Construction and Maintenance occupations in Powell County are Farming, Fishing & Forestry (107 | 4.2%), Construction & Extraction (45 | 1.8%), and Installation, Maintenance & Repair (34 | 1.3%).
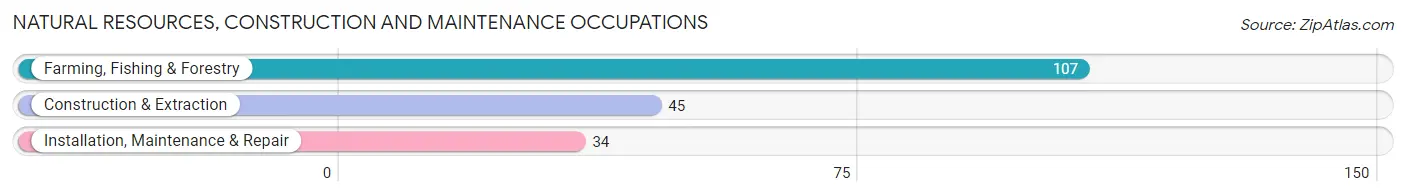
Natural Resources, Construction and Maintenance Occupations by Sex
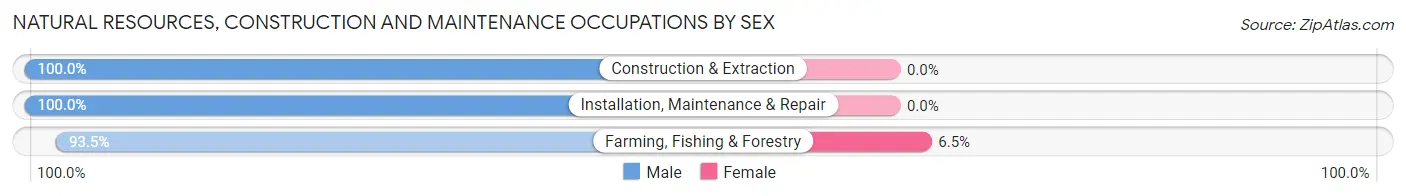
| Occupation | Male | Female |
| Farming, Fishing & Forestry | 100 (93.5%) | 7 (6.5%) |
| Construction & Extraction | 45 (100.0%) | 0 (0.0%) |
| Installation, Maintenance & Repair | 34 (100.0%) | 0 (0.0%) |
| Total (Category) | 179 (96.2%) | 7 (3.8%) |
| Total (Overall) | 1,501 (59.2%) | 1,034 (40.8%) |
Production, Transportation and Moving Occupations
The most common Production, Transportation and Moving occupations in Powell County are Production (120 | 4.7%), Material Moving (83 | 3.3%), and Transportation (66 | 2.6%).
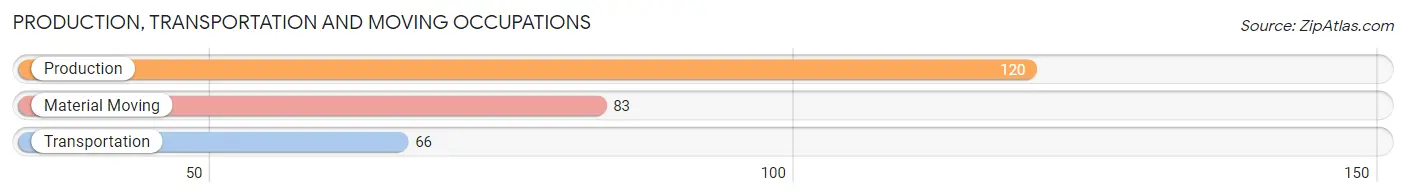
Production, Transportation and Moving Occupations by Sex
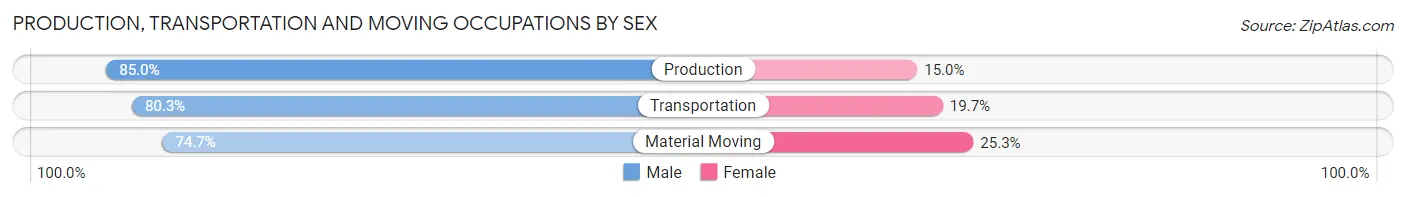
| Occupation | Male | Female |
| Production | 102 (85.0%) | 18 (15.0%) |
| Transportation | 53 (80.3%) | 13 (19.7%) |
| Material Moving | 62 (74.7%) | 21 (25.3%) |
| Total (Category) | 217 (80.7%) | 52 (19.3%) |
| Total (Overall) | 1,501 (59.2%) | 1,034 (40.8%) |
Employment Industries by Sex in Powell County
Employment Industries in Powell County
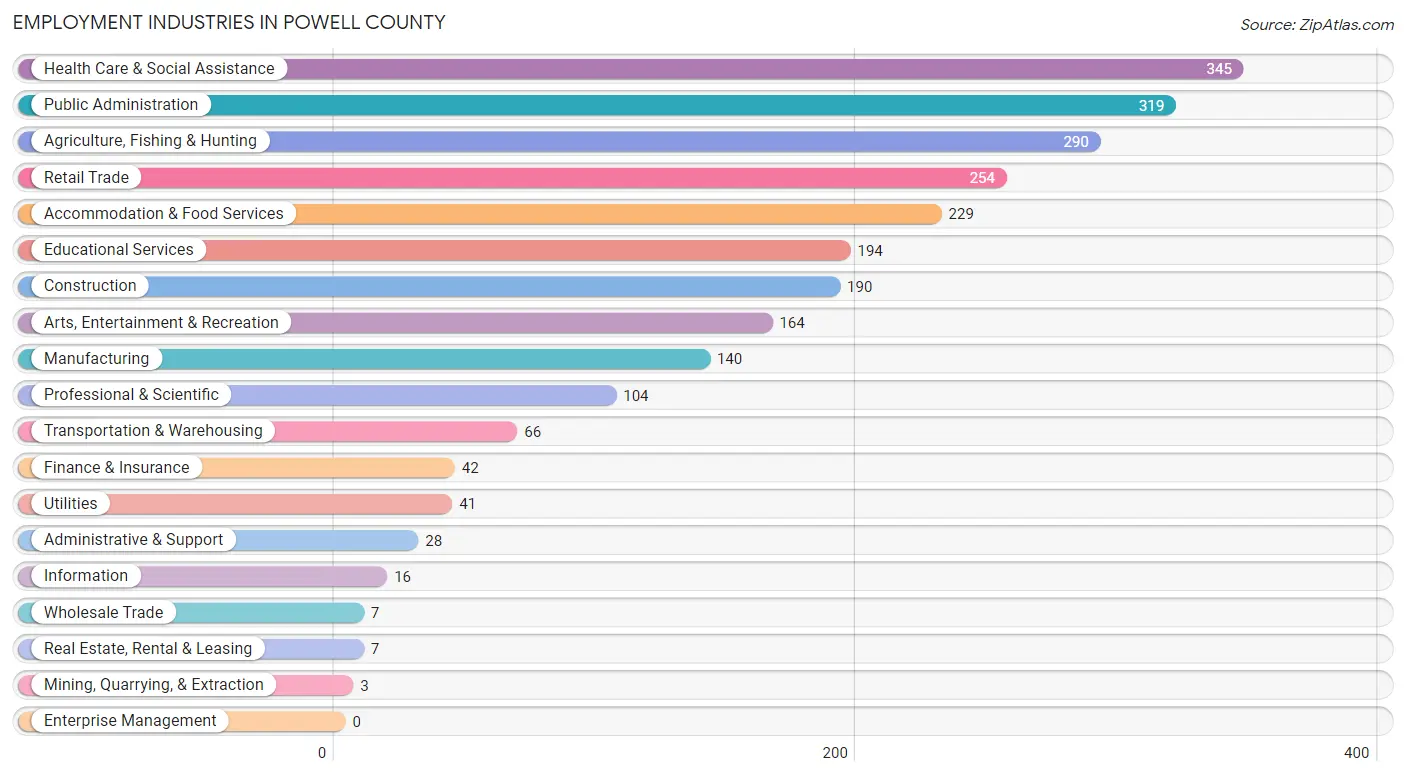
The major employment industries in Powell County include Health Care & Social Assistance (345 | 13.6%), Public Administration (319 | 12.6%), Agriculture, Fishing & Hunting (290 | 11.4%), Retail Trade (254 | 10.0%), and Accommodation & Food Services (229 | 9.0%).
Employment Industries by Sex in Powell County
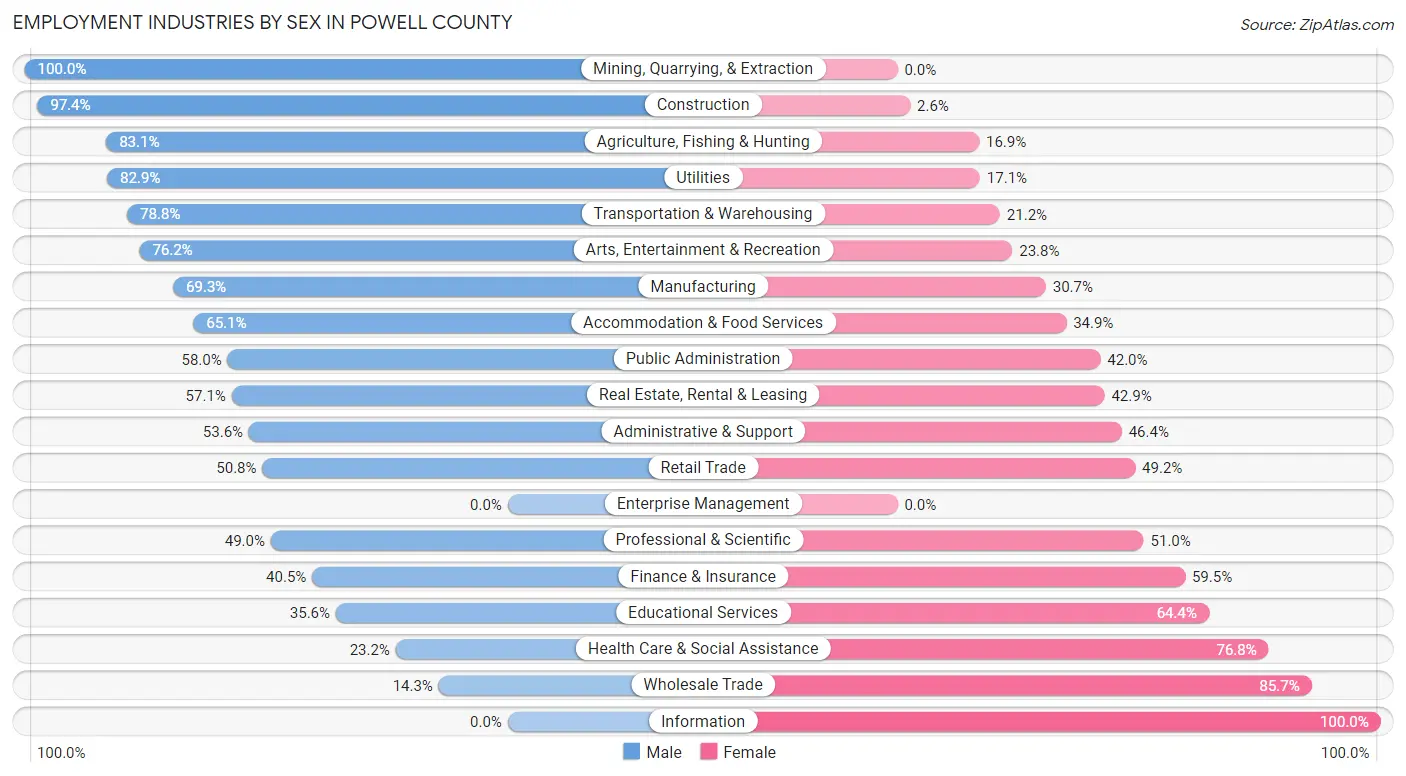
The Powell County industries that see more men than women are Mining, Quarrying, & Extraction (100.0%), Construction (97.4%), and Agriculture, Fishing & Hunting (83.1%), whereas the industries that tend to have a higher number of women are Information (100.0%), Wholesale Trade (85.7%), and Health Care & Social Assistance (76.8%).
| Industry | Male | Female |
| Agriculture, Fishing & Hunting | 241 (83.1%) | 49 (16.9%) |
| Mining, Quarrying, & Extraction | 3 (100.0%) | 0 (0.0%) |
| Construction | 185 (97.4%) | 5 (2.6%) |
| Manufacturing | 97 (69.3%) | 43 (30.7%) |
| Wholesale Trade | 1 (14.3%) | 6 (85.7%) |
| Retail Trade | 129 (50.8%) | 125 (49.2%) |
| Transportation & Warehousing | 52 (78.8%) | 14 (21.2%) |
| Utilities | 34 (82.9%) | 7 (17.1%) |
| Information | 0 (0.0%) | 16 (100.0%) |
| Finance & Insurance | 17 (40.5%) | 25 (59.5%) |
| Real Estate, Rental & Leasing | 4 (57.1%) | 3 (42.9%) |
| Professional & Scientific | 51 (49.0%) | 53 (51.0%) |
| Enterprise Management | 0 (0.0%) | 0 (0.0%) |
| Administrative & Support | 15 (53.6%) | 13 (46.4%) |
| Educational Services | 69 (35.6%) | 125 (64.4%) |
| Health Care & Social Assistance | 80 (23.2%) | 265 (76.8%) |
| Arts, Entertainment & Recreation | 125 (76.2%) | 39 (23.8%) |
| Accommodation & Food Services | 149 (65.1%) | 80 (34.9%) |
| Public Administration | 185 (58.0%) | 134 (42.0%) |
| Total | 1,501 (59.2%) | 1,034 (40.8%) |
Education in Powell County
School Enrollment in Powell County
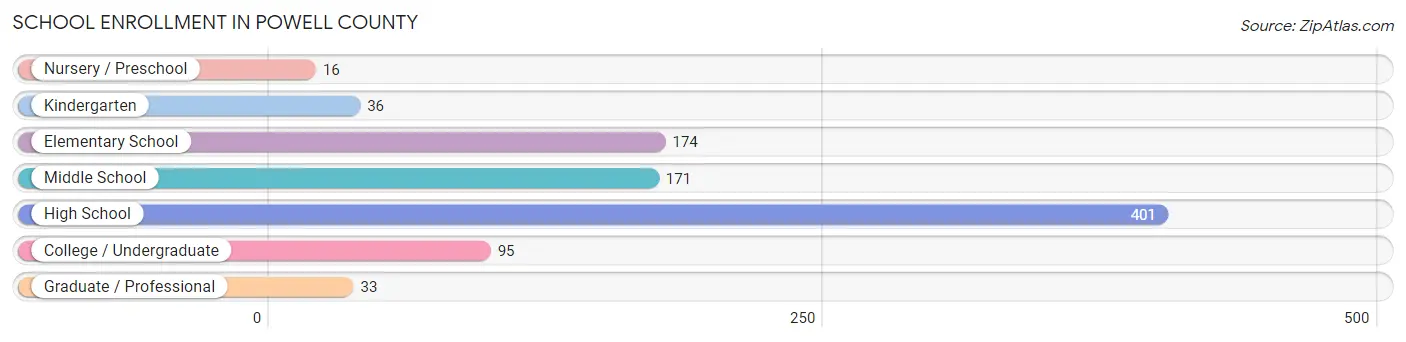
The most common levels of schooling among the 926 students in Powell County are high school (401 | 43.3%), elementary school (174 | 18.8%), and middle school (171 | 18.5%).
| School Level | # Students | % Students |
| Nursery / Preschool | 16 | 1.7% |
| Kindergarten | 36 | 3.9% |
| Elementary School | 174 | 18.8% |
| Middle School | 171 | 18.5% |
| High School | 401 | 43.3% |
| College / Undergraduate | 95 | 10.3% |
| Graduate / Professional | 33 | 3.6% |
| Total | 926 | 100.0% |
School Enrollment by Age by Funding Source in Powell County
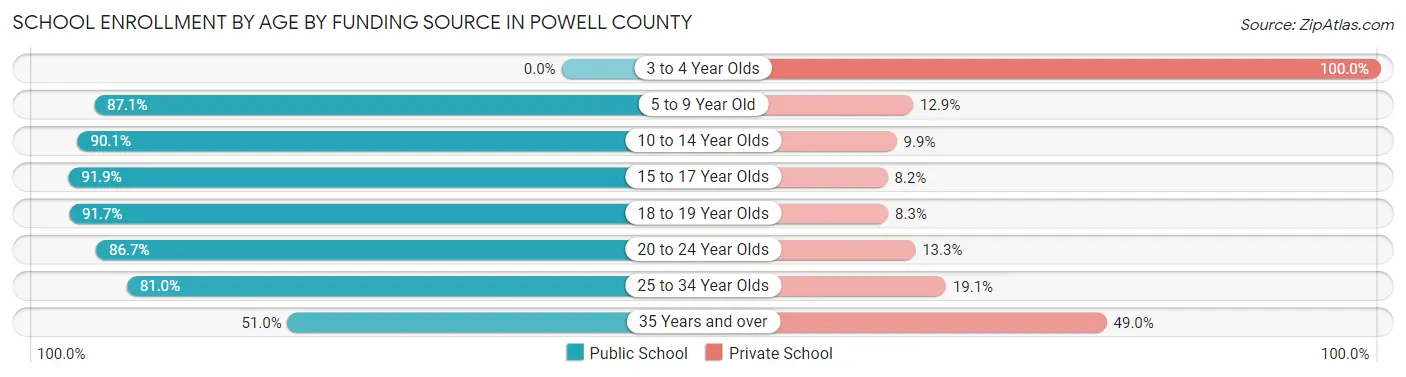
Out of a total of 926 students who are enrolled in schools in Powell County, 140 (15.1%) attend a private institution, while the remaining 786 (84.9%) are enrolled in public schools. The age group of 3 to 4 year olds has the highest likelihood of being enrolled in private schools, with 9 (100.0% in the age bracket) enrolled. Conversely, the age group of 15 to 17 year olds has the lowest likelihood of being enrolled in a private school, with 169 (91.8% in the age bracket) attending a public institution.
| Age Bracket | Public School | Private School |
| 3 to 4 Year Olds | 0 (0.0%) | 9 (100.0%) |
| 5 to 9 Year Old | 148 (87.1%) | 22 (12.9%) |
| 10 to 14 Year Olds | 210 (90.1%) | 23 (9.9%) |
| 15 to 17 Year Olds | 169 (91.8%) | 15 (8.2%) |
| 18 to 19 Year Olds | 166 (91.7%) | 15 (8.3%) |
| 20 to 24 Year Olds | 26 (86.7%) | 4 (13.3%) |
| 25 to 34 Year Olds | 17 (80.9%) | 4 (19.1%) |
| 35 Years and over | 50 (51.0%) | 48 (49.0%) |
| Total | 786 (84.9%) | 140 (15.1%) |
Educational Attainment by Field of Study in Powell County
Education (267 | 23.7%), science & technology (259 | 23.0%), bio, nature & agricultural (107 | 9.5%), business (101 | 9.0%), and engineering (87 | 7.7%) are the most common fields of study among 1,127 individuals in Powell County who have obtained a bachelor's degree or higher.
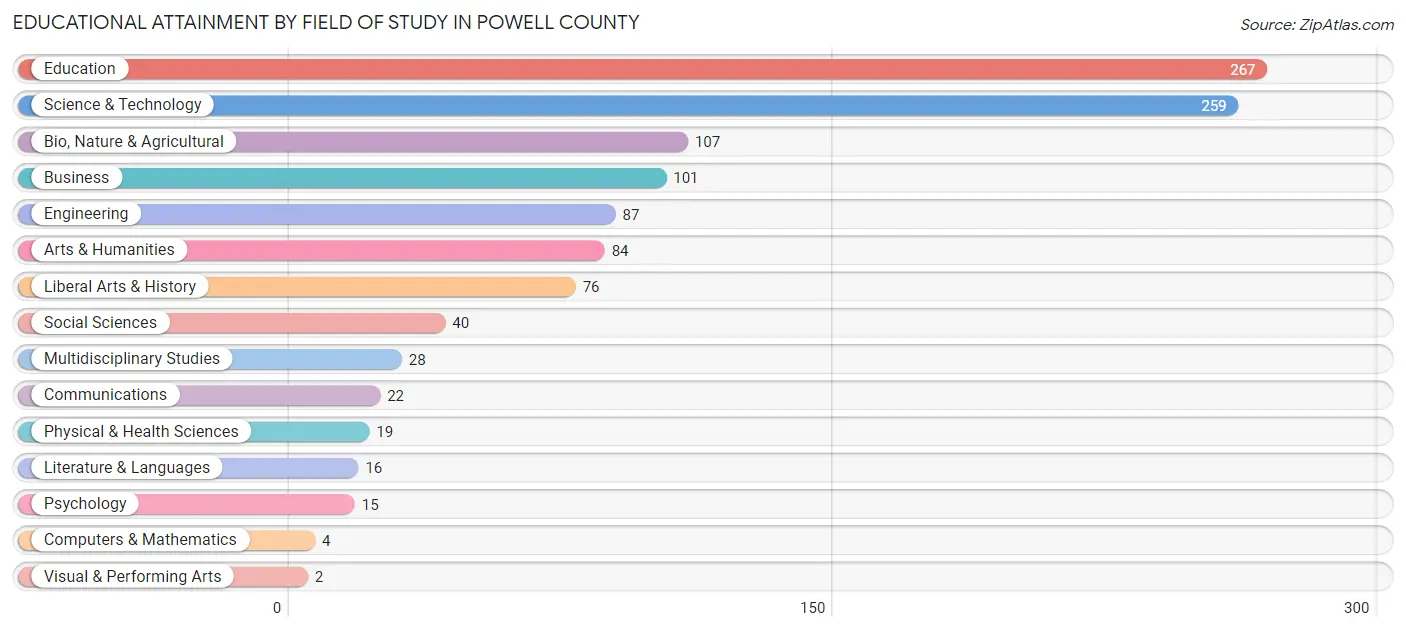
| Field of Study | # Graduates | % Graduates |
| Computers & Mathematics | 4 | 0.4% |
| Bio, Nature & Agricultural | 107 | 9.5% |
| Physical & Health Sciences | 19 | 1.7% |
| Psychology | 15 | 1.3% |
| Social Sciences | 40 | 3.5% |
| Engineering | 87 | 7.7% |
| Multidisciplinary Studies | 28 | 2.5% |
| Science & Technology | 259 | 23.0% |
| Business | 101 | 9.0% |
| Education | 267 | 23.7% |
| Literature & Languages | 16 | 1.4% |
| Liberal Arts & History | 76 | 6.7% |
| Visual & Performing Arts | 2 | 0.2% |
| Communications | 22 | 1.9% |
| Arts & Humanities | 84 | 7.4% |
| Total | 1,127 | 100.0% |
Transportation & Commute in Powell County
Vehicle Availability by Sex in Powell County
The most prevalent vehicle ownership categories in Powell County are males with 2 vehicles (539, accounting for 39.0%) and females with 2 vehicles (434, making up 52.4%).
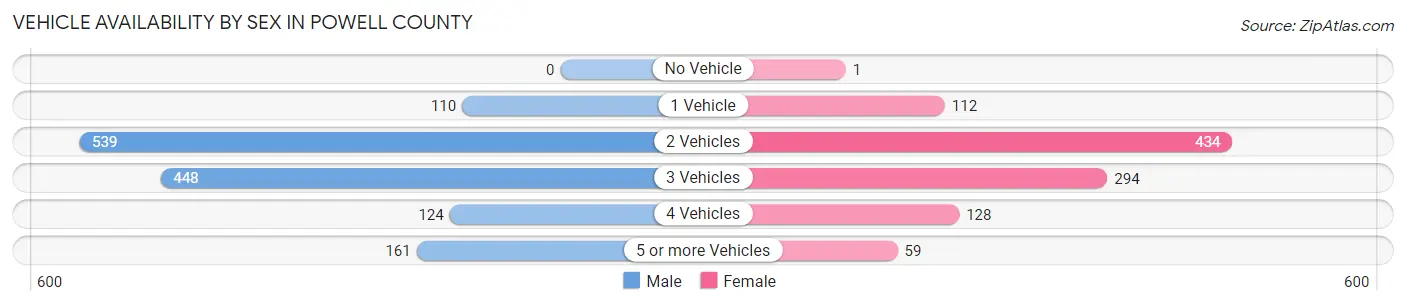
| Vehicles Available | Male | Female |
| No Vehicle | 0 (0.0%) | 1 (0.1%) |
| 1 Vehicle | 110 (8.0%) | 112 (10.9%) |
| 2 Vehicles | 539 (39.0%) | 434 (42.2%) |
| 3 Vehicles | 448 (32.4%) | 294 (28.6%) |
| 4 Vehicles | 124 (9.0%) | 128 (12.4%) |
| 5 or more Vehicles | 161 (11.7%) | 59 (5.7%) |
| Total | 1,382 (100.0%) | 1,028 (100.0%) |
Commute Time in Powell County
The most frequently occuring commute durations in Powell County are 10 to 14 minutes (607 commuters, 27.3%), 5 to 9 minutes (525 commuters, 23.6%), and 30 to 34 minutes (307 commuters, 13.8%).
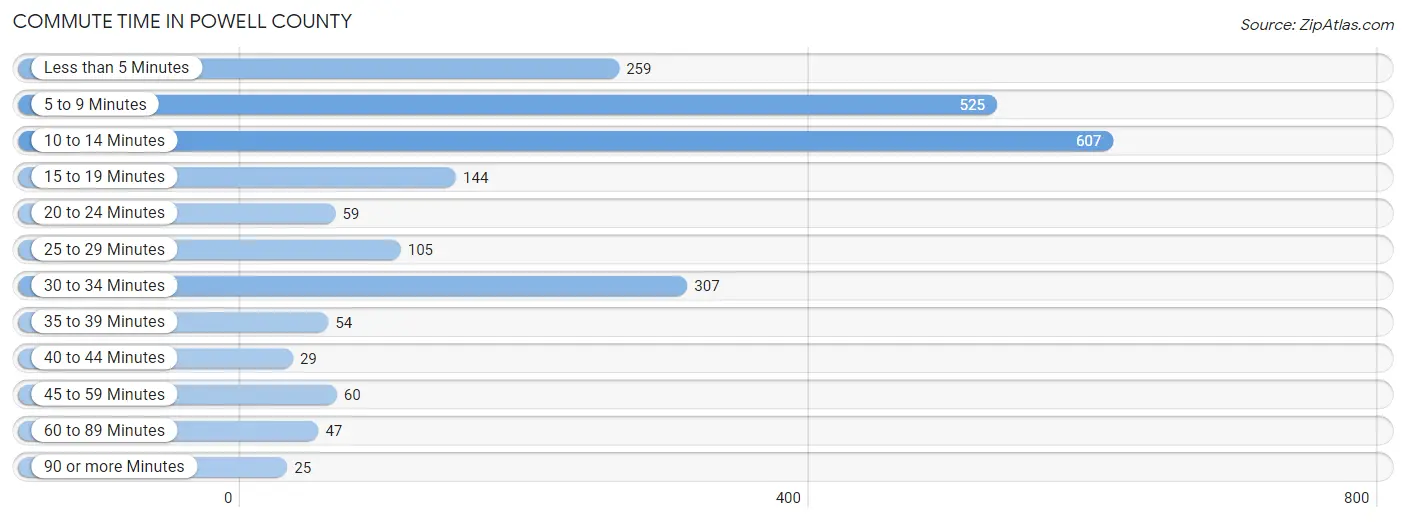
| Commute Time | # Commuters | % Commuters |
| Less than 5 Minutes | 259 | 11.7% |
| 5 to 9 Minutes | 525 | 23.6% |
| 10 to 14 Minutes | 607 | 27.3% |
| 15 to 19 Minutes | 144 | 6.5% |
| 20 to 24 Minutes | 59 | 2.7% |
| 25 to 29 Minutes | 105 | 4.7% |
| 30 to 34 Minutes | 307 | 13.8% |
| 35 to 39 Minutes | 54 | 2.4% |
| 40 to 44 Minutes | 29 | 1.3% |
| 45 to 59 Minutes | 60 | 2.7% |
| 60 to 89 Minutes | 47 | 2.1% |
| 90 or more Minutes | 25 | 1.1% |
Commute Time by Sex in Powell County
The most common commute times in Powell County are 10 to 14 minutes (341 commuters, 26.4%) for males and 5 to 9 minutes (275 commuters, 29.5%) for females.
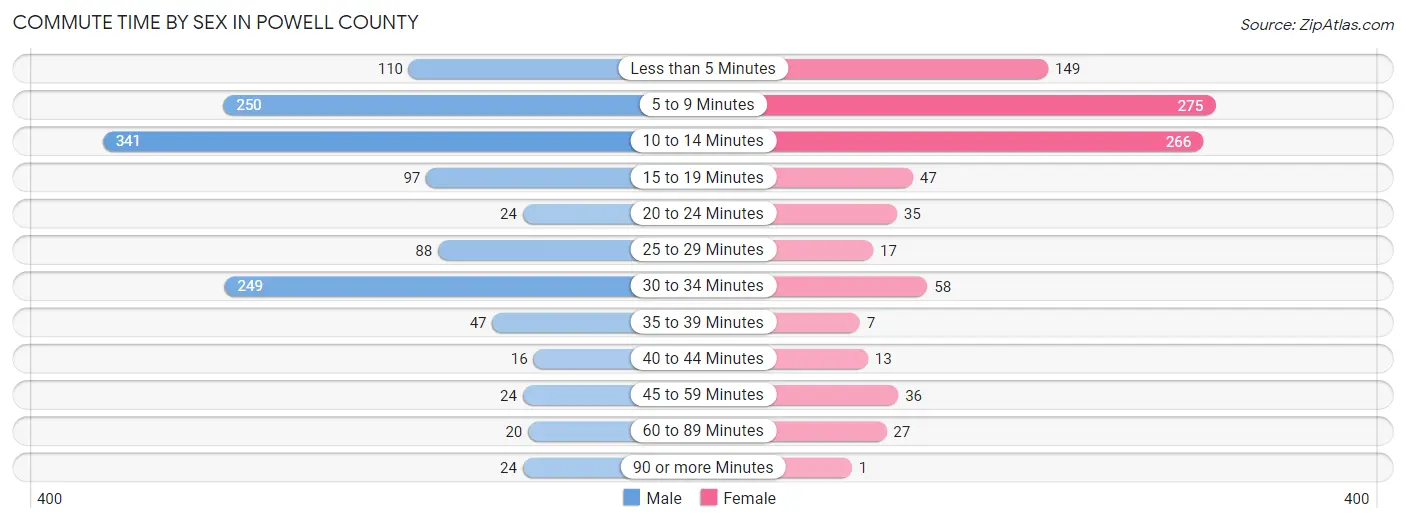
| Commute Time | Male | Female |
| Less than 5 Minutes | 110 (8.5%) | 149 (16.0%) |
| 5 to 9 Minutes | 250 (19.4%) | 275 (29.5%) |
| 10 to 14 Minutes | 341 (26.4%) | 266 (28.6%) |
| 15 to 19 Minutes | 97 (7.5%) | 47 (5.1%) |
| 20 to 24 Minutes | 24 (1.9%) | 35 (3.8%) |
| 25 to 29 Minutes | 88 (6.8%) | 17 (1.8%) |
| 30 to 34 Minutes | 249 (19.3%) | 58 (6.2%) |
| 35 to 39 Minutes | 47 (3.6%) | 7 (0.7%) |
| 40 to 44 Minutes | 16 (1.2%) | 13 (1.4%) |
| 45 to 59 Minutes | 24 (1.9%) | 36 (3.9%) |
| 60 to 89 Minutes | 20 (1.5%) | 27 (2.9%) |
| 90 or more Minutes | 24 (1.9%) | 1 (0.1%) |
Time of Departure to Work by Sex in Powell County
The most frequent times of departure to work in Powell County are 4:00 PM to 11:59 PM (194, 15.0%) for males and 7:30 AM to 7:59 AM (227, 24.4%) for females.
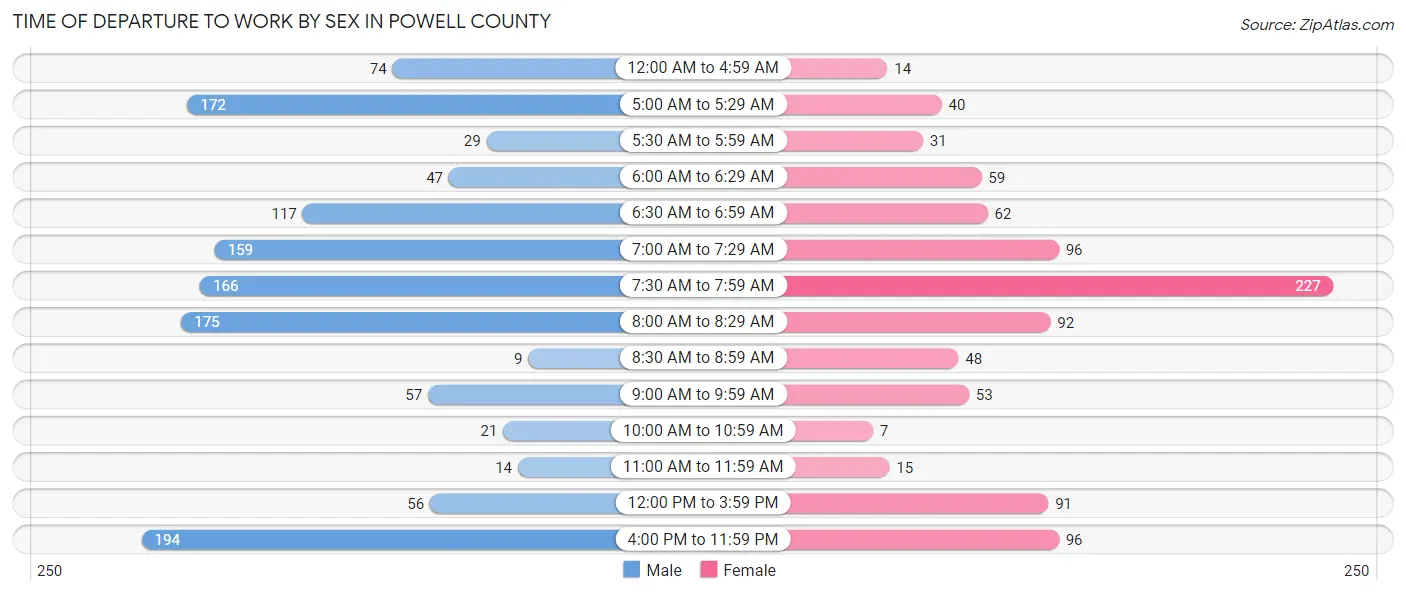
| Time of Departure | Male | Female |
| 12:00 AM to 4:59 AM | 74 (5.7%) | 14 (1.5%) |
| 5:00 AM to 5:29 AM | 172 (13.3%) | 40 (4.3%) |
| 5:30 AM to 5:59 AM | 29 (2.2%) | 31 (3.3%) |
| 6:00 AM to 6:29 AM | 47 (3.6%) | 59 (6.3%) |
| 6:30 AM to 6:59 AM | 117 (9.1%) | 62 (6.7%) |
| 7:00 AM to 7:29 AM | 159 (12.3%) | 96 (10.3%) |
| 7:30 AM to 7:59 AM | 166 (12.9%) | 227 (24.4%) |
| 8:00 AM to 8:29 AM | 175 (13.6%) | 92 (9.9%) |
| 8:30 AM to 8:59 AM | 9 (0.7%) | 48 (5.2%) |
| 9:00 AM to 9:59 AM | 57 (4.4%) | 53 (5.7%) |
| 10:00 AM to 10:59 AM | 21 (1.6%) | 7 (0.7%) |
| 11:00 AM to 11:59 AM | 14 (1.1%) | 15 (1.6%) |
| 12:00 PM to 3:59 PM | 56 (4.3%) | 91 (9.8%) |
| 4:00 PM to 11:59 PM | 194 (15.0%) | 96 (10.3%) |
| Total | 1,290 (100.0%) | 931 (100.0%) |
Housing Occupancy in Powell County
Occupancy by Ownership in Powell County
Of the total 2,298 dwellings in Powell County, owner-occupied units account for 1,606 (69.9%), while renter-occupied units make up 692 (30.1%).
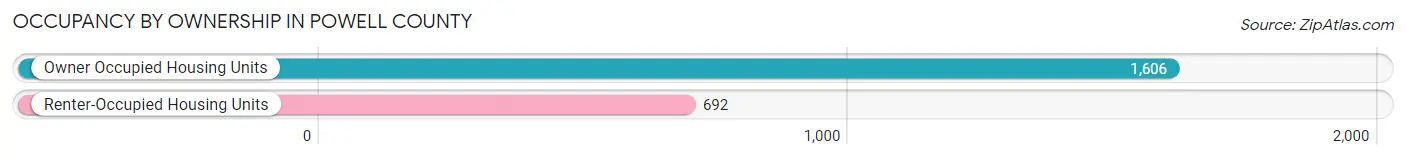
| Occupancy | # Housing Units | % Housing Units |
| Owner Occupied Housing Units | 1,606 | 69.9% |
| Renter-Occupied Housing Units | 692 | 30.1% |
| Total Occupied Housing Units | 2,298 | 100.0% |
Occupancy by Household Size in Powell County
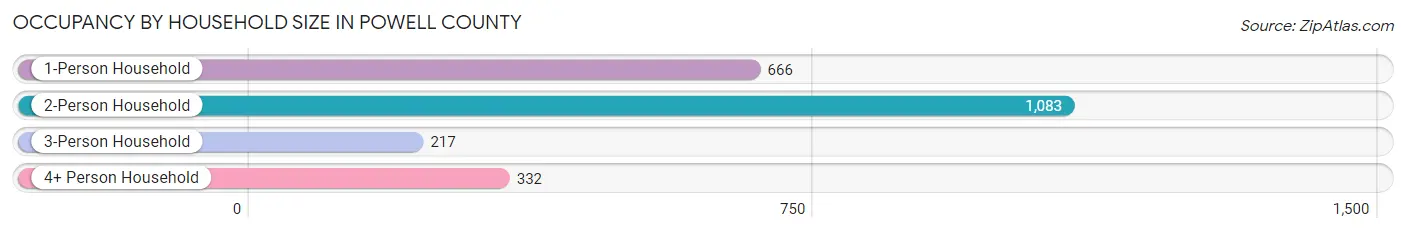
| Household Size | # Housing Units | % Housing Units |
| 1-Person Household | 666 | 29.0% |
| 2-Person Household | 1,083 | 47.1% |
| 3-Person Household | 217 | 9.4% |
| 4+ Person Household | 332 | 14.4% |
| Total Housing Units | 2,298 | 100.0% |
Occupancy by Ownership by Household Size in Powell County
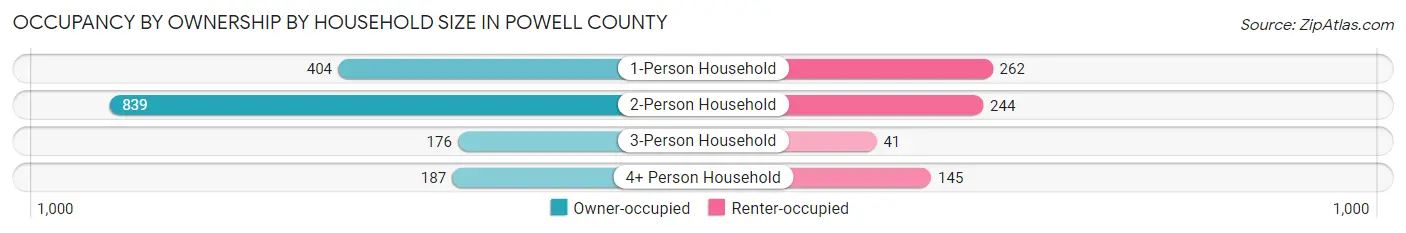
| Household Size | Owner-occupied | Renter-occupied |
| 1-Person Household | 404 (60.7%) | 262 (39.3%) |
| 2-Person Household | 839 (77.5%) | 244 (22.5%) |
| 3-Person Household | 176 (81.1%) | 41 (18.9%) |
| 4+ Person Household | 187 (56.3%) | 145 (43.7%) |
| Total Housing Units | 1,606 (69.9%) | 692 (30.1%) |
Occupancy by Educational Attainment in Powell County
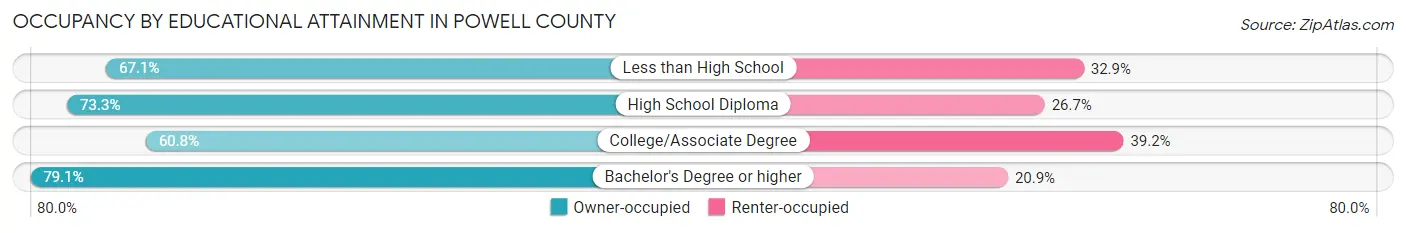
| Household Size | Owner-occupied | Renter-occupied |
| Less than High School | 55 (67.1%) | 27 (32.9%) |
| High School Diploma | 529 (73.3%) | 193 (26.7%) |
| College/Associate Degree | 530 (60.8%) | 342 (39.2%) |
| Bachelor's Degree or higher | 492 (79.1%) | 130 (20.9%) |
Occupancy by Age of Householder in Powell County
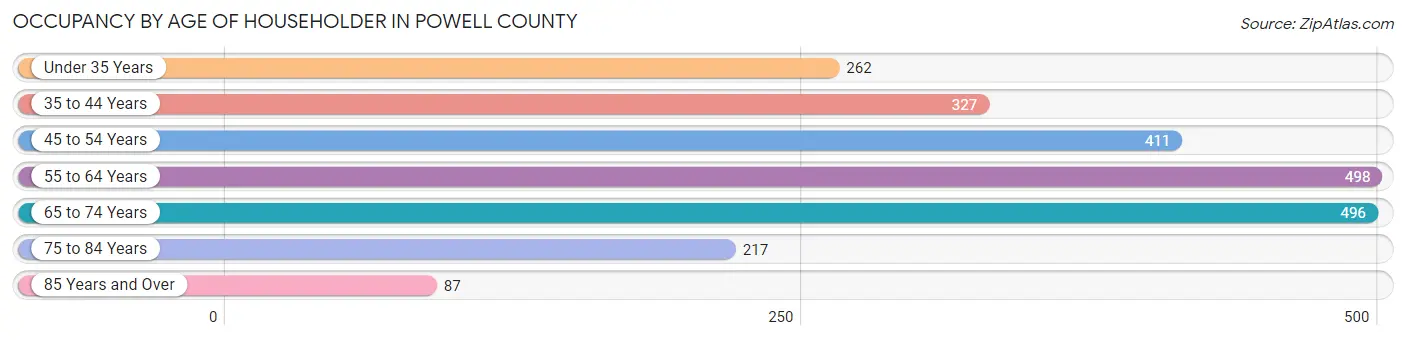
| Age Bracket | # Households | % Households |
| Under 35 Years | 262 | 11.4% |
| 35 to 44 Years | 327 | 14.2% |
| 45 to 54 Years | 411 | 17.9% |
| 55 to 64 Years | 498 | 21.7% |
| 65 to 74 Years | 496 | 21.6% |
| 75 to 84 Years | 217 | 9.4% |
| 85 Years and Over | 87 | 3.8% |
| Total | 2,298 | 100.0% |
Housing Finances in Powell County
Median Income by Occupancy in Powell County
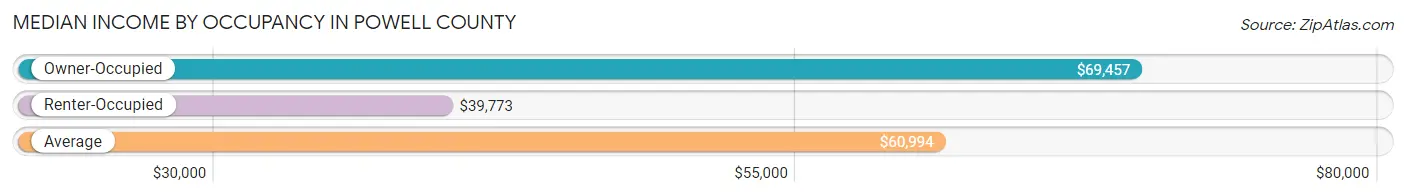
| Occupancy Type | # Households | Median Income |
| Owner-Occupied | 1,606 (69.9%) | $69,457 |
| Renter-Occupied | 692 (30.1%) | $39,773 |
| Average | 2,298 (100.0%) | $60,994 |
Occupancy by Householder Income Bracket in Powell County
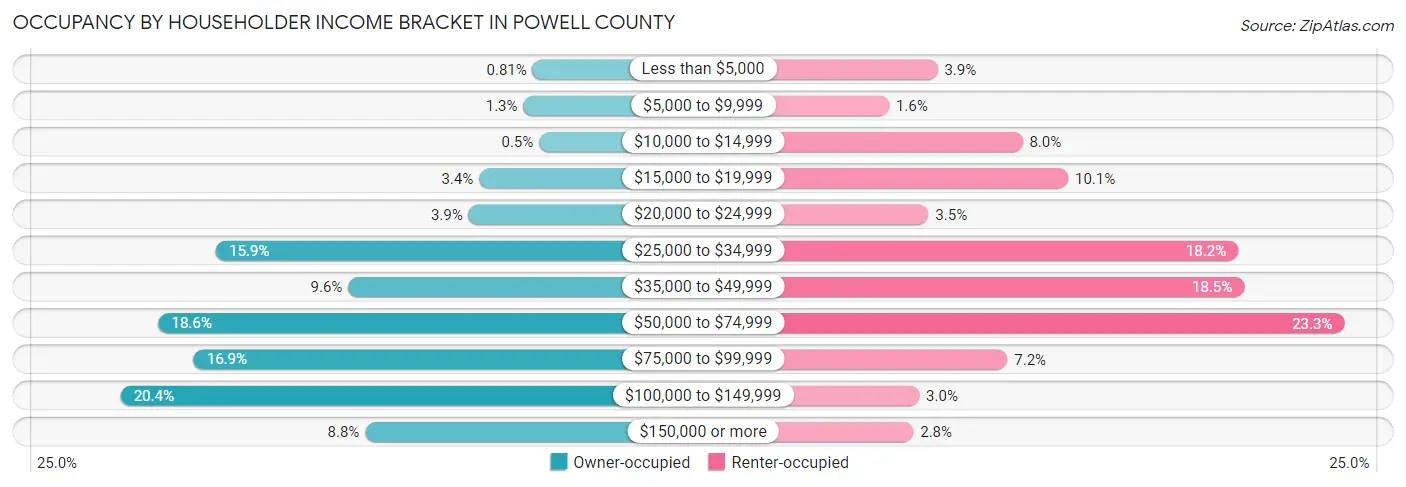
| Income Bracket | Owner-occupied | Renter-occupied |
| Less than $5,000 | 13 (0.8%) | 27 (3.9%) |
| $5,000 to $9,999 | 20 (1.3%) | 11 (1.6%) |
| $10,000 to $14,999 | 8 (0.5%) | 55 (8.0%) |
| $15,000 to $19,999 | 54 (3.4%) | 70 (10.1%) |
| $20,000 to $24,999 | 62 (3.9%) | 24 (3.5%) |
| $25,000 to $34,999 | 255 (15.9%) | 126 (18.2%) |
| $35,000 to $49,999 | 154 (9.6%) | 128 (18.5%) |
| $50,000 to $74,999 | 299 (18.6%) | 161 (23.3%) |
| $75,000 to $99,999 | 272 (16.9%) | 50 (7.2%) |
| $100,000 to $149,999 | 328 (20.4%) | 21 (3.0%) |
| $150,000 or more | 141 (8.8%) | 19 (2.8%) |
| Total | 1,606 (100.0%) | 692 (100.0%) |
Monthly Housing Cost Tiers in Powell County
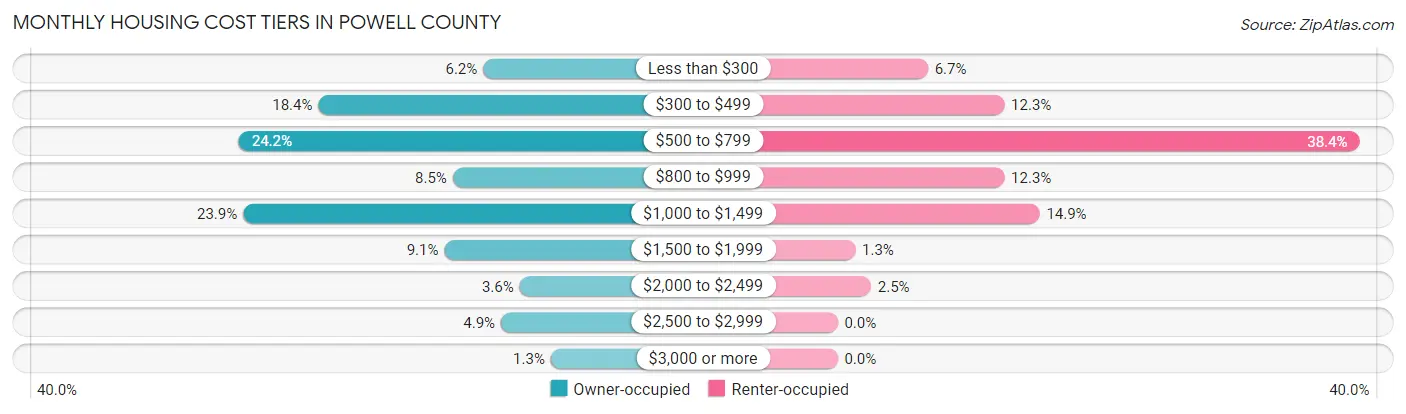
| Monthly Cost | Owner-occupied | Renter-occupied |
| Less than $300 | 100 (6.2%) | 46 (6.7%) |
| $300 to $499 | 295 (18.4%) | 85 (12.3%) |
| $500 to $799 | 389 (24.2%) | 266 (38.4%) |
| $800 to $999 | 136 (8.5%) | 85 (12.3%) |
| $1,000 to $1,499 | 384 (23.9%) | 103 (14.9%) |
| $1,500 to $1,999 | 146 (9.1%) | 9 (1.3%) |
| $2,000 to $2,499 | 57 (3.5%) | 17 (2.5%) |
| $2,500 to $2,999 | 79 (4.9%) | 0 (0.0%) |
| $3,000 or more | 20 (1.3%) | 0 (0.0%) |
| Total | 1,606 (100.0%) | 692 (100.0%) |
Physical Housing Characteristics in Powell County
Housing Structures in Powell County
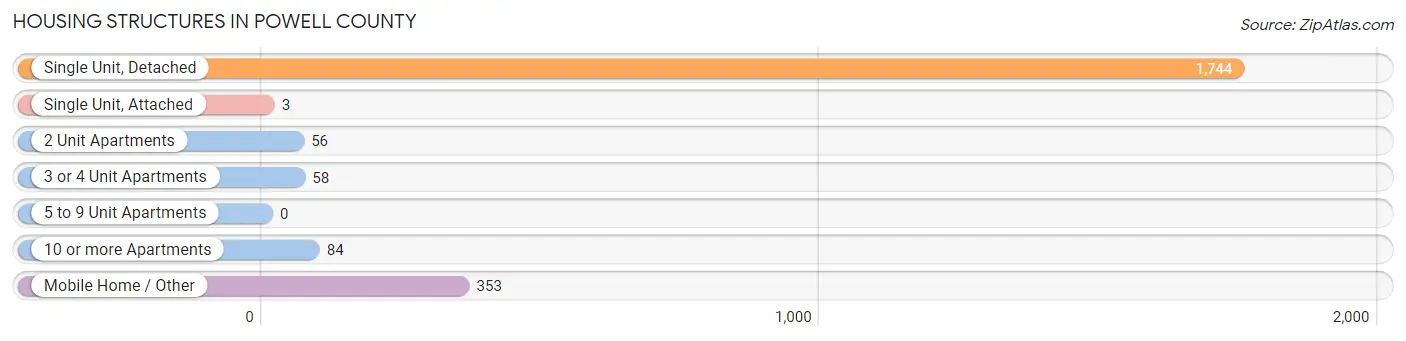
| Structure Type | # Housing Units | % Housing Units |
| Single Unit, Detached | 1,744 | 75.9% |
| Single Unit, Attached | 3 | 0.1% |
| 2 Unit Apartments | 56 | 2.4% |
| 3 or 4 Unit Apartments | 58 | 2.5% |
| 5 to 9 Unit Apartments | 0 | 0.0% |
| 10 or more Apartments | 84 | 3.7% |
| Mobile Home / Other | 353 | 15.4% |
| Total | 2,298 | 100.0% |
Housing Structures by Occupancy in Powell County
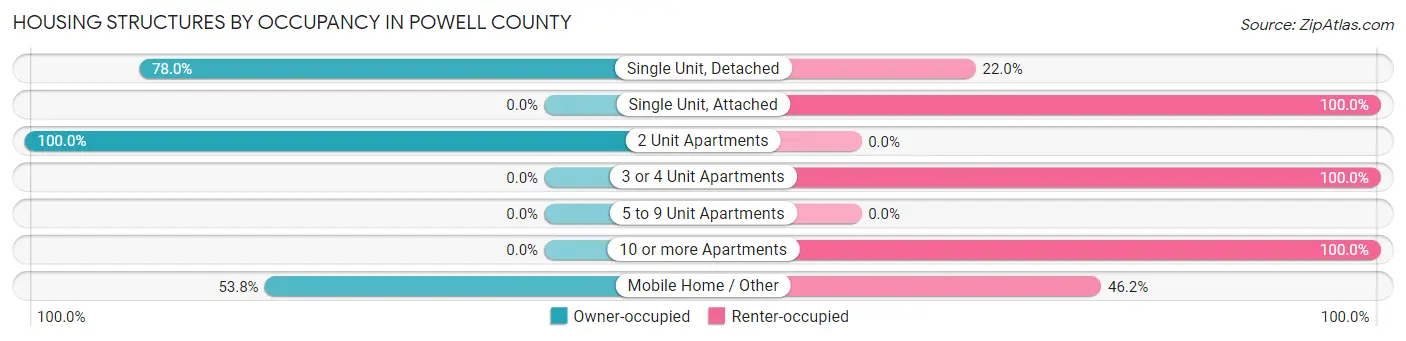
| Structure Type | Owner-occupied | Renter-occupied |
| Single Unit, Detached | 1,360 (78.0%) | 384 (22.0%) |
| Single Unit, Attached | 0 (0.0%) | 3 (100.0%) |
| 2 Unit Apartments | 56 (100.0%) | 0 (0.0%) |
| 3 or 4 Unit Apartments | 0 (0.0%) | 58 (100.0%) |
| 5 to 9 Unit Apartments | 0 (0.0%) | 0 (0.0%) |
| 10 or more Apartments | 0 (0.0%) | 84 (100.0%) |
| Mobile Home / Other | 190 (53.8%) | 163 (46.2%) |
| Total | 1,606 (69.9%) | 692 (30.1%) |
Housing Structures by Number of Rooms in Powell County
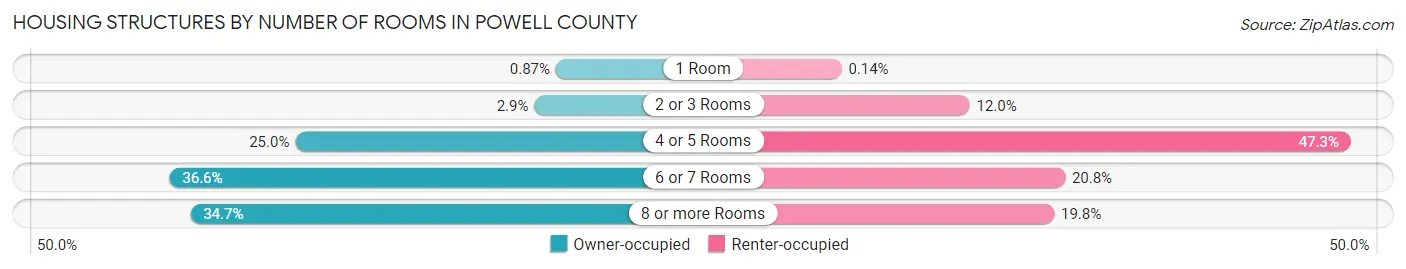
| Number of Rooms | Owner-occupied | Renter-occupied |
| 1 Room | 14 (0.9%) | 1 (0.1%) |
| 2 or 3 Rooms | 46 (2.9%) | 83 (12.0%) |
| 4 or 5 Rooms | 401 (25.0%) | 327 (47.2%) |
| 6 or 7 Rooms | 588 (36.6%) | 144 (20.8%) |
| 8 or more Rooms | 557 (34.7%) | 137 (19.8%) |
| Total | 1,606 (100.0%) | 692 (100.0%) |
Housing Structure by Heating Type in Powell County
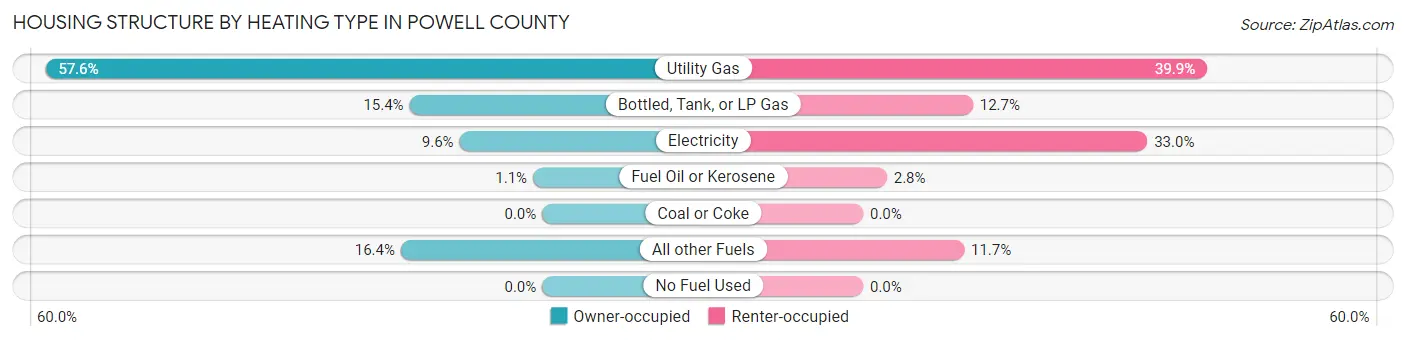
| Heating Type | Owner-occupied | Renter-occupied |
| Utility Gas | 925 (57.6%) | 276 (39.9%) |
| Bottled, Tank, or LP Gas | 247 (15.4%) | 88 (12.7%) |
| Electricity | 154 (9.6%) | 228 (33.0%) |
| Fuel Oil or Kerosene | 17 (1.1%) | 19 (2.8%) |
| Coal or Coke | 0 (0.0%) | 0 (0.0%) |
| All other Fuels | 263 (16.4%) | 81 (11.7%) |
| No Fuel Used | 0 (0.0%) | 0 (0.0%) |
| Total | 1,606 (100.0%) | 692 (100.0%) |
Household Vehicle Usage in Powell County
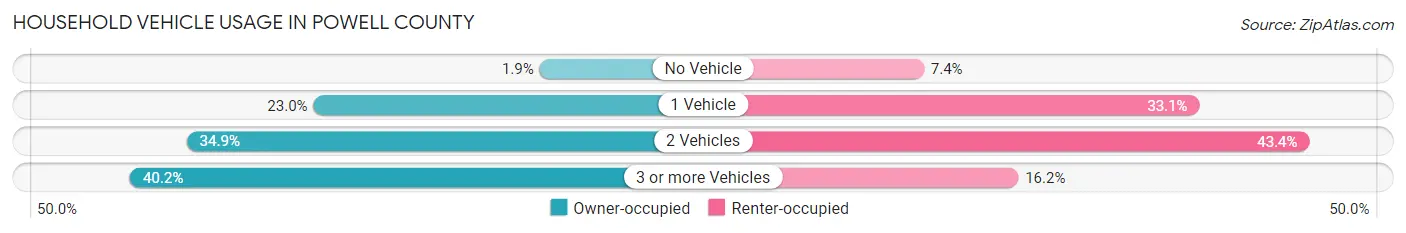
| Vehicles per Household | Owner-occupied | Renter-occupied |
| No Vehicle | 31 (1.9%) | 51 (7.4%) |
| 1 Vehicle | 370 (23.0%) | 229 (33.1%) |
| 2 Vehicles | 560 (34.9%) | 300 (43.3%) |
| 3 or more Vehicles | 645 (40.2%) | 112 (16.2%) |
| Total | 1,606 (100.0%) | 692 (100.0%) |
Real Estate & Mortgages in Powell County
Real Estate and Mortgage Overview in Powell County
| Characteristic | Without Mortgage | With Mortgage |
| Housing Units | 848 | 758 |
| Median Property Value | $187,500 | $240,100 |
| Median Household Income | $47,292 | $63 |
| Monthly Housing Costs | $519 | $20 |
| Real Estate Taxes | $1,692 | $8 |
Property Value by Mortgage Status in Powell County
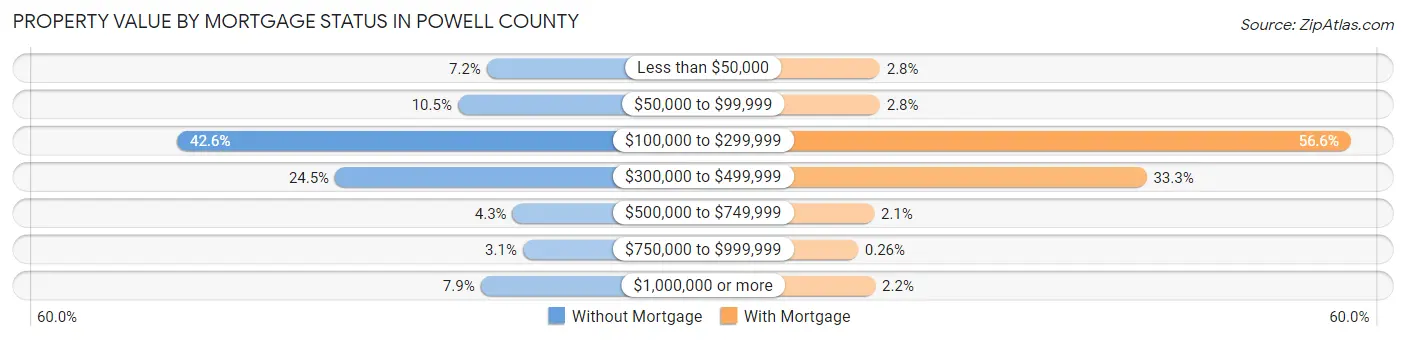
| Property Value | Without Mortgage | With Mortgage |
| Less than $50,000 | 61 (7.2%) | 21 (2.8%) |
| $50,000 to $99,999 | 89 (10.5%) | 21 (2.8%) |
| $100,000 to $299,999 | 361 (42.6%) | 429 (56.6%) |
| $300,000 to $499,999 | 208 (24.5%) | 252 (33.3%) |
| $500,000 to $749,999 | 36 (4.3%) | 16 (2.1%) |
| $750,000 to $999,999 | 26 (3.1%) | 2 (0.3%) |
| $1,000,000 or more | 67 (7.9%) | 17 (2.2%) |
| Total | 848 (100.0%) | 758 (100.0%) |
Household Income by Mortgage Status in Powell County
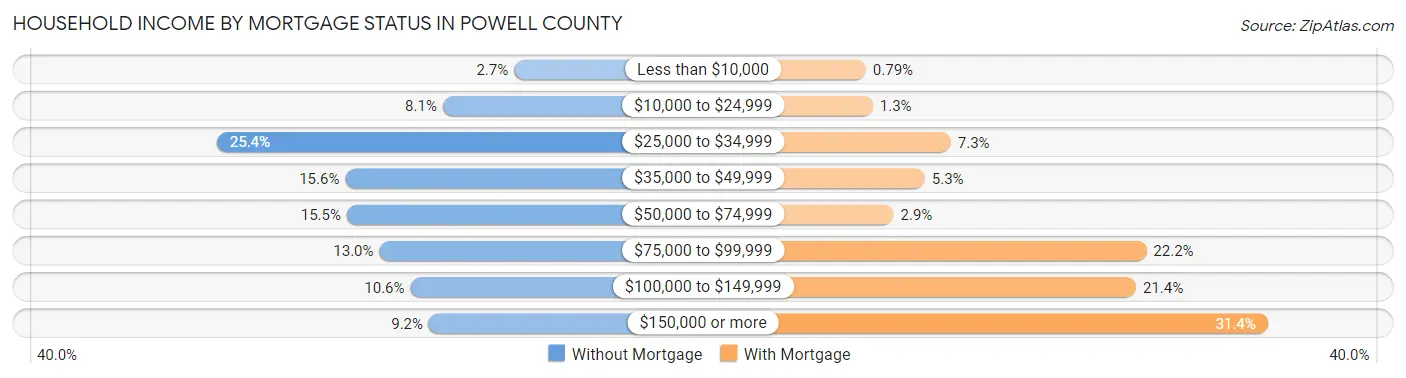
| Household Income | Without Mortgage | With Mortgage |
| Less than $10,000 | 23 (2.7%) | 6 (0.8%) |
| $10,000 to $24,999 | 69 (8.1%) | 10 (1.3%) |
| $25,000 to $34,999 | 215 (25.4%) | 55 (7.3%) |
| $35,000 to $49,999 | 132 (15.6%) | 40 (5.3%) |
| $50,000 to $74,999 | 131 (15.4%) | 22 (2.9%) |
| $75,000 to $99,999 | 110 (13.0%) | 168 (22.2%) |
| $100,000 to $149,999 | 90 (10.6%) | 162 (21.4%) |
| $150,000 or more | 78 (9.2%) | 238 (31.4%) |
| Total | 848 (100.0%) | 758 (100.0%) |
Property Value to Household Income Ratio in Powell County
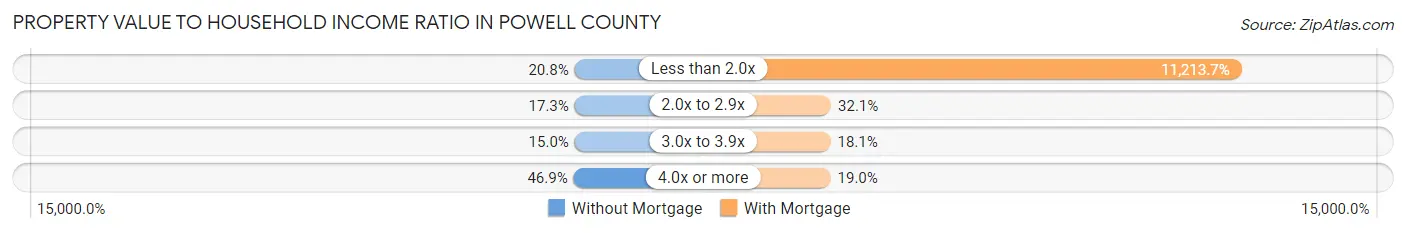
| Value-to-Income Ratio | Without Mortgage | With Mortgage |
| Less than 2.0x | 176 (20.7%) | 85,000 (11,213.7%) |
| 2.0x to 2.9x | 147 (17.3%) | 243 (32.1%) |
| 3.0x to 3.9x | 127 (15.0%) | 137 (18.1%) |
| 4.0x or more | 398 (46.9%) | 144 (19.0%) |
| Total | 848 (100.0%) | 758 (100.0%) |
Real Estate Taxes by Mortgage Status in Powell County
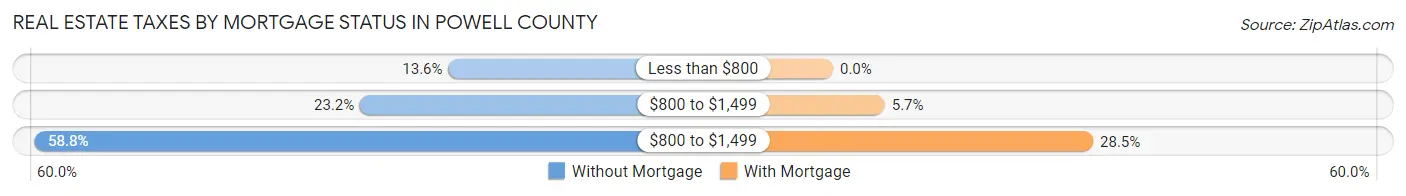
| Property Taxes | Without Mortgage | With Mortgage |
| Less than $800 | 115 (13.6%) | 0 (0.0%) |
| $800 to $1,499 | 197 (23.2%) | 43 (5.7%) |
| $800 to $1,499 | 499 (58.8%) | 216 (28.5%) |
| Total | 848 (100.0%) | 758 (100.0%) |
Health & Disability in Powell County
Health Insurance Coverage by Age in Powell County
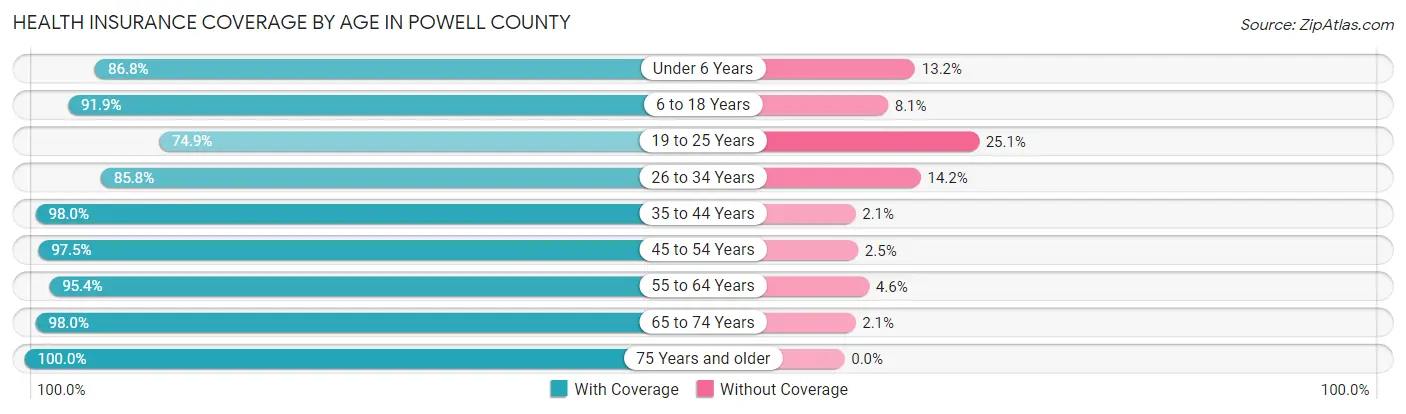
| Age Bracket | With Coverage | Without Coverage |
| Under 6 Years | 264 (86.8%) | 40 (13.2%) |
| 6 to 18 Years | 691 (91.9%) | 61 (8.1%) |
| 19 to 25 Years | 311 (74.9%) | 104 (25.1%) |
| 26 to 34 Years | 368 (85.8%) | 61 (14.2%) |
| 35 to 44 Years | 525 (98.0%) | 11 (2.1%) |
| 45 to 54 Years | 692 (97.5%) | 18 (2.5%) |
| 55 to 64 Years | 831 (95.4%) | 40 (4.6%) |
| 65 to 74 Years | 765 (98.0%) | 16 (2.1%) |
| 75 Years and older | 526 (100.0%) | 0 (0.0%) |
| Total | 4,973 (93.4%) | 351 (6.6%) |
Health Insurance Coverage by Citizenship Status in Powell County

| Citizenship Status | With Coverage | Without Coverage |
| Native Born | 264 (86.8%) | 40 (13.2%) |
| Foreign Born, Citizen | 691 (91.9%) | 61 (8.1%) |
| Foreign Born, not a Citizen | 311 (74.9%) | 104 (25.1%) |
Health Insurance Coverage by Household Income in Powell County
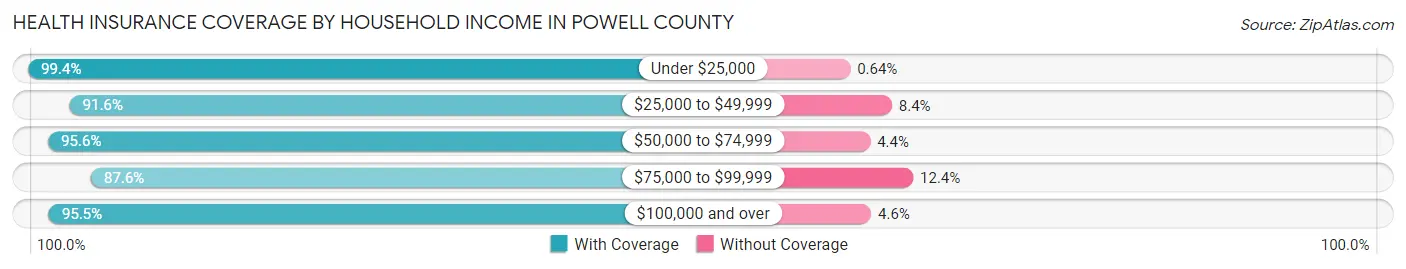
| Household Income | With Coverage | Without Coverage |
| Under $25,000 | 464 (99.4%) | 3 (0.6%) |
| $25,000 to $49,999 | 1,117 (91.6%) | 103 (8.4%) |
| $50,000 to $74,999 | 1,068 (95.6%) | 49 (4.4%) |
| $75,000 to $99,999 | 902 (87.6%) | 128 (12.4%) |
| $100,000 and over | 1,407 (95.5%) | 67 (4.5%) |
Public vs Private Health Insurance Coverage by Age in Powell County
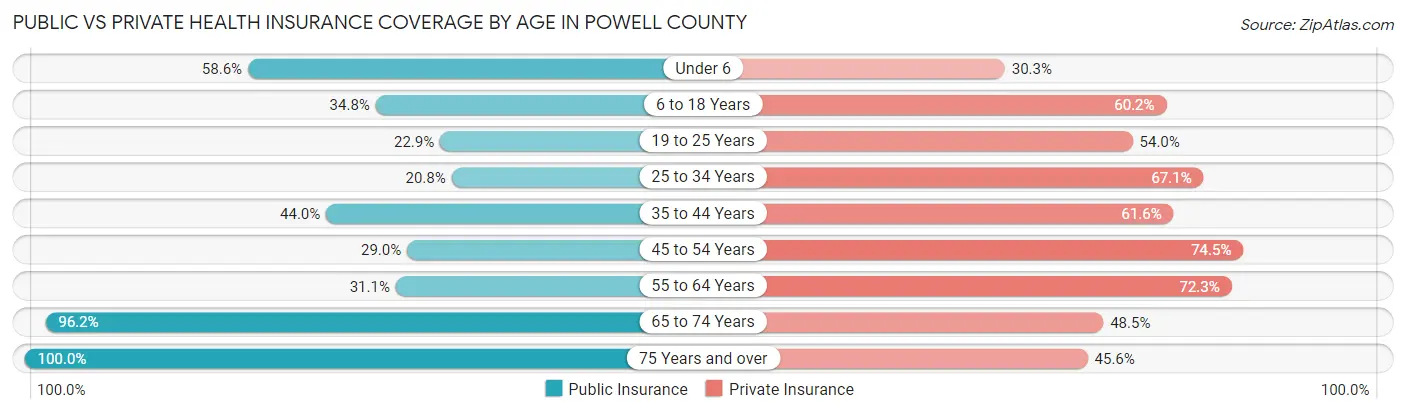
| Age Bracket | Public Insurance | Private Insurance |
| Under 6 | 178 (58.6%) | 92 (30.3%) |
| 6 to 18 Years | 262 (34.8%) | 453 (60.2%) |
| 19 to 25 Years | 95 (22.9%) | 224 (54.0%) |
| 25 to 34 Years | 89 (20.7%) | 288 (67.1%) |
| 35 to 44 Years | 236 (44.0%) | 330 (61.6%) |
| 45 to 54 Years | 206 (29.0%) | 529 (74.5%) |
| 55 to 64 Years | 271 (31.1%) | 630 (72.3%) |
| 65 to 74 Years | 751 (96.2%) | 379 (48.5%) |
| 75 Years and over | 526 (100.0%) | 240 (45.6%) |
| Total | 2,614 (49.1%) | 3,165 (59.5%) |
Disability Status by Sex by Age in Powell County
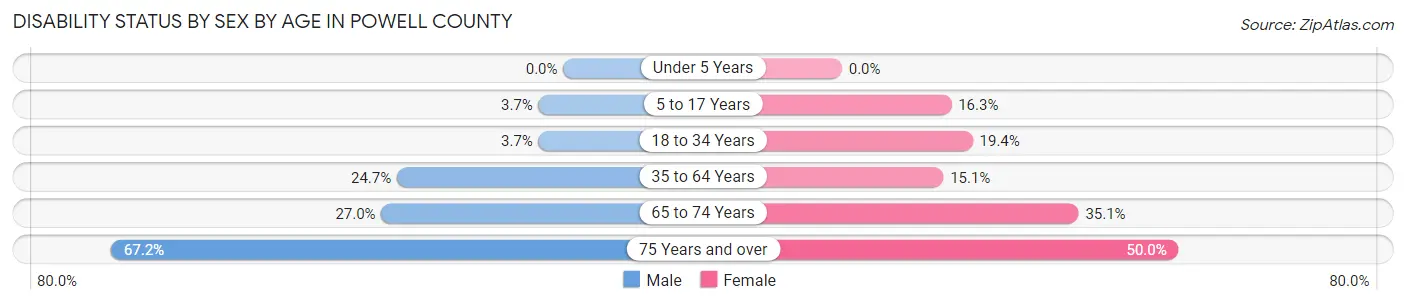
| Age Bracket | Male | Female |
| Under 5 Years | 0 (0.0%) | 0 (0.0%) |
| 5 to 17 Years | 12 (3.7%) | 65 (16.3%) |
| 18 to 34 Years | 21 (3.7%) | 67 (19.4%) |
| 35 to 64 Years | 285 (24.7%) | 145 (15.1%) |
| 65 to 74 Years | 111 (27.0%) | 130 (35.1%) |
| 75 Years and over | 176 (67.2%) | 132 (50.0%) |
Disability Class by Sex by Age in Powell County
Disability Class: Hearing Difficulty
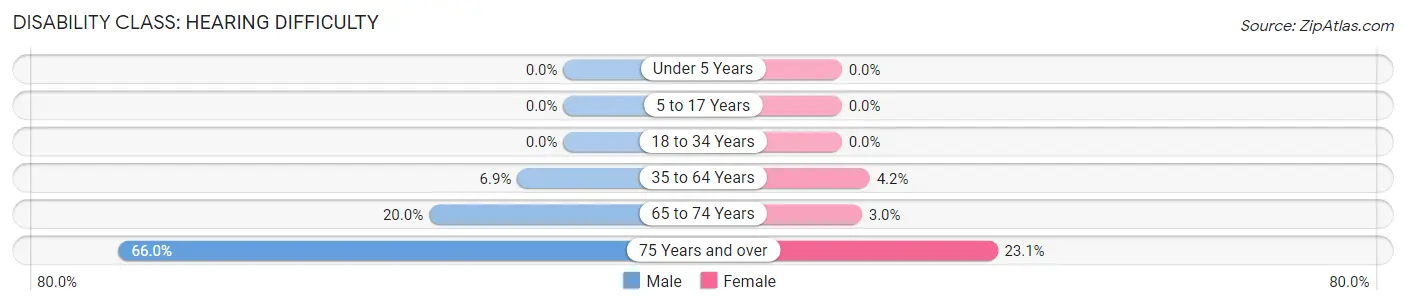
| Age Bracket | Male | Female |
| Under 5 Years | 0 (0.0%) | 0 (0.0%) |
| 5 to 17 Years | 0 (0.0%) | 0 (0.0%) |
| 18 to 34 Years | 0 (0.0%) | 0 (0.0%) |
| 35 to 64 Years | 79 (6.9%) | 40 (4.2%) |
| 65 to 74 Years | 82 (20.0%) | 11 (3.0%) |
| 75 Years and over | 173 (66.0%) | 61 (23.1%) |
Disability Class: Vision Difficulty
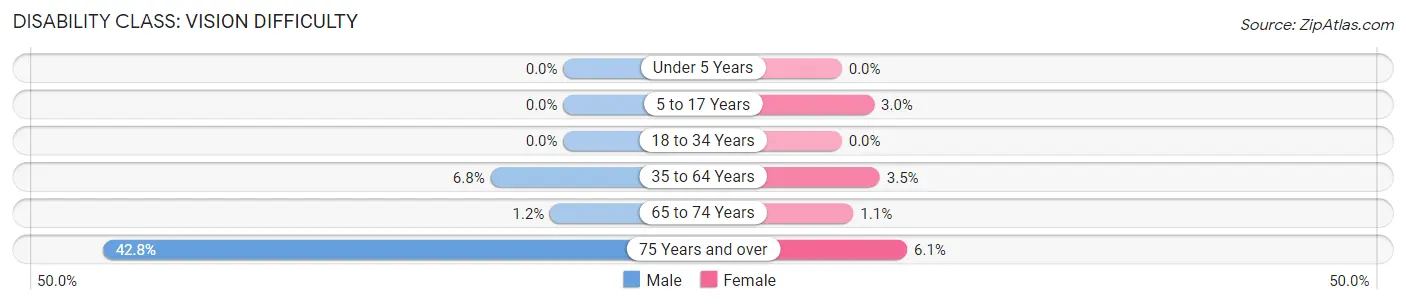
| Age Bracket | Male | Female |
| Under 5 Years | 0 (0.0%) | 0 (0.0%) |
| 5 to 17 Years | 0 (0.0%) | 12 (3.0%) |
| 18 to 34 Years | 0 (0.0%) | 0 (0.0%) |
| 35 to 64 Years | 78 (6.8%) | 34 (3.5%) |
| 65 to 74 Years | 5 (1.2%) | 4 (1.1%) |
| 75 Years and over | 112 (42.7%) | 16 (6.1%) |
Disability Class: Cognitive Difficulty
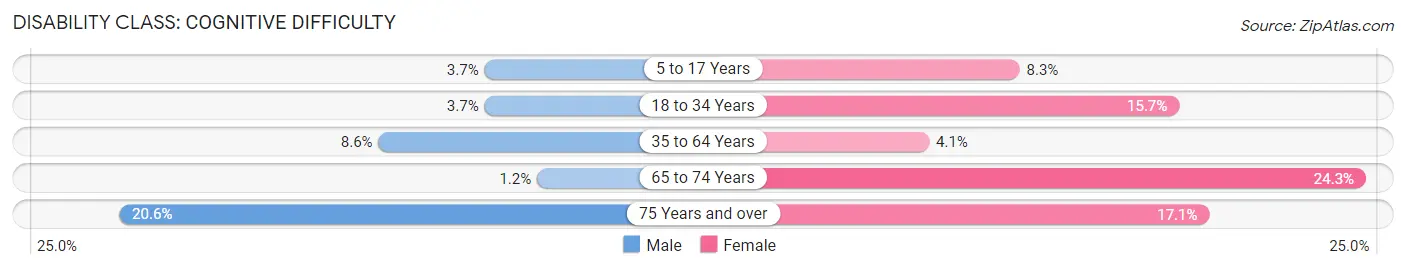
| Age Bracket | Male | Female |
| 5 to 17 Years | 12 (3.7%) | 33 (8.3%) |
| 18 to 34 Years | 21 (3.7%) | 54 (15.7%) |
| 35 to 64 Years | 99 (8.6%) | 39 (4.1%) |
| 65 to 74 Years | 5 (1.2%) | 90 (24.3%) |
| 75 Years and over | 54 (20.6%) | 45 (17.1%) |
Disability Class: Ambulatory Difficulty
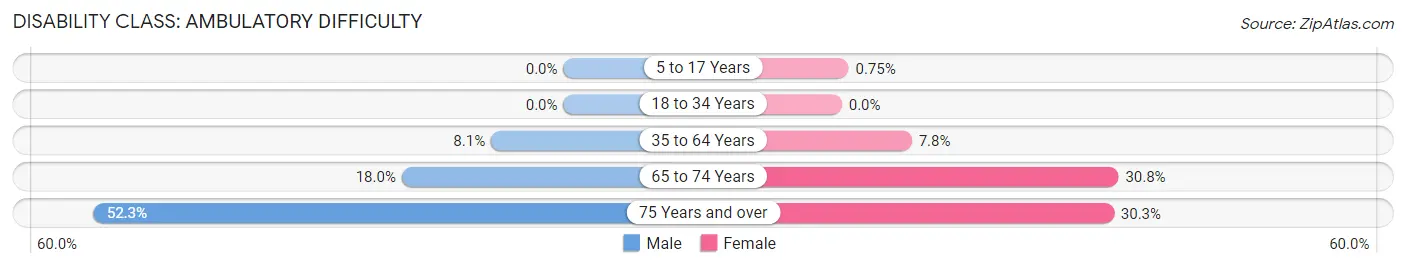
| Age Bracket | Male | Female |
| 5 to 17 Years | 0 (0.0%) | 3 (0.7%) |
| 18 to 34 Years | 0 (0.0%) | 0 (0.0%) |
| 35 to 64 Years | 93 (8.1%) | 75 (7.8%) |
| 65 to 74 Years | 74 (18.0%) | 114 (30.8%) |
| 75 Years and over | 137 (52.3%) | 80 (30.3%) |
Disability Class: Self-Care Difficulty
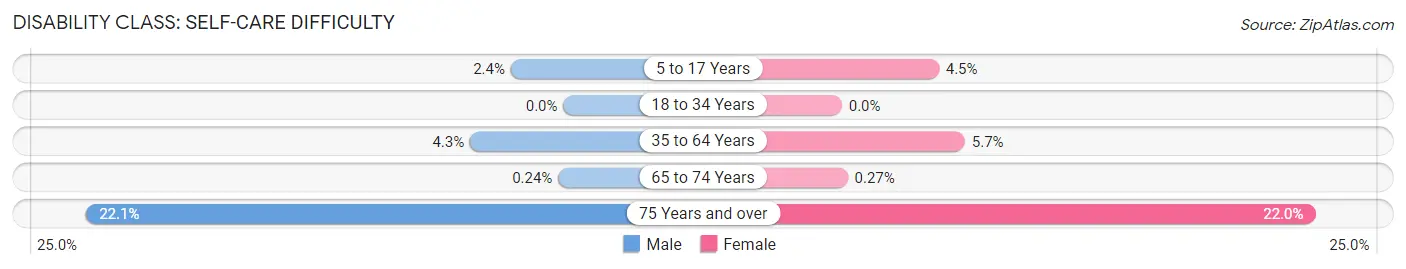
| Age Bracket | Male | Female |
| 5 to 17 Years | 8 (2.4%) | 18 (4.5%) |
| 18 to 34 Years | 0 (0.0%) | 0 (0.0%) |
| 35 to 64 Years | 50 (4.3%) | 55 (5.7%) |
| 65 to 74 Years | 1 (0.2%) | 1 (0.3%) |
| 75 Years and over | 58 (22.1%) | 58 (22.0%) |
Technology Access in Powell County
Computing Device Access in Powell County
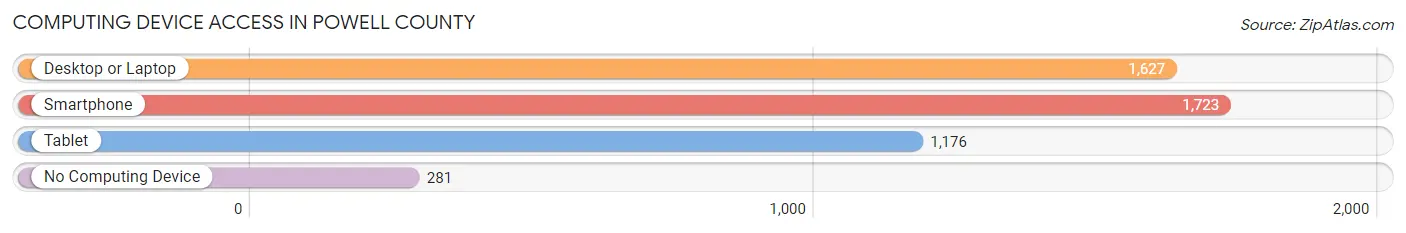
| Device Type | # Households | % Households |
| Desktop or Laptop | 1,627 | 70.8% |
| Smartphone | 1,723 | 75.0% |
| Tablet | 1,176 | 51.2% |
| No Computing Device | 281 | 12.2% |
| Total | 2,298 | 100.0% |
Internet Access in Powell County
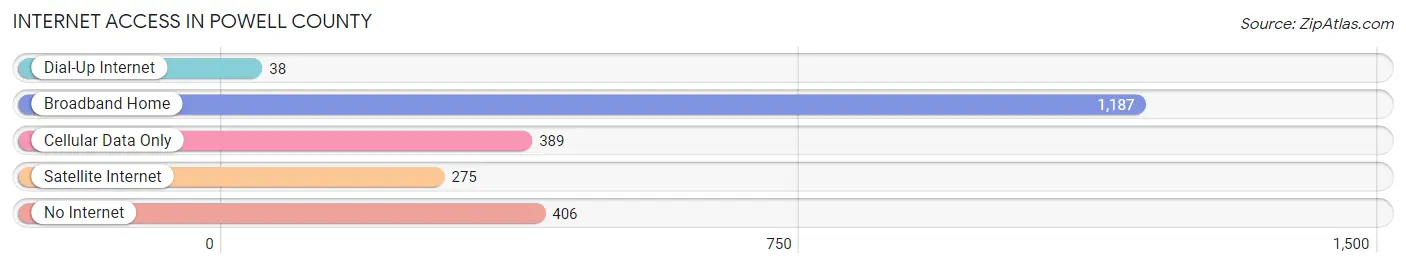
| Internet Type | # Households | % Households |
| Dial-Up Internet | 38 | 1.7% |
| Broadband Home | 1,187 | 51.6% |
| Cellular Data Only | 389 | 16.9% |
| Satellite Internet | 275 | 12.0% |
| No Internet | 406 | 17.7% |
| Total | 2,298 | 100.0% |
Powell County Summary
Powell County is located in the southwestern part of Montana, and is bordered by Beaverhead County to the north, Madison County to the east, and Deer Lodge County to the south. The county seat is Deer Lodge, and the county has a total area of 1,845 square miles. The population of Powell County was estimated to be 8,945 in 2019.
History
Powell County was established in 1901, and was named after John Wesley Powell, an explorer and geologist who explored the area in 1869. The county was originally part of Deer Lodge County, and was created to provide better government services to the area.
The first settlers in the area were miners, who came to the area in search of gold and other minerals. The first permanent settlement in the county was established in 1864, and the town of Deer Lodge was established in 1866.
Geography
Powell County is located in the Rocky Mountains, and is home to several mountain ranges, including the Big Belt Mountains, the Anaconda Range, and the Tobacco Root Mountains. The county is also home to several rivers, including the Big Hole River, the Beaverhead River, and the Ruby River.
The county has a semi-arid climate, with hot summers and cold winters. The average annual temperature is 44 degrees Fahrenheit, and the average annual precipitation is 13.5 inches.
Economy
The economy of Powell County is largely based on agriculture and tourism. The county is home to several large ranches, and the agricultural industry is the largest employer in the county. The county is also home to several tourist attractions, including the Montana State Prison Museum, the Montana Auto Museum, and the Montana Cowboy Hall of Fame.
The county also has a growing manufacturing sector, with several companies located in the county, including a paper mill, a wood products plant, and a metal fabrication plant.
Demographics
As of the 2010 census, the population of Powell County was 8,845, with a population density of 4.8 people per square mile. The median age in the county was 44.7 years, and the median household income was $41,945.
The racial makeup of the county was 95.3% White, 0.7% Native American, 0.3% Asian, 0.2% Black or African American, 0.1% Pacific Islander, and 2.4% from other races. The largest ancestry groups in the county were German (25.3%), Irish (17.2%), English (14.2%), and Norwegian (10.2%).
The largest religious group in the county was Catholic (25.3%), followed by Protestant (24.2%), and Other (17.2%). The largest language spoken in the county was English (97.2%), followed by Spanish (1.2%), and German (0.7%).
Conclusion
Powell County is a rural county located in the southwestern part of Montana. The county has a semi-arid climate, and the economy is largely based on agriculture and tourism. The population of the county is 8,945, and the largest ancestry groups are German, Irish, English, and Norwegian. The largest religious group in the county is Catholic, and the largest language spoken is English.
Common Questions
What is Per Capita Income in Powell County?
Per Capita income in Powell County is $29,675.
What is the Median Family Income in Powell County?
Median Family Income in Powell County is $66,725.
What is the Median Household income in Powell County?
Median Household Income in Powell County is $60,994.
What is Income or Wage Gap in Powell County?
Income or Wage Gap in Powell County is 14.9%.
Women in Powell County earn 85.1 cents for every dollar earned by a man.
What is Inequality or Gini Index in Powell County?
Inequality or Gini Index in Powell County is 0.46.
What is the Total Population of Powell County?
Total Population of Powell County is 6,998.
What is the Total Male Population of Powell County?
Total Male Population of Powell County is 4,455.
What is the Total Female Population of Powell County?
Total Female Population of Powell County is 2,543.
What is the Ratio of Males per 100 Females in Powell County?
There are 175.19 Males per 100 Females in Powell County.
What is the Ratio of Females per 100 Males in Powell County?
There are 57.08 Females per 100 Males in Powell County.
What is the Median Population Age in Powell County?
Median Population Age in Powell County is 45.5 Years.
What is the Average Family Size in Powell County
Average Family Size in Powell County is 2.8 People.
What is the Average Household Size in Powell County
Average Household Size in Powell County is 2.3 People.
How Large is the Labor Force in Powell County?
There are 2,662 People in the Labor Forcein in Powell County.
What is the Percentage of People in the Labor Force in Powell County?
43.8% of People are in the Labor Force in Powell County.
What is the Unemployment Rate in Powell County?
Unemployment Rate in Powell County is 4.8%.