Fergus County, MT Map & Demographics
Fergus County Map
Fergus County Overview
$34,932
PER CAPITA INCOME
$83,279
AVG FAMILY INCOME
$58,321
AVG HOUSEHOLD INCOME
28.0%
WAGE / INCOME GAP [ % ]
72.0¢/ $1
WAGE / INCOME GAP [ $ ]
0.44
INEQUALITY / GINI INDEX
11,496
TOTAL POPULATION
5,991
MALE POPULATION
5,505
FEMALE POPULATION
108.83
MALES / 100 FEMALES
91.89
FEMALES / 100 MALES
46.7
MEDIAN AGE
2.8
AVG FAMILY SIZE
2.1
AVG HOUSEHOLD SIZE
5,770
LABOR FORCE [ PEOPLE ]
60.7%
PERCENT IN LABOR FORCE
3.1%
UNEMPLOYMENT RATE
Fergus County Area Codes
Income in Fergus County
Income Overview in Fergus County
Per Capita Income in Fergus County is $34,932, while median incomes of families and households are $83,279 and $58,321 respectively.
| Characteristic | Number | Measure |
| Per Capita Income | 11,496 | $34,932 |
| Median Family Income | 3,067 | $83,279 |
| Mean Family Income | 3,067 | $95,348 |
| Median Household Income | 5,186 | $58,321 |
| Mean Household Income | 5,186 | $76,228 |
| Income Deficit | 3,067 | $0 |
| Wage / Income Gap (%) | 11,496 | 28.01% |
| Wage / Income Gap ($) | 11,496 | 71.99¢ per $1 |
| Gini / Inequality Index | 11,496 | 0.44 |
Earnings by Sex in Fergus County
Average Earnings in Fergus County are $35,240, $40,093 for men and $28,864 for women, a difference of 28.0%.
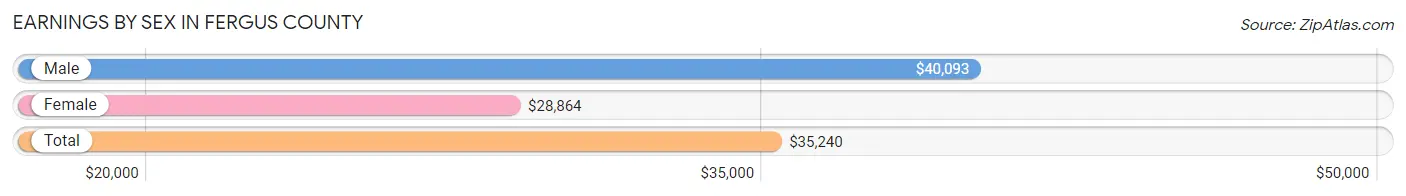
| Sex | Number | Average Earnings |
| Male | 3,608 (55.9%) | $40,093 |
| Female | 2,842 (44.1%) | $28,864 |
| Total | 6,450 (100.0%) | $35,240 |
Earnings by Sex by Income Bracket in Fergus County
The most common earnings brackets in Fergus County are $75,000 to $99,999 for men (550 | 15.2%) and $30,000 to $34,999 for women (327 | 11.5%).
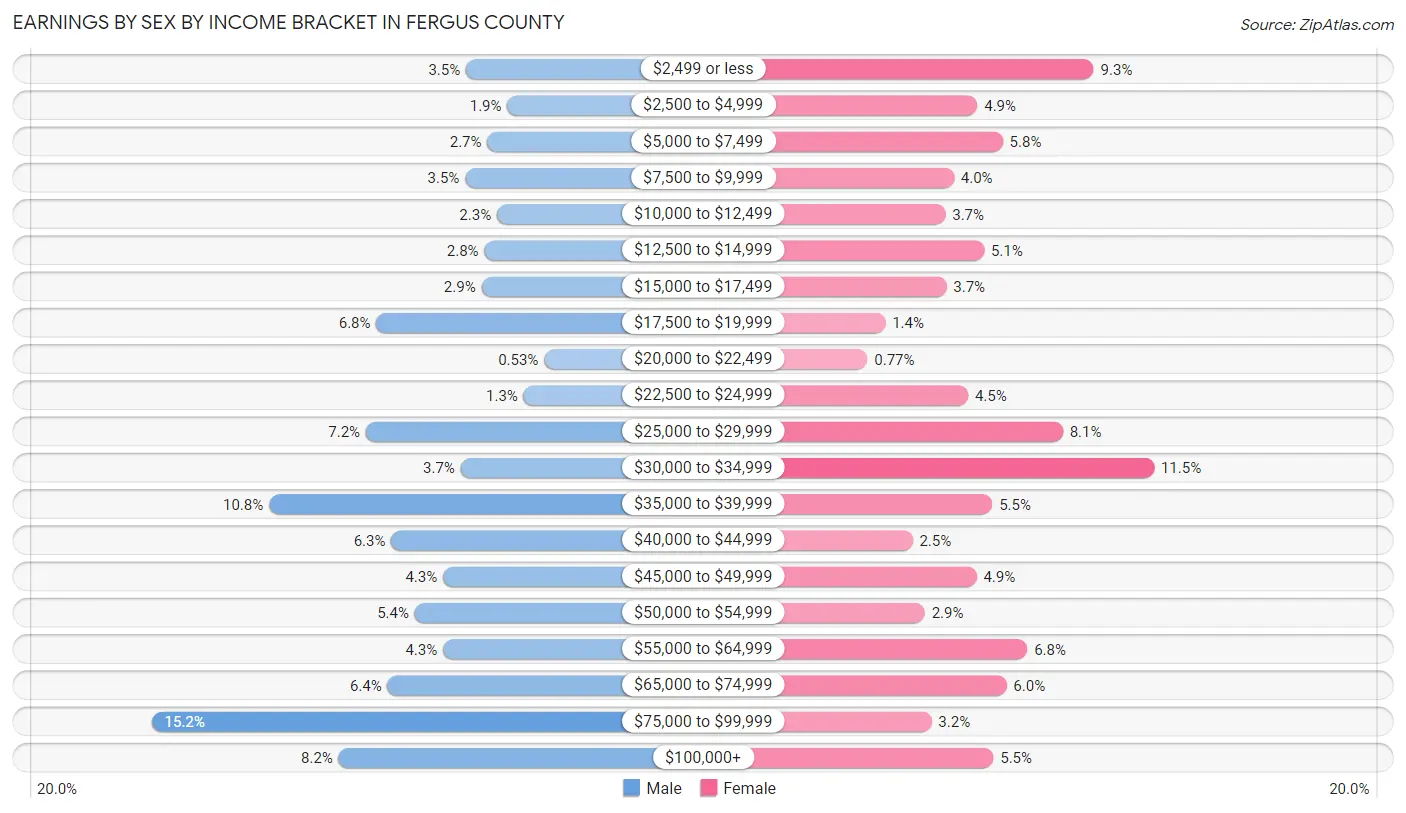
| Income | Male | Female |
| $2,499 or less | 125 (3.5%) | 263 (9.2%) |
| $2,500 to $4,999 | 69 (1.9%) | 139 (4.9%) |
| $5,000 to $7,499 | 96 (2.7%) | 166 (5.8%) |
| $7,500 to $9,999 | 126 (3.5%) | 114 (4.0%) |
| $10,000 to $12,499 | 83 (2.3%) | 105 (3.7%) |
| $12,500 to $14,999 | 100 (2.8%) | 146 (5.1%) |
| $15,000 to $17,499 | 104 (2.9%) | 106 (3.7%) |
| $17,500 to $19,999 | 246 (6.8%) | 41 (1.4%) |
| $20,000 to $22,499 | 19 (0.5%) | 22 (0.8%) |
| $22,500 to $24,999 | 47 (1.3%) | 129 (4.5%) |
| $25,000 to $29,999 | 260 (7.2%) | 230 (8.1%) |
| $30,000 to $34,999 | 132 (3.7%) | 327 (11.5%) |
| $35,000 to $39,999 | 391 (10.8%) | 155 (5.4%) |
| $40,000 to $44,999 | 226 (6.3%) | 70 (2.5%) |
| $45,000 to $49,999 | 156 (4.3%) | 138 (4.9%) |
| $50,000 to $54,999 | 194 (5.4%) | 83 (2.9%) |
| $55,000 to $64,999 | 156 (4.3%) | 192 (6.8%) |
| $65,000 to $74,999 | 231 (6.4%) | 170 (6.0%) |
| $75,000 to $99,999 | 550 (15.2%) | 90 (3.2%) |
| $100,000+ | 297 (8.2%) | 156 (5.5%) |
| Total | 3,608 (100.0%) | 2,842 (100.0%) |
Earnings by Sex by Educational Attainment in Fergus County
Average earnings in Fergus County are $44,082 for men and $30,309 for women, a difference of 31.2%. Men with an educational attainment of graduate degree enjoy the highest average annual earnings of $90,202, while those with high school diploma education earn the least with $37,523. Women with an educational attainment of bachelor's degree earn the most with the average annual earnings of $46,667, while those with high school diploma education have the smallest earnings of $23,654.
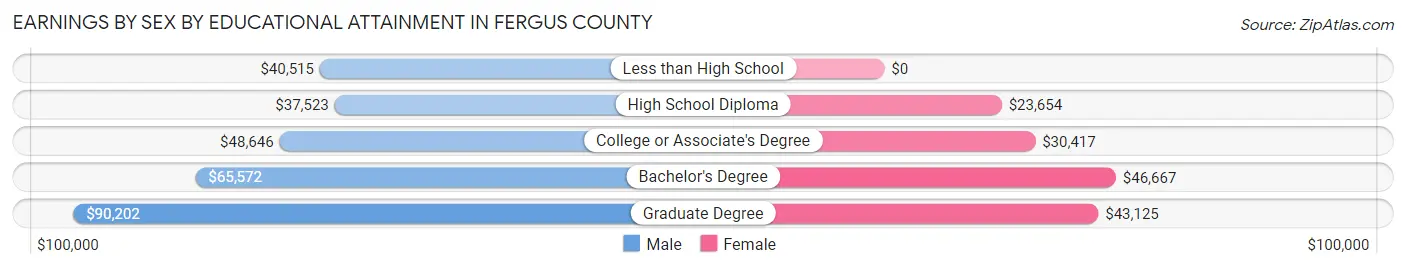
| Educational Attainment | Male Income | Female Income |
| Less than High School | $40,515 | $0 |
| High School Diploma | $37,523 | $23,654 |
| College or Associate's Degree | $48,646 | $30,417 |
| Bachelor's Degree | $65,572 | $46,667 |
| Graduate Degree | $90,202 | $43,125 |
| Total | $44,082 | $30,309 |
Family Income in Fergus County
Family Income Brackets in Fergus County
According to the Fergus County family income data, there are 883 families falling into the $75,000 to $99,999 income range, which is the most common income bracket and makes up 28.8% of all families. Conversely, the $10,000 to $14,999 income bracket is the least frequent group with only 64 families (2.1%) belonging to this category.
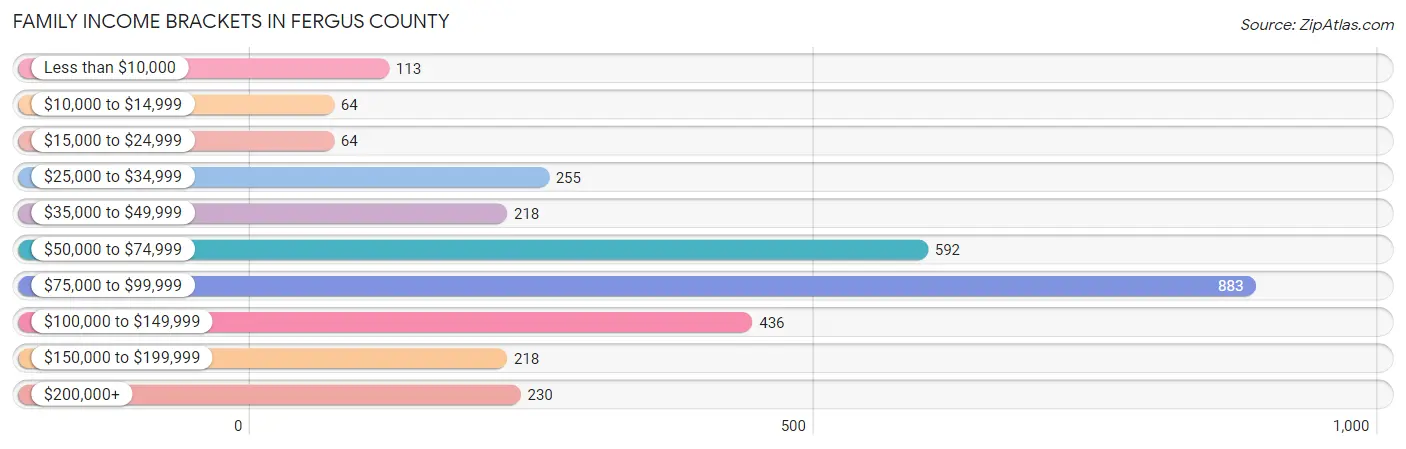
| Income Bracket | # Families | % Families |
| Less than $10,000 | 113 | 3.7% |
| $10,000 to $14,999 | 64 | 2.1% |
| $15,000 to $24,999 | 64 | 2.1% |
| $25,000 to $34,999 | 255 | 8.3% |
| $35,000 to $49,999 | 218 | 7.1% |
| $50,000 to $74,999 | 592 | 19.3% |
| $75,000 to $99,999 | 883 | 28.8% |
| $100,000 to $149,999 | 436 | 14.2% |
| $150,000 to $199,999 | 218 | 7.1% |
| $200,000+ | 230 | 7.5% |
Family Income by Famaliy Size in Fergus County
4-person families (580 | 18.9%) account for the highest median family income in Fergus County with $95,201 per family, while 2-person families (1,594 | 52.0%) have the highest median income of $35,930 per family member.
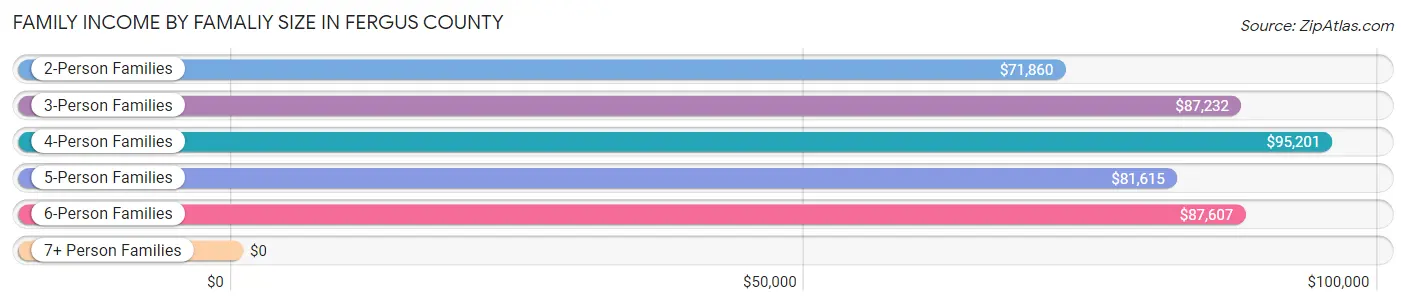
| Income Bracket | # Families | Median Income |
| 2-Person Families | 1,594 (52.0%) | $71,860 |
| 3-Person Families | 601 (19.6%) | $87,232 |
| 4-Person Families | 580 (18.9%) | $95,201 |
| 5-Person Families | 95 (3.1%) | $81,615 |
| 6-Person Families | 155 (5.1%) | $87,607 |
| 7+ Person Families | 42 (1.4%) | $0 |
| Total | 3,067 (100.0%) | $83,279 |
Family Income by Number of Earners in Fergus County
The median family income in Fergus County is $83,279, with families comprising 2 earners (1,413) having the highest median family income of $89,753, while families with no earners (464) have the lowest median family income of $46,667, accounting for 46.1% and 15.1% of families, respectively.
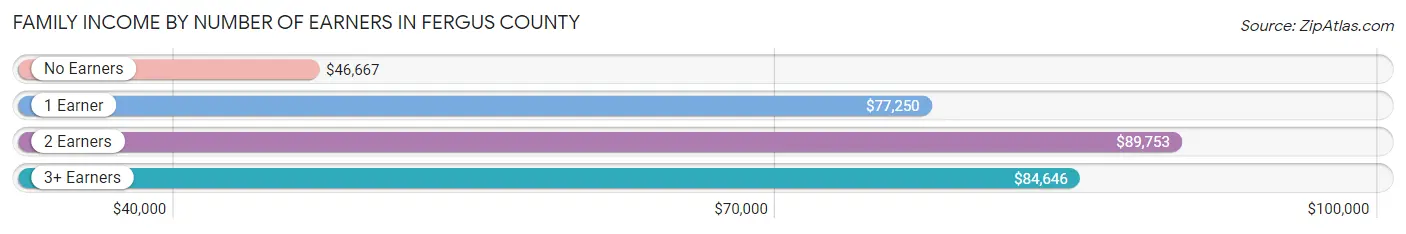
| Number of Earners | # Families | Median Income |
| No Earners | 464 (15.1%) | $46,667 |
| 1 Earner | 991 (32.3%) | $77,250 |
| 2 Earners | 1,413 (46.1%) | $89,753 |
| 3+ Earners | 199 (6.5%) | $84,646 |
| Total | 3,067 (100.0%) | $83,279 |
Household Income in Fergus County
Household Income Brackets in Fergus County
With 985 households falling in the category, the $75,000 to $99,999 income range is the most frequent in Fergus County, accounting for 19.0% of all households. In contrast, only 254 households (4.9%) fall into the less than $10,000 income bracket, making it the least populous group.
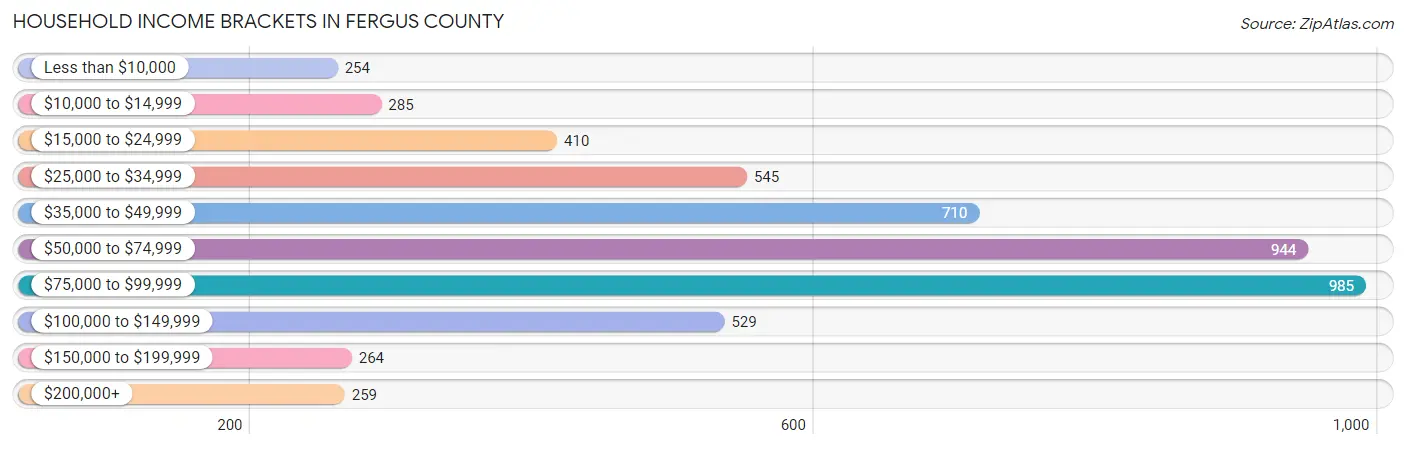
| Income Bracket | # Households | % Households |
| Less than $10,000 | 254 | 4.9% |
| $10,000 to $14,999 | 285 | 5.5% |
| $15,000 to $24,999 | 410 | 7.9% |
| $25,000 to $34,999 | 545 | 10.5% |
| $35,000 to $49,999 | 710 | 13.7% |
| $50,000 to $74,999 | 944 | 18.2% |
| $75,000 to $99,999 | 985 | 19.0% |
| $100,000 to $149,999 | 529 | 10.2% |
| $150,000 to $199,999 | 264 | 5.1% |
| $200,000+ | 259 | 5.0% |
Household Income by Householder Age in Fergus County
The median household income in Fergus County is $58,321, with the highest median household income of $81,776 found in the 25 to 44 years age bracket for the primary householder. A total of 1,444 households (27.8%) fall into this category. Meanwhile, the 15 to 24 years age bracket for the primary householder has the lowest median household income of $37,292, with 195 households (3.8%) in this group.
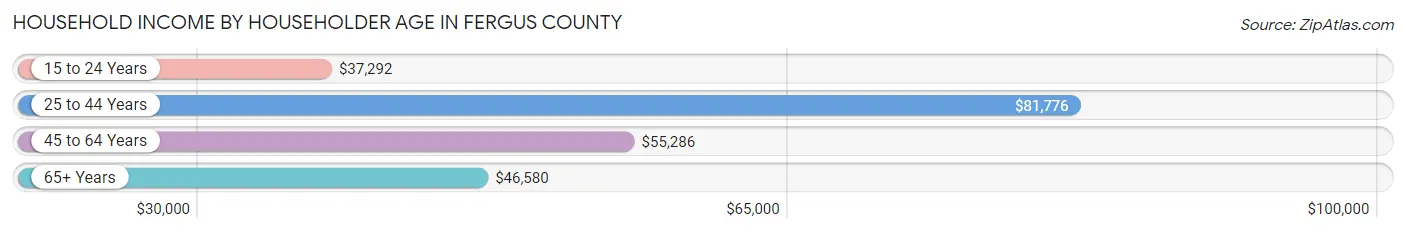
| Income Bracket | # Households | Median Income |
| 15 to 24 Years | 195 (3.8%) | $37,292 |
| 25 to 44 Years | 1,444 (27.8%) | $81,776 |
| 45 to 64 Years | 1,766 (34.1%) | $55,286 |
| 65+ Years | 1,781 (34.3%) | $46,580 |
| Total | 5,186 (100.0%) | $58,321 |
Poverty in Fergus County
Income Below Poverty by Sex and Age in Fergus County
With 12.5% poverty level for males and 17.2% for females among the residents of Fergus County, 6 to 11 year old males and 18 to 24 year old females are the most vulnerable to poverty, with 170 males (34.3%) and 146 females (46.9%) in their respective age groups living below the poverty level.
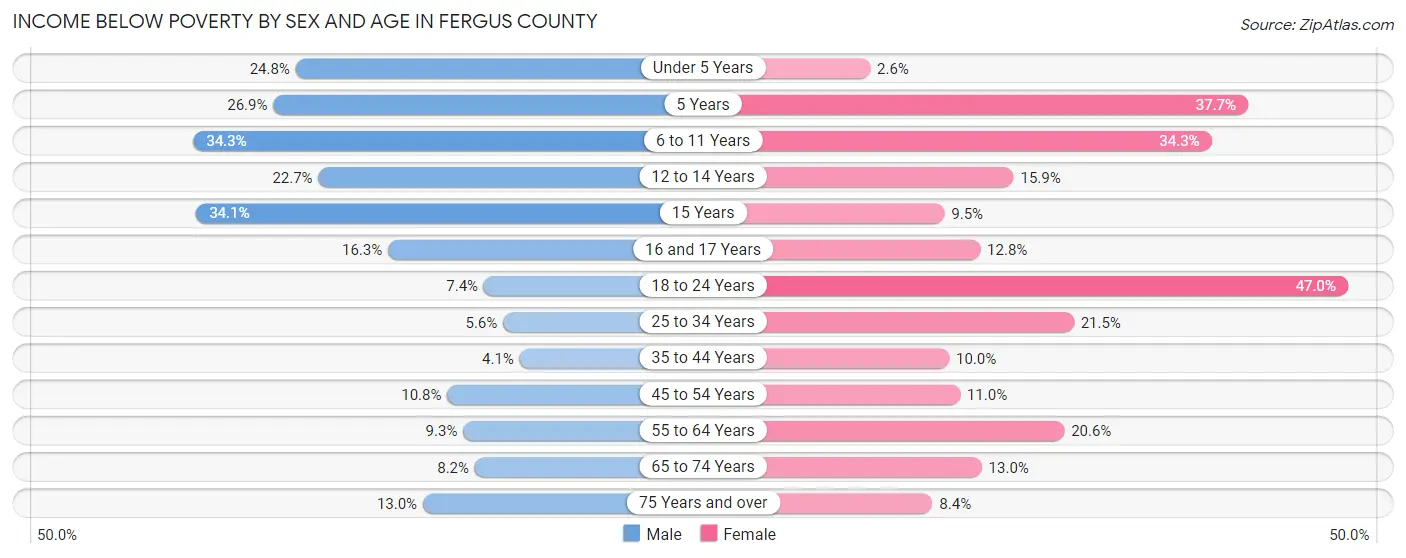
| Age Bracket | Male | Female |
| Under 5 Years | 76 (24.8%) | 7 (2.6%) |
| 5 Years | 7 (26.9%) | 26 (37.7%) |
| 6 to 11 Years | 170 (34.3%) | 118 (34.3%) |
| 12 to 14 Years | 30 (22.7%) | 22 (15.9%) |
| 15 Years | 31 (34.1%) | 6 (9.5%) |
| 16 and 17 Years | 27 (16.3%) | 14 (12.8%) |
| 18 to 24 Years | 25 (7.4%) | 146 (46.9%) |
| 25 to 34 Years | 38 (5.6%) | 136 (21.5%) |
| 35 to 44 Years | 26 (4.1%) | 66 (10.0%) |
| 45 to 54 Years | 78 (10.8%) | 67 (11.0%) |
| 55 to 64 Years | 78 (9.3%) | 168 (20.6%) |
| 65 to 74 Years | 66 (8.2%) | 101 (13.0%) |
| 75 Years and over | 74 (13.0%) | 48 (8.4%) |
| Total | 726 (12.5%) | 925 (17.2%) |
Income Above Poverty by Sex and Age in Fergus County
According to the poverty statistics in Fergus County, males aged 35 to 44 years and females aged under 5 years are the age groups that are most secure financially, with 96.0% of males and 97.4% of females in these age groups living above the poverty line.
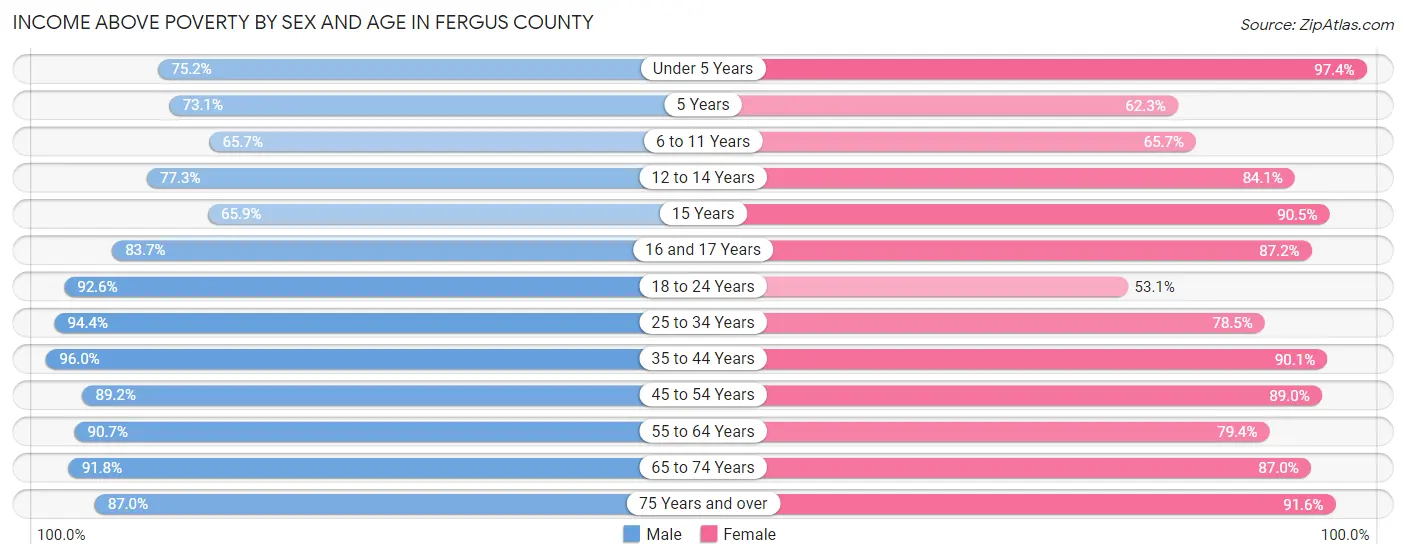
| Age Bracket | Male | Female |
| Under 5 Years | 230 (75.2%) | 259 (97.4%) |
| 5 Years | 19 (73.1%) | 43 (62.3%) |
| 6 to 11 Years | 325 (65.7%) | 226 (65.7%) |
| 12 to 14 Years | 102 (77.3%) | 116 (84.1%) |
| 15 Years | 60 (65.9%) | 57 (90.5%) |
| 16 and 17 Years | 139 (83.7%) | 95 (87.2%) |
| 18 to 24 Years | 314 (92.6%) | 165 (53.0%) |
| 25 to 34 Years | 642 (94.4%) | 496 (78.5%) |
| 35 to 44 Years | 616 (96.0%) | 597 (90.0%) |
| 45 to 54 Years | 646 (89.2%) | 544 (89.0%) |
| 55 to 64 Years | 762 (90.7%) | 646 (79.4%) |
| 65 to 74 Years | 738 (91.8%) | 677 (87.0%) |
| 75 Years and over | 494 (87.0%) | 523 (91.6%) |
| Total | 5,087 (87.5%) | 4,444 (82.8%) |
Income Below Poverty Among Married-Couple Families in Fergus County
The poverty statistics for married-couple families in Fergus County show that 4.3% or 108 of the total 2,543 families live below the poverty line. Families with 5 or more children have the highest poverty rate of 84.0%, comprising of 21 families. On the other hand, families with 1 or 2 children have the lowest poverty rate of 1.8%, which includes 13 families.
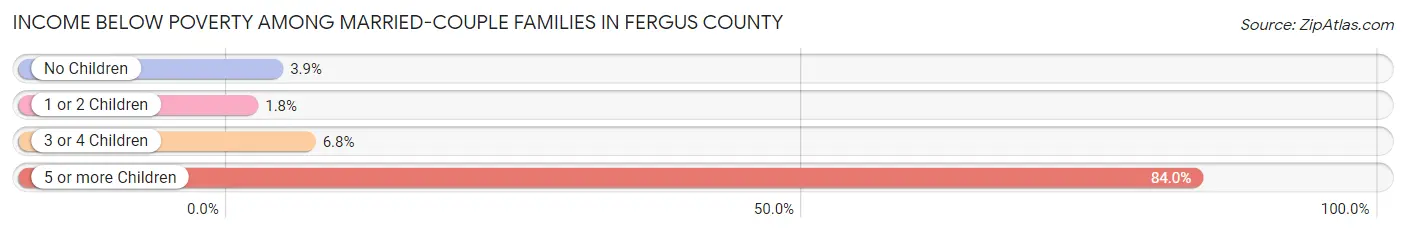
| Children | Above Poverty | Below Poverty |
| No Children | 1,566 (96.1%) | 64 (3.9%) |
| 1 or 2 Children | 727 (98.2%) | 13 (1.8%) |
| 3 or 4 Children | 138 (93.2%) | 10 (6.8%) |
| 5 or more Children | 4 (16.0%) | 21 (84.0%) |
| Total | 2,435 (95.8%) | 108 (4.3%) |
Income Below Poverty Among Single-Parent Households in Fergus County
According to the poverty data in Fergus County, 2.5% or 7 single-father households and 46.4% or 111 single-mother households are living below the poverty line. Among single-father households, those with 1 or 2 children have the highest poverty rate, with 7 households (5.3%) experiencing poverty. Likewise, among single-mother households, those with 5 or more children have the highest poverty rate, with 60 households (100.0%) falling below the poverty line.
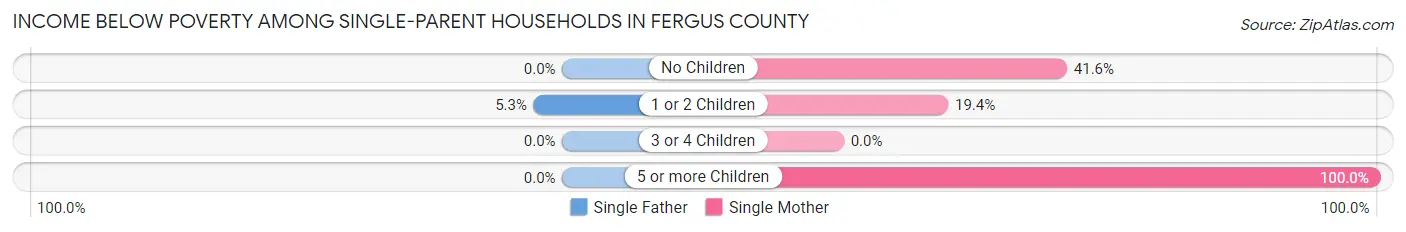
| Children | Single Father | Single Mother |
| No Children | 0 (0.0%) | 37 (41.6%) |
| 1 or 2 Children | 7 (5.3%) | 14 (19.4%) |
| 3 or 4 Children | 0 (0.0%) | 0 (0.0%) |
| 5 or more Children | 0 (0.0%) | 60 (100.0%) |
| Total | 7 (2.5%) | 111 (46.4%) |
Income Below Poverty Among Married-Couple vs Single-Parent Households in Fergus County
The poverty data for Fergus County shows that 108 of the married-couple family households (4.3%) and 118 of the single-parent households (22.5%) are living below the poverty level. Within the married-couple family households, those with 5 or more children have the highest poverty rate, with 21 households (84.0%) falling below the poverty line. Among the single-parent households, those with 5 or more children have the highest poverty rate, with 60 household (100.0%) living below poverty.
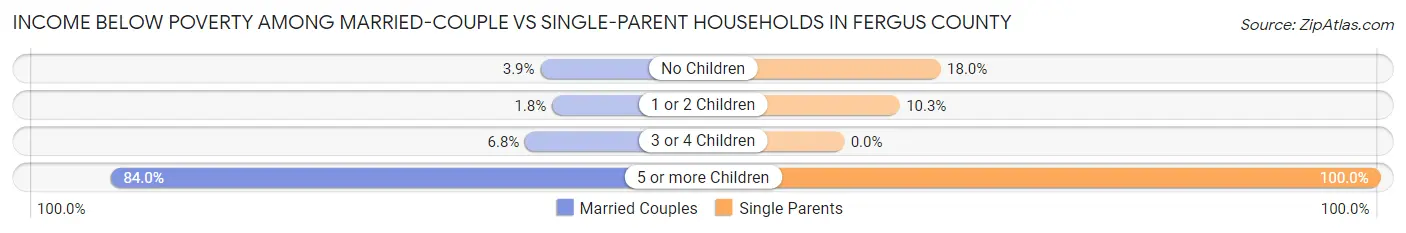
| Children | Married-Couple Families | Single-Parent Households |
| No Children | 64 (3.9%) | 37 (18.0%) |
| 1 or 2 Children | 13 (1.8%) | 21 (10.3%) |
| 3 or 4 Children | 10 (6.8%) | 0 (0.0%) |
| 5 or more Children | 21 (84.0%) | 60 (100.0%) |
| Total | 108 (4.3%) | 118 (22.5%) |
Race in Fergus County
The most populous races in Fergus County are White / Caucasian (10,731 | 93.3%), Hispanic or Latino (236 | 2.1%), and Two or more Races (230 | 2.0%).
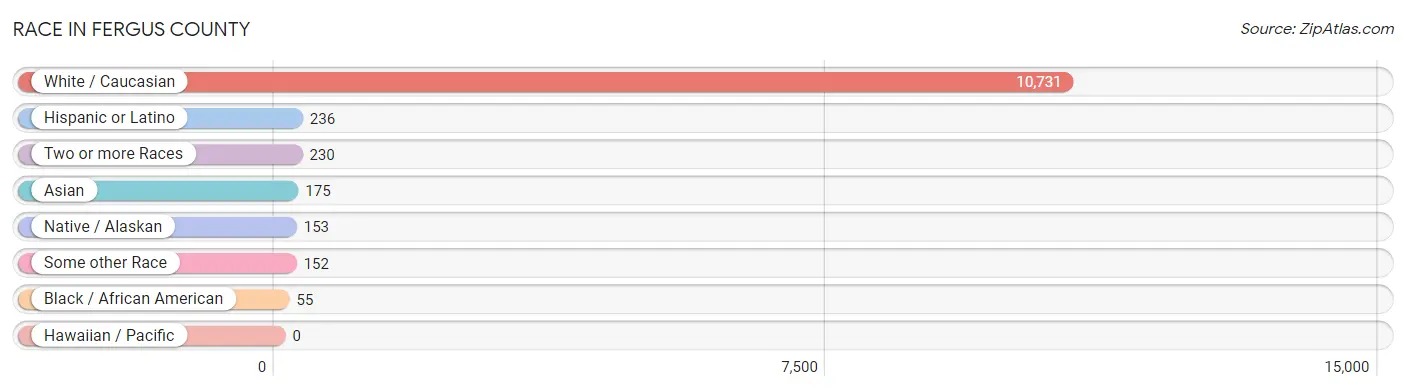
| Race | # Population | % Population |
| Asian | 175 | 1.5% |
| Black / African American | 55 | 0.5% |
| Hawaiian / Pacific | 0 | 0.0% |
| Hispanic or Latino | 236 | 2.1% |
| Native / Alaskan | 153 | 1.3% |
| White / Caucasian | 10,731 | 93.3% |
| Two or more Races | 230 | 2.0% |
| Some other Race | 152 | 1.3% |
| Total | 11,496 | 100.0% |
Ancestry in Fergus County
The most populous ancestries reported in Fergus County are German (2,755 | 24.0%), American (1,604 | 14.0%), Irish (1,277 | 11.1%), English (1,239 | 10.8%), and Norwegian (1,032 | 9.0%), together accounting for 68.8% of all Fergus County residents.
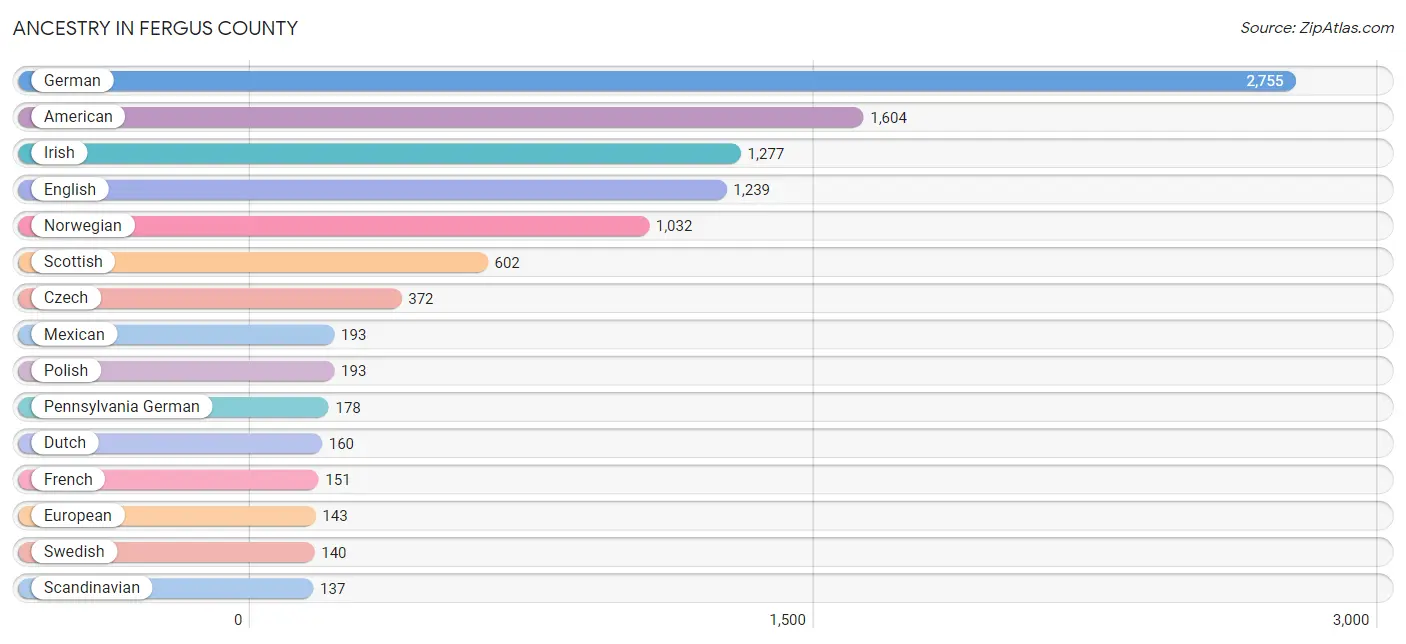
| Ancestry | # Population | % Population |
| African | 3 | 0.0% |
| American | 1,604 | 14.0% |
| Arapaho | 28 | 0.2% |
| Austrian | 27 | 0.2% |
| Basque | 3 | 0.0% |
| Belgian | 20 | 0.2% |
| Bhutanese | 3 | 0.0% |
| Blackfeet | 4 | 0.0% |
| British | 112 | 1.0% |
| Bulgarian | 1 | 0.0% |
| Burmese | 79 | 0.7% |
| Canadian | 57 | 0.5% |
| Cherokee | 3 | 0.0% |
| Cheyenne | 2 | 0.0% |
| Chippewa | 11 | 0.1% |
| Choctaw | 8 | 0.1% |
| Colombian | 10 | 0.1% |
| Cree | 9 | 0.1% |
| Croatian | 71 | 0.6% |
| Crow | 11 | 0.1% |
| Cuban | 4 | 0.0% |
| Czech | 372 | 3.2% |
| Czechoslovakian | 35 | 0.3% |
| Danish | 58 | 0.5% |
| Dutch | 160 | 1.4% |
| Eastern European | 18 | 0.2% |
| English | 1,239 | 10.8% |
| European | 143 | 1.2% |
| Finnish | 38 | 0.3% |
| French | 151 | 1.3% |
| French Canadian | 68 | 0.6% |
| German | 2,755 | 24.0% |
| Greek | 4 | 0.0% |
| Hungarian | 33 | 0.3% |
| Icelander | 5 | 0.0% |
| Indian (Asian) | 2 | 0.0% |
| Irish | 1,277 | 11.1% |
| Iroquois | 3 | 0.0% |
| Italian | 121 | 1.1% |
| Lithuanian | 4 | 0.0% |
| Mexican | 193 | 1.7% |
| Native Hawaiian | 2 | 0.0% |
| Navajo | 13 | 0.1% |
| Northern European | 4 | 0.0% |
| Norwegian | 1,032 | 9.0% |
| Pennsylvania German | 178 | 1.5% |
| Polish | 193 | 1.7% |
| Portuguese | 3 | 0.0% |
| Puerto Rican | 7 | 0.1% |
| Russian | 7 | 0.1% |
| Samoan | 2 | 0.0% |
| Scandinavian | 137 | 1.2% |
| Scotch-Irish | 99 | 0.9% |
| Scottish | 602 | 5.2% |
| Sioux | 13 | 0.1% |
| Slavic | 8 | 0.1% |
| South American | 10 | 0.1% |
| Spaniard | 14 | 0.1% |
| Spanish American | 8 | 0.1% |
| Subsaharan African | 3 | 0.0% |
| Swedish | 140 | 1.2% |
| Swiss | 60 | 0.5% |
| Thai | 96 | 0.8% |
| Tohono O'Odham | 3 | 0.0% |
| Turkish | 3 | 0.0% |
| Ukrainian | 16 | 0.1% |
| Welsh | 54 | 0.5% |
| Yugoslavian | 20 | 0.2% | View All 68 Rows |
Immigrants in Fergus County
The most numerous immigrant groups reported in Fergus County came from Asia (79 | 0.7%), Eastern Asia (79 | 0.7%), Korea (79 | 0.7%), Canada (61 | 0.5%), and Latin America (30 | 0.3%), together accounting for 2.9% of all Fergus County residents.
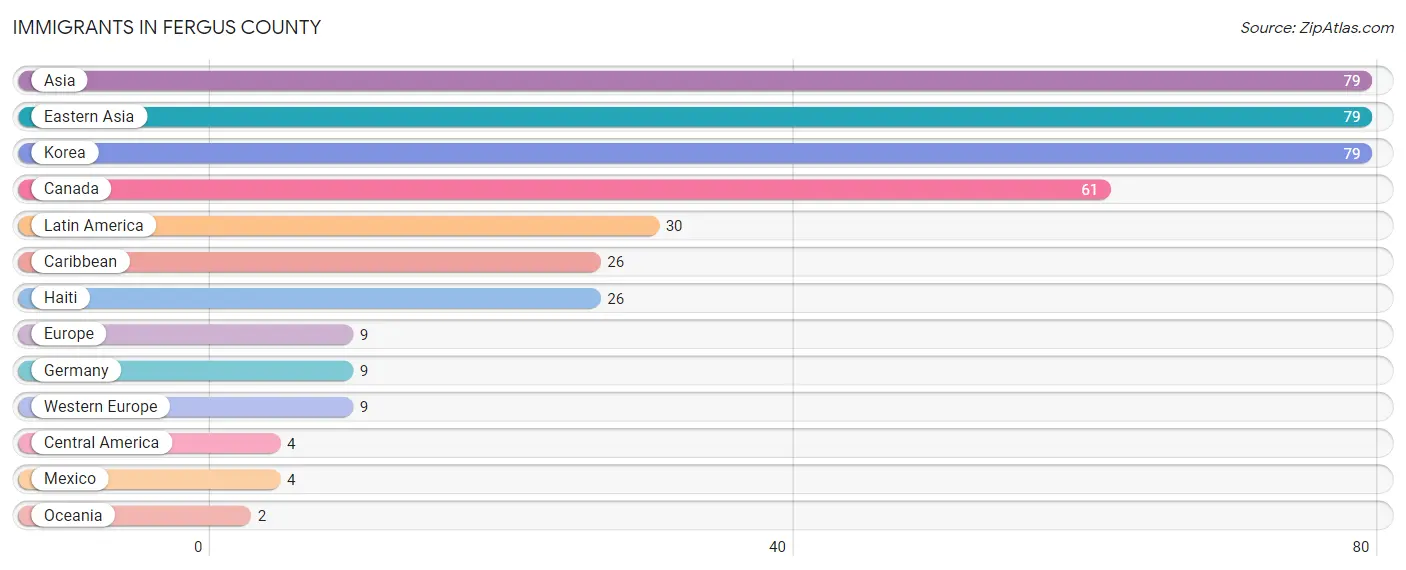
| Immigration Origin | # Population | % Population |
| Asia | 79 | 0.7% |
| Canada | 61 | 0.5% |
| Caribbean | 26 | 0.2% |
| Central America | 4 | 0.0% |
| Eastern Asia | 79 | 0.7% |
| Europe | 9 | 0.1% |
| Germany | 9 | 0.1% |
| Haiti | 26 | 0.2% |
| Korea | 79 | 0.7% |
| Latin America | 30 | 0.3% |
| Mexico | 4 | 0.0% |
| Oceania | 2 | 0.0% |
| Western Europe | 9 | 0.1% | View All 13 Rows |
Sex and Age in Fergus County
Sex and Age in Fergus County
The most populous age groups in Fergus County are 60 to 64 Years (533 | 8.9%) for men and 60 to 64 Years (511 | 9.3%) for women.
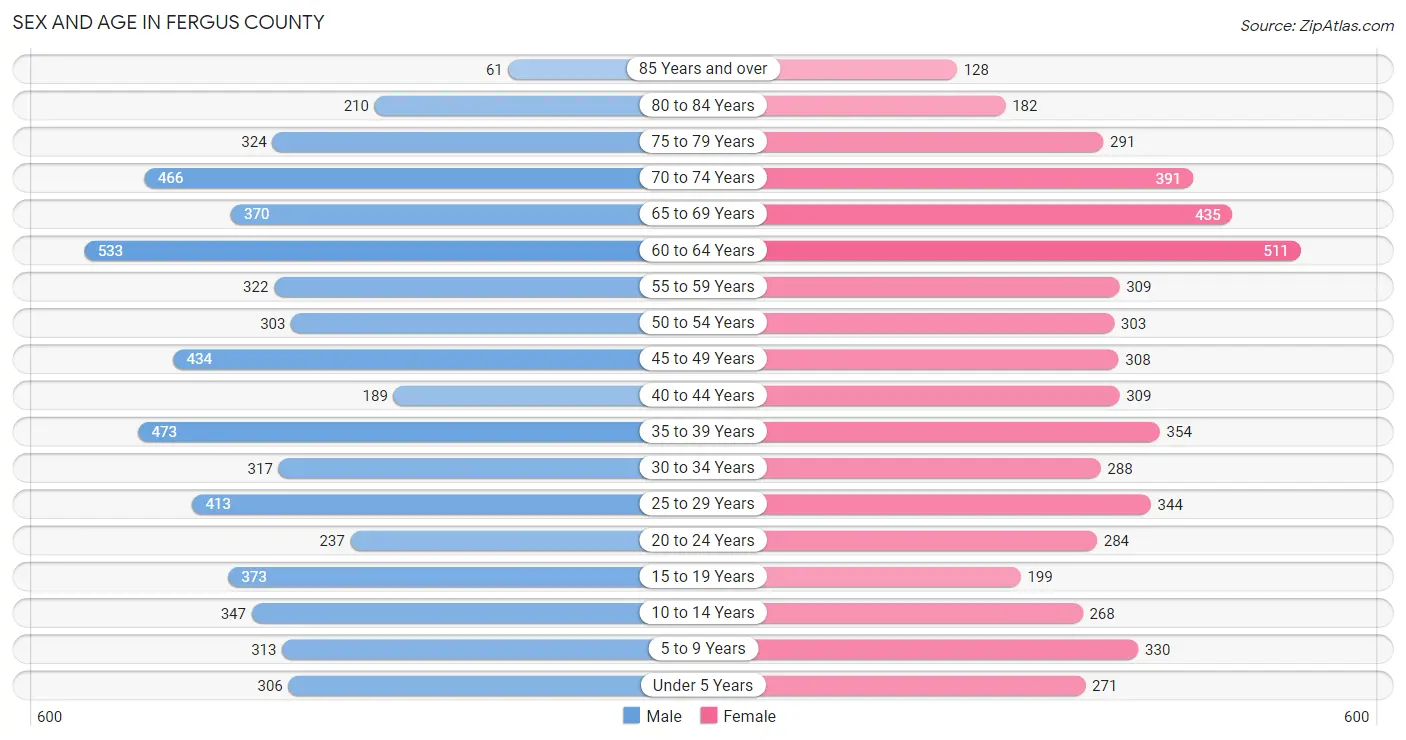
| Age Bracket | Male | Female |
| Under 5 Years | 306 (5.1%) | 271 (4.9%) |
| 5 to 9 Years | 313 (5.2%) | 330 (6.0%) |
| 10 to 14 Years | 347 (5.8%) | 268 (4.9%) |
| 15 to 19 Years | 373 (6.2%) | 199 (3.6%) |
| 20 to 24 Years | 237 (4.0%) | 284 (5.2%) |
| 25 to 29 Years | 413 (6.9%) | 344 (6.2%) |
| 30 to 34 Years | 317 (5.3%) | 288 (5.2%) |
| 35 to 39 Years | 473 (7.9%) | 354 (6.4%) |
| 40 to 44 Years | 189 (3.2%) | 309 (5.6%) |
| 45 to 49 Years | 434 (7.2%) | 308 (5.6%) |
| 50 to 54 Years | 303 (5.1%) | 303 (5.5%) |
| 55 to 59 Years | 322 (5.4%) | 309 (5.6%) |
| 60 to 64 Years | 533 (8.9%) | 511 (9.3%) |
| 65 to 69 Years | 370 (6.2%) | 435 (7.9%) |
| 70 to 74 Years | 466 (7.8%) | 391 (7.1%) |
| 75 to 79 Years | 324 (5.4%) | 291 (5.3%) |
| 80 to 84 Years | 210 (3.5%) | 182 (3.3%) |
| 85 Years and over | 61 (1.0%) | 128 (2.3%) |
| Total | 5,991 (100.0%) | 5,505 (100.0%) |
Families and Households in Fergus County
Median Family Size in Fergus County
The median family size in Fergus County is 2.75 persons per family, with single female/mother families (239 | 7.8%) accounting for the largest median family size of 3.47 persons per family. On the other hand, single male/father families (285 | 9.3%) represent the smallest median family size with 2.63 persons per family.
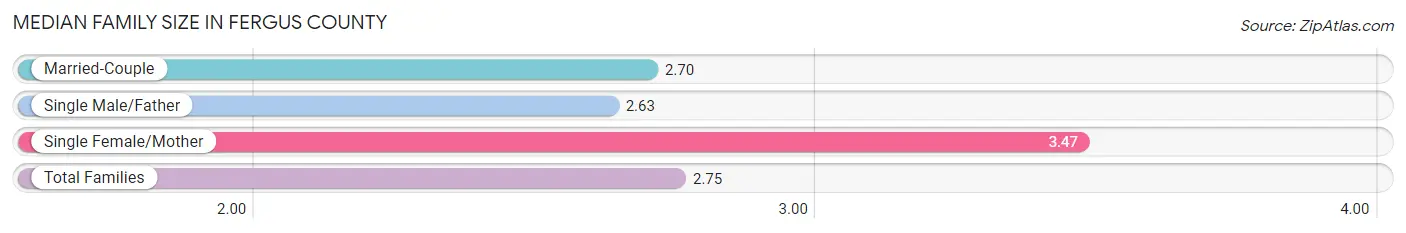
| Family Type | # Families | Family Size |
| Married-Couple | 2,543 (82.9%) | 2.70 |
| Single Male/Father | 285 (9.3%) | 2.63 |
| Single Female/Mother | 239 (7.8%) | 3.47 |
| Total Families | 3,067 (100.0%) | 2.75 |
Median Household Size in Fergus County
The median household size in Fergus County is 2.15 persons per household, with single female/mother households (239 | 4.6%) accounting for the largest median household size of 3.77 persons per household. non-family households (2,119 | 40.9%) represent the smallest median household size with 1.17 persons per household.
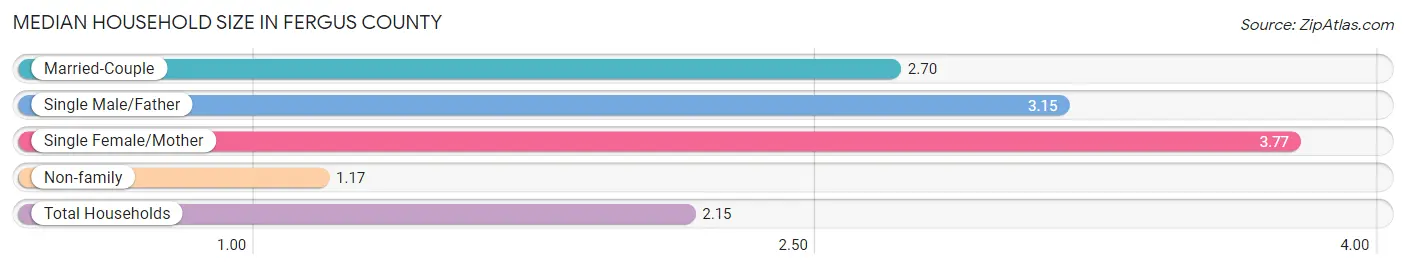
| Household Type | # Households | Household Size |
| Married-Couple | 2,543 (49.0%) | 2.70 |
| Single Male/Father | 285 (5.5%) | 3.15 |
| Single Female/Mother | 239 (4.6%) | 3.77 |
| Non-family | 2,119 (40.9%) | 1.17 |
| Total Households | 5,186 (100.0%) | 2.15 |
Household Size by Marriage Status in Fergus County
Out of a total of 5,186 households in Fergus County, 3,067 (59.1%) are family households, while 2,119 (40.9%) are nonfamily households. The most numerous type of family households are 2-person households, comprising 1,536, and the most common type of nonfamily households are 1-person households, comprising 1,835.
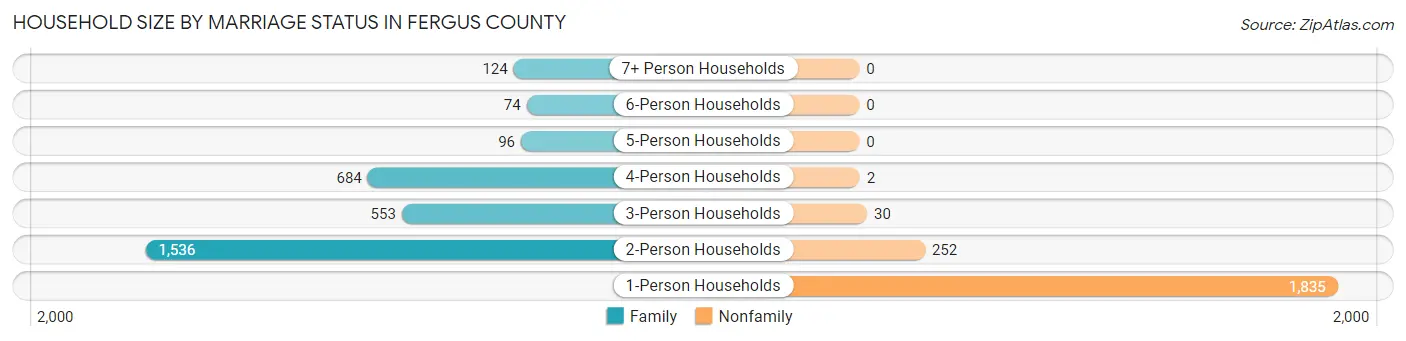
| Household Size | Family Households | Nonfamily Households |
| 1-Person Households | - | 1,835 (35.4%) |
| 2-Person Households | 1,536 (29.6%) | 252 (4.9%) |
| 3-Person Households | 553 (10.7%) | 30 (0.6%) |
| 4-Person Households | 684 (13.2%) | 2 (0.0%) |
| 5-Person Households | 96 (1.8%) | 0 (0.0%) |
| 6-Person Households | 74 (1.4%) | 0 (0.0%) |
| 7+ Person Households | 124 (2.4%) | 0 (0.0%) |
| Total | 3,067 (59.1%) | 2,119 (40.9%) |
Female Fertility in Fergus County
Fertility by Age in Fergus County
Average fertility rate in Fergus County is 52.0 births per 1,000 women. Women in the age bracket of 20 to 34 years have the highest fertility rate with 85.0 births per 1,000 women. Women in the age bracket of 20 to 34 years acount for 70.3% of all women with births.
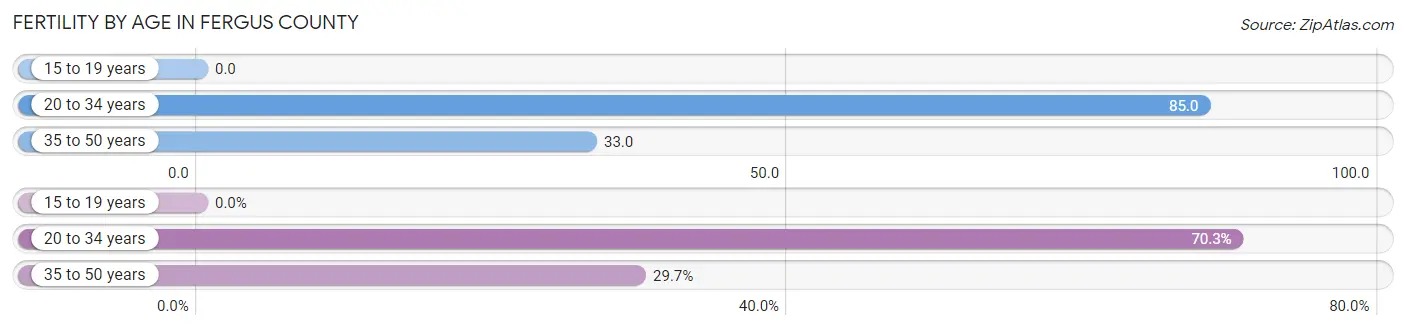
| Age Bracket | Women with Births | Births / 1,000 Women |
| 15 to 19 years | 0 (0.0%) | 0.0 |
| 20 to 34 years | 78 (70.3%) | 85.0 |
| 35 to 50 years | 33 (29.7%) | 33.0 |
| Total | 111 (100.0%) | 52.0 |
Fertility by Age by Marriage Status in Fergus County
95.5% of women with births (111) in Fergus County are married. The highest percentage of unmarried women with births falls into 20 to 34 years age bracket with 6.4% of them unmarried at the time of birth, while the lowest percentage of unmarried women with births belong to 35 to 50 years age bracket with 0.0% of them unmarried.
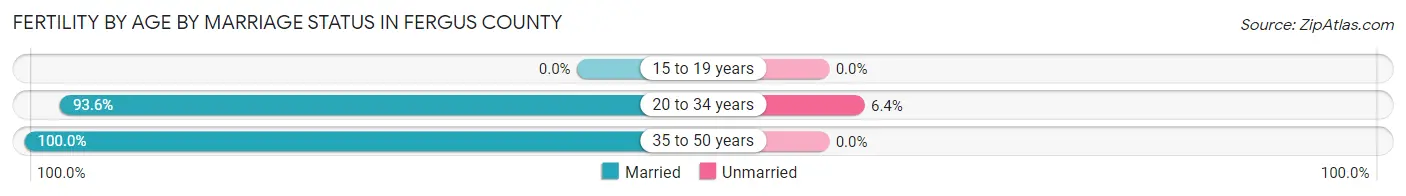
| Age Bracket | Married | Unmarried |
| 15 to 19 years | 0 (0.0%) | 0 (0.0%) |
| 20 to 34 years | 73 (93.6%) | 5 (6.4%) |
| 35 to 50 years | 33 (100.0%) | 0 (0.0%) |
| Total | 106 (95.5%) | 5 (4.5%) |
Fertility by Education in Fergus County
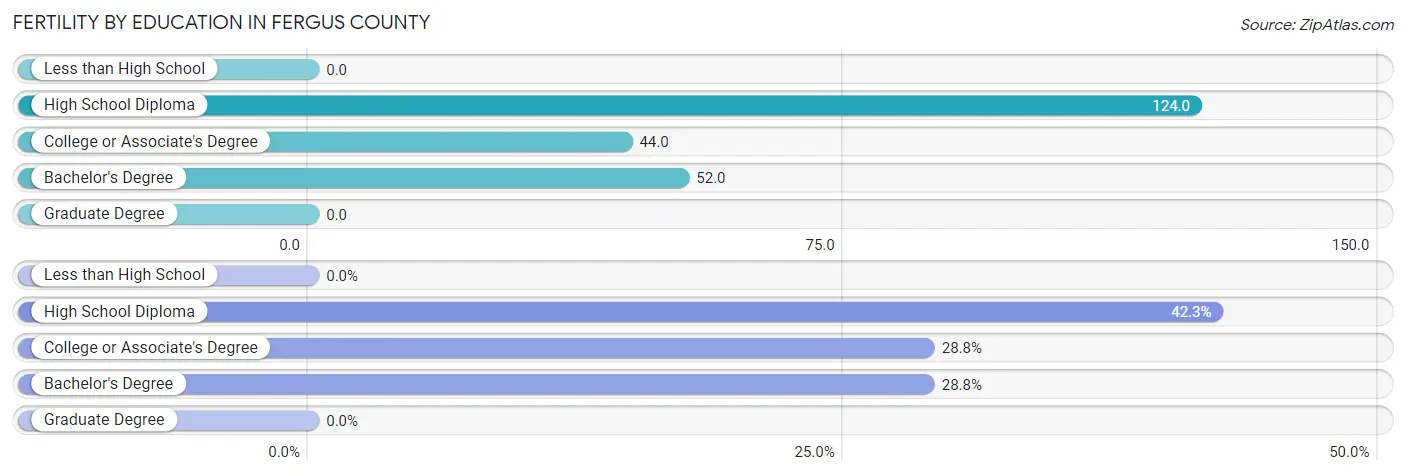
| Educational Attainment | Women with Births | Births / 1,000 Women |
| Less than High School | 0 (0.0%) | 0.0 |
| High School Diploma | 47 (42.3%) | 124.0 |
| College or Associate's Degree | 32 (28.8%) | 44.0 |
| Bachelor's Degree | 32 (28.8%) | 52.0 |
| Graduate Degree | 0 (0.0%) | 0.0 |
| Total | 111 (100.0%) | 52.0 |
Fertility by Education by Marriage Status in Fergus County
4.5% of women with births in Fergus County are unmarried. Women with the educational attainment of college or associate's degree are most likely to be married with 100.0% of them married at childbirth, while women with the educational attainment of high school diploma are least likely to be married with 10.6% of them unmarried at childbirth.
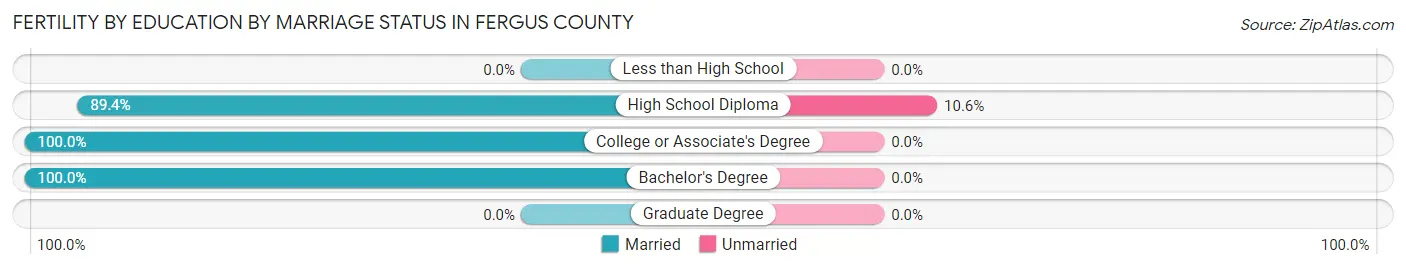
| Educational Attainment | Married | Unmarried |
| Less than High School | 0 (0.0%) | 0 (0.0%) |
| High School Diploma | 42 (89.4%) | 5 (10.6%) |
| College or Associate's Degree | 32 (100.0%) | 0 (0.0%) |
| Bachelor's Degree | 32 (100.0%) | 0 (0.0%) |
| Graduate Degree | 0 (0.0%) | 0 (0.0%) |
| Total | 106 (95.5%) | 5 (4.5%) |
Employment Characteristics in Fergus County
Employment by Class of Employer in Fergus County
Among the 5,584 employed individuals in Fergus County, private company employees (2,843 | 50.9%), self-employed (not incorporated) (847 | 15.2%), and not-for-profit organizations (728 | 13.0%) make up the most common classes of employment.
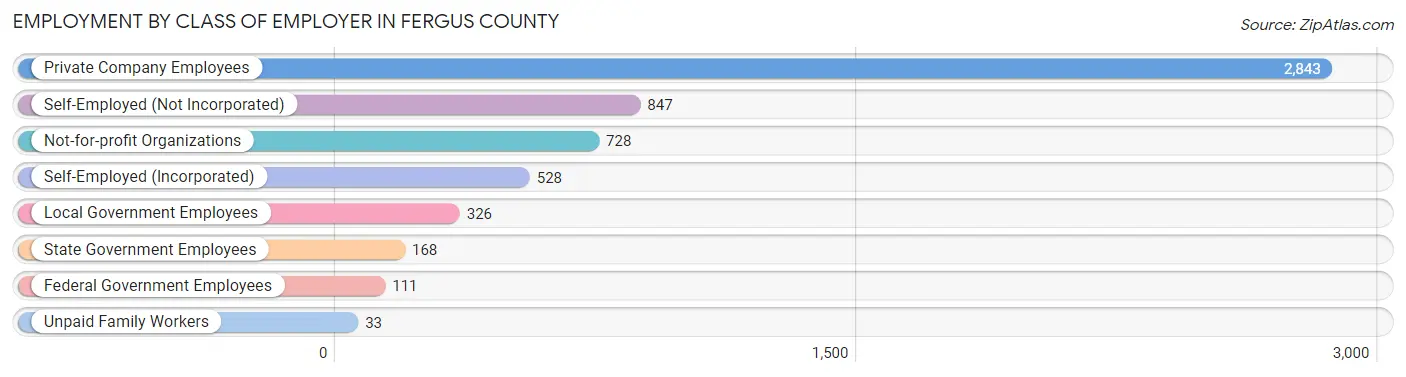
| Employer Class | # Employees | % Employees |
| Private Company Employees | 2,843 | 50.9% |
| Self-Employed (Incorporated) | 528 | 9.5% |
| Self-Employed (Not Incorporated) | 847 | 15.2% |
| Not-for-profit Organizations | 728 | 13.0% |
| Local Government Employees | 326 | 5.8% |
| State Government Employees | 168 | 3.0% |
| Federal Government Employees | 111 | 2.0% |
| Unpaid Family Workers | 33 | 0.6% |
| Total | 5,584 | 100.0% |
Employment Status by Age in Fergus County
According to the labor force statistics for Fergus County, out of the total population over 16 years of age (9,506), 60.7% or 5,770 individuals are in the labor force, with 3.1% or 179 of them unemployed. The age group with the highest labor force participation rate is 20 to 24 years, with 95.0% or 495 individuals in the labor force. Within the labor force, the 20 to 24 years age range has the highest percentage of unemployed individuals, with 20.8% or 103 of them being unemployed.
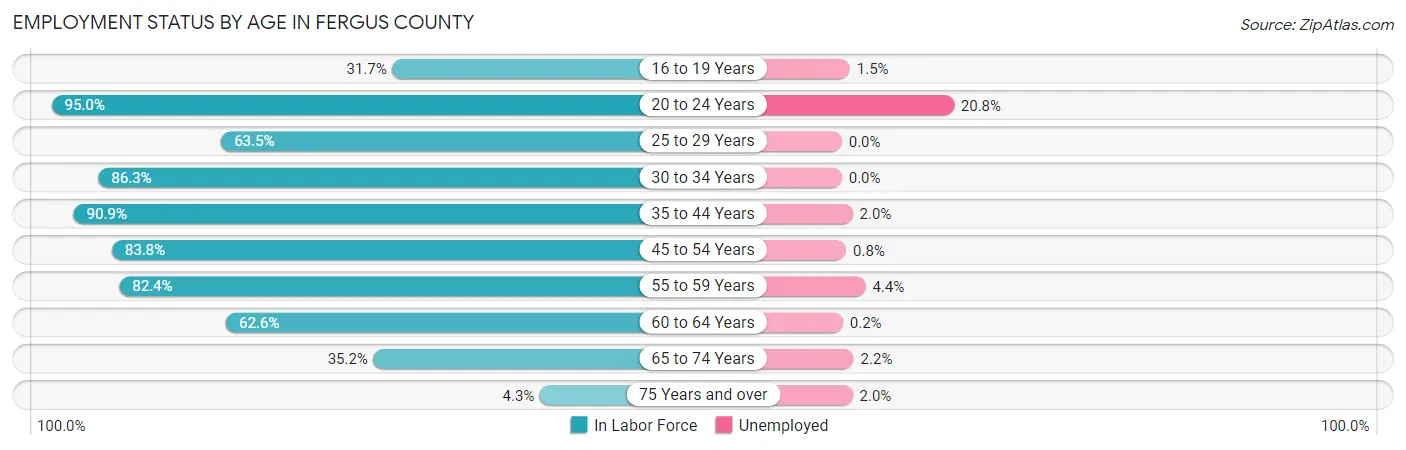
| Age Bracket | In Labor Force | Unemployed |
| 16 to 19 Years | 132 (31.7%) | 2 (1.5%) |
| 20 to 24 Years | 495 (95.0%) | 103 (20.8%) |
| 25 to 29 Years | 481 (63.5%) | 0 (0.0%) |
| 30 to 34 Years | 522 (86.3%) | 0 (0.0%) |
| 35 to 44 Years | 1,204 (90.9%) | 24 (2.0%) |
| 45 to 54 Years | 1,130 (83.8%) | 9 (0.8%) |
| 55 to 59 Years | 520 (82.4%) | 23 (4.4%) |
| 60 to 64 Years | 654 (62.6%) | 1 (0.2%) |
| 65 to 74 Years | 585 (35.2%) | 13 (2.2%) |
| 75 Years and over | 51 (4.3%) | 1 (2.0%) |
| Total | 5,770 (60.7%) | 179 (3.1%) |
Employment Status by Educational Attainment in Fergus County
According to labor force statistics for Fergus County, 79.0% of individuals (4,511) out of the total population between 25 and 64 years of age (5,710) are in the labor force, with 1.3% or 59 of them being unemployed. The group with the highest labor force participation rate are those with the educational attainment of bachelor's degree or higher, with 85.9% or 1,494 individuals in the labor force. Within the labor force, individuals with college / associate degree education have the highest percentage of unemployment, with 2.3% or 37 of them being unemployed.
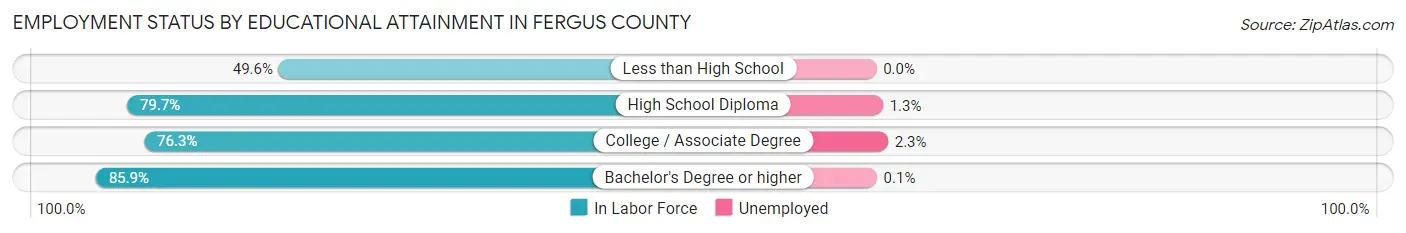
| Educational Attainment | In Labor Force | Unemployed |
| Less than High School | 123 (49.6%) | 0 (0.0%) |
| High School Diploma | 1,268 (79.7%) | 21 (1.3%) |
| College / Associate Degree | 1,627 (76.3%) | 49 (2.3%) |
| Bachelor's Degree or higher | 1,494 (85.9%) | 2 (0.1%) |
| Total | 4,511 (79.0%) | 74 (1.3%) |
Employment Occupations by Sex in Fergus County
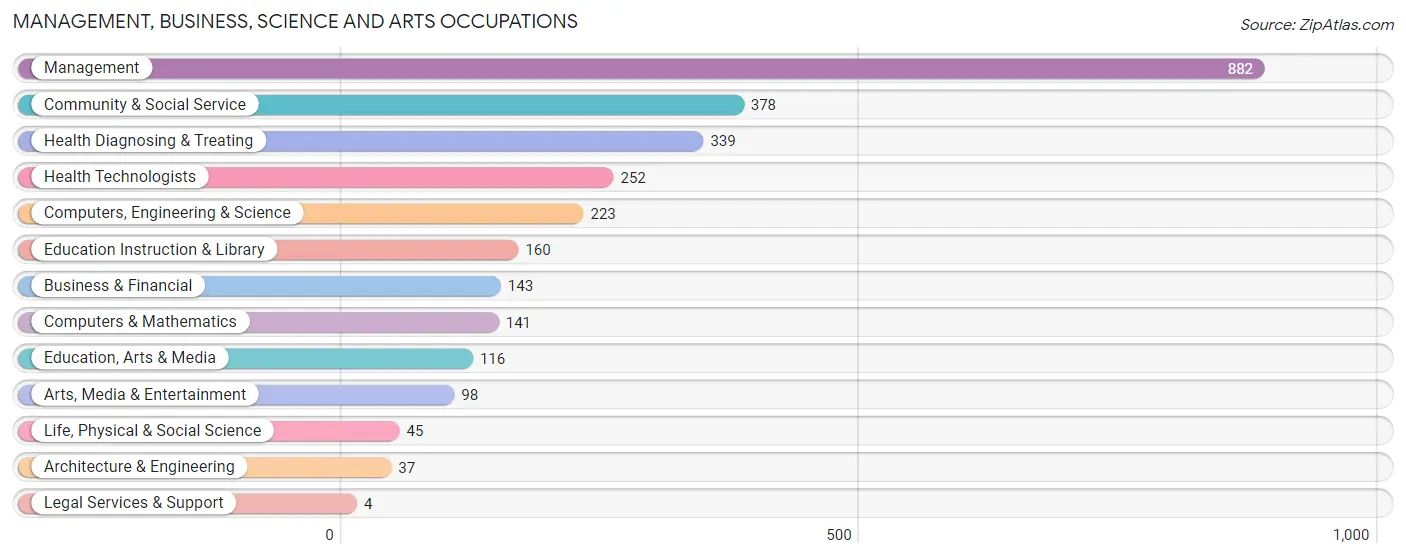
Management, Business, Science and Arts Occupations
The most common Management, Business, Science and Arts occupations in Fergus County are Management (882 | 15.8%), Community & Social Service (378 | 6.8%), Health Diagnosing & Treating (339 | 6.1%), Health Technologists (252 | 4.5%), and Computers, Engineering & Science (223 | 4.0%).
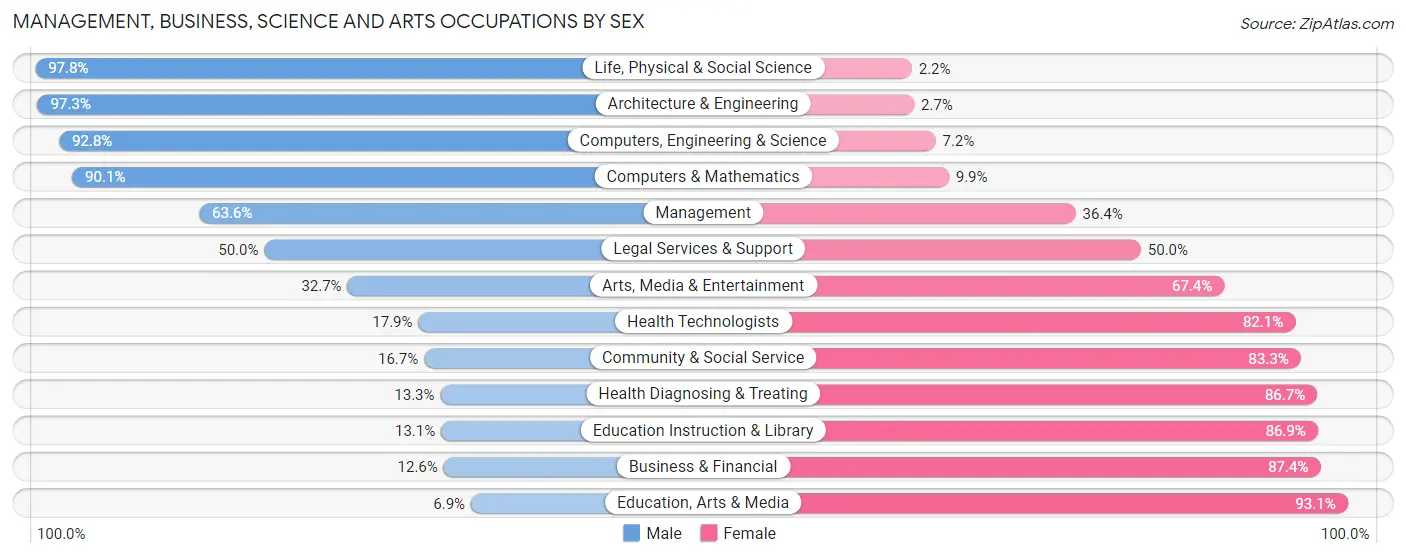
Management, Business, Science and Arts Occupations by Sex
Within the Management, Business, Science and Arts occupations in Fergus County, the most male-oriented occupations are Life, Physical & Social Science (97.8%), Architecture & Engineering (97.3%), and Computers, Engineering & Science (92.8%), while the most female-oriented occupations are Education, Arts & Media (93.1%), Business & Financial (87.4%), and Education Instruction & Library (86.9%).
| Occupation | Male | Female |
| Management | 561 (63.6%) | 321 (36.4%) |
| Business & Financial | 18 (12.6%) | 125 (87.4%) |
| Computers, Engineering & Science | 207 (92.8%) | 16 (7.2%) |
| Computers & Mathematics | 127 (90.1%) | 14 (9.9%) |
| Architecture & Engineering | 36 (97.3%) | 1 (2.7%) |
| Life, Physical & Social Science | 44 (97.8%) | 1 (2.2%) |
| Community & Social Service | 63 (16.7%) | 315 (83.3%) |
| Education, Arts & Media | 8 (6.9%) | 108 (93.1%) |
| Legal Services & Support | 2 (50.0%) | 2 (50.0%) |
| Education Instruction & Library | 21 (13.1%) | 139 (86.9%) |
| Arts, Media & Entertainment | 32 (32.7%) | 66 (67.3%) |
| Health Diagnosing & Treating | 45 (13.3%) | 294 (86.7%) |
| Health Technologists | 45 (17.9%) | 207 (82.1%) |
| Total (Category) | 894 (45.5%) | 1,071 (54.5%) |
| Total (Overall) | 3,247 (58.1%) | 2,344 (41.9%) |
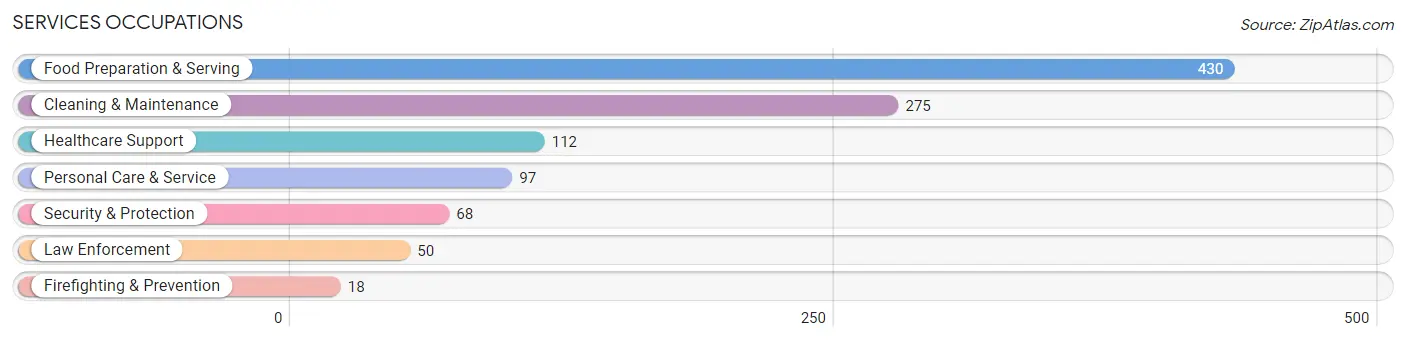
Services Occupations
The most common Services occupations in Fergus County are Food Preparation & Serving (430 | 7.7%), Cleaning & Maintenance (275 | 4.9%), Healthcare Support (112 | 2.0%), Personal Care & Service (97 | 1.7%), and Security & Protection (68 | 1.2%).
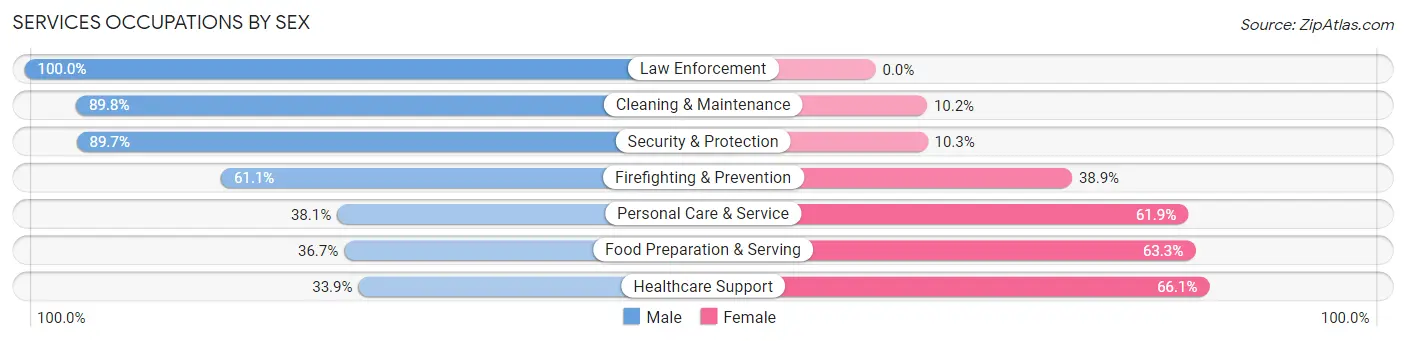
Services Occupations by Sex
Within the Services occupations in Fergus County, the most male-oriented occupations are Law Enforcement (100.0%), Cleaning & Maintenance (89.8%), and Security & Protection (89.7%), while the most female-oriented occupations are Healthcare Support (66.1%), Food Preparation & Serving (63.3%), and Personal Care & Service (61.9%).
| Occupation | Male | Female |
| Healthcare Support | 38 (33.9%) | 74 (66.1%) |
| Security & Protection | 61 (89.7%) | 7 (10.3%) |
| Firefighting & Prevention | 11 (61.1%) | 7 (38.9%) |
| Law Enforcement | 50 (100.0%) | 0 (0.0%) |
| Food Preparation & Serving | 158 (36.7%) | 272 (63.3%) |
| Cleaning & Maintenance | 247 (89.8%) | 28 (10.2%) |
| Personal Care & Service | 37 (38.1%) | 60 (61.9%) |
| Total (Category) | 541 (55.1%) | 441 (44.9%) |
| Total (Overall) | 3,247 (58.1%) | 2,344 (41.9%) |
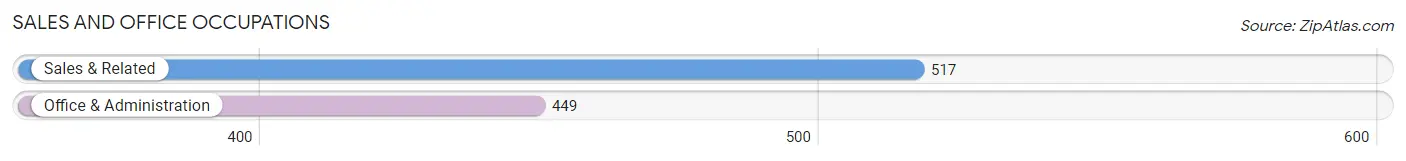
Sales and Office Occupations
The most common Sales and Office occupations in Fergus County are Sales & Related (517 | 9.2%), and Office & Administration (449 | 8.0%).
Sales and Office Occupations by Sex
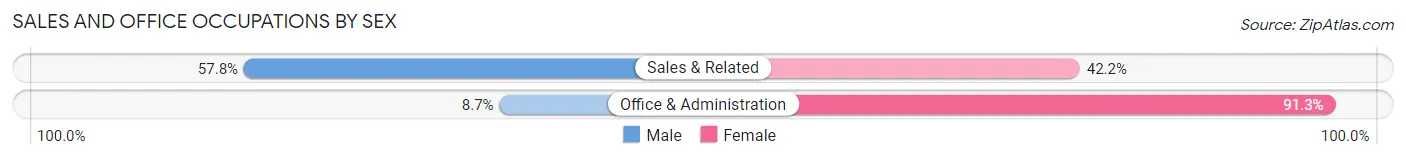
| Occupation | Male | Female |
| Sales & Related | 299 (57.8%) | 218 (42.2%) |
| Office & Administration | 39 (8.7%) | 410 (91.3%) |
| Total (Category) | 338 (35.0%) | 628 (65.0%) |
| Total (Overall) | 3,247 (58.1%) | 2,344 (41.9%) |
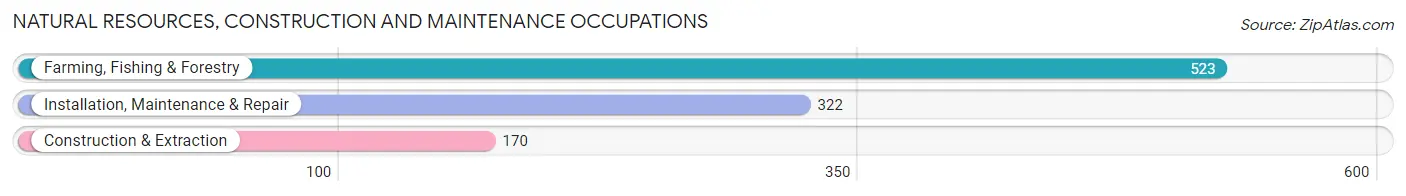
Natural Resources, Construction and Maintenance Occupations
The most common Natural Resources, Construction and Maintenance occupations in Fergus County are Farming, Fishing & Forestry (523 | 9.3%), Installation, Maintenance & Repair (322 | 5.8%), and Construction & Extraction (170 | 3.0%).
Natural Resources, Construction and Maintenance Occupations by Sex
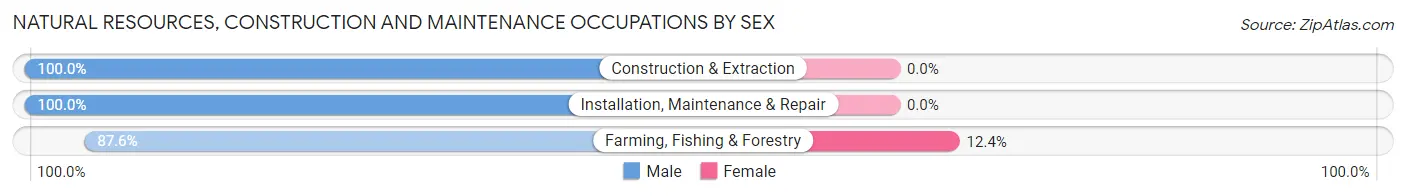
| Occupation | Male | Female |
| Farming, Fishing & Forestry | 458 (87.6%) | 65 (12.4%) |
| Construction & Extraction | 170 (100.0%) | 0 (0.0%) |
| Installation, Maintenance & Repair | 322 (100.0%) | 0 (0.0%) |
| Total (Category) | 950 (93.6%) | 65 (6.4%) |
| Total (Overall) | 3,247 (58.1%) | 2,344 (41.9%) |
Production, Transportation and Moving Occupations
The most common Production, Transportation and Moving occupations in Fergus County are Production (294 | 5.3%), Transportation (230 | 4.1%), and Material Moving (139 | 2.5%).
Production, Transportation and Moving Occupations by Sex
| Occupation | Male | Female |
| Production | 198 (67.3%) | 96 (32.7%) |
| Transportation | 210 (91.3%) | 20 (8.7%) |
| Material Moving | 116 (83.5%) | 23 (16.6%) |
| Total (Category) | 524 (79.0%) | 139 (21.0%) |
| Total (Overall) | 3,247 (58.1%) | 2,344 (41.9%) |
Employment Industries by Sex in Fergus County
Employment Industries in Fergus County
The major employment industries in Fergus County include Agriculture, Fishing & Hunting (1,022 | 18.3%), Health Care & Social Assistance (904 | 16.2%), Retail Trade (657 | 11.7%), Accommodation & Food Services (440 | 7.9%), and Construction (396 | 7.1%).
Employment Industries by Sex in Fergus County
The Fergus County industries that see more men than women are Mining, Quarrying, & Extraction (100.0%), Utilities (96.0%), and Agriculture, Fishing & Hunting (84.3%), whereas the industries that tend to have a higher number of women are Finance & Insurance (89.5%), Educational Services (80.6%), and Health Care & Social Assistance (69.9%).
| Industry | Male | Female |
| Agriculture, Fishing & Hunting | 862 (84.3%) | 160 (15.7%) |
| Mining, Quarrying, & Extraction | 23 (100.0%) | 0 (0.0%) |
| Construction | 325 (82.1%) | 71 (17.9%) |
| Manufacturing | 94 (65.7%) | 49 (34.3%) |
| Wholesale Trade | 118 (63.8%) | 67 (36.2%) |
| Retail Trade | 391 (59.5%) | 266 (40.5%) |
| Transportation & Warehousing | 145 (71.8%) | 57 (28.2%) |
| Utilities | 119 (96.0%) | 5 (4.0%) |
| Information | 46 (55.4%) | 37 (44.6%) |
| Finance & Insurance | 14 (10.4%) | 120 (89.5%) |
| Real Estate, Rental & Leasing | 34 (43.6%) | 44 (56.4%) |
| Professional & Scientific | 168 (69.4%) | 74 (30.6%) |
| Enterprise Management | 0 (0.0%) | 0 (0.0%) |
| Administrative & Support | 77 (65.2%) | 41 (34.7%) |
| Educational Services | 51 (19.4%) | 212 (80.6%) |
| Health Care & Social Assistance | 272 (30.1%) | 632 (69.9%) |
| Arts, Entertainment & Recreation | 23 (63.9%) | 13 (36.1%) |
| Accommodation & Food Services | 192 (43.6%) | 248 (56.4%) |
| Public Administration | 128 (73.6%) | 46 (26.4%) |
| Total | 3,247 (58.1%) | 2,344 (41.9%) |
Education in Fergus County
School Enrollment in Fergus County
The most common levels of schooling among the 1,950 students in Fergus County are elementary school (519 | 26.6%), high school (424 | 21.7%), and middle school (414 | 21.2%).
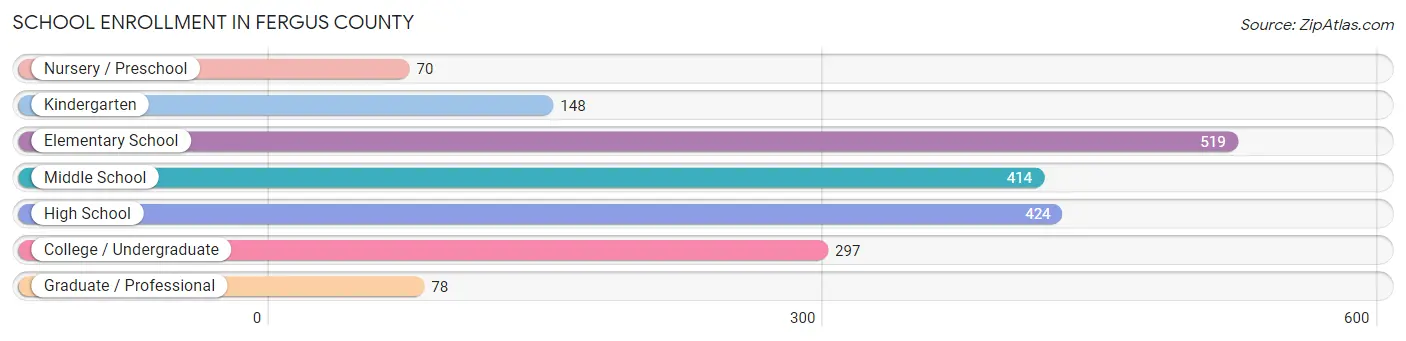
| School Level | # Students | % Students |
| Nursery / Preschool | 70 | 3.6% |
| Kindergarten | 148 | 7.6% |
| Elementary School | 519 | 26.6% |
| Middle School | 414 | 21.2% |
| High School | 424 | 21.7% |
| College / Undergraduate | 297 | 15.2% |
| Graduate / Professional | 78 | 4.0% |
| Total | 1,950 | 100.0% |
School Enrollment by Age by Funding Source in Fergus County
Out of a total of 1,950 students who are enrolled in schools in Fergus County, 218 (11.2%) attend a private institution, while the remaining 1,732 (88.8%) are enrolled in public schools. The age group of 25 to 34 year olds has the highest likelihood of being enrolled in private schools, with 80 (83.3% in the age bracket) enrolled. Conversely, the age group of 3 to 4 year olds has the lowest likelihood of being enrolled in a private school, with 37 (100.0% in the age bracket) attending a public institution.
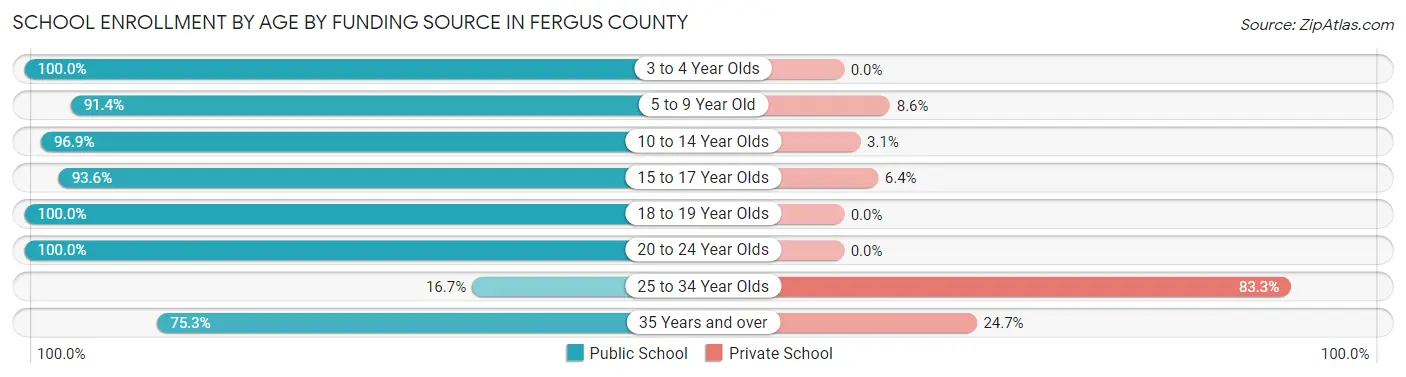
| Age Bracket | Public School | Private School |
| 3 to 4 Year Olds | 37 (100.0%) | 0 (0.0%) |
| 5 to 9 Year Old | 532 (91.4%) | 50 (8.6%) |
| 10 to 14 Year Olds | 538 (96.9%) | 17 (3.1%) |
| 15 to 17 Year Olds | 383 (93.6%) | 26 (6.4%) |
| 18 to 19 Year Olds | 52 (100.0%) | 0 (0.0%) |
| 20 to 24 Year Olds | 37 (100.0%) | 0 (0.0%) |
| 25 to 34 Year Olds | 16 (16.7%) | 80 (83.3%) |
| 35 Years and over | 137 (75.3%) | 45 (24.7%) |
| Total | 1,732 (88.8%) | 218 (11.2%) |
Educational Attainment by Field of Study in Fergus County
Education (542 | 21.4%), business (523 | 20.7%), bio, nature & agricultural (359 | 14.2%), arts & humanities (275 | 10.9%), and science & technology (196 | 7.7%) are the most common fields of study among 2,529 individuals in Fergus County who have obtained a bachelor's degree or higher.
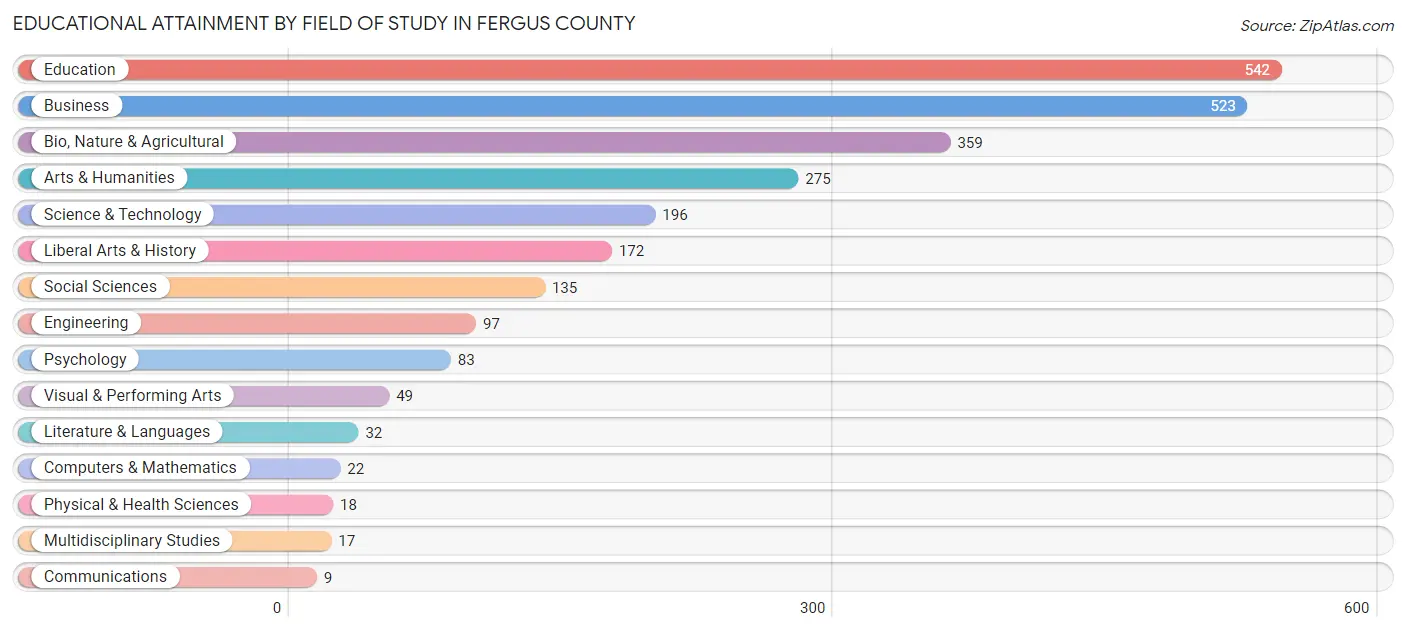
| Field of Study | # Graduates | % Graduates |
| Computers & Mathematics | 22 | 0.9% |
| Bio, Nature & Agricultural | 359 | 14.2% |
| Physical & Health Sciences | 18 | 0.7% |
| Psychology | 83 | 3.3% |
| Social Sciences | 135 | 5.3% |
| Engineering | 97 | 3.8% |
| Multidisciplinary Studies | 17 | 0.7% |
| Science & Technology | 196 | 7.7% |
| Business | 523 | 20.7% |
| Education | 542 | 21.4% |
| Literature & Languages | 32 | 1.3% |
| Liberal Arts & History | 172 | 6.8% |
| Visual & Performing Arts | 49 | 1.9% |
| Communications | 9 | 0.4% |
| Arts & Humanities | 275 | 10.9% |
| Total | 2,529 | 100.0% |
Transportation & Commute in Fergus County
Vehicle Availability by Sex in Fergus County
The most prevalent vehicle ownership categories in Fergus County are males with 2 vehicles (1,077, accounting for 33.7%) and females with 2 vehicles (624, making up 46.8%).
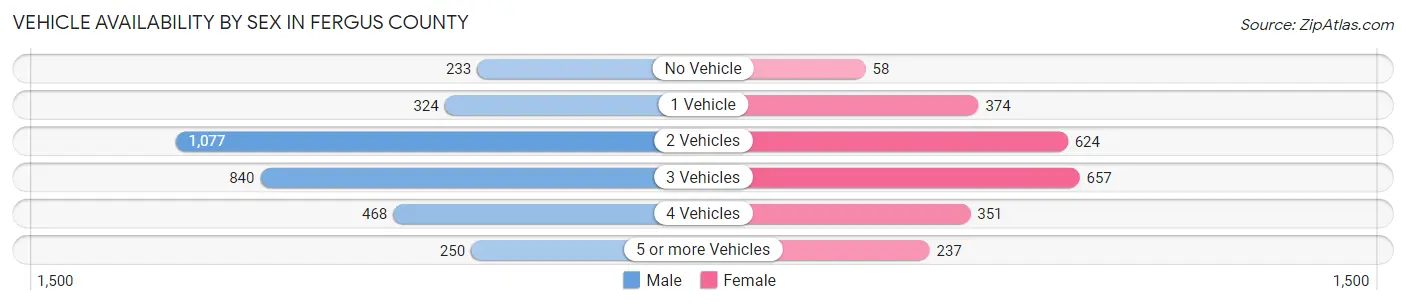
| Vehicles Available | Male | Female |
| No Vehicle | 233 (7.3%) | 58 (2.5%) |
| 1 Vehicle | 324 (10.2%) | 374 (16.3%) |
| 2 Vehicles | 1,077 (33.7%) | 624 (27.1%) |
| 3 Vehicles | 840 (26.3%) | 657 (28.5%) |
| 4 Vehicles | 468 (14.7%) | 351 (15.2%) |
| 5 or more Vehicles | 250 (7.8%) | 237 (10.3%) |
| Total | 3,192 (100.0%) | 2,301 (100.0%) |
Commute Time in Fergus County
The most frequently occuring commute durations in Fergus County are 5 to 9 minutes (1,310 commuters, 28.3%), less than 5 minutes (694 commuters, 15.0%), and 10 to 14 minutes (680 commuters, 14.7%).
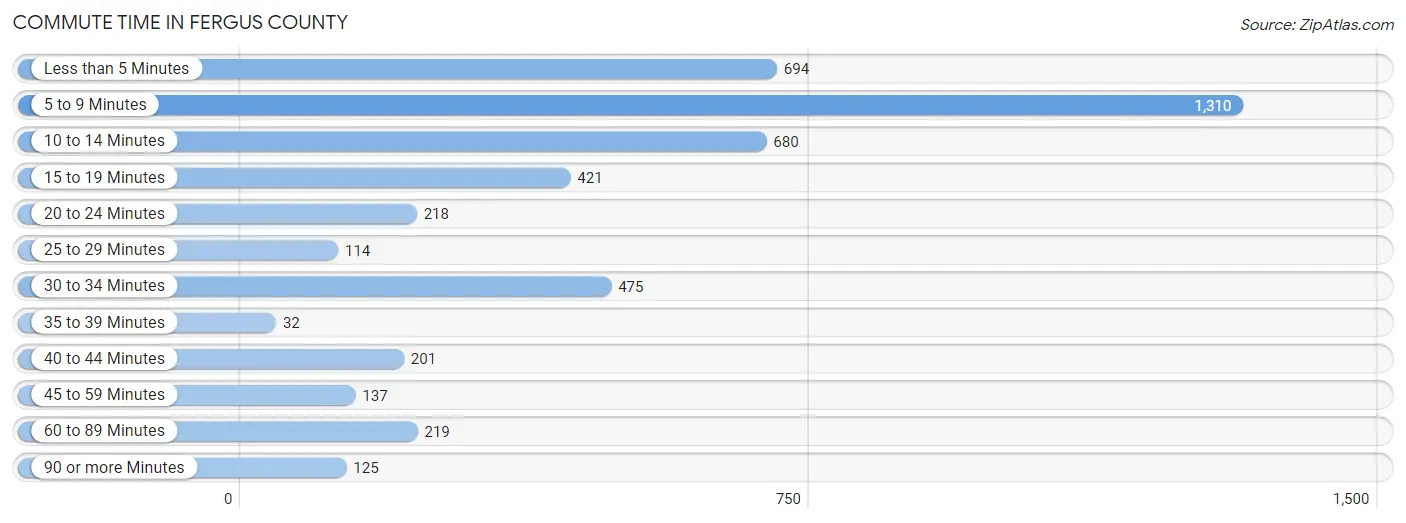
| Commute Time | # Commuters | % Commuters |
| Less than 5 Minutes | 694 | 15.0% |
| 5 to 9 Minutes | 1,310 | 28.3% |
| 10 to 14 Minutes | 680 | 14.7% |
| 15 to 19 Minutes | 421 | 9.1% |
| 20 to 24 Minutes | 218 | 4.7% |
| 25 to 29 Minutes | 114 | 2.5% |
| 30 to 34 Minutes | 475 | 10.3% |
| 35 to 39 Minutes | 32 | 0.7% |
| 40 to 44 Minutes | 201 | 4.3% |
| 45 to 59 Minutes | 137 | 3.0% |
| 60 to 89 Minutes | 219 | 4.7% |
| 90 or more Minutes | 125 | 2.7% |
Commute Time by Sex in Fergus County
The most common commute times in Fergus County are 5 to 9 minutes (676 commuters, 26.3%) for males and 5 to 9 minutes (634 commuters, 30.8%) for females.
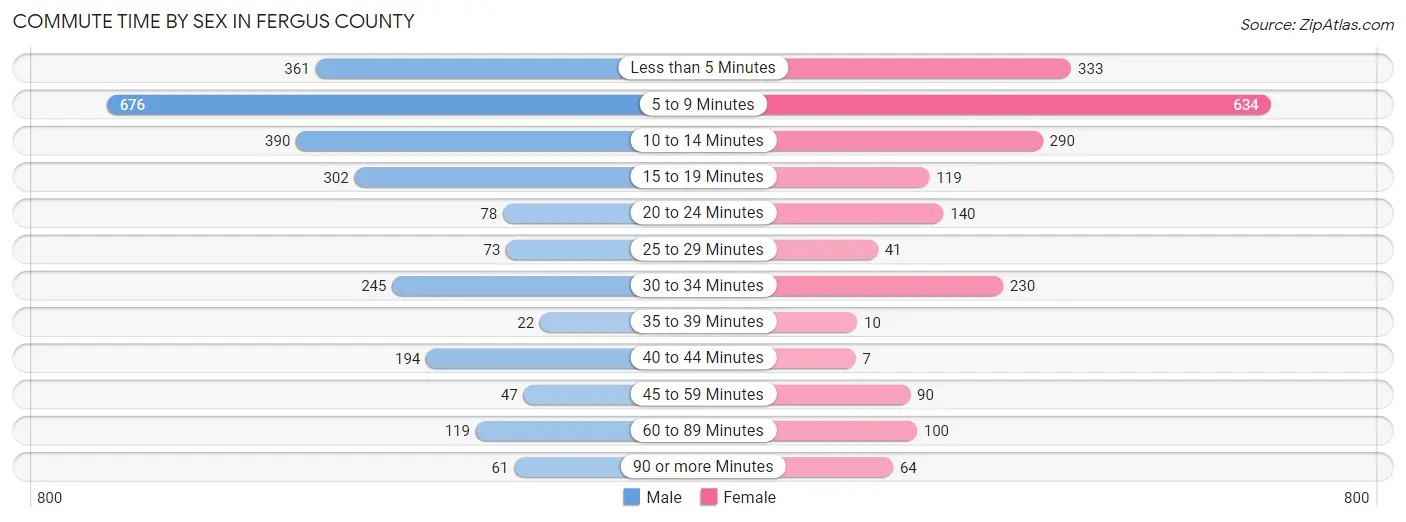
| Commute Time | Male | Female |
| Less than 5 Minutes | 361 (14.1%) | 333 (16.2%) |
| 5 to 9 Minutes | 676 (26.3%) | 634 (30.8%) |
| 10 to 14 Minutes | 390 (15.2%) | 290 (14.1%) |
| 15 to 19 Minutes | 302 (11.8%) | 119 (5.8%) |
| 20 to 24 Minutes | 78 (3.0%) | 140 (6.8%) |
| 25 to 29 Minutes | 73 (2.8%) | 41 (2.0%) |
| 30 to 34 Minutes | 245 (9.5%) | 230 (11.2%) |
| 35 to 39 Minutes | 22 (0.9%) | 10 (0.5%) |
| 40 to 44 Minutes | 194 (7.5%) | 7 (0.3%) |
| 45 to 59 Minutes | 47 (1.8%) | 90 (4.4%) |
| 60 to 89 Minutes | 119 (4.6%) | 100 (4.9%) |
| 90 or more Minutes | 61 (2.4%) | 64 (3.1%) |
Time of Departure to Work by Sex in Fergus County
The most frequent times of departure to work in Fergus County are 6:30 AM to 6:59 AM (604, 23.5%) for males and 7:30 AM to 7:59 AM (587, 28.5%) for females.
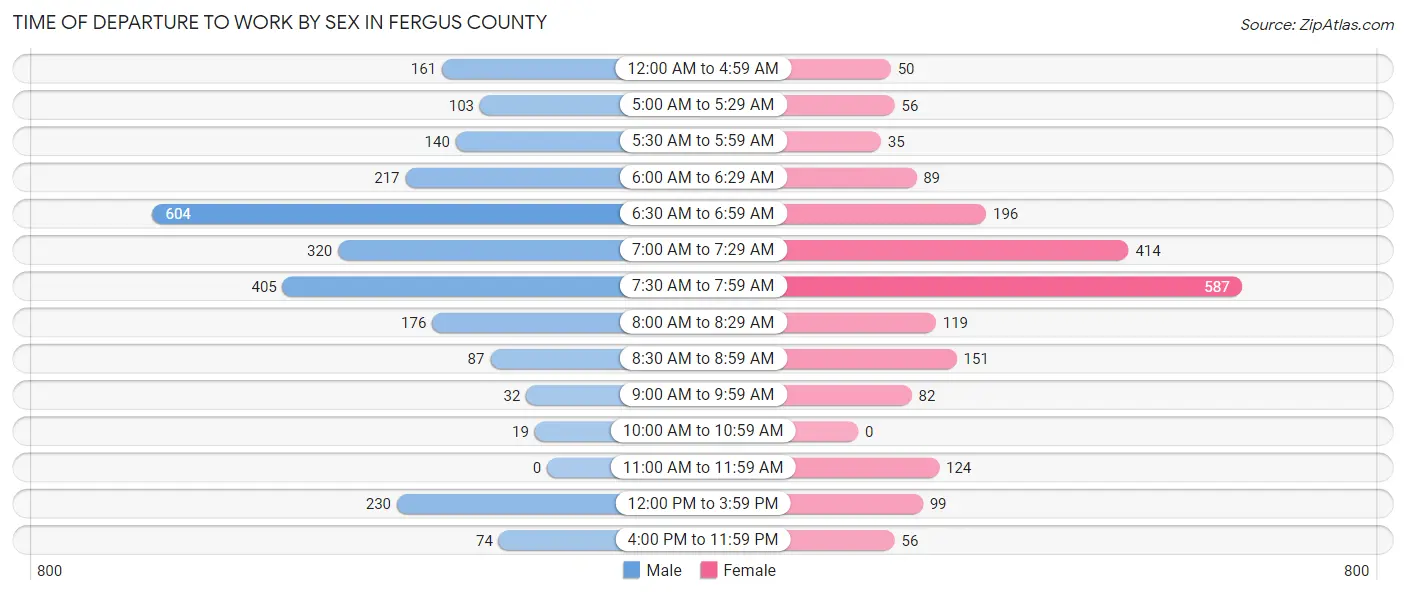
| Time of Departure | Male | Female |
| 12:00 AM to 4:59 AM | 161 (6.3%) | 50 (2.4%) |
| 5:00 AM to 5:29 AM | 103 (4.0%) | 56 (2.7%) |
| 5:30 AM to 5:59 AM | 140 (5.4%) | 35 (1.7%) |
| 6:00 AM to 6:29 AM | 217 (8.5%) | 89 (4.3%) |
| 6:30 AM to 6:59 AM | 604 (23.5%) | 196 (9.5%) |
| 7:00 AM to 7:29 AM | 320 (12.5%) | 414 (20.1%) |
| 7:30 AM to 7:59 AM | 405 (15.8%) | 587 (28.5%) |
| 8:00 AM to 8:29 AM | 176 (6.9%) | 119 (5.8%) |
| 8:30 AM to 8:59 AM | 87 (3.4%) | 151 (7.3%) |
| 9:00 AM to 9:59 AM | 32 (1.3%) | 82 (4.0%) |
| 10:00 AM to 10:59 AM | 19 (0.7%) | 0 (0.0%) |
| 11:00 AM to 11:59 AM | 0 (0.0%) | 124 (6.0%) |
| 12:00 PM to 3:59 PM | 230 (9.0%) | 99 (4.8%) |
| 4:00 PM to 11:59 PM | 74 (2.9%) | 56 (2.7%) |
| Total | 2,568 (100.0%) | 2,058 (100.0%) |
Housing Occupancy in Fergus County
Occupancy by Ownership in Fergus County
Of the total 5,186 dwellings in Fergus County, owner-occupied units account for 3,492 (67.3%), while renter-occupied units make up 1,694 (32.7%).
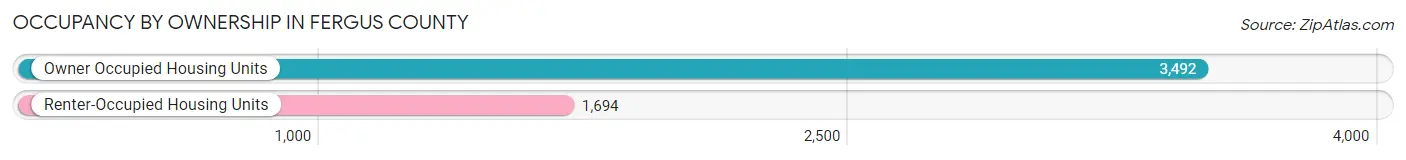
| Occupancy | # Housing Units | % Housing Units |
| Owner Occupied Housing Units | 3,492 | 67.3% |
| Renter-Occupied Housing Units | 1,694 | 32.7% |
| Total Occupied Housing Units | 5,186 | 100.0% |
Occupancy by Household Size in Fergus County
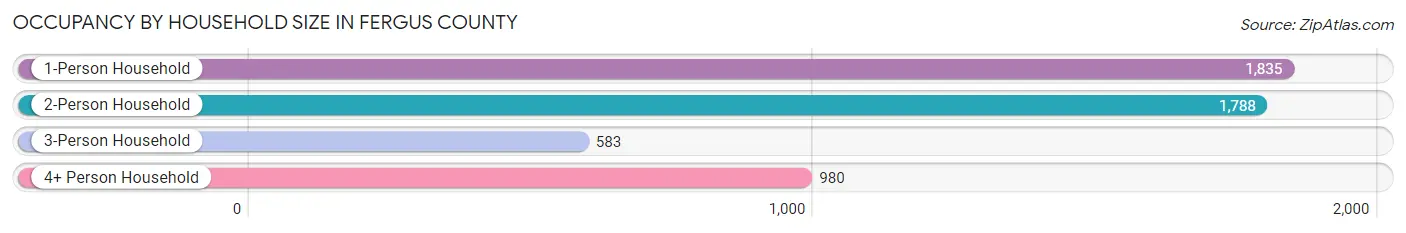
| Household Size | # Housing Units | % Housing Units |
| 1-Person Household | 1,835 | 35.4% |
| 2-Person Household | 1,788 | 34.5% |
| 3-Person Household | 583 | 11.2% |
| 4+ Person Household | 980 | 18.9% |
| Total Housing Units | 5,186 | 100.0% |
Occupancy by Ownership by Household Size in Fergus County
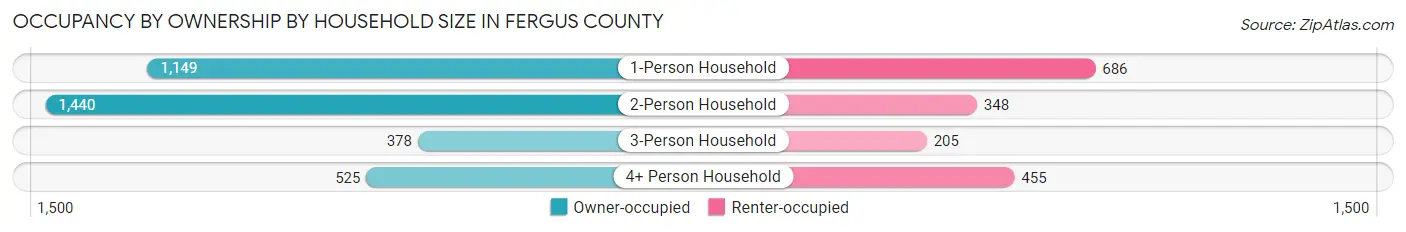
| Household Size | Owner-occupied | Renter-occupied |
| 1-Person Household | 1,149 (62.6%) | 686 (37.4%) |
| 2-Person Household | 1,440 (80.5%) | 348 (19.5%) |
| 3-Person Household | 378 (64.8%) | 205 (35.2%) |
| 4+ Person Household | 525 (53.6%) | 455 (46.4%) |
| Total Housing Units | 3,492 (67.3%) | 1,694 (32.7%) |
Occupancy by Educational Attainment in Fergus County
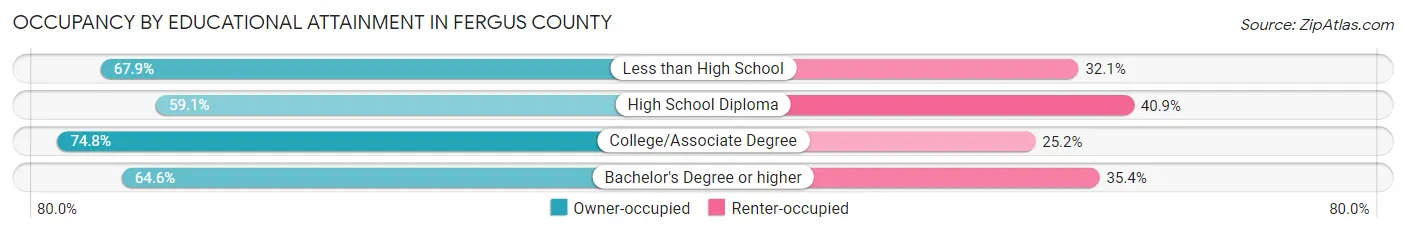
| Household Size | Owner-occupied | Renter-occupied |
| Less than High School | 127 (67.9%) | 60 (32.1%) |
| High School Diploma | 803 (59.1%) | 555 (40.9%) |
| College/Associate Degree | 1,549 (74.8%) | 523 (25.2%) |
| Bachelor's Degree or higher | 1,013 (64.6%) | 556 (35.4%) |
Occupancy by Age of Householder in Fergus County
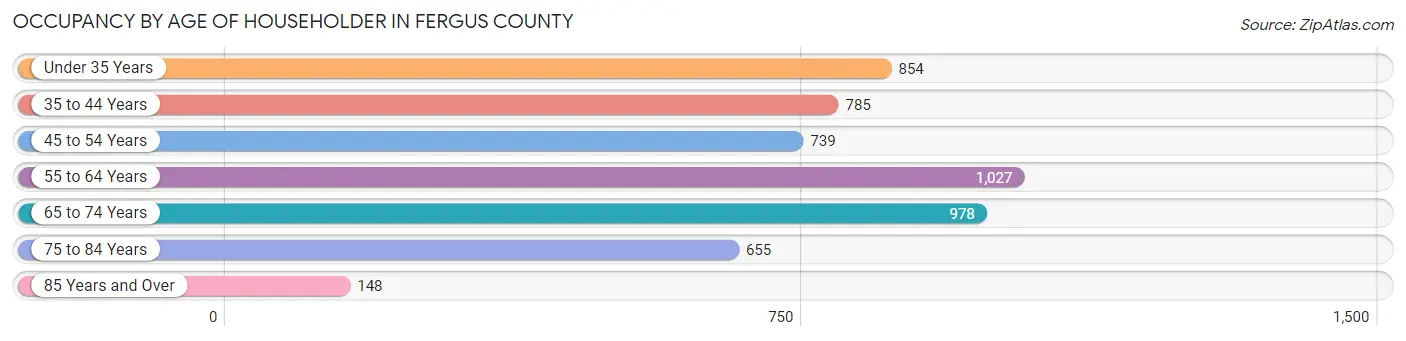
| Age Bracket | # Households | % Households |
| Under 35 Years | 854 | 16.5% |
| 35 to 44 Years | 785 | 15.1% |
| 45 to 54 Years | 739 | 14.2% |
| 55 to 64 Years | 1,027 | 19.8% |
| 65 to 74 Years | 978 | 18.9% |
| 75 to 84 Years | 655 | 12.6% |
| 85 Years and Over | 148 | 2.9% |
| Total | 5,186 | 100.0% |
Housing Finances in Fergus County
Median Income by Occupancy in Fergus County
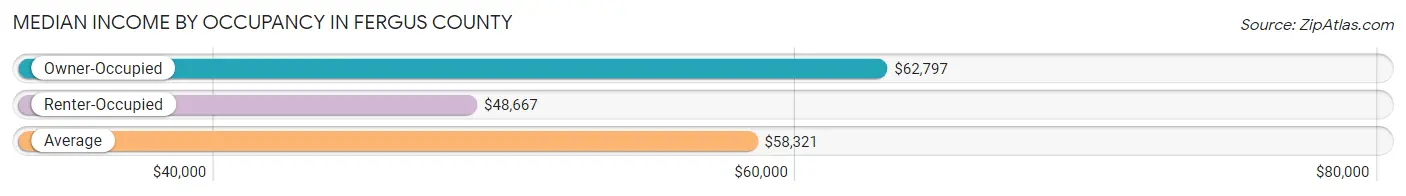
| Occupancy Type | # Households | Median Income |
| Owner-Occupied | 3,492 (67.3%) | $62,797 |
| Renter-Occupied | 1,694 (32.7%) | $48,667 |
| Average | 5,186 (100.0%) | $58,321 |
Occupancy by Householder Income Bracket in Fergus County
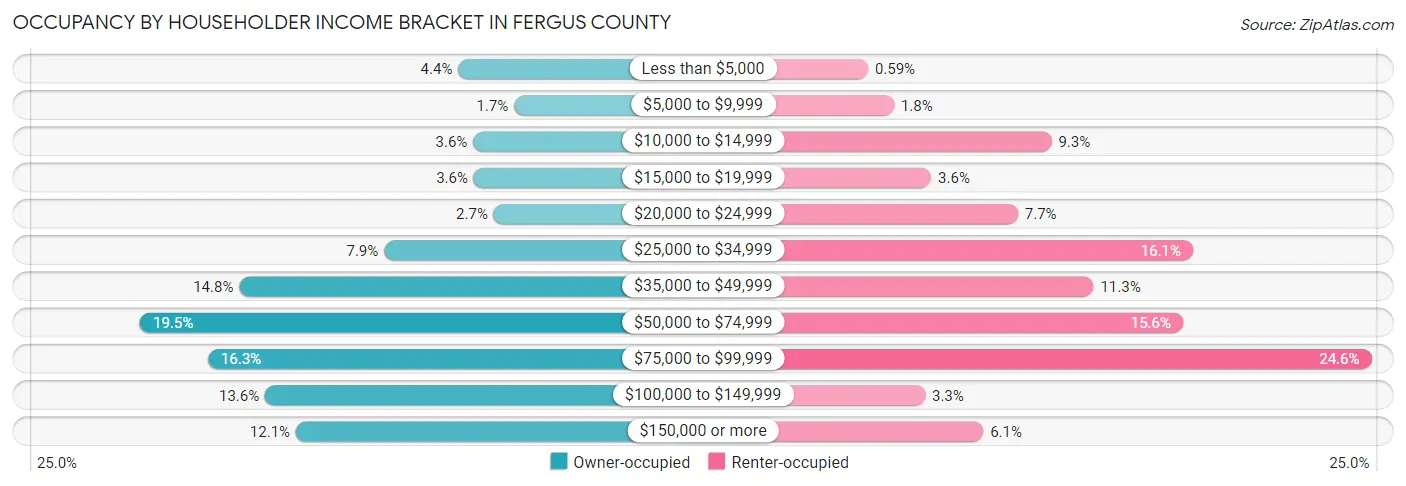
| Income Bracket | Owner-occupied | Renter-occupied |
| Less than $5,000 | 152 (4.3%) | 10 (0.6%) |
| $5,000 to $9,999 | 59 (1.7%) | 31 (1.8%) |
| $10,000 to $14,999 | 127 (3.6%) | 158 (9.3%) |
| $15,000 to $19,999 | 126 (3.6%) | 61 (3.6%) |
| $20,000 to $24,999 | 93 (2.7%) | 131 (7.7%) |
| $25,000 to $34,999 | 275 (7.9%) | 272 (16.1%) |
| $35,000 to $49,999 | 516 (14.8%) | 192 (11.3%) |
| $50,000 to $74,999 | 681 (19.5%) | 264 (15.6%) |
| $75,000 to $99,999 | 568 (16.3%) | 416 (24.6%) |
| $100,000 to $149,999 | 473 (13.6%) | 56 (3.3%) |
| $150,000 or more | 422 (12.1%) | 103 (6.1%) |
| Total | 3,492 (100.0%) | 1,694 (100.0%) |
Monthly Housing Cost Tiers in Fergus County
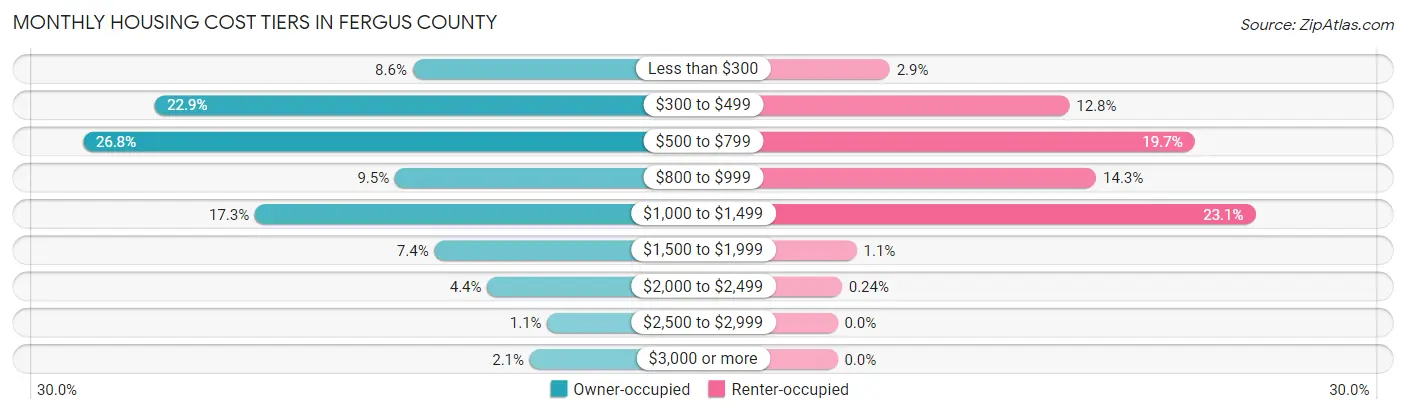
| Monthly Cost | Owner-occupied | Renter-occupied |
| Less than $300 | 299 (8.6%) | 49 (2.9%) |
| $300 to $499 | 798 (22.9%) | 217 (12.8%) |
| $500 to $799 | 935 (26.8%) | 334 (19.7%) |
| $800 to $999 | 333 (9.5%) | 242 (14.3%) |
| $1,000 to $1,499 | 603 (17.3%) | 391 (23.1%) |
| $1,500 to $1,999 | 257 (7.4%) | 18 (1.1%) |
| $2,000 to $2,499 | 155 (4.4%) | 4 (0.2%) |
| $2,500 to $2,999 | 39 (1.1%) | 0 (0.0%) |
| $3,000 or more | 73 (2.1%) | 0 (0.0%) |
| Total | 3,492 (100.0%) | 1,694 (100.0%) |
Physical Housing Characteristics in Fergus County
Housing Structures in Fergus County
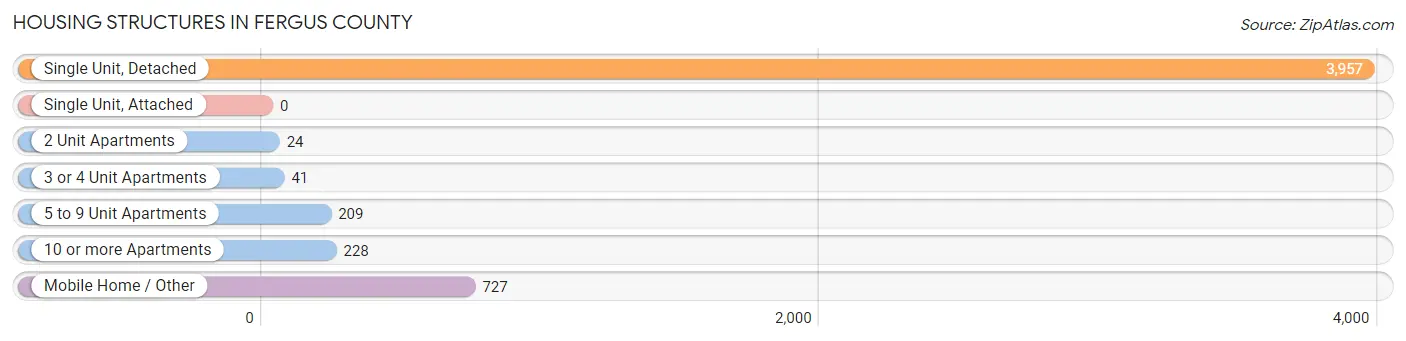
| Structure Type | # Housing Units | % Housing Units |
| Single Unit, Detached | 3,957 | 76.3% |
| Single Unit, Attached | 0 | 0.0% |
| 2 Unit Apartments | 24 | 0.5% |
| 3 or 4 Unit Apartments | 41 | 0.8% |
| 5 to 9 Unit Apartments | 209 | 4.0% |
| 10 or more Apartments | 228 | 4.4% |
| Mobile Home / Other | 727 | 14.0% |
| Total | 5,186 | 100.0% |
Housing Structures by Occupancy in Fergus County
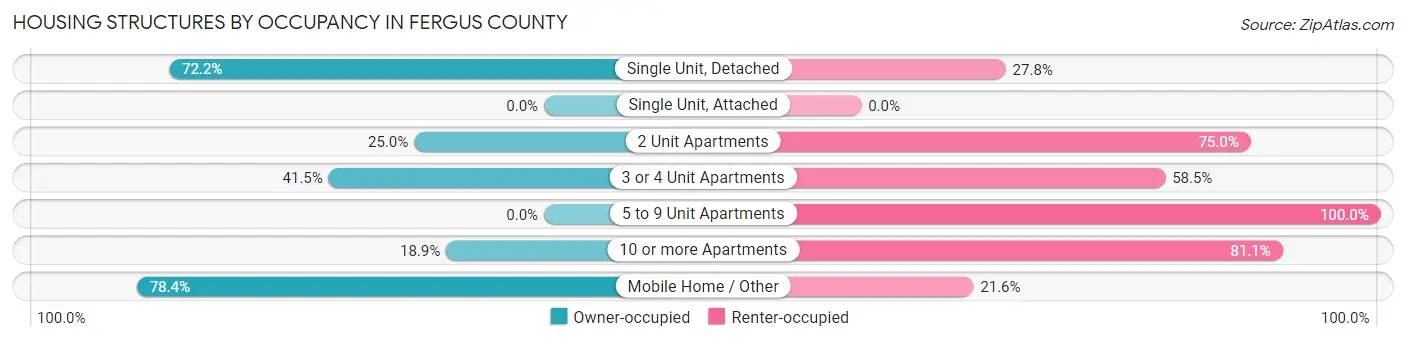
| Structure Type | Owner-occupied | Renter-occupied |
| Single Unit, Detached | 2,856 (72.2%) | 1,101 (27.8%) |
| Single Unit, Attached | 0 (0.0%) | 0 (0.0%) |
| 2 Unit Apartments | 6 (25.0%) | 18 (75.0%) |
| 3 or 4 Unit Apartments | 17 (41.5%) | 24 (58.5%) |
| 5 to 9 Unit Apartments | 0 (0.0%) | 209 (100.0%) |
| 10 or more Apartments | 43 (18.9%) | 185 (81.1%) |
| Mobile Home / Other | 570 (78.4%) | 157 (21.6%) |
| Total | 3,492 (67.3%) | 1,694 (32.7%) |
Housing Structures by Number of Rooms in Fergus County
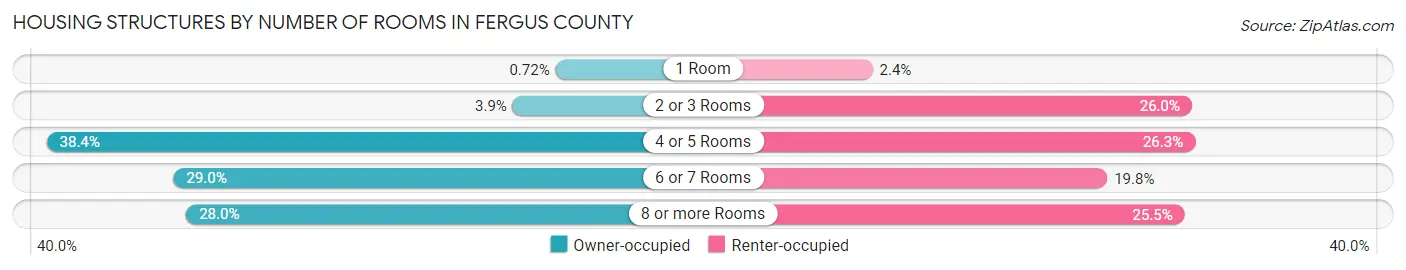
| Number of Rooms | Owner-occupied | Renter-occupied |
| 1 Room | 25 (0.7%) | 41 (2.4%) |
| 2 or 3 Rooms | 136 (3.9%) | 441 (26.0%) |
| 4 or 5 Rooms | 1,340 (38.4%) | 445 (26.3%) |
| 6 or 7 Rooms | 1,012 (29.0%) | 335 (19.8%) |
| 8 or more Rooms | 979 (28.0%) | 432 (25.5%) |
| Total | 3,492 (100.0%) | 1,694 (100.0%) |
Housing Structure by Heating Type in Fergus County
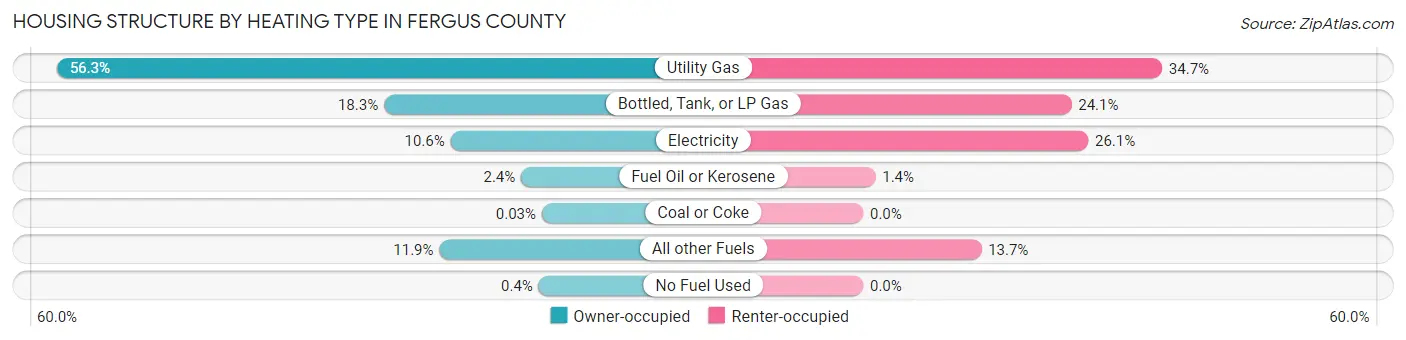
| Heating Type | Owner-occupied | Renter-occupied |
| Utility Gas | 1,965 (56.3%) | 587 (34.6%) |
| Bottled, Tank, or LP Gas | 640 (18.3%) | 409 (24.1%) |
| Electricity | 371 (10.6%) | 442 (26.1%) |
| Fuel Oil or Kerosene | 85 (2.4%) | 24 (1.4%) |
| Coal or Coke | 1 (0.0%) | 0 (0.0%) |
| All other Fuels | 416 (11.9%) | 232 (13.7%) |
| No Fuel Used | 14 (0.4%) | 0 (0.0%) |
| Total | 3,492 (100.0%) | 1,694 (100.0%) |
Household Vehicle Usage in Fergus County
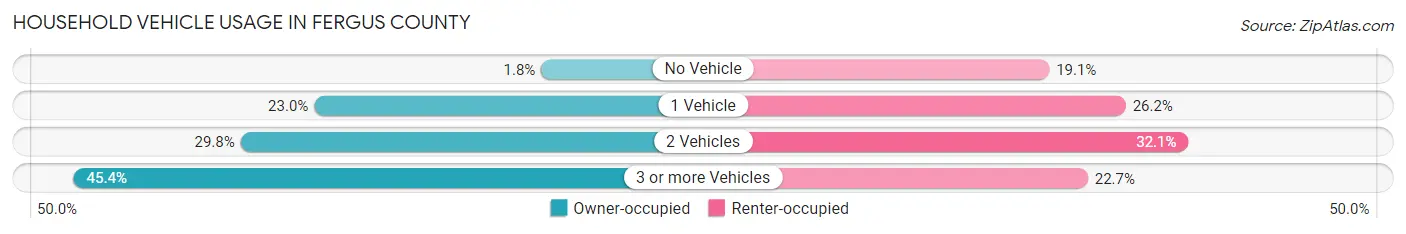
| Vehicles per Household | Owner-occupied | Renter-occupied |
| No Vehicle | 62 (1.8%) | 323 (19.1%) |
| 1 Vehicle | 802 (23.0%) | 444 (26.2%) |
| 2 Vehicles | 1,042 (29.8%) | 543 (32.1%) |
| 3 or more Vehicles | 1,586 (45.4%) | 384 (22.7%) |
| Total | 3,492 (100.0%) | 1,694 (100.0%) |
Real Estate & Mortgages in Fergus County
Real Estate and Mortgage Overview in Fergus County
| Characteristic | Without Mortgage | With Mortgage |
| Housing Units | 2,075 | 1,417 |
| Median Property Value | $156,100 | $196,300 |
| Median Household Income | $55,924 | $204 |
| Monthly Housing Costs | $487 | $62 |
| Real Estate Taxes | $1,310 | $13 |
Property Value by Mortgage Status in Fergus County
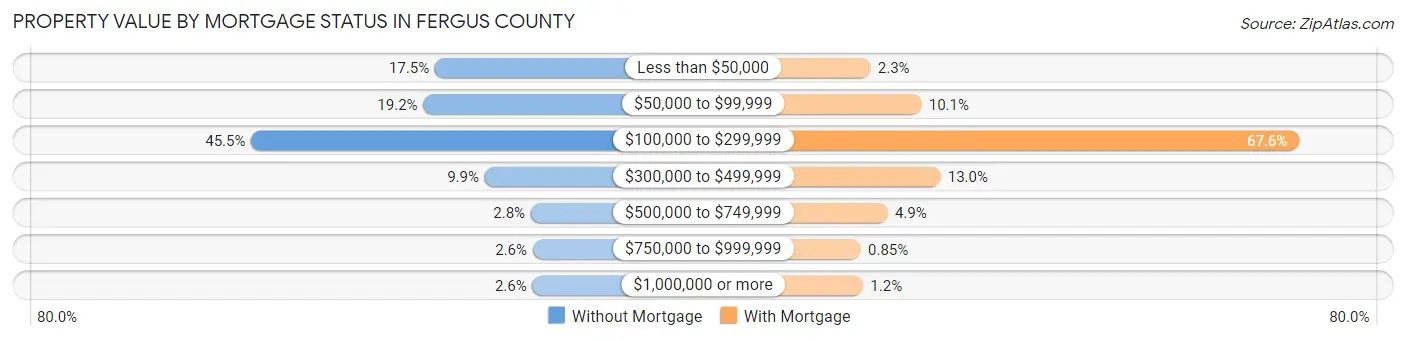
| Property Value | Without Mortgage | With Mortgage |
| Less than $50,000 | 362 (17.4%) | 33 (2.3%) |
| $50,000 to $99,999 | 399 (19.2%) | 143 (10.1%) |
| $100,000 to $299,999 | 943 (45.5%) | 958 (67.6%) |
| $300,000 to $499,999 | 205 (9.9%) | 184 (13.0%) |
| $500,000 to $749,999 | 59 (2.8%) | 70 (4.9%) |
| $750,000 to $999,999 | 53 (2.5%) | 12 (0.9%) |
| $1,000,000 or more | 54 (2.6%) | 17 (1.2%) |
| Total | 2,075 (100.0%) | 1,417 (100.0%) |
Household Income by Mortgage Status in Fergus County
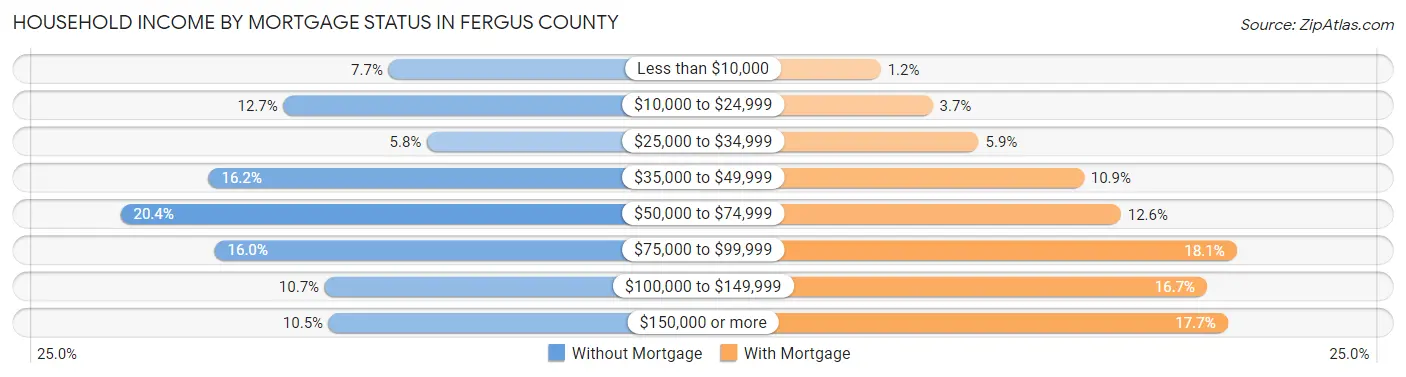
| Household Income | Without Mortgage | With Mortgage |
| Less than $10,000 | 159 (7.7%) | 17 (1.2%) |
| $10,000 to $24,999 | 263 (12.7%) | 52 (3.7%) |
| $25,000 to $34,999 | 121 (5.8%) | 83 (5.9%) |
| $35,000 to $49,999 | 337 (16.2%) | 154 (10.9%) |
| $50,000 to $74,999 | 424 (20.4%) | 179 (12.6%) |
| $75,000 to $99,999 | 331 (16.0%) | 257 (18.1%) |
| $100,000 to $149,999 | 222 (10.7%) | 237 (16.7%) |
| $150,000 or more | 218 (10.5%) | 251 (17.7%) |
| Total | 2,075 (100.0%) | 1,417 (100.0%) |
Property Value to Household Income Ratio in Fergus County
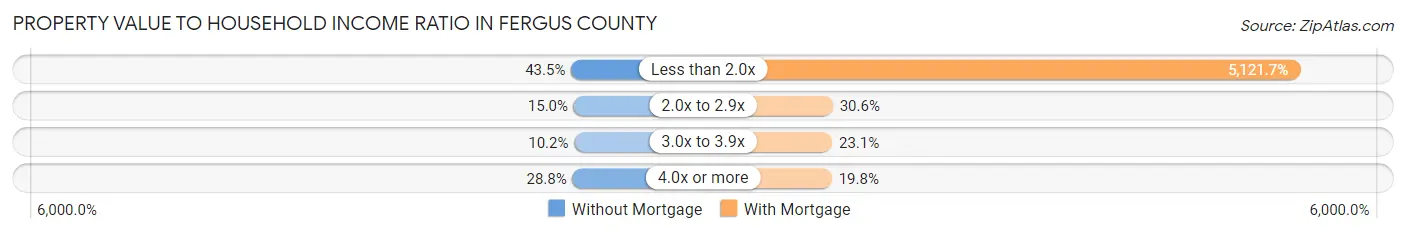
| Value-to-Income Ratio | Without Mortgage | With Mortgage |
| Less than 2.0x | 902 (43.5%) | 72,574 (5,121.7%) |
| 2.0x to 2.9x | 312 (15.0%) | 434 (30.6%) |
| 3.0x to 3.9x | 211 (10.2%) | 327 (23.1%) |
| 4.0x or more | 598 (28.8%) | 281 (19.8%) |
| Total | 2,075 (100.0%) | 1,417 (100.0%) |
Real Estate Taxes by Mortgage Status in Fergus County
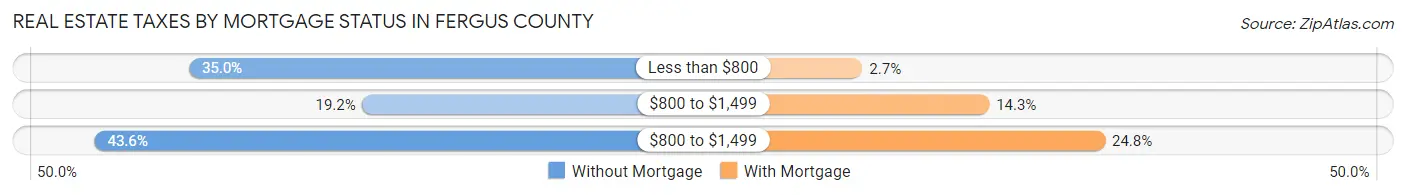
| Property Taxes | Without Mortgage | With Mortgage |
| Less than $800 | 726 (35.0%) | 38 (2.7%) |
| $800 to $1,499 | 399 (19.2%) | 202 (14.3%) |
| $800 to $1,499 | 905 (43.6%) | 352 (24.8%) |
| Total | 2,075 (100.0%) | 1,417 (100.0%) |
Health & Disability in Fergus County
Health Insurance Coverage by Age in Fergus County
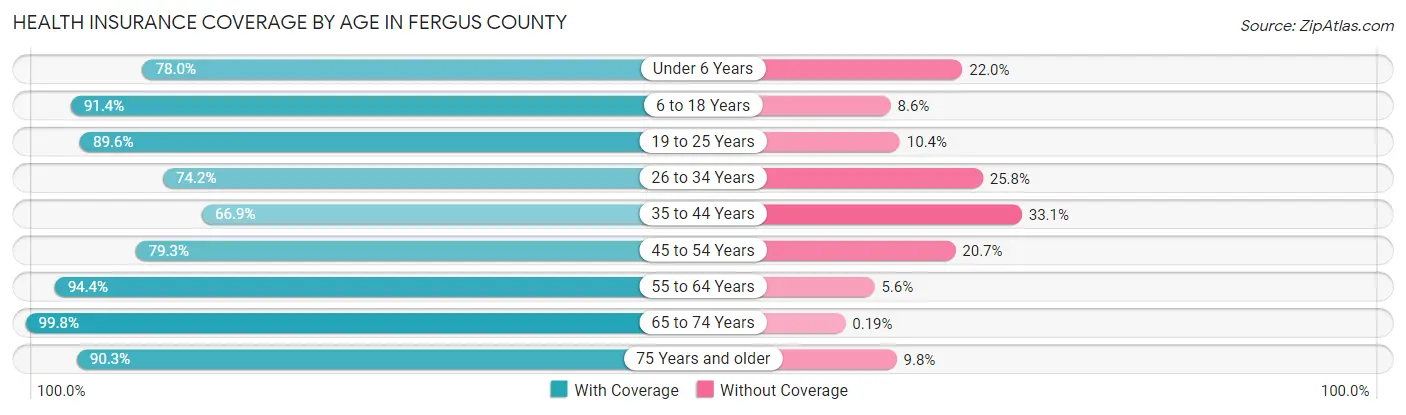
| Age Bracket | With Coverage | Without Coverage |
| Under 6 Years | 524 (78.0%) | 148 (22.0%) |
| 6 to 18 Years | 1,557 (91.4%) | 147 (8.6%) |
| 19 to 25 Years | 597 (89.6%) | 69 (10.4%) |
| 26 to 34 Years | 876 (74.2%) | 305 (25.8%) |
| 35 to 44 Years | 873 (66.9%) | 432 (33.1%) |
| 45 to 54 Years | 1,053 (79.3%) | 275 (20.7%) |
| 55 to 64 Years | 1,561 (94.4%) | 93 (5.6%) |
| 65 to 74 Years | 1,579 (99.8%) | 3 (0.2%) |
| 75 Years and older | 1,028 (90.2%) | 111 (9.8%) |
| Total | 9,648 (85.9%) | 1,583 (14.1%) |
Health Insurance Coverage by Citizenship Status in Fergus County
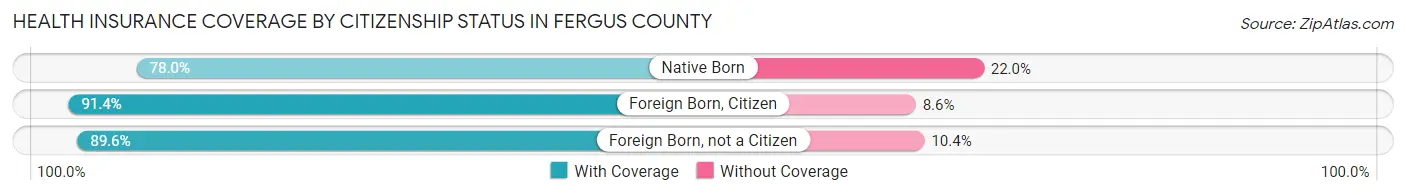
| Citizenship Status | With Coverage | Without Coverage |
| Native Born | 524 (78.0%) | 148 (22.0%) |
| Foreign Born, Citizen | 1,557 (91.4%) | 147 (8.6%) |
| Foreign Born, not a Citizen | 597 (89.6%) | 69 (10.4%) |
Health Insurance Coverage by Household Income in Fergus County
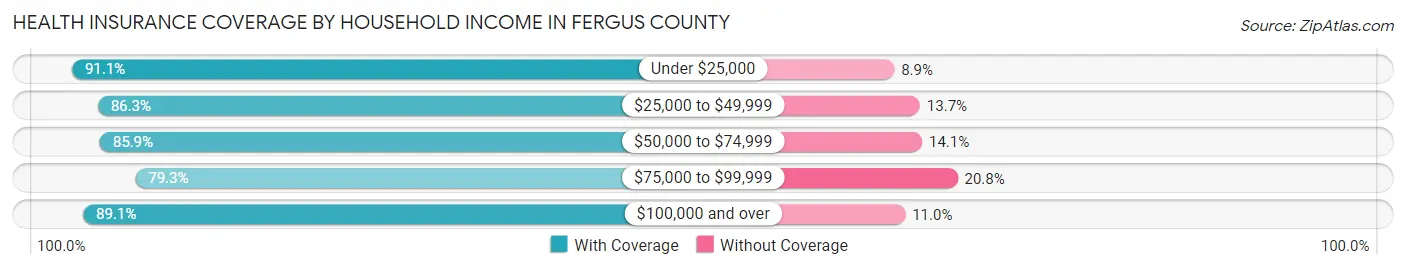
| Household Income | With Coverage | Without Coverage |
| Under $25,000 | 1,314 (91.1%) | 128 (8.9%) |
| $25,000 to $49,999 | 1,801 (86.3%) | 286 (13.7%) |
| $50,000 to $74,999 | 1,950 (85.9%) | 320 (14.1%) |
| $75,000 to $99,999 | 1,894 (79.2%) | 496 (20.7%) |
| $100,000 and over | 2,626 (89.0%) | 323 (11.0%) |
Public vs Private Health Insurance Coverage by Age in Fergus County
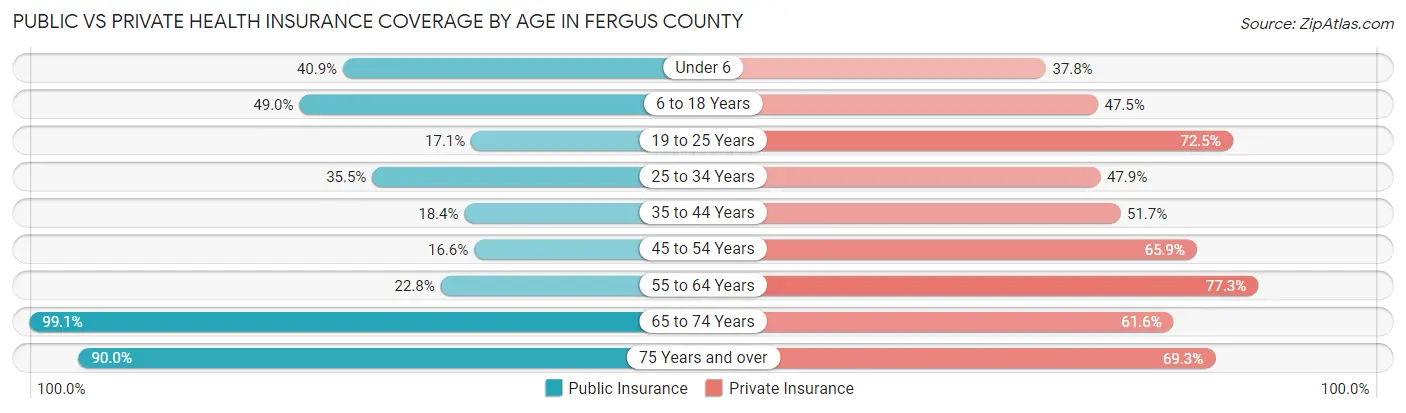
| Age Bracket | Public Insurance | Private Insurance |
| Under 6 | 275 (40.9%) | 254 (37.8%) |
| 6 to 18 Years | 835 (49.0%) | 809 (47.5%) |
| 19 to 25 Years | 114 (17.1%) | 483 (72.5%) |
| 25 to 34 Years | 419 (35.5%) | 566 (47.9%) |
| 35 to 44 Years | 240 (18.4%) | 674 (51.6%) |
| 45 to 54 Years | 220 (16.6%) | 875 (65.9%) |
| 55 to 64 Years | 377 (22.8%) | 1,278 (77.3%) |
| 65 to 74 Years | 1,568 (99.1%) | 974 (61.6%) |
| 75 Years and over | 1,025 (90.0%) | 789 (69.3%) |
| Total | 5,073 (45.2%) | 6,702 (59.7%) |
Disability Status by Sex by Age in Fergus County
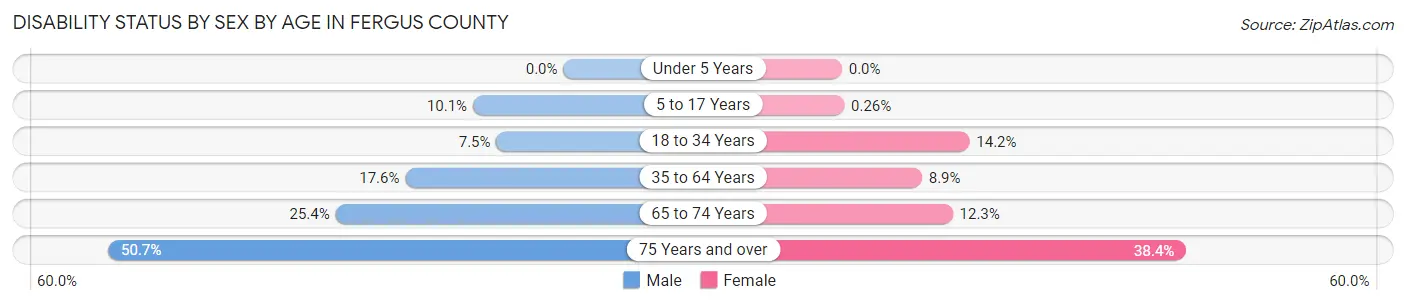
| Age Bracket | Male | Female |
| Under 5 Years | 0 (0.0%) | 0 (0.0%) |
| 5 to 17 Years | 92 (10.1%) | 2 (0.3%) |
| 18 to 34 Years | 76 (7.5%) | 134 (14.2%) |
| 35 to 64 Years | 387 (17.6%) | 186 (8.9%) |
| 65 to 74 Years | 204 (25.4%) | 96 (12.3%) |
| 75 Years and over | 288 (50.7%) | 219 (38.4%) |
Disability Class by Sex by Age in Fergus County
Disability Class: Hearing Difficulty
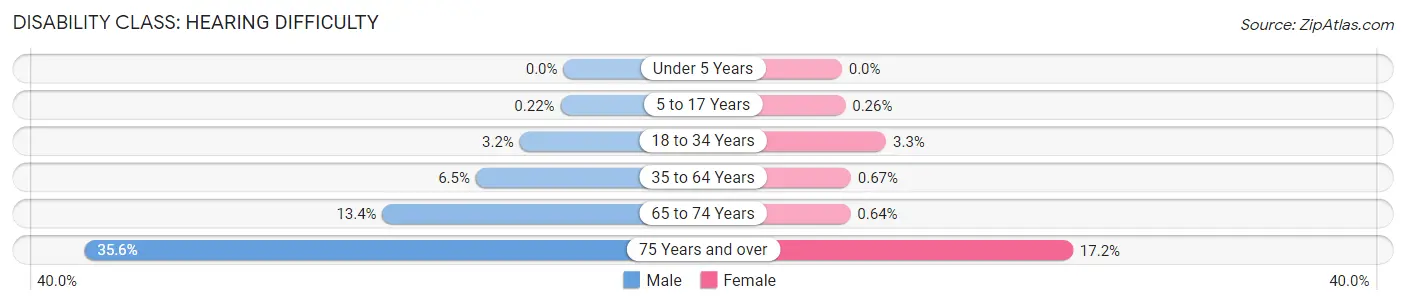
| Age Bracket | Male | Female |
| Under 5 Years | 0 (0.0%) | 0 (0.0%) |
| 5 to 17 Years | 2 (0.2%) | 2 (0.3%) |
| 18 to 34 Years | 33 (3.2%) | 31 (3.3%) |
| 35 to 64 Years | 143 (6.5%) | 14 (0.7%) |
| 65 to 74 Years | 108 (13.4%) | 5 (0.6%) |
| 75 Years and over | 202 (35.6%) | 98 (17.2%) |
Disability Class: Vision Difficulty
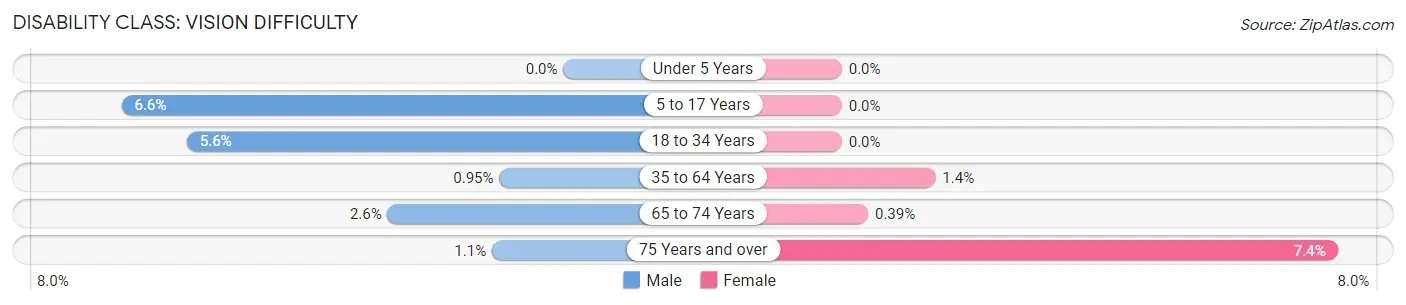
| Age Bracket | Male | Female |
| Under 5 Years | 0 (0.0%) | 0 (0.0%) |
| 5 to 17 Years | 60 (6.6%) | 0 (0.0%) |
| 18 to 34 Years | 57 (5.6%) | 0 (0.0%) |
| 35 to 64 Years | 21 (0.9%) | 29 (1.4%) |
| 65 to 74 Years | 21 (2.6%) | 3 (0.4%) |
| 75 Years and over | 6 (1.1%) | 42 (7.4%) |
Disability Class: Cognitive Difficulty
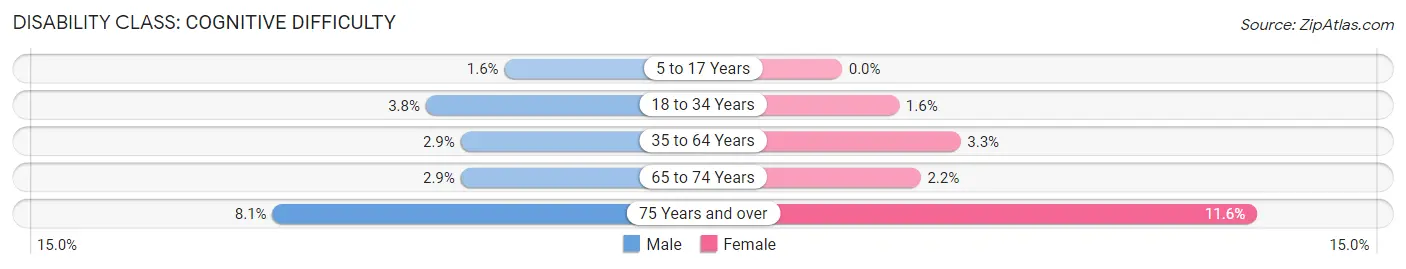
| Age Bracket | Male | Female |
| 5 to 17 Years | 15 (1.6%) | 0 (0.0%) |
| 18 to 34 Years | 39 (3.8%) | 15 (1.6%) |
| 35 to 64 Years | 63 (2.9%) | 69 (3.3%) |
| 65 to 74 Years | 23 (2.9%) | 17 (2.2%) |
| 75 Years and over | 46 (8.1%) | 66 (11.6%) |
Disability Class: Ambulatory Difficulty
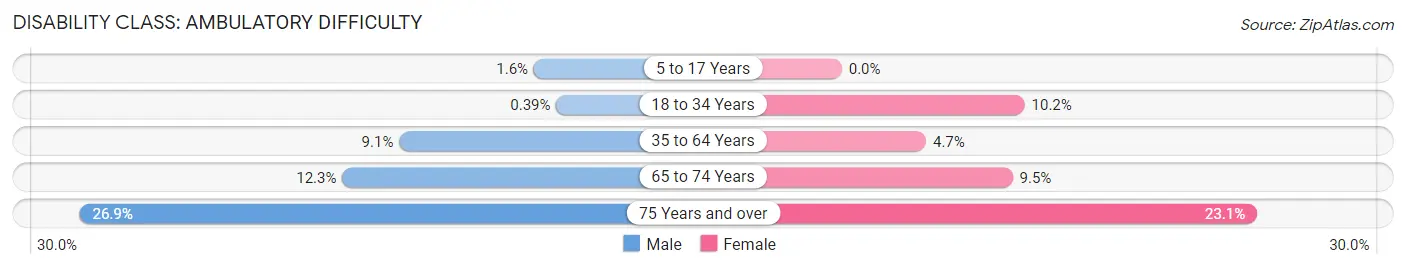
| Age Bracket | Male | Female |
| 5 to 17 Years | 15 (1.6%) | 0 (0.0%) |
| 18 to 34 Years | 4 (0.4%) | 96 (10.2%) |
| 35 to 64 Years | 201 (9.1%) | 98 (4.7%) |
| 65 to 74 Years | 99 (12.3%) | 74 (9.5%) |
| 75 Years and over | 153 (26.9%) | 132 (23.1%) |
Disability Class: Self-Care Difficulty
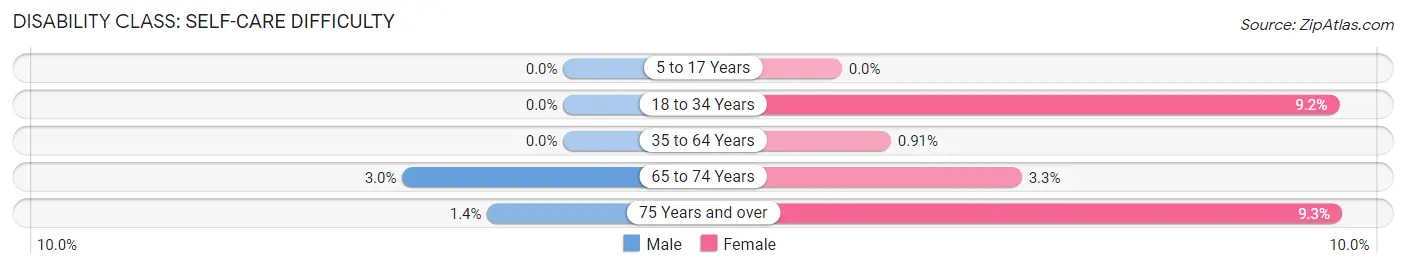
| Age Bracket | Male | Female |
| 5 to 17 Years | 0 (0.0%) | 0 (0.0%) |
| 18 to 34 Years | 0 (0.0%) | 87 (9.2%) |
| 35 to 64 Years | 0 (0.0%) | 19 (0.9%) |
| 65 to 74 Years | 24 (3.0%) | 26 (3.3%) |
| 75 Years and over | 8 (1.4%) | 53 (9.3%) |
Technology Access in Fergus County
Computing Device Access in Fergus County
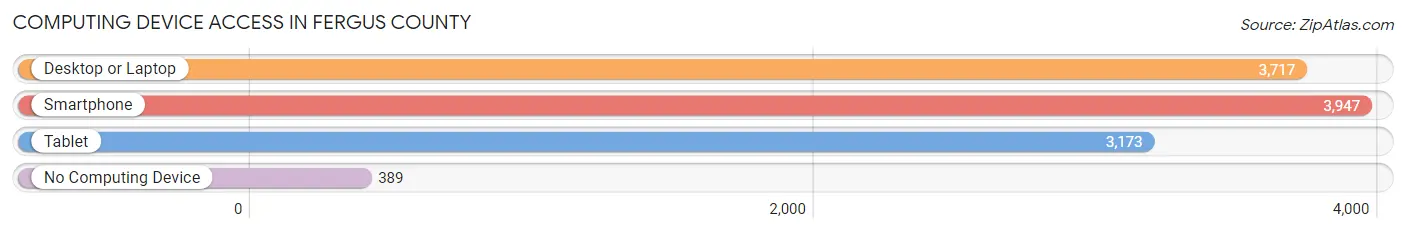
| Device Type | # Households | % Households |
| Desktop or Laptop | 3,717 | 71.7% |
| Smartphone | 3,947 | 76.1% |
| Tablet | 3,173 | 61.2% |
| No Computing Device | 389 | 7.5% |
| Total | 5,186 | 100.0% |
Internet Access in Fergus County
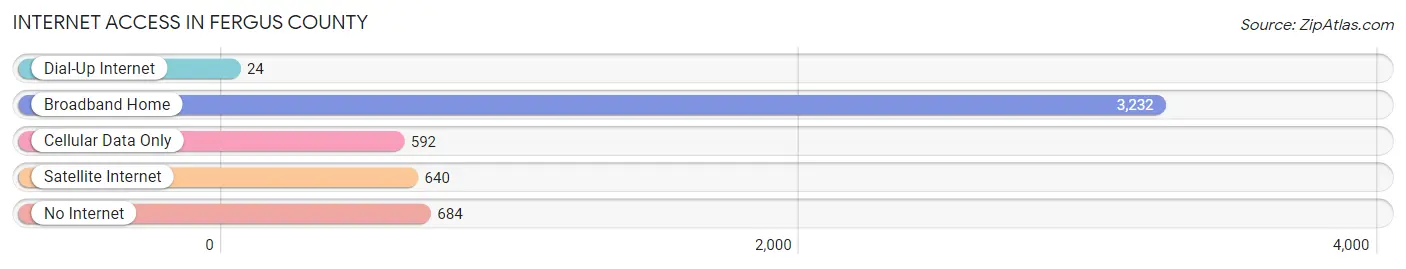
| Internet Type | # Households | % Households |
| Dial-Up Internet | 24 | 0.5% |
| Broadband Home | 3,232 | 62.3% |
| Cellular Data Only | 592 | 11.4% |
| Satellite Internet | 640 | 12.3% |
| No Internet | 684 | 13.2% |
| Total | 5,186 | 100.0% |
Fergus County Summary
Fergus County is located in the central part of Montana, in the United States. It is bordered by Petroleum County to the north, Musselshell County to the east, Wheatland County to the south, and Judith Basin County to the west. The county seat is Lewistown, which is also the largest city in the county. Fergus County covers an area of 2,845 square miles and has a population of 11,486 as of the 2020 census.
History
Fergus County was established in 1885 and named after James Fergus, a prominent Montana pioneer. The county was originally part of Meagher County, which was created in 1867. In 1883, the Montana Territorial Legislature divided Meagher County into two parts, creating Fergus County. The county was officially organized in 1885, and Lewistown was designated as the county seat.
The first settlers in the area were ranchers and farmers, who were attracted by the fertile soil and abundant water. The first permanent settlement in the county was established in 1879, when a group of ranchers and farmers from Iowa and Illinois settled in the Judith Basin. The county quickly grew, and by the early 1900s, it was home to several small towns and communities.
Geography
Fergus County is located in the central part of Montana, in the United States. It is bordered by Petroleum County to the north, Musselshell County to the east, Wheatland County to the south, and Judith Basin County to the west. The county covers an area of 2,845 square miles and has a population of 11,486 as of the 2020 census.
The county is located in the Rocky Mountain region of Montana, and is characterized by rolling hills, grassy plains, and rugged mountains. The highest point in the county is Mount Baldy, which has an elevation of 8,890 feet. The county is home to several rivers, including the Judith River, the Musselshell River, and the Missouri River.
Economy
Fergus County is primarily an agricultural county, with the majority of its economy based on farming and ranching. The county is home to several large cattle ranches, as well as several smaller farms. The county is also home to several oil and gas fields, which provide jobs and revenue for the county.
The county is also home to several manufacturing companies, including a furniture factory, a wood products plant, and a metal fabrication plant. The county is also home to several retail stores, restaurants, and other businesses.
Demographics
As of the 2020 census, Fergus County had a population of 11,486. The racial makeup of the county was 94.3% White, 0.3% African American, 1.2% Native American, 0.3% Asian, 0.1% Pacific Islander, 1.7% from other races, and 2.1% from two or more races. Hispanic or Latino of any race were 4.2% of the population.
The median income for a household in the county was $41,945, and the median income for a family was $50,945. The per capita income for the county was $21,945. About 11.2% of families and 14.3% of the population were below the poverty line, including 18.2% of those under age 18 and 8.2% of those age 65 or over.
Common Questions
What is Per Capita Income in Fergus County?
Per Capita income in Fergus County is $34,932.
What is the Median Family Income in Fergus County?
Median Family Income in Fergus County is $83,279.
What is the Median Household income in Fergus County?
Median Household Income in Fergus County is $58,321.
What is Income or Wage Gap in Fergus County?
Income or Wage Gap in Fergus County is 28.0%.
Women in Fergus County earn 72.0 cents for every dollar earned by a man.
What is Inequality or Gini Index in Fergus County?
Inequality or Gini Index in Fergus County is 0.44.
What is the Total Population of Fergus County?
Total Population of Fergus County is 11,496.
What is the Total Male Population of Fergus County?
Total Male Population of Fergus County is 5,991.
What is the Total Female Population of Fergus County?
Total Female Population of Fergus County is 5,505.
What is the Ratio of Males per 100 Females in Fergus County?
There are 108.83 Males per 100 Females in Fergus County.
What is the Ratio of Females per 100 Males in Fergus County?
There are 91.89 Females per 100 Males in Fergus County.
What is the Median Population Age in Fergus County?
Median Population Age in Fergus County is 46.7 Years.
What is the Average Family Size in Fergus County
Average Family Size in Fergus County is 2.8 People.
What is the Average Household Size in Fergus County
Average Household Size in Fergus County is 2.1 People.
How Large is the Labor Force in Fergus County?
There are 5,770 People in the Labor Forcein in Fergus County.
What is the Percentage of People in the Labor Force in Fergus County?
60.7% of People are in the Labor Force in Fergus County.
What is the Unemployment Rate in Fergus County?
Unemployment Rate in Fergus County is 3.1%.