Anaconda Deer Lodge County, MT Map & Demographics
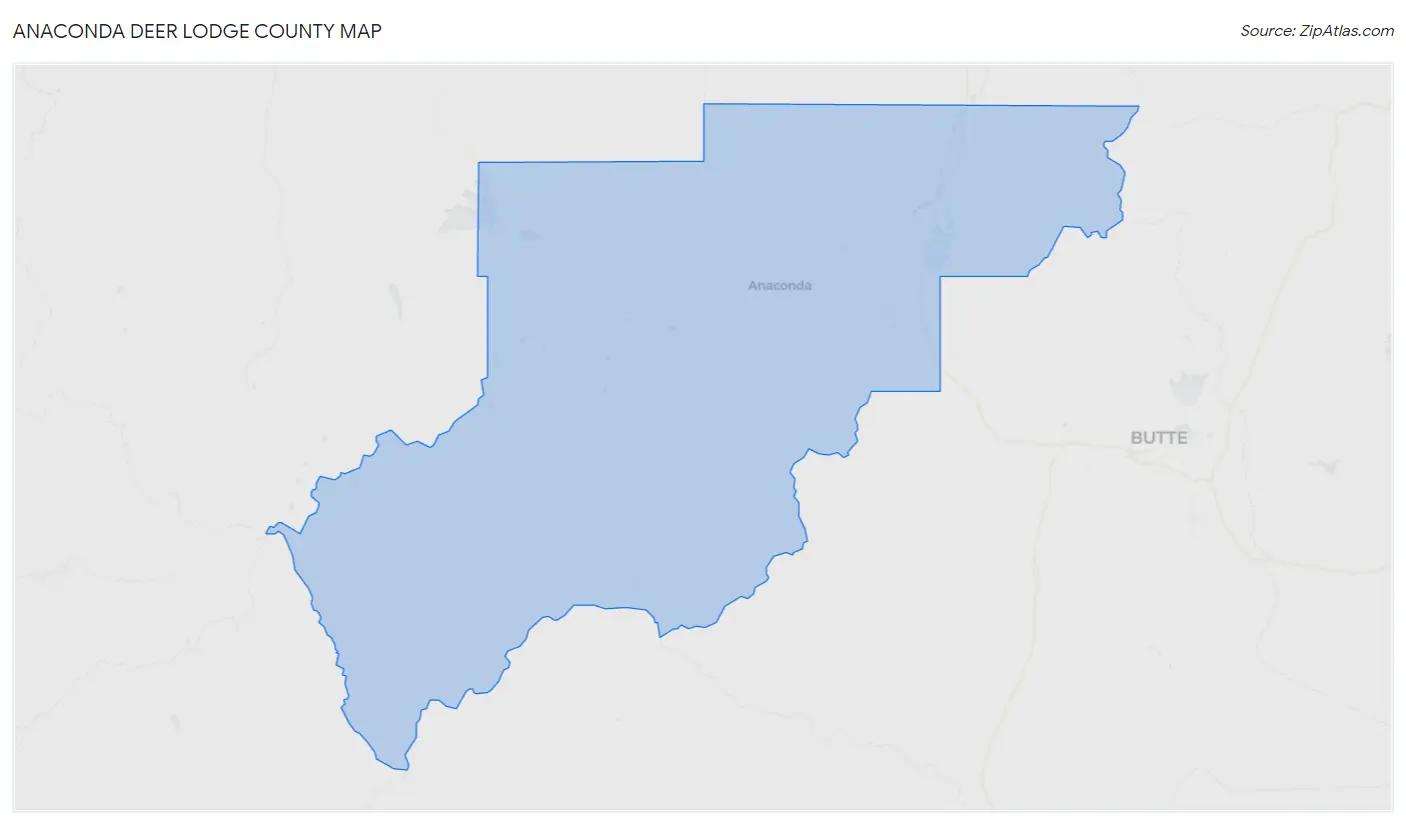
Anaconda Deer Lodge County Map
Anaconda Deer Lodge County Overview
$30,185
PER CAPITA INCOME
$62,575
AVG FAMILY INCOME
$46,436
AVG HOUSEHOLD INCOME
7.2%
WAGE / INCOME GAP [ % ]
92.8¢/ $1
WAGE / INCOME GAP [ $ ]
0.44
INEQUALITY / GINI INDEX
9,435
TOTAL POPULATION
5,072
MALE POPULATION
4,363
FEMALE POPULATION
116.25
MALES / 100 FEMALES
86.02
FEMALES / 100 MALES
49.6
MEDIAN AGE
2.6
AVG FAMILY SIZE
2.0
AVG HOUSEHOLD SIZE
4,369
LABOR FORCE [ PEOPLE ]
51.6%
PERCENT IN LABOR FORCE
3.8%
UNEMPLOYMENT RATE
Income in Anaconda Deer Lodge County
Income Overview in Anaconda Deer Lodge County
Per Capita Income in Anaconda Deer Lodge County is $30,185, while median incomes of families and households are $62,575 and $46,436 respectively.
| Characteristic | Number | Measure |
| Per Capita Income | 9,435 | $30,185 |
| Median Family Income | 2,269 | $62,575 |
| Mean Family Income | 2,269 | $75,025 |
| Median Household Income | 4,336 | $46,436 |
| Mean Household Income | 4,336 | $59,745 |
| Income Deficit | 2,269 | $0 |
| Wage / Income Gap (%) | 9,435 | 7.20% |
| Wage / Income Gap ($) | 9,435 | 92.80¢ per $1 |
| Gini / Inequality Index | 9,435 | 0.44 |
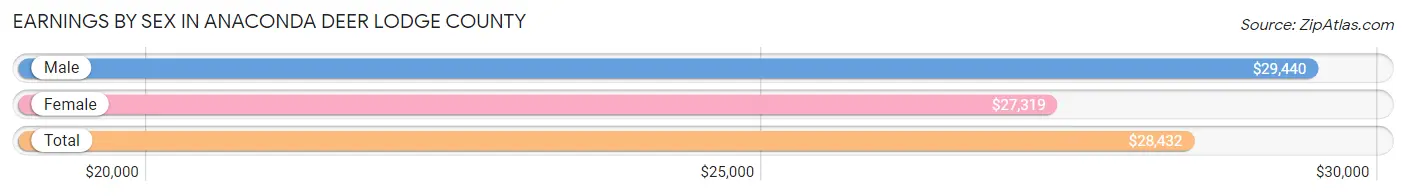
Earnings by Sex in Anaconda Deer Lodge County
Average Earnings in Anaconda Deer Lodge County are $28,432, $29,440 for men and $27,319 for women, a difference of 7.2%.
| Sex | Number | Average Earnings |
| Male | 2,585 (53.8%) | $29,440 |
| Female | 2,220 (46.2%) | $27,319 |
| Total | 4,805 (100.0%) | $28,432 |
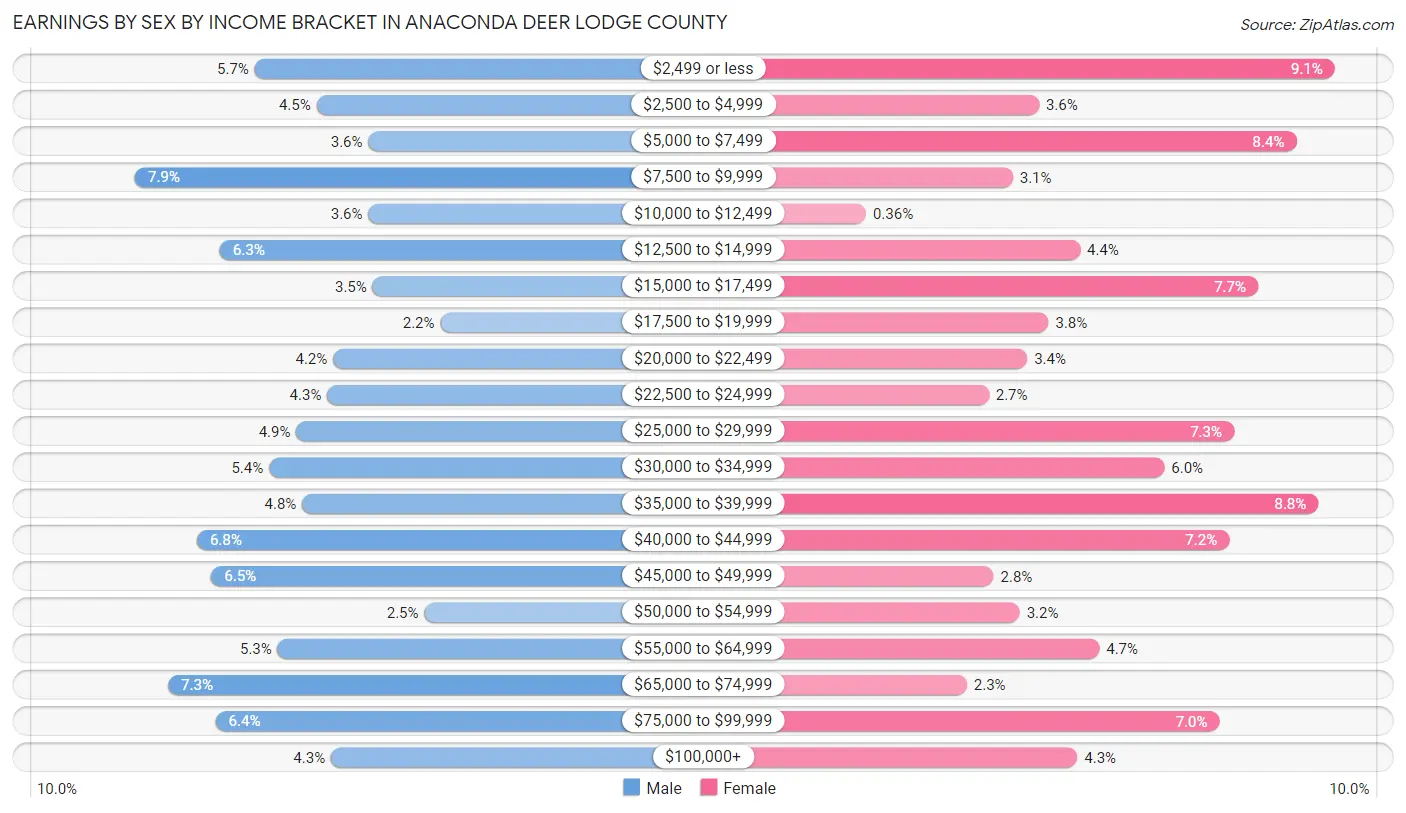
Earnings by Sex by Income Bracket in Anaconda Deer Lodge County
The most common earnings brackets in Anaconda Deer Lodge County are $7,500 to $9,999 for men (205 | 7.9%) and $2,499 or less for women (203 | 9.1%).
| Income | Male | Female |
| $2,499 or less | 147 (5.7%) | 203 (9.1%) |
| $2,500 to $4,999 | 117 (4.5%) | 80 (3.6%) |
| $5,000 to $7,499 | 92 (3.6%) | 187 (8.4%) |
| $7,500 to $9,999 | 205 (7.9%) | 69 (3.1%) |
| $10,000 to $12,499 | 92 (3.6%) | 8 (0.4%) |
| $12,500 to $14,999 | 164 (6.3%) | 97 (4.4%) |
| $15,000 to $17,499 | 90 (3.5%) | 171 (7.7%) |
| $17,500 to $19,999 | 57 (2.2%) | 84 (3.8%) |
| $20,000 to $22,499 | 109 (4.2%) | 75 (3.4%) |
| $22,500 to $24,999 | 112 (4.3%) | 59 (2.7%) |
| $25,000 to $29,999 | 127 (4.9%) | 161 (7.2%) |
| $30,000 to $34,999 | 140 (5.4%) | 132 (5.9%) |
| $35,000 to $39,999 | 124 (4.8%) | 196 (8.8%) |
| $40,000 to $44,999 | 175 (6.8%) | 159 (7.2%) |
| $45,000 to $49,999 | 168 (6.5%) | 61 (2.8%) |
| $50,000 to $54,999 | 65 (2.5%) | 72 (3.2%) |
| $55,000 to $64,999 | 136 (5.3%) | 105 (4.7%) |
| $65,000 to $74,999 | 189 (7.3%) | 50 (2.2%) |
| $75,000 to $99,999 | 166 (6.4%) | 155 (7.0%) |
| $100,000+ | 110 (4.3%) | 96 (4.3%) |
| Total | 2,585 (100.0%) | 2,220 (100.0%) |
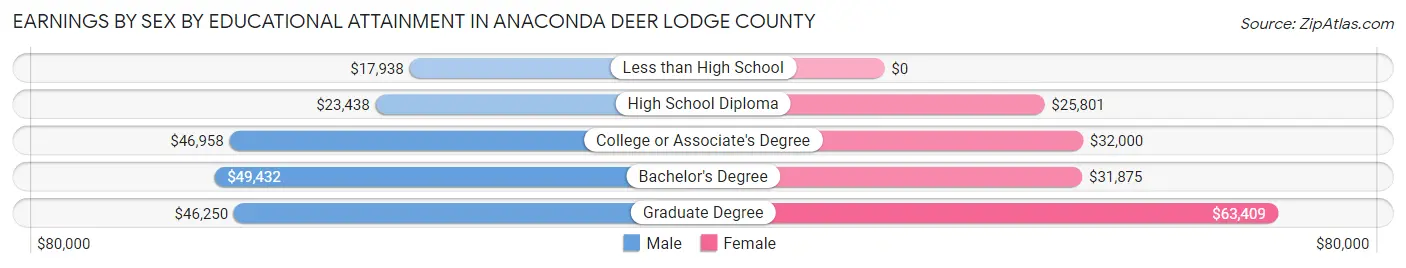
Earnings by Sex by Educational Attainment in Anaconda Deer Lodge County
Average earnings in Anaconda Deer Lodge County are $36,618 for men and $29,712 for women, a difference of 18.9%. Men with an educational attainment of bachelor's degree enjoy the highest average annual earnings of $49,432, while those with less than high school education earn the least with $17,938. Women with an educational attainment of graduate degree earn the most with the average annual earnings of $63,409, while those with high school diploma education have the smallest earnings of $25,801.
| Educational Attainment | Male Income | Female Income |
| Less than High School | $17,938 | $0 |
| High School Diploma | $23,438 | $25,801 |
| College or Associate's Degree | $46,958 | $32,000 |
| Bachelor's Degree | $49,432 | $31,875 |
| Graduate Degree | $46,250 | $63,409 |
| Total | $36,618 | $29,712 |
Family Income in Anaconda Deer Lodge County
Family Income Brackets in Anaconda Deer Lodge County
According to the Anaconda Deer Lodge County family income data, there are 583 families falling into the $50,000 to $74,999 income range, which is the most common income bracket and makes up 25.7% of all families. Conversely, the $200,000+ income bracket is the least frequent group with only 64 families (2.8%) belonging to this category.
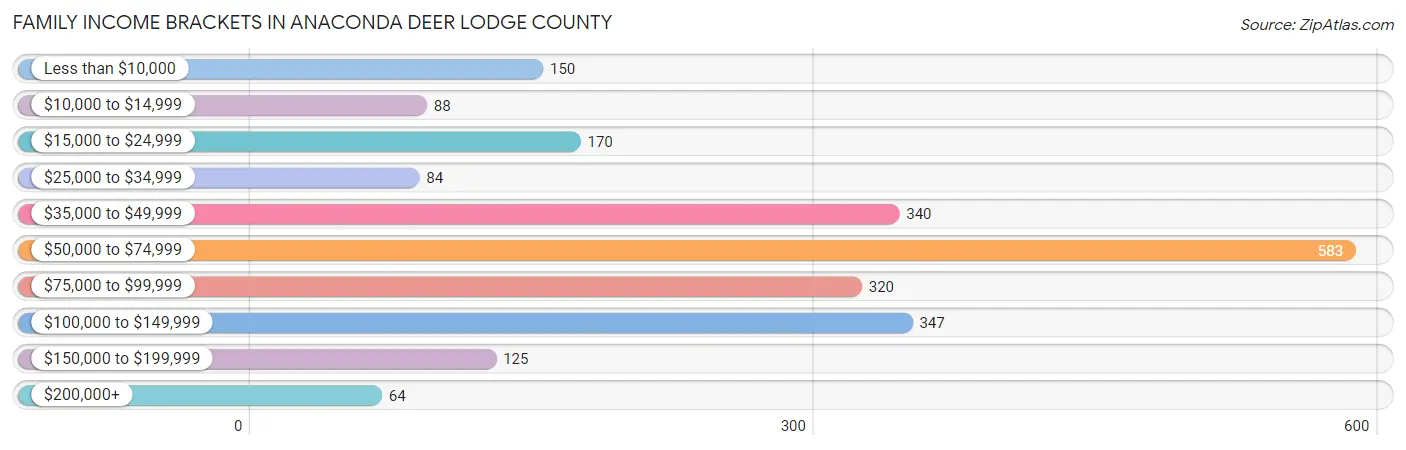
| Income Bracket | # Families | % Families |
| Less than $10,000 | 150 | 6.6% |
| $10,000 to $14,999 | 88 | 3.9% |
| $15,000 to $24,999 | 170 | 7.5% |
| $25,000 to $34,999 | 84 | 3.7% |
| $35,000 to $49,999 | 340 | 15.0% |
| $50,000 to $74,999 | 583 | 25.7% |
| $75,000 to $99,999 | 320 | 14.1% |
| $100,000 to $149,999 | 347 | 15.3% |
| $150,000 to $199,999 | 125 | 5.5% |
| $200,000+ | 64 | 2.8% |
Family Income by Famaliy Size in Anaconda Deer Lodge County
5-person families (124 | 5.5%) account for the highest median family income in Anaconda Deer Lodge County with $119,000 per family, while 2-person families (1,439 | 63.4%) have the highest median income of $30,674 per family member.
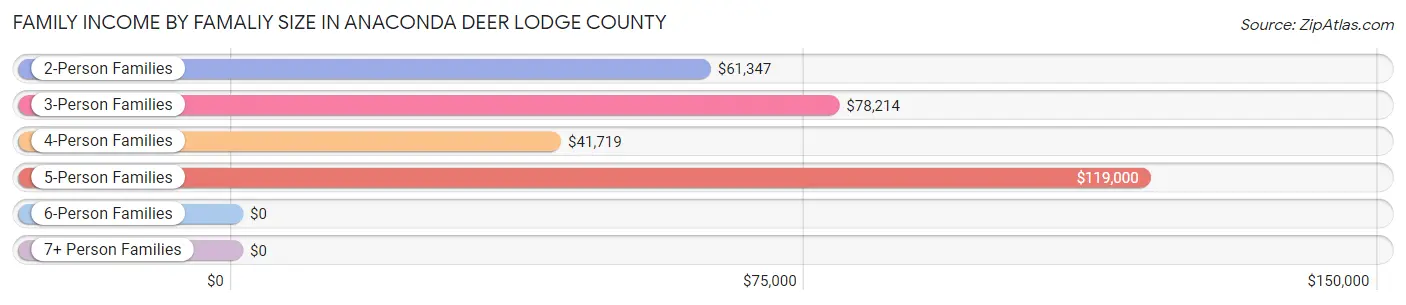
| Income Bracket | # Families | Median Income |
| 2-Person Families | 1,439 (63.4%) | $61,347 |
| 3-Person Families | 430 (19.0%) | $78,214 |
| 4-Person Families | 271 (11.9%) | $41,719 |
| 5-Person Families | 124 (5.5%) | $119,000 |
| 6-Person Families | 5 (0.2%) | $0 |
| 7+ Person Families | 0 (0.0%) | $0 |
| Total | 2,269 (100.0%) | $62,575 |
Family Income by Number of Earners in Anaconda Deer Lodge County
The median family income in Anaconda Deer Lodge County is $62,575, with families comprising 3+ earners (127) having the highest median family income of $153,029, while families with no earners (527) have the lowest median family income of $41,406, accounting for 5.6% and 23.2% of families, respectively.
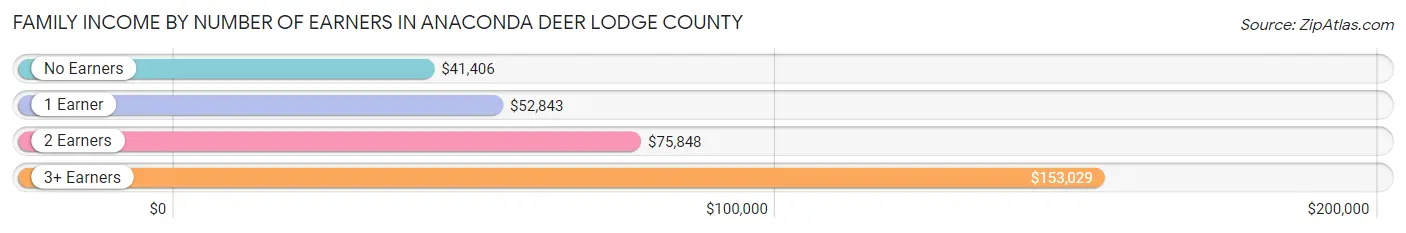
| Number of Earners | # Families | Median Income |
| No Earners | 527 (23.2%) | $41,406 |
| 1 Earner | 920 (40.6%) | $52,843 |
| 2 Earners | 695 (30.6%) | $75,848 |
| 3+ Earners | 127 (5.6%) | $153,029 |
| Total | 2,269 (100.0%) | $62,575 |
Household Income in Anaconda Deer Lodge County
Household Income Brackets in Anaconda Deer Lodge County
With 763 households falling in the category, the $35,000 to $49,999 income range is the most frequent in Anaconda Deer Lodge County, accounting for 17.6% of all households. In contrast, only 100 households (2.3%) fall into the $200,000+ income bracket, making it the least populous group.
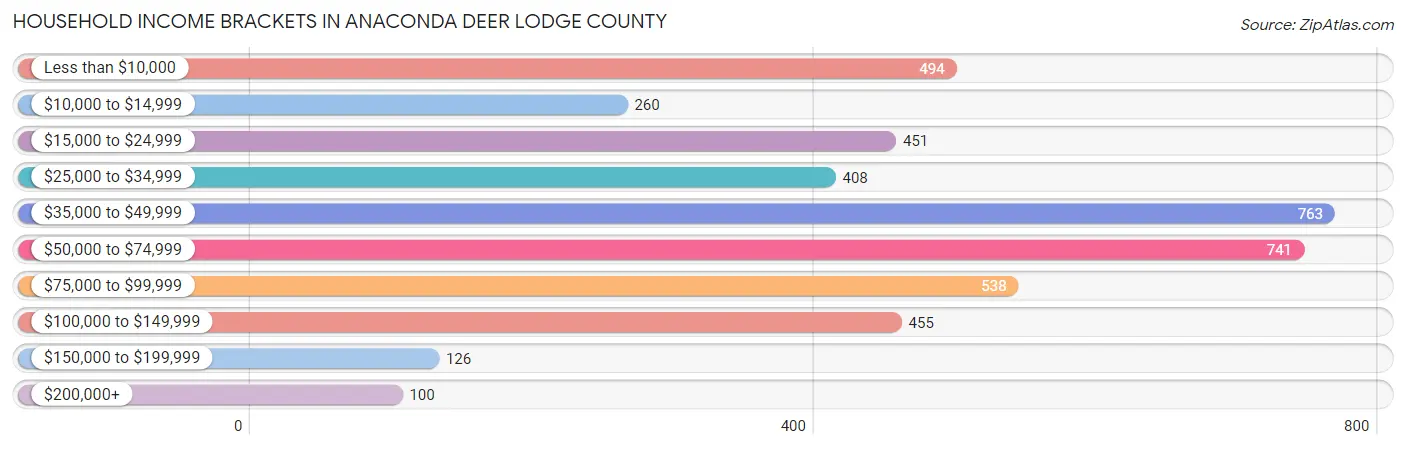
| Income Bracket | # Households | % Households |
| Less than $10,000 | 494 | 11.4% |
| $10,000 to $14,999 | 260 | 6.0% |
| $15,000 to $24,999 | 451 | 10.4% |
| $25,000 to $34,999 | 408 | 9.4% |
| $35,000 to $49,999 | 763 | 17.6% |
| $50,000 to $74,999 | 741 | 17.1% |
| $75,000 to $99,999 | 538 | 12.4% |
| $100,000 to $149,999 | 455 | 10.5% |
| $150,000 to $199,999 | 126 | 2.9% |
| $200,000+ | 100 | 2.3% |
Household Income by Householder Age in Anaconda Deer Lodge County
The median household income in Anaconda Deer Lodge County is $46,436, with the highest median household income of $64,539 found in the 25 to 44 years age bracket for the primary householder. A total of 867 households (20.0%) fall into this category. Meanwhile, the 15 to 24 years age bracket for the primary householder has the lowest median household income of $0, with 230 households (5.3%) in this group.
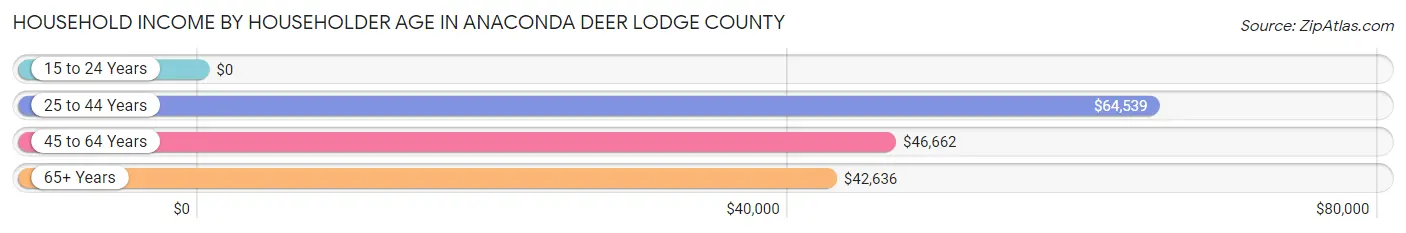
| Income Bracket | # Households | Median Income |
| 15 to 24 Years | 230 (5.3%) | $0 |
| 25 to 44 Years | 867 (20.0%) | $64,539 |
| 45 to 64 Years | 1,701 (39.2%) | $46,662 |
| 65+ Years | 1,538 (35.5%) | $42,636 |
| Total | 4,336 (100.0%) | $46,436 |
Poverty in Anaconda Deer Lodge County
Income Below Poverty by Sex and Age in Anaconda Deer Lodge County
With 25.7% poverty level for males and 19.9% for females among the residents of Anaconda Deer Lodge County, 6 to 11 year old males and 18 to 24 year old females are the most vulnerable to poverty, with 154 males (53.5%) and 147 females (46.7%) in their respective age groups living below the poverty level.

| Age Bracket | Male | Female |
| Under 5 Years | 73 (33.8%) | 0 (0.0%) |
| 5 Years | 0 (0.0%) | 0 (0.0%) |
| 6 to 11 Years | 154 (53.5%) | 56 (27.6%) |
| 12 to 14 Years | 3 (13.6%) | 0 (0.0%) |
| 15 Years | 0 (0.0%) | 0 (0.0%) |
| 16 and 17 Years | 25 (26.9%) | 38 (36.9%) |
| 18 to 24 Years | 256 (53.1%) | 147 (46.7%) |
| 25 to 34 Years | 65 (14.2%) | 194 (36.3%) |
| 35 to 44 Years | 195 (41.2%) | 17 (3.6%) |
| 45 to 54 Years | 66 (9.7%) | 83 (15.3%) |
| 55 to 64 Years | 180 (22.4%) | 130 (16.5%) |
| 65 to 74 Years | 165 (21.8%) | 127 (17.8%) |
| 75 Years and over | 30 (7.7%) | 66 (14.7%) |
| Total | 1,212 (25.7%) | 858 (19.9%) |
Income Above Poverty by Sex and Age in Anaconda Deer Lodge County
According to the poverty statistics in Anaconda Deer Lodge County, males aged 5 years and females aged under 5 years are the age groups that are most secure financially, with 100.0% of males and 100.0% of females in these age groups living above the poverty line.
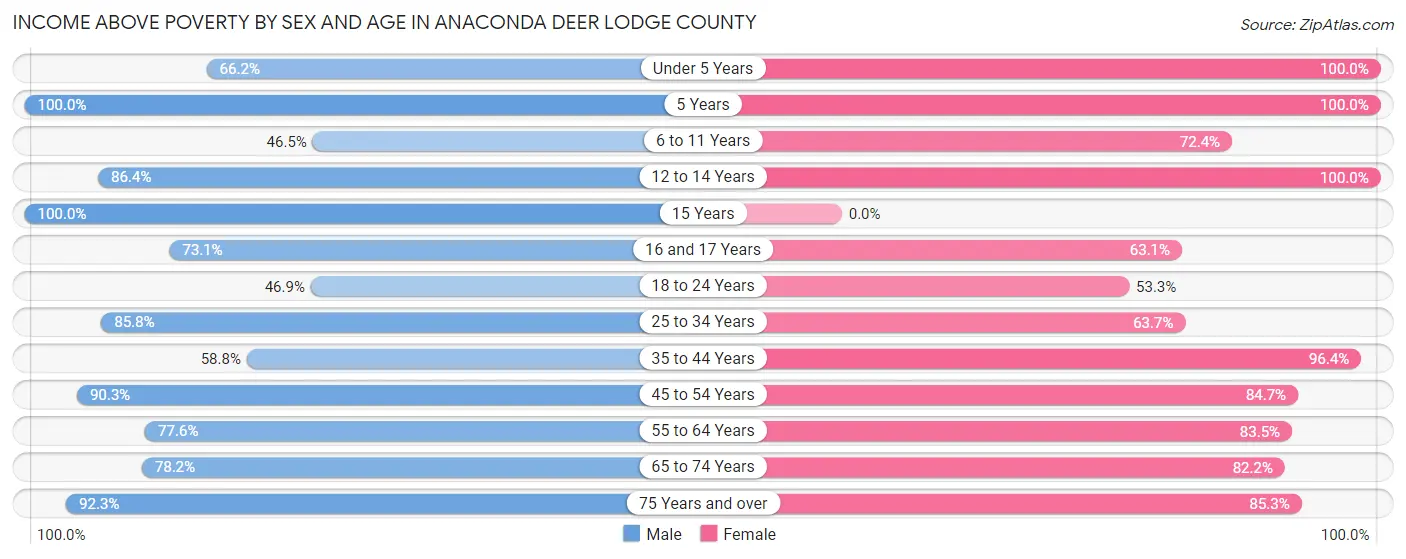
| Age Bracket | Male | Female |
| Under 5 Years | 143 (66.2%) | 106 (100.0%) |
| 5 Years | 23 (100.0%) | 32 (100.0%) |
| 6 to 11 Years | 134 (46.5%) | 147 (72.4%) |
| 12 to 14 Years | 19 (86.4%) | 48 (100.0%) |
| 15 Years | 28 (100.0%) | 0 (0.0%) |
| 16 and 17 Years | 68 (73.1%) | 65 (63.1%) |
| 18 to 24 Years | 226 (46.9%) | 168 (53.3%) |
| 25 to 34 Years | 391 (85.8%) | 341 (63.7%) |
| 35 to 44 Years | 278 (58.8%) | 455 (96.4%) |
| 45 to 54 Years | 613 (90.3%) | 458 (84.7%) |
| 55 to 64 Years | 625 (77.6%) | 660 (83.5%) |
| 65 to 74 Years | 593 (78.2%) | 587 (82.2%) |
| 75 Years and over | 359 (92.3%) | 384 (85.3%) |
| Total | 3,500 (74.3%) | 3,451 (80.1%) |
Income Below Poverty Among Married-Couple Families in Anaconda Deer Lodge County
The poverty statistics for married-couple families in Anaconda Deer Lodge County show that 9.4% or 151 of the total 1,605 families live below the poverty line. Families with 1 or 2 children have the highest poverty rate of 20.4%, comprising of 92 families. On the other hand, families with 3 or 4 children have the lowest poverty rate of 0.0%, which includes 0 families.
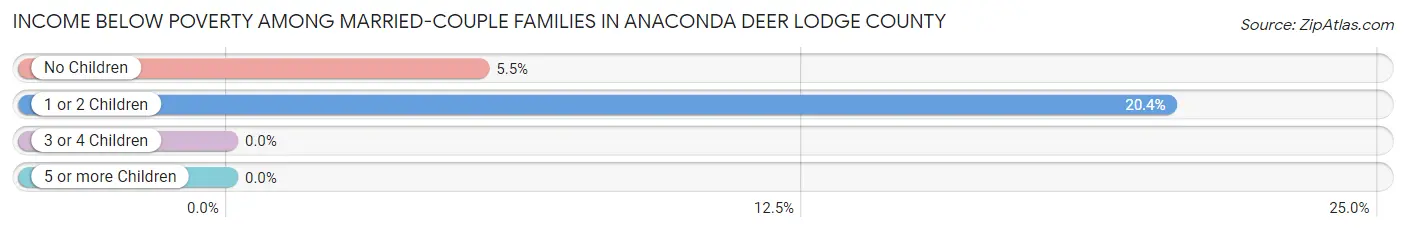
| Children | Above Poverty | Below Poverty |
| No Children | 1,019 (94.5%) | 59 (5.5%) |
| 1 or 2 Children | 358 (79.6%) | 92 (20.4%) |
| 3 or 4 Children | 77 (100.0%) | 0 (0.0%) |
| 5 or more Children | 0 (0.0%) | 0 (0.0%) |
| Total | 1,454 (90.6%) | 151 (9.4%) |
Income Below Poverty Among Single-Parent Households in Anaconda Deer Lodge County
According to the poverty data in Anaconda Deer Lodge County, 5.4% or 12 single-father households and 46.1% or 203 single-mother households are living below the poverty line. Among single-father households, those with no children have the highest poverty rate, with 12 households (37.5%) experiencing poverty. Likewise, among single-mother households, those with 3 or 4 children have the highest poverty rate, with 75 households (100.0%) falling below the poverty line.
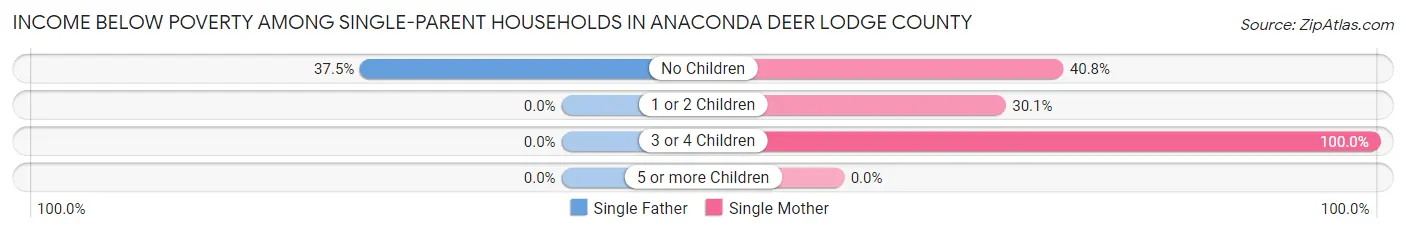
| Children | Single Father | Single Mother |
| No Children | 12 (37.5%) | 69 (40.8%) |
| 1 or 2 Children | 0 (0.0%) | 59 (30.1%) |
| 3 or 4 Children | 0 (0.0%) | 75 (100.0%) |
| 5 or more Children | 0 (0.0%) | 0 (0.0%) |
| Total | 12 (5.4%) | 203 (46.1%) |
Income Below Poverty Among Married-Couple vs Single-Parent Households in Anaconda Deer Lodge County
The poverty data for Anaconda Deer Lodge County shows that 151 of the married-couple family households (9.4%) and 215 of the single-parent households (32.4%) are living below the poverty level. Within the married-couple family households, those with 1 or 2 children have the highest poverty rate, with 92 households (20.4%) falling below the poverty line. Among the single-parent households, those with 3 or 4 children have the highest poverty rate, with 75 household (83.3%) living below poverty.
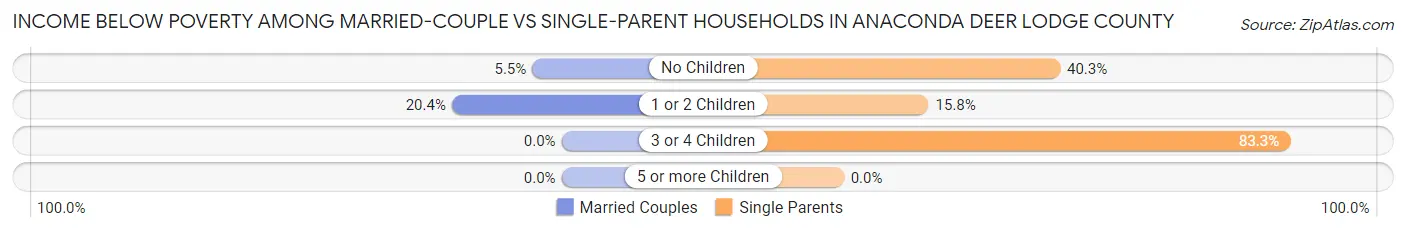
| Children | Married-Couple Families | Single-Parent Households |
| No Children | 59 (5.5%) | 81 (40.3%) |
| 1 or 2 Children | 92 (20.4%) | 59 (15.8%) |
| 3 or 4 Children | 0 (0.0%) | 75 (83.3%) |
| 5 or more Children | 0 (0.0%) | 0 (0.0%) |
| Total | 151 (9.4%) | 215 (32.4%) |
Race in Anaconda Deer Lodge County
The most populous races in Anaconda Deer Lodge County are White / Caucasian (8,589 | 91.0%), Two or more Races (535 | 5.7%), and Hispanic or Latino (353 | 3.7%).
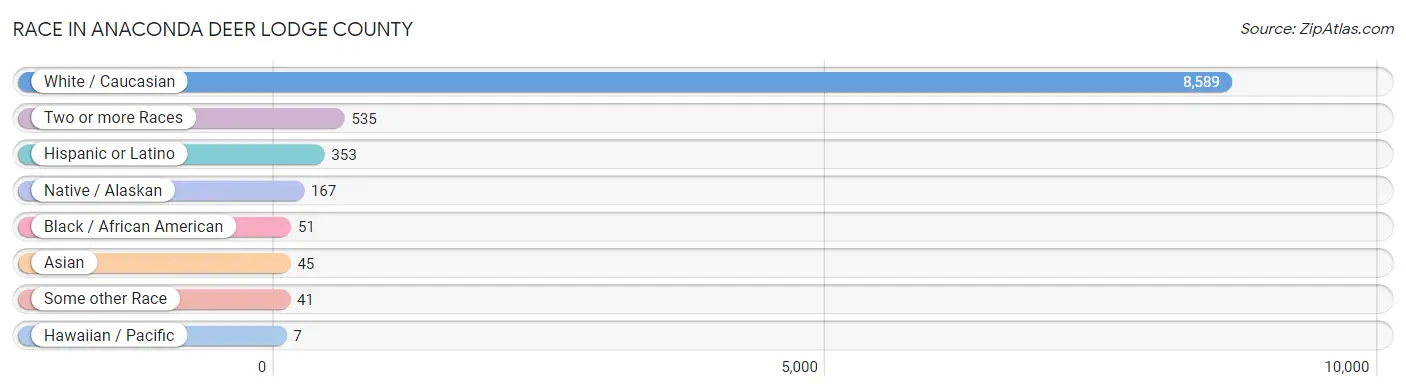
| Race | # Population | % Population |
| Asian | 45 | 0.5% |
| Black / African American | 51 | 0.5% |
| Hawaiian / Pacific | 7 | 0.1% |
| Hispanic or Latino | 353 | 3.7% |
| Native / Alaskan | 167 | 1.8% |
| White / Caucasian | 8,589 | 91.0% |
| Two or more Races | 535 | 5.7% |
| Some other Race | 41 | 0.4% |
| Total | 9,435 | 100.0% |
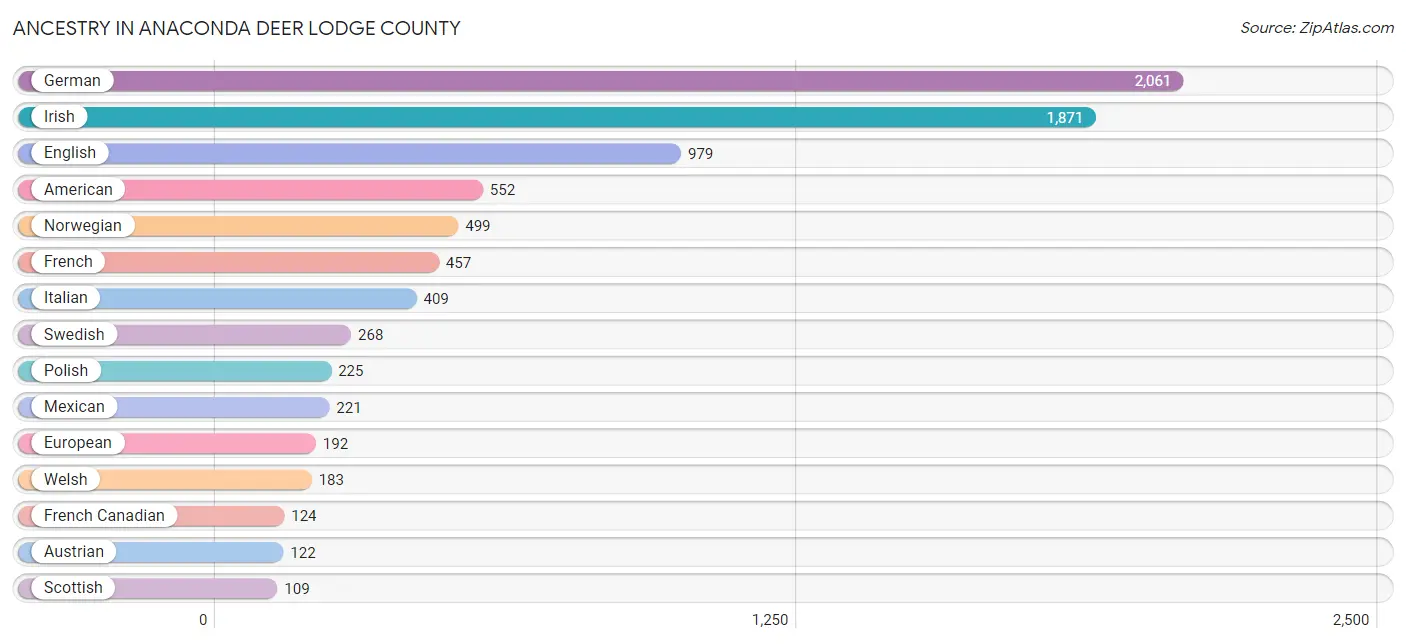
Ancestry in Anaconda Deer Lodge County
The most populous ancestries reported in Anaconda Deer Lodge County are German (2,061 | 21.8%), Irish (1,871 | 19.8%), English (979 | 10.4%), American (552 | 5.9%), and Norwegian (499 | 5.3%), together accounting for 63.2% of all Anaconda Deer Lodge County residents.
| Ancestry | # Population | % Population |
| African | 22 | 0.2% |
| American | 552 | 5.9% |
| Arab | 73 | 0.8% |
| Arapaho | 1 | 0.0% |
| Austrian | 122 | 1.3% |
| Basque | 14 | 0.2% |
| Bhutanese | 33 | 0.4% |
| Blackfeet | 27 | 0.3% |
| British | 22 | 0.2% |
| Cherokee | 52 | 0.5% |
| Chippewa | 58 | 0.6% |
| Creek | 3 | 0.0% |
| Croatian | 59 | 0.6% |
| Crow | 6 | 0.1% |
| Cuban | 1 | 0.0% |
| Czech | 85 | 0.9% |
| Czechoslovakian | 8 | 0.1% |
| Danish | 35 | 0.4% |
| Dutch | 65 | 0.7% |
| Eastern European | 39 | 0.4% |
| English | 979 | 10.4% |
| European | 192 | 2.0% |
| Finnish | 40 | 0.4% |
| French | 457 | 4.8% |
| French Canadian | 124 | 1.3% |
| German | 2,061 | 21.8% |
| Hungarian | 3 | 0.0% |
| Indian (Asian) | 15 | 0.2% |
| Inupiat | 4 | 0.0% |
| Iranian | 58 | 0.6% |
| Irish | 1,871 | 19.8% |
| Italian | 409 | 4.3% |
| Korean | 49 | 0.5% |
| Lebanese | 54 | 0.6% |
| Mexican | 221 | 2.3% |
| Native Hawaiian | 1 | 0.0% |
| Navajo | 4 | 0.0% |
| Northern European | 41 | 0.4% |
| Norwegian | 499 | 5.3% |
| Pennsylvania German | 12 | 0.1% |
| Polish | 225 | 2.4% |
| Portuguese | 11 | 0.1% |
| Puerto Rican | 4 | 0.0% |
| Russian | 66 | 0.7% |
| Samoan | 6 | 0.1% |
| Scandinavian | 73 | 0.8% |
| Scotch-Irish | 71 | 0.7% |
| Scottish | 109 | 1.2% |
| Serbian | 42 | 0.4% |
| Slovak | 8 | 0.1% |
| Spaniard | 67 | 0.7% |
| Spanish | 44 | 0.5% |
| Subsaharan African | 22 | 0.2% |
| Swedish | 268 | 2.8% |
| Swiss | 13 | 0.1% |
| Syrian | 19 | 0.2% |
| Tlingit-Haida | 4 | 0.0% |
| Welsh | 183 | 1.9% |
| Yugoslavian | 30 | 0.3% | View All 59 Rows |
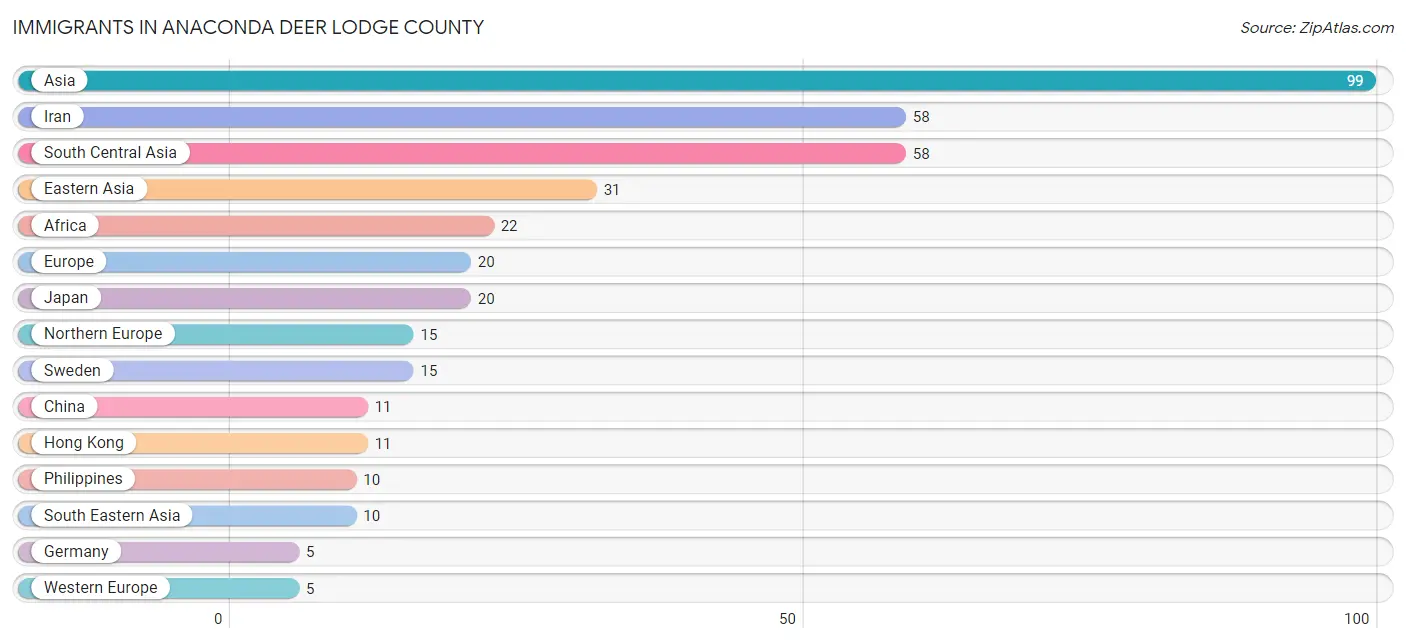
Immigrants in Anaconda Deer Lodge County
The most numerous immigrant groups reported in Anaconda Deer Lodge County came from Asia (99 | 1.1%), Iran (58 | 0.6%), South Central Asia (58 | 0.6%), Eastern Asia (31 | 0.3%), and Africa (22 | 0.2%), together accounting for 2.8% of all Anaconda Deer Lodge County residents.
| Immigration Origin | # Population | % Population |
| Africa | 22 | 0.2% |
| Asia | 99 | 1.1% |
| Central America | 4 | 0.0% |
| China | 11 | 0.1% |
| Eastern Asia | 31 | 0.3% |
| Europe | 20 | 0.2% |
| Germany | 5 | 0.1% |
| Hong Kong | 11 | 0.1% |
| Iran | 58 | 0.6% |
| Japan | 20 | 0.2% |
| Latin America | 4 | 0.0% |
| Mexico | 4 | 0.0% |
| Northern Europe | 15 | 0.2% |
| Philippines | 10 | 0.1% |
| South Central Asia | 58 | 0.6% |
| South Eastern Asia | 10 | 0.1% |
| Sweden | 15 | 0.2% |
| Western Europe | 5 | 0.1% | View All 18 Rows |
Sex and Age in Anaconda Deer Lodge County
Sex and Age in Anaconda Deer Lodge County
The most populous age groups in Anaconda Deer Lodge County are 60 to 64 Years (446 | 8.8%) for men and 55 to 59 Years (443 | 10.2%) for women.
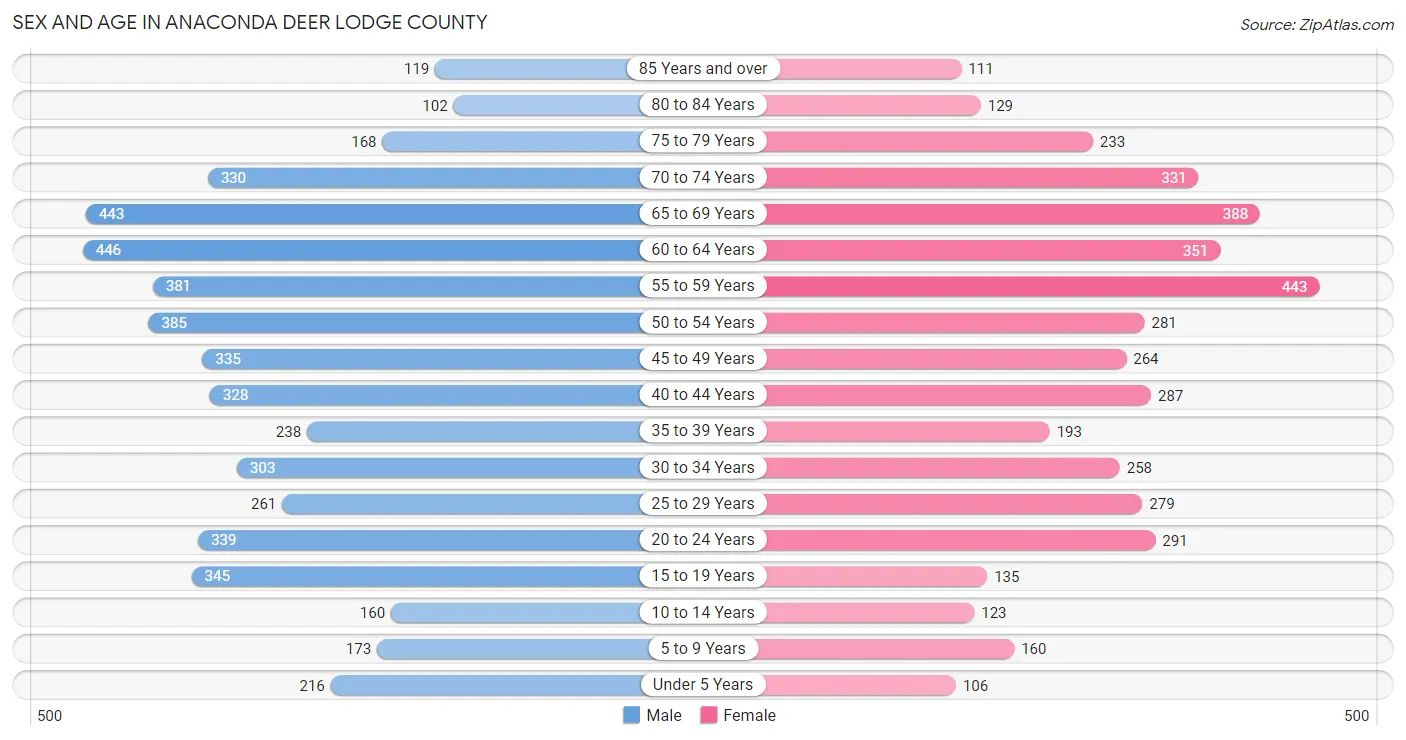
| Age Bracket | Male | Female |
| Under 5 Years | 216 (4.3%) | 106 (2.4%) |
| 5 to 9 Years | 173 (3.4%) | 160 (3.7%) |
| 10 to 14 Years | 160 (3.2%) | 123 (2.8%) |
| 15 to 19 Years | 345 (6.8%) | 135 (3.1%) |
| 20 to 24 Years | 339 (6.7%) | 291 (6.7%) |
| 25 to 29 Years | 261 (5.1%) | 279 (6.4%) |
| 30 to 34 Years | 303 (6.0%) | 258 (5.9%) |
| 35 to 39 Years | 238 (4.7%) | 193 (4.4%) |
| 40 to 44 Years | 328 (6.5%) | 287 (6.6%) |
| 45 to 49 Years | 335 (6.6%) | 264 (6.0%) |
| 50 to 54 Years | 385 (7.6%) | 281 (6.4%) |
| 55 to 59 Years | 381 (7.5%) | 443 (10.2%) |
| 60 to 64 Years | 446 (8.8%) | 351 (8.0%) |
| 65 to 69 Years | 443 (8.7%) | 388 (8.9%) |
| 70 to 74 Years | 330 (6.5%) | 331 (7.6%) |
| 75 to 79 Years | 168 (3.3%) | 233 (5.3%) |
| 80 to 84 Years | 102 (2.0%) | 129 (3.0%) |
| 85 Years and over | 119 (2.4%) | 111 (2.5%) |
| Total | 5,072 (100.0%) | 4,363 (100.0%) |
Families and Households in Anaconda Deer Lodge County
Median Family Size in Anaconda Deer Lodge County
The median family size in Anaconda Deer Lodge County is 2.63 persons per family, with single female/mother families (440 | 19.4%) accounting for the largest median family size of 2.86 persons per family. On the other hand, single male/father families (224 | 9.9%) represent the smallest median family size with 2.32 persons per family.
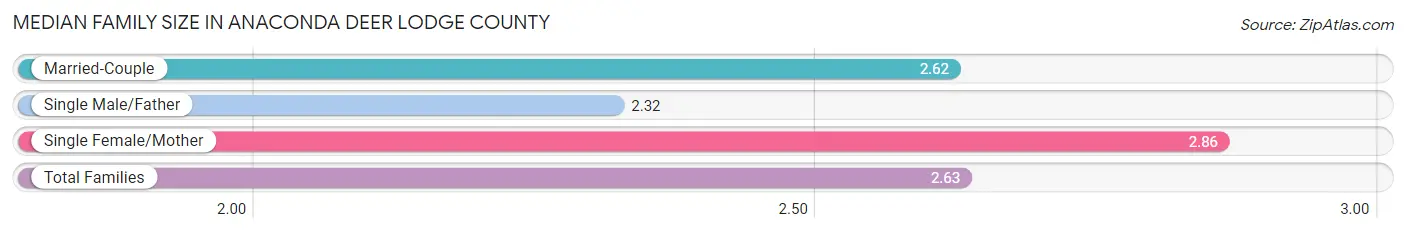
| Family Type | # Families | Family Size |
| Married-Couple | 1,605 (70.7%) | 2.62 |
| Single Male/Father | 224 (9.9%) | 2.32 |
| Single Female/Mother | 440 (19.4%) | 2.86 |
| Total Families | 2,269 (100.0%) | 2.63 |
Median Household Size in Anaconda Deer Lodge County
The median household size in Anaconda Deer Lodge County is 1.97 persons per household, with single female/mother households (440 | 10.2%) accounting for the largest median household size of 3.28 persons per household. non-family households (2,067 | 47.7%) represent the smallest median household size with 1.09 persons per household.
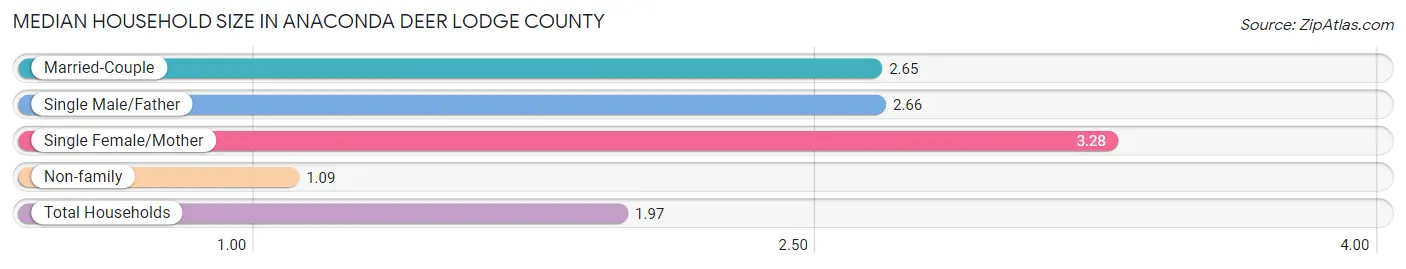
| Household Type | # Households | Household Size |
| Married-Couple | 1,605 (37.0%) | 2.65 |
| Single Male/Father | 224 (5.2%) | 2.66 |
| Single Female/Mother | 440 (10.2%) | 3.28 |
| Non-family | 2,067 (47.7%) | 1.09 |
| Total Households | 4,336 (100.0%) | 1.97 |
Household Size by Marriage Status in Anaconda Deer Lodge County
Out of a total of 4,336 households in Anaconda Deer Lodge County, 2,269 (52.3%) are family households, while 2,067 (47.7%) are nonfamily households. The most numerous type of family households are 2-person households, comprising 1,295, and the most common type of nonfamily households are 1-person households, comprising 1,866.
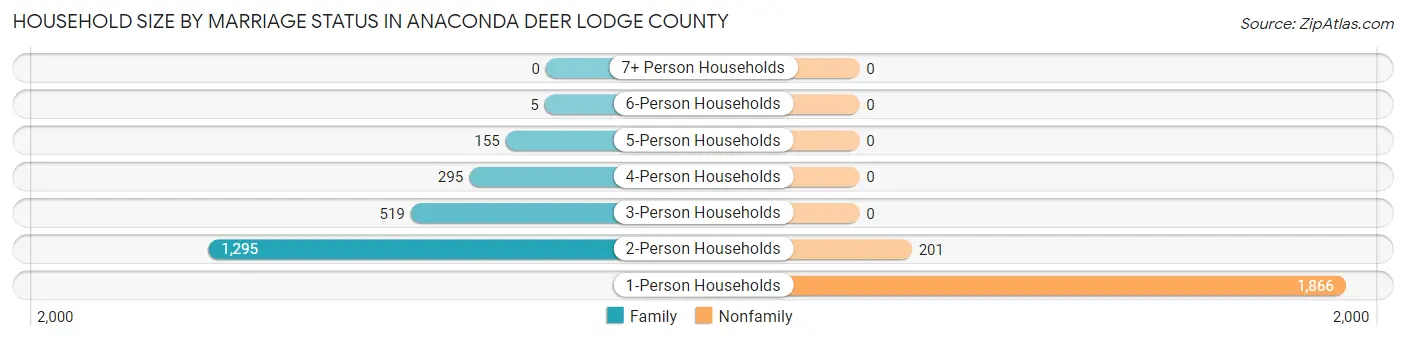
| Household Size | Family Households | Nonfamily Households |
| 1-Person Households | - | 1,866 (43.0%) |
| 2-Person Households | 1,295 (29.9%) | 201 (4.6%) |
| 3-Person Households | 519 (12.0%) | 0 (0.0%) |
| 4-Person Households | 295 (6.8%) | 0 (0.0%) |
| 5-Person Households | 155 (3.6%) | 0 (0.0%) |
| 6-Person Households | 5 (0.1%) | 0 (0.0%) |
| 7+ Person Households | 0 (0.0%) | 0 (0.0%) |
| Total | 2,269 (52.3%) | 2,067 (47.7%) |
Female Fertility in Anaconda Deer Lodge County
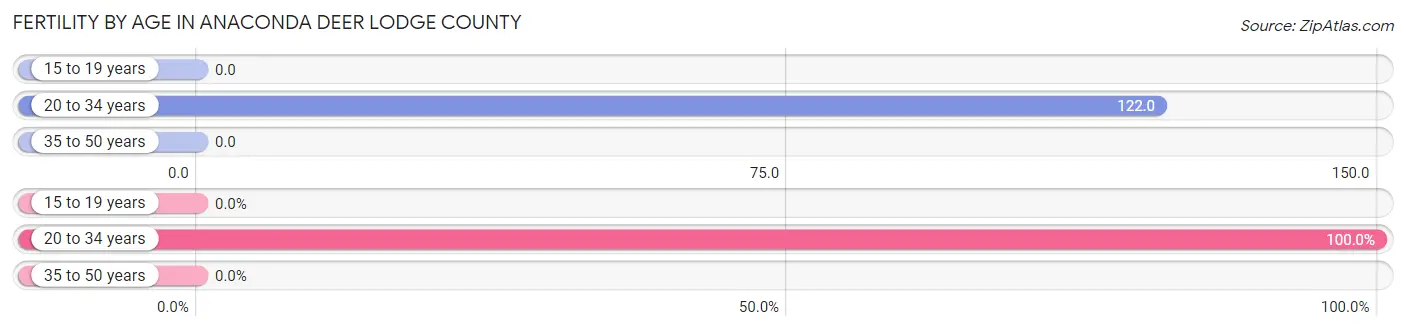
Fertility by Age in Anaconda Deer Lodge County
Average fertility rate in Anaconda Deer Lodge County is 58.0 births per 1,000 women. Women in the age bracket of 20 to 34 years have the highest fertility rate with 122.0 births per 1,000 women. Women in the age bracket of 20 to 34 years acount for 100.0% of all women with births.
| Age Bracket | Women with Births | Births / 1,000 Women |
| 15 to 19 years | 0 (0.0%) | 0.0 |
| 20 to 34 years | 101 (100.0%) | 122.0 |
| 35 to 50 years | 0 (0.0%) | 0.0 |
| Total | 101 (100.0%) | 58.0 |
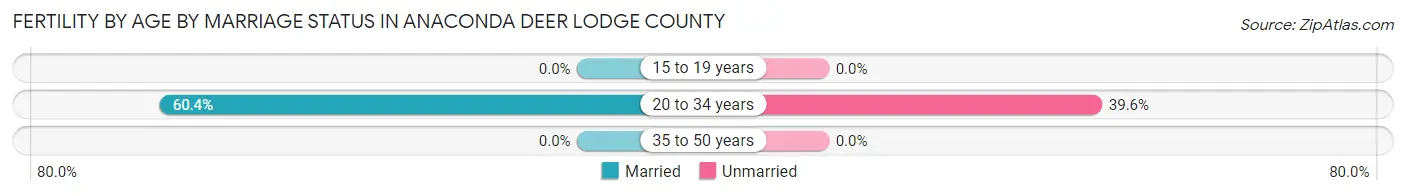
Fertility by Age by Marriage Status in Anaconda Deer Lodge County
60.4% of women with births (101) in Anaconda Deer Lodge County are married. The highest percentage of unmarried women with births falls into 20 to 34 years age bracket with 39.6% of them unmarried at the time of birth, while the lowest percentage of unmarried women with births belong to 20 to 34 years age bracket with 39.6% of them unmarried.
| Age Bracket | Married | Unmarried |
| 15 to 19 years | 0 (0.0%) | 0 (0.0%) |
| 20 to 34 years | 61 (60.4%) | 40 (39.6%) |
| 35 to 50 years | 0 (0.0%) | 0 (0.0%) |
| Total | 61 (60.4%) | 40 (39.6%) |
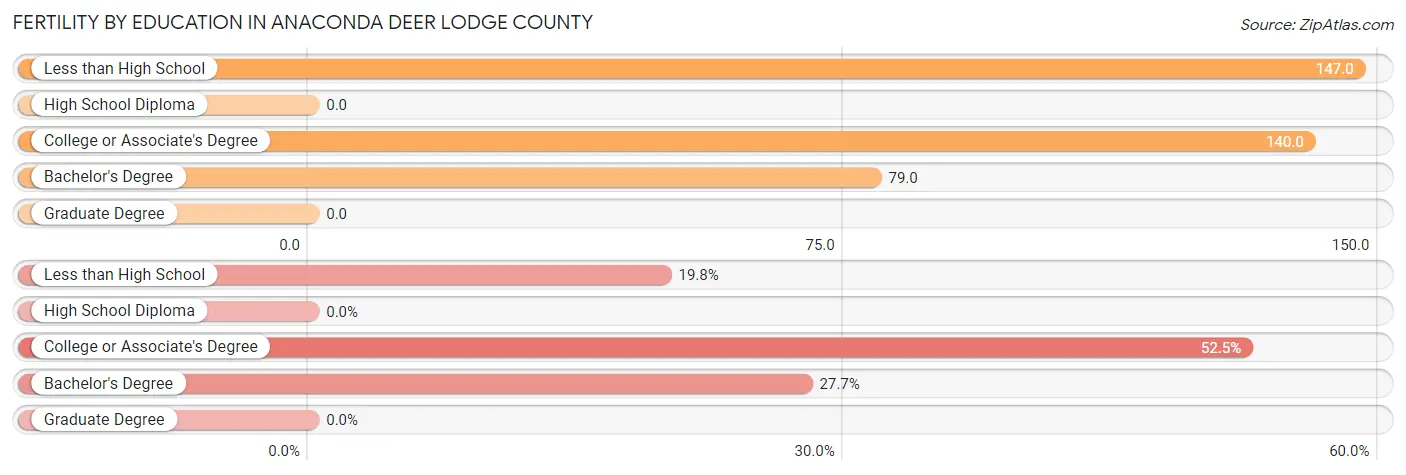
Fertility by Education in Anaconda Deer Lodge County
| Educational Attainment | Women with Births | Births / 1,000 Women |
| Less than High School | 20 (19.8%) | 147.0 |
| High School Diploma | 0 (0.0%) | 0.0 |
| College or Associate's Degree | 53 (52.5%) | 140.0 |
| Bachelor's Degree | 28 (27.7%) | 79.0 |
| Graduate Degree | 0 (0.0%) | 0.0 |
| Total | 101 (100.0%) | 58.0 |
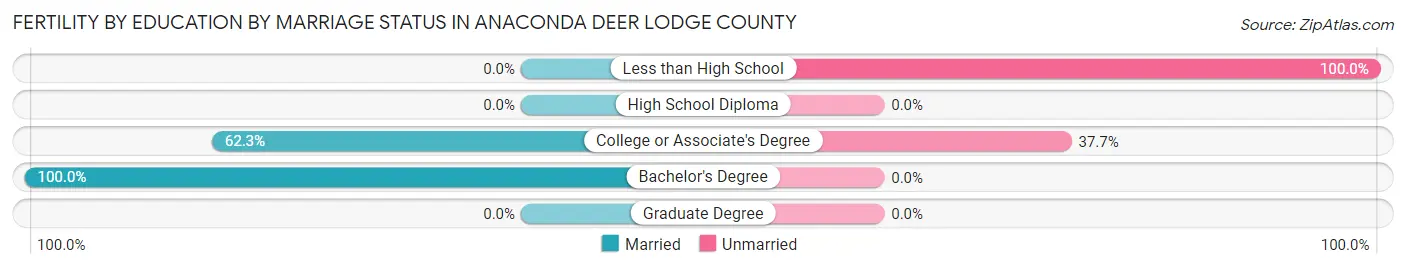
Fertility by Education by Marriage Status in Anaconda Deer Lodge County
39.6% of women with births in Anaconda Deer Lodge County are unmarried. Women with the educational attainment of bachelor's degree are most likely to be married with 100.0% of them married at childbirth, while women with the educational attainment of less than high school are least likely to be married with 100.0% of them unmarried at childbirth.
| Educational Attainment | Married | Unmarried |
| Less than High School | 0 (0.0%) | 20 (100.0%) |
| High School Diploma | 0 (0.0%) | 0 (0.0%) |
| College or Associate's Degree | 33 (62.3%) | 20 (37.7%) |
| Bachelor's Degree | 28 (100.0%) | 0 (0.0%) |
| Graduate Degree | 0 (0.0%) | 0 (0.0%) |
| Total | 61 (60.4%) | 40 (39.6%) |
Employment Characteristics in Anaconda Deer Lodge County
Employment by Class of Employer in Anaconda Deer Lodge County
Among the 4,088 employed individuals in Anaconda Deer Lodge County, private company employees (2,354 | 57.6%), state government employees (481 | 11.8%), and not-for-profit organizations (409 | 10.0%) make up the most common classes of employment.
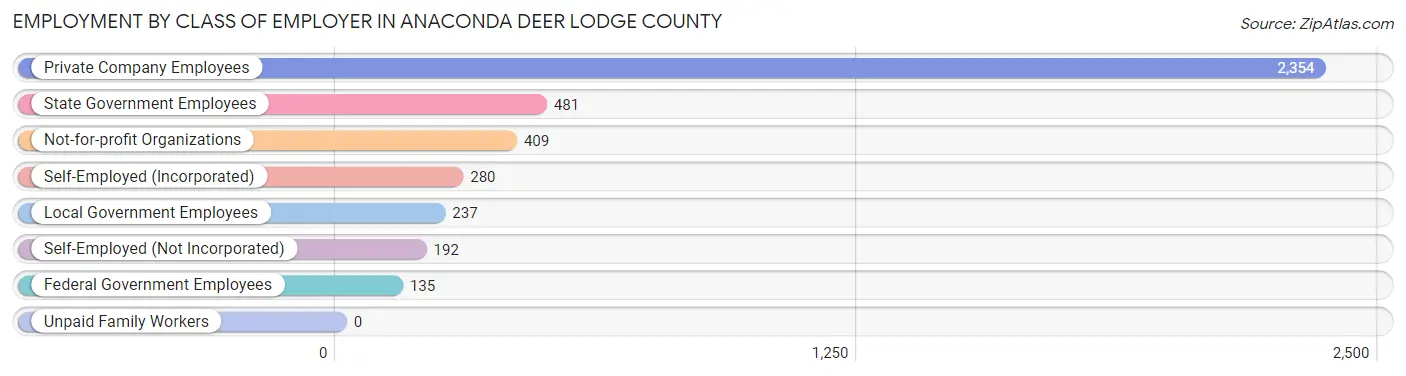
| Employer Class | # Employees | % Employees |
| Private Company Employees | 2,354 | 57.6% |
| Self-Employed (Incorporated) | 280 | 6.9% |
| Self-Employed (Not Incorporated) | 192 | 4.7% |
| Not-for-profit Organizations | 409 | 10.0% |
| Local Government Employees | 237 | 5.8% |
| State Government Employees | 481 | 11.8% |
| Federal Government Employees | 135 | 3.3% |
| Unpaid Family Workers | 0 | 0.0% |
| Total | 4,088 | 100.0% |
Employment Status by Age in Anaconda Deer Lodge County
According to the labor force statistics for Anaconda Deer Lodge County, out of the total population over 16 years of age (8,468), 51.6% or 4,369 individuals are in the labor force, with 3.8% or 166 of them unemployed. The age group with the highest labor force participation rate is 25 to 29 years, with 82.2% or 444 individuals in the labor force. Within the labor force, the 35 to 44 years age range has the highest percentage of unemployed individuals, with 10.0% or 72 of them being unemployed.
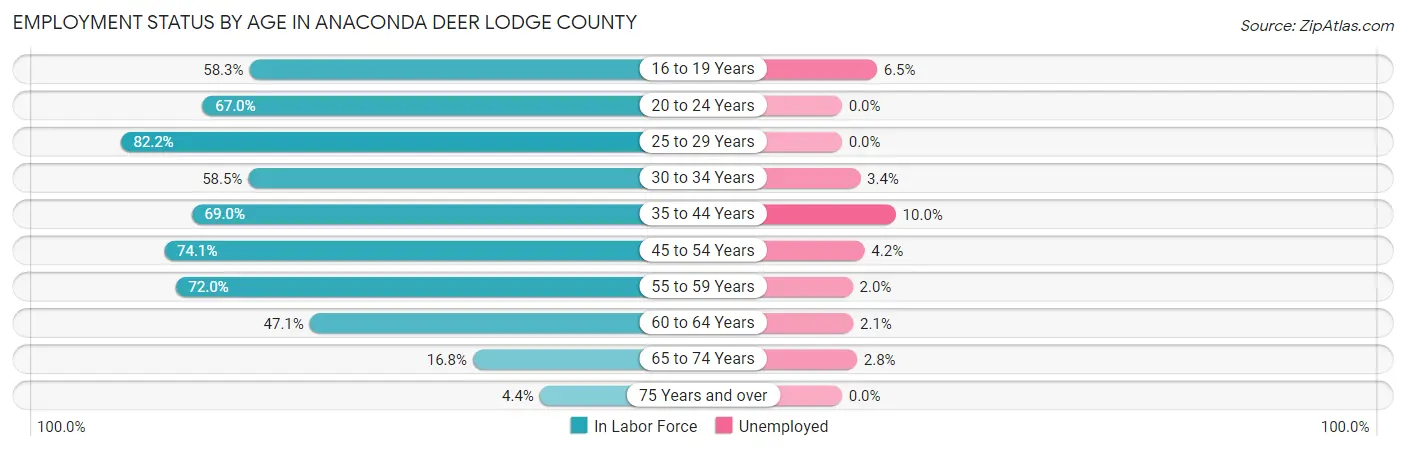
| Age Bracket | In Labor Force | Unemployed |
| 16 to 19 Years | 263 (58.3%) | 17 (6.5%) |
| 20 to 24 Years | 422 (67.0%) | 0 (0.0%) |
| 25 to 29 Years | 444 (82.2%) | 0 (0.0%) |
| 30 to 34 Years | 328 (58.5%) | 11 (3.4%) |
| 35 to 44 Years | 722 (69.0%) | 72 (10.0%) |
| 45 to 54 Years | 937 (74.1%) | 39 (4.2%) |
| 55 to 59 Years | 593 (72.0%) | 12 (2.0%) |
| 60 to 64 Years | 375 (47.1%) | 8 (2.1%) |
| 65 to 74 Years | 251 (16.8%) | 7 (2.8%) |
| 75 Years and over | 38 (4.4%) | 0 (0.0%) |
| Total | 4,369 (51.6%) | 166 (3.8%) |
Employment Status by Educational Attainment in Anaconda Deer Lodge County
According to labor force statistics for Anaconda Deer Lodge County, 67.5% of individuals (3,397) out of the total population between 25 and 64 years of age (5,033) are in the labor force, with 4.2% or 143 of them being unemployed. The group with the highest labor force participation rate are those with the educational attainment of bachelor's degree or higher, with 87.1% or 877 individuals in the labor force. Within the labor force, individuals with bachelor's degree or higher education have the highest percentage of unemployment, with 8.4% or 74 of them being unemployed.
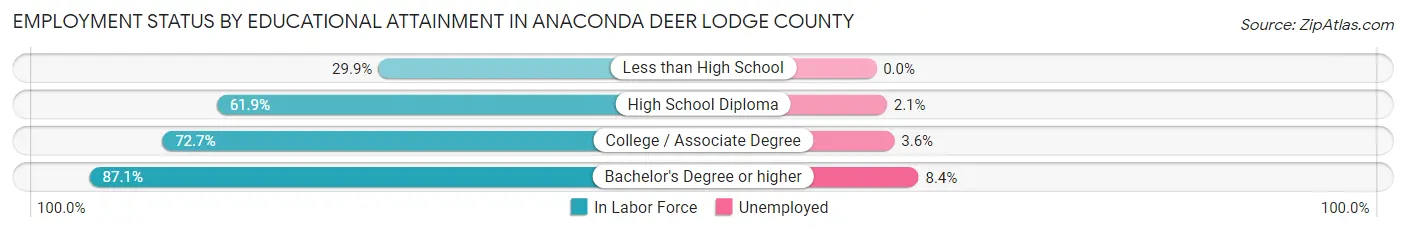
| Educational Attainment | In Labor Force | Unemployed |
| Less than High School | 136 (29.9%) | 0 (0.0%) |
| High School Diploma | 1,205 (61.9%) | 41 (2.1%) |
| College / Associate Degree | 1,181 (72.7%) | 58 (3.6%) |
| Bachelor's Degree or higher | 877 (87.1%) | 85 (8.4%) |
| Total | 3,397 (67.5%) | 211 (4.2%) |
Employment Occupations by Sex in Anaconda Deer Lodge County
Management, Business, Science and Arts Occupations
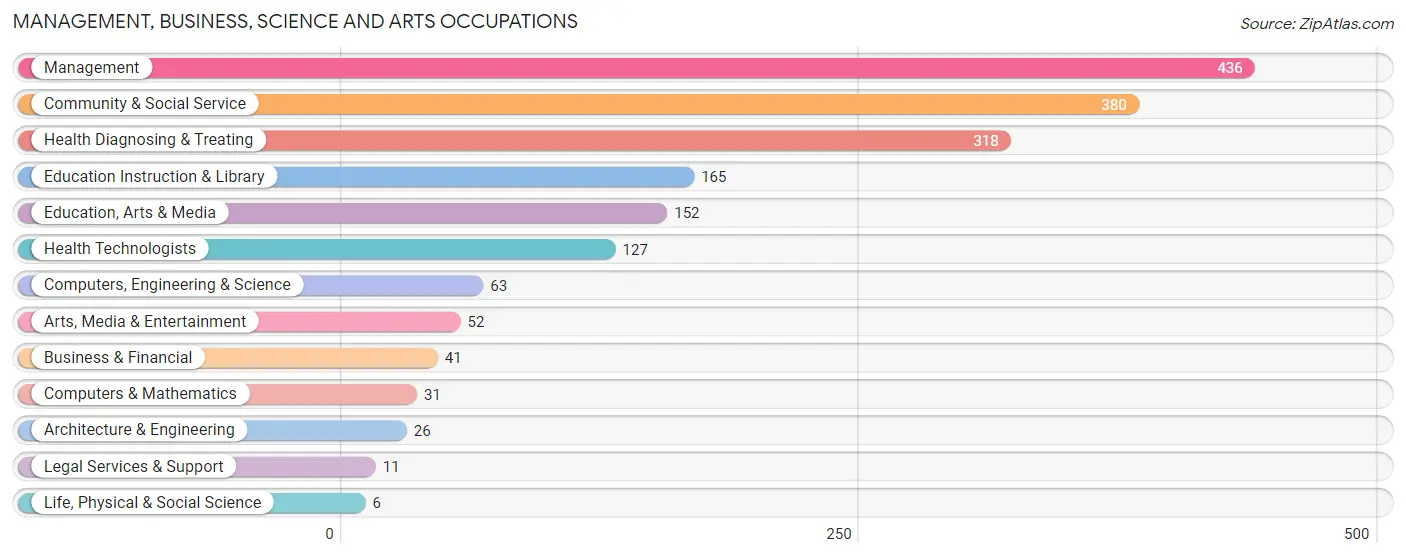
The most common Management, Business, Science and Arts occupations in Anaconda Deer Lodge County are Management (436 | 10.4%), Community & Social Service (380 | 9.0%), Health Diagnosing & Treating (318 | 7.6%), Education Instruction & Library (165 | 3.9%), and Education, Arts & Media (152 | 3.6%).
Management, Business, Science and Arts Occupations by Sex
Within the Management, Business, Science and Arts occupations in Anaconda Deer Lodge County, the most male-oriented occupations are Computers & Mathematics (100.0%), Life, Physical & Social Science (100.0%), and Business & Financial (90.2%), while the most female-oriented occupations are Health Technologists (94.5%), Education Instruction & Library (84.9%), and Legal Services & Support (81.8%).
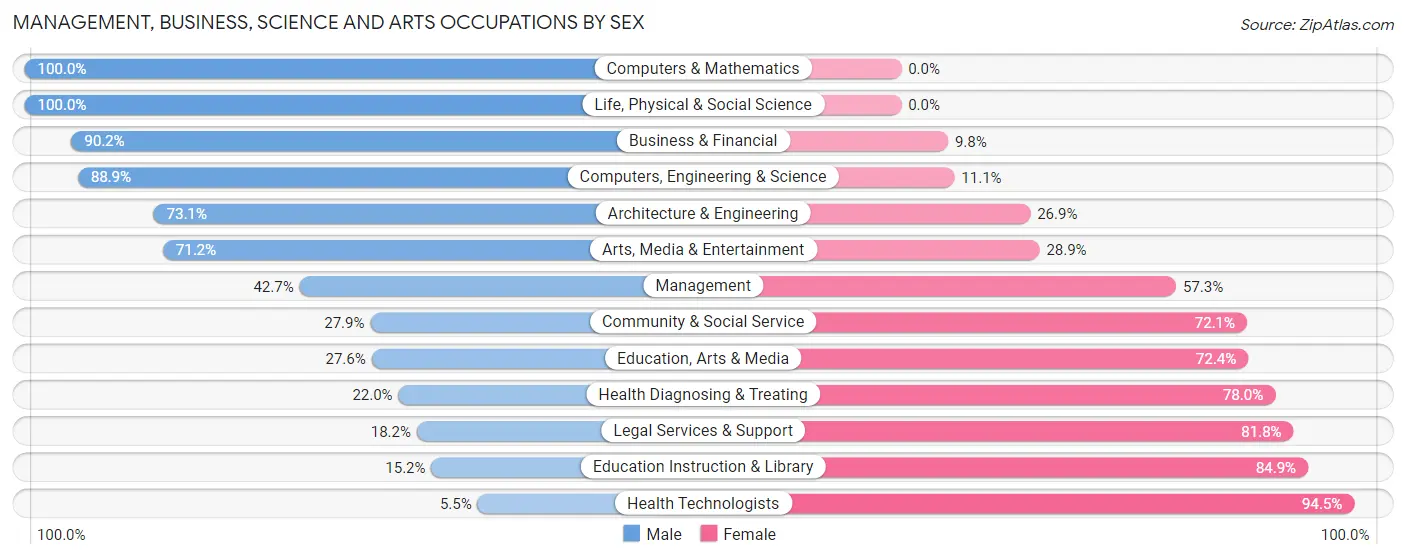
| Occupation | Male | Female |
| Management | 186 (42.7%) | 250 (57.3%) |
| Business & Financial | 37 (90.2%) | 4 (9.8%) |
| Computers, Engineering & Science | 56 (88.9%) | 7 (11.1%) |
| Computers & Mathematics | 31 (100.0%) | 0 (0.0%) |
| Architecture & Engineering | 19 (73.1%) | 7 (26.9%) |
| Life, Physical & Social Science | 6 (100.0%) | 0 (0.0%) |
| Community & Social Service | 106 (27.9%) | 274 (72.1%) |
| Education, Arts & Media | 42 (27.6%) | 110 (72.4%) |
| Legal Services & Support | 2 (18.2%) | 9 (81.8%) |
| Education Instruction & Library | 25 (15.1%) | 140 (84.9%) |
| Arts, Media & Entertainment | 37 (71.2%) | 15 (28.8%) |
| Health Diagnosing & Treating | 70 (22.0%) | 248 (78.0%) |
| Health Technologists | 7 (5.5%) | 120 (94.5%) |
| Total (Category) | 455 (36.7%) | 783 (63.2%) |
| Total (Overall) | 2,188 (52.0%) | 2,019 (48.0%) |
Services Occupations
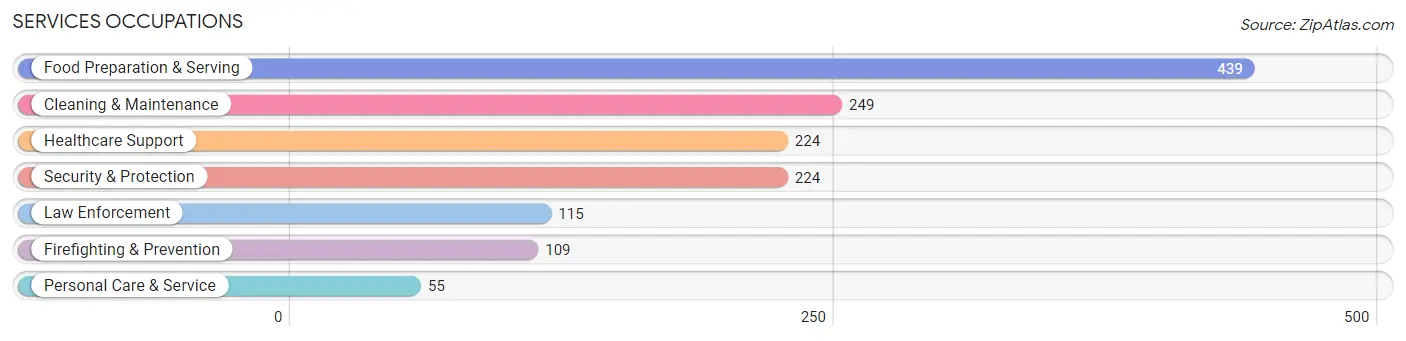
The most common Services occupations in Anaconda Deer Lodge County are Food Preparation & Serving (439 | 10.4%), Cleaning & Maintenance (249 | 5.9%), Healthcare Support (224 | 5.3%), Security & Protection (224 | 5.3%), and Law Enforcement (115 | 2.7%).
Services Occupations by Sex
Within the Services occupations in Anaconda Deer Lodge County, the most male-oriented occupations are Firefighting & Prevention (100.0%), Security & Protection (94.6%), and Law Enforcement (89.6%), while the most female-oriented occupations are Personal Care & Service (100.0%), Healthcare Support (63.4%), and Food Preparation & Serving (57.9%).
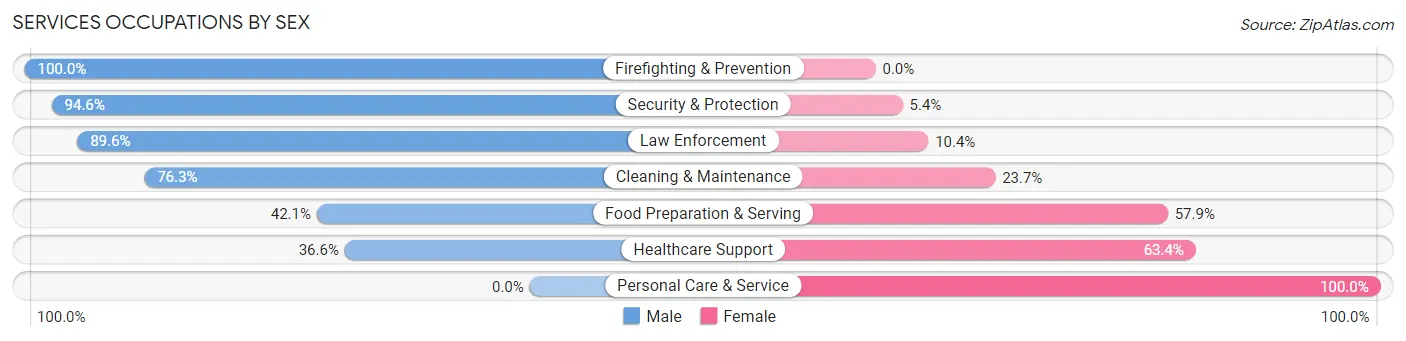
| Occupation | Male | Female |
| Healthcare Support | 82 (36.6%) | 142 (63.4%) |
| Security & Protection | 212 (94.6%) | 12 (5.4%) |
| Firefighting & Prevention | 109 (100.0%) | 0 (0.0%) |
| Law Enforcement | 103 (89.6%) | 12 (10.4%) |
| Food Preparation & Serving | 185 (42.1%) | 254 (57.9%) |
| Cleaning & Maintenance | 190 (76.3%) | 59 (23.7%) |
| Personal Care & Service | 0 (0.0%) | 55 (100.0%) |
| Total (Category) | 669 (56.2%) | 522 (43.8%) |
| Total (Overall) | 2,188 (52.0%) | 2,019 (48.0%) |
Sales and Office Occupations
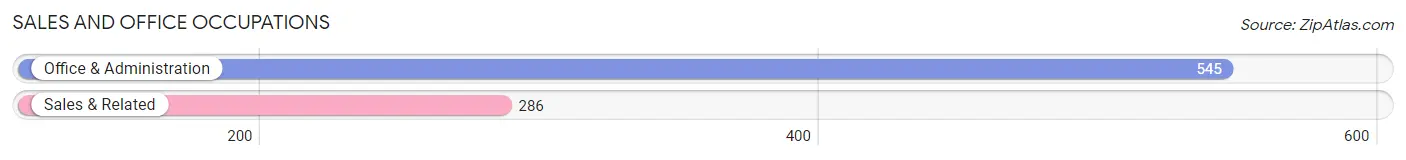
The most common Sales and Office occupations in Anaconda Deer Lodge County are Office & Administration (545 | 13.0%), and Sales & Related (286 | 6.8%).
Sales and Office Occupations by Sex
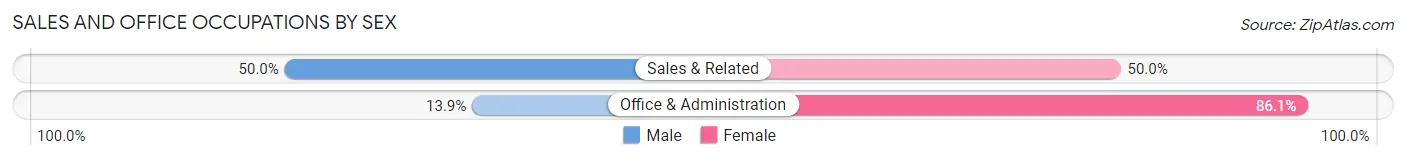
| Occupation | Male | Female |
| Sales & Related | 143 (50.0%) | 143 (50.0%) |
| Office & Administration | 76 (13.9%) | 469 (86.1%) |
| Total (Category) | 219 (26.4%) | 612 (73.7%) |
| Total (Overall) | 2,188 (52.0%) | 2,019 (48.0%) |
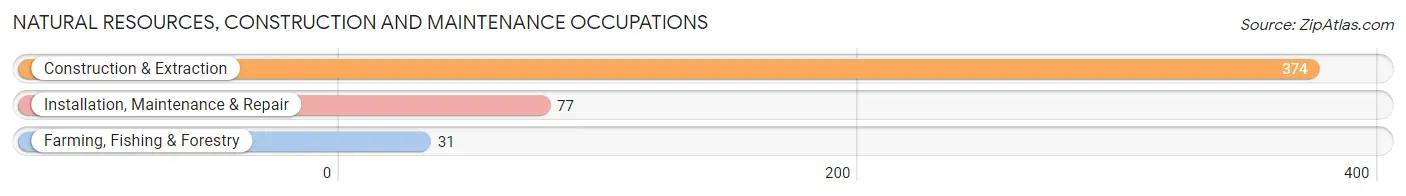
Natural Resources, Construction and Maintenance Occupations
The most common Natural Resources, Construction and Maintenance occupations in Anaconda Deer Lodge County are Construction & Extraction (374 | 8.9%), Installation, Maintenance & Repair (77 | 1.8%), and Farming, Fishing & Forestry (31 | 0.7%).
Natural Resources, Construction and Maintenance Occupations by Sex
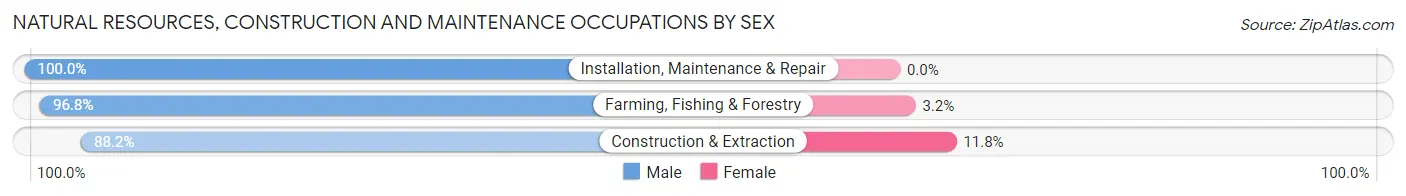
| Occupation | Male | Female |
| Farming, Fishing & Forestry | 30 (96.8%) | 1 (3.2%) |
| Construction & Extraction | 330 (88.2%) | 44 (11.8%) |
| Installation, Maintenance & Repair | 77 (100.0%) | 0 (0.0%) |
| Total (Category) | 437 (90.7%) | 45 (9.3%) |
| Total (Overall) | 2,188 (52.0%) | 2,019 (48.0%) |
Production, Transportation and Moving Occupations
The most common Production, Transportation and Moving occupations in Anaconda Deer Lodge County are Production (292 | 6.9%), Transportation (122 | 2.9%), and Material Moving (51 | 1.2%).
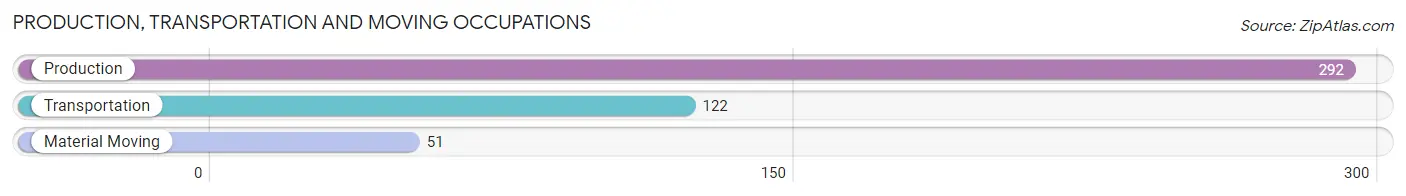
Production, Transportation and Moving Occupations by Sex
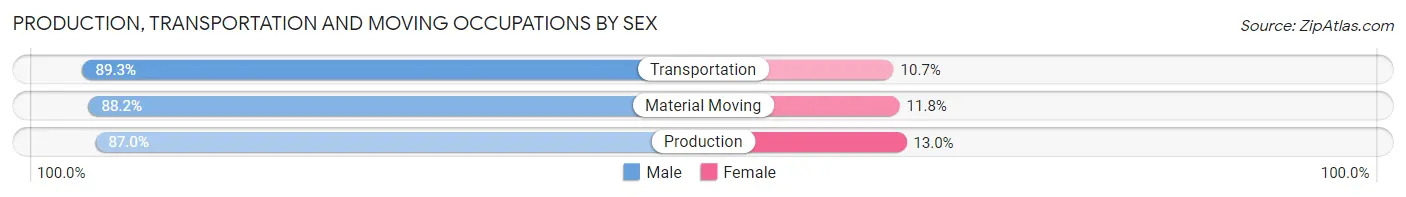
| Occupation | Male | Female |
| Production | 254 (87.0%) | 38 (13.0%) |
| Transportation | 109 (89.3%) | 13 (10.7%) |
| Material Moving | 45 (88.2%) | 6 (11.8%) |
| Total (Category) | 408 (87.7%) | 57 (12.3%) |
| Total (Overall) | 2,188 (52.0%) | 2,019 (48.0%) |
Employment Industries by Sex in Anaconda Deer Lodge County
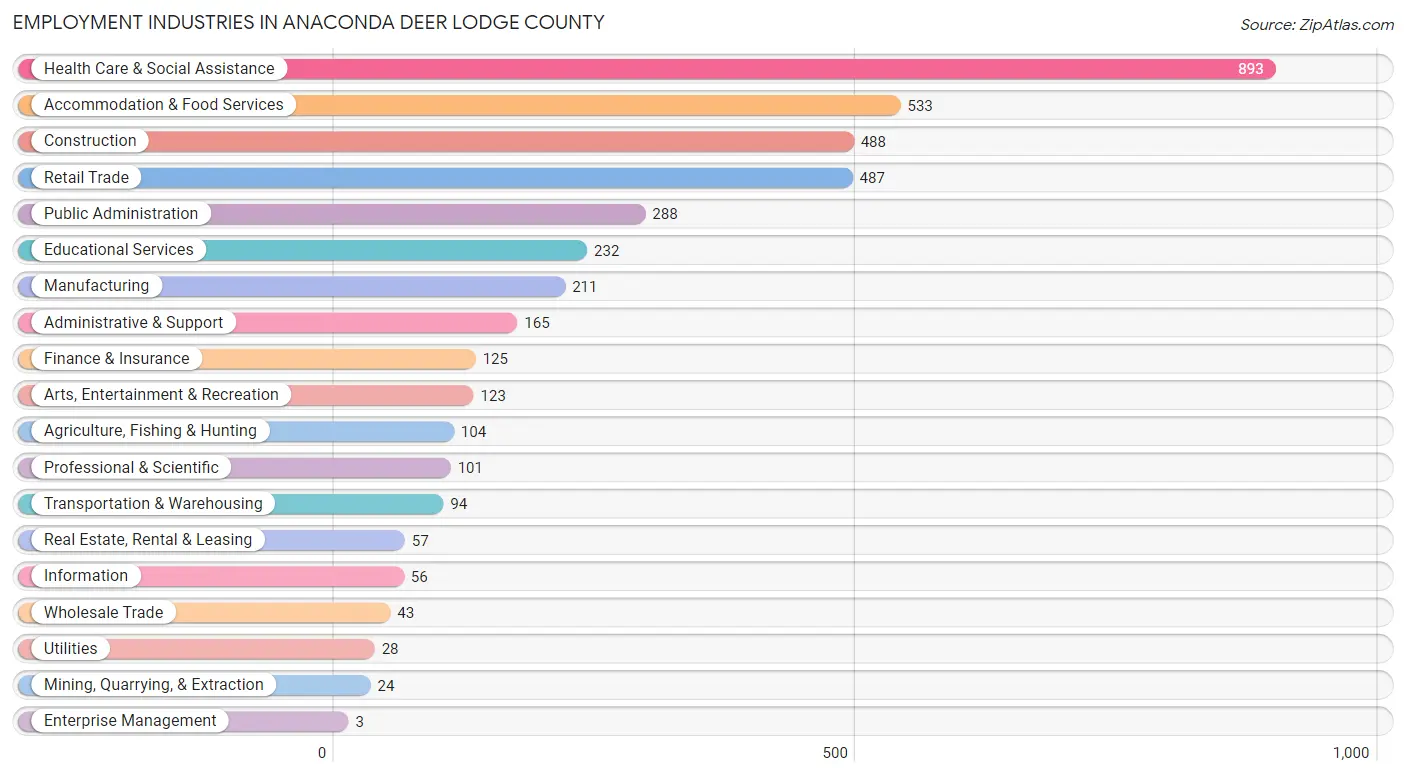
Employment Industries in Anaconda Deer Lodge County
The major employment industries in Anaconda Deer Lodge County include Health Care & Social Assistance (893 | 21.2%), Accommodation & Food Services (533 | 12.7%), Construction (488 | 11.6%), Retail Trade (487 | 11.6%), and Public Administration (288 | 6.9%).
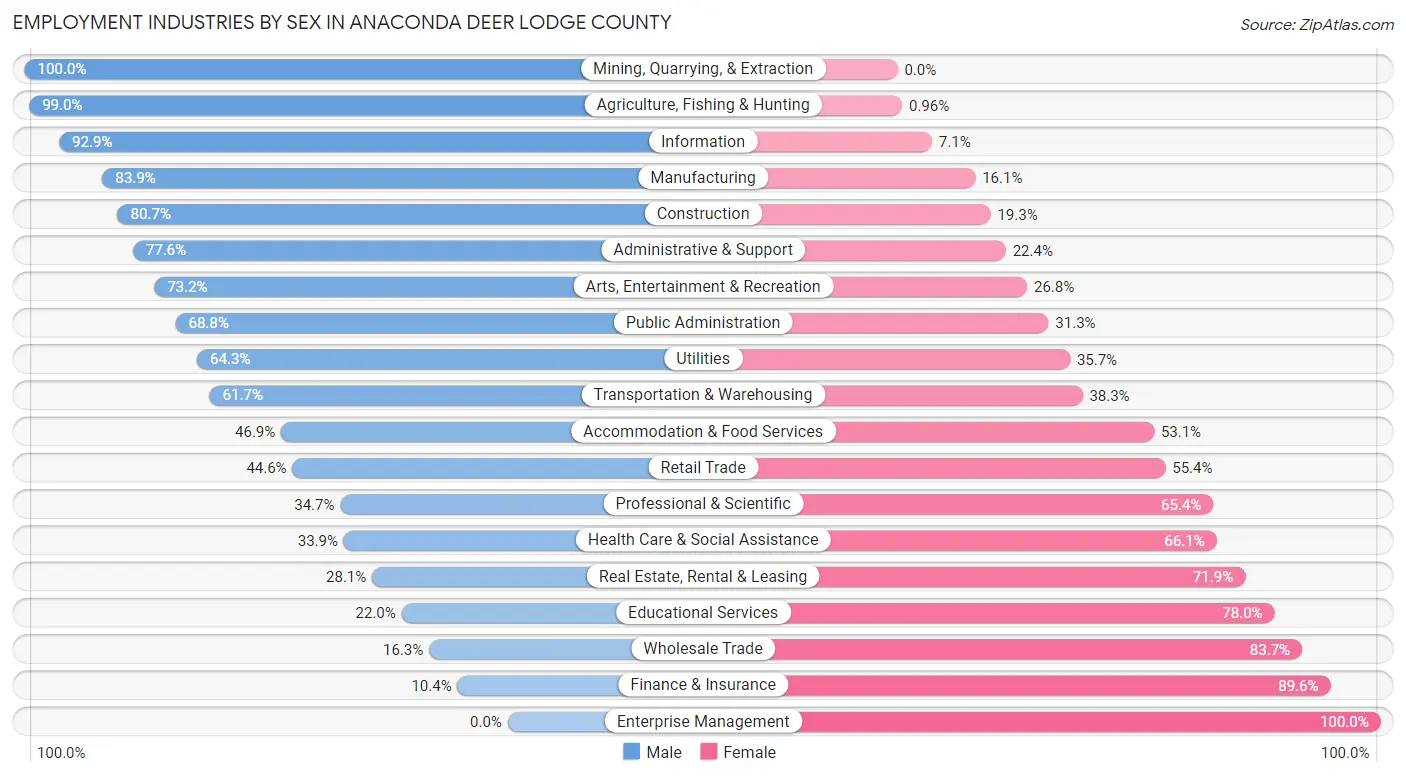
Employment Industries by Sex in Anaconda Deer Lodge County
The Anaconda Deer Lodge County industries that see more men than women are Mining, Quarrying, & Extraction (100.0%), Agriculture, Fishing & Hunting (99.0%), and Information (92.9%), whereas the industries that tend to have a higher number of women are Enterprise Management (100.0%), Finance & Insurance (89.6%), and Wholesale Trade (83.7%).
| Industry | Male | Female |
| Agriculture, Fishing & Hunting | 103 (99.0%) | 1 (1.0%) |
| Mining, Quarrying, & Extraction | 24 (100.0%) | 0 (0.0%) |
| Construction | 394 (80.7%) | 94 (19.3%) |
| Manufacturing | 177 (83.9%) | 34 (16.1%) |
| Wholesale Trade | 7 (16.3%) | 36 (83.7%) |
| Retail Trade | 217 (44.6%) | 270 (55.4%) |
| Transportation & Warehousing | 58 (61.7%) | 36 (38.3%) |
| Utilities | 18 (64.3%) | 10 (35.7%) |
| Information | 52 (92.9%) | 4 (7.1%) |
| Finance & Insurance | 13 (10.4%) | 112 (89.6%) |
| Real Estate, Rental & Leasing | 16 (28.1%) | 41 (71.9%) |
| Professional & Scientific | 35 (34.6%) | 66 (65.3%) |
| Enterprise Management | 0 (0.0%) | 3 (100.0%) |
| Administrative & Support | 128 (77.6%) | 37 (22.4%) |
| Educational Services | 51 (22.0%) | 181 (78.0%) |
| Health Care & Social Assistance | 303 (33.9%) | 590 (66.1%) |
| Arts, Entertainment & Recreation | 90 (73.2%) | 33 (26.8%) |
| Accommodation & Food Services | 250 (46.9%) | 283 (53.1%) |
| Public Administration | 198 (68.8%) | 90 (31.2%) |
| Total | 2,188 (52.0%) | 2,019 (48.0%) |
Education in Anaconda Deer Lodge County
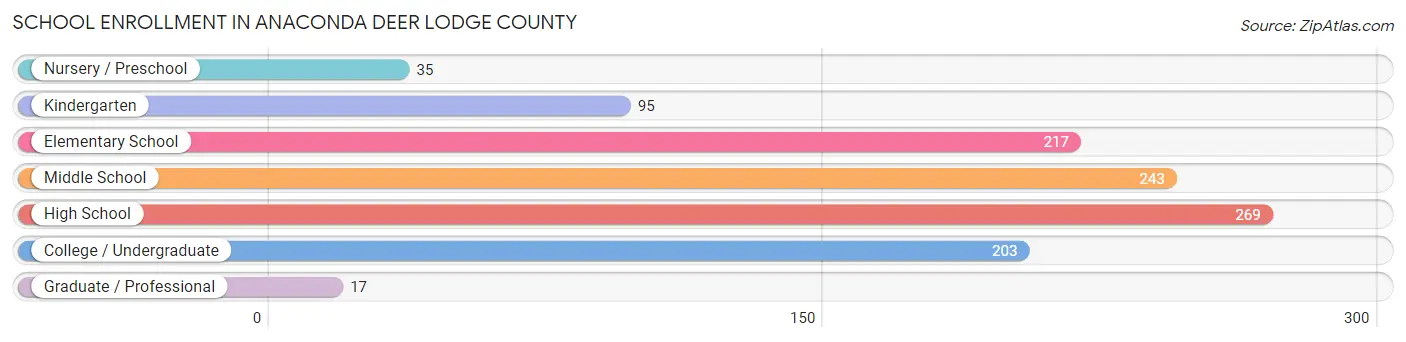
School Enrollment in Anaconda Deer Lodge County
The most common levels of schooling among the 1,079 students in Anaconda Deer Lodge County are high school (269 | 24.9%), middle school (243 | 22.5%), and elementary school (217 | 20.1%).
| School Level | # Students | % Students |
| Nursery / Preschool | 35 | 3.2% |
| Kindergarten | 95 | 8.8% |
| Elementary School | 217 | 20.1% |
| Middle School | 243 | 22.5% |
| High School | 269 | 24.9% |
| College / Undergraduate | 203 | 18.8% |
| Graduate / Professional | 17 | 1.6% |
| Total | 1,079 | 100.0% |
School Enrollment by Age by Funding Source in Anaconda Deer Lodge County
Out of a total of 1,079 students who are enrolled in schools in Anaconda Deer Lodge County, 148 (13.7%) attend a private institution, while the remaining 931 (86.3%) are enrolled in public schools. The age group of 3 to 4 year olds has the highest likelihood of being enrolled in private schools, with 19 (100.0% in the age bracket) enrolled. Conversely, the age group of 20 to 24 year olds has the lowest likelihood of being enrolled in a private school, with 127 (100.0% in the age bracket) attending a public institution.
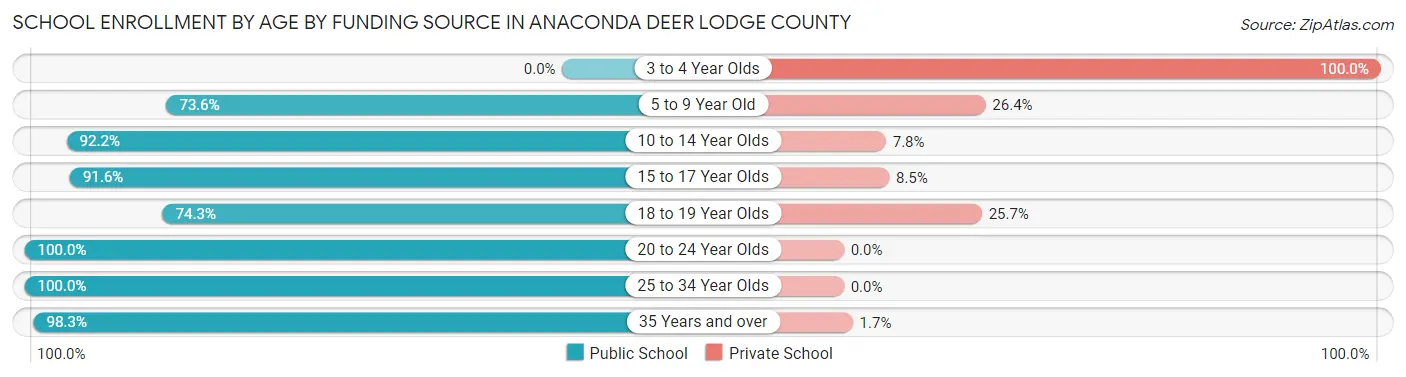
| Age Bracket | Public School | Private School |
| 3 to 4 Year Olds | 0 (0.0%) | 19 (100.0%) |
| 5 to 9 Year Old | 223 (73.6%) | 80 (26.4%) |
| 10 to 14 Year Olds | 247 (92.2%) | 21 (7.8%) |
| 15 to 17 Year Olds | 195 (91.5%) | 18 (8.5%) |
| 18 to 19 Year Olds | 26 (74.3%) | 9 (25.7%) |
| 20 to 24 Year Olds | 127 (100.0%) | 0 (0.0%) |
| 25 to 34 Year Olds | 54 (100.0%) | 0 (0.0%) |
| 35 Years and over | 59 (98.3%) | 1 (1.7%) |
| Total | 931 (86.3%) | 148 (13.7%) |
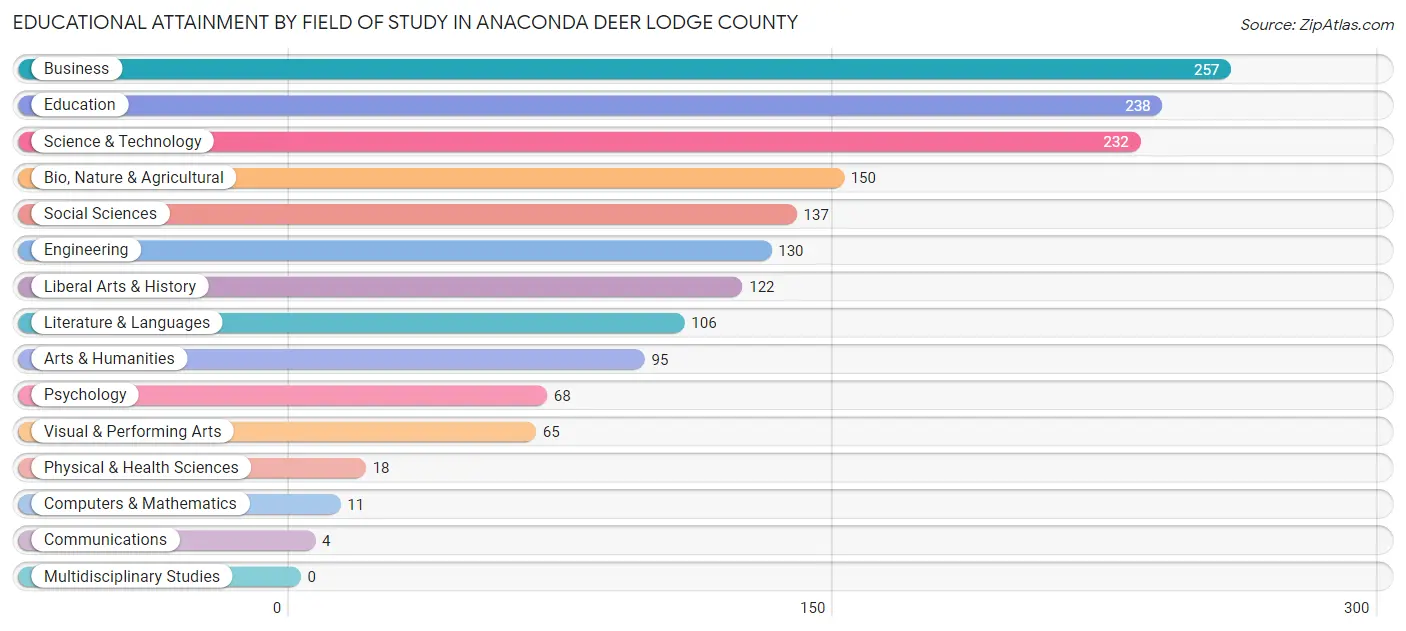
Educational Attainment by Field of Study in Anaconda Deer Lodge County
Business (257 | 15.7%), education (238 | 14.6%), science & technology (232 | 14.2%), bio, nature & agricultural (150 | 9.2%), and social sciences (137 | 8.4%) are the most common fields of study among 1,633 individuals in Anaconda Deer Lodge County who have obtained a bachelor's degree or higher.
| Field of Study | # Graduates | % Graduates |
| Computers & Mathematics | 11 | 0.7% |
| Bio, Nature & Agricultural | 150 | 9.2% |
| Physical & Health Sciences | 18 | 1.1% |
| Psychology | 68 | 4.2% |
| Social Sciences | 137 | 8.4% |
| Engineering | 130 | 8.0% |
| Multidisciplinary Studies | 0 | 0.0% |
| Science & Technology | 232 | 14.2% |
| Business | 257 | 15.7% |
| Education | 238 | 14.6% |
| Literature & Languages | 106 | 6.5% |
| Liberal Arts & History | 122 | 7.5% |
| Visual & Performing Arts | 65 | 4.0% |
| Communications | 4 | 0.2% |
| Arts & Humanities | 95 | 5.8% |
| Total | 1,633 | 100.0% |
Transportation & Commute in Anaconda Deer Lodge County
Vehicle Availability by Sex in Anaconda Deer Lodge County
The most prevalent vehicle ownership categories in Anaconda Deer Lodge County are males with 2 vehicles (735, accounting for 38.1%) and females with 2 vehicles (686, making up 38.6%).
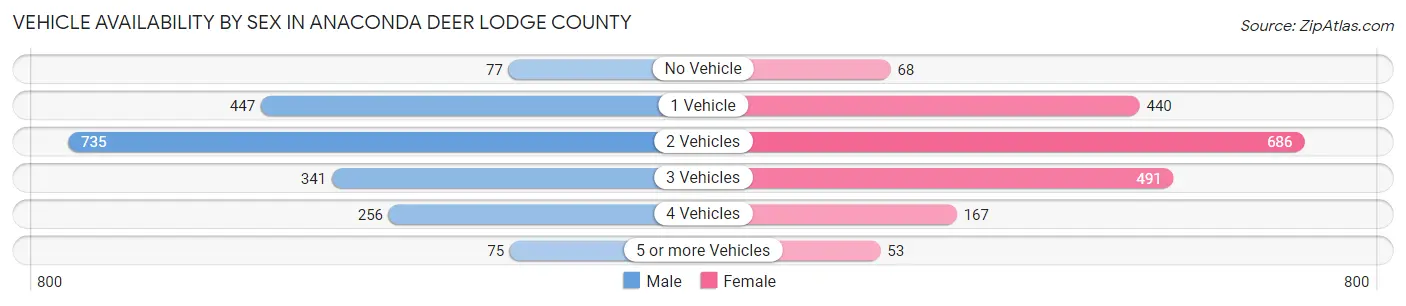
| Vehicles Available | Male | Female |
| No Vehicle | 77 (4.0%) | 68 (3.6%) |
| 1 Vehicle | 447 (23.2%) | 440 (23.1%) |
| 2 Vehicles | 735 (38.1%) | 686 (36.0%) |
| 3 Vehicles | 341 (17.7%) | 491 (25.8%) |
| 4 Vehicles | 256 (13.3%) | 167 (8.8%) |
| 5 or more Vehicles | 75 (3.9%) | 53 (2.8%) |
| Total | 1,931 (100.0%) | 1,905 (100.0%) |
Commute Time in Anaconda Deer Lodge County
The most frequently occuring commute durations in Anaconda Deer Lodge County are 5 to 9 minutes (705 commuters, 19.0%), 20 to 24 minutes (528 commuters, 14.2%), and 30 to 34 minutes (527 commuters, 14.2%).
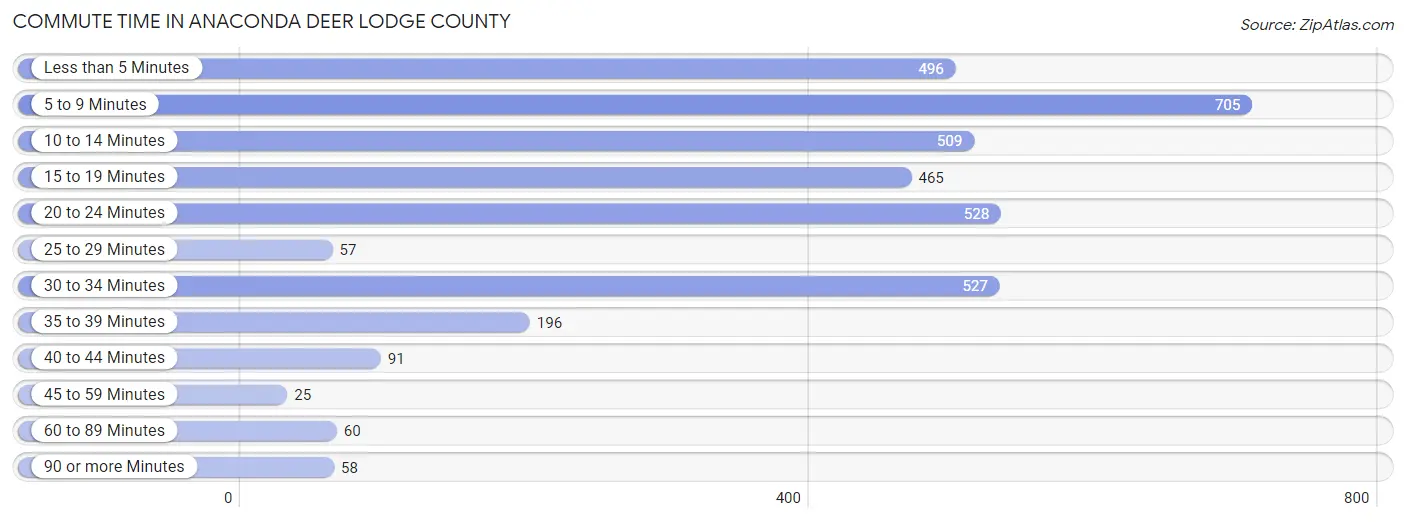
| Commute Time | # Commuters | % Commuters |
| Less than 5 Minutes | 496 | 13.3% |
| 5 to 9 Minutes | 705 | 19.0% |
| 10 to 14 Minutes | 509 | 13.7% |
| 15 to 19 Minutes | 465 | 12.5% |
| 20 to 24 Minutes | 528 | 14.2% |
| 25 to 29 Minutes | 57 | 1.5% |
| 30 to 34 Minutes | 527 | 14.2% |
| 35 to 39 Minutes | 196 | 5.3% |
| 40 to 44 Minutes | 91 | 2.5% |
| 45 to 59 Minutes | 25 | 0.7% |
| 60 to 89 Minutes | 60 | 1.6% |
| 90 or more Minutes | 58 | 1.6% |
Commute Time by Sex in Anaconda Deer Lodge County
The most common commute times in Anaconda Deer Lodge County are 20 to 24 minutes (356 commuters, 18.4%) for males and 5 to 9 minutes (422 commuters, 23.7%) for females.
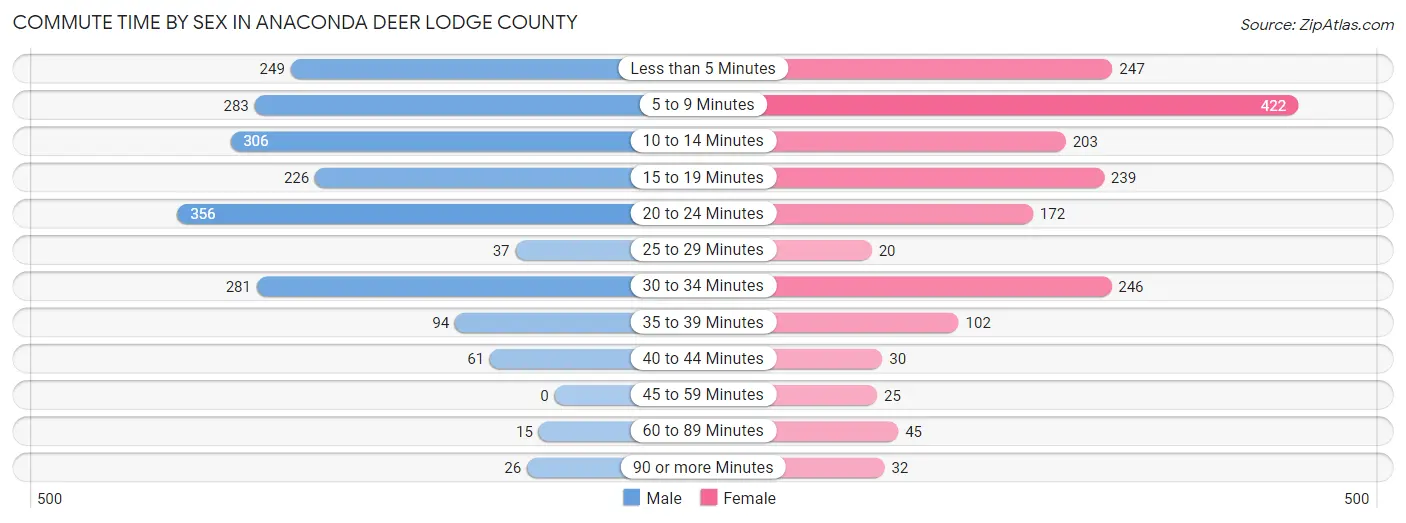
| Commute Time | Male | Female |
| Less than 5 Minutes | 249 (12.9%) | 247 (13.9%) |
| 5 to 9 Minutes | 283 (14.6%) | 422 (23.7%) |
| 10 to 14 Minutes | 306 (15.8%) | 203 (11.4%) |
| 15 to 19 Minutes | 226 (11.7%) | 239 (13.4%) |
| 20 to 24 Minutes | 356 (18.4%) | 172 (9.7%) |
| 25 to 29 Minutes | 37 (1.9%) | 20 (1.1%) |
| 30 to 34 Minutes | 281 (14.5%) | 246 (13.8%) |
| 35 to 39 Minutes | 94 (4.9%) | 102 (5.7%) |
| 40 to 44 Minutes | 61 (3.2%) | 30 (1.7%) |
| 45 to 59 Minutes | 0 (0.0%) | 25 (1.4%) |
| 60 to 89 Minutes | 15 (0.8%) | 45 (2.5%) |
| 90 or more Minutes | 26 (1.3%) | 32 (1.8%) |
Time of Departure to Work by Sex in Anaconda Deer Lodge County
The most frequent times of departure to work in Anaconda Deer Lodge County are 6:30 AM to 6:59 AM (286, 14.8%) for males and 8:00 AM to 8:29 AM (375, 21.0%) for females.
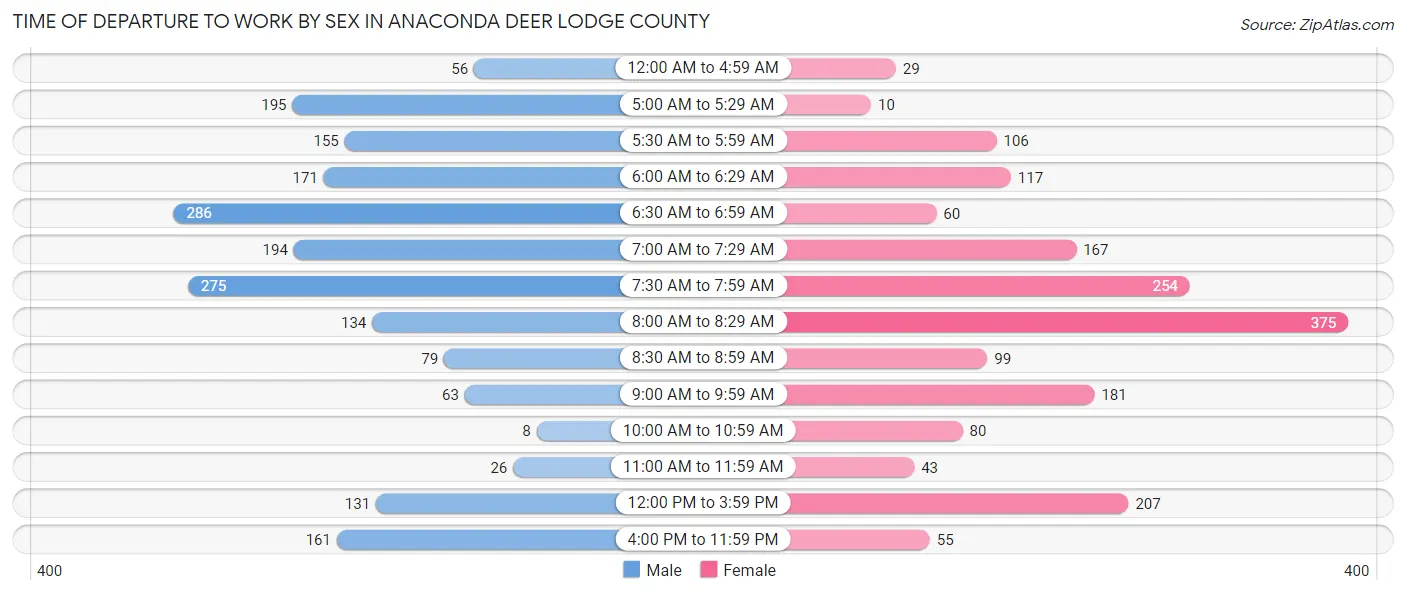
| Time of Departure | Male | Female |
| 12:00 AM to 4:59 AM | 56 (2.9%) | 29 (1.6%) |
| 5:00 AM to 5:29 AM | 195 (10.1%) | 10 (0.6%) |
| 5:30 AM to 5:59 AM | 155 (8.0%) | 106 (5.9%) |
| 6:00 AM to 6:29 AM | 171 (8.8%) | 117 (6.6%) |
| 6:30 AM to 6:59 AM | 286 (14.8%) | 60 (3.4%) |
| 7:00 AM to 7:29 AM | 194 (10.0%) | 167 (9.4%) |
| 7:30 AM to 7:59 AM | 275 (14.2%) | 254 (14.2%) |
| 8:00 AM to 8:29 AM | 134 (6.9%) | 375 (21.0%) |
| 8:30 AM to 8:59 AM | 79 (4.1%) | 99 (5.6%) |
| 9:00 AM to 9:59 AM | 63 (3.3%) | 181 (10.2%) |
| 10:00 AM to 10:59 AM | 8 (0.4%) | 80 (4.5%) |
| 11:00 AM to 11:59 AM | 26 (1.3%) | 43 (2.4%) |
| 12:00 PM to 3:59 PM | 131 (6.8%) | 207 (11.6%) |
| 4:00 PM to 11:59 PM | 161 (8.3%) | 55 (3.1%) |
| Total | 1,934 (100.0%) | 1,783 (100.0%) |
Housing Occupancy in Anaconda Deer Lodge County
Occupancy by Ownership in Anaconda Deer Lodge County
Of the total 4,336 dwellings in Anaconda Deer Lodge County, owner-occupied units account for 2,858 (65.9%), while renter-occupied units make up 1,478 (34.1%).
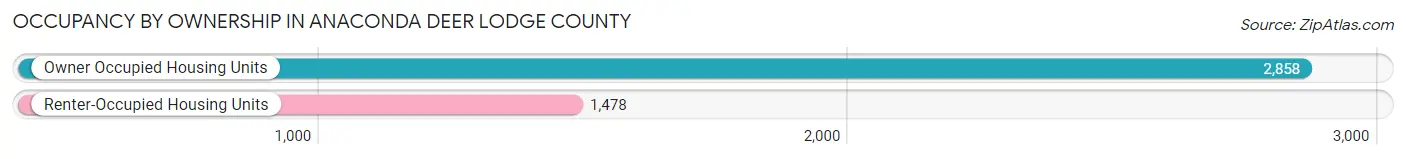
| Occupancy | # Housing Units | % Housing Units |
| Owner Occupied Housing Units | 2,858 | 65.9% |
| Renter-Occupied Housing Units | 1,478 | 34.1% |
| Total Occupied Housing Units | 4,336 | 100.0% |
Occupancy by Household Size in Anaconda Deer Lodge County
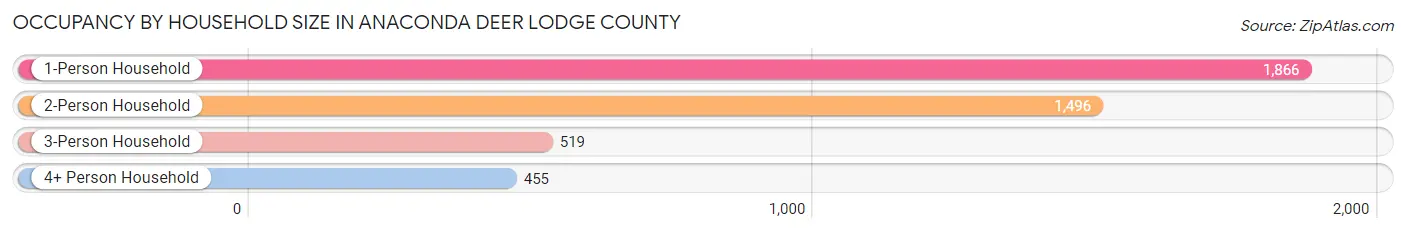
| Household Size | # Housing Units | % Housing Units |
| 1-Person Household | 1,866 | 43.0% |
| 2-Person Household | 1,496 | 34.5% |
| 3-Person Household | 519 | 12.0% |
| 4+ Person Household | 455 | 10.5% |
| Total Housing Units | 4,336 | 100.0% |
Occupancy by Ownership by Household Size in Anaconda Deer Lodge County
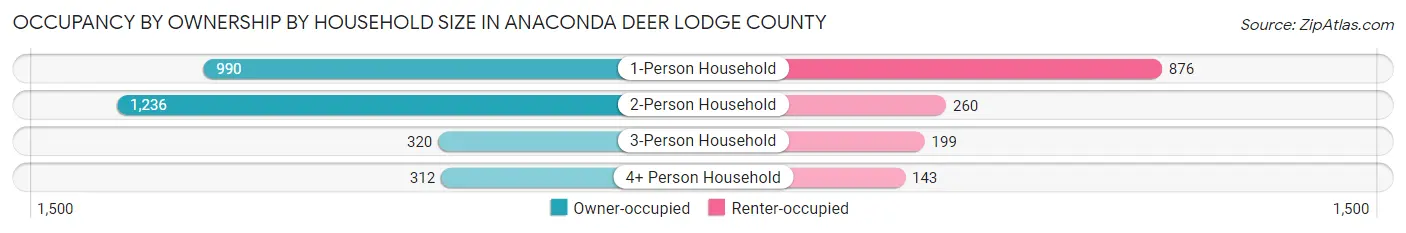
| Household Size | Owner-occupied | Renter-occupied |
| 1-Person Household | 990 (53.0%) | 876 (46.9%) |
| 2-Person Household | 1,236 (82.6%) | 260 (17.4%) |
| 3-Person Household | 320 (61.7%) | 199 (38.3%) |
| 4+ Person Household | 312 (68.6%) | 143 (31.4%) |
| Total Housing Units | 2,858 (65.9%) | 1,478 (34.1%) |
Occupancy by Educational Attainment in Anaconda Deer Lodge County
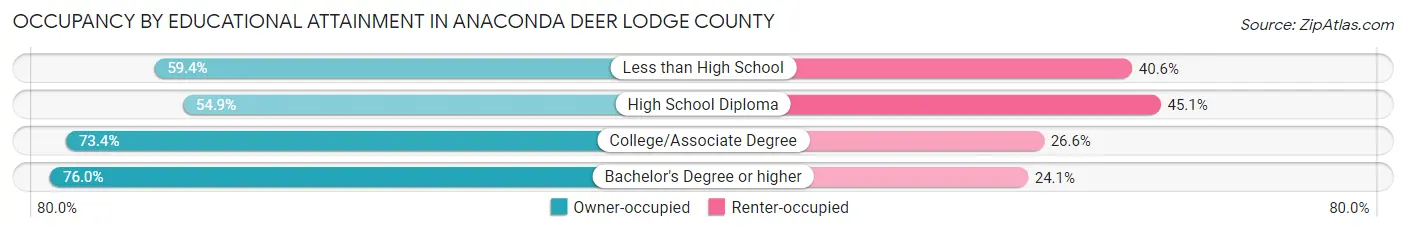
| Household Size | Owner-occupied | Renter-occupied |
| Less than High School | 107 (59.4%) | 73 (40.6%) |
| High School Diploma | 965 (54.9%) | 793 (45.1%) |
| College/Associate Degree | 1,028 (73.4%) | 372 (26.6%) |
| Bachelor's Degree or higher | 758 (75.9%) | 240 (24.0%) |
Occupancy by Age of Householder in Anaconda Deer Lodge County
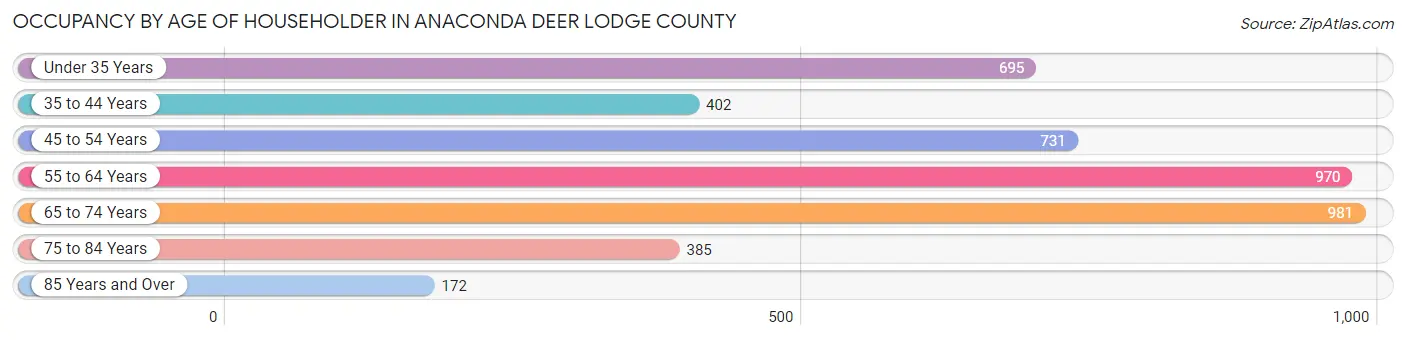
| Age Bracket | # Households | % Households |
| Under 35 Years | 695 | 16.0% |
| 35 to 44 Years | 402 | 9.3% |
| 45 to 54 Years | 731 | 16.9% |
| 55 to 64 Years | 970 | 22.4% |
| 65 to 74 Years | 981 | 22.6% |
| 75 to 84 Years | 385 | 8.9% |
| 85 Years and Over | 172 | 4.0% |
| Total | 4,336 | 100.0% |
Housing Finances in Anaconda Deer Lodge County
Median Income by Occupancy in Anaconda Deer Lodge County
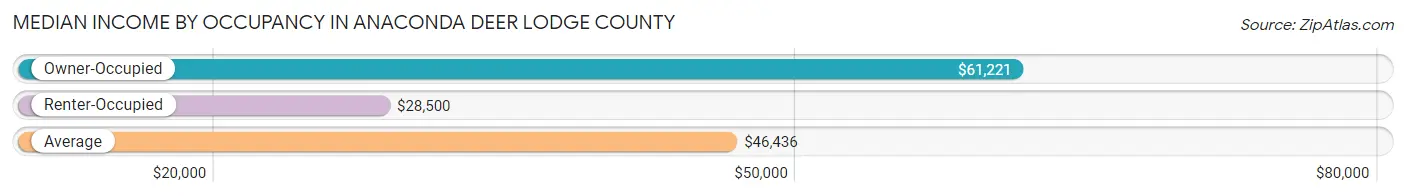
| Occupancy Type | # Households | Median Income |
| Owner-Occupied | 2,858 (65.9%) | $61,221 |
| Renter-Occupied | 1,478 (34.1%) | $28,500 |
| Average | 4,336 (100.0%) | $46,436 |
Occupancy by Householder Income Bracket in Anaconda Deer Lodge County
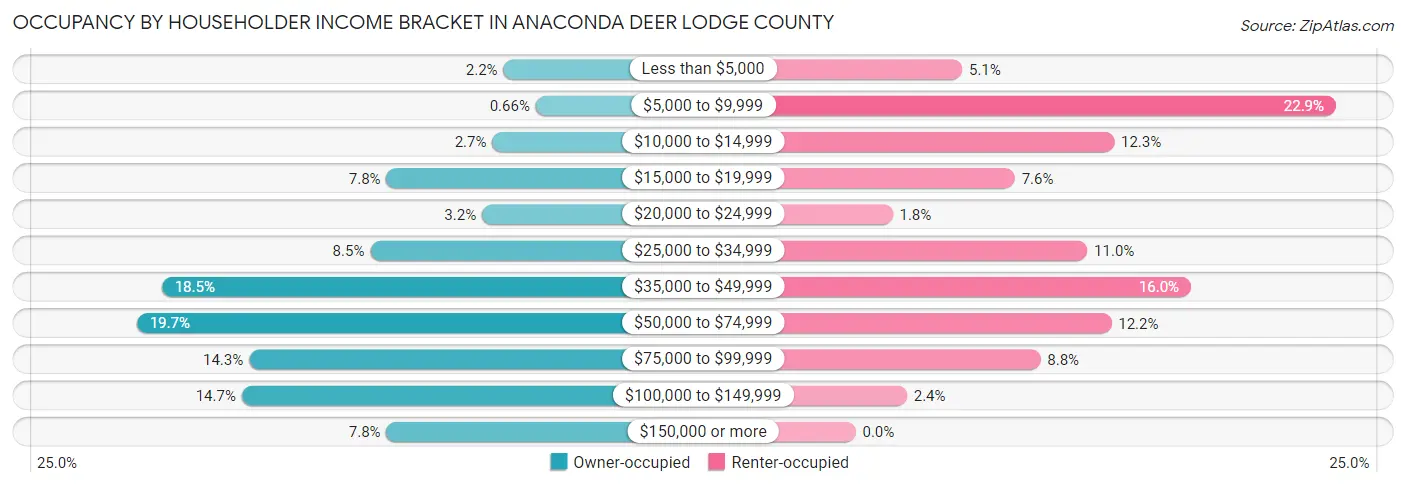
| Income Bracket | Owner-occupied | Renter-occupied |
| Less than $5,000 | 63 (2.2%) | 75 (5.1%) |
| $5,000 to $9,999 | 19 (0.7%) | 338 (22.9%) |
| $10,000 to $14,999 | 78 (2.7%) | 182 (12.3%) |
| $15,000 to $19,999 | 222 (7.8%) | 112 (7.6%) |
| $20,000 to $24,999 | 92 (3.2%) | 26 (1.8%) |
| $25,000 to $34,999 | 244 (8.5%) | 163 (11.0%) |
| $35,000 to $49,999 | 528 (18.5%) | 236 (16.0%) |
| $50,000 to $74,999 | 562 (19.7%) | 180 (12.2%) |
| $75,000 to $99,999 | 409 (14.3%) | 130 (8.8%) |
| $100,000 to $149,999 | 419 (14.7%) | 36 (2.4%) |
| $150,000 or more | 222 (7.8%) | 0 (0.0%) |
| Total | 2,858 (100.0%) | 1,478 (100.0%) |
Monthly Housing Cost Tiers in Anaconda Deer Lodge County
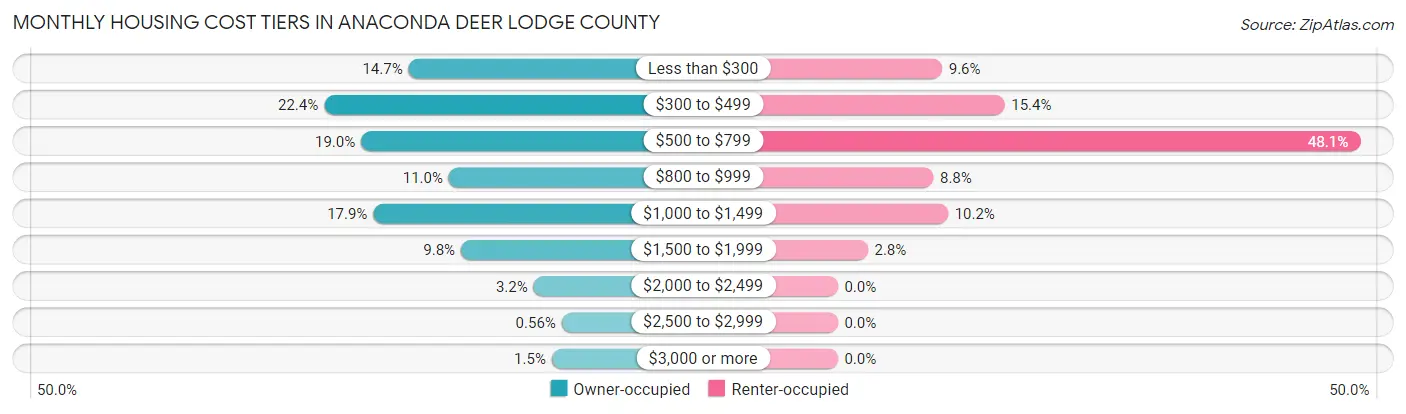
| Monthly Cost | Owner-occupied | Renter-occupied |
| Less than $300 | 419 (14.7%) | 142 (9.6%) |
| $300 to $499 | 641 (22.4%) | 227 (15.4%) |
| $500 to $799 | 544 (19.0%) | 711 (48.1%) |
| $800 to $999 | 313 (11.0%) | 130 (8.8%) |
| $1,000 to $1,499 | 512 (17.9%) | 150 (10.2%) |
| $1,500 to $1,999 | 281 (9.8%) | 41 (2.8%) |
| $2,000 to $2,499 | 90 (3.2%) | 0 (0.0%) |
| $2,500 to $2,999 | 16 (0.6%) | 0 (0.0%) |
| $3,000 or more | 42 (1.5%) | 0 (0.0%) |
| Total | 2,858 (100.0%) | 1,478 (100.0%) |
Physical Housing Characteristics in Anaconda Deer Lodge County
Housing Structures in Anaconda Deer Lodge County
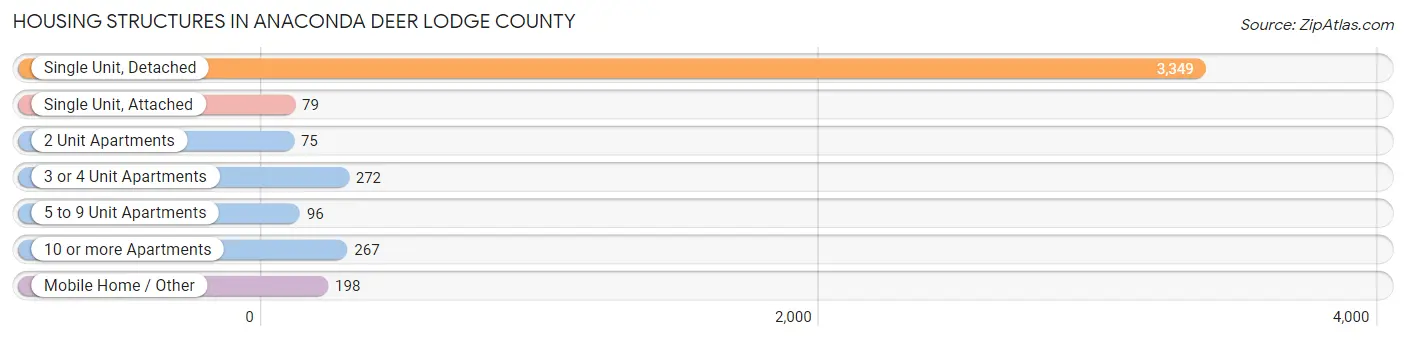
| Structure Type | # Housing Units | % Housing Units |
| Single Unit, Detached | 3,349 | 77.2% |
| Single Unit, Attached | 79 | 1.8% |
| 2 Unit Apartments | 75 | 1.7% |
| 3 or 4 Unit Apartments | 272 | 6.3% |
| 5 to 9 Unit Apartments | 96 | 2.2% |
| 10 or more Apartments | 267 | 6.2% |
| Mobile Home / Other | 198 | 4.6% |
| Total | 4,336 | 100.0% |
Housing Structures by Occupancy in Anaconda Deer Lodge County
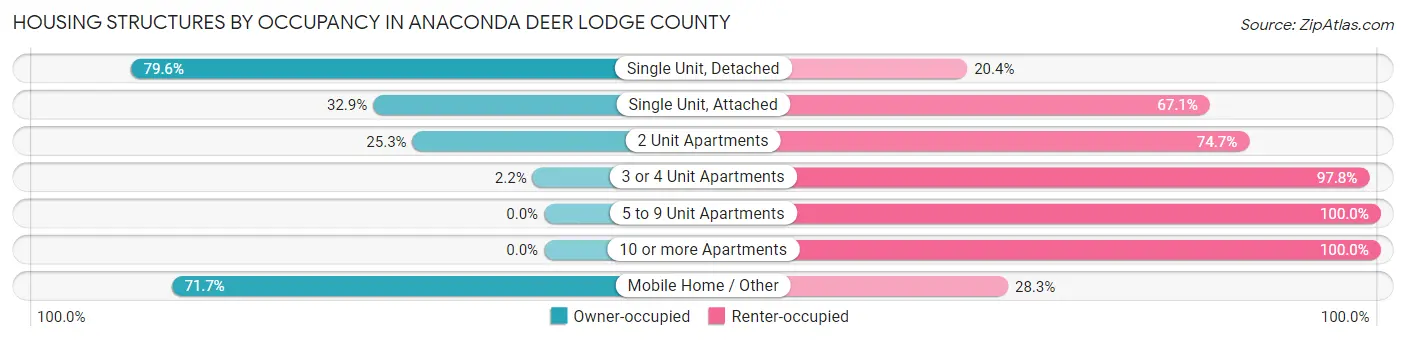
| Structure Type | Owner-occupied | Renter-occupied |
| Single Unit, Detached | 2,665 (79.6%) | 684 (20.4%) |
| Single Unit, Attached | 26 (32.9%) | 53 (67.1%) |
| 2 Unit Apartments | 19 (25.3%) | 56 (74.7%) |
| 3 or 4 Unit Apartments | 6 (2.2%) | 266 (97.8%) |
| 5 to 9 Unit Apartments | 0 (0.0%) | 96 (100.0%) |
| 10 or more Apartments | 0 (0.0%) | 267 (100.0%) |
| Mobile Home / Other | 142 (71.7%) | 56 (28.3%) |
| Total | 2,858 (65.9%) | 1,478 (34.1%) |
Housing Structures by Number of Rooms in Anaconda Deer Lodge County
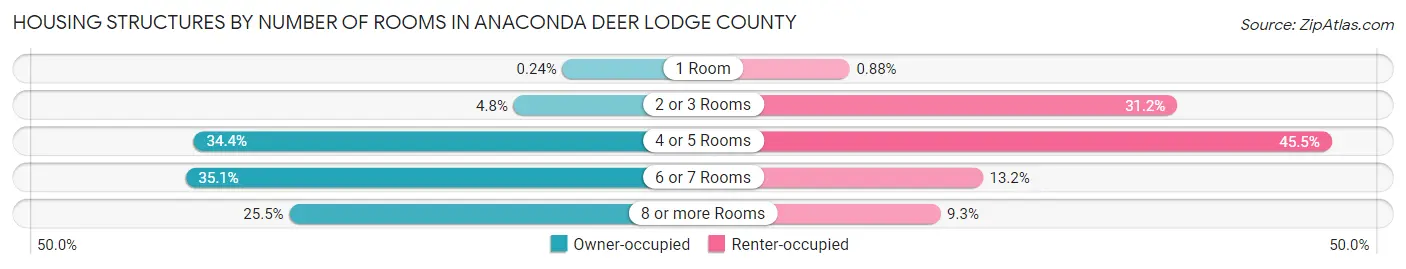
| Number of Rooms | Owner-occupied | Renter-occupied |
| 1 Room | 7 (0.2%) | 13 (0.9%) |
| 2 or 3 Rooms | 136 (4.8%) | 461 (31.2%) |
| 4 or 5 Rooms | 982 (34.4%) | 672 (45.5%) |
| 6 or 7 Rooms | 1,004 (35.1%) | 195 (13.2%) |
| 8 or more Rooms | 729 (25.5%) | 137 (9.3%) |
| Total | 2,858 (100.0%) | 1,478 (100.0%) |
Housing Structure by Heating Type in Anaconda Deer Lodge County
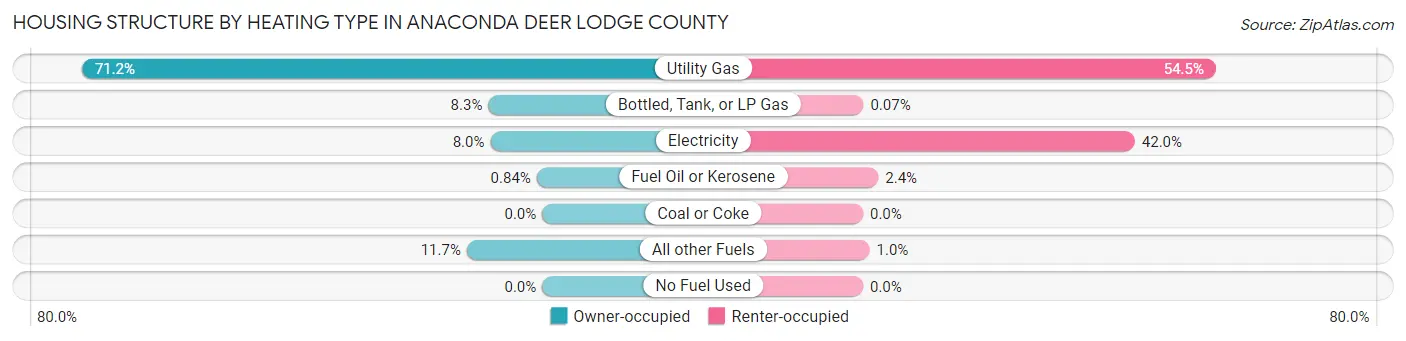
| Heating Type | Owner-occupied | Renter-occupied |
| Utility Gas | 2,034 (71.2%) | 806 (54.5%) |
| Bottled, Tank, or LP Gas | 238 (8.3%) | 1 (0.1%) |
| Electricity | 229 (8.0%) | 621 (42.0%) |
| Fuel Oil or Kerosene | 24 (0.8%) | 35 (2.4%) |
| Coal or Coke | 0 (0.0%) | 0 (0.0%) |
| All other Fuels | 333 (11.7%) | 15 (1.0%) |
| No Fuel Used | 0 (0.0%) | 0 (0.0%) |
| Total | 2,858 (100.0%) | 1,478 (100.0%) |
Household Vehicle Usage in Anaconda Deer Lodge County
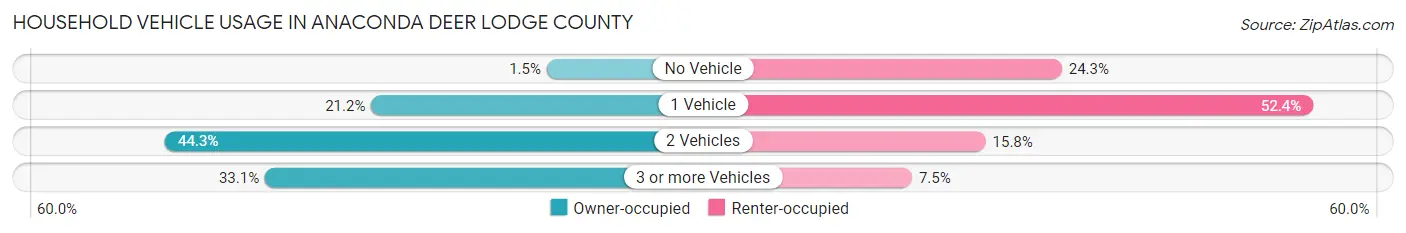
| Vehicles per Household | Owner-occupied | Renter-occupied |
| No Vehicle | 43 (1.5%) | 359 (24.3%) |
| 1 Vehicle | 605 (21.2%) | 775 (52.4%) |
| 2 Vehicles | 1,265 (44.3%) | 233 (15.8%) |
| 3 or more Vehicles | 945 (33.1%) | 111 (7.5%) |
| Total | 2,858 (100.0%) | 1,478 (100.0%) |
Real Estate & Mortgages in Anaconda Deer Lodge County
Real Estate and Mortgage Overview in Anaconda Deer Lodge County
| Characteristic | Without Mortgage | With Mortgage |
| Housing Units | 1,463 | 1,395 |
| Median Property Value | $151,900 | $197,700 |
| Median Household Income | $46,911 | $181 |
| Monthly Housing Costs | $382 | $42 |
| Real Estate Taxes | $1,417 | $29 |
Property Value by Mortgage Status in Anaconda Deer Lodge County
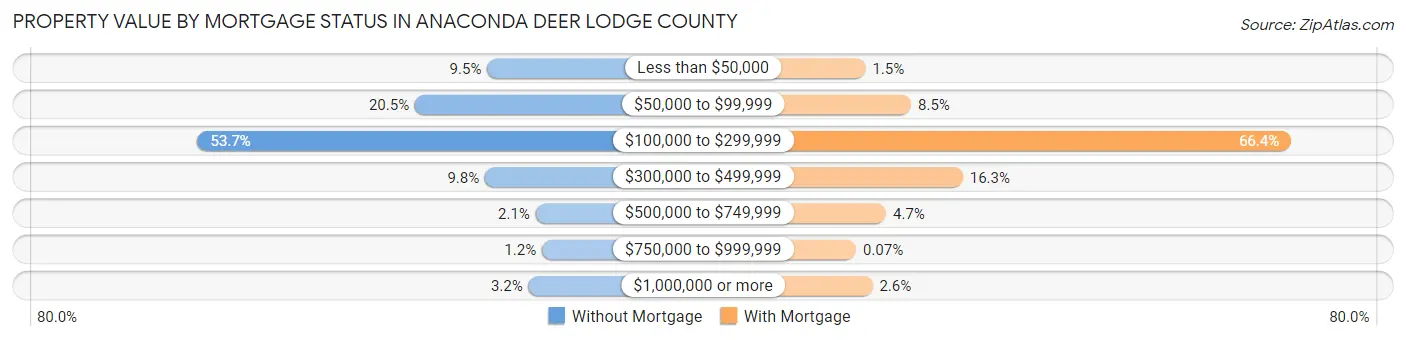
| Property Value | Without Mortgage | With Mortgage |
| Less than $50,000 | 139 (9.5%) | 21 (1.5%) |
| $50,000 to $99,999 | 300 (20.5%) | 118 (8.5%) |
| $100,000 to $299,999 | 785 (53.7%) | 926 (66.4%) |
| $300,000 to $499,999 | 144 (9.8%) | 228 (16.3%) |
| $500,000 to $749,999 | 31 (2.1%) | 65 (4.7%) |
| $750,000 to $999,999 | 17 (1.2%) | 1 (0.1%) |
| $1,000,000 or more | 47 (3.2%) | 36 (2.6%) |
| Total | 1,463 (100.0%) | 1,395 (100.0%) |
Household Income by Mortgage Status in Anaconda Deer Lodge County
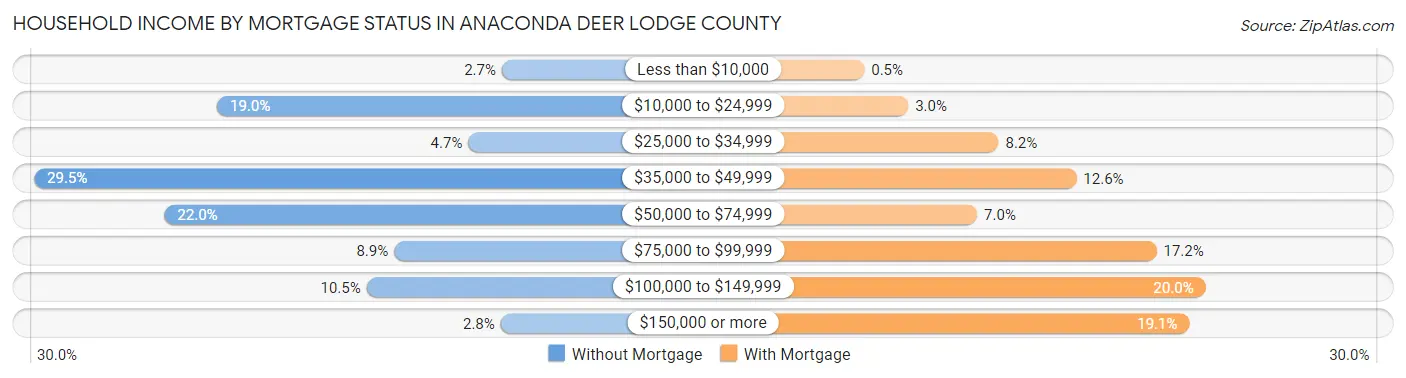
| Household Income | Without Mortgage | With Mortgage |
| Less than $10,000 | 40 (2.7%) | 7 (0.5%) |
| $10,000 to $24,999 | 278 (19.0%) | 42 (3.0%) |
| $25,000 to $34,999 | 68 (4.6%) | 114 (8.2%) |
| $35,000 to $49,999 | 431 (29.5%) | 176 (12.6%) |
| $50,000 to $74,999 | 322 (22.0%) | 97 (7.0%) |
| $75,000 to $99,999 | 130 (8.9%) | 240 (17.2%) |
| $100,000 to $149,999 | 153 (10.5%) | 279 (20.0%) |
| $150,000 or more | 41 (2.8%) | 266 (19.1%) |
| Total | 1,463 (100.0%) | 1,395 (100.0%) |
Property Value to Household Income Ratio in Anaconda Deer Lodge County
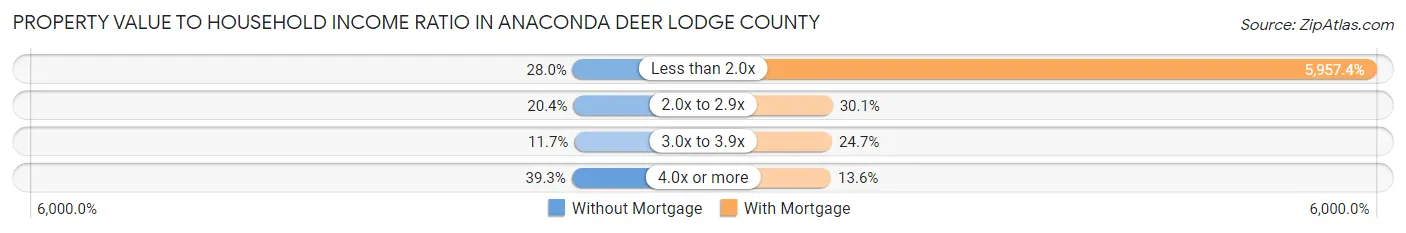
| Value-to-Income Ratio | Without Mortgage | With Mortgage |
| Less than 2.0x | 409 (28.0%) | 83,105 (5,957.4%) |
| 2.0x to 2.9x | 299 (20.4%) | 420 (30.1%) |
| 3.0x to 3.9x | 171 (11.7%) | 344 (24.7%) |
| 4.0x or more | 575 (39.3%) | 189 (13.6%) |
| Total | 1,463 (100.0%) | 1,395 (100.0%) |
Real Estate Taxes by Mortgage Status in Anaconda Deer Lodge County
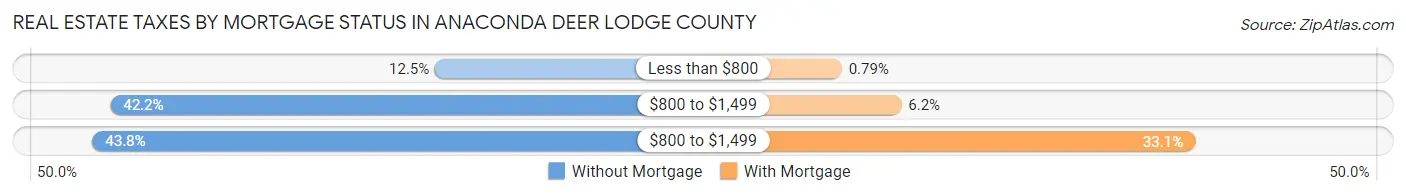
| Property Taxes | Without Mortgage | With Mortgage |
| Less than $800 | 183 (12.5%) | 11 (0.8%) |
| $800 to $1,499 | 617 (42.2%) | 87 (6.2%) |
| $800 to $1,499 | 641 (43.8%) | 461 (33.1%) |
| Total | 1,463 (100.0%) | 1,395 (100.0%) |
Health & Disability in Anaconda Deer Lodge County
Health Insurance Coverage by Age in Anaconda Deer Lodge County
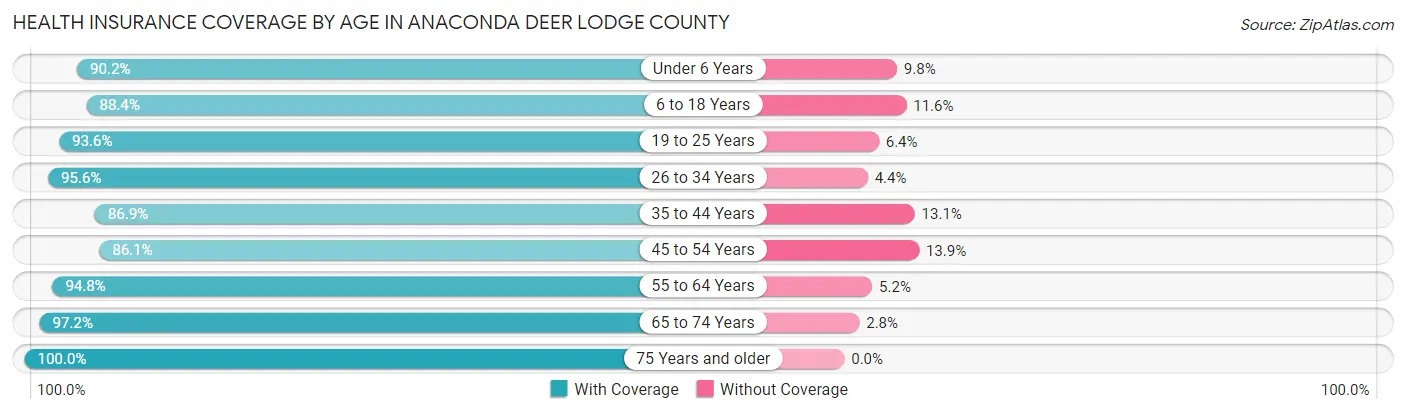
| Age Bracket | With Coverage | Without Coverage |
| Under 6 Years | 340 (90.2%) | 37 (9.8%) |
| 6 to 18 Years | 788 (88.4%) | 103 (11.6%) |
| 19 to 25 Years | 699 (93.6%) | 48 (6.4%) |
| 26 to 34 Years | 897 (95.6%) | 41 (4.4%) |
| 35 to 44 Years | 821 (86.9%) | 124 (13.1%) |
| 45 to 54 Years | 1,050 (86.1%) | 170 (13.9%) |
| 55 to 64 Years | 1,513 (94.8%) | 83 (5.2%) |
| 65 to 74 Years | 1,431 (97.2%) | 41 (2.8%) |
| 75 Years and older | 839 (100.0%) | 0 (0.0%) |
| Total | 8,378 (92.8%) | 647 (7.2%) |
Health Insurance Coverage by Citizenship Status in Anaconda Deer Lodge County
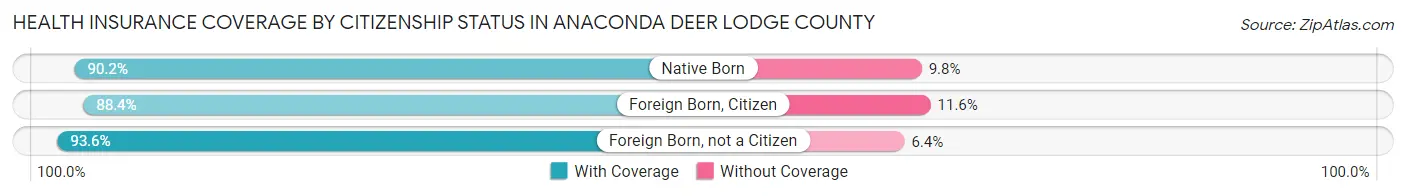
| Citizenship Status | With Coverage | Without Coverage |
| Native Born | 340 (90.2%) | 37 (9.8%) |
| Foreign Born, Citizen | 788 (88.4%) | 103 (11.6%) |
| Foreign Born, not a Citizen | 699 (93.6%) | 48 (6.4%) |
Health Insurance Coverage by Household Income in Anaconda Deer Lodge County
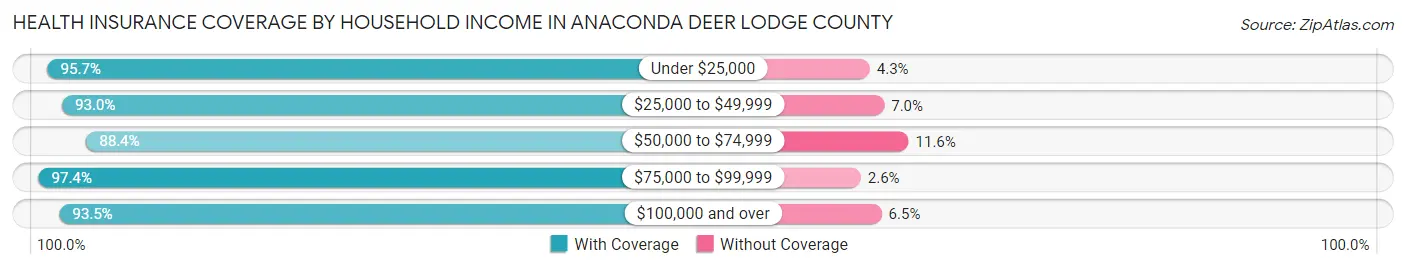
| Household Income | With Coverage | Without Coverage |
| Under $25,000 | 1,816 (95.7%) | 82 (4.3%) |
| $25,000 to $49,999 | 1,749 (93.0%) | 132 (7.0%) |
| $50,000 to $74,999 | 1,382 (88.4%) | 181 (11.6%) |
| $75,000 to $99,999 | 1,186 (97.4%) | 32 (2.6%) |
| $100,000 and over | 1,860 (93.5%) | 130 (6.5%) |
Public vs Private Health Insurance Coverage by Age in Anaconda Deer Lodge County
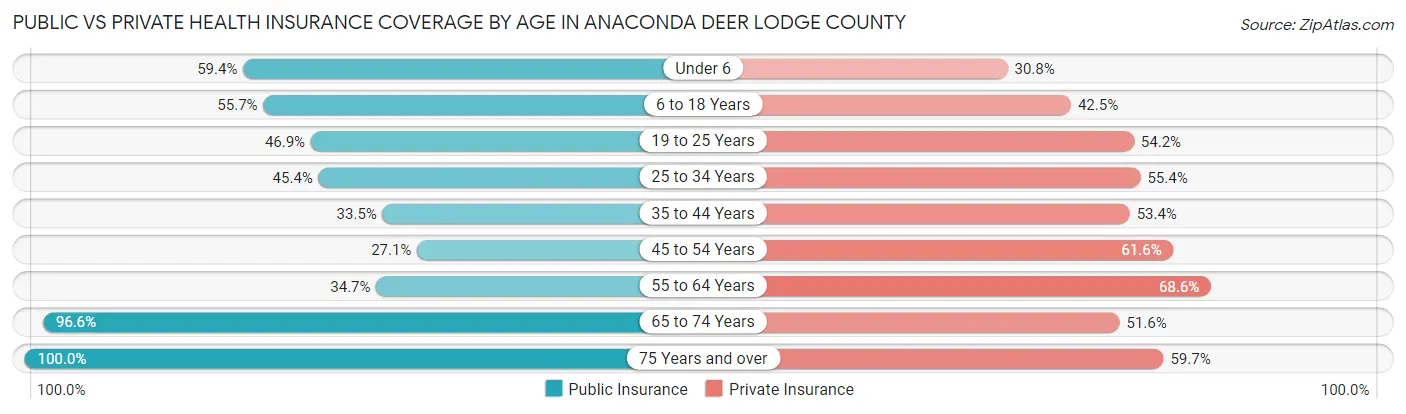
| Age Bracket | Public Insurance | Private Insurance |
| Under 6 | 224 (59.4%) | 116 (30.8%) |
| 6 to 18 Years | 496 (55.7%) | 379 (42.5%) |
| 19 to 25 Years | 350 (46.9%) | 405 (54.2%) |
| 25 to 34 Years | 426 (45.4%) | 520 (55.4%) |
| 35 to 44 Years | 317 (33.5%) | 505 (53.4%) |
| 45 to 54 Years | 331 (27.1%) | 751 (61.6%) |
| 55 to 64 Years | 554 (34.7%) | 1,094 (68.5%) |
| 65 to 74 Years | 1,422 (96.6%) | 759 (51.6%) |
| 75 Years and over | 839 (100.0%) | 501 (59.7%) |
| Total | 4,959 (54.9%) | 5,030 (55.7%) |
Disability Status by Sex by Age in Anaconda Deer Lodge County
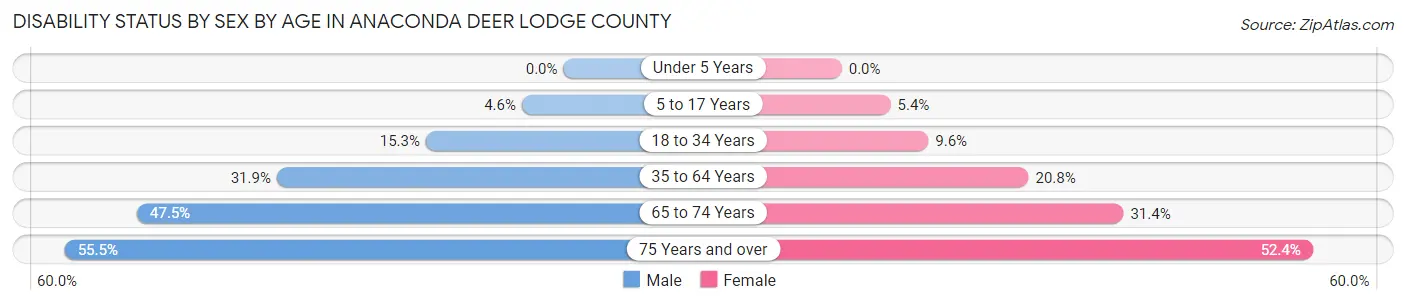
| Age Bracket | Male | Female |
| Under 5 Years | 0 (0.0%) | 0 (0.0%) |
| 5 to 17 Years | 21 (4.6%) | 21 (5.4%) |
| 18 to 34 Years | 144 (15.3%) | 82 (9.6%) |
| 35 to 64 Years | 625 (31.9%) | 375 (20.8%) |
| 65 to 74 Years | 360 (47.5%) | 224 (31.4%) |
| 75 Years and over | 216 (55.5%) | 236 (52.4%) |
Disability Class by Sex by Age in Anaconda Deer Lodge County
Disability Class: Hearing Difficulty
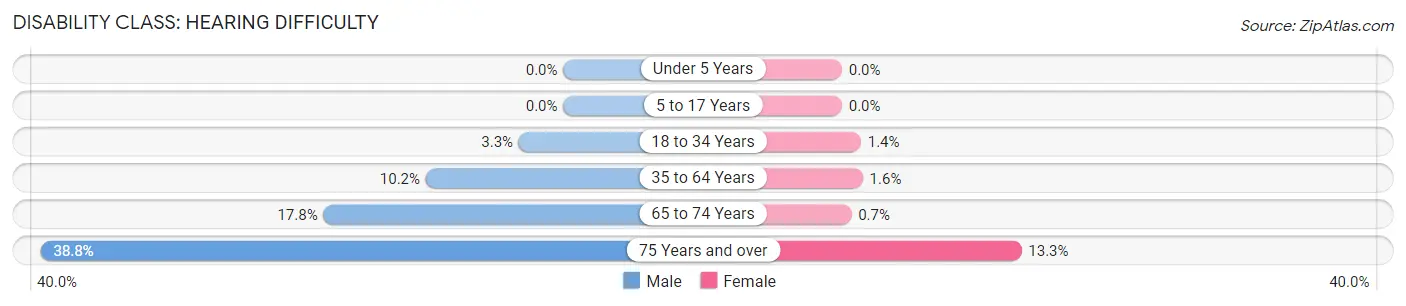
| Age Bracket | Male | Female |
| Under 5 Years | 0 (0.0%) | 0 (0.0%) |
| 5 to 17 Years | 0 (0.0%) | 0 (0.0%) |
| 18 to 34 Years | 31 (3.3%) | 12 (1.4%) |
| 35 to 64 Years | 200 (10.2%) | 28 (1.5%) |
| 65 to 74 Years | 135 (17.8%) | 5 (0.7%) |
| 75 Years and over | 151 (38.8%) | 60 (13.3%) |
Disability Class: Vision Difficulty
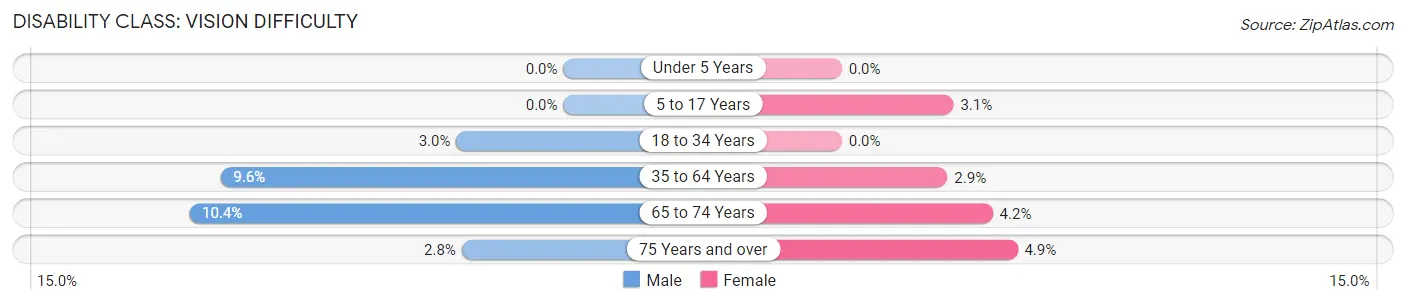
| Age Bracket | Male | Female |
| Under 5 Years | 0 (0.0%) | 0 (0.0%) |
| 5 to 17 Years | 0 (0.0%) | 12 (3.1%) |
| 18 to 34 Years | 28 (3.0%) | 0 (0.0%) |
| 35 to 64 Years | 187 (9.6%) | 53 (2.9%) |
| 65 to 74 Years | 79 (10.4%) | 30 (4.2%) |
| 75 Years and over | 11 (2.8%) | 22 (4.9%) |
Disability Class: Cognitive Difficulty
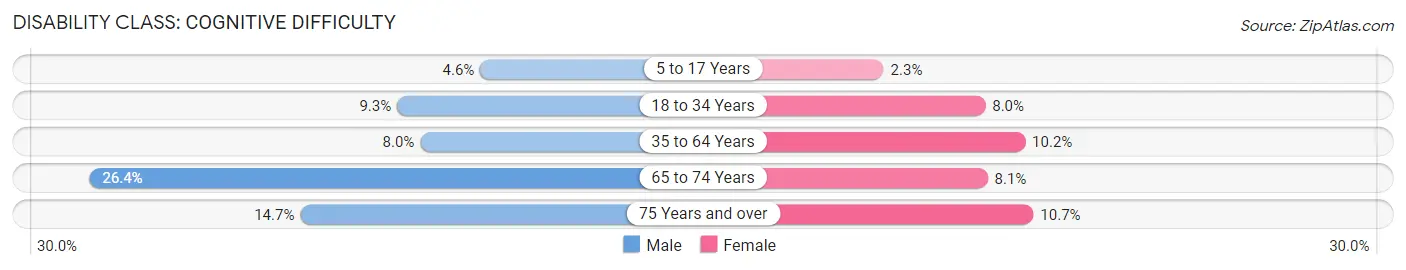
| Age Bracket | Male | Female |
| 5 to 17 Years | 21 (4.6%) | 9 (2.3%) |
| 18 to 34 Years | 87 (9.3%) | 68 (8.0%) |
| 35 to 64 Years | 156 (8.0%) | 184 (10.2%) |
| 65 to 74 Years | 200 (26.4%) | 58 (8.1%) |
| 75 Years and over | 57 (14.6%) | 48 (10.7%) |
Disability Class: Ambulatory Difficulty
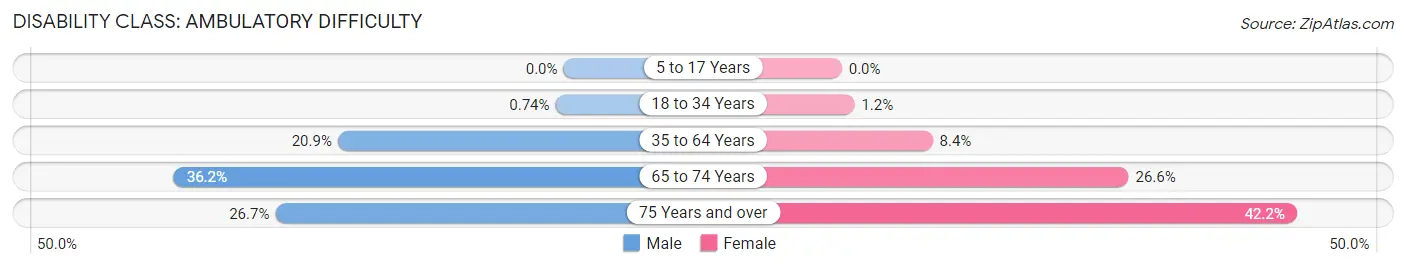
| Age Bracket | Male | Female |
| 5 to 17 Years | 0 (0.0%) | 0 (0.0%) |
| 18 to 34 Years | 7 (0.7%) | 10 (1.2%) |
| 35 to 64 Years | 410 (20.9%) | 152 (8.4%) |
| 65 to 74 Years | 274 (36.1%) | 190 (26.6%) |
| 75 Years and over | 104 (26.7%) | 190 (42.2%) |
Disability Class: Self-Care Difficulty
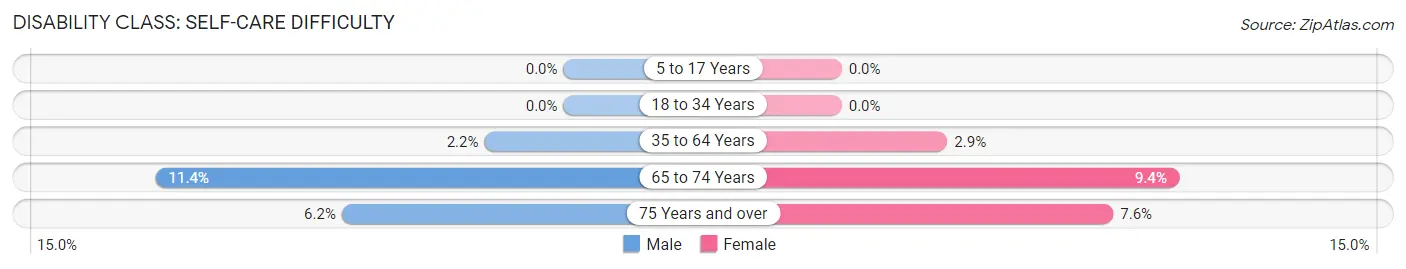
| Age Bracket | Male | Female |
| 5 to 17 Years | 0 (0.0%) | 0 (0.0%) |
| 18 to 34 Years | 0 (0.0%) | 0 (0.0%) |
| 35 to 64 Years | 43 (2.2%) | 53 (2.9%) |
| 65 to 74 Years | 86 (11.4%) | 67 (9.4%) |
| 75 Years and over | 24 (6.2%) | 34 (7.6%) |
Technology Access in Anaconda Deer Lodge County
Computing Device Access in Anaconda Deer Lodge County
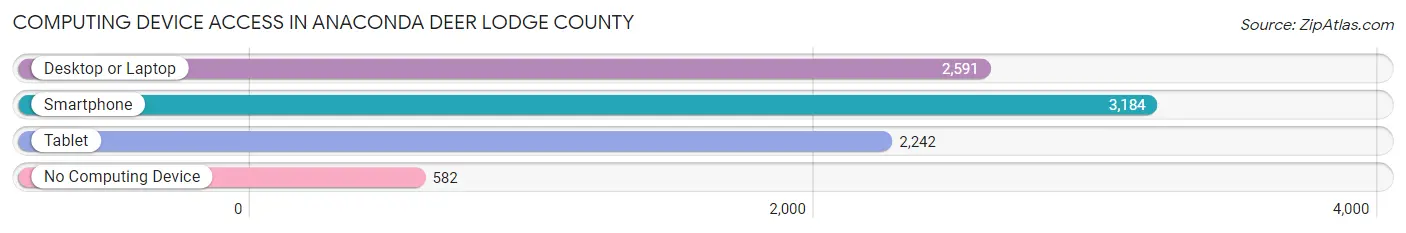
| Device Type | # Households | % Households |
| Desktop or Laptop | 2,591 | 59.8% |
| Smartphone | 3,184 | 73.4% |
| Tablet | 2,242 | 51.7% |
| No Computing Device | 582 | 13.4% |
| Total | 4,336 | 100.0% |
Internet Access in Anaconda Deer Lodge County
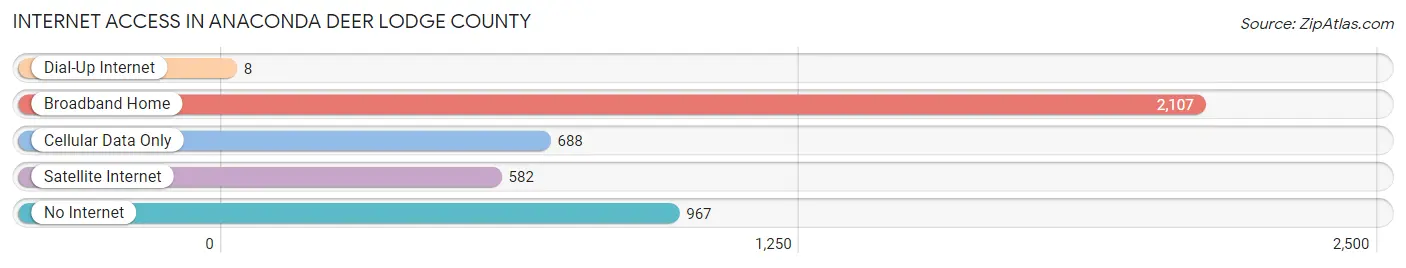
| Internet Type | # Households | % Households |
| Dial-Up Internet | 8 | 0.2% |
| Broadband Home | 2,107 | 48.6% |
| Cellular Data Only | 688 | 15.9% |
| Satellite Internet | 582 | 13.4% |
| No Internet | 967 | 22.3% |
| Total | 4,336 | 100.0% |
Anaconda Deer Lodge County Summary
Anaconda Deer Lodge County, Montana is located in the southwestern part of the state and is bordered by Granite, Powell, and Silver Bow counties. The county seat is Anaconda, and the county is home to a population of approximately 9,000 people. The county is home to the historic Anaconda Copper Mine, which was once the largest copper mine in the world.
History
Anaconda Deer Lodge County was established in 1864 and was named after the Anaconda Copper Mine, which was discovered in 1883. The mine was owned by the Anaconda Company, which was founded by Marcus Daly, a prominent Montana businessman. The mine was the largest copper mine in the world and was responsible for the economic growth of the area. The mine was in operation until 1983, when it was closed due to environmental concerns.
The county was also home to the historic Butte-Anaconda Historic District, which was listed on the National Register of Historic Places in 1975. The district includes the historic downtown area of Anaconda, as well as the Anaconda Copper Mine.
Geography
Anaconda Deer Lodge County is located in the southwestern part of Montana and is bordered by Granite, Powell, and Silver Bow counties. The county covers an area of 1,845 square miles and is home to a population of approximately 9,000 people. The county is located in the Rocky Mountains and is home to several mountain ranges, including the Anaconda Range, the Flint Creek Range, and the Big Hole Mountains. The county is also home to several rivers, including the Blackfoot River, the Clark Fork River, and the Bitterroot River.
Economy
Anaconda Deer Lodge County is home to a diverse economy, with a variety of industries providing employment opportunities. The county is home to several large employers, including the Anaconda Company, which is the largest employer in the county. Other major employers include the Montana Department of Transportation, the Montana State University-Bozeman, and the Montana Department of Corrections.
The county is also home to several small businesses, including restaurants, retail stores, and other service-based businesses. The county is also home to several tourist attractions, including the Anaconda Copper Mine, the Butte-Anaconda Historic District, and the Big Hole National Battlefield.
Demographics
As of the 2010 census, Anaconda Deer Lodge County had a population of 8,945 people. The racial makeup of the county was 94.3% White, 0.7% Native American, 0.3% Asian, 0.2% Black or African American, 0.1% Pacific Islander, and 4.4% from two or more races. The median household income in the county was $37,945, and the median family income was $45,938. The per capita income in the county was $20,945.
Anaconda Deer Lodge County is home to a variety of religious denominations, including Catholic, Protestant, and Mormon. The county is also home to several public schools, including Anaconda High School, Anaconda Middle School, and Anaconda Elementary School. The county is also home to several private schools, including St. Mary's Catholic School and the Anaconda Christian Academy.
Common Questions
What is Per Capita Income in Anaconda Deer Lodge County?
Per Capita income in Anaconda Deer Lodge County is $30,185.
What is the Median Family Income in Anaconda Deer Lodge County?
Median Family Income in Anaconda Deer Lodge County is $62,575.
What is the Median Household income in Anaconda Deer Lodge County?
Median Household Income in Anaconda Deer Lodge County is $46,436.
What is Income or Wage Gap in Anaconda Deer Lodge County?
Income or Wage Gap in Anaconda Deer Lodge County is 7.2%.
Women in Anaconda Deer Lodge County earn 92.8 cents for every dollar earned by a man.
What is Inequality or Gini Index in Anaconda Deer Lodge County?
Inequality or Gini Index in Anaconda Deer Lodge County is 0.44.
What is the Total Population of Anaconda Deer Lodge County?
Total Population of Anaconda Deer Lodge County is 9,435.
What is the Total Male Population of Anaconda Deer Lodge County?
Total Male Population of Anaconda Deer Lodge County is 5,072.
What is the Total Female Population of Anaconda Deer Lodge County?
Total Female Population of Anaconda Deer Lodge County is 4,363.
What is the Ratio of Males per 100 Females in Anaconda Deer Lodge County?
There are 116.25 Males per 100 Females in Anaconda Deer Lodge County.
What is the Ratio of Females per 100 Males in Anaconda Deer Lodge County?
There are 86.02 Females per 100 Males in Anaconda Deer Lodge County.
What is the Median Population Age in Anaconda Deer Lodge County?
Median Population Age in Anaconda Deer Lodge County is 49.6 Years.
What is the Average Family Size in Anaconda Deer Lodge County
Average Family Size in Anaconda Deer Lodge County is 2.6 People.
What is the Average Household Size in Anaconda Deer Lodge County
Average Household Size in Anaconda Deer Lodge County is 2.0 People.
How Large is the Labor Force in Anaconda Deer Lodge County?
There are 4,369 People in the Labor Forcein in Anaconda Deer Lodge County.
What is the Percentage of People in the Labor Force in Anaconda Deer Lodge County?
51.6% of People are in the Labor Force in Anaconda Deer Lodge County.
What is the Unemployment Rate in Anaconda Deer Lodge County?
Unemployment Rate in Anaconda Deer Lodge County is 3.8%.