Park County, MT Map & Demographics
Park County Map
Park County Overview
$44,273
PER CAPITA INCOME
$90,483
AVG FAMILY INCOME
$67,602
AVG HOUSEHOLD INCOME
31.6%
WAGE / INCOME GAP [ % ]
68.4¢/ $1
WAGE / INCOME GAP [ $ ]
0.47
INEQUALITY / GINI INDEX
17,320
TOTAL POPULATION
8,723
MALE POPULATION
8,597
FEMALE POPULATION
101.47
MALES / 100 FEMALES
98.56
FEMALES / 100 MALES
46.2
MEDIAN AGE
2.6
AVG FAMILY SIZE
2.1
AVG HOUSEHOLD SIZE
9,399
LABOR FORCE [ PEOPLE ]
63.2%
PERCENT IN LABOR FORCE
3.3%
UNEMPLOYMENT RATE
Park County Area Codes
Income in Park County
Income Overview in Park County
Per Capita Income in Park County is $44,273, while median incomes of families and households are $90,483 and $67,602 respectively.
| Characteristic | Number | Measure |
| Per Capita Income | 17,320 | $44,273 |
| Median Family Income | 4,606 | $90,483 |
| Mean Family Income | 4,606 | $108,546 |
| Median Household Income | 8,055 | $67,602 |
| Mean Household Income | 8,055 | $94,904 |
| Income Deficit | 4,606 | $0 |
| Wage / Income Gap (%) | 17,320 | 31.57% |
| Wage / Income Gap ($) | 17,320 | 68.43¢ per $1 |
| Gini / Inequality Index | 17,320 | 0.47 |
Earnings by Sex in Park County
Average Earnings in Park County are $37,038, $46,731 for men and $31,980 for women, a difference of 31.6%.
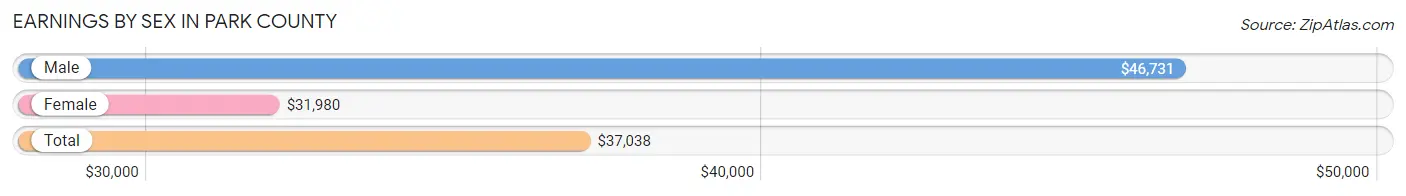
| Sex | Number | Average Earnings |
| Male | 5,469 (53.2%) | $46,731 |
| Female | 4,804 (46.8%) | $31,980 |
| Total | 10,273 (100.0%) | $37,038 |
Earnings by Sex by Income Bracket in Park County
The most common earnings brackets in Park County are $100,000+ for men (799 | 14.6%) and $30,000 to $34,999 for women (502 | 10.4%).
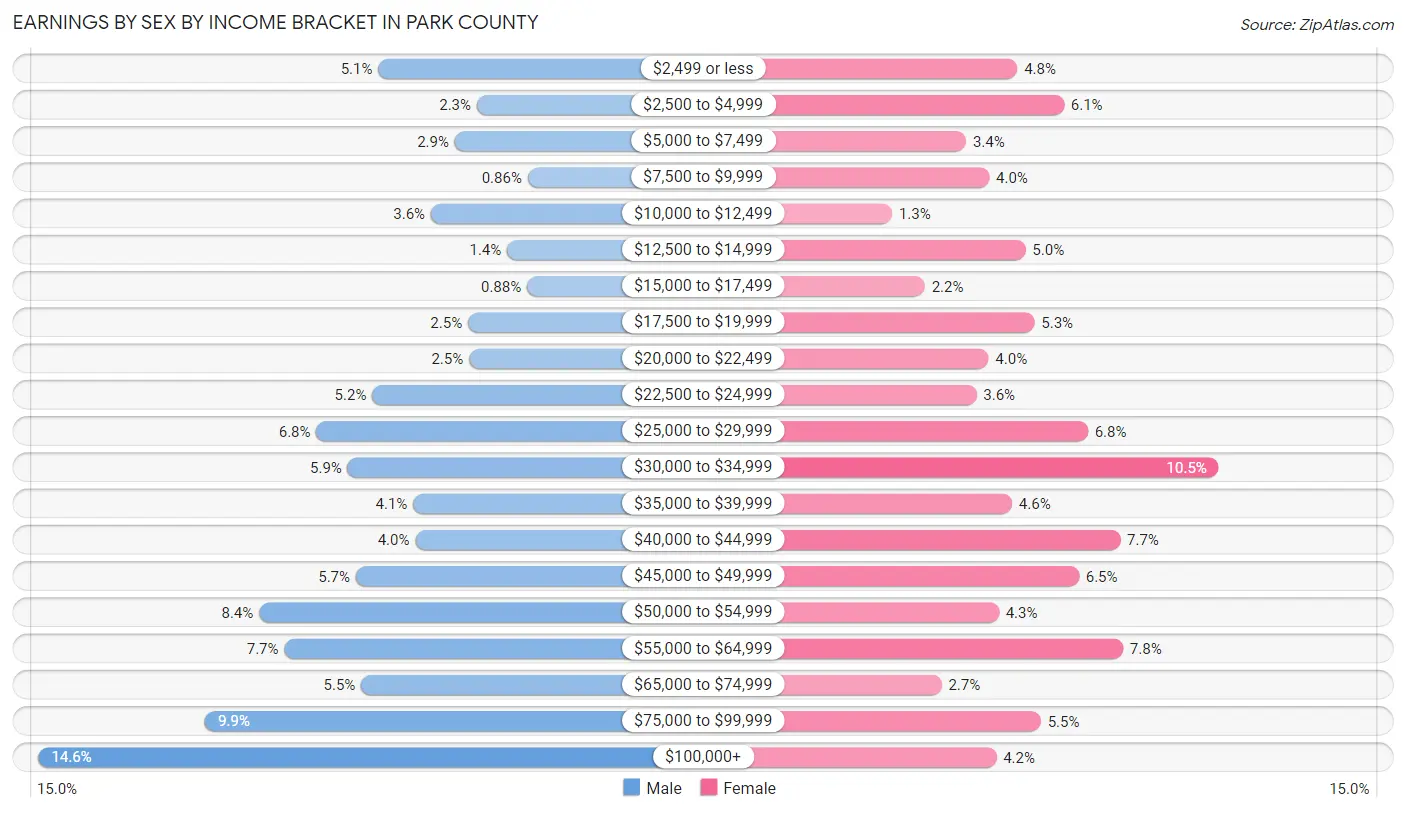
| Income | Male | Female |
| $2,499 or less | 277 (5.1%) | 230 (4.8%) |
| $2,500 to $4,999 | 125 (2.3%) | 293 (6.1%) |
| $5,000 to $7,499 | 159 (2.9%) | 161 (3.4%) |
| $7,500 to $9,999 | 47 (0.9%) | 192 (4.0%) |
| $10,000 to $12,499 | 196 (3.6%) | 61 (1.3%) |
| $12,500 to $14,999 | 79 (1.4%) | 241 (5.0%) |
| $15,000 to $17,499 | 48 (0.9%) | 105 (2.2%) |
| $17,500 to $19,999 | 139 (2.5%) | 253 (5.3%) |
| $20,000 to $22,499 | 137 (2.5%) | 191 (4.0%) |
| $22,500 to $24,999 | 286 (5.2%) | 175 (3.6%) |
| $25,000 to $29,999 | 372 (6.8%) | 325 (6.8%) |
| $30,000 to $34,999 | 324 (5.9%) | 502 (10.4%) |
| $35,000 to $39,999 | 223 (4.1%) | 223 (4.6%) |
| $40,000 to $44,999 | 220 (4.0%) | 369 (7.7%) |
| $45,000 to $49,999 | 311 (5.7%) | 313 (6.5%) |
| $50,000 to $54,999 | 460 (8.4%) | 205 (4.3%) |
| $55,000 to $64,999 | 421 (7.7%) | 373 (7.8%) |
| $65,000 to $74,999 | 303 (5.5%) | 128 (2.7%) |
| $75,000 to $99,999 | 543 (9.9%) | 262 (5.4%) |
| $100,000+ | 799 (14.6%) | 202 (4.2%) |
| Total | 5,469 (100.0%) | 4,804 (100.0%) |
Earnings by Sex by Educational Attainment in Park County
Average earnings in Park County are $50,801 for men and $34,560 for women, a difference of 32.0%. Men with an educational attainment of graduate degree enjoy the highest average annual earnings of $72,656, while those with less than high school education earn the least with $35,833. Women with an educational attainment of graduate degree earn the most with the average annual earnings of $47,708, while those with high school diploma education have the smallest earnings of $22,049.
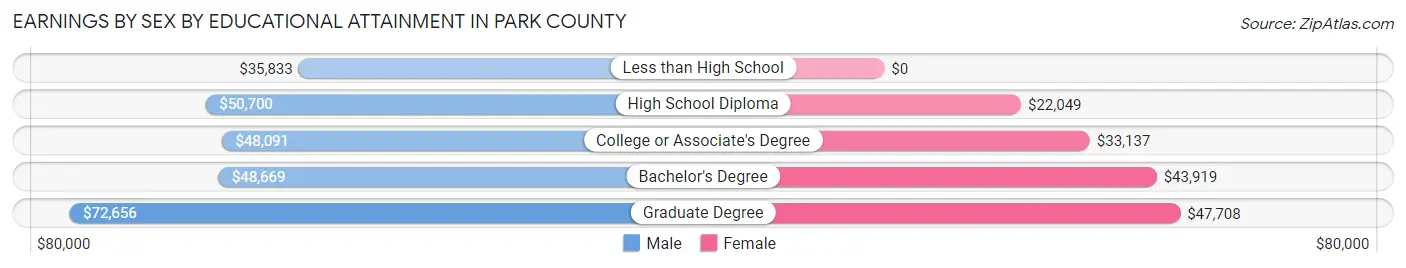
| Educational Attainment | Male Income | Female Income |
| Less than High School | $35,833 | $0 |
| High School Diploma | $50,700 | $22,049 |
| College or Associate's Degree | $48,091 | $33,137 |
| Bachelor's Degree | $48,669 | $43,919 |
| Graduate Degree | $72,656 | $47,708 |
| Total | $50,801 | $34,560 |
Family Income in Park County
Family Income Brackets in Park County
According to the Park County family income data, there are 1,069 families falling into the $100,000 to $149,999 income range, which is the most common income bracket and makes up 23.2% of all families. Conversely, the $10,000 to $14,999 income bracket is the least frequent group with only 32 families (0.7%) belonging to this category.
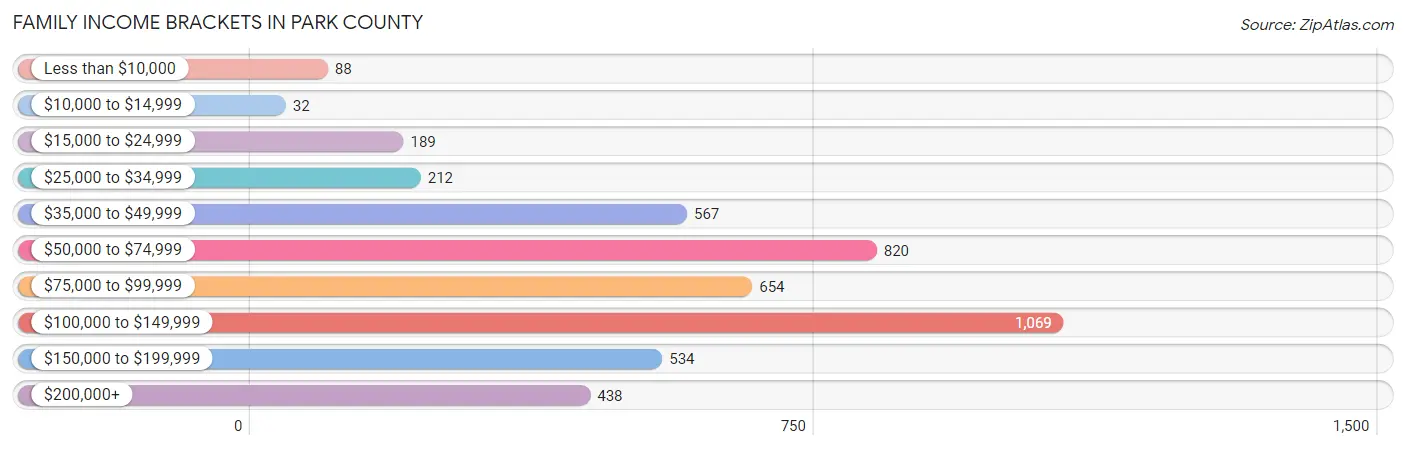
| Income Bracket | # Families | % Families |
| Less than $10,000 | 88 | 1.9% |
| $10,000 to $14,999 | 32 | 0.7% |
| $15,000 to $24,999 | 189 | 4.1% |
| $25,000 to $34,999 | 212 | 4.6% |
| $35,000 to $49,999 | 567 | 12.3% |
| $50,000 to $74,999 | 820 | 17.8% |
| $75,000 to $99,999 | 654 | 14.2% |
| $100,000 to $149,999 | 1,069 | 23.2% |
| $150,000 to $199,999 | 534 | 11.6% |
| $200,000+ | 438 | 9.5% |
Family Income by Famaliy Size in Park County
4-person families (568 | 12.3%) account for the highest median family income in Park County with $110,156 per family, while 2-person families (2,874 | 62.4%) have the highest median income of $45,582 per family member.
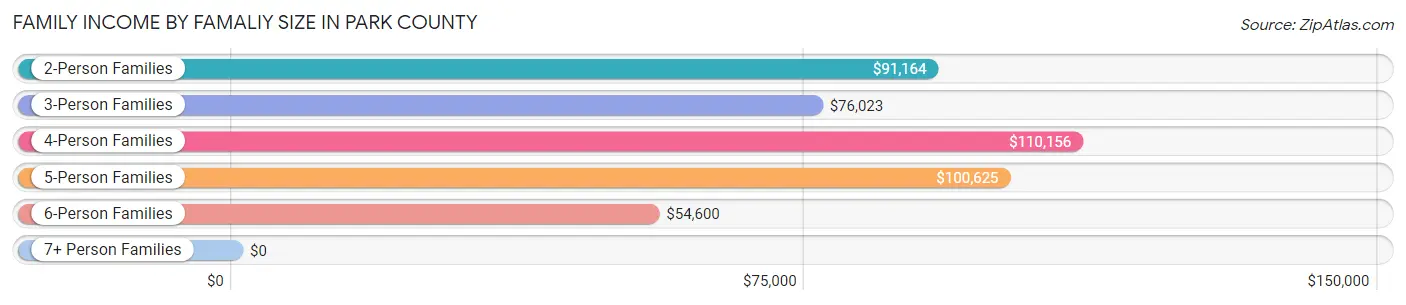
| Income Bracket | # Families | Median Income |
| 2-Person Families | 2,874 (62.4%) | $91,164 |
| 3-Person Families | 825 (17.9%) | $76,023 |
| 4-Person Families | 568 (12.3%) | $110,156 |
| 5-Person Families | 257 (5.6%) | $100,625 |
| 6-Person Families | 42 (0.9%) | $54,600 |
| 7+ Person Families | 40 (0.9%) | $0 |
| Total | 4,606 (100.0%) | $90,483 |
Family Income by Number of Earners in Park County
The median family income in Park County is $90,483, with families comprising 3+ earners (384) having the highest median family income of $137,800, while families with 1 earner (1,372) have the lowest median family income of $54,595, accounting for 8.3% and 29.8% of families, respectively.
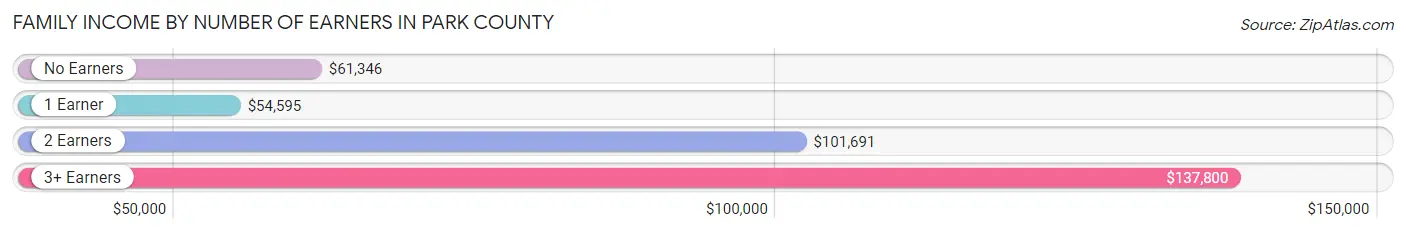
| Number of Earners | # Families | Median Income |
| No Earners | 860 (18.7%) | $61,346 |
| 1 Earner | 1,372 (29.8%) | $54,595 |
| 2 Earners | 1,990 (43.2%) | $101,691 |
| 3+ Earners | 384 (8.3%) | $137,800 |
| Total | 4,606 (100.0%) | $90,483 |
Household Income in Park County
Household Income Brackets in Park County
With 1,442 households falling in the category, the $50,000 to $74,999 income range is the most frequent in Park County, accounting for 17.9% of all households. In contrast, only 306 households (3.8%) fall into the $10,000 to $14,999 income bracket, making it the least populous group.
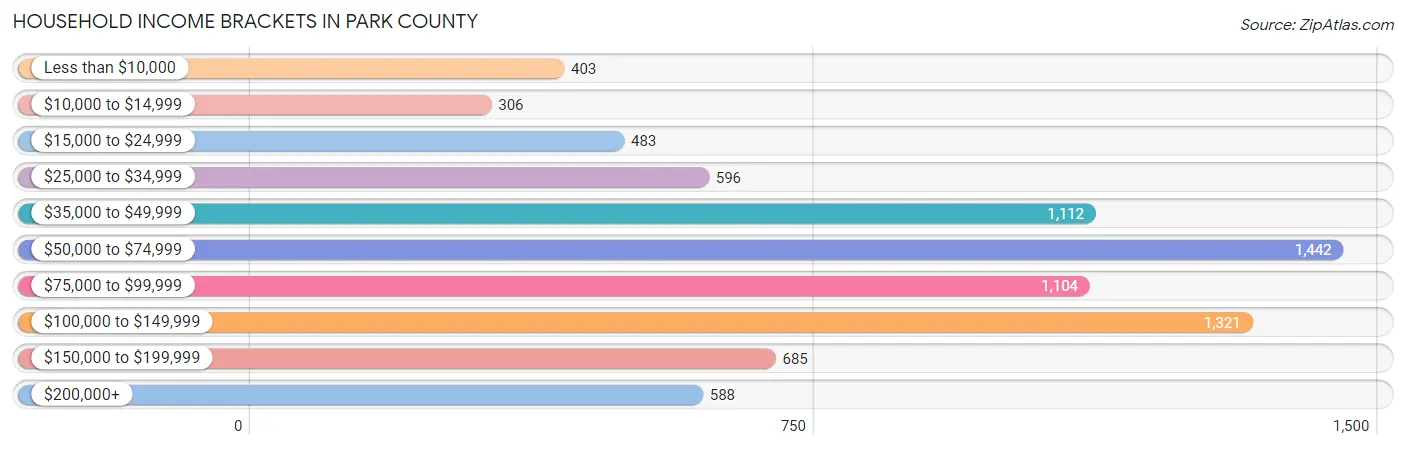
| Income Bracket | # Households | % Households |
| Less than $10,000 | 403 | 5.0% |
| $10,000 to $14,999 | 306 | 3.8% |
| $15,000 to $24,999 | 483 | 6.0% |
| $25,000 to $34,999 | 596 | 7.4% |
| $35,000 to $49,999 | 1,112 | 13.8% |
| $50,000 to $74,999 | 1,442 | 17.9% |
| $75,000 to $99,999 | 1,104 | 13.7% |
| $100,000 to $149,999 | 1,321 | 16.4% |
| $150,000 to $199,999 | 685 | 8.5% |
| $200,000+ | 588 | 7.3% |
Household Income by Householder Age in Park County
The median household income in Park County is $67,602, with the highest median household income of $90,114 found in the 45 to 64 years age bracket for the primary householder. A total of 3,011 households (37.4%) fall into this category. Meanwhile, the 15 to 24 years age bracket for the primary householder has the lowest median household income of $26,821, with 267 households (3.3%) in this group.
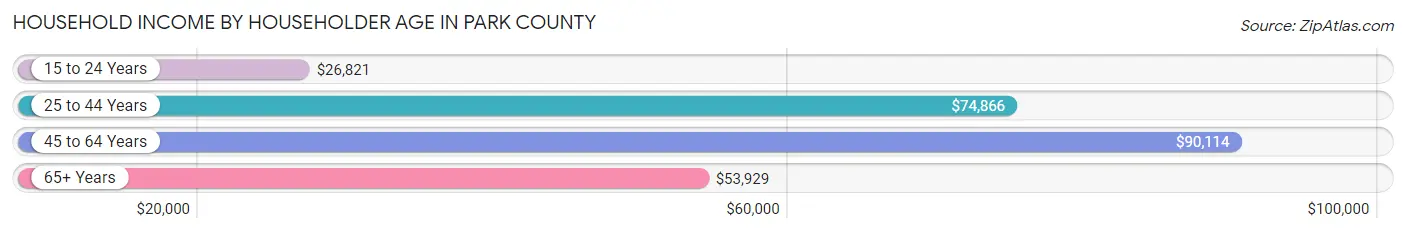
| Income Bracket | # Households | Median Income |
| 15 to 24 Years | 267 (3.3%) | $26,821 |
| 25 to 44 Years | 2,289 (28.4%) | $74,866 |
| 45 to 64 Years | 3,011 (37.4%) | $90,114 |
| 65+ Years | 2,488 (30.9%) | $53,929 |
| Total | 8,055 (100.0%) | $67,602 |
Poverty in Park County
Income Below Poverty by Sex and Age in Park County
With 10.4% poverty level for males and 12.6% for females among the residents of Park County, 5 year old males and under 5 year old females are the most vulnerable to poverty, with 19 males (51.3%) and 108 females (29.7%) in their respective age groups living below the poverty level.
| Age Bracket | Male | Female |
| Under 5 Years | 104 (27.7%) | 108 (29.7%) |
| 5 Years | 19 (51.3%) | 27 (25.7%) |
| 6 to 11 Years | 85 (19.1%) | 48 (11.4%) |
| 12 to 14 Years | 59 (16.9%) | 3 (1.8%) |
| 15 Years | 0 (0.0%) | 2 (4.1%) |
| 16 and 17 Years | 47 (21.5%) | 28 (13.3%) |
| 18 to 24 Years | 88 (17.8%) | 106 (22.8%) |
| 25 to 34 Years | 109 (10.0%) | 107 (9.8%) |
| 35 to 44 Years | 66 (5.9%) | 149 (13.1%) |
| 45 to 54 Years | 15 (1.4%) | 87 (8.6%) |
| 55 to 64 Years | 87 (6.3%) | 161 (11.2%) |
| 65 to 74 Years | 154 (11.9%) | 127 (10.3%) |
| 75 Years and over | 67 (10.0%) | 115 (14.1%) |
| Total | 900 (10.4%) | 1,068 (12.6%) |
Income Above Poverty by Sex and Age in Park County
According to the poverty statistics in Park County, males aged 15 years and females aged 12 to 14 years are the age groups that are most secure financially, with 100.0% of males and 98.2% of females in these age groups living above the poverty line.
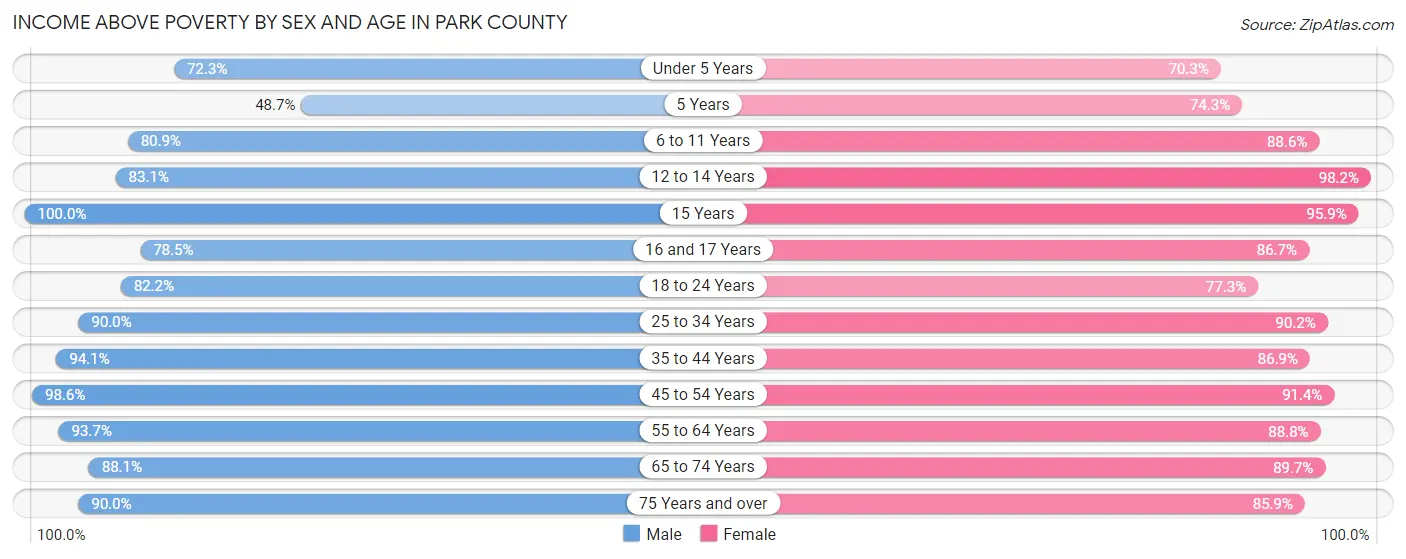
| Age Bracket | Male | Female |
| Under 5 Years | 271 (72.3%) | 256 (70.3%) |
| 5 Years | 18 (48.6%) | 78 (74.3%) |
| 6 to 11 Years | 359 (80.9%) | 373 (88.6%) |
| 12 to 14 Years | 290 (83.1%) | 163 (98.2%) |
| 15 Years | 79 (100.0%) | 47 (95.9%) |
| 16 and 17 Years | 172 (78.5%) | 182 (86.7%) |
| 18 to 24 Years | 405 (82.2%) | 360 (77.2%) |
| 25 to 34 Years | 982 (90.0%) | 982 (90.2%) |
| 35 to 44 Years | 1,055 (94.1%) | 986 (86.9%) |
| 45 to 54 Years | 1,068 (98.6%) | 924 (91.4%) |
| 55 to 64 Years | 1,295 (93.7%) | 1,280 (88.8%) |
| 65 to 74 Years | 1,138 (88.1%) | 1,108 (89.7%) |
| 75 Years and over | 605 (90.0%) | 703 (85.9%) |
| Total | 7,737 (89.6%) | 7,442 (87.5%) |
Income Below Poverty Among Married-Couple Families in Park County
The poverty statistics for married-couple families in Park County show that 4.2% or 161 of the total 3,876 families live below the poverty line. Families with 5 or more children have the highest poverty rate of 45.5%, comprising of 15 families. On the other hand, families with no children have the lowest poverty rate of 2.9%, which includes 80 families.
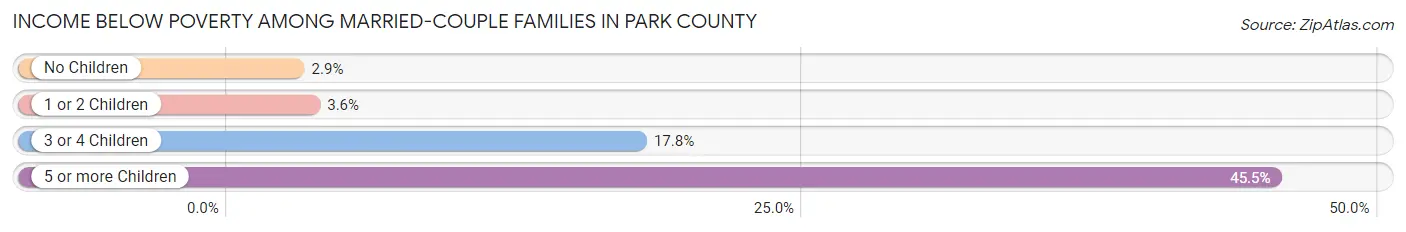
| Children | Above Poverty | Below Poverty |
| No Children | 2,679 (97.1%) | 80 (2.9%) |
| 1 or 2 Children | 861 (96.4%) | 32 (3.6%) |
| 3 or 4 Children | 157 (82.2%) | 34 (17.8%) |
| 5 or more Children | 18 (54.5%) | 15 (45.5%) |
| Total | 3,715 (95.9%) | 161 (4.2%) |
Income Below Poverty Among Single-Parent Households in Park County
According to the poverty data in Park County, 4.3% or 15 single-father households and 25.3% or 97 single-mother households are living below the poverty line. Among single-father households, those with 1 or 2 children have the highest poverty rate, with 15 households (5.4%) experiencing poverty. Likewise, among single-mother households, those with 1 or 2 children have the highest poverty rate, with 86 households (57.3%) falling below the poverty line.
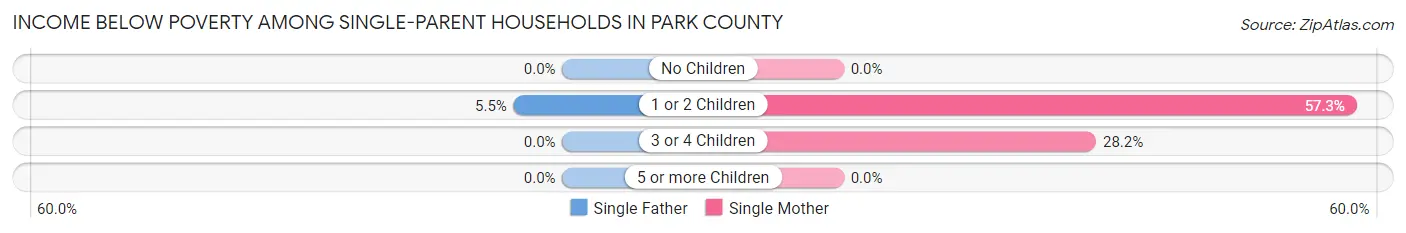
| Children | Single Father | Single Mother |
| No Children | 0 (0.0%) | 0 (0.0%) |
| 1 or 2 Children | 15 (5.4%) | 86 (57.3%) |
| 3 or 4 Children | 0 (0.0%) | 11 (28.2%) |
| 5 or more Children | 0 (0.0%) | 0 (0.0%) |
| Total | 15 (4.3%) | 97 (25.3%) |
Income Below Poverty Among Married-Couple vs Single-Parent Households in Park County
The poverty data for Park County shows that 161 of the married-couple family households (4.2%) and 112 of the single-parent households (15.3%) are living below the poverty level. Within the married-couple family households, those with 5 or more children have the highest poverty rate, with 15 households (45.5%) falling below the poverty line. Among the single-parent households, those with 3 or 4 children have the highest poverty rate, with 11 household (28.2%) living below poverty.
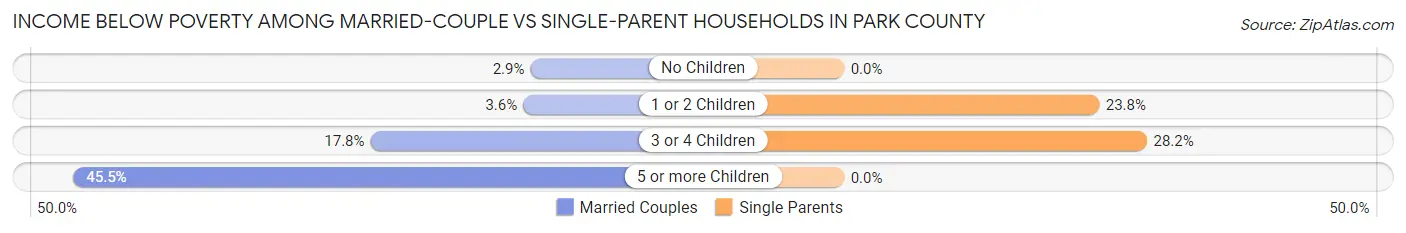
| Children | Married-Couple Families | Single-Parent Households |
| No Children | 80 (2.9%) | 0 (0.0%) |
| 1 or 2 Children | 32 (3.6%) | 101 (23.8%) |
| 3 or 4 Children | 34 (17.8%) | 11 (28.2%) |
| 5 or more Children | 15 (45.5%) | 0 (0.0%) |
| Total | 161 (4.2%) | 112 (15.3%) |
Race in Park County
The most populous races in Park County are White / Caucasian (16,146 | 93.2%), Two or more Races (723 | 4.2%), and Hispanic or Latino (569 | 3.3%).
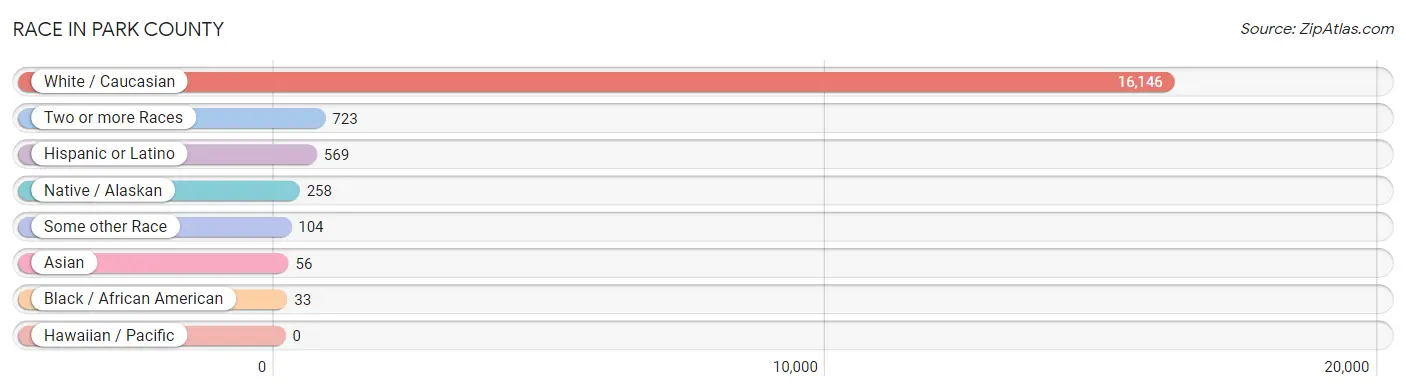
| Race | # Population | % Population |
| Asian | 56 | 0.3% |
| Black / African American | 33 | 0.2% |
| Hawaiian / Pacific | 0 | 0.0% |
| Hispanic or Latino | 569 | 3.3% |
| Native / Alaskan | 258 | 1.5% |
| White / Caucasian | 16,146 | 93.2% |
| Two or more Races | 723 | 4.2% |
| Some other Race | 104 | 0.6% |
| Total | 17,320 | 100.0% |
Ancestry in Park County
The most populous ancestries reported in Park County are German (4,166 | 24.0%), Irish (2,880 | 16.6%), English (2,310 | 13.3%), Norwegian (1,504 | 8.7%), and Scottish (1,002 | 5.8%), together accounting for 68.5% of all Park County residents.
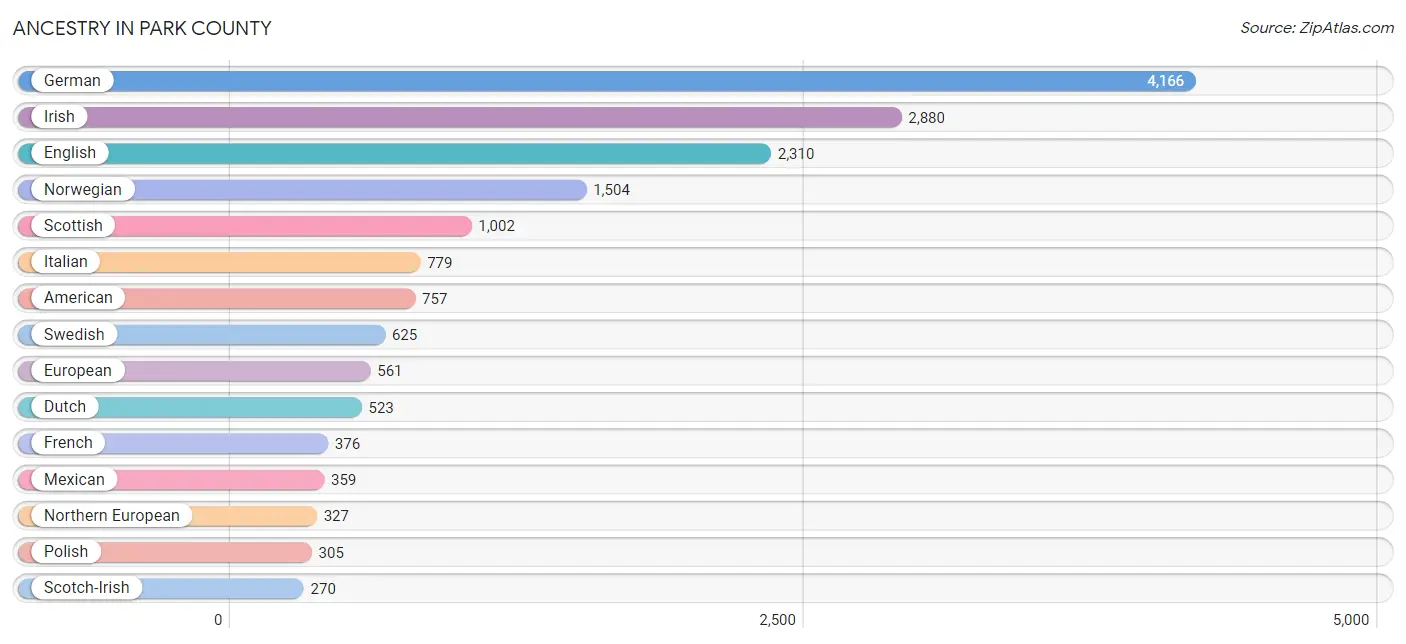
| Ancestry | # Population | % Population |
| African | 4 | 0.0% |
| American | 757 | 4.4% |
| Arab | 13 | 0.1% |
| Australian | 10 | 0.1% |
| Austrian | 102 | 0.6% |
| Basque | 5 | 0.0% |
| Belgian | 97 | 0.6% |
| Bhutanese | 15 | 0.1% |
| Blackfeet | 38 | 0.2% |
| British | 137 | 0.8% |
| Bulgarian | 23 | 0.1% |
| Burmese | 22 | 0.1% |
| Canadian | 38 | 0.2% |
| Celtic | 2 | 0.0% |
| Central American | 19 | 0.1% |
| Cherokee | 90 | 0.5% |
| Chickasaw | 21 | 0.1% |
| Chippewa | 48 | 0.3% |
| Choctaw | 17 | 0.1% |
| Colombian | 103 | 0.6% |
| Costa Rican | 7 | 0.0% |
| Cree | 3 | 0.0% |
| Creek | 8 | 0.1% |
| Croatian | 71 | 0.4% |
| Crow | 14 | 0.1% |
| Czech | 43 | 0.3% |
| Czechoslovakian | 92 | 0.5% |
| Danish | 137 | 0.8% |
| Dutch | 523 | 3.0% |
| Eastern European | 70 | 0.4% |
| Ecuadorian | 1 | 0.0% |
| English | 2,310 | 13.3% |
| European | 561 | 3.2% |
| Finnish | 123 | 0.7% |
| French | 376 | 2.2% |
| French Canadian | 120 | 0.7% |
| German | 4,166 | 24.0% |
| Greek | 60 | 0.4% |
| Guatemalan | 3 | 0.0% |
| Hungarian | 35 | 0.2% |
| Icelander | 3 | 0.0% |
| Indian (Asian) | 55 | 0.3% |
| Irish | 2,880 | 16.6% |
| Italian | 779 | 4.5% |
| Korean | 12 | 0.1% |
| Lithuanian | 20 | 0.1% |
| Macedonian | 10 | 0.1% |
| Mexican | 359 | 2.1% |
| Navajo | 6 | 0.0% |
| Nicaraguan | 9 | 0.1% |
| Northern European | 327 | 1.9% |
| Norwegian | 1,504 | 8.7% |
| Peruvian | 2 | 0.0% |
| Polish | 305 | 1.8% |
| Portuguese | 37 | 0.2% |
| Romanian | 10 | 0.1% |
| Russian | 95 | 0.5% |
| Scandinavian | 132 | 0.8% |
| Scotch-Irish | 270 | 1.6% |
| Scottish | 1,002 | 5.8% |
| Serbian | 25 | 0.1% |
| Sioux | 77 | 0.4% |
| Slavic | 5 | 0.0% |
| Slovak | 16 | 0.1% |
| South American | 186 | 1.1% |
| South American Indian | 79 | 0.5% |
| Spaniard | 1 | 0.0% |
| Spanish | 4 | 0.0% |
| Subsaharan African | 4 | 0.0% |
| Swedish | 625 | 3.6% |
| Swiss | 107 | 0.6% |
| Syrian | 13 | 0.1% |
| Thai | 28 | 0.2% |
| Ukrainian | 50 | 0.3% |
| Venezuelan | 33 | 0.2% |
| Welsh | 81 | 0.5% | View All 76 Rows |
Immigrants in Park County
The most numerous immigrant groups reported in Park County came from Europe (172 | 1.0%), Latin America (151 | 0.9%), Western Europe (92 | 0.5%), Central America (80 | 0.5%), and South America (71 | 0.4%), together accounting for 3.3% of all Park County residents.
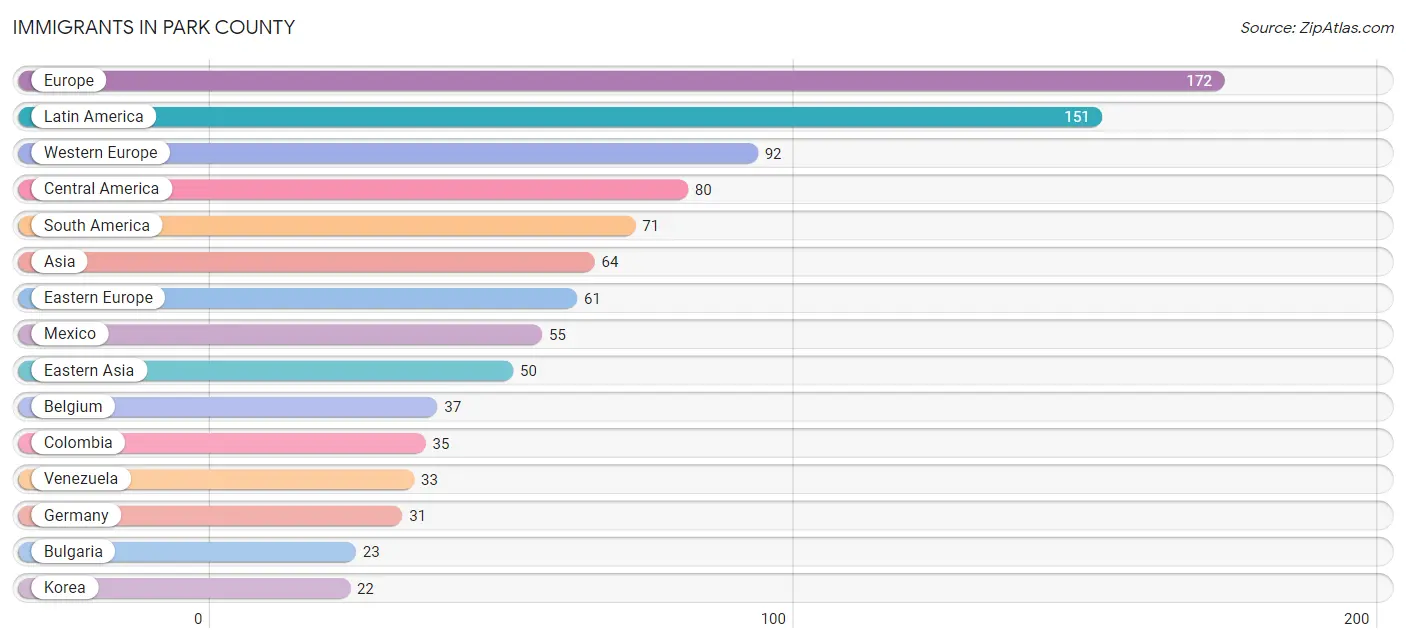
| Immigration Origin | # Population | % Population |
| Africa | 1 | 0.0% |
| Asia | 64 | 0.4% |
| Australia | 6 | 0.0% |
| Belgium | 37 | 0.2% |
| Brazil | 2 | 0.0% |
| Bulgaria | 23 | 0.1% |
| Canada | 20 | 0.1% |
| Central America | 80 | 0.5% |
| China | 11 | 0.1% |
| Colombia | 35 | 0.2% |
| Czechoslovakia | 7 | 0.0% |
| Eastern Africa | 1 | 0.0% |
| Eastern Asia | 50 | 0.3% |
| Eastern Europe | 61 | 0.4% |
| Ecuador | 1 | 0.0% |
| Europe | 172 | 1.0% |
| Germany | 31 | 0.2% |
| Guatemala | 3 | 0.0% |
| India | 9 | 0.1% |
| Ireland | 14 | 0.1% |
| Japan | 17 | 0.1% |
| Kenya | 1 | 0.0% |
| Korea | 22 | 0.1% |
| Latin America | 151 | 0.9% |
| Lithuania | 8 | 0.1% |
| Mexico | 55 | 0.3% |
| Netherlands | 20 | 0.1% |
| Nicaragua | 22 | 0.1% |
| North Macedonia | 10 | 0.1% |
| Northern Europe | 19 | 0.1% |
| Oceania | 6 | 0.0% |
| Pakistan | 2 | 0.0% |
| Philippines | 3 | 0.0% |
| Russia | 13 | 0.1% |
| Scotland | 2 | 0.0% |
| South America | 71 | 0.4% |
| South Central Asia | 11 | 0.1% |
| South Eastern Asia | 3 | 0.0% |
| Switzerland | 4 | 0.0% |
| Venezuela | 33 | 0.2% |
| Western Europe | 92 | 0.5% | View All 41 Rows |
Sex and Age in Park County
Sex and Age in Park County
The most populous age groups in Park County are 40 to 44 Years (712 | 8.2%) for men and 60 to 64 Years (771 | 9.0%) for women.
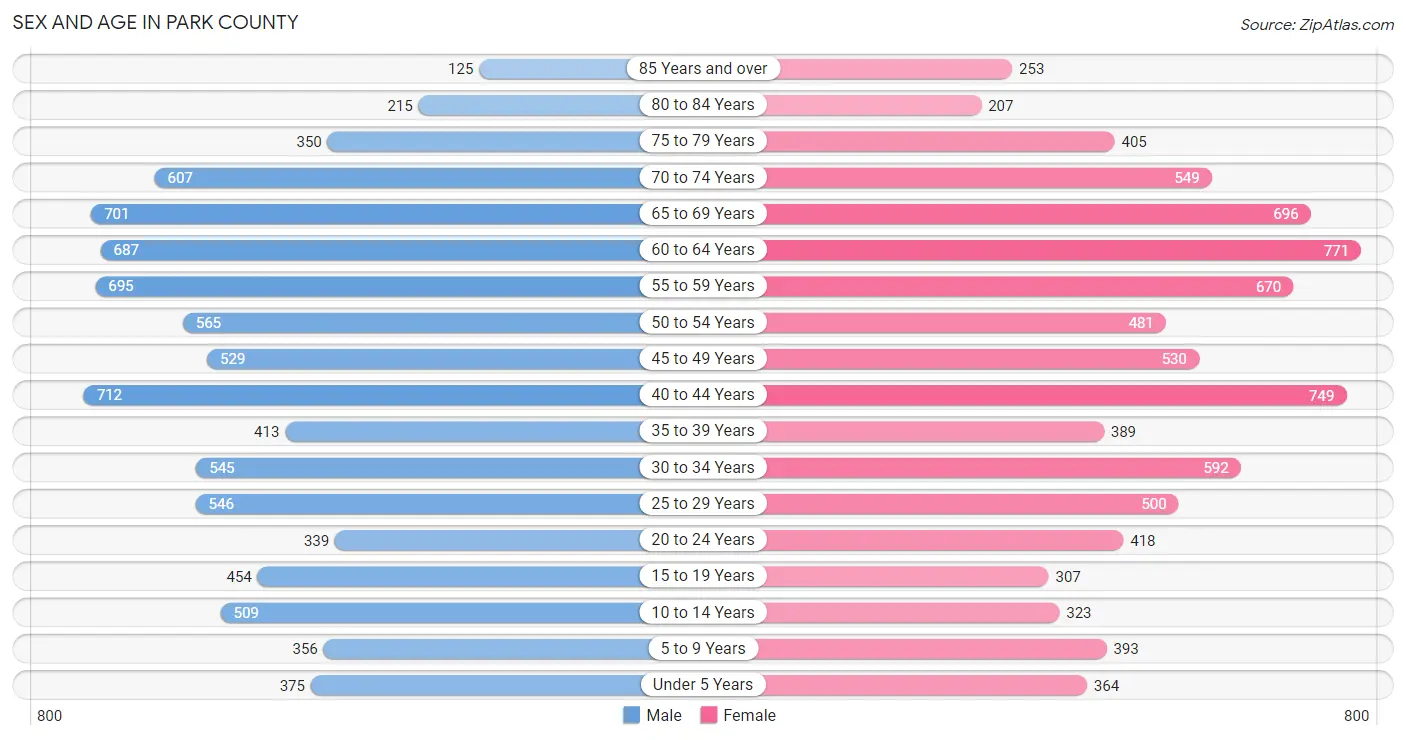
| Age Bracket | Male | Female |
| Under 5 Years | 375 (4.3%) | 364 (4.2%) |
| 5 to 9 Years | 356 (4.1%) | 393 (4.6%) |
| 10 to 14 Years | 509 (5.8%) | 323 (3.8%) |
| 15 to 19 Years | 454 (5.2%) | 307 (3.6%) |
| 20 to 24 Years | 339 (3.9%) | 418 (4.9%) |
| 25 to 29 Years | 546 (6.3%) | 500 (5.8%) |
| 30 to 34 Years | 545 (6.2%) | 592 (6.9%) |
| 35 to 39 Years | 413 (4.7%) | 389 (4.5%) |
| 40 to 44 Years | 712 (8.2%) | 749 (8.7%) |
| 45 to 49 Years | 529 (6.1%) | 530 (6.2%) |
| 50 to 54 Years | 565 (6.5%) | 481 (5.6%) |
| 55 to 59 Years | 695 (8.0%) | 670 (7.8%) |
| 60 to 64 Years | 687 (7.9%) | 771 (9.0%) |
| 65 to 69 Years | 701 (8.0%) | 696 (8.1%) |
| 70 to 74 Years | 607 (7.0%) | 549 (6.4%) |
| 75 to 79 Years | 350 (4.0%) | 405 (4.7%) |
| 80 to 84 Years | 215 (2.5%) | 207 (2.4%) |
| 85 Years and over | 125 (1.4%) | 253 (2.9%) |
| Total | 8,723 (100.0%) | 8,597 (100.0%) |
Families and Households in Park County
Median Family Size in Park County
The median family size in Park County is 2.63 persons per family, with single female/mother families (384 | 8.3%) accounting for the largest median family size of 2.76 persons per family. On the other hand, single male/father families (346 | 7.5%) represent the smallest median family size with 2.42 persons per family.
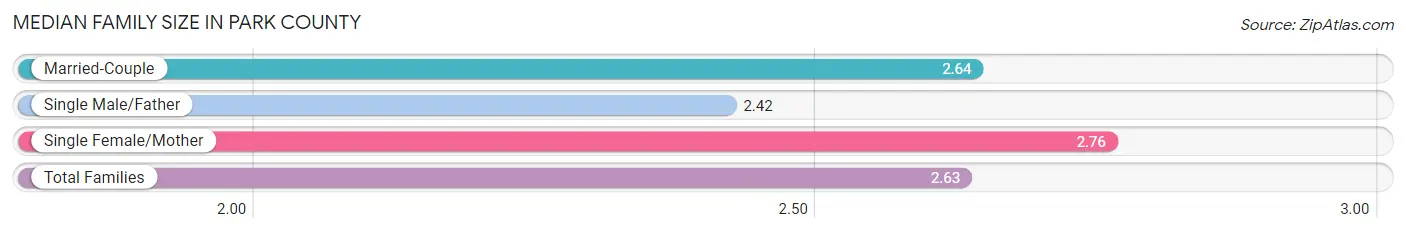
| Family Type | # Families | Family Size |
| Married-Couple | 3,876 (84.2%) | 2.64 |
| Single Male/Father | 346 (7.5%) | 2.42 |
| Single Female/Mother | 384 (8.3%) | 2.76 |
| Total Families | 4,606 (100.0%) | 2.63 |
Median Household Size in Park County
The median household size in Park County is 2.11 persons per household, with single female/mother households (384 | 4.8%) accounting for the largest median household size of 3.01 persons per household. non-family households (3,449 | 42.8%) represent the smallest median household size with 1.34 persons per household.
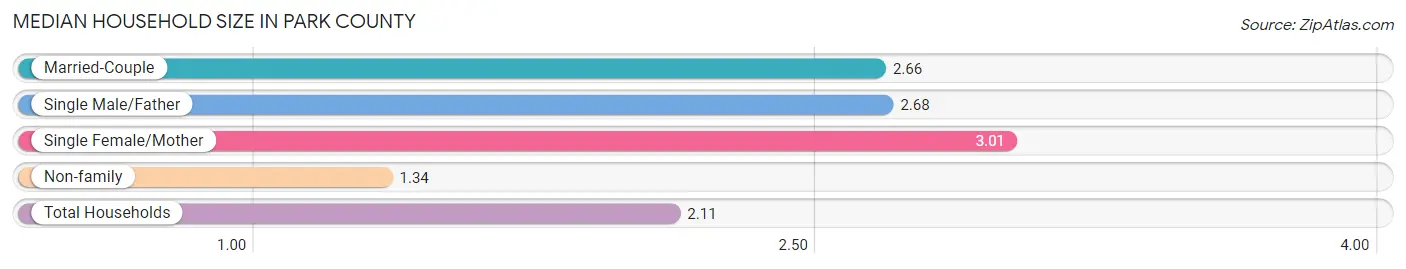
| Household Type | # Households | Household Size |
| Married-Couple | 3,876 (48.1%) | 2.66 |
| Single Male/Father | 346 (4.3%) | 2.68 |
| Single Female/Mother | 384 (4.8%) | 3.01 |
| Non-family | 3,449 (42.8%) | 1.34 |
| Total Households | 8,055 (100.0%) | 2.11 |
Household Size by Marriage Status in Park County
Out of a total of 8,055 households in Park County, 4,606 (57.2%) are family households, while 3,449 (42.8%) are nonfamily households. The most numerous type of family households are 2-person households, comprising 2,790, and the most common type of nonfamily households are 1-person households, comprising 2,642.
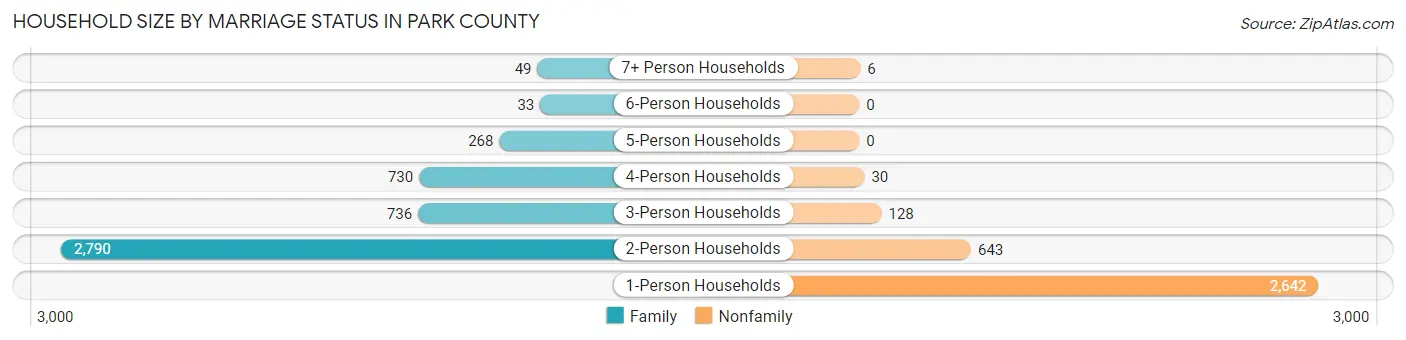
| Household Size | Family Households | Nonfamily Households |
| 1-Person Households | - | 2,642 (32.8%) |
| 2-Person Households | 2,790 (34.6%) | 643 (8.0%) |
| 3-Person Households | 736 (9.1%) | 128 (1.6%) |
| 4-Person Households | 730 (9.1%) | 30 (0.4%) |
| 5-Person Households | 268 (3.3%) | 0 (0.0%) |
| 6-Person Households | 33 (0.4%) | 0 (0.0%) |
| 7+ Person Households | 49 (0.6%) | 6 (0.1%) |
| Total | 4,606 (57.2%) | 3,449 (42.8%) |
Female Fertility in Park County
Fertility by Age in Park County
Average fertility rate in Park County is 54.0 births per 1,000 women. Women in the age bracket of 20 to 34 years have the highest fertility rate with 106.0 births per 1,000 women. Women in the age bracket of 20 to 34 years acount for 84.7% of all women with births.
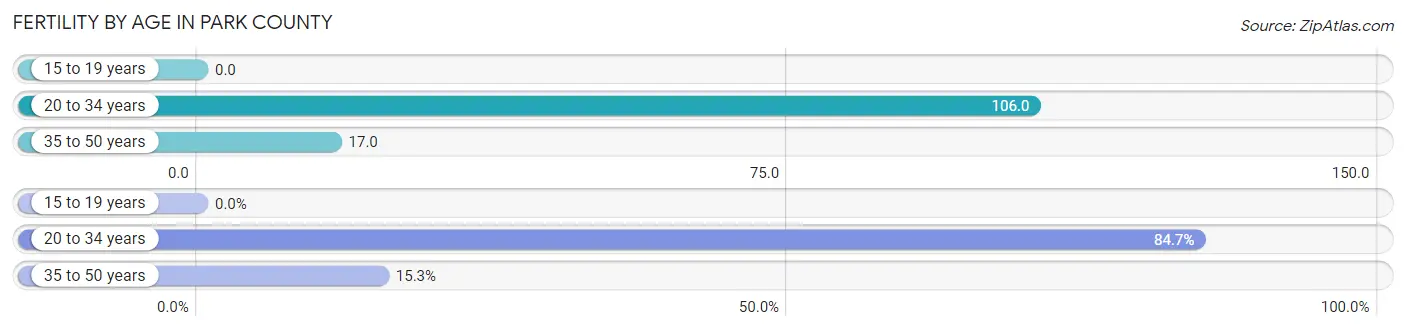
| Age Bracket | Women with Births | Births / 1,000 Women |
| 15 to 19 years | 0 (0.0%) | 0.0 |
| 20 to 34 years | 160 (84.7%) | 106.0 |
| 35 to 50 years | 29 (15.3%) | 17.0 |
| Total | 189 (100.0%) | 54.0 |
Fertility by Age by Marriage Status in Park County
74.1% of women with births (189) in Park County are married. The highest percentage of unmarried women with births falls into 20 to 34 years age bracket with 30.6% of them unmarried at the time of birth, while the lowest percentage of unmarried women with births belong to 35 to 50 years age bracket with 0.0% of them unmarried.
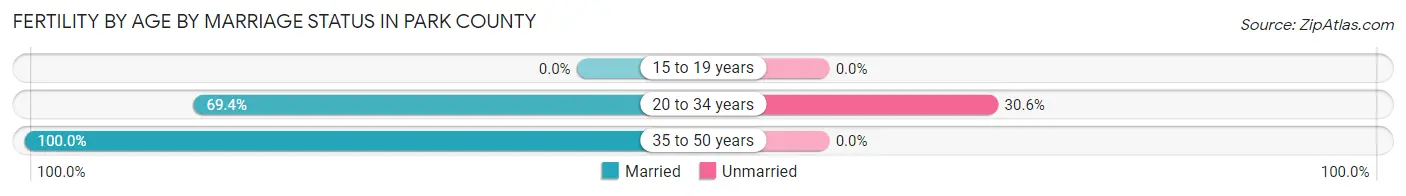
| Age Bracket | Married | Unmarried |
| 15 to 19 years | 0 (0.0%) | 0 (0.0%) |
| 20 to 34 years | 111 (69.4%) | 49 (30.6%) |
| 35 to 50 years | 29 (100.0%) | 0 (0.0%) |
| Total | 140 (74.1%) | 49 (25.9%) |
Fertility by Education in Park County
Average fertility rate in Park County is 54.0 births per 1,000 women. Women with the education attainment of less than high school have the highest fertility rate of 229.0 births per 1,000 women, while women with the education attainment of bachelor's degree have the lowest fertility at 15.0 births per 1,000 women. Women with the education attainment of less than high school represent 39.2% of all women with births.
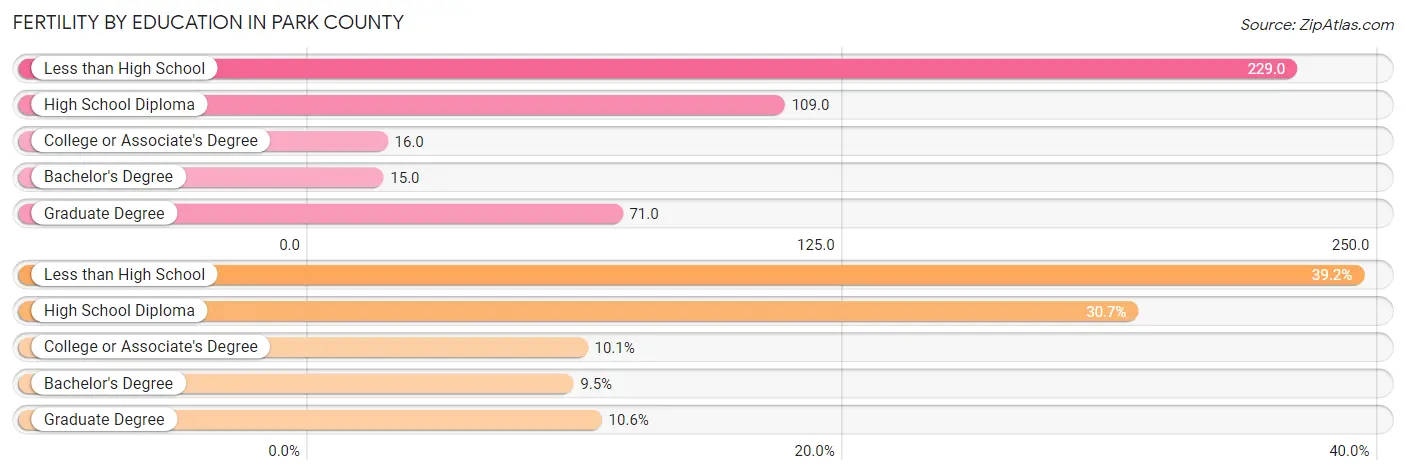
| Educational Attainment | Women with Births | Births / 1,000 Women |
| Less than High School | 74 (39.2%) | 229.0 |
| High School Diploma | 58 (30.7%) | 109.0 |
| College or Associate's Degree | 19 (10.1%) | 16.0 |
| Bachelor's Degree | 18 (9.5%) | 15.0 |
| Graduate Degree | 20 (10.6%) | 71.0 |
| Total | 189 (100.0%) | 54.0 |
Fertility by Education by Marriage Status in Park County
25.9% of women with births in Park County are unmarried. Women with the educational attainment of less than high school are most likely to be married with 100.0% of them married at childbirth, while women with the educational attainment of graduate degree are least likely to be married with 100.0% of them unmarried at childbirth.
| Educational Attainment | Married | Unmarried |
| Less than High School | 74 (100.0%) | 0 (0.0%) |
| High School Diploma | 29 (50.0%) | 29 (50.0%) |
| College or Associate's Degree | 19 (100.0%) | 0 (0.0%) |
| Bachelor's Degree | 18 (100.0%) | 0 (0.0%) |
| Graduate Degree | 0 (0.0%) | 20 (100.0%) |
| Total | 140 (74.1%) | 49 (25.9%) |
Employment Characteristics in Park County
Employment by Class of Employer in Park County
Among the 8,950 employed individuals in Park County, private company employees (4,982 | 55.7%), self-employed (not incorporated) (1,054 | 11.8%), and self-employed (incorporated) (902 | 10.1%) make up the most common classes of employment.
| Employer Class | # Employees | % Employees |
| Private Company Employees | 4,982 | 55.7% |
| Self-Employed (Incorporated) | 902 | 10.1% |
| Self-Employed (Not Incorporated) | 1,054 | 11.8% |
| Not-for-profit Organizations | 887 | 9.9% |
| Local Government Employees | 629 | 7.0% |
| State Government Employees | 246 | 2.8% |
| Federal Government Employees | 222 | 2.5% |
| Unpaid Family Workers | 28 | 0.3% |
| Total | 8,950 | 100.0% |
Employment Status by Age in Park County
According to the labor force statistics for Park County, out of the total population over 16 years of age (14,872), 63.2% or 9,399 individuals are in the labor force, with 3.3% or 310 of them unemployed. The age group with the highest labor force participation rate is 25 to 29 years, with 90.3% or 945 individuals in the labor force. Within the labor force, the 20 to 24 years age range has the highest percentage of unemployed individuals, with 10.4% or 69 of them being unemployed.
| Age Bracket | In Labor Force | Unemployed |
| 16 to 19 Years | 302 (47.7%) | 16 (5.3%) |
| 20 to 24 Years | 664 (87.7%) | 69 (10.4%) |
| 25 to 29 Years | 945 (90.3%) | 11 (1.2%) |
| 30 to 34 Years | 966 (85.0%) | 5 (0.5%) |
| 35 to 44 Years | 2,021 (89.3%) | 44 (2.2%) |
| 45 to 54 Years | 1,886 (89.6%) | 53 (2.8%) |
| 55 to 59 Years | 946 (69.3%) | 25 (2.6%) |
| 60 to 64 Years | 838 (57.5%) | 39 (4.7%) |
| 65 to 74 Years | 659 (25.8%) | 46 (7.0%) |
| 75 Years and over | 177 (11.4%) | 0 (0.0%) |
| Total | 9,399 (63.2%) | 310 (3.3%) |
Employment Status by Educational Attainment in Park County
According to labor force statistics for Park County, 81.1% of individuals (7,602) out of the total population between 25 and 64 years of age (9,374) are in the labor force, with 2.3% or 175 of them being unemployed. The group with the highest labor force participation rate are those with the educational attainment of bachelor's degree or higher, with 84.7% or 2,895 individuals in the labor force. Within the labor force, individuals with less than high school education have the highest percentage of unemployment, with 9.5% or 13 of them being unemployed.
| Educational Attainment | In Labor Force | Unemployed |
| Less than High School | 137 (50.9%) | 26 (9.5%) |
| High School Diploma | 1,840 (80.4%) | 2 (0.1%) |
| College / Associate Degree | 2,729 (80.3%) | 85 (2.5%) |
| Bachelor's Degree or higher | 2,895 (84.7%) | 109 (3.2%) |
| Total | 7,602 (81.1%) | 216 (2.3%) |
Employment Occupations by Sex in Park County
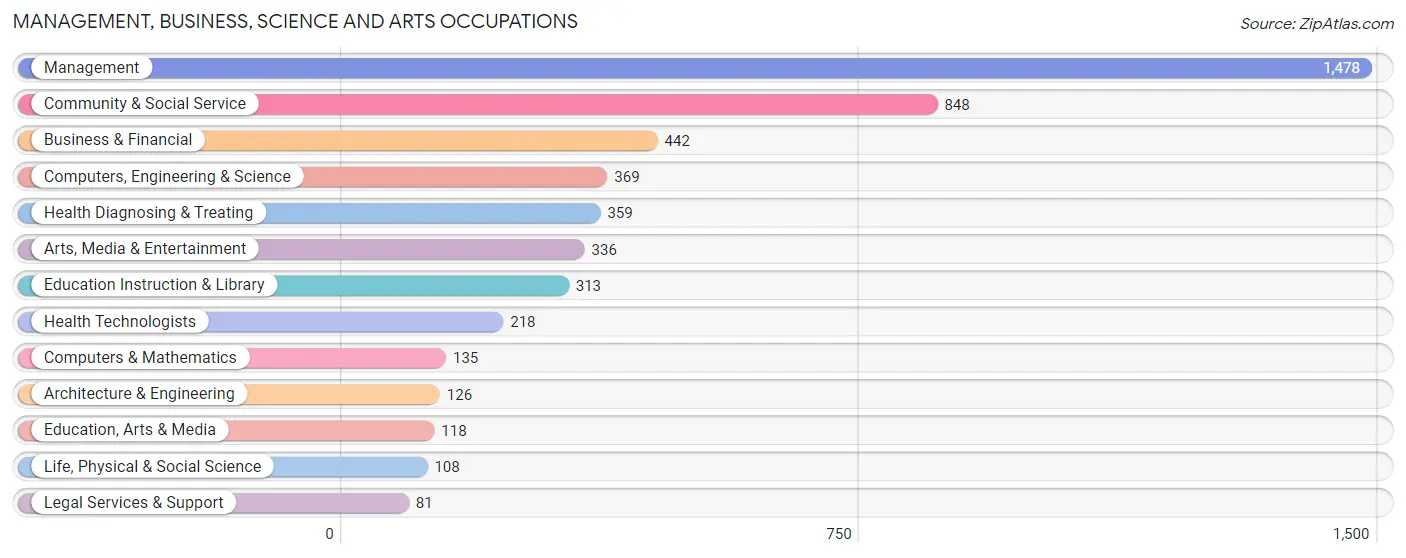
Management, Business, Science and Arts Occupations
The most common Management, Business, Science and Arts occupations in Park County are Management (1,478 | 16.3%), Community & Social Service (848 | 9.3%), Business & Financial (442 | 4.9%), Computers, Engineering & Science (369 | 4.1%), and Health Diagnosing & Treating (359 | 4.0%).
Management, Business, Science and Arts Occupations by Sex
Within the Management, Business, Science and Arts occupations in Park County, the most male-oriented occupations are Computers & Mathematics (94.1%), Architecture & Engineering (78.6%), and Computers, Engineering & Science (68.8%), while the most female-oriented occupations are Health Technologists (91.7%), Health Diagnosing & Treating (82.7%), and Life, Physical & Social Science (74.1%).
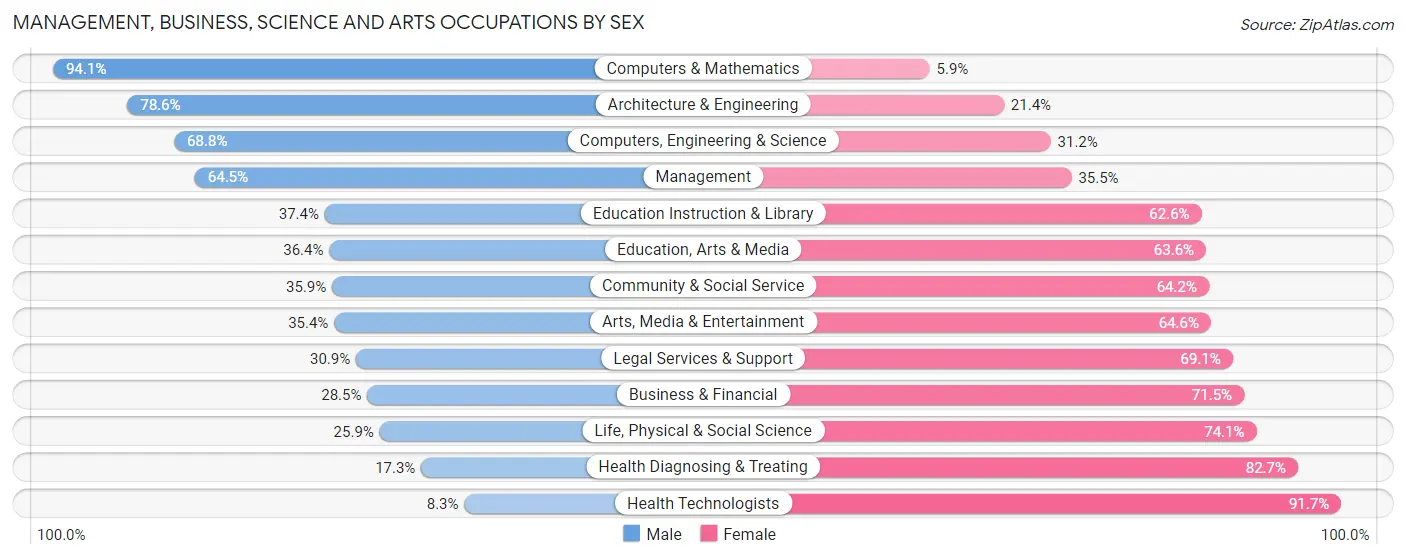
| Occupation | Male | Female |
| Management | 953 (64.5%) | 525 (35.5%) |
| Business & Financial | 126 (28.5%) | 316 (71.5%) |
| Computers, Engineering & Science | 254 (68.8%) | 115 (31.2%) |
| Computers & Mathematics | 127 (94.1%) | 8 (5.9%) |
| Architecture & Engineering | 99 (78.6%) | 27 (21.4%) |
| Life, Physical & Social Science | 28 (25.9%) | 80 (74.1%) |
| Community & Social Service | 304 (35.8%) | 544 (64.1%) |
| Education, Arts & Media | 43 (36.4%) | 75 (63.6%) |
| Legal Services & Support | 25 (30.9%) | 56 (69.1%) |
| Education Instruction & Library | 117 (37.4%) | 196 (62.6%) |
| Arts, Media & Entertainment | 119 (35.4%) | 217 (64.6%) |
| Health Diagnosing & Treating | 62 (17.3%) | 297 (82.7%) |
| Health Technologists | 18 (8.3%) | 200 (91.7%) |
| Total (Category) | 1,699 (48.6%) | 1,797 (51.4%) |
| Total (Overall) | 4,975 (54.7%) | 4,123 (45.3%) |
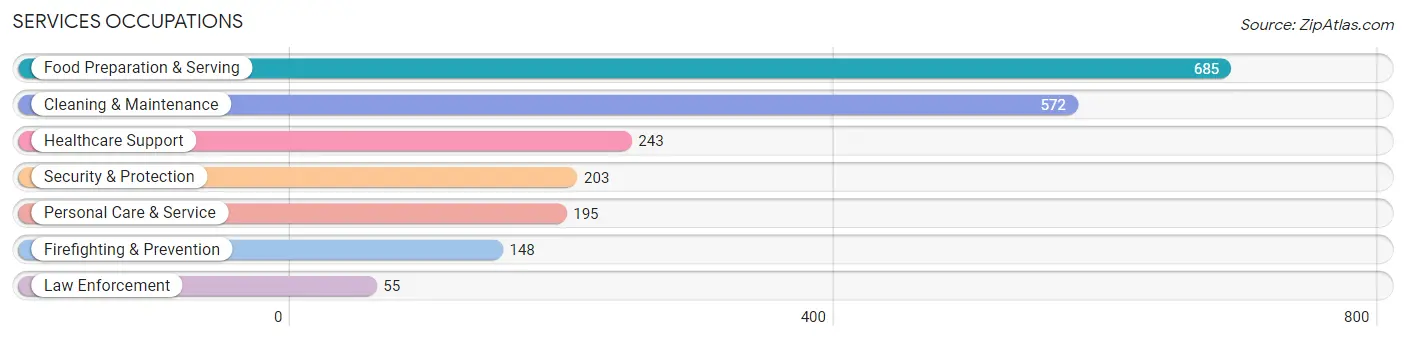
Services Occupations
The most common Services occupations in Park County are Food Preparation & Serving (685 | 7.5%), Cleaning & Maintenance (572 | 6.3%), Healthcare Support (243 | 2.7%), Security & Protection (203 | 2.2%), and Personal Care & Service (195 | 2.1%).
Services Occupations by Sex
Within the Services occupations in Park County, the most male-oriented occupations are Law Enforcement (100.0%), Security & Protection (74.4%), and Firefighting & Prevention (64.9%), while the most female-oriented occupations are Healthcare Support (98.8%), Personal Care & Service (66.1%), and Food Preparation & Serving (55.9%).
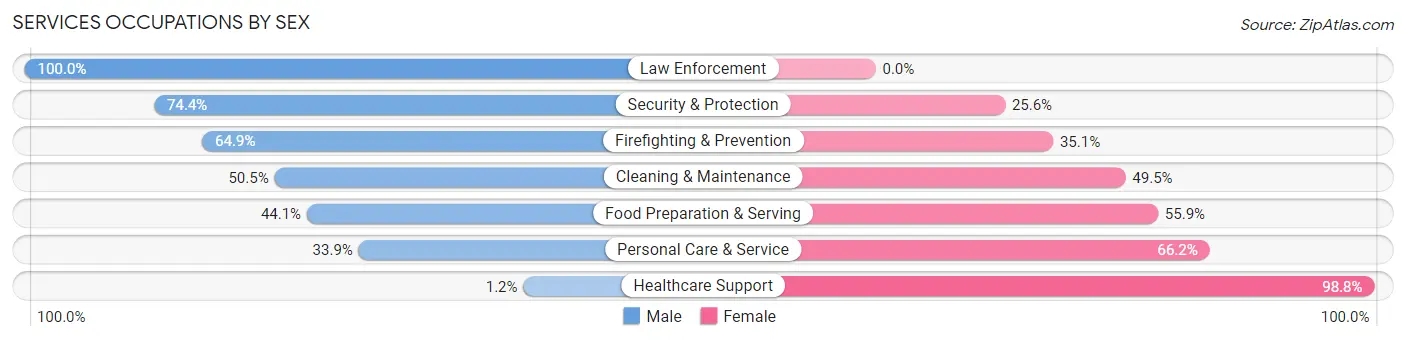
| Occupation | Male | Female |
| Healthcare Support | 3 (1.2%) | 240 (98.8%) |
| Security & Protection | 151 (74.4%) | 52 (25.6%) |
| Firefighting & Prevention | 96 (64.9%) | 52 (35.1%) |
| Law Enforcement | 55 (100.0%) | 0 (0.0%) |
| Food Preparation & Serving | 302 (44.1%) | 383 (55.9%) |
| Cleaning & Maintenance | 289 (50.5%) | 283 (49.5%) |
| Personal Care & Service | 66 (33.9%) | 129 (66.1%) |
| Total (Category) | 811 (42.7%) | 1,087 (57.3%) |
| Total (Overall) | 4,975 (54.7%) | 4,123 (45.3%) |
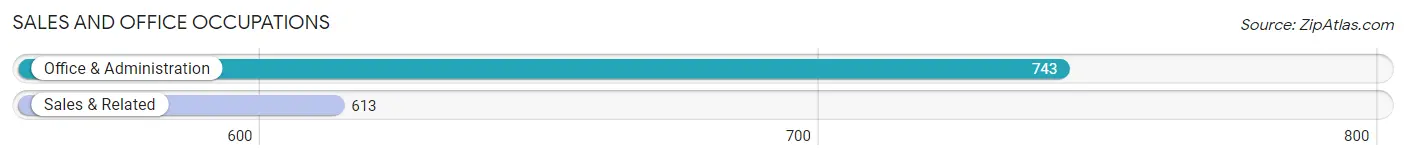
Sales and Office Occupations
The most common Sales and Office occupations in Park County are Office & Administration (743 | 8.2%), and Sales & Related (613 | 6.7%).
Sales and Office Occupations by Sex
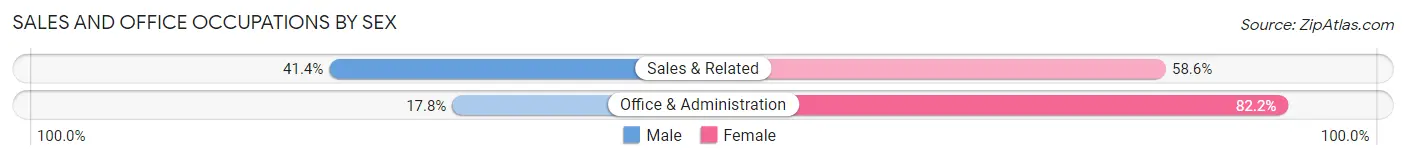
| Occupation | Male | Female |
| Sales & Related | 254 (41.4%) | 359 (58.6%) |
| Office & Administration | 132 (17.8%) | 611 (82.2%) |
| Total (Category) | 386 (28.5%) | 970 (71.5%) |
| Total (Overall) | 4,975 (54.7%) | 4,123 (45.3%) |
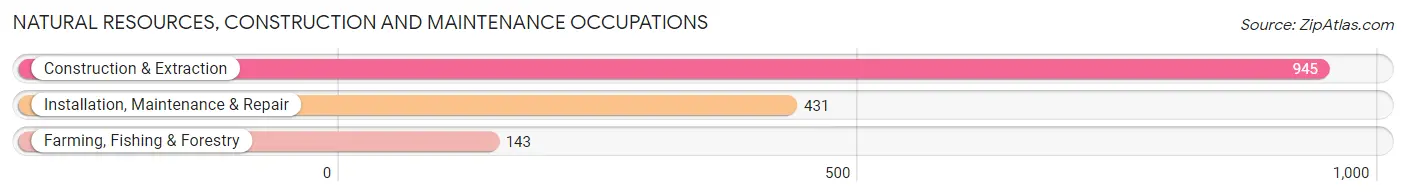
Natural Resources, Construction and Maintenance Occupations
The most common Natural Resources, Construction and Maintenance occupations in Park County are Construction & Extraction (945 | 10.4%), Installation, Maintenance & Repair (431 | 4.7%), and Farming, Fishing & Forestry (143 | 1.6%).
Natural Resources, Construction and Maintenance Occupations by Sex
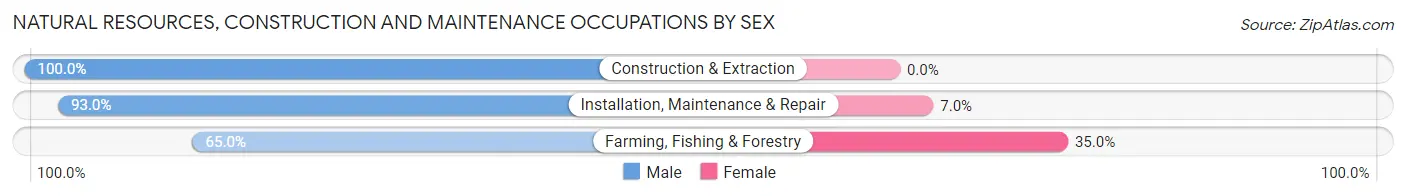
| Occupation | Male | Female |
| Farming, Fishing & Forestry | 93 (65.0%) | 50 (35.0%) |
| Construction & Extraction | 945 (100.0%) | 0 (0.0%) |
| Installation, Maintenance & Repair | 401 (93.0%) | 30 (7.0%) |
| Total (Category) | 1,439 (94.7%) | 80 (5.3%) |
| Total (Overall) | 4,975 (54.7%) | 4,123 (45.3%) |
Production, Transportation and Moving Occupations
The most common Production, Transportation and Moving occupations in Park County are Production (539 | 5.9%), Transportation (149 | 1.6%), and Material Moving (141 | 1.5%).
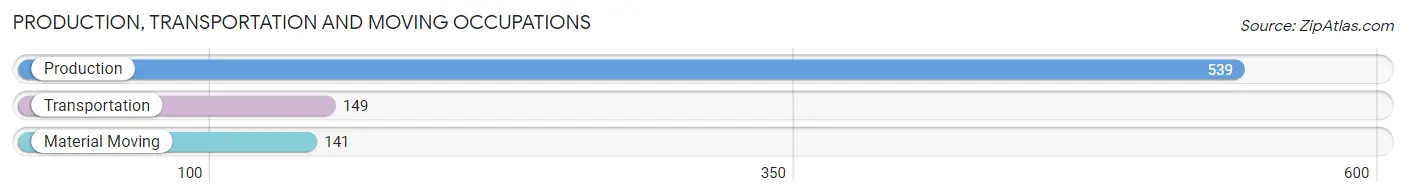
Production, Transportation and Moving Occupations by Sex
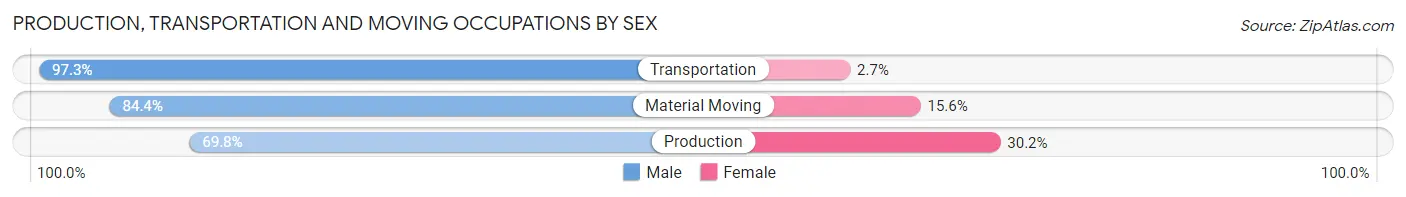
| Occupation | Male | Female |
| Production | 376 (69.8%) | 163 (30.2%) |
| Transportation | 145 (97.3%) | 4 (2.7%) |
| Material Moving | 119 (84.4%) | 22 (15.6%) |
| Total (Category) | 640 (77.2%) | 189 (22.8%) |
| Total (Overall) | 4,975 (54.7%) | 4,123 (45.3%) |
Employment Industries by Sex in Park County
Employment Industries in Park County
The major employment industries in Park County include Construction (1,229 | 13.5%), Health Care & Social Assistance (941 | 10.3%), Accommodation & Food Services (885 | 9.7%), Retail Trade (850 | 9.3%), and Professional & Scientific (838 | 9.2%).
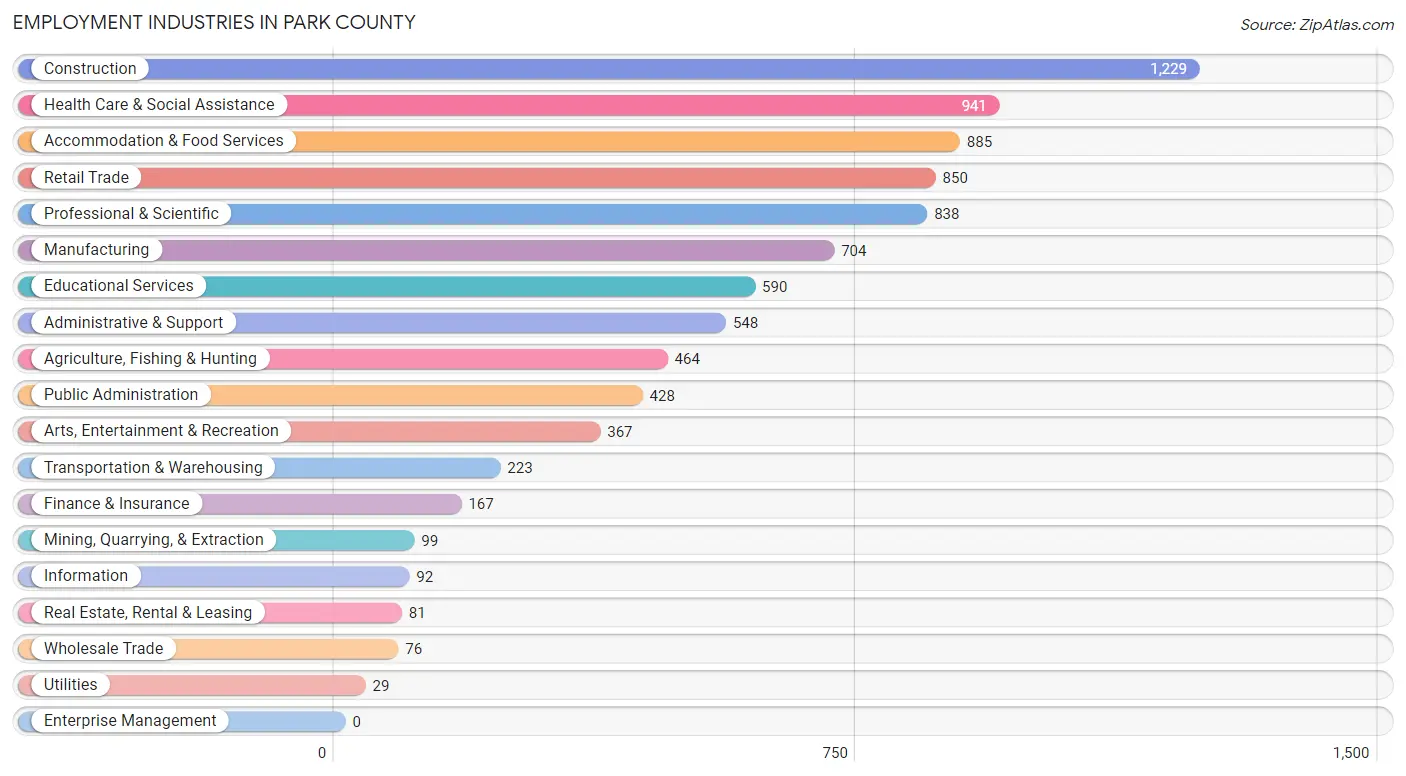
Employment Industries by Sex in Park County
The Park County industries that see more men than women are Mining, Quarrying, & Extraction (100.0%), Construction (93.7%), and Transportation & Warehousing (92.8%), whereas the industries that tend to have a higher number of women are Finance & Insurance (97.0%), Health Care & Social Assistance (90.3%), and Real Estate, Rental & Leasing (80.2%).
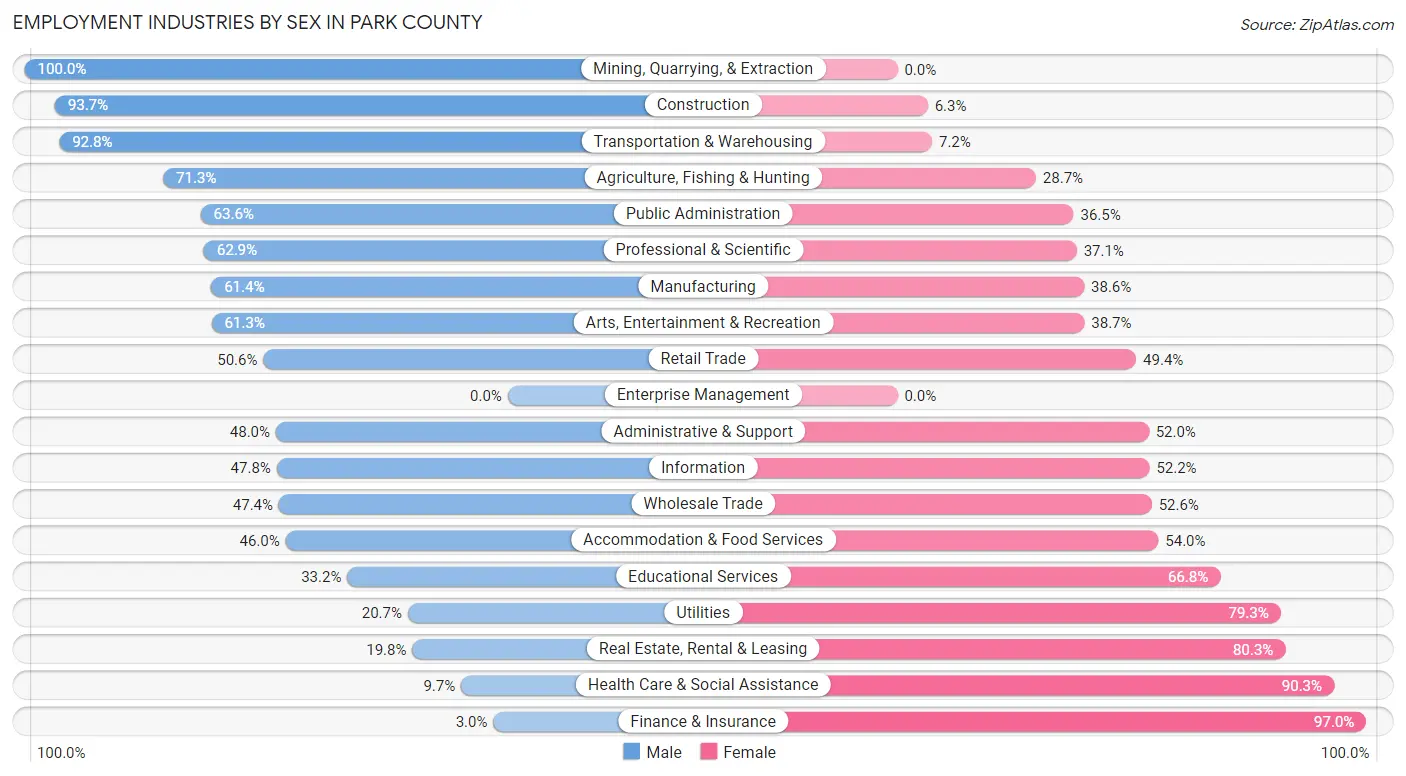
| Industry | Male | Female |
| Agriculture, Fishing & Hunting | 331 (71.3%) | 133 (28.7%) |
| Mining, Quarrying, & Extraction | 99 (100.0%) | 0 (0.0%) |
| Construction | 1,152 (93.7%) | 77 (6.3%) |
| Manufacturing | 432 (61.4%) | 272 (38.6%) |
| Wholesale Trade | 36 (47.4%) | 40 (52.6%) |
| Retail Trade | 430 (50.6%) | 420 (49.4%) |
| Transportation & Warehousing | 207 (92.8%) | 16 (7.2%) |
| Utilities | 6 (20.7%) | 23 (79.3%) |
| Information | 44 (47.8%) | 48 (52.2%) |
| Finance & Insurance | 5 (3.0%) | 162 (97.0%) |
| Real Estate, Rental & Leasing | 16 (19.8%) | 65 (80.2%) |
| Professional & Scientific | 527 (62.9%) | 311 (37.1%) |
| Enterprise Management | 0 (0.0%) | 0 (0.0%) |
| Administrative & Support | 263 (48.0%) | 285 (52.0%) |
| Educational Services | 196 (33.2%) | 394 (66.8%) |
| Health Care & Social Assistance | 91 (9.7%) | 850 (90.3%) |
| Arts, Entertainment & Recreation | 225 (61.3%) | 142 (38.7%) |
| Accommodation & Food Services | 407 (46.0%) | 478 (54.0%) |
| Public Administration | 272 (63.5%) | 156 (36.4%) |
| Total | 4,975 (54.7%) | 4,123 (45.3%) |
Education in Park County
School Enrollment in Park County
The most common levels of schooling among the 2,743 students in Park County are middle school (669 | 24.4%), high school (627 | 22.9%), and elementary school (485 | 17.7%).
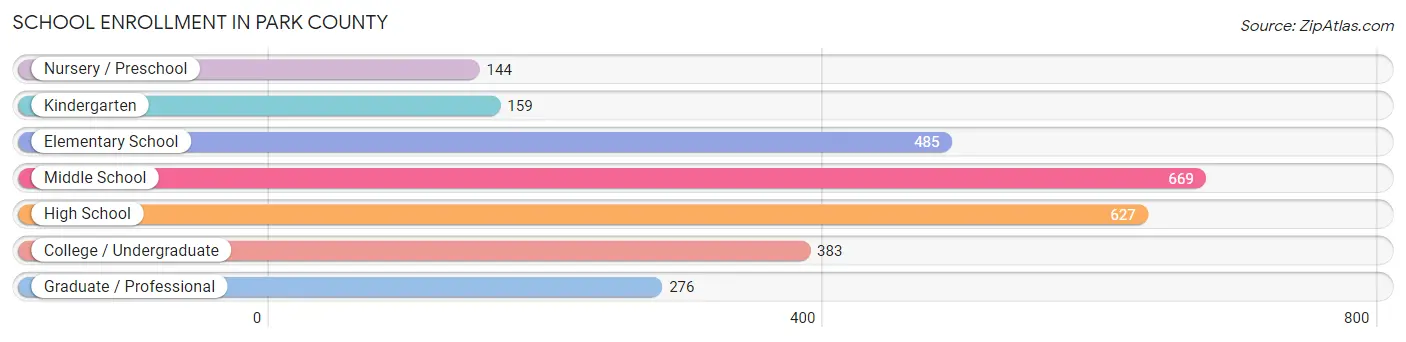
| School Level | # Students | % Students |
| Nursery / Preschool | 144 | 5.2% |
| Kindergarten | 159 | 5.8% |
| Elementary School | 485 | 17.7% |
| Middle School | 669 | 24.4% |
| High School | 627 | 22.9% |
| College / Undergraduate | 383 | 14.0% |
| Graduate / Professional | 276 | 10.1% |
| Total | 2,743 | 100.0% |
School Enrollment by Age by Funding Source in Park County
Out of a total of 2,743 students who are enrolled in schools in Park County, 483 (17.6%) attend a private institution, while the remaining 2,260 (82.4%) are enrolled in public schools. The age group of 3 to 4 year olds has the highest likelihood of being enrolled in private schools, with 67 (56.3% in the age bracket) enrolled. Conversely, the age group of 25 to 34 year olds has the lowest likelihood of being enrolled in a private school, with 166 (99.4% in the age bracket) attending a public institution.
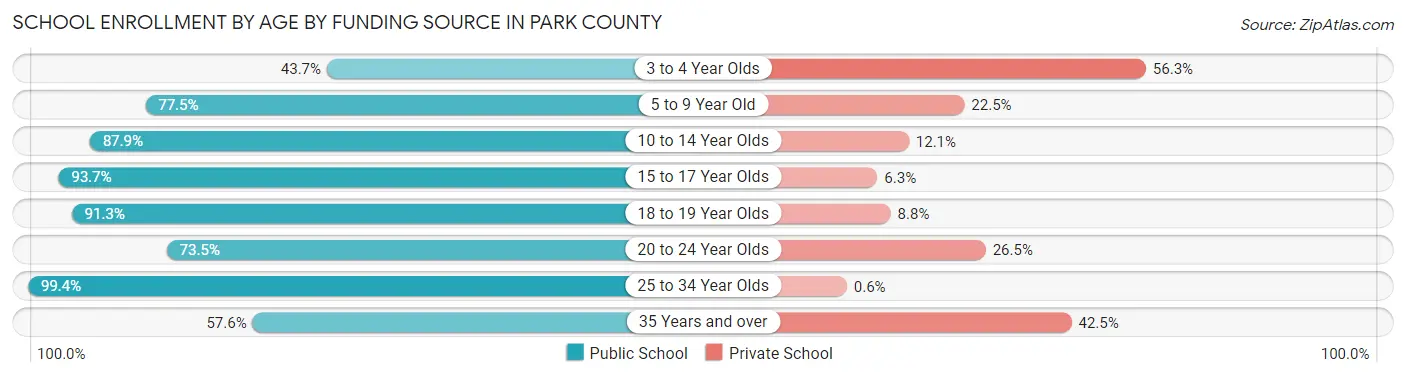
| Age Bracket | Public School | Private School |
| 3 to 4 Year Olds | 52 (43.7%) | 67 (56.3%) |
| 5 to 9 Year Old | 455 (77.5%) | 132 (22.5%) |
| 10 to 14 Year Olds | 731 (87.9%) | 101 (12.1%) |
| 15 to 17 Year Olds | 463 (93.7%) | 31 (6.3%) |
| 18 to 19 Year Olds | 73 (91.2%) | 7 (8.7%) |
| 20 to 24 Year Olds | 239 (73.5%) | 86 (26.5%) |
| 25 to 34 Year Olds | 166 (99.4%) | 1 (0.6%) |
| 35 Years and over | 80 (57.6%) | 59 (42.4%) |
| Total | 2,260 (82.4%) | 483 (17.6%) |
Educational Attainment by Field of Study in Park County
Bio, nature & agricultural (798 | 14.9%), education (752 | 14.1%), science & technology (527 | 9.9%), business (467 | 8.7%), and social sciences (434 | 8.1%) are the most common fields of study among 5,338 individuals in Park County who have obtained a bachelor's degree or higher.
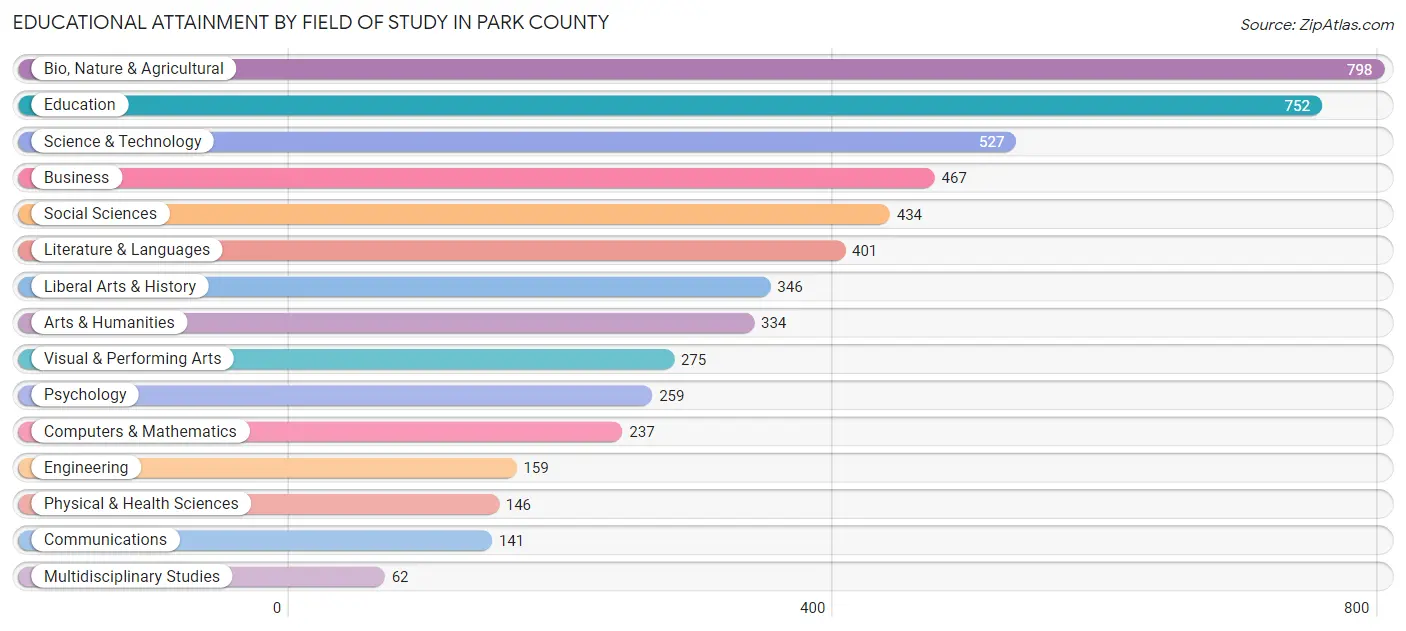
| Field of Study | # Graduates | % Graduates |
| Computers & Mathematics | 237 | 4.4% |
| Bio, Nature & Agricultural | 798 | 14.9% |
| Physical & Health Sciences | 146 | 2.7% |
| Psychology | 259 | 4.9% |
| Social Sciences | 434 | 8.1% |
| Engineering | 159 | 3.0% |
| Multidisciplinary Studies | 62 | 1.2% |
| Science & Technology | 527 | 9.9% |
| Business | 467 | 8.7% |
| Education | 752 | 14.1% |
| Literature & Languages | 401 | 7.5% |
| Liberal Arts & History | 346 | 6.5% |
| Visual & Performing Arts | 275 | 5.1% |
| Communications | 141 | 2.6% |
| Arts & Humanities | 334 | 6.3% |
| Total | 5,338 | 100.0% |
Transportation & Commute in Park County
Vehicle Availability by Sex in Park County
The most prevalent vehicle ownership categories in Park County are males with 2 vehicles (1,616, accounting for 34.2%) and females with 2 vehicles (1,357, making up 39.7%).
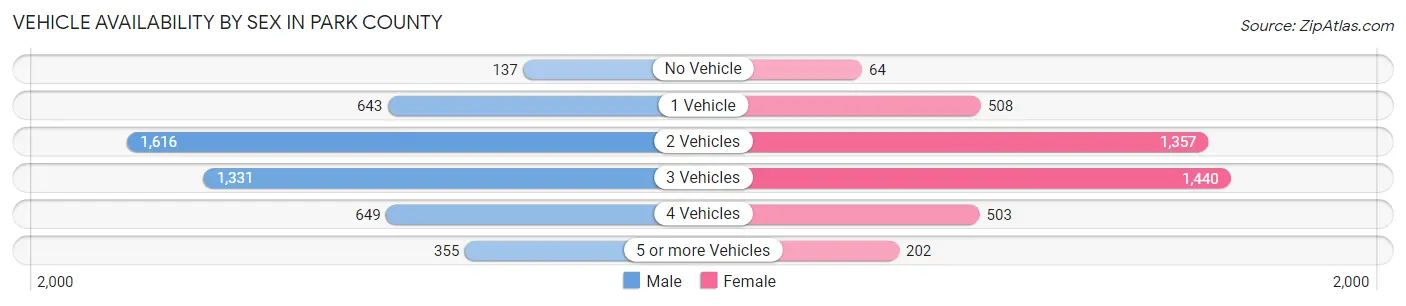
| Vehicles Available | Male | Female |
| No Vehicle | 137 (2.9%) | 64 (1.6%) |
| 1 Vehicle | 643 (13.6%) | 508 (12.5%) |
| 2 Vehicles | 1,616 (34.2%) | 1,357 (33.3%) |
| 3 Vehicles | 1,331 (28.1%) | 1,440 (35.3%) |
| 4 Vehicles | 649 (13.7%) | 503 (12.3%) |
| 5 or more Vehicles | 355 (7.5%) | 202 (5.0%) |
| Total | 4,731 (100.0%) | 4,074 (100.0%) |
Commute Time in Park County
The most frequently occuring commute durations in Park County are 5 to 9 minutes (1,629 commuters, 21.6%), 10 to 14 minutes (1,225 commuters, 16.2%), and 30 to 34 minutes (994 commuters, 13.2%).
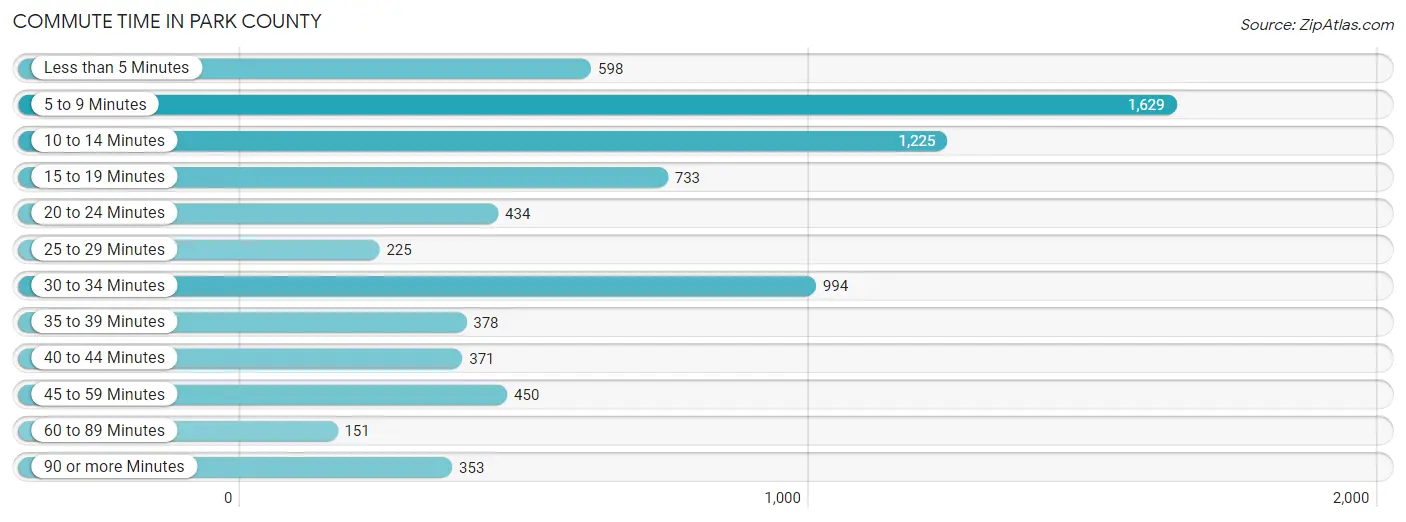
| Commute Time | # Commuters | % Commuters |
| Less than 5 Minutes | 598 | 7.9% |
| 5 to 9 Minutes | 1,629 | 21.6% |
| 10 to 14 Minutes | 1,225 | 16.2% |
| 15 to 19 Minutes | 733 | 9.7% |
| 20 to 24 Minutes | 434 | 5.8% |
| 25 to 29 Minutes | 225 | 3.0% |
| 30 to 34 Minutes | 994 | 13.2% |
| 35 to 39 Minutes | 378 | 5.0% |
| 40 to 44 Minutes | 371 | 4.9% |
| 45 to 59 Minutes | 450 | 6.0% |
| 60 to 89 Minutes | 151 | 2.0% |
| 90 or more Minutes | 353 | 4.7% |
Commute Time by Sex in Park County
The most common commute times in Park County are 5 to 9 minutes (859 commuters, 20.3%) for males and 5 to 9 minutes (770 commuters, 23.3%) for females.
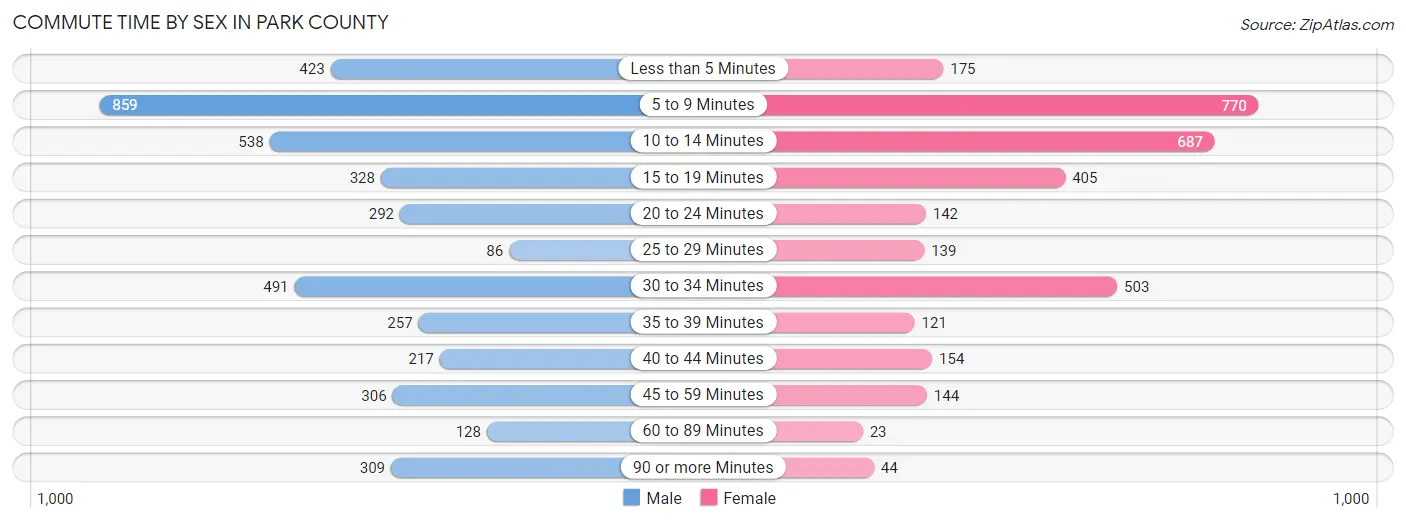
| Commute Time | Male | Female |
| Less than 5 Minutes | 423 (10.0%) | 175 (5.3%) |
| 5 to 9 Minutes | 859 (20.3%) | 770 (23.3%) |
| 10 to 14 Minutes | 538 (12.7%) | 687 (20.8%) |
| 15 to 19 Minutes | 328 (7.7%) | 405 (12.2%) |
| 20 to 24 Minutes | 292 (6.9%) | 142 (4.3%) |
| 25 to 29 Minutes | 86 (2.0%) | 139 (4.2%) |
| 30 to 34 Minutes | 491 (11.6%) | 503 (15.2%) |
| 35 to 39 Minutes | 257 (6.1%) | 121 (3.7%) |
| 40 to 44 Minutes | 217 (5.1%) | 154 (4.7%) |
| 45 to 59 Minutes | 306 (7.2%) | 144 (4.3%) |
| 60 to 89 Minutes | 128 (3.0%) | 23 (0.7%) |
| 90 or more Minutes | 309 (7.3%) | 44 (1.3%) |
Time of Departure to Work by Sex in Park County
The most frequent times of departure to work in Park County are 7:00 AM to 7:29 AM (728, 17.2%) for males and 7:00 AM to 7:29 AM (545, 16.5%) for females.
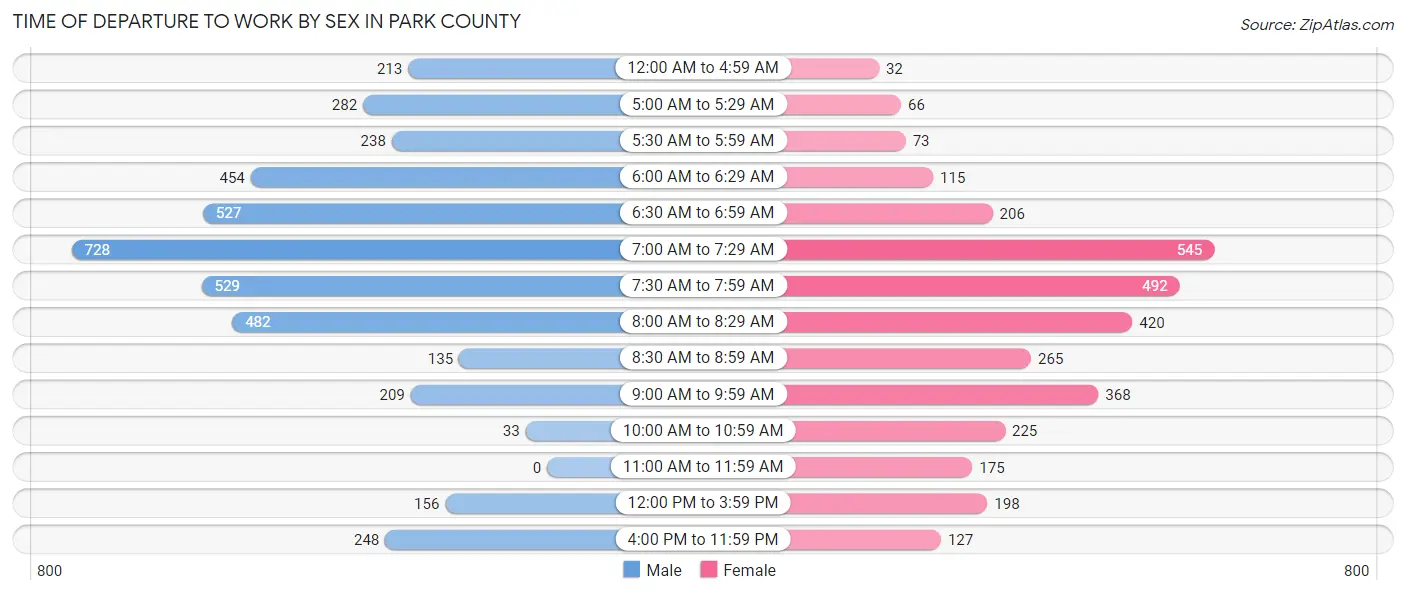
| Time of Departure | Male | Female |
| 12:00 AM to 4:59 AM | 213 (5.0%) | 32 (1.0%) |
| 5:00 AM to 5:29 AM | 282 (6.7%) | 66 (2.0%) |
| 5:30 AM to 5:59 AM | 238 (5.6%) | 73 (2.2%) |
| 6:00 AM to 6:29 AM | 454 (10.7%) | 115 (3.5%) |
| 6:30 AM to 6:59 AM | 527 (12.4%) | 206 (6.2%) |
| 7:00 AM to 7:29 AM | 728 (17.2%) | 545 (16.5%) |
| 7:30 AM to 7:59 AM | 529 (12.5%) | 492 (14.9%) |
| 8:00 AM to 8:29 AM | 482 (11.4%) | 420 (12.7%) |
| 8:30 AM to 8:59 AM | 135 (3.2%) | 265 (8.0%) |
| 9:00 AM to 9:59 AM | 209 (4.9%) | 368 (11.1%) |
| 10:00 AM to 10:59 AM | 33 (0.8%) | 225 (6.8%) |
| 11:00 AM to 11:59 AM | 0 (0.0%) | 175 (5.3%) |
| 12:00 PM to 3:59 PM | 156 (3.7%) | 198 (6.0%) |
| 4:00 PM to 11:59 PM | 248 (5.9%) | 127 (3.8%) |
| Total | 4,234 (100.0%) | 3,307 (100.0%) |
Housing Occupancy in Park County
Occupancy by Ownership in Park County
Of the total 8,055 dwellings in Park County, owner-occupied units account for 5,658 (70.2%), while renter-occupied units make up 2,397 (29.8%).
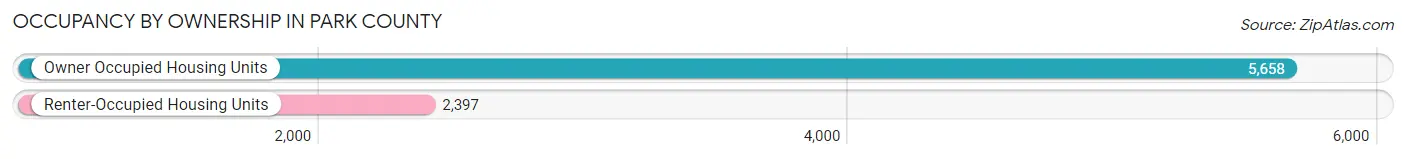
| Occupancy | # Housing Units | % Housing Units |
| Owner Occupied Housing Units | 5,658 | 70.2% |
| Renter-Occupied Housing Units | 2,397 | 29.8% |
| Total Occupied Housing Units | 8,055 | 100.0% |
Occupancy by Household Size in Park County
| Household Size | # Housing Units | % Housing Units |
| 1-Person Household | 2,642 | 32.8% |
| 2-Person Household | 3,433 | 42.6% |
| 3-Person Household | 864 | 10.7% |
| 4+ Person Household | 1,116 | 13.9% |
| Total Housing Units | 8,055 | 100.0% |
Occupancy by Ownership by Household Size in Park County
| Household Size | Owner-occupied | Renter-occupied |
| 1-Person Household | 1,388 (52.5%) | 1,254 (47.5%) |
| 2-Person Household | 2,686 (78.2%) | 747 (21.8%) |
| 3-Person Household | 697 (80.7%) | 167 (19.3%) |
| 4+ Person Household | 887 (79.5%) | 229 (20.5%) |
| Total Housing Units | 5,658 (70.2%) | 2,397 (29.8%) |
Occupancy by Educational Attainment in Park County
| Household Size | Owner-occupied | Renter-occupied |
| Less than High School | 89 (46.6%) | 102 (53.4%) |
| High School Diploma | 1,443 (66.4%) | 731 (33.6%) |
| College/Associate Degree | 1,942 (71.1%) | 791 (28.9%) |
| Bachelor's Degree or higher | 2,184 (73.9%) | 773 (26.1%) |
Occupancy by Age of Householder in Park County
| Age Bracket | # Households | % Households |
| Under 35 Years | 1,320 | 16.4% |
| 35 to 44 Years | 1,236 | 15.3% |
| 45 to 54 Years | 1,292 | 16.0% |
| 55 to 64 Years | 1,719 | 21.3% |
| 65 to 74 Years | 1,597 | 19.8% |
| 75 to 84 Years | 648 | 8.0% |
| 85 Years and Over | 243 | 3.0% |
| Total | 8,055 | 100.0% |
Housing Finances in Park County
Median Income by Occupancy in Park County
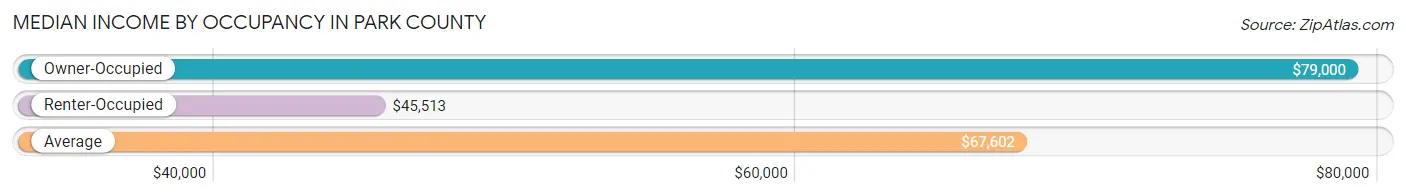
| Occupancy Type | # Households | Median Income |
| Owner-Occupied | 5,658 (70.2%) | $79,000 |
| Renter-Occupied | 2,397 (29.8%) | $45,513 |
| Average | 8,055 (100.0%) | $67,602 |
Occupancy by Householder Income Bracket in Park County
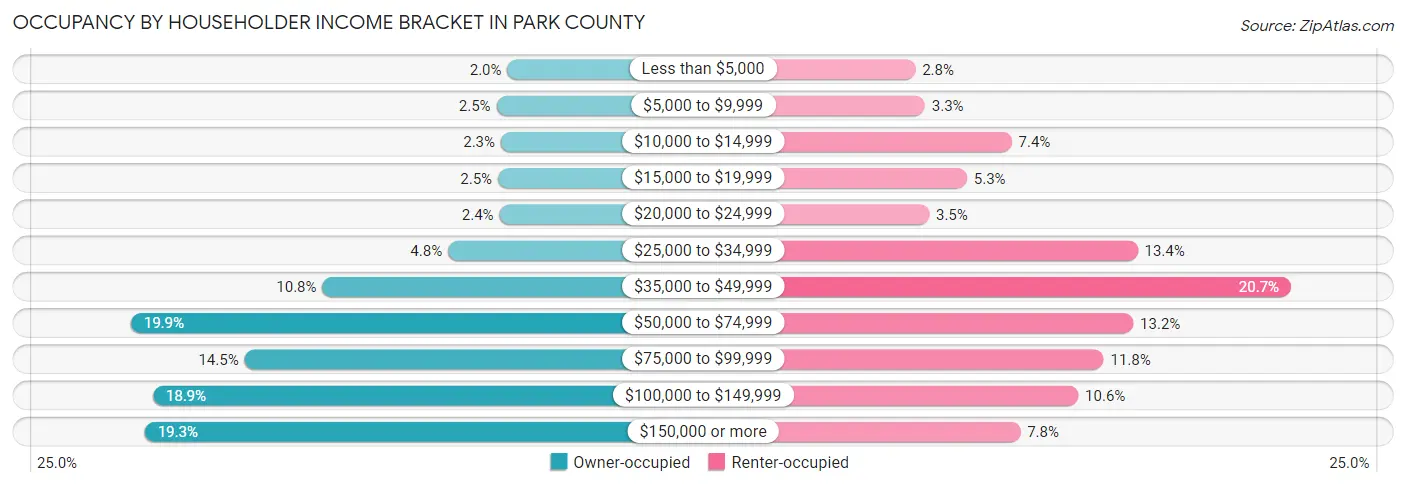
| Income Bracket | Owner-occupied | Renter-occupied |
| Less than $5,000 | 114 (2.0%) | 68 (2.8%) |
| $5,000 to $9,999 | 143 (2.5%) | 79 (3.3%) |
| $10,000 to $14,999 | 131 (2.3%) | 178 (7.4%) |
| $15,000 to $19,999 | 139 (2.5%) | 127 (5.3%) |
| $20,000 to $24,999 | 135 (2.4%) | 84 (3.5%) |
| $25,000 to $34,999 | 274 (4.8%) | 322 (13.4%) |
| $35,000 to $49,999 | 612 (10.8%) | 497 (20.7%) |
| $50,000 to $74,999 | 1,128 (19.9%) | 317 (13.2%) |
| $75,000 to $99,999 | 822 (14.5%) | 283 (11.8%) |
| $100,000 to $149,999 | 1,069 (18.9%) | 254 (10.6%) |
| $150,000 or more | 1,091 (19.3%) | 188 (7.8%) |
| Total | 5,658 (100.0%) | 2,397 (100.0%) |
Monthly Housing Cost Tiers in Park County
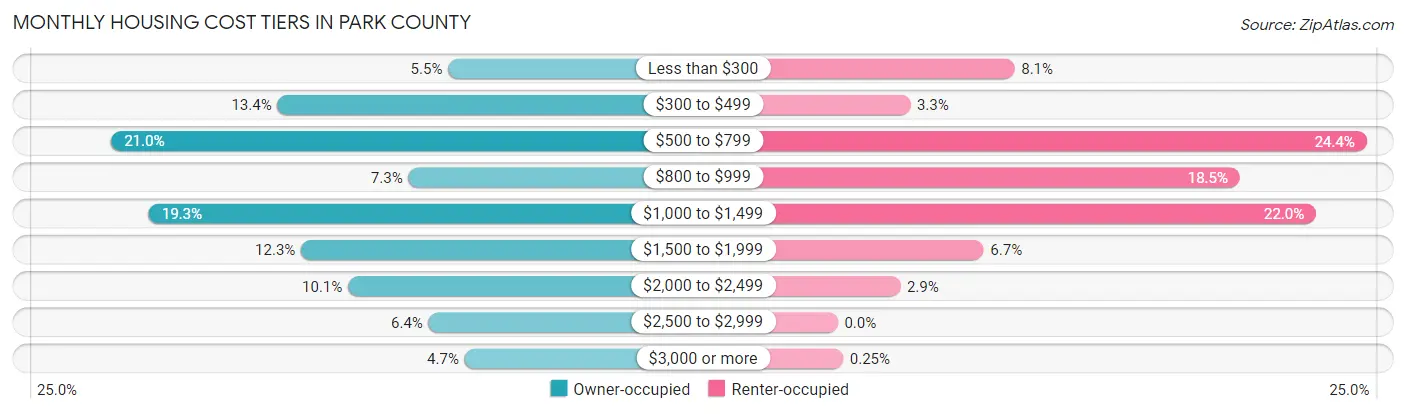
| Monthly Cost | Owner-occupied | Renter-occupied |
| Less than $300 | 311 (5.5%) | 195 (8.1%) |
| $300 to $499 | 756 (13.4%) | 80 (3.3%) |
| $500 to $799 | 1,189 (21.0%) | 584 (24.4%) |
| $800 to $999 | 415 (7.3%) | 444 (18.5%) |
| $1,000 to $1,499 | 1,091 (19.3%) | 528 (22.0%) |
| $1,500 to $1,999 | 694 (12.3%) | 161 (6.7%) |
| $2,000 to $2,499 | 572 (10.1%) | 69 (2.9%) |
| $2,500 to $2,999 | 362 (6.4%) | 0 (0.0%) |
| $3,000 or more | 268 (4.7%) | 6 (0.3%) |
| Total | 5,658 (100.0%) | 2,397 (100.0%) |
Physical Housing Characteristics in Park County
Housing Structures in Park County
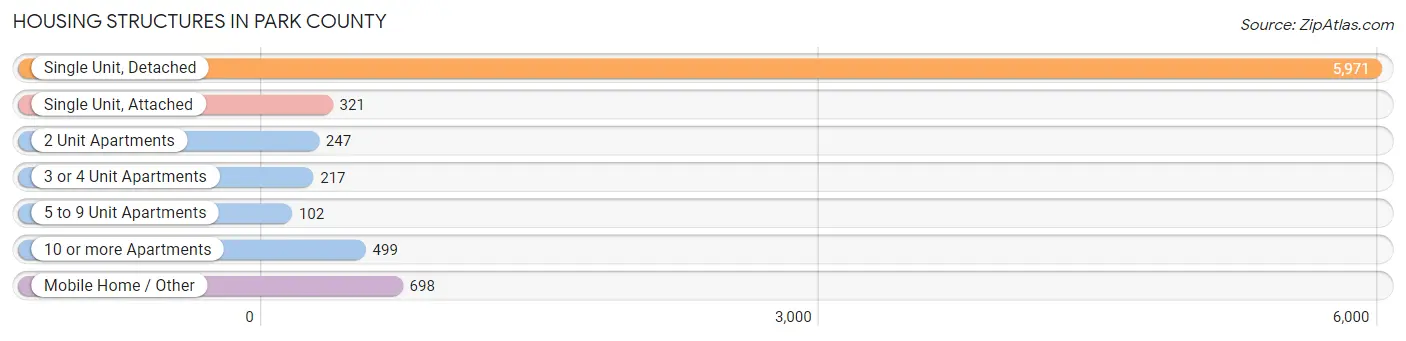
| Structure Type | # Housing Units | % Housing Units |
| Single Unit, Detached | 5,971 | 74.1% |
| Single Unit, Attached | 321 | 4.0% |
| 2 Unit Apartments | 247 | 3.1% |
| 3 or 4 Unit Apartments | 217 | 2.7% |
| 5 to 9 Unit Apartments | 102 | 1.3% |
| 10 or more Apartments | 499 | 6.2% |
| Mobile Home / Other | 698 | 8.7% |
| Total | 8,055 | 100.0% |
Housing Structures by Occupancy in Park County
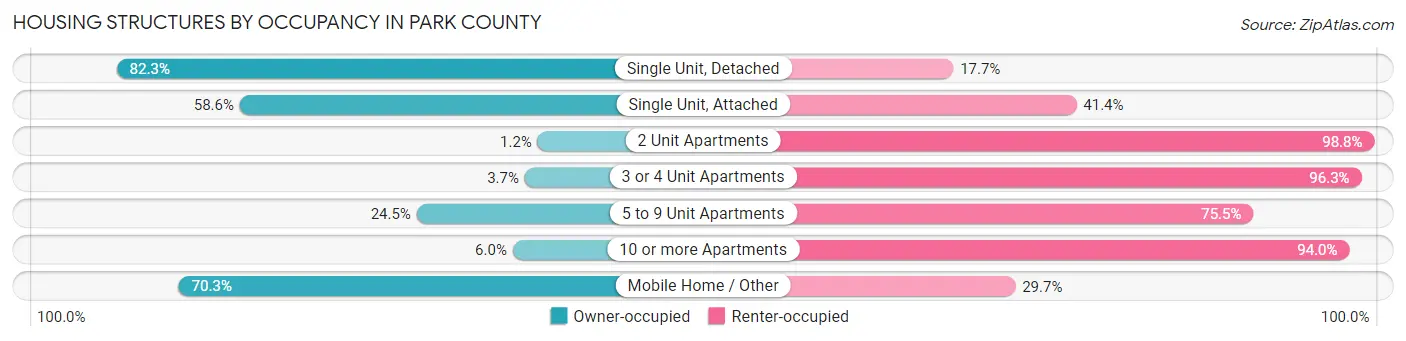
| Structure Type | Owner-occupied | Renter-occupied |
| Single Unit, Detached | 4,913 (82.3%) | 1,058 (17.7%) |
| Single Unit, Attached | 188 (58.6%) | 133 (41.4%) |
| 2 Unit Apartments | 3 (1.2%) | 244 (98.8%) |
| 3 or 4 Unit Apartments | 8 (3.7%) | 209 (96.3%) |
| 5 to 9 Unit Apartments | 25 (24.5%) | 77 (75.5%) |
| 10 or more Apartments | 30 (6.0%) | 469 (94.0%) |
| Mobile Home / Other | 491 (70.3%) | 207 (29.7%) |
| Total | 5,658 (70.2%) | 2,397 (29.8%) |
Housing Structures by Number of Rooms in Park County
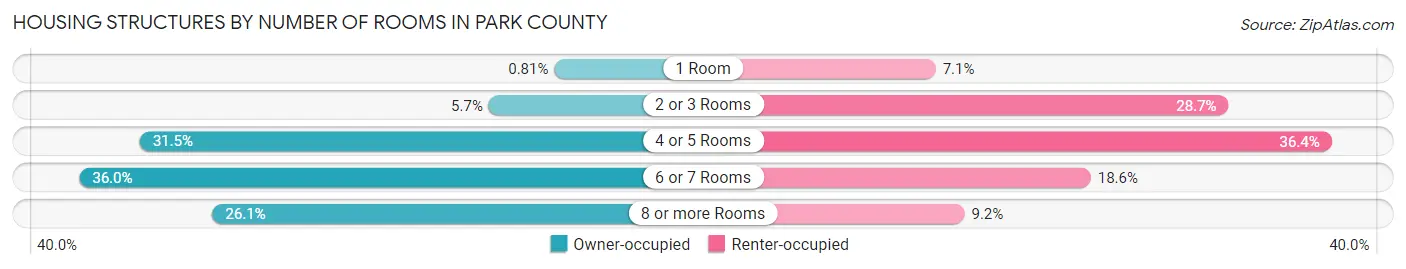
| Number of Rooms | Owner-occupied | Renter-occupied |
| 1 Room | 46 (0.8%) | 170 (7.1%) |
| 2 or 3 Rooms | 320 (5.7%) | 689 (28.7%) |
| 4 or 5 Rooms | 1,781 (31.5%) | 872 (36.4%) |
| 6 or 7 Rooms | 2,034 (35.9%) | 445 (18.6%) |
| 8 or more Rooms | 1,477 (26.1%) | 221 (9.2%) |
| Total | 5,658 (100.0%) | 2,397 (100.0%) |
Housing Structure by Heating Type in Park County
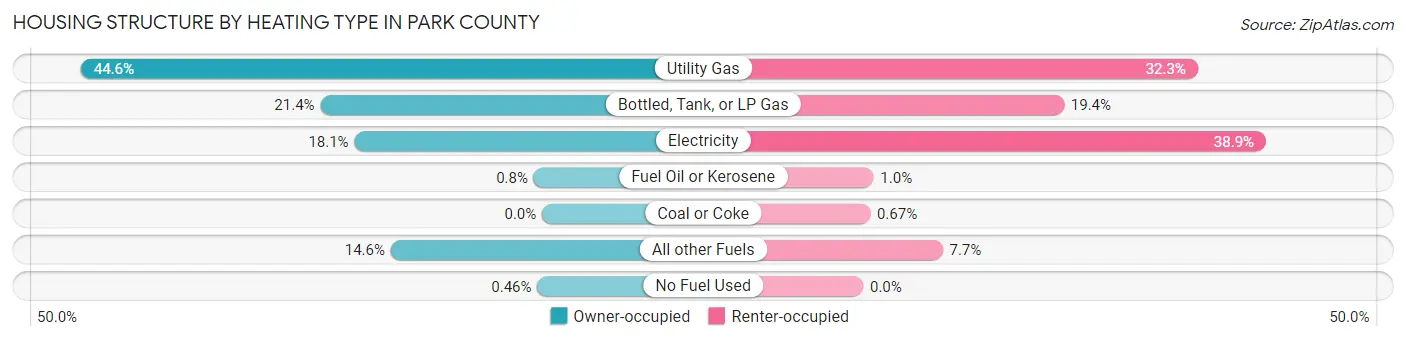
| Heating Type | Owner-occupied | Renter-occupied |
| Utility Gas | 2,522 (44.6%) | 775 (32.3%) |
| Bottled, Tank, or LP Gas | 1,212 (21.4%) | 465 (19.4%) |
| Electricity | 1,026 (18.1%) | 933 (38.9%) |
| Fuel Oil or Kerosene | 45 (0.8%) | 24 (1.0%) |
| Coal or Coke | 0 (0.0%) | 16 (0.7%) |
| All other Fuels | 827 (14.6%) | 184 (7.7%) |
| No Fuel Used | 26 (0.5%) | 0 (0.0%) |
| Total | 5,658 (100.0%) | 2,397 (100.0%) |
Household Vehicle Usage in Park County
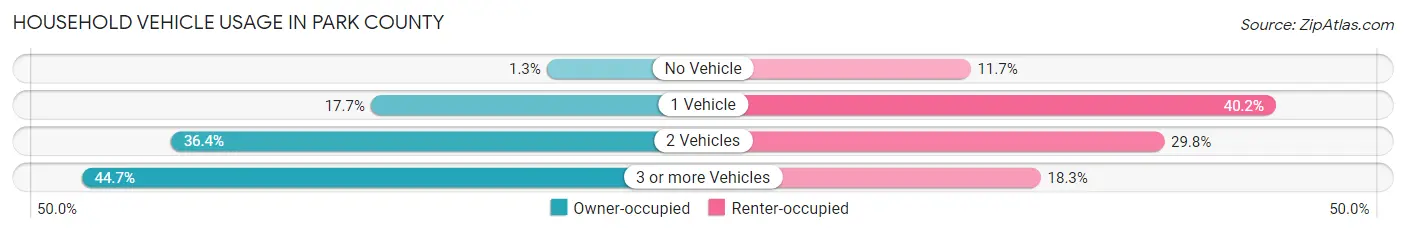
| Vehicles per Household | Owner-occupied | Renter-occupied |
| No Vehicle | 72 (1.3%) | 281 (11.7%) |
| 1 Vehicle | 1,001 (17.7%) | 964 (40.2%) |
| 2 Vehicles | 2,057 (36.4%) | 714 (29.8%) |
| 3 or more Vehicles | 2,528 (44.7%) | 438 (18.3%) |
| Total | 5,658 (100.0%) | 2,397 (100.0%) |
Real Estate & Mortgages in Park County
Real Estate and Mortgage Overview in Park County
| Characteristic | Without Mortgage | With Mortgage |
| Housing Units | 2,485 | 3,173 |
| Median Property Value | $393,700 | $404,200 |
| Median Household Income | $70,912 | $618 |
| Monthly Housing Costs | $548 | $218 |
| Real Estate Taxes | $2,446 | $84 |
Property Value by Mortgage Status in Park County
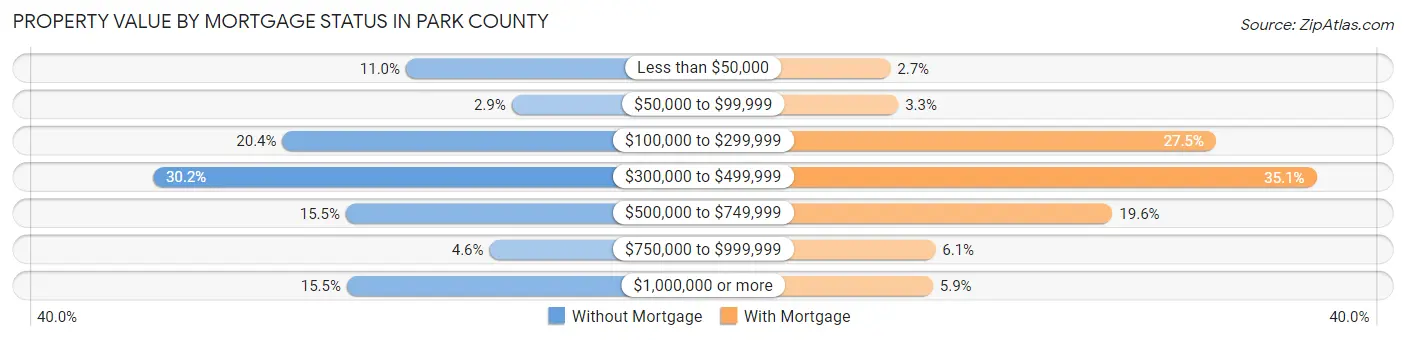
| Property Value | Without Mortgage | With Mortgage |
| Less than $50,000 | 272 (11.0%) | 84 (2.6%) |
| $50,000 to $99,999 | 72 (2.9%) | 103 (3.3%) |
| $100,000 to $299,999 | 506 (20.4%) | 871 (27.5%) |
| $300,000 to $499,999 | 751 (30.2%) | 1,114 (35.1%) |
| $500,000 to $749,999 | 386 (15.5%) | 621 (19.6%) |
| $750,000 to $999,999 | 114 (4.6%) | 193 (6.1%) |
| $1,000,000 or more | 384 (15.4%) | 187 (5.9%) |
| Total | 2,485 (100.0%) | 3,173 (100.0%) |
Household Income by Mortgage Status in Park County
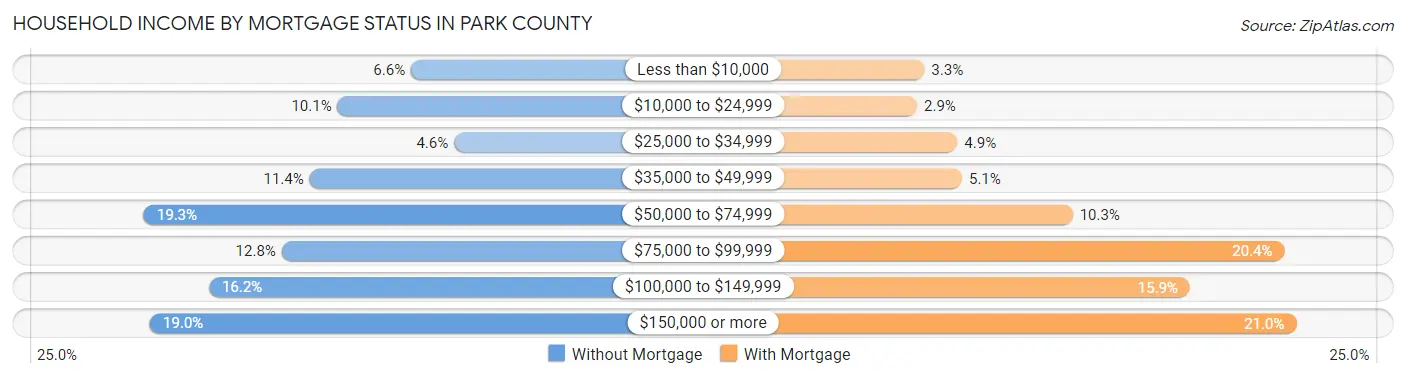
| Household Income | Without Mortgage | With Mortgage |
| Less than $10,000 | 164 (6.6%) | 104 (3.3%) |
| $10,000 to $24,999 | 251 (10.1%) | 93 (2.9%) |
| $25,000 to $34,999 | 113 (4.5%) | 154 (4.9%) |
| $35,000 to $49,999 | 284 (11.4%) | 161 (5.1%) |
| $50,000 to $74,999 | 480 (19.3%) | 328 (10.3%) |
| $75,000 to $99,999 | 317 (12.8%) | 648 (20.4%) |
| $100,000 to $149,999 | 403 (16.2%) | 505 (15.9%) |
| $150,000 or more | 473 (19.0%) | 666 (21.0%) |
| Total | 2,485 (100.0%) | 3,173 (100.0%) |
Property Value to Household Income Ratio in Park County
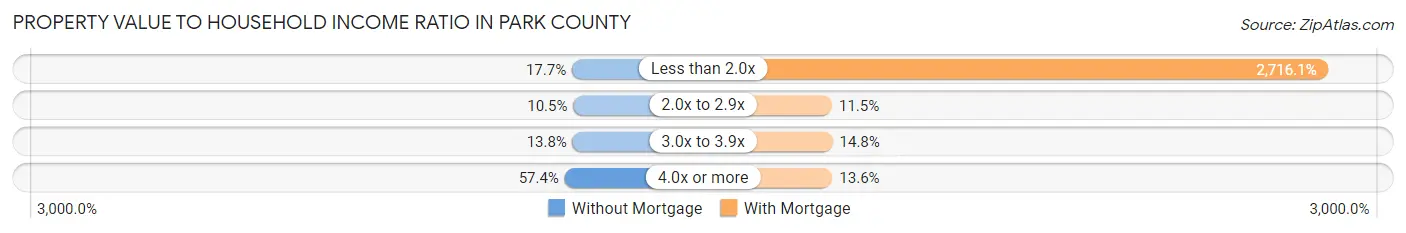
| Value-to-Income Ratio | Without Mortgage | With Mortgage |
| Less than 2.0x | 439 (17.7%) | 86,181 (2,716.1%) |
| 2.0x to 2.9x | 260 (10.5%) | 365 (11.5%) |
| 3.0x to 3.9x | 343 (13.8%) | 468 (14.7%) |
| 4.0x or more | 1,427 (57.4%) | 431 (13.6%) |
| Total | 2,485 (100.0%) | 3,173 (100.0%) |
Real Estate Taxes by Mortgage Status in Park County
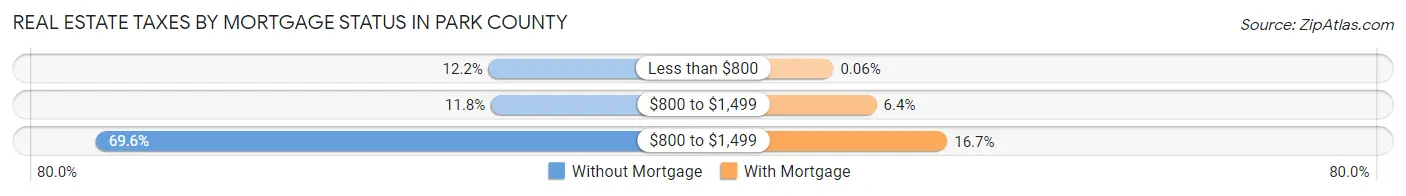
| Property Taxes | Without Mortgage | With Mortgage |
| Less than $800 | 303 (12.2%) | 2 (0.1%) |
| $800 to $1,499 | 294 (11.8%) | 202 (6.4%) |
| $800 to $1,499 | 1,729 (69.6%) | 530 (16.7%) |
| Total | 2,485 (100.0%) | 3,173 (100.0%) |
Health & Disability in Park County
Health Insurance Coverage by Age in Park County
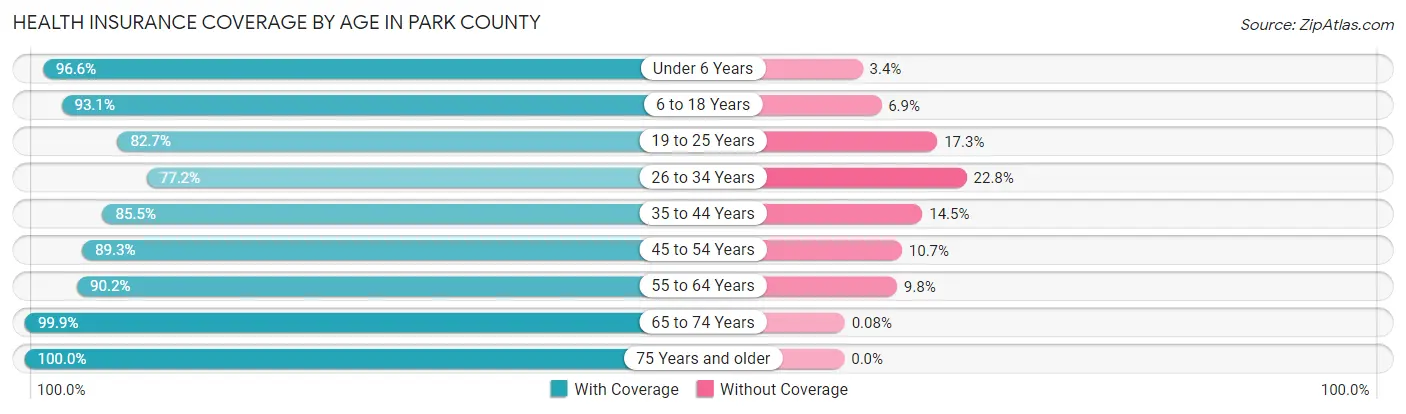
| Age Bracket | With Coverage | Without Coverage |
| Under 6 Years | 851 (96.6%) | 30 (3.4%) |
| 6 to 18 Years | 1,933 (93.1%) | 143 (6.9%) |
| 19 to 25 Years | 811 (82.7%) | 170 (17.3%) |
| 26 to 34 Years | 1,604 (77.2%) | 474 (22.8%) |
| 35 to 44 Years | 1,928 (85.5%) | 328 (14.5%) |
| 45 to 54 Years | 1,869 (89.3%) | 225 (10.7%) |
| 55 to 64 Years | 2,546 (90.2%) | 277 (9.8%) |
| 65 to 74 Years | 2,525 (99.9%) | 2 (0.1%) |
| 75 Years and older | 1,490 (100.0%) | 0 (0.0%) |
| Total | 15,557 (90.4%) | 1,649 (9.6%) |
Health Insurance Coverage by Citizenship Status in Park County
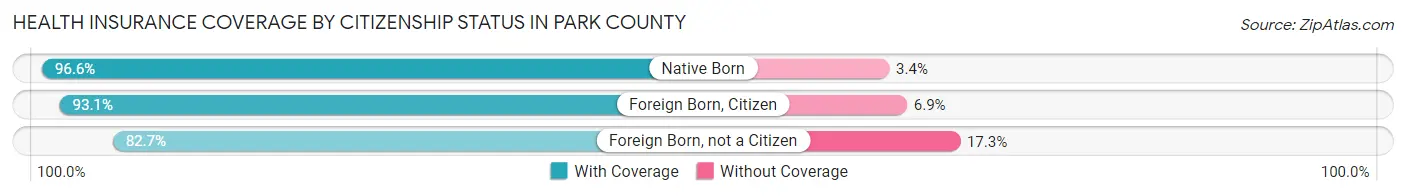
| Citizenship Status | With Coverage | Without Coverage |
| Native Born | 851 (96.6%) | 30 (3.4%) |
| Foreign Born, Citizen | 1,933 (93.1%) | 143 (6.9%) |
| Foreign Born, not a Citizen | 811 (82.7%) | 170 (17.3%) |
Health Insurance Coverage by Household Income in Park County
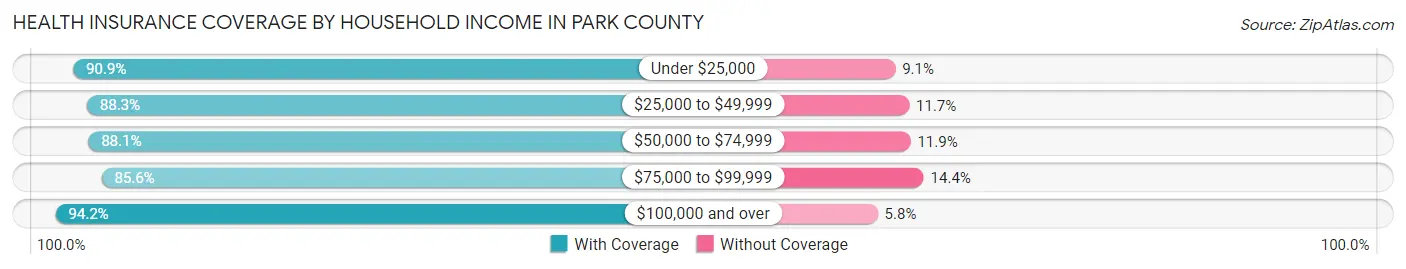
| Household Income | With Coverage | Without Coverage |
| Under $25,000 | 1,484 (90.9%) | 148 (9.1%) |
| $25,000 to $49,999 | 2,875 (88.3%) | 380 (11.7%) |
| $50,000 to $74,999 | 2,561 (88.1%) | 347 (11.9%) |
| $75,000 to $99,999 | 2,224 (85.6%) | 374 (14.4%) |
| $100,000 and over | 6,224 (94.2%) | 382 (5.8%) |
Public vs Private Health Insurance Coverage by Age in Park County
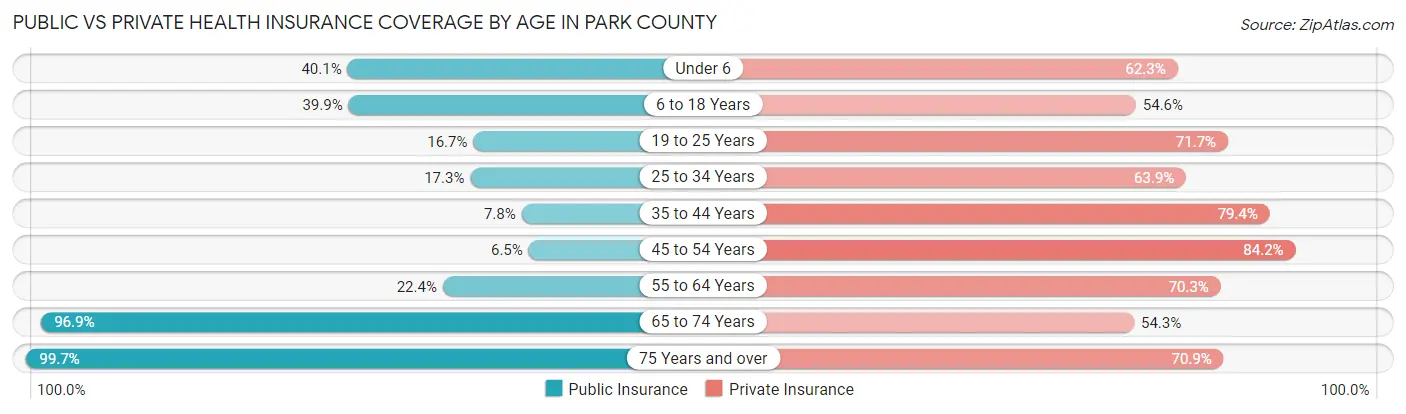
| Age Bracket | Public Insurance | Private Insurance |
| Under 6 | 353 (40.1%) | 549 (62.3%) |
| 6 to 18 Years | 828 (39.9%) | 1,133 (54.6%) |
| 19 to 25 Years | 164 (16.7%) | 703 (71.7%) |
| 25 to 34 Years | 359 (17.3%) | 1,328 (63.9%) |
| 35 to 44 Years | 175 (7.8%) | 1,792 (79.4%) |
| 45 to 54 Years | 135 (6.5%) | 1,763 (84.2%) |
| 55 to 64 Years | 632 (22.4%) | 1,985 (70.3%) |
| 65 to 74 Years | 2,449 (96.9%) | 1,371 (54.2%) |
| 75 Years and over | 1,485 (99.7%) | 1,056 (70.9%) |
| Total | 6,580 (38.2%) | 11,680 (67.9%) |
Disability Status by Sex by Age in Park County

| Age Bracket | Male | Female |
| Under 5 Years | 0 (0.0%) | 0 (0.0%) |
| 5 to 17 Years | 55 (4.7%) | 14 (1.4%) |
| 18 to 34 Years | 124 (7.8%) | 110 (7.1%) |
| 35 to 64 Years | 307 (8.6%) | 319 (8.9%) |
| 65 to 74 Years | 282 (21.8%) | 189 (15.3%) |
| 75 Years and over | 298 (44.4%) | 283 (34.6%) |
Disability Class by Sex by Age in Park County
Disability Class: Hearing Difficulty
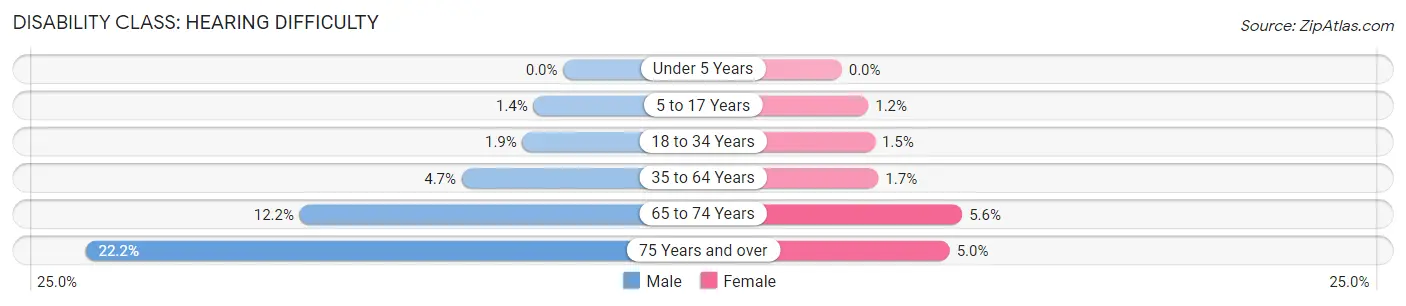
| Age Bracket | Male | Female |
| Under 5 Years | 0 (0.0%) | 0 (0.0%) |
| 5 to 17 Years | 16 (1.4%) | 12 (1.2%) |
| 18 to 34 Years | 30 (1.9%) | 24 (1.5%) |
| 35 to 64 Years | 169 (4.7%) | 61 (1.7%) |
| 65 to 74 Years | 158 (12.2%) | 69 (5.6%) |
| 75 Years and over | 149 (22.2%) | 41 (5.0%) |
Disability Class: Vision Difficulty
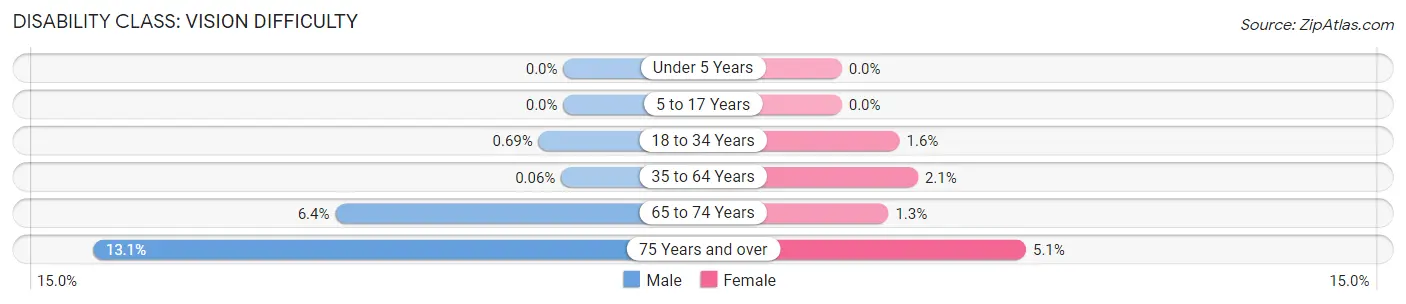
| Age Bracket | Male | Female |
| Under 5 Years | 0 (0.0%) | 0 (0.0%) |
| 5 to 17 Years | 0 (0.0%) | 0 (0.0%) |
| 18 to 34 Years | 11 (0.7%) | 25 (1.6%) |
| 35 to 64 Years | 2 (0.1%) | 76 (2.1%) |
| 65 to 74 Years | 82 (6.4%) | 16 (1.3%) |
| 75 Years and over | 88 (13.1%) | 42 (5.1%) |
Disability Class: Cognitive Difficulty
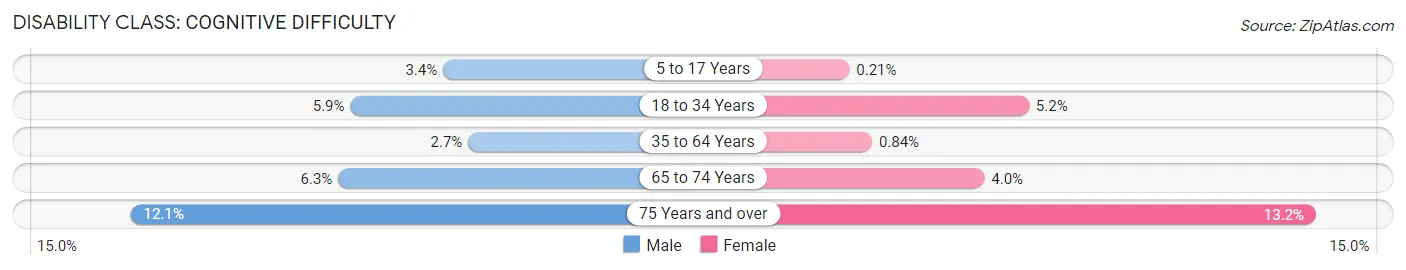
| Age Bracket | Male | Female |
| 5 to 17 Years | 39 (3.4%) | 2 (0.2%) |
| 18 to 34 Years | 94 (5.9%) | 81 (5.2%) |
| 35 to 64 Years | 95 (2.6%) | 30 (0.8%) |
| 65 to 74 Years | 81 (6.3%) | 49 (4.0%) |
| 75 Years and over | 81 (12.0%) | 108 (13.2%) |
Disability Class: Ambulatory Difficulty
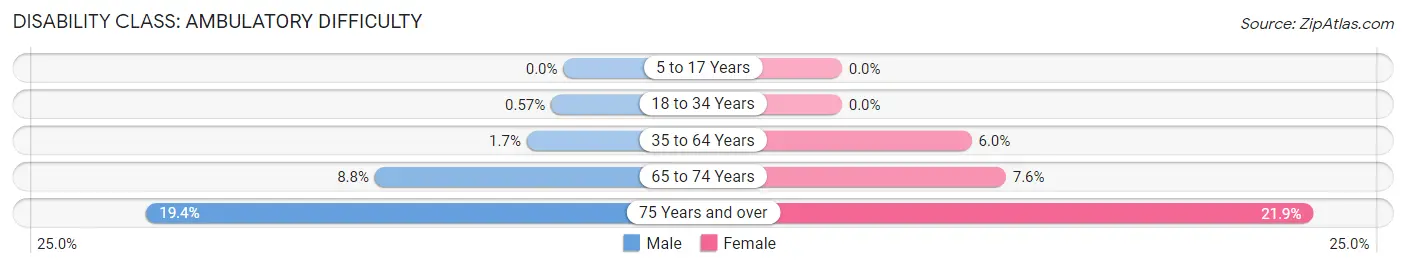
| Age Bracket | Male | Female |
| 5 to 17 Years | 0 (0.0%) | 0 (0.0%) |
| 18 to 34 Years | 9 (0.6%) | 0 (0.0%) |
| 35 to 64 Years | 61 (1.7%) | 216 (6.0%) |
| 65 to 74 Years | 113 (8.7%) | 94 (7.6%) |
| 75 Years and over | 130 (19.4%) | 179 (21.9%) |
Disability Class: Self-Care Difficulty
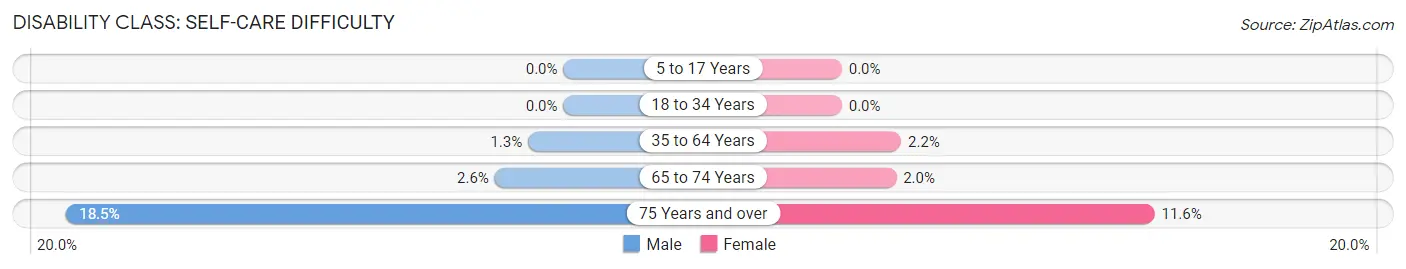
| Age Bracket | Male | Female |
| 5 to 17 Years | 0 (0.0%) | 0 (0.0%) |
| 18 to 34 Years | 0 (0.0%) | 0 (0.0%) |
| 35 to 64 Years | 47 (1.3%) | 79 (2.2%) |
| 65 to 74 Years | 33 (2.5%) | 25 (2.0%) |
| 75 Years and over | 124 (18.4%) | 95 (11.6%) |
Technology Access in Park County
Computing Device Access in Park County
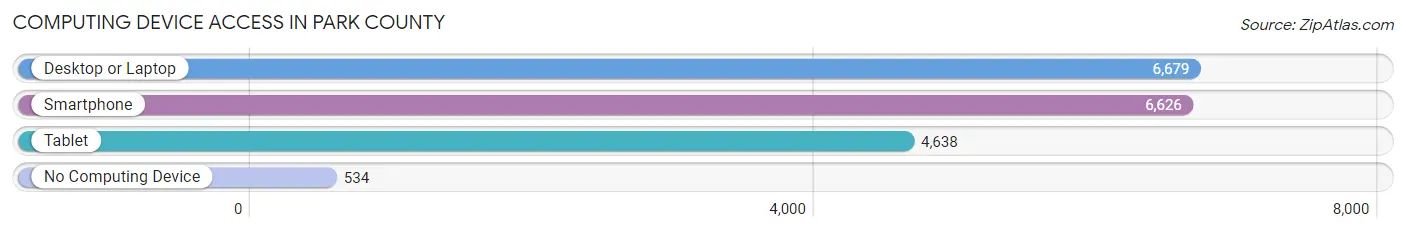
| Device Type | # Households | % Households |
| Desktop or Laptop | 6,679 | 82.9% |
| Smartphone | 6,626 | 82.3% |
| Tablet | 4,638 | 57.6% |
| No Computing Device | 534 | 6.6% |
| Total | 8,055 | 100.0% |
Internet Access in Park County
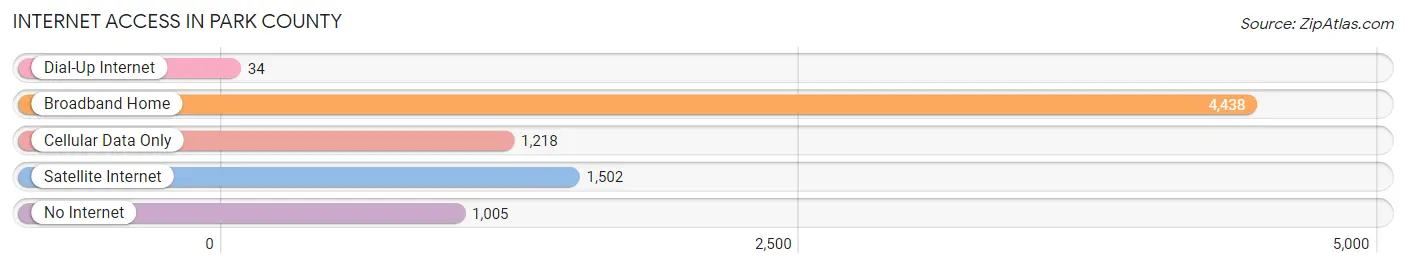
| Internet Type | # Households | % Households |
| Dial-Up Internet | 34 | 0.4% |
| Broadband Home | 4,438 | 55.1% |
| Cellular Data Only | 1,218 | 15.1% |
| Satellite Internet | 1,502 | 18.6% |
| No Internet | 1,005 | 12.5% |
| Total | 8,055 | 100.0% |
Park County Summary
Park County is located in the south-central region of Montana, and is bordered by the states of Wyoming and South Dakota. It is the fourth largest county in the state, with an area of 5,717 square miles. Park County is home to the city of Livingston, the county seat, as well as the towns of Clyde Park, Emigrant, Gardiner, and Pray.
History
Park County was established in 1887, and was named after the Yellowstone National Park, which is located in the county. The county was originally part of Gallatin County, and was created to provide better access to the park. The first settlers in the area were miners, who were attracted to the area by the gold and silver deposits in the area.
The county was also home to the Crow Nation, who had lived in the area for centuries before the arrival of the Europeans. The Crow Nation was forced to cede much of their land to the United States government in the late 19th century, and the area was opened up to settlement.
Geography
Park County is located in the south-central region of Montana, and is bordered by the states of Wyoming and South Dakota. It is the fourth largest county in the state, with an area of 5,717 square miles. The county is located in the Rocky Mountains, and is home to the Absaroka-Beartooth Wilderness, which is part of the Greater Yellowstone Ecosystem. The county is also home to the Yellowstone River, which flows through the county from north to south.
The county is home to several mountain ranges, including the Absaroka Range, the Beartooth Mountains, the Crazy Mountains, and the Gallatin Range. The county is also home to several lakes, including Hebgen Lake, Quake Lake, and Yellowstone Lake.
Economy
Park County is largely rural, and the economy is largely based on agriculture and tourism. The county is home to several large ranches, and the agricultural sector is the largest employer in the county. The county is also home to several tourist attractions, including the Yellowstone National Park, the Beartooth Highway, and the Crazy Mountains.
The county is also home to several mining operations, including gold, silver, and coal. The county is also home to several oil and gas operations, and the energy sector is a major contributor to the economy.
Demographics
As of the 2010 census, Park County had a population of 16,741. The population is largely white, with a small Native American population. The median household income in the county is $45,845, and the median home value is $212,400. The county has a poverty rate of 13.3%, and the unemployment rate is 4.2%.
Conclusion
Park County is a large, rural county located in the south-central region of Montana. The county is home to the Yellowstone National Park, and is largely dependent on agriculture and tourism for its economy. The population is largely white, with a small Native American population. The median household income in the county is $45,845, and the median home value is $212,400. The county has a poverty rate of 13.3%, and the unemployment rate is 4.2%.
Common Questions
What is Per Capita Income in Park County?
Per Capita income in Park County is $44,273.
What is the Median Family Income in Park County?
Median Family Income in Park County is $90,483.
What is the Median Household income in Park County?
Median Household Income in Park County is $67,602.
What is Income or Wage Gap in Park County?
Income or Wage Gap in Park County is 31.6%.
Women in Park County earn 68.4 cents for every dollar earned by a man.
What is Inequality or Gini Index in Park County?
Inequality or Gini Index in Park County is 0.47.
What is the Total Population of Park County?
Total Population of Park County is 17,320.
What is the Total Male Population of Park County?
Total Male Population of Park County is 8,723.
What is the Total Female Population of Park County?
Total Female Population of Park County is 8,597.
What is the Ratio of Males per 100 Females in Park County?
There are 101.47 Males per 100 Females in Park County.
What is the Ratio of Females per 100 Males in Park County?
There are 98.56 Females per 100 Males in Park County.
What is the Median Population Age in Park County?
Median Population Age in Park County is 46.2 Years.
What is the Average Family Size in Park County
Average Family Size in Park County is 2.6 People.
What is the Average Household Size in Park County
Average Household Size in Park County is 2.1 People.
How Large is the Labor Force in Park County?
There are 9,399 People in the Labor Forcein in Park County.
What is the Percentage of People in the Labor Force in Park County?
63.2% of People are in the Labor Force in Park County.
What is the Unemployment Rate in Park County?
Unemployment Rate in Park County is 3.3%.