Orchard Homes, MT Map & Demographics
Orchard Homes Map
Orchard Homes Overview
$42,427
PER CAPITA INCOME
$114,602
AVG FAMILY INCOME
$78,108
AVG HOUSEHOLD INCOME
26.2%
WAGE / INCOME GAP [ % ]
73.8¢/ $1
WAGE / INCOME GAP [ $ ]
0.44
INEQUALITY / GINI INDEX
5,265
TOTAL POPULATION
2,766
MALE POPULATION
2,499
FEMALE POPULATION
110.68
MALES / 100 FEMALES
90.35
FEMALES / 100 MALES
44.2
MEDIAN AGE
2.8
AVG FAMILY SIZE
2.3
AVG HOUSEHOLD SIZE
2,815
LABOR FORCE [ PEOPLE ]
62.8%
PERCENT IN LABOR FORCE
5.9%
UNEMPLOYMENT RATE
Income in Orchard Homes
Income Overview in Orchard Homes
Per Capita Income in Orchard Homes is $42,427, while median incomes of families and households are $114,602 and $78,108 respectively.
| Characteristic | Number | Measure |
| Per Capita Income | 5,265 | $42,427 |
| Median Family Income | 1,510 | $114,602 |
| Mean Family Income | 1,510 | $123,920 |
| Median Household Income | 2,282 | $78,108 |
| Mean Household Income | 2,282 | $97,075 |
| Income Deficit | 1,510 | $0 |
| Wage / Income Gap (%) | 5,265 | 26.22% |
| Wage / Income Gap ($) | 5,265 | 73.78¢ per $1 |
| Gini / Inequality Index | 5,265 | 0.44 |
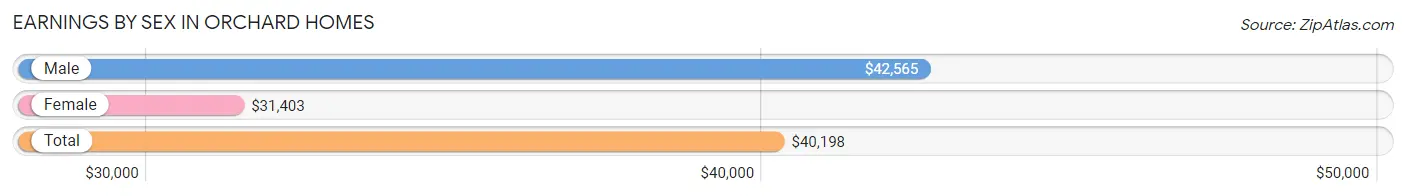
Earnings by Sex in Orchard Homes
Average Earnings in Orchard Homes are $40,198, $42,565 for men and $31,403 for women, a difference of 26.2%.
| Sex | Number | Average Earnings |
| Male | 1,679 (54.4%) | $42,565 |
| Female | 1,407 (45.6%) | $31,403 |
| Total | 3,086 (100.0%) | $40,198 |
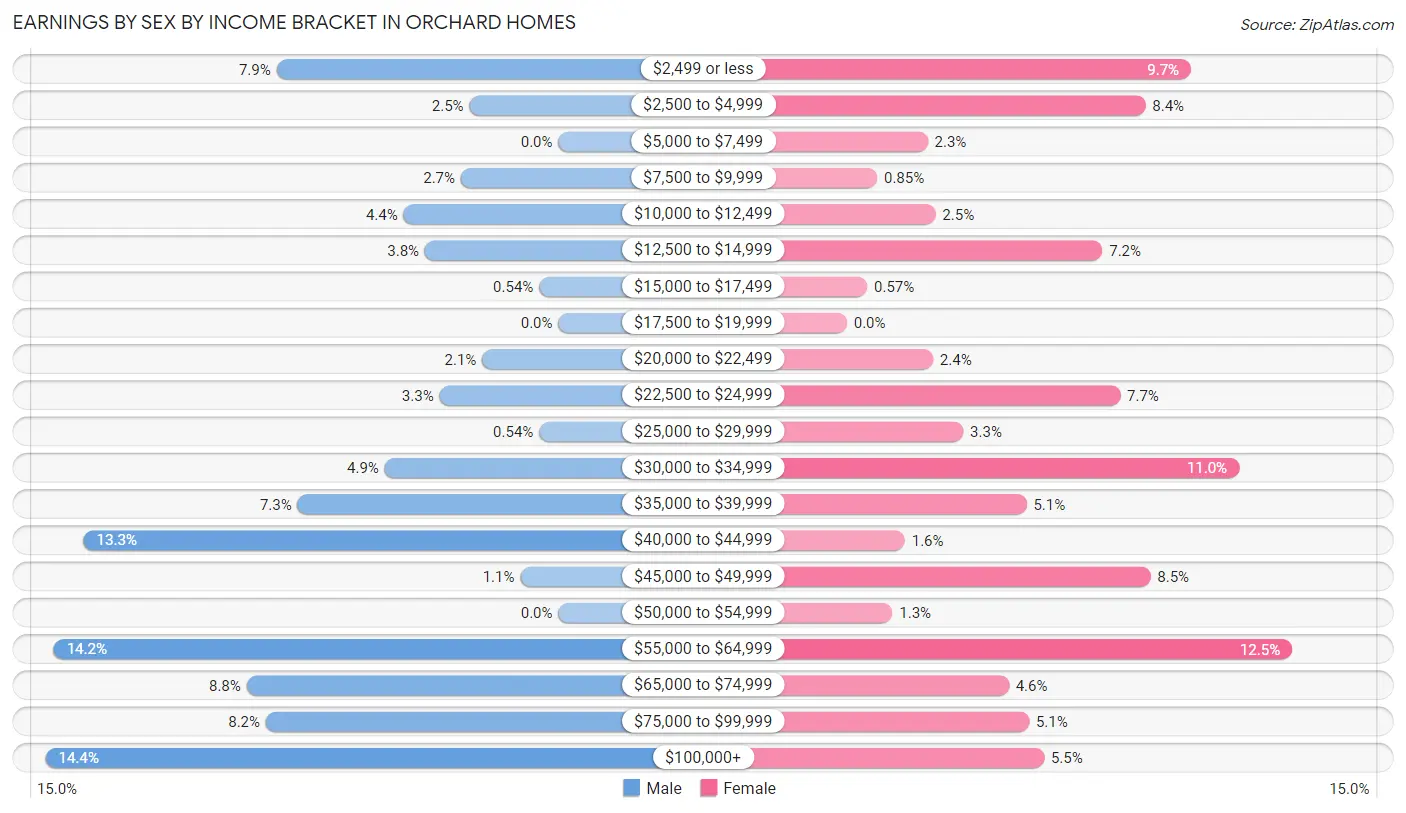
Earnings by Sex by Income Bracket in Orchard Homes
The most common earnings brackets in Orchard Homes are $100,000+ for men (242 | 14.4%) and $55,000 to $64,999 for women (176 | 12.5%).
| Income | Male | Female |
| $2,499 or less | 133 (7.9%) | 136 (9.7%) |
| $2,500 to $4,999 | 42 (2.5%) | 118 (8.4%) |
| $5,000 to $7,499 | 0 (0.0%) | 32 (2.3%) |
| $7,500 to $9,999 | 46 (2.7%) | 12 (0.9%) |
| $10,000 to $12,499 | 73 (4.3%) | 35 (2.5%) |
| $12,500 to $14,999 | 63 (3.7%) | 101 (7.2%) |
| $15,000 to $17,499 | 9 (0.5%) | 8 (0.6%) |
| $17,500 to $19,999 | 0 (0.0%) | 0 (0.0%) |
| $20,000 to $22,499 | 36 (2.1%) | 34 (2.4%) |
| $22,500 to $24,999 | 56 (3.3%) | 108 (7.7%) |
| $25,000 to $29,999 | 9 (0.5%) | 46 (3.3%) |
| $30,000 to $34,999 | 82 (4.9%) | 155 (11.0%) |
| $35,000 to $39,999 | 123 (7.3%) | 71 (5.1%) |
| $40,000 to $44,999 | 224 (13.3%) | 23 (1.6%) |
| $45,000 to $49,999 | 18 (1.1%) | 120 (8.5%) |
| $50,000 to $54,999 | 0 (0.0%) | 18 (1.3%) |
| $55,000 to $64,999 | 238 (14.2%) | 176 (12.5%) |
| $65,000 to $74,999 | 147 (8.8%) | 64 (4.5%) |
| $75,000 to $99,999 | 138 (8.2%) | 72 (5.1%) |
| $100,000+ | 242 (14.4%) | 78 (5.5%) |
| Total | 1,679 (100.0%) | 1,407 (100.0%) |
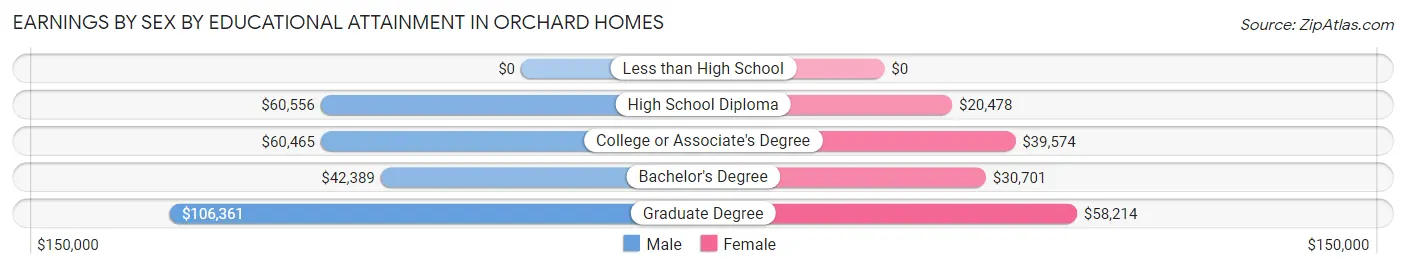
Earnings by Sex by Educational Attainment in Orchard Homes
Average earnings in Orchard Homes are $55,820 for men and $38,063 for women, a difference of 31.8%. Men with an educational attainment of graduate degree enjoy the highest average annual earnings of $106,361, while those with bachelor's degree education earn the least with $42,389. Women with an educational attainment of graduate degree earn the most with the average annual earnings of $58,214, while those with high school diploma education have the smallest earnings of $20,478.
| Educational Attainment | Male Income | Female Income |
| Less than High School | - | - |
| High School Diploma | $60,556 | $20,478 |
| College or Associate's Degree | $60,465 | $39,574 |
| Bachelor's Degree | $42,389 | $30,701 |
| Graduate Degree | $106,361 | $58,214 |
| Total | $55,820 | $38,063 |
Family Income in Orchard Homes
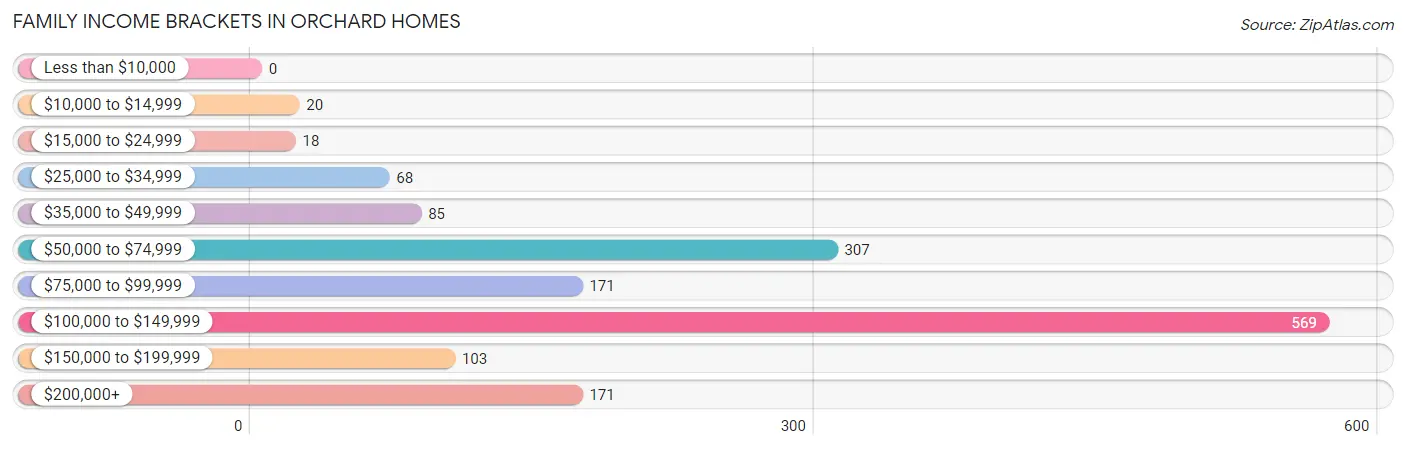
Family Income Brackets in Orchard Homes
According to the Orchard Homes family income data, there are 569 families falling into the $100,000 to $149,999 income range, which is the most common income bracket and makes up 37.7% of all families.
| Income Bracket | # Families | % Families |
| Less than $10,000 | 0 | 0.0% |
| $10,000 to $14,999 | 20 | 1.3% |
| $15,000 to $24,999 | 18 | 1.2% |
| $25,000 to $34,999 | 68 | 4.5% |
| $35,000 to $49,999 | 85 | 5.6% |
| $50,000 to $74,999 | 307 | 20.3% |
| $75,000 to $99,999 | 171 | 11.3% |
| $100,000 to $149,999 | 569 | 37.7% |
| $150,000 to $199,999 | 103 | 6.8% |
| $200,000+ | 171 | 11.3% |
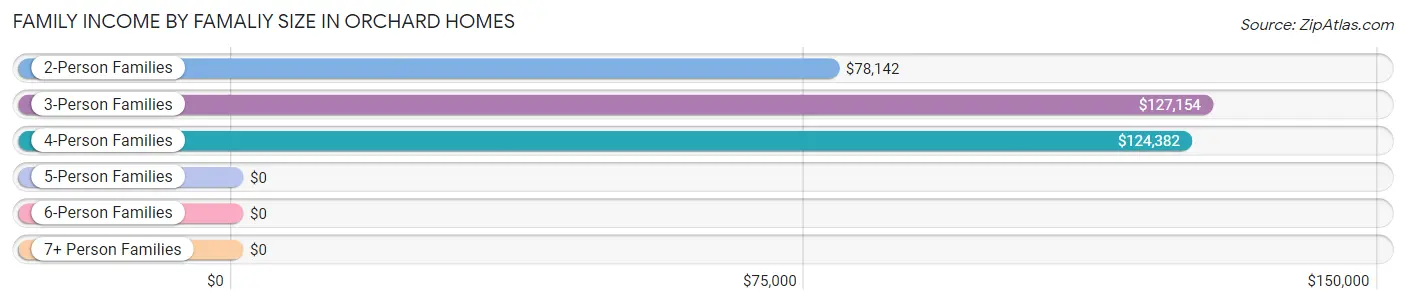
Family Income by Famaliy Size in Orchard Homes
3-person families (361 | 23.9%) account for the highest median family income in Orchard Homes with $127,154 per family, while 3-person families (361 | 23.9%) have the highest median income of $42,385 per family member.
| Income Bracket | # Families | Median Income |
| 2-Person Families | 837 (55.4%) | $78,142 |
| 3-Person Families | 361 (23.9%) | $127,154 |
| 4-Person Families | 249 (16.5%) | $124,382 |
| 5-Person Families | 29 (1.9%) | $0 |
| 6-Person Families | 29 (1.9%) | $0 |
| 7+ Person Families | 5 (0.3%) | $0 |
| Total | 1,510 (100.0%) | $114,602 |
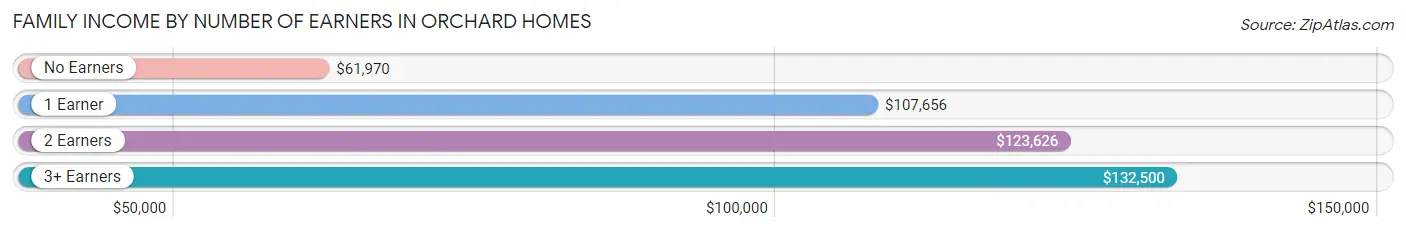
Family Income by Number of Earners in Orchard Homes
The median family income in Orchard Homes is $114,602, with families comprising 3+ earners (122) having the highest median family income of $132,500, while families with no earners (330) have the lowest median family income of $61,970, accounting for 8.1% and 21.8% of families, respectively.
| Number of Earners | # Families | Median Income |
| No Earners | 330 (21.8%) | $61,970 |
| 1 Earner | 318 (21.1%) | $107,656 |
| 2 Earners | 740 (49.0%) | $123,626 |
| 3+ Earners | 122 (8.1%) | $132,500 |
| Total | 1,510 (100.0%) | $114,602 |
Household Income in Orchard Homes
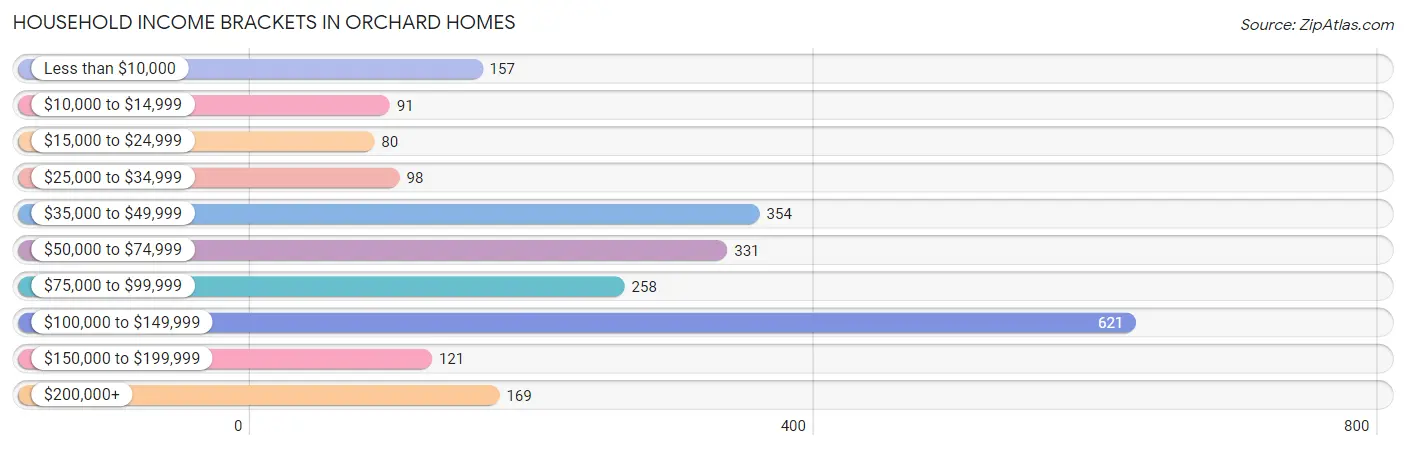
Household Income Brackets in Orchard Homes
With 621 households falling in the category, the $100,000 to $149,999 income range is the most frequent in Orchard Homes, accounting for 27.2% of all households. In contrast, only 80 households (3.5%) fall into the $15,000 to $24,999 income bracket, making it the least populous group.
| Income Bracket | # Households | % Households |
| Less than $10,000 | 157 | 6.9% |
| $10,000 to $14,999 | 91 | 4.0% |
| $15,000 to $24,999 | 80 | 3.5% |
| $25,000 to $34,999 | 98 | 4.3% |
| $35,000 to $49,999 | 354 | 15.5% |
| $50,000 to $74,999 | 331 | 14.5% |
| $75,000 to $99,999 | 258 | 11.3% |
| $100,000 to $149,999 | 621 | 27.2% |
| $150,000 to $199,999 | 121 | 5.3% |
| $200,000+ | 169 | 7.4% |
Household Income by Householder Age in Orchard Homes
The median household income in Orchard Homes is $78,108, with the highest median household income of $123,438 found in the 45 to 64 years age bracket for the primary householder. A total of 722 households (31.6%) fall into this category. Meanwhile, the 15 to 24 years age bracket for the primary householder has the lowest median household income of $0, with 77 households (3.4%) in this group.
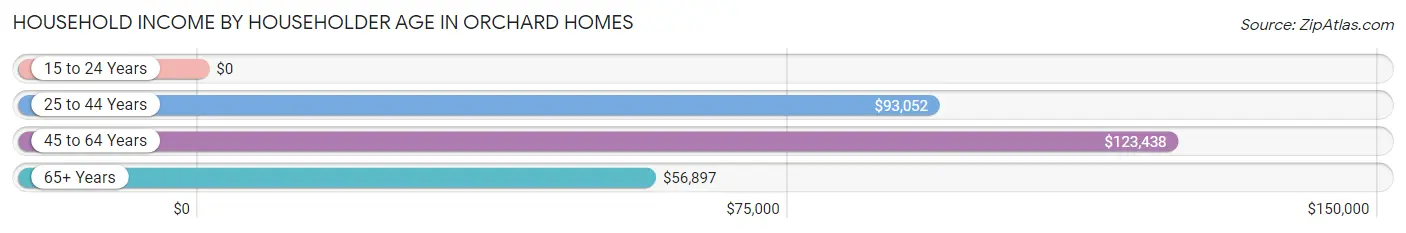
| Income Bracket | # Households | Median Income |
| 15 to 24 Years | 77 (3.4%) | $0 |
| 25 to 44 Years | 675 (29.6%) | $93,052 |
| 45 to 64 Years | 722 (31.6%) | $123,438 |
| 65+ Years | 808 (35.4%) | $56,897 |
| Total | 2,282 (100.0%) | $78,108 |
Poverty in Orchard Homes
Income Below Poverty by Sex and Age in Orchard Homes
With 2.2% poverty level for males and 10.0% for females among the residents of Orchard Homes, 35 to 44 year old males and 75 year old and over females are the most vulnerable to poverty, with 61 males (10.9%) and 56 females (20.7%) in their respective age groups living below the poverty level.
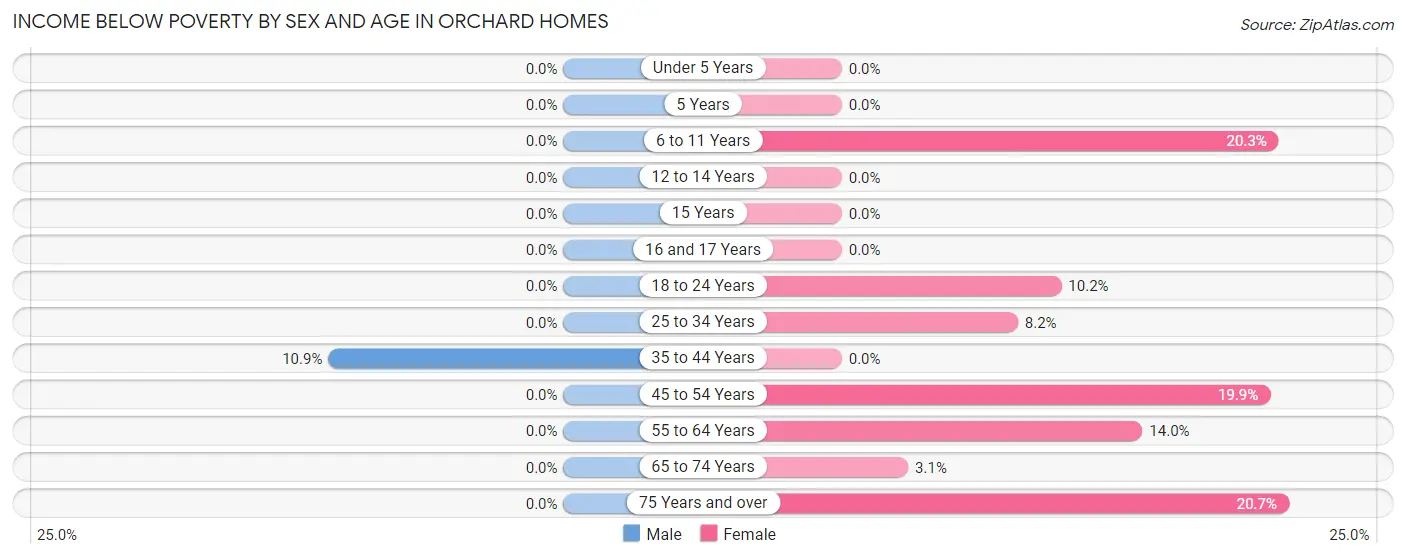
| Age Bracket | Male | Female |
| Under 5 Years | 0 (0.0%) | 0 (0.0%) |
| 5 Years | 0 (0.0%) | 0 (0.0%) |
| 6 to 11 Years | 0 (0.0%) | 15 (20.3%) |
| 12 to 14 Years | 0 (0.0%) | 0 (0.0%) |
| 15 Years | 0 (0.0%) | 0 (0.0%) |
| 16 and 17 Years | 0 (0.0%) | 0 (0.0%) |
| 18 to 24 Years | 0 (0.0%) | 22 (10.2%) |
| 25 to 34 Years | 0 (0.0%) | 25 (8.2%) |
| 35 to 44 Years | 61 (10.9%) | 0 (0.0%) |
| 45 to 54 Years | 0 (0.0%) | 60 (19.9%) |
| 55 to 64 Years | 0 (0.0%) | 60 (14.0%) |
| 65 to 74 Years | 0 (0.0%) | 10 (3.1%) |
| 75 Years and over | 0 (0.0%) | 56 (20.7%) |
| Total | 61 (2.2%) | 248 (10.0%) |
Income Above Poverty by Sex and Age in Orchard Homes
According to the poverty statistics in Orchard Homes, males aged under 5 years and females aged under 5 years are the age groups that are most secure financially, with 100.0% of males and 100.0% of females in these age groups living above the poverty line.
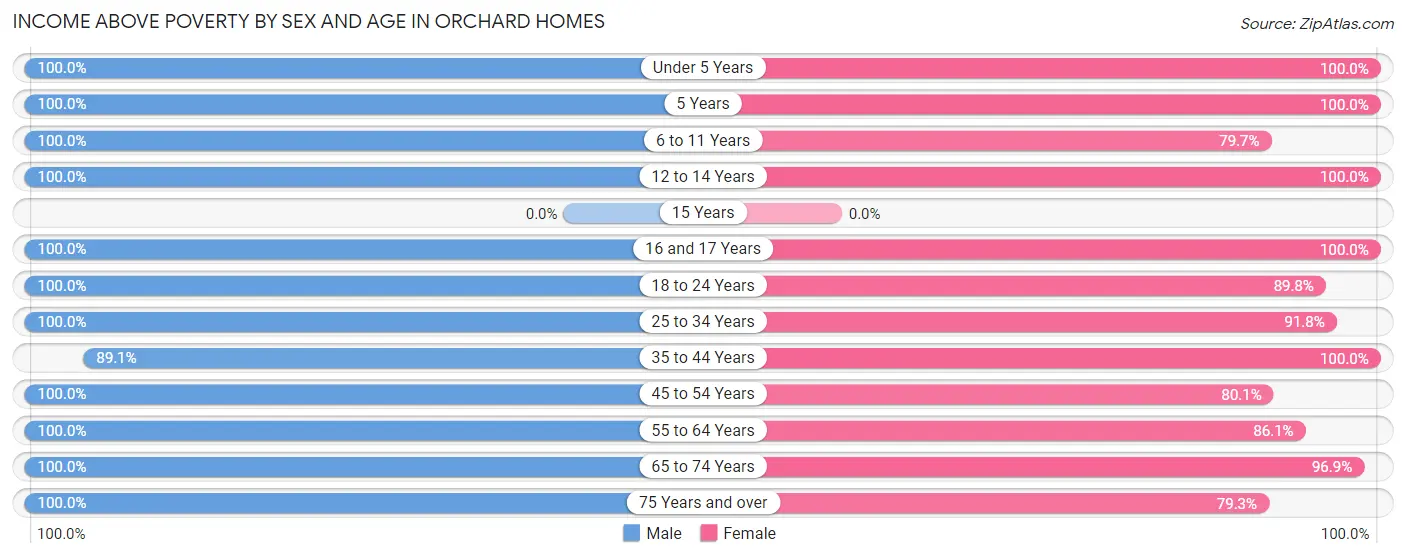
| Age Bracket | Male | Female |
| Under 5 Years | 235 (100.0%) | 132 (100.0%) |
| 5 Years | 15 (100.0%) | 73 (100.0%) |
| 6 to 11 Years | 138 (100.0%) | 59 (79.7%) |
| 12 to 14 Years | 82 (100.0%) | 32 (100.0%) |
| 15 Years | 0 (0.0%) | 0 (0.0%) |
| 16 and 17 Years | 49 (100.0%) | 47 (100.0%) |
| 18 to 24 Years | 139 (100.0%) | 194 (89.8%) |
| 25 to 34 Years | 284 (100.0%) | 281 (91.8%) |
| 35 to 44 Years | 498 (89.1%) | 282 (100.0%) |
| 45 to 54 Years | 284 (100.0%) | 242 (80.1%) |
| 55 to 64 Years | 322 (100.0%) | 370 (86.1%) |
| 65 to 74 Years | 331 (100.0%) | 315 (96.9%) |
| 75 Years and over | 328 (100.0%) | 214 (79.3%) |
| Total | 2,705 (97.8%) | 2,241 (90.0%) |
Income Below Poverty Among Married-Couple Families in Orchard Homes
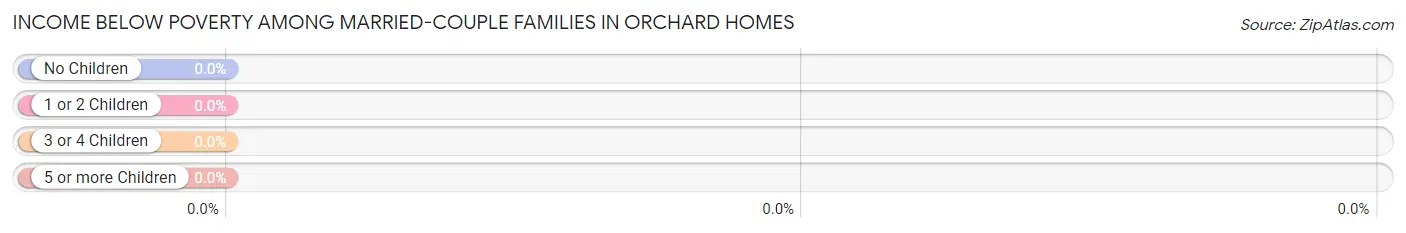
| Children | Above Poverty | Below Poverty |
| No Children | 828 (100.0%) | 0 (0.0%) |
| 1 or 2 Children | 413 (100.0%) | 0 (0.0%) |
| 3 or 4 Children | 46 (100.0%) | 0 (0.0%) |
| 5 or more Children | 0 (0.0%) | 0 (0.0%) |
| Total | 1,287 (100.0%) | 0 (0.0%) |
Income Below Poverty Among Single-Parent Households in Orchard Homes
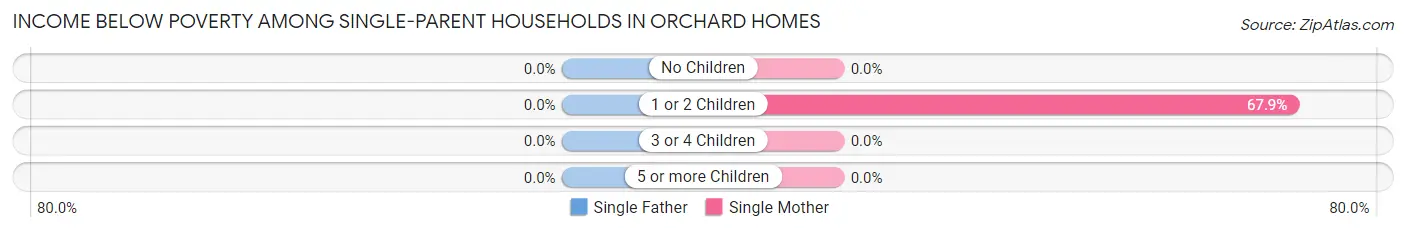
| Children | Single Father | Single Mother |
| No Children | 0 (0.0%) | 0 (0.0%) |
| 1 or 2 Children | 0 (0.0%) | 19 (67.9%) |
| 3 or 4 Children | 0 (0.0%) | 0 (0.0%) |
| 5 or more Children | 0 (0.0%) | 0 (0.0%) |
| Total | 0 (0.0%) | 19 (23.5%) |
Income Below Poverty Among Married-Couple vs Single-Parent Households in Orchard Homes
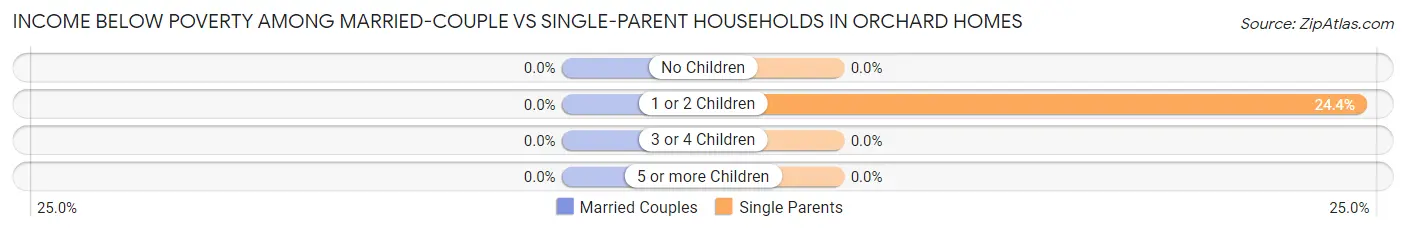
| Children | Married-Couple Families | Single-Parent Households |
| No Children | 0 (0.0%) | 0 (0.0%) |
| 1 or 2 Children | 0 (0.0%) | 19 (24.4%) |
| 3 or 4 Children | 0 (0.0%) | 0 (0.0%) |
| 5 or more Children | 0 (0.0%) | 0 (0.0%) |
| Total | 0 (0.0%) | 19 (8.5%) |
Race in Orchard Homes
The most populous races in Orchard Homes are White / Caucasian (4,748 | 90.2%), Asian (266 | 5.1%), and Two or more Races (197 | 3.7%).
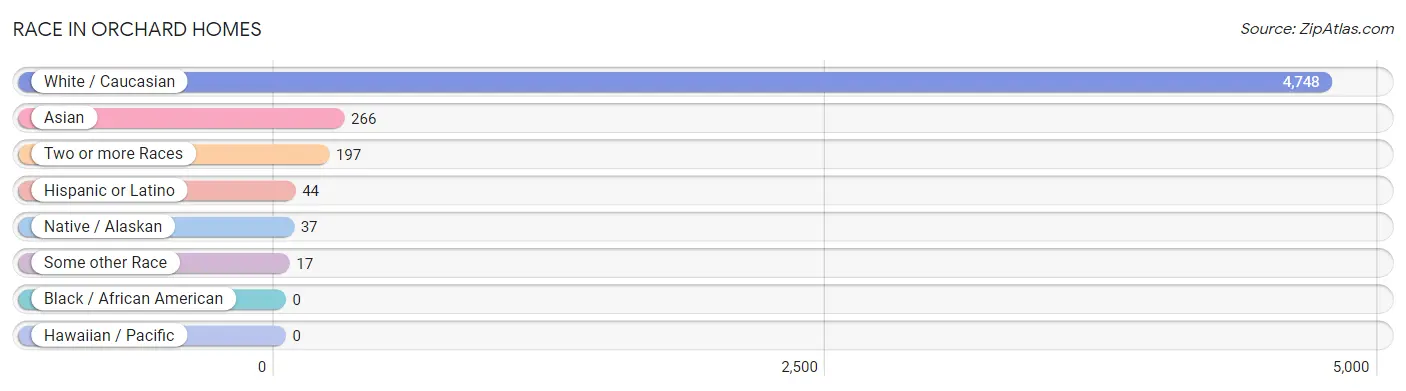
| Race | # Population | % Population |
| Asian | 266 | 5.1% |
| Black / African American | 0 | 0.0% |
| Hawaiian / Pacific | 0 | 0.0% |
| Hispanic or Latino | 44 | 0.8% |
| Native / Alaskan | 37 | 0.7% |
| White / Caucasian | 4,748 | 90.2% |
| Two or more Races | 197 | 3.7% |
| Some other Race | 17 | 0.3% |
| Total | 5,265 | 100.0% |
Ancestry in Orchard Homes
The most populous ancestries reported in Orchard Homes are German (868 | 16.5%), English (651 | 12.4%), Irish (505 | 9.6%), Swedish (244 | 4.6%), and Norwegian (241 | 4.6%), together accounting for 47.6% of all Orchard Homes residents.
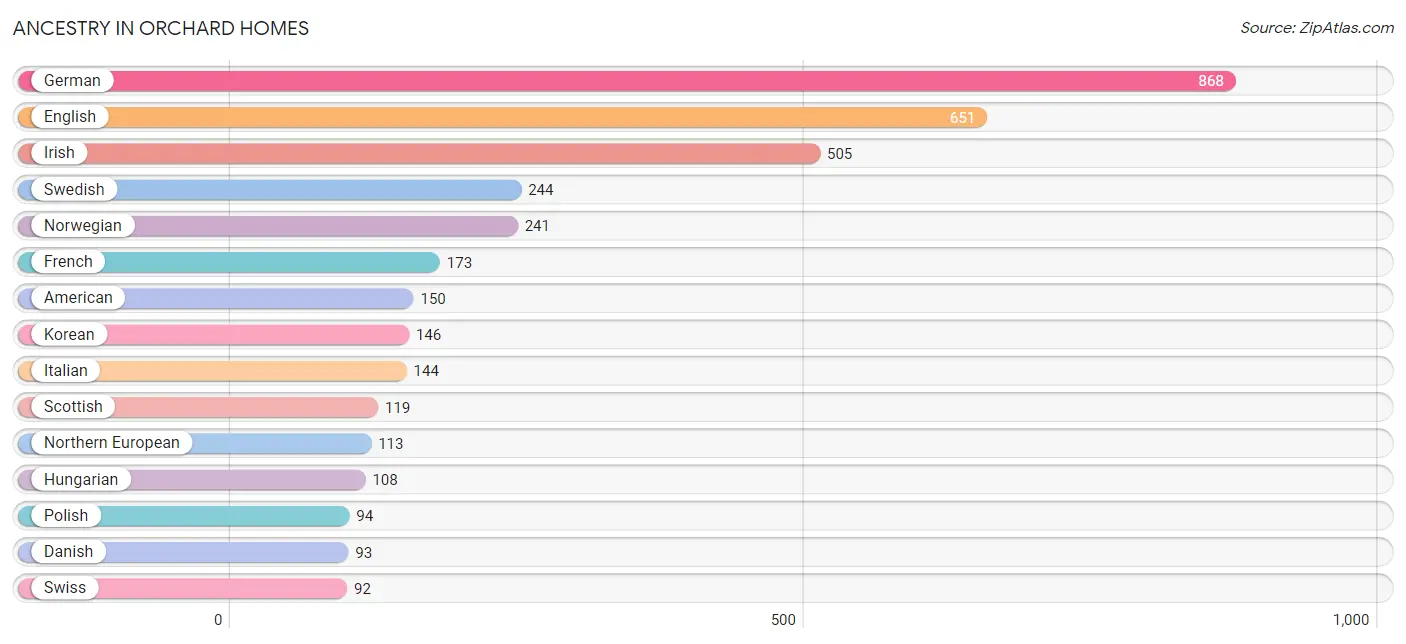
| Ancestry | # Population | % Population |
| American | 150 | 2.9% |
| Austrian | 38 | 0.7% |
| Bangladeshi | 59 | 1.1% |
| British | 13 | 0.3% |
| Burmese | 73 | 1.4% |
| Cherokee | 33 | 0.6% |
| Czech | 14 | 0.3% |
| Danish | 93 | 1.8% |
| Dutch | 39 | 0.7% |
| English | 651 | 12.4% |
| European | 59 | 1.1% |
| Finnish | 41 | 0.8% |
| French | 173 | 3.3% |
| French Canadian | 75 | 1.4% |
| German | 868 | 16.5% |
| Houma | 7 | 0.1% |
| Hungarian | 108 | 2.1% |
| Indian (Asian) | 55 | 1.0% |
| Irish | 505 | 9.6% |
| Italian | 144 | 2.7% |
| Korean | 146 | 2.8% |
| Malaysian | 59 | 1.1% |
| Mexican | 11 | 0.2% |
| Northern European | 113 | 2.1% |
| Norwegian | 241 | 4.6% |
| Polish | 94 | 1.8% |
| Portuguese | 12 | 0.2% |
| Russian | 34 | 0.6% |
| Scandinavian | 42 | 0.8% |
| Scottish | 119 | 2.3% |
| Serbian | 17 | 0.3% |
| Sioux | 13 | 0.3% |
| South African | 18 | 0.3% |
| South American | 15 | 0.3% |
| Subsaharan African | 18 | 0.3% |
| Swedish | 244 | 4.6% |
| Swiss | 92 | 1.8% |
| Uruguayan | 15 | 0.3% |
| Welsh | 38 | 0.7% | View All 39 Rows |
Immigrants in Orchard Homes
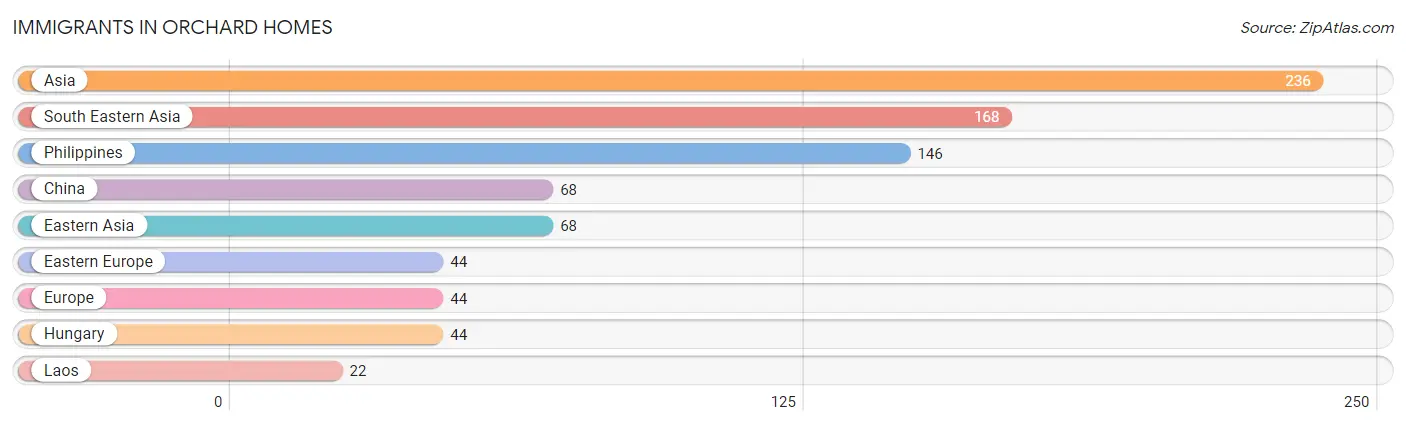
The most numerous immigrant groups reported in Orchard Homes came from Asia (236 | 4.5%), South Eastern Asia (168 | 3.2%), Philippines (146 | 2.8%), China (68 | 1.3%), and Eastern Asia (68 | 1.3%), together accounting for 13.0% of all Orchard Homes residents.
| Immigration Origin | # Population | % Population |
| Asia | 236 | 4.5% |
| China | 68 | 1.3% |
| Eastern Asia | 68 | 1.3% |
| Eastern Europe | 44 | 0.8% |
| Europe | 44 | 0.8% |
| Hungary | 44 | 0.8% |
| Laos | 22 | 0.4% |
| Philippines | 146 | 2.8% |
| South Eastern Asia | 168 | 3.2% | View All 9 Rows |
Sex and Age in Orchard Homes
Sex and Age in Orchard Homes
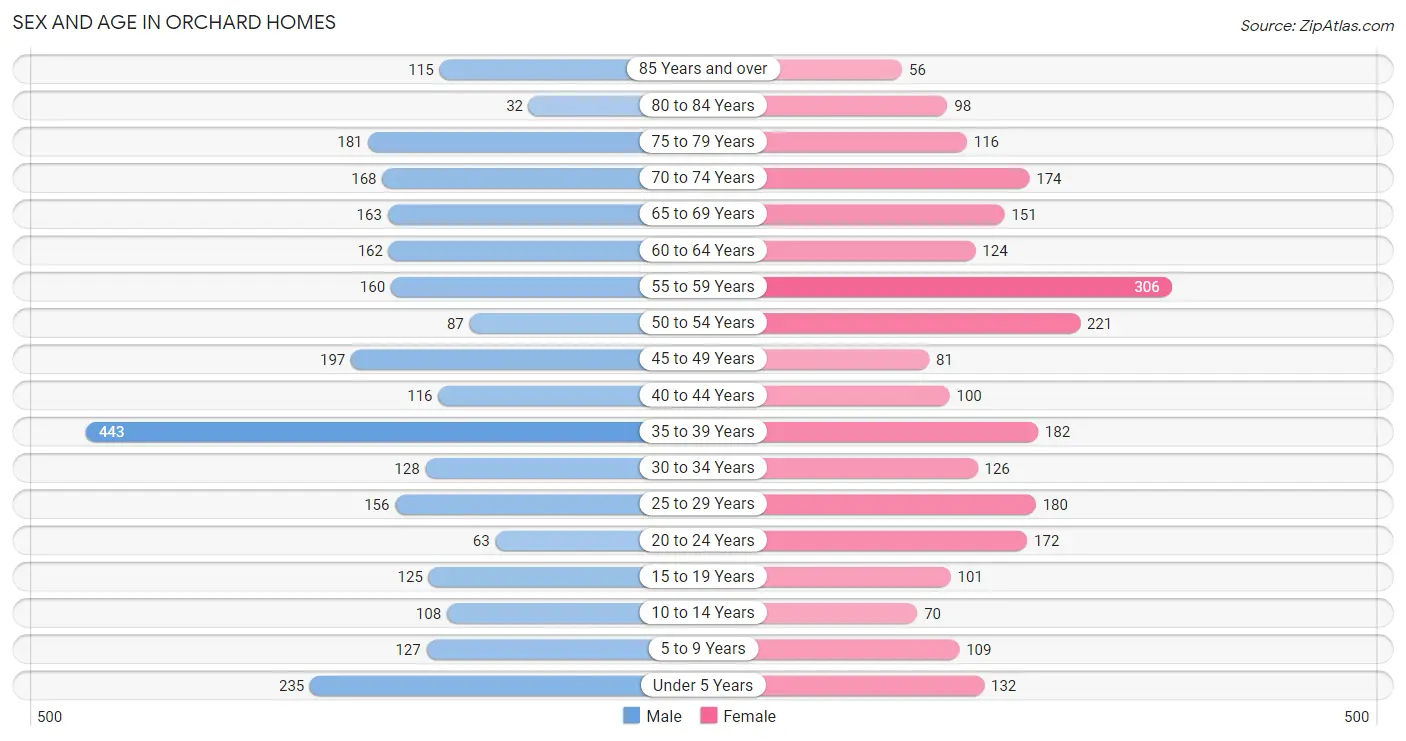
The most populous age groups in Orchard Homes are 35 to 39 Years (443 | 16.0%) for men and 55 to 59 Years (306 | 12.2%) for women.
| Age Bracket | Male | Female |
| Under 5 Years | 235 (8.5%) | 132 (5.3%) |
| 5 to 9 Years | 127 (4.6%) | 109 (4.4%) |
| 10 to 14 Years | 108 (3.9%) | 70 (2.8%) |
| 15 to 19 Years | 125 (4.5%) | 101 (4.0%) |
| 20 to 24 Years | 63 (2.3%) | 172 (6.9%) |
| 25 to 29 Years | 156 (5.6%) | 180 (7.2%) |
| 30 to 34 Years | 128 (4.6%) | 126 (5.0%) |
| 35 to 39 Years | 443 (16.0%) | 182 (7.3%) |
| 40 to 44 Years | 116 (4.2%) | 100 (4.0%) |
| 45 to 49 Years | 197 (7.1%) | 81 (3.2%) |
| 50 to 54 Years | 87 (3.2%) | 221 (8.8%) |
| 55 to 59 Years | 160 (5.8%) | 306 (12.2%) |
| 60 to 64 Years | 162 (5.9%) | 124 (5.0%) |
| 65 to 69 Years | 163 (5.9%) | 151 (6.0%) |
| 70 to 74 Years | 168 (6.1%) | 174 (7.0%) |
| 75 to 79 Years | 181 (6.5%) | 116 (4.6%) |
| 80 to 84 Years | 32 (1.2%) | 98 (3.9%) |
| 85 Years and over | 115 (4.2%) | 56 (2.2%) |
| Total | 2,766 (100.0%) | 2,499 (100.0%) |
Families and Households in Orchard Homes
Median Family Size in Orchard Homes
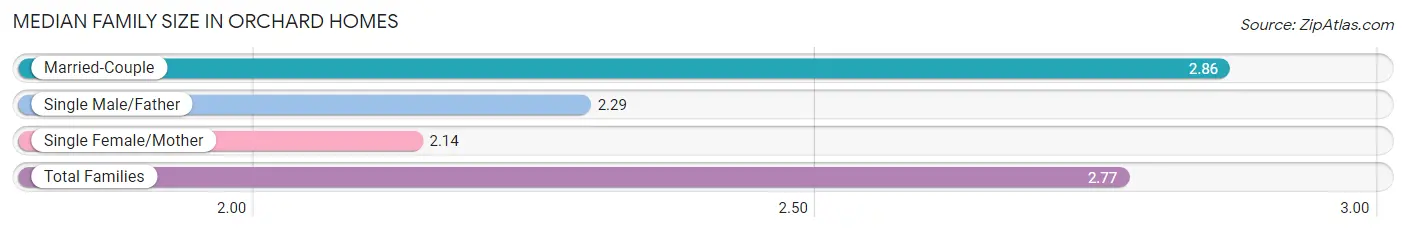
The median family size in Orchard Homes is 2.77 persons per family, with married-couple families (1,287 | 85.2%) accounting for the largest median family size of 2.86 persons per family. On the other hand, single female/mother families (81 | 5.4%) represent the smallest median family size with 2.14 persons per family.
| Family Type | # Families | Family Size |
| Married-Couple | 1,287 (85.2%) | 2.86 |
| Single Male/Father | 142 (9.4%) | 2.29 |
| Single Female/Mother | 81 (5.4%) | 2.14 |
| Total Families | 1,510 (100.0%) | 2.77 |
Median Household Size in Orchard Homes
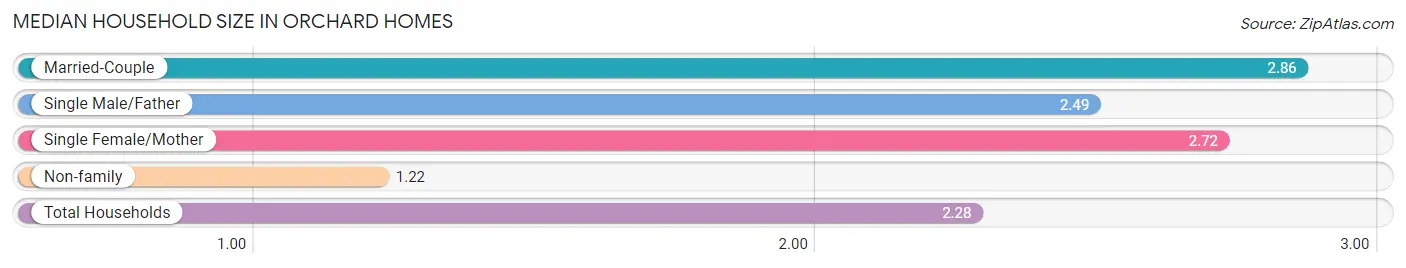
The median household size in Orchard Homes is 2.28 persons per household, with married-couple households (1,287 | 56.4%) accounting for the largest median household size of 2.86 persons per household. non-family households (772 | 33.8%) represent the smallest median household size with 1.22 persons per household.
| Household Type | # Households | Household Size |
| Married-Couple | 1,287 (56.4%) | 2.86 |
| Single Male/Father | 142 (6.2%) | 2.49 |
| Single Female/Mother | 81 (3.5%) | 2.72 |
| Non-family | 772 (33.8%) | 1.22 |
| Total Households | 2,282 (100.0%) | 2.28 |
Household Size by Marriage Status in Orchard Homes
Out of a total of 2,282 households in Orchard Homes, 1,510 (66.2%) are family households, while 772 (33.8%) are nonfamily households. The most numerous type of family households are 2-person households, comprising 762, and the most common type of nonfamily households are 1-person households, comprising 624.
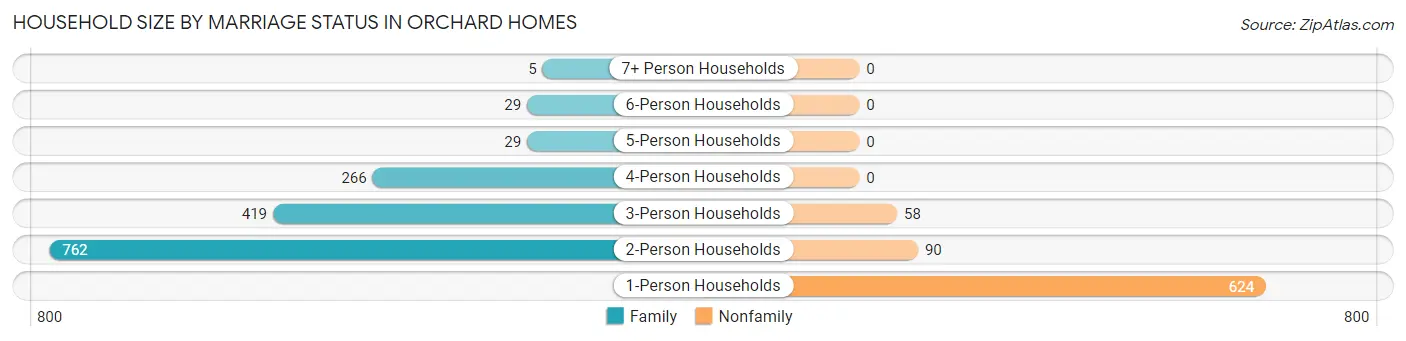
| Household Size | Family Households | Nonfamily Households |
| 1-Person Households | - | 624 (27.3%) |
| 2-Person Households | 762 (33.4%) | 90 (3.9%) |
| 3-Person Households | 419 (18.4%) | 58 (2.5%) |
| 4-Person Households | 266 (11.7%) | 0 (0.0%) |
| 5-Person Households | 29 (1.3%) | 0 (0.0%) |
| 6-Person Households | 29 (1.3%) | 0 (0.0%) |
| 7+ Person Households | 5 (0.2%) | 0 (0.0%) |
| Total | 1,510 (66.2%) | 772 (33.8%) |
Female Fertility in Orchard Homes
Fertility by Age in Orchard Homes
Average fertility rate in Orchard Homes is 42.0 births per 1,000 women. Women in the age bracket of 35 to 50 years have the highest fertility rate with 103.0 births per 1,000 women. Women in the age bracket of 35 to 50 years acount for 100.0% of all women with births.
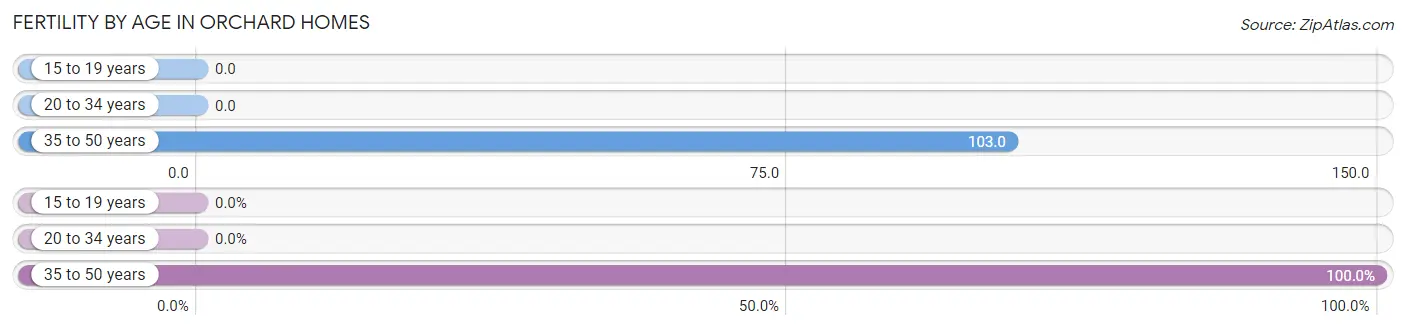
| Age Bracket | Women with Births | Births / 1,000 Women |
| 15 to 19 years | 0 (0.0%) | 0.0 |
| 20 to 34 years | 0 (0.0%) | 0.0 |
| 35 to 50 years | 41 (100.0%) | 103.0 |
| Total | 41 (100.0%) | 42.0 |
Fertility by Age by Marriage Status in Orchard Homes
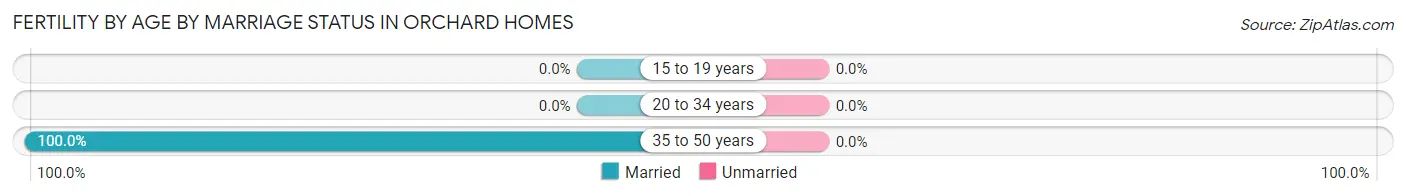
| Age Bracket | Married | Unmarried |
| 15 to 19 years | 0 (0.0%) | 0 (0.0%) |
| 20 to 34 years | 0 (0.0%) | 0 (0.0%) |
| 35 to 50 years | 41 (100.0%) | 0 (0.0%) |
| Total | 41 (100.0%) | 0 (0.0%) |
Fertility by Education in Orchard Homes
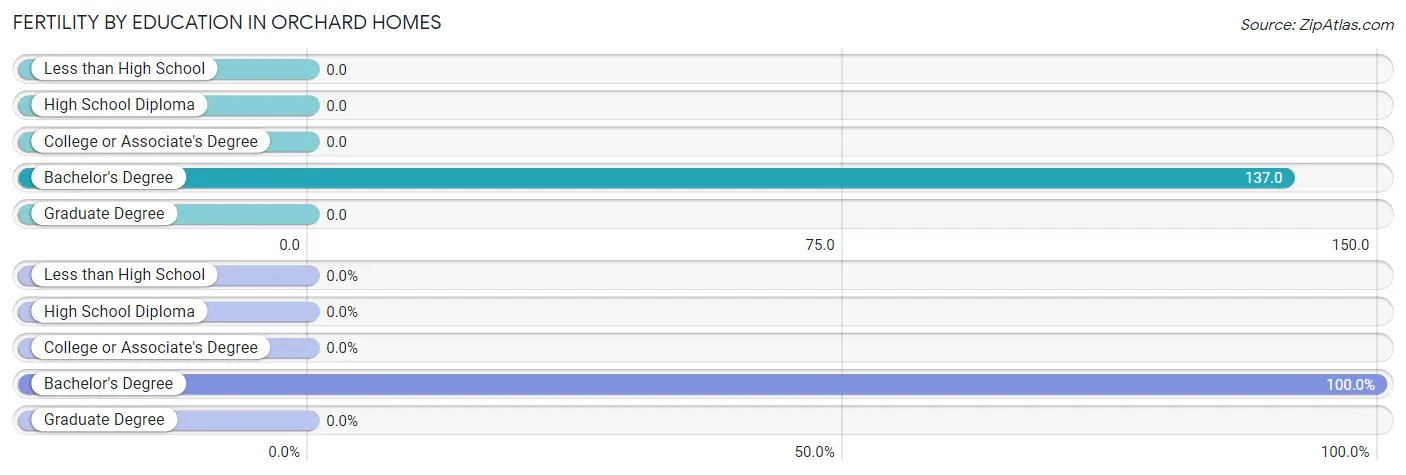
| Educational Attainment | Women with Births | Births / 1,000 Women |
| Less than High School | 0 (0.0%) | 0.0 |
| High School Diploma | 0 (0.0%) | 0.0 |
| College or Associate's Degree | 0 (0.0%) | 0.0 |
| Bachelor's Degree | 41 (100.0%) | 137.0 |
| Graduate Degree | 0 (0.0%) | 0.0 |
| Total | 41 (100.0%) | 42.0 |
Fertility by Education by Marriage Status in Orchard Homes
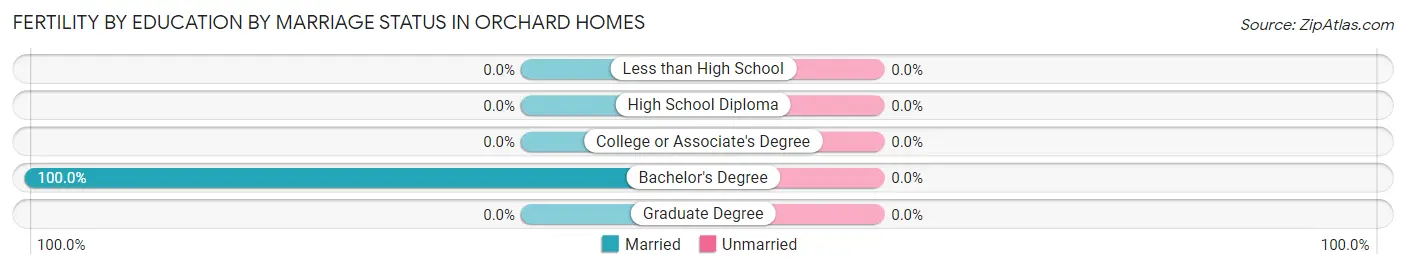
| Educational Attainment | Married | Unmarried |
| Less than High School | 0 (0.0%) | 0 (0.0%) |
| High School Diploma | 0 (0.0%) | 0 (0.0%) |
| College or Associate's Degree | 0 (0.0%) | 0 (0.0%) |
| Bachelor's Degree | 41 (100.0%) | 0 (0.0%) |
| Graduate Degree | 0 (0.0%) | 0 (0.0%) |
| Total | 41 (100.0%) | 0 (0.0%) |
Employment Characteristics in Orchard Homes
Employment by Class of Employer in Orchard Homes
Among the 2,561 employed individuals in Orchard Homes, private company employees (1,410 | 55.1%), not-for-profit organizations (329 | 12.9%), and state government employees (292 | 11.4%) make up the most common classes of employment.
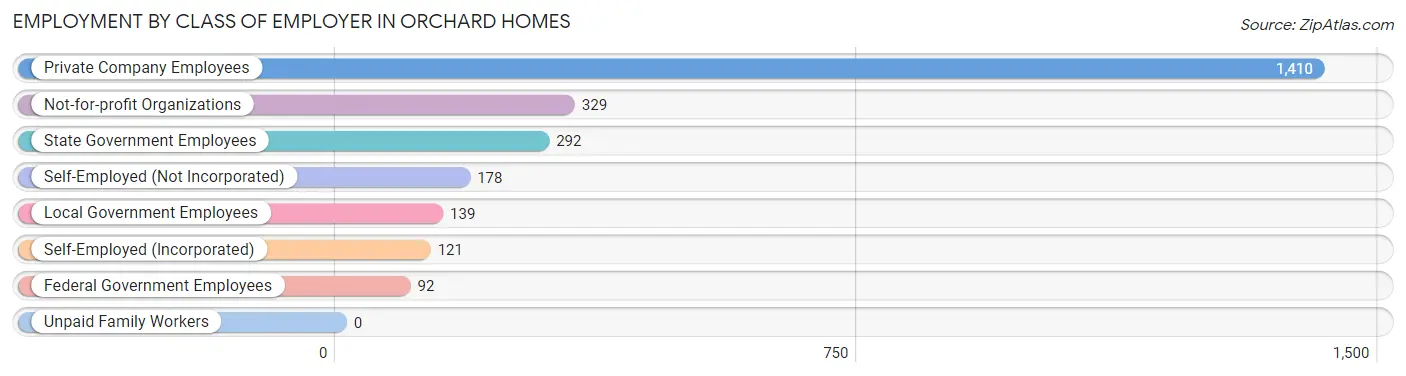
| Employer Class | # Employees | % Employees |
| Private Company Employees | 1,410 | 55.1% |
| Self-Employed (Incorporated) | 121 | 4.7% |
| Self-Employed (Not Incorporated) | 178 | 7.0% |
| Not-for-profit Organizations | 329 | 12.9% |
| Local Government Employees | 139 | 5.4% |
| State Government Employees | 292 | 11.4% |
| Federal Government Employees | 92 | 3.6% |
| Unpaid Family Workers | 0 | 0.0% |
| Total | 2,561 | 100.0% |
Employment Status by Age in Orchard Homes
According to the labor force statistics for Orchard Homes, out of the total population over 16 years of age (4,483), 62.8% or 2,815 individuals are in the labor force, with 5.9% or 166 of them unemployed. The age group with the highest labor force participation rate is 35 to 44 years, with 95.7% or 805 individuals in the labor force. Within the labor force, the 20 to 24 years age range has the highest percentage of unemployed individuals, with 24.5% or 49 of them being unemployed.
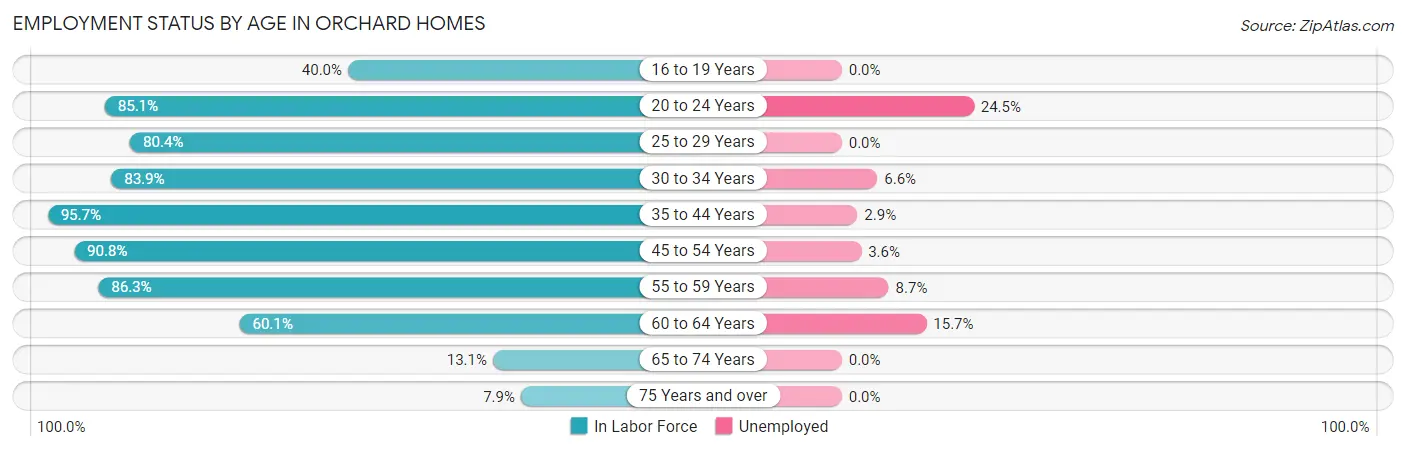
| Age Bracket | In Labor Force | Unemployed |
| 16 to 19 Years | 90 (40.0%) | 0 (0.0%) |
| 20 to 24 Years | 200 (85.1%) | 49 (24.5%) |
| 25 to 29 Years | 270 (80.4%) | 0 (0.0%) |
| 30 to 34 Years | 213 (83.9%) | 14 (6.6%) |
| 35 to 44 Years | 805 (95.7%) | 23 (2.9%) |
| 45 to 54 Years | 532 (90.8%) | 19 (3.6%) |
| 55 to 59 Years | 402 (86.3%) | 35 (8.7%) |
| 60 to 64 Years | 172 (60.1%) | 27 (15.7%) |
| 65 to 74 Years | 86 (13.1%) | 0 (0.0%) |
| 75 Years and over | 47 (7.9%) | 0 (0.0%) |
| Total | 2,815 (62.8%) | 166 (5.9%) |
Employment Status by Educational Attainment in Orchard Homes
According to labor force statistics for Orchard Homes, 86.5% of individuals (2,395) out of the total population between 25 and 64 years of age (2,769) are in the labor force, with 4.9% or 117 of them being unemployed. The group with the highest labor force participation rate are those with the educational attainment of less than high school, with 100.0% or 17 individuals in the labor force. Within the labor force, individuals with college / associate degree education have the highest percentage of unemployment, with 5.4% or 29 of them being unemployed.
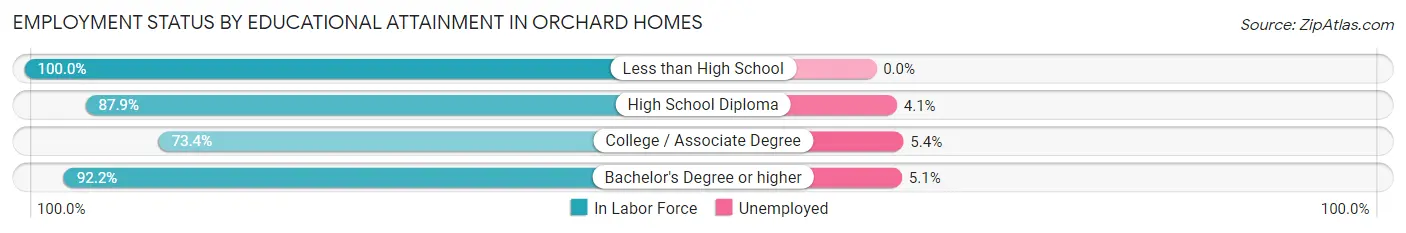
| Educational Attainment | In Labor Force | Unemployed |
| Less than High School | 17 (100.0%) | 0 (0.0%) |
| High School Diploma | 485 (87.9%) | 23 (4.1%) |
| College / Associate Degree | 533 (73.4%) | 39 (5.4%) |
| Bachelor's Degree or higher | 1,359 (92.2%) | 75 (5.1%) |
| Total | 2,395 (86.5%) | 136 (4.9%) |
Employment Occupations by Sex in Orchard Homes
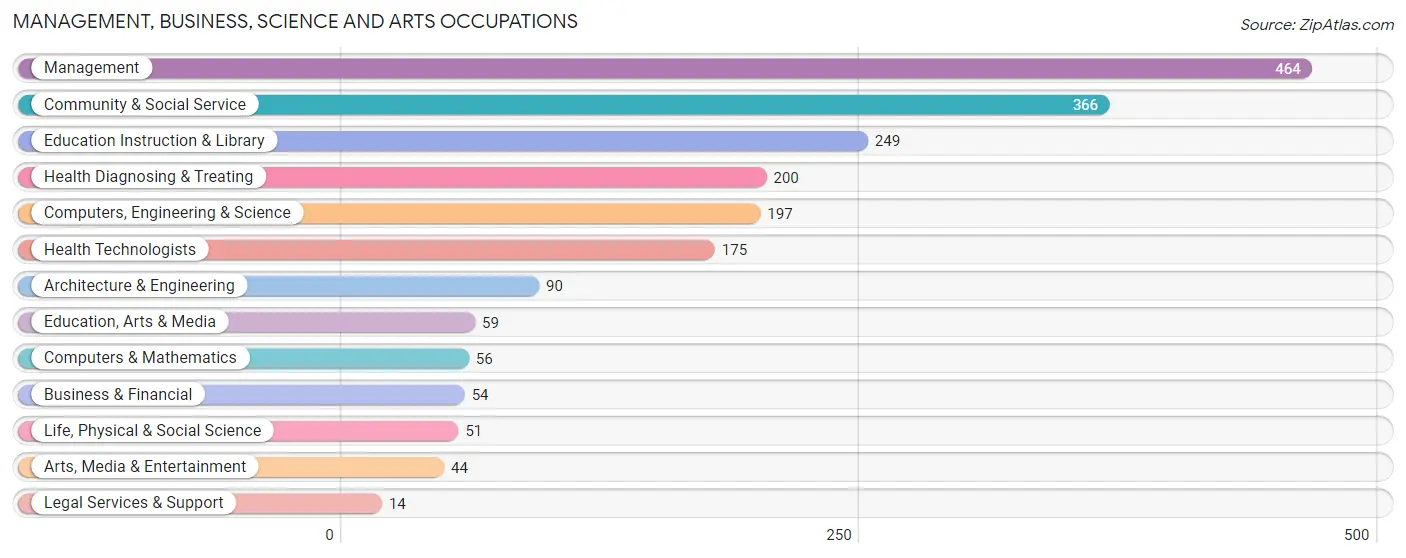
Management, Business, Science and Arts Occupations
The most common Management, Business, Science and Arts occupations in Orchard Homes are Management (464 | 17.5%), Community & Social Service (366 | 13.8%), Education Instruction & Library (249 | 9.4%), Health Diagnosing & Treating (200 | 7.5%), and Computers, Engineering & Science (197 | 7.4%).
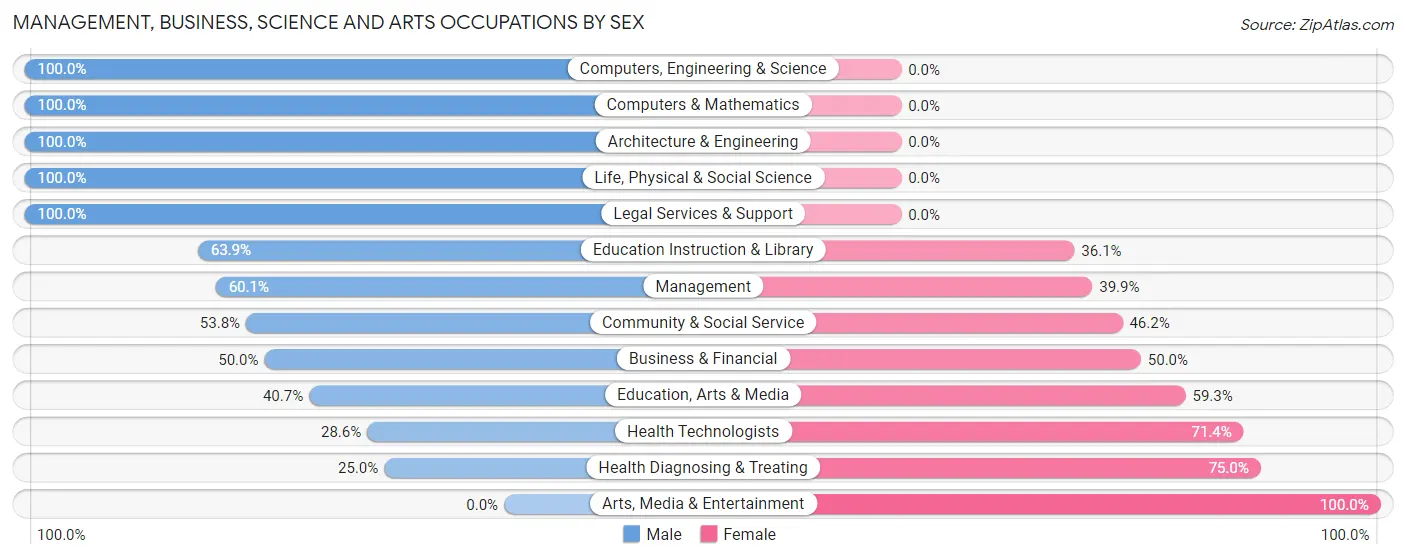
Management, Business, Science and Arts Occupations by Sex
Within the Management, Business, Science and Arts occupations in Orchard Homes, the most male-oriented occupations are Computers, Engineering & Science (100.0%), Computers & Mathematics (100.0%), and Architecture & Engineering (100.0%), while the most female-oriented occupations are Arts, Media & Entertainment (100.0%), Health Diagnosing & Treating (75.0%), and Health Technologists (71.4%).
| Occupation | Male | Female |
| Management | 279 (60.1%) | 185 (39.9%) |
| Business & Financial | 27 (50.0%) | 27 (50.0%) |
| Computers, Engineering & Science | 197 (100.0%) | 0 (0.0%) |
| Computers & Mathematics | 56 (100.0%) | 0 (0.0%) |
| Architecture & Engineering | 90 (100.0%) | 0 (0.0%) |
| Life, Physical & Social Science | 51 (100.0%) | 0 (0.0%) |
| Community & Social Service | 197 (53.8%) | 169 (46.2%) |
| Education, Arts & Media | 24 (40.7%) | 35 (59.3%) |
| Legal Services & Support | 14 (100.0%) | 0 (0.0%) |
| Education Instruction & Library | 159 (63.9%) | 90 (36.1%) |
| Arts, Media & Entertainment | 0 (0.0%) | 44 (100.0%) |
| Health Diagnosing & Treating | 50 (25.0%) | 150 (75.0%) |
| Health Technologists | 50 (28.6%) | 125 (71.4%) |
| Total (Category) | 750 (58.6%) | 531 (41.4%) |
| Total (Overall) | 1,553 (58.6%) | 1,097 (41.4%) |
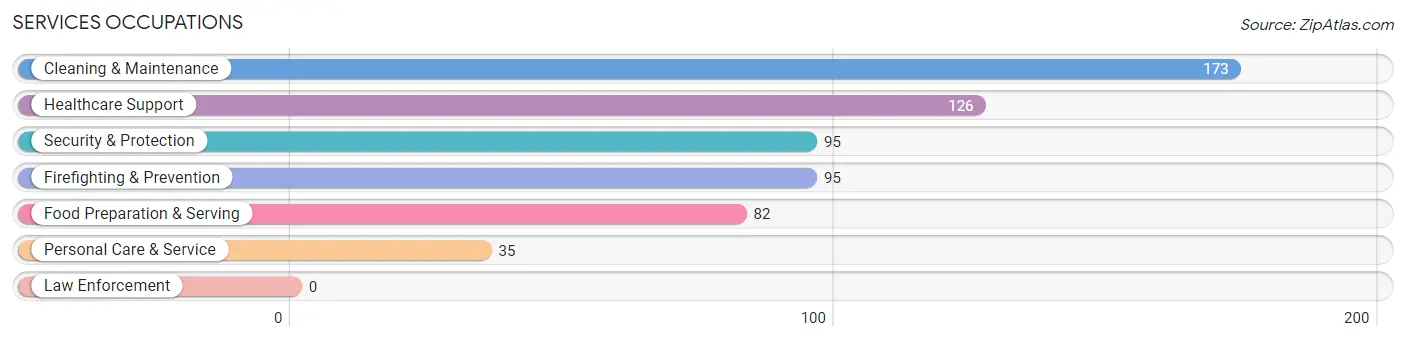
Services Occupations
The most common Services occupations in Orchard Homes are Cleaning & Maintenance (173 | 6.5%), Healthcare Support (126 | 4.8%), Security & Protection (95 | 3.6%), Firefighting & Prevention (95 | 3.6%), and Food Preparation & Serving (82 | 3.1%).
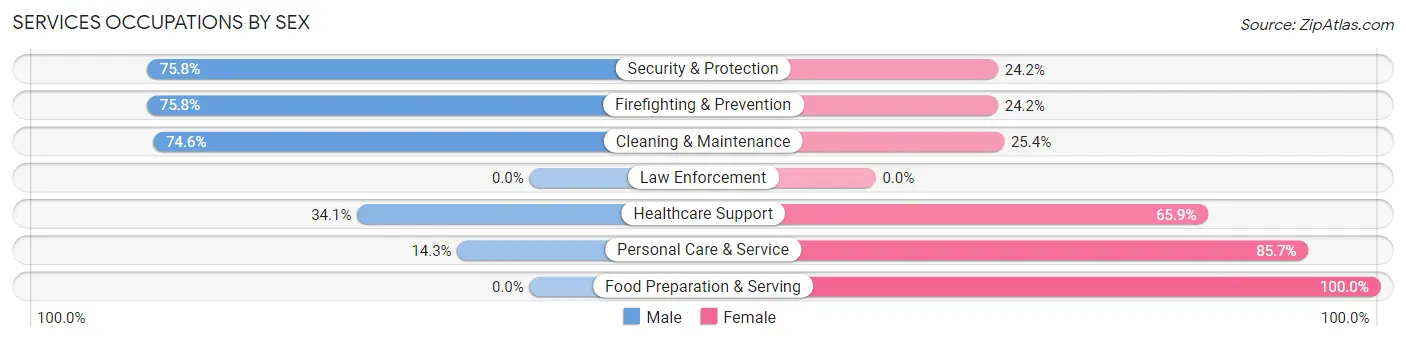
Services Occupations by Sex
Within the Services occupations in Orchard Homes, the most male-oriented occupations are Security & Protection (75.8%), Firefighting & Prevention (75.8%), and Cleaning & Maintenance (74.6%), while the most female-oriented occupations are Food Preparation & Serving (100.0%), Personal Care & Service (85.7%), and Healthcare Support (65.9%).
| Occupation | Male | Female |
| Healthcare Support | 43 (34.1%) | 83 (65.9%) |
| Security & Protection | 72 (75.8%) | 23 (24.2%) |
| Firefighting & Prevention | 72 (75.8%) | 23 (24.2%) |
| Law Enforcement | 0 (0.0%) | 0 (0.0%) |
| Food Preparation & Serving | 0 (0.0%) | 82 (100.0%) |
| Cleaning & Maintenance | 129 (74.6%) | 44 (25.4%) |
| Personal Care & Service | 5 (14.3%) | 30 (85.7%) |
| Total (Category) | 249 (48.7%) | 262 (51.3%) |
| Total (Overall) | 1,553 (58.6%) | 1,097 (41.4%) |
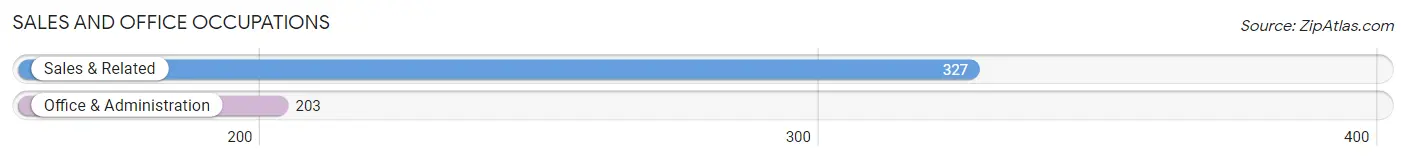
Sales and Office Occupations
The most common Sales and Office occupations in Orchard Homes are Sales & Related (327 | 12.3%), and Office & Administration (203 | 7.7%).
Sales and Office Occupations by Sex
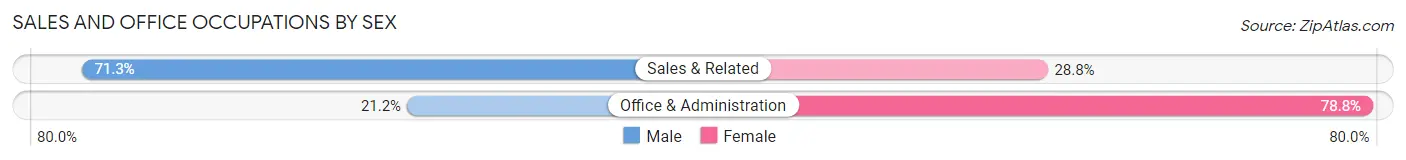
| Occupation | Male | Female |
| Sales & Related | 233 (71.3%) | 94 (28.7%) |
| Office & Administration | 43 (21.2%) | 160 (78.8%) |
| Total (Category) | 276 (52.1%) | 254 (47.9%) |
| Total (Overall) | 1,553 (58.6%) | 1,097 (41.4%) |
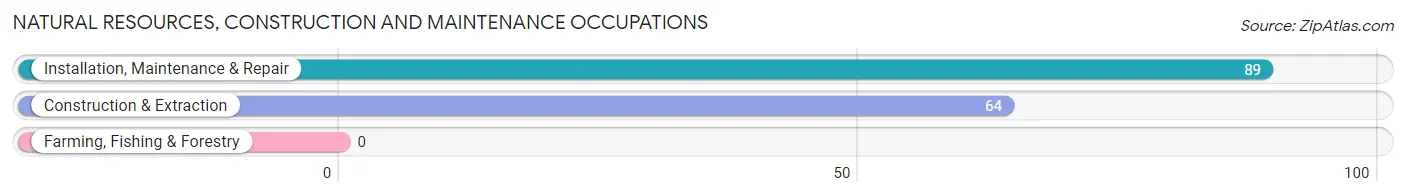
Natural Resources, Construction and Maintenance Occupations
The most common Natural Resources, Construction and Maintenance occupations in Orchard Homes are Installation, Maintenance & Repair (89 | 3.4%), and Construction & Extraction (64 | 2.4%).
Natural Resources, Construction and Maintenance Occupations by Sex
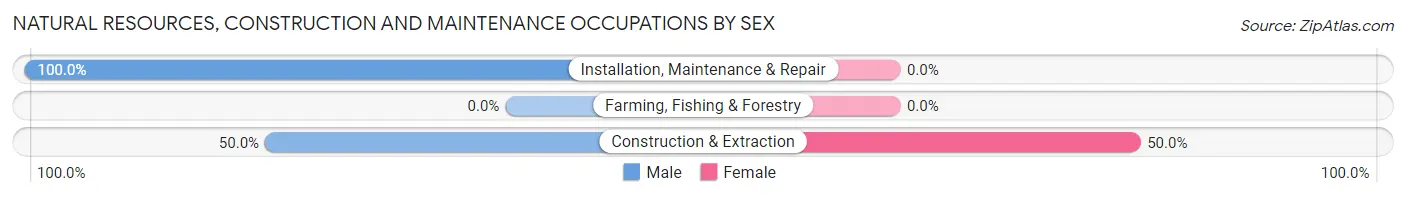
| Occupation | Male | Female |
| Farming, Fishing & Forestry | 0 (0.0%) | 0 (0.0%) |
| Construction & Extraction | 32 (50.0%) | 32 (50.0%) |
| Installation, Maintenance & Repair | 89 (100.0%) | 0 (0.0%) |
| Total (Category) | 121 (79.1%) | 32 (20.9%) |
| Total (Overall) | 1,553 (58.6%) | 1,097 (41.4%) |
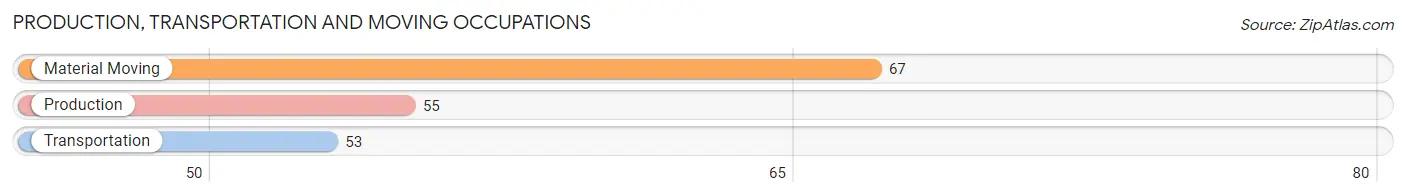
Production, Transportation and Moving Occupations
The most common Production, Transportation and Moving occupations in Orchard Homes are Material Moving (67 | 2.5%), Production (55 | 2.1%), and Transportation (53 | 2.0%).
Production, Transportation and Moving Occupations by Sex
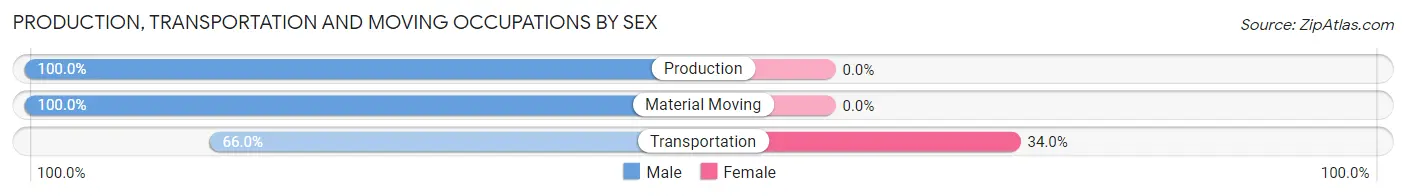
| Occupation | Male | Female |
| Production | 55 (100.0%) | 0 (0.0%) |
| Transportation | 35 (66.0%) | 18 (34.0%) |
| Material Moving | 67 (100.0%) | 0 (0.0%) |
| Total (Category) | 157 (89.7%) | 18 (10.3%) |
| Total (Overall) | 1,553 (58.6%) | 1,097 (41.4%) |
Employment Industries by Sex in Orchard Homes
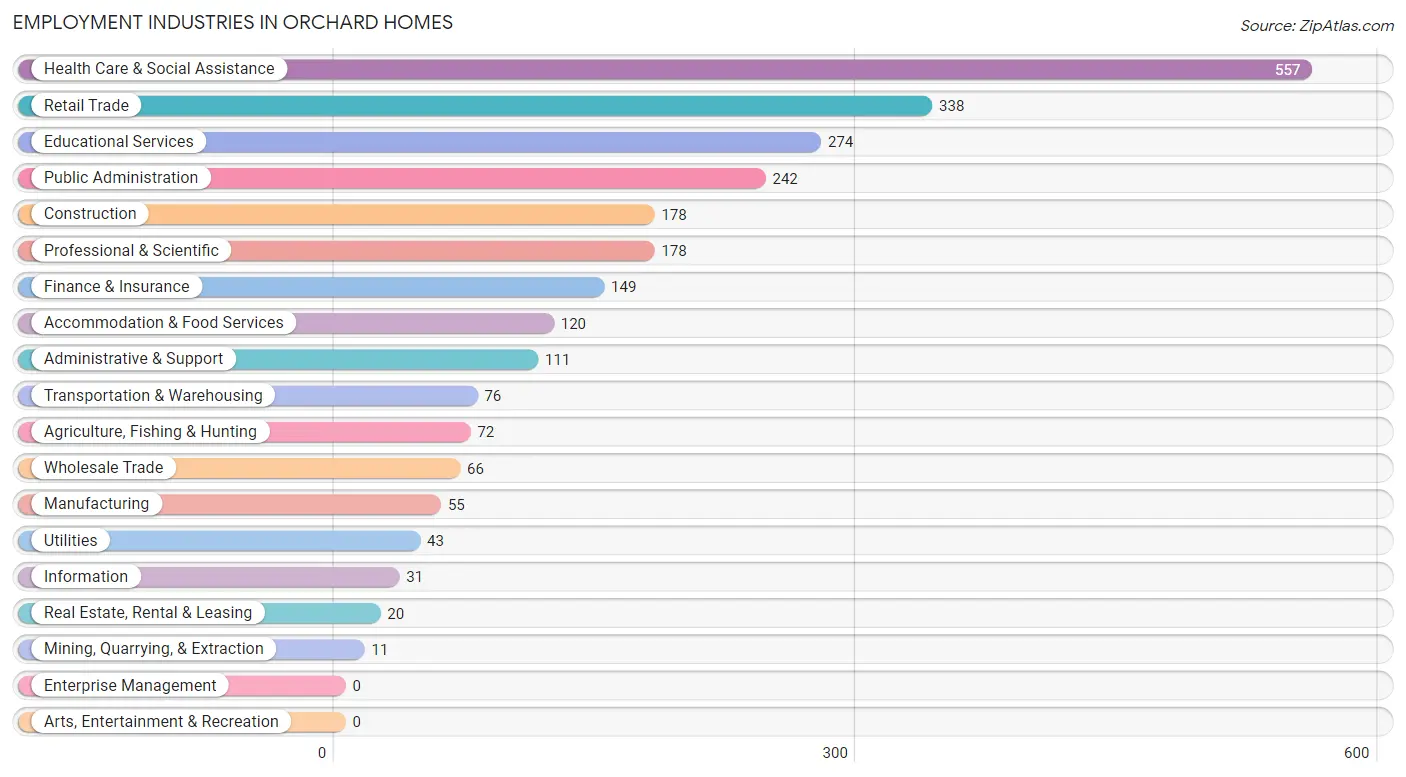
Employment Industries in Orchard Homes
The major employment industries in Orchard Homes include Health Care & Social Assistance (557 | 21.0%), Retail Trade (338 | 12.8%), Educational Services (274 | 10.3%), Public Administration (242 | 9.1%), and Construction (178 | 6.7%).
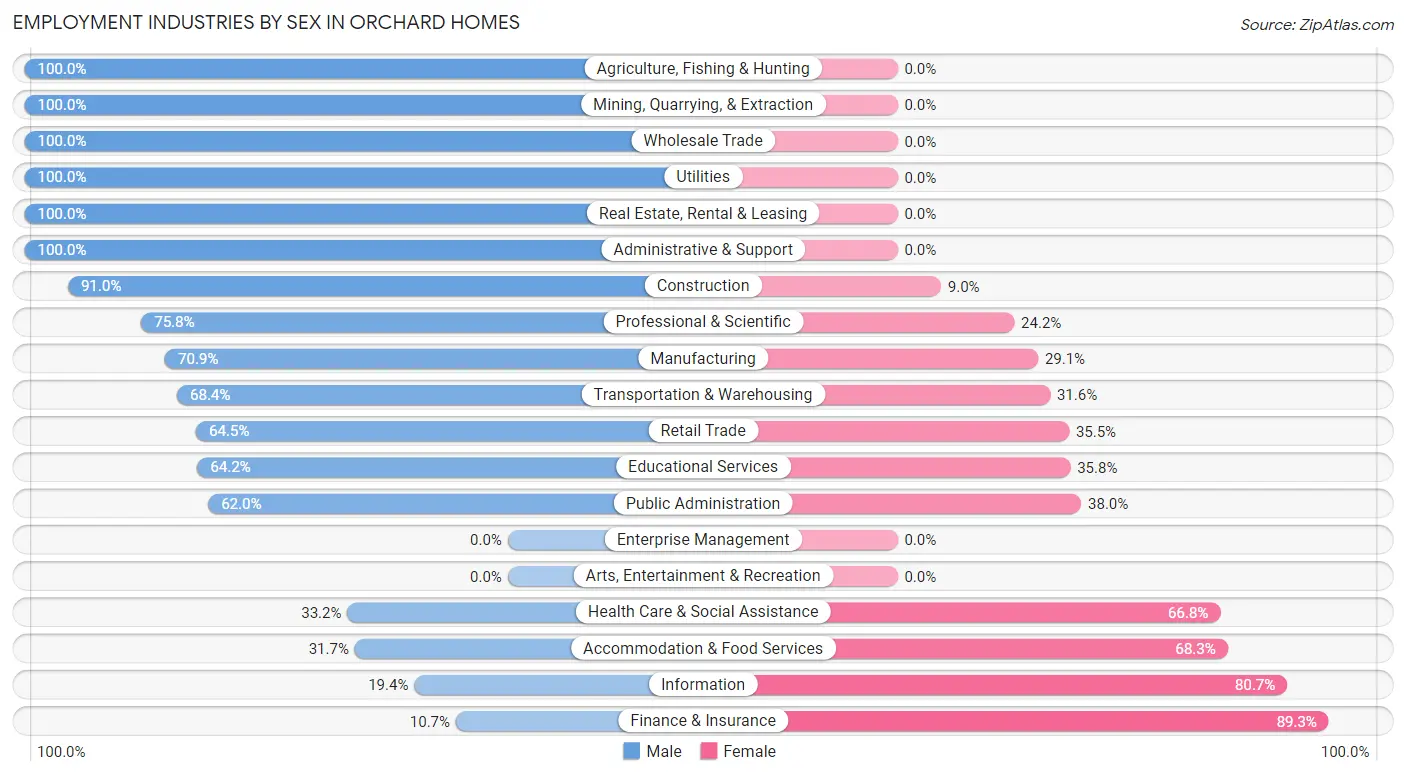
Employment Industries by Sex in Orchard Homes
The Orchard Homes industries that see more men than women are Agriculture, Fishing & Hunting (100.0%), Mining, Quarrying, & Extraction (100.0%), and Wholesale Trade (100.0%), whereas the industries that tend to have a higher number of women are Finance & Insurance (89.3%), Information (80.6%), and Accommodation & Food Services (68.3%).
| Industry | Male | Female |
| Agriculture, Fishing & Hunting | 72 (100.0%) | 0 (0.0%) |
| Mining, Quarrying, & Extraction | 11 (100.0%) | 0 (0.0%) |
| Construction | 162 (91.0%) | 16 (9.0%) |
| Manufacturing | 39 (70.9%) | 16 (29.1%) |
| Wholesale Trade | 66 (100.0%) | 0 (0.0%) |
| Retail Trade | 218 (64.5%) | 120 (35.5%) |
| Transportation & Warehousing | 52 (68.4%) | 24 (31.6%) |
| Utilities | 43 (100.0%) | 0 (0.0%) |
| Information | 6 (19.4%) | 25 (80.6%) |
| Finance & Insurance | 16 (10.7%) | 133 (89.3%) |
| Real Estate, Rental & Leasing | 20 (100.0%) | 0 (0.0%) |
| Professional & Scientific | 135 (75.8%) | 43 (24.2%) |
| Enterprise Management | 0 (0.0%) | 0 (0.0%) |
| Administrative & Support | 111 (100.0%) | 0 (0.0%) |
| Educational Services | 176 (64.2%) | 98 (35.8%) |
| Health Care & Social Assistance | 185 (33.2%) | 372 (66.8%) |
| Arts, Entertainment & Recreation | 0 (0.0%) | 0 (0.0%) |
| Accommodation & Food Services | 38 (31.7%) | 82 (68.3%) |
| Public Administration | 150 (62.0%) | 92 (38.0%) |
| Total | 1,553 (58.6%) | 1,097 (41.4%) |
Education in Orchard Homes
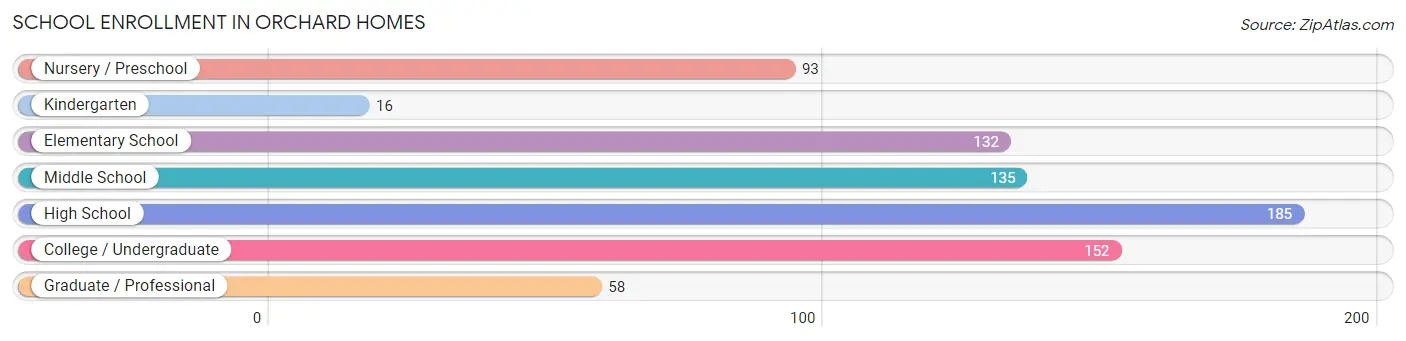
School Enrollment in Orchard Homes
The most common levels of schooling among the 771 students in Orchard Homes are high school (185 | 24.0%), college / undergraduate (152 | 19.7%), and middle school (135 | 17.5%).
| School Level | # Students | % Students |
| Nursery / Preschool | 93 | 12.1% |
| Kindergarten | 16 | 2.1% |
| Elementary School | 132 | 17.1% |
| Middle School | 135 | 17.5% |
| High School | 185 | 24.0% |
| College / Undergraduate | 152 | 19.7% |
| Graduate / Professional | 58 | 7.5% |
| Total | 771 | 100.0% |
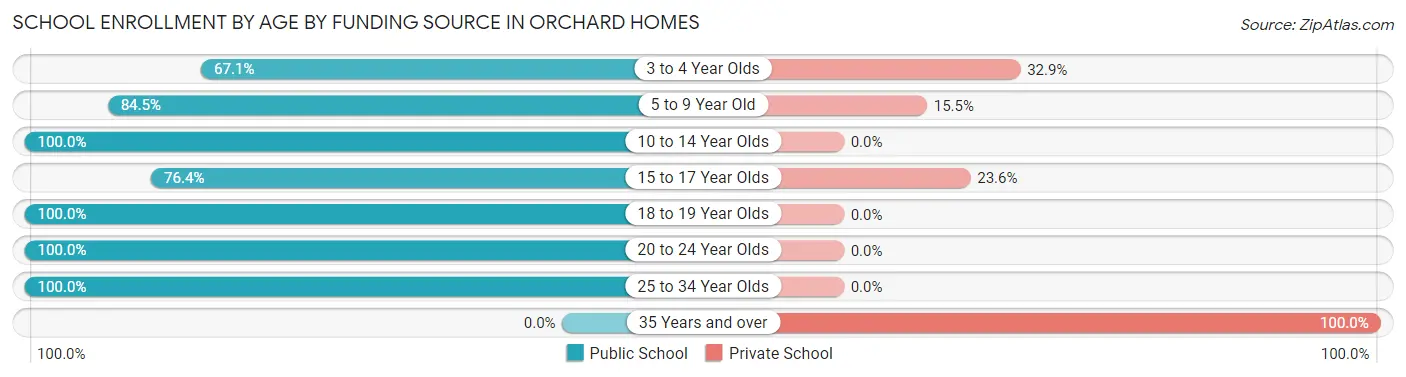
School Enrollment by Age by Funding Source in Orchard Homes
Out of a total of 771 students who are enrolled in schools in Orchard Homes, 93 (12.1%) attend a private institution, while the remaining 678 (87.9%) are enrolled in public schools. The age group of 35 years and over has the highest likelihood of being enrolled in private schools, with 18 (100.0% in the age bracket) enrolled. Conversely, the age group of 10 to 14 year olds has the lowest likelihood of being enrolled in a private school, with 178 (100.0% in the age bracket) attending a public institution.
| Age Bracket | Public School | Private School |
| 3 to 4 Year Olds | 49 (67.1%) | 24 (32.9%) |
| 5 to 9 Year Old | 142 (84.5%) | 26 (15.5%) |
| 10 to 14 Year Olds | 178 (100.0%) | 0 (0.0%) |
| 15 to 17 Year Olds | 81 (76.4%) | 25 (23.6%) |
| 18 to 19 Year Olds | 68 (100.0%) | 0 (0.0%) |
| 20 to 24 Year Olds | 43 (100.0%) | 0 (0.0%) |
| 25 to 34 Year Olds | 117 (100.0%) | 0 (0.0%) |
| 35 Years and over | 0 (0.0%) | 18 (100.0%) |
| Total | 678 (87.9%) | 93 (12.1%) |
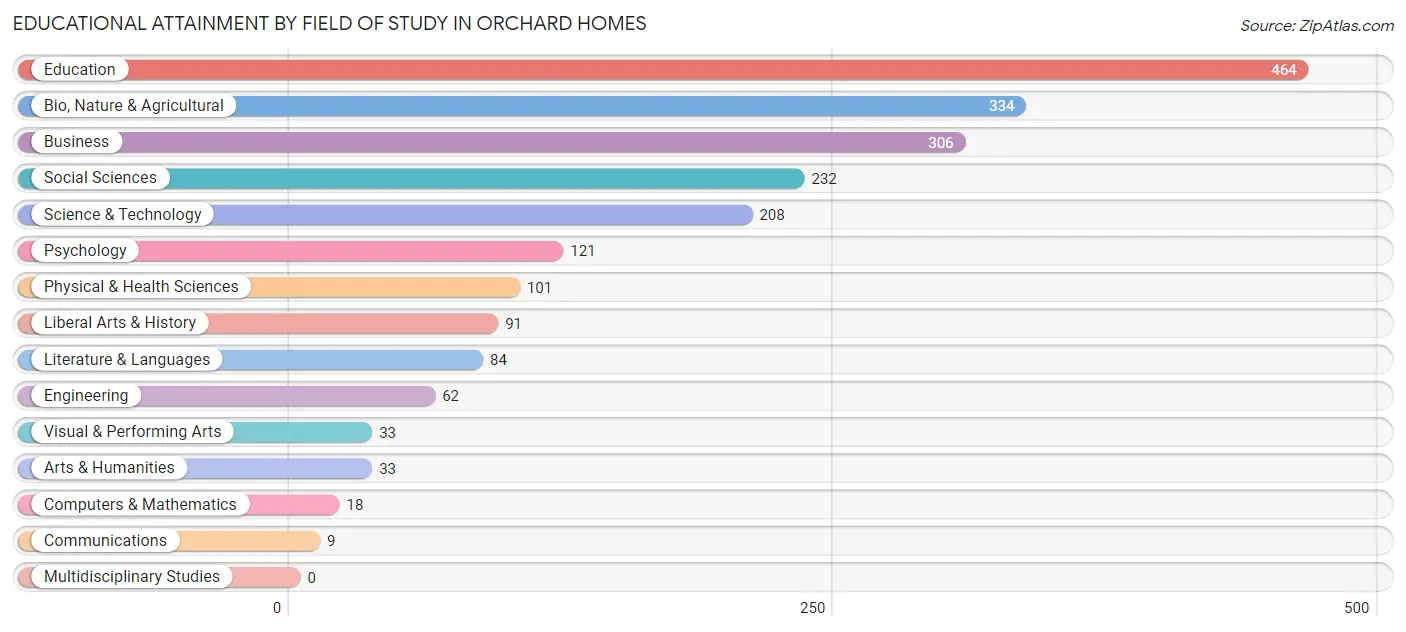
Educational Attainment by Field of Study in Orchard Homes
Education (464 | 22.1%), bio, nature & agricultural (334 | 15.9%), business (306 | 14.6%), social sciences (232 | 11.1%), and science & technology (208 | 9.9%) are the most common fields of study among 2,096 individuals in Orchard Homes who have obtained a bachelor's degree or higher.
| Field of Study | # Graduates | % Graduates |
| Computers & Mathematics | 18 | 0.9% |
| Bio, Nature & Agricultural | 334 | 15.9% |
| Physical & Health Sciences | 101 | 4.8% |
| Psychology | 121 | 5.8% |
| Social Sciences | 232 | 11.1% |
| Engineering | 62 | 3.0% |
| Multidisciplinary Studies | 0 | 0.0% |
| Science & Technology | 208 | 9.9% |
| Business | 306 | 14.6% |
| Education | 464 | 22.1% |
| Literature & Languages | 84 | 4.0% |
| Liberal Arts & History | 91 | 4.3% |
| Visual & Performing Arts | 33 | 1.6% |
| Communications | 9 | 0.4% |
| Arts & Humanities | 33 | 1.6% |
| Total | 2,096 | 100.0% |
Transportation & Commute in Orchard Homes
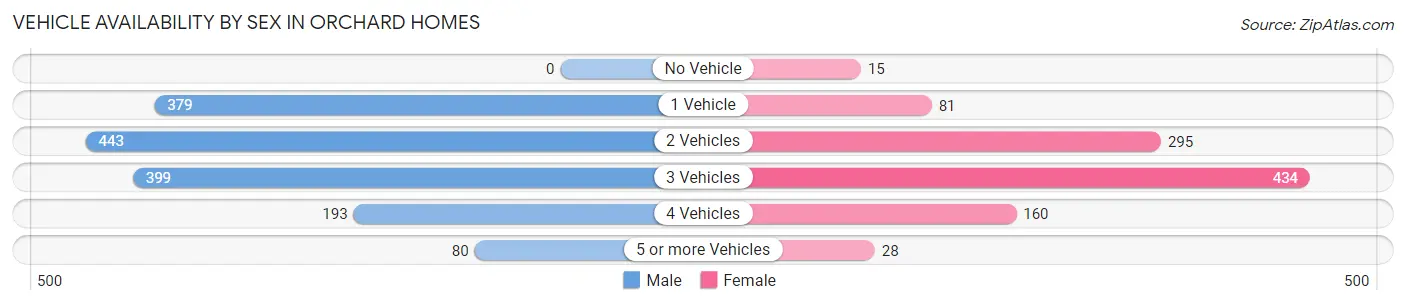
Vehicle Availability by Sex in Orchard Homes
The most prevalent vehicle ownership categories in Orchard Homes are males with 2 vehicles (443, accounting for 29.6%) and females with 2 vehicles (295, making up 43.7%).
| Vehicles Available | Male | Female |
| No Vehicle | 0 (0.0%) | 15 (1.5%) |
| 1 Vehicle | 379 (25.4%) | 81 (8.0%) |
| 2 Vehicles | 443 (29.6%) | 295 (29.1%) |
| 3 Vehicles | 399 (26.7%) | 434 (42.8%) |
| 4 Vehicles | 193 (12.9%) | 160 (15.8%) |
| 5 or more Vehicles | 80 (5.3%) | 28 (2.8%) |
| Total | 1,494 (100.0%) | 1,013 (100.0%) |
Commute Time in Orchard Homes
The most frequently occuring commute durations in Orchard Homes are 10 to 14 minutes (618 commuters, 24.8%), 15 to 19 minutes (592 commuters, 23.8%), and 20 to 24 minutes (548 commuters, 22.0%).
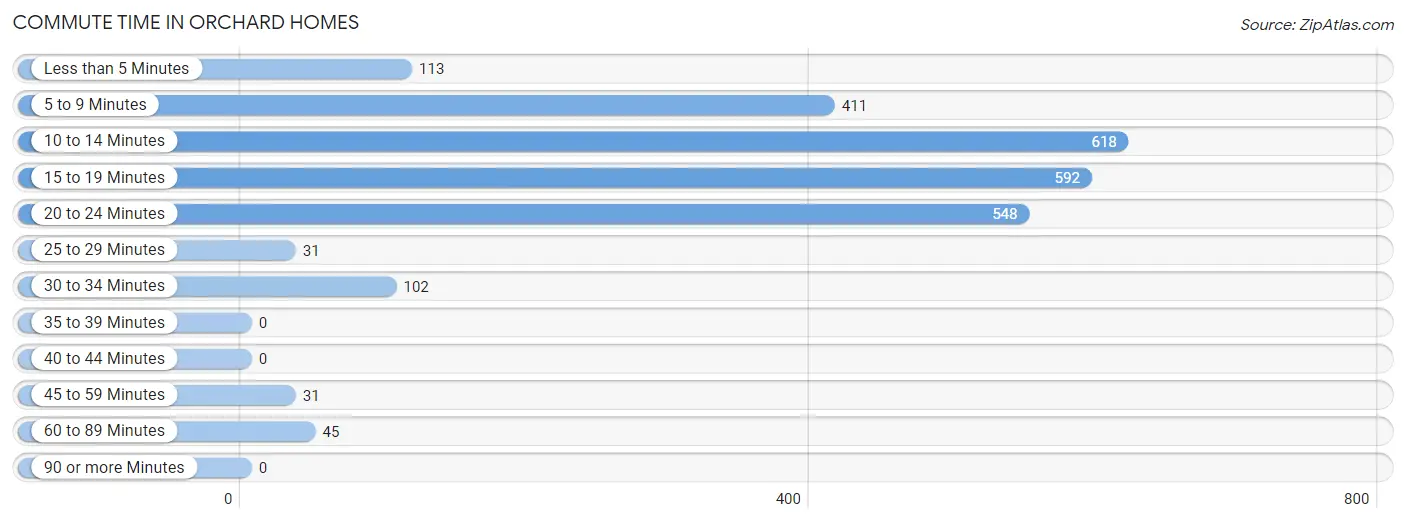
| Commute Time | # Commuters | % Commuters |
| Less than 5 Minutes | 113 | 4.5% |
| 5 to 9 Minutes | 411 | 16.5% |
| 10 to 14 Minutes | 618 | 24.8% |
| 15 to 19 Minutes | 592 | 23.8% |
| 20 to 24 Minutes | 548 | 22.0% |
| 25 to 29 Minutes | 31 | 1.2% |
| 30 to 34 Minutes | 102 | 4.1% |
| 35 to 39 Minutes | 0 | 0.0% |
| 40 to 44 Minutes | 0 | 0.0% |
| 45 to 59 Minutes | 31 | 1.2% |
| 60 to 89 Minutes | 45 | 1.8% |
| 90 or more Minutes | 0 | 0.0% |
Commute Time by Sex in Orchard Homes
The most common commute times in Orchard Homes are 10 to 14 minutes (424 commuters, 28.6%) for males and 15 to 19 minutes (275 commuters, 27.2%) for females.
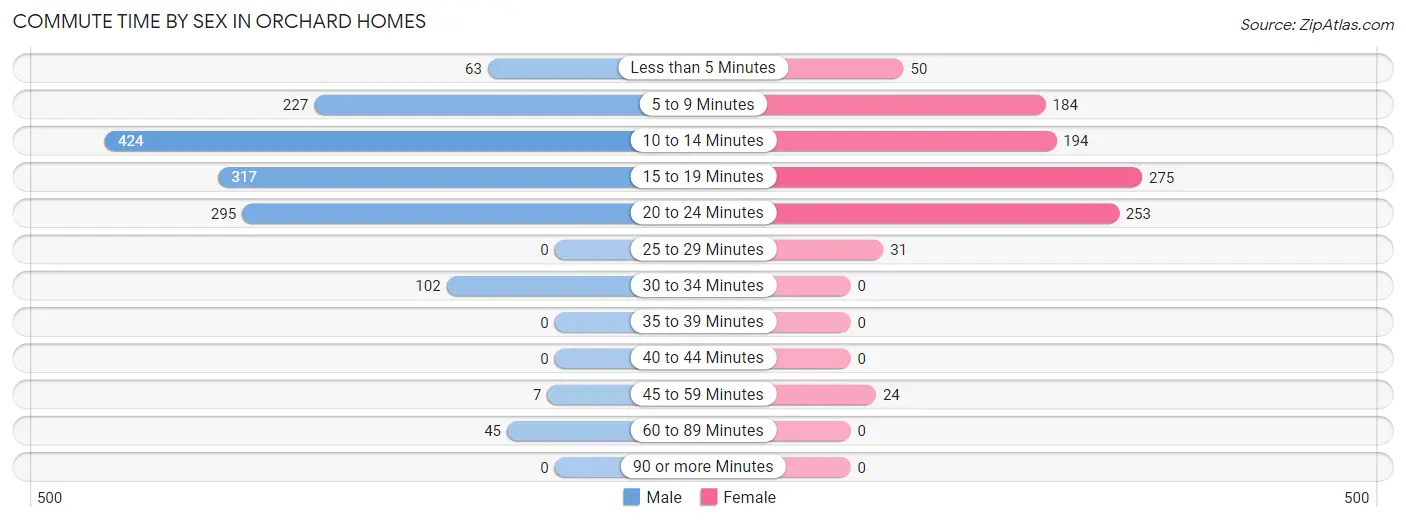
| Commute Time | Male | Female |
| Less than 5 Minutes | 63 (4.3%) | 50 (5.0%) |
| 5 to 9 Minutes | 227 (15.3%) | 184 (18.2%) |
| 10 to 14 Minutes | 424 (28.6%) | 194 (19.2%) |
| 15 to 19 Minutes | 317 (21.4%) | 275 (27.2%) |
| 20 to 24 Minutes | 295 (19.9%) | 253 (25.0%) |
| 25 to 29 Minutes | 0 (0.0%) | 31 (3.1%) |
| 30 to 34 Minutes | 102 (6.9%) | 0 (0.0%) |
| 35 to 39 Minutes | 0 (0.0%) | 0 (0.0%) |
| 40 to 44 Minutes | 0 (0.0%) | 0 (0.0%) |
| 45 to 59 Minutes | 7 (0.5%) | 24 (2.4%) |
| 60 to 89 Minutes | 45 (3.0%) | 0 (0.0%) |
| 90 or more Minutes | 0 (0.0%) | 0 (0.0%) |
Time of Departure to Work by Sex in Orchard Homes
The most frequent times of departure to work in Orchard Homes are 8:00 AM to 8:29 AM (226, 15.3%) for males and 7:30 AM to 7:59 AM (320, 31.7%) for females.
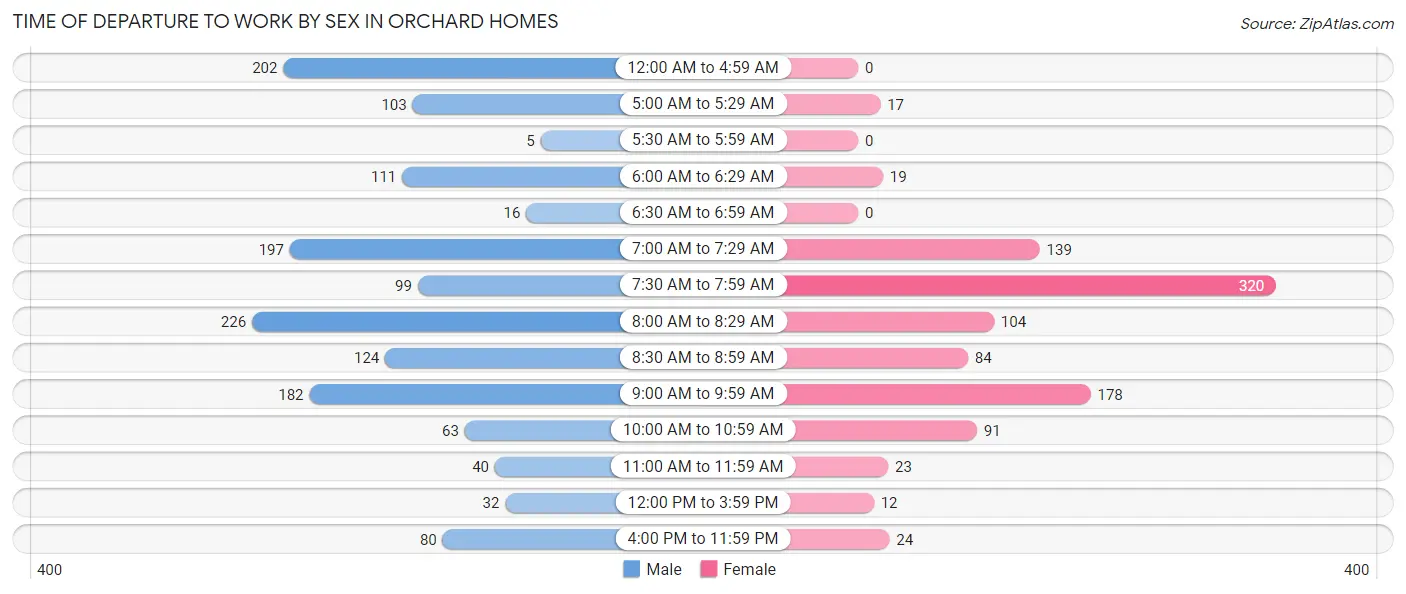
| Time of Departure | Male | Female |
| 12:00 AM to 4:59 AM | 202 (13.7%) | 0 (0.0%) |
| 5:00 AM to 5:29 AM | 103 (7.0%) | 17 (1.7%) |
| 5:30 AM to 5:59 AM | 5 (0.3%) | 0 (0.0%) |
| 6:00 AM to 6:29 AM | 111 (7.5%) | 19 (1.9%) |
| 6:30 AM to 6:59 AM | 16 (1.1%) | 0 (0.0%) |
| 7:00 AM to 7:29 AM | 197 (13.3%) | 139 (13.8%) |
| 7:30 AM to 7:59 AM | 99 (6.7%) | 320 (31.7%) |
| 8:00 AM to 8:29 AM | 226 (15.3%) | 104 (10.3%) |
| 8:30 AM to 8:59 AM | 124 (8.4%) | 84 (8.3%) |
| 9:00 AM to 9:59 AM | 182 (12.3%) | 178 (17.6%) |
| 10:00 AM to 10:59 AM | 63 (4.3%) | 91 (9.0%) |
| 11:00 AM to 11:59 AM | 40 (2.7%) | 23 (2.3%) |
| 12:00 PM to 3:59 PM | 32 (2.2%) | 12 (1.2%) |
| 4:00 PM to 11:59 PM | 80 (5.4%) | 24 (2.4%) |
| Total | 1,480 (100.0%) | 1,011 (100.0%) |
Housing Occupancy in Orchard Homes
Occupancy by Ownership in Orchard Homes
Of the total 2,282 dwellings in Orchard Homes, owner-occupied units account for 1,497 (65.6%), while renter-occupied units make up 785 (34.4%).
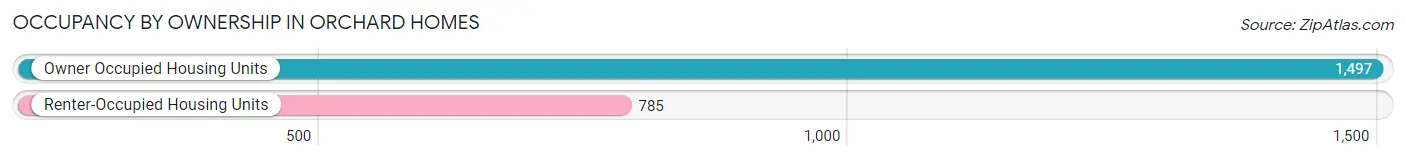
| Occupancy | # Housing Units | % Housing Units |
| Owner Occupied Housing Units | 1,497 | 65.6% |
| Renter-Occupied Housing Units | 785 | 34.4% |
| Total Occupied Housing Units | 2,282 | 100.0% |
Occupancy by Household Size in Orchard Homes
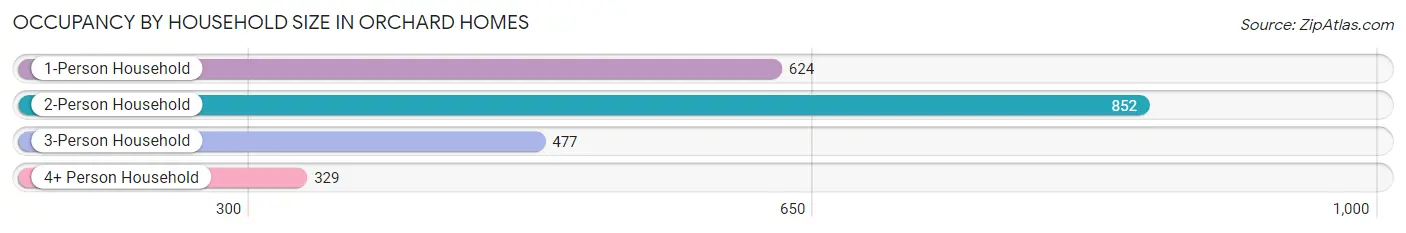
| Household Size | # Housing Units | % Housing Units |
| 1-Person Household | 624 | 27.3% |
| 2-Person Household | 852 | 37.3% |
| 3-Person Household | 477 | 20.9% |
| 4+ Person Household | 329 | 14.4% |
| Total Housing Units | 2,282 | 100.0% |
Occupancy by Ownership by Household Size in Orchard Homes
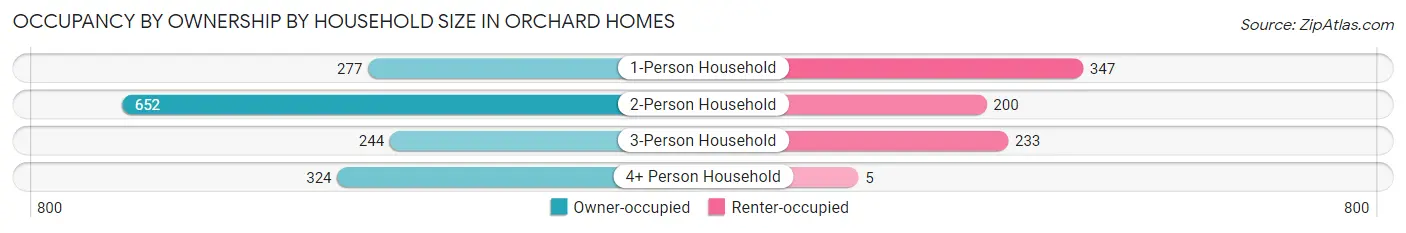
| Household Size | Owner-occupied | Renter-occupied |
| 1-Person Household | 277 (44.4%) | 347 (55.6%) |
| 2-Person Household | 652 (76.5%) | 200 (23.5%) |
| 3-Person Household | 244 (51.1%) | 233 (48.8%) |
| 4+ Person Household | 324 (98.5%) | 5 (1.5%) |
| Total Housing Units | 1,497 (65.6%) | 785 (34.4%) |
Occupancy by Educational Attainment in Orchard Homes
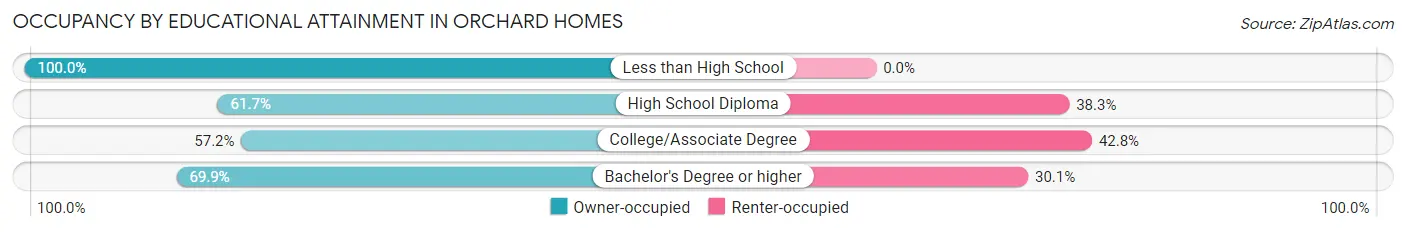
| Household Size | Owner-occupied | Renter-occupied |
| Less than High School | 80 (100.0%) | 0 (0.0%) |
| High School Diploma | 179 (61.7%) | 111 (38.3%) |
| College/Associate Degree | 444 (57.2%) | 332 (42.8%) |
| Bachelor's Degree or higher | 794 (69.9%) | 342 (30.1%) |
Occupancy by Age of Householder in Orchard Homes
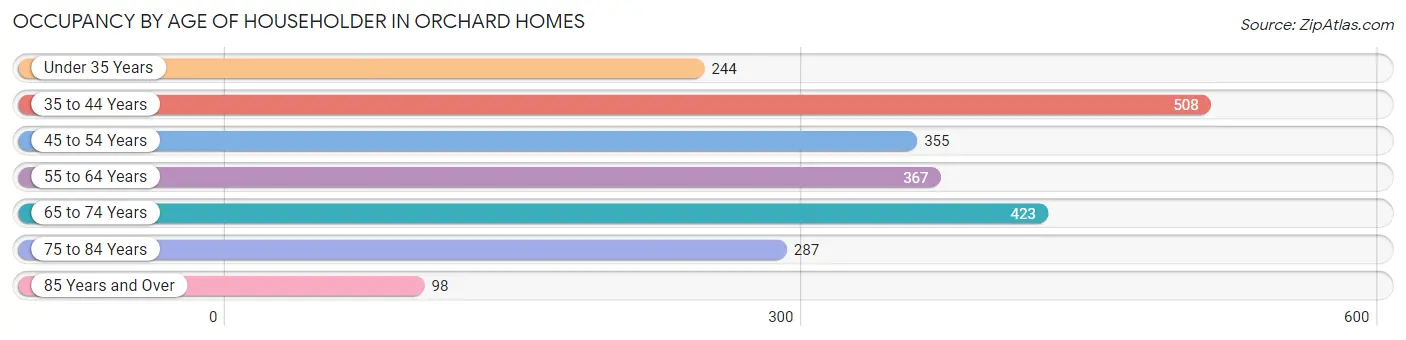
| Age Bracket | # Households | % Households |
| Under 35 Years | 244 | 10.7% |
| 35 to 44 Years | 508 | 22.3% |
| 45 to 54 Years | 355 | 15.6% |
| 55 to 64 Years | 367 | 16.1% |
| 65 to 74 Years | 423 | 18.5% |
| 75 to 84 Years | 287 | 12.6% |
| 85 Years and Over | 98 | 4.3% |
| Total | 2,282 | 100.0% |
Housing Finances in Orchard Homes
Median Income by Occupancy in Orchard Homes
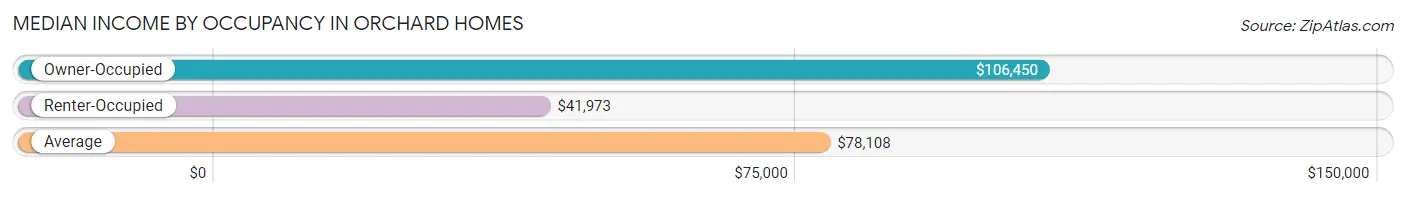
| Occupancy Type | # Households | Median Income |
| Owner-Occupied | 1,497 (65.6%) | $106,450 |
| Renter-Occupied | 785 (34.4%) | $41,973 |
| Average | 2,282 (100.0%) | $78,108 |
Occupancy by Householder Income Bracket in Orchard Homes
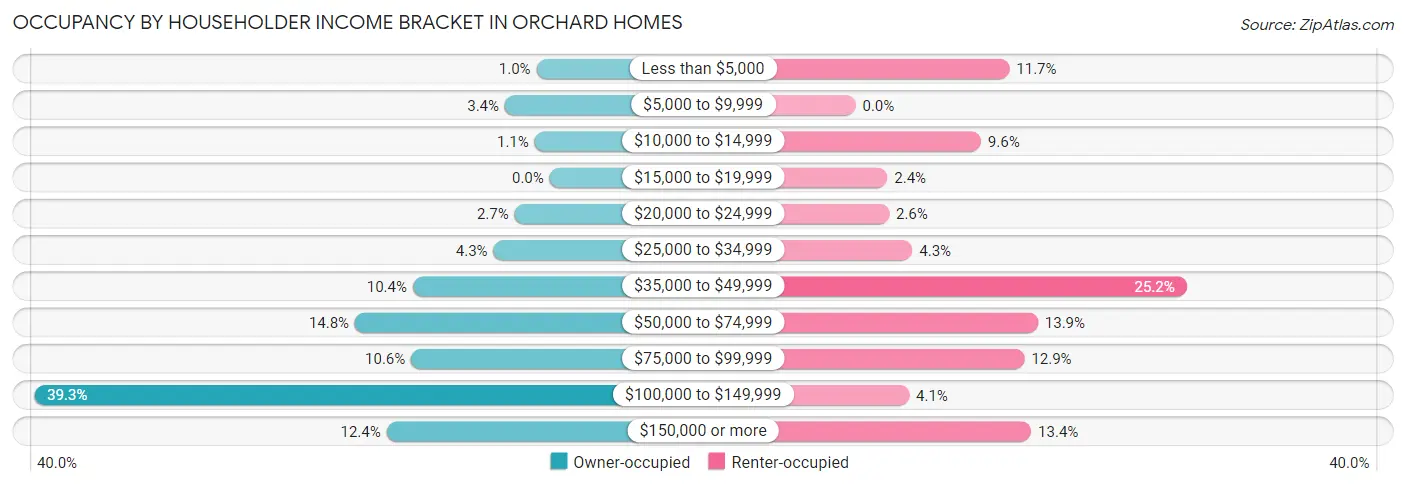
| Income Bracket | Owner-occupied | Renter-occupied |
| Less than $5,000 | 15 (1.0%) | 92 (11.7%) |
| $5,000 to $9,999 | 51 (3.4%) | 0 (0.0%) |
| $10,000 to $14,999 | 17 (1.1%) | 75 (9.6%) |
| $15,000 to $19,999 | 0 (0.0%) | 19 (2.4%) |
| $20,000 to $24,999 | 40 (2.7%) | 20 (2.5%) |
| $25,000 to $34,999 | 64 (4.3%) | 34 (4.3%) |
| $35,000 to $49,999 | 156 (10.4%) | 198 (25.2%) |
| $50,000 to $74,999 | 222 (14.8%) | 109 (13.9%) |
| $75,000 to $99,999 | 158 (10.5%) | 101 (12.9%) |
| $100,000 to $149,999 | 588 (39.3%) | 32 (4.1%) |
| $150,000 or more | 186 (12.4%) | 105 (13.4%) |
| Total | 1,497 (100.0%) | 785 (100.0%) |
Monthly Housing Cost Tiers in Orchard Homes
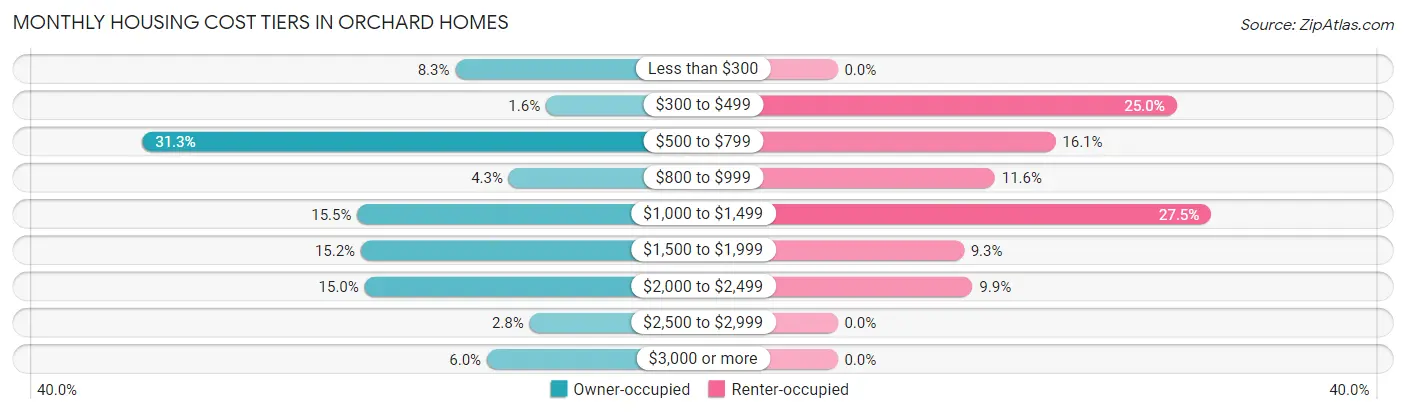
| Monthly Cost | Owner-occupied | Renter-occupied |
| Less than $300 | 124 (8.3%) | 0 (0.0%) |
| $300 to $499 | 24 (1.6%) | 196 (25.0%) |
| $500 to $799 | 469 (31.3%) | 126 (16.1%) |
| $800 to $999 | 65 (4.3%) | 91 (11.6%) |
| $1,000 to $1,499 | 232 (15.5%) | 216 (27.5%) |
| $1,500 to $1,999 | 228 (15.2%) | 73 (9.3%) |
| $2,000 to $2,499 | 224 (15.0%) | 78 (9.9%) |
| $2,500 to $2,999 | 42 (2.8%) | 0 (0.0%) |
| $3,000 or more | 89 (5.9%) | 0 (0.0%) |
| Total | 1,497 (100.0%) | 785 (100.0%) |
Physical Housing Characteristics in Orchard Homes
Housing Structures in Orchard Homes
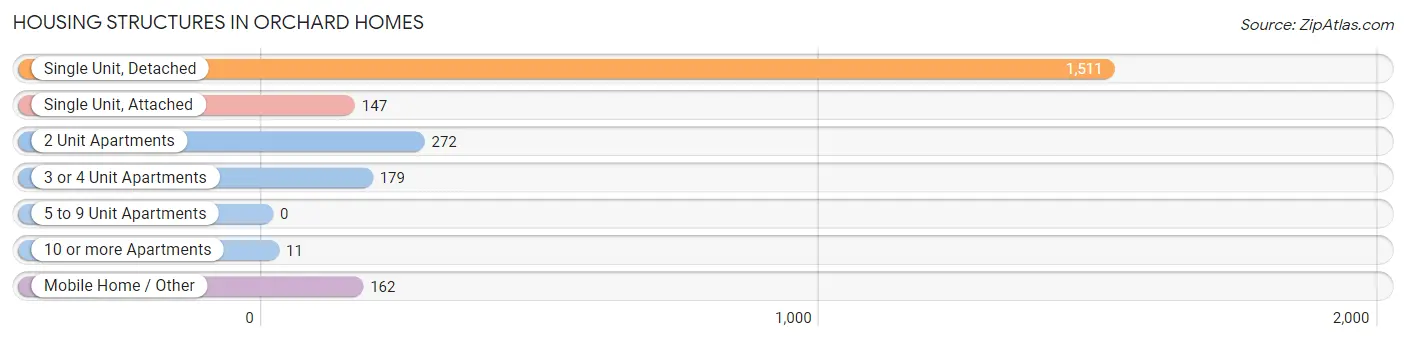
| Structure Type | # Housing Units | % Housing Units |
| Single Unit, Detached | 1,511 | 66.2% |
| Single Unit, Attached | 147 | 6.4% |
| 2 Unit Apartments | 272 | 11.9% |
| 3 or 4 Unit Apartments | 179 | 7.8% |
| 5 to 9 Unit Apartments | 0 | 0.0% |
| 10 or more Apartments | 11 | 0.5% |
| Mobile Home / Other | 162 | 7.1% |
| Total | 2,282 | 100.0% |
Housing Structures by Occupancy in Orchard Homes
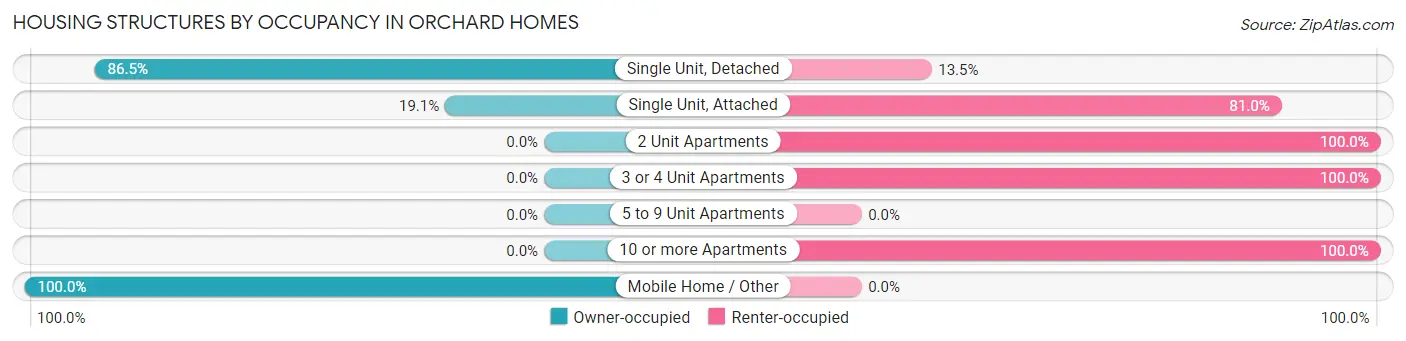
| Structure Type | Owner-occupied | Renter-occupied |
| Single Unit, Detached | 1,307 (86.5%) | 204 (13.5%) |
| Single Unit, Attached | 28 (19.1%) | 119 (80.9%) |
| 2 Unit Apartments | 0 (0.0%) | 272 (100.0%) |
| 3 or 4 Unit Apartments | 0 (0.0%) | 179 (100.0%) |
| 5 to 9 Unit Apartments | 0 (0.0%) | 0 (0.0%) |
| 10 or more Apartments | 0 (0.0%) | 11 (100.0%) |
| Mobile Home / Other | 162 (100.0%) | 0 (0.0%) |
| Total | 1,497 (65.6%) | 785 (34.4%) |
Housing Structures by Number of Rooms in Orchard Homes
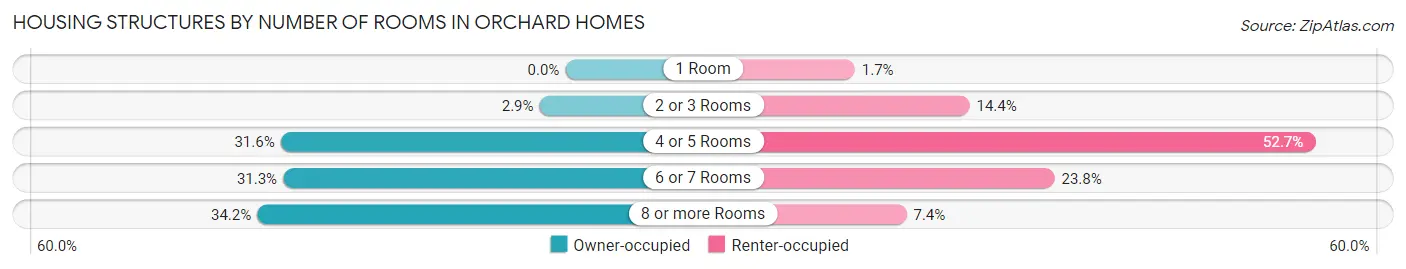
| Number of Rooms | Owner-occupied | Renter-occupied |
| 1 Room | 0 (0.0%) | 13 (1.7%) |
| 2 or 3 Rooms | 43 (2.9%) | 113 (14.4%) |
| 4 or 5 Rooms | 473 (31.6%) | 414 (52.7%) |
| 6 or 7 Rooms | 469 (31.3%) | 187 (23.8%) |
| 8 or more Rooms | 512 (34.2%) | 58 (7.4%) |
| Total | 1,497 (100.0%) | 785 (100.0%) |
Housing Structure by Heating Type in Orchard Homes
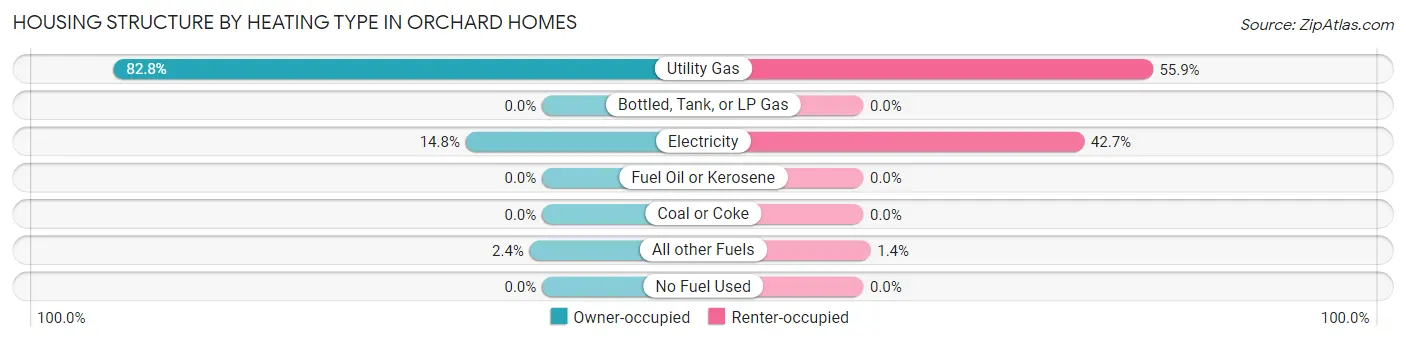
| Heating Type | Owner-occupied | Renter-occupied |
| Utility Gas | 1,240 (82.8%) | 439 (55.9%) |
| Bottled, Tank, or LP Gas | 0 (0.0%) | 0 (0.0%) |
| Electricity | 221 (14.8%) | 335 (42.7%) |
| Fuel Oil or Kerosene | 0 (0.0%) | 0 (0.0%) |
| Coal or Coke | 0 (0.0%) | 0 (0.0%) |
| All other Fuels | 36 (2.4%) | 11 (1.4%) |
| No Fuel Used | 0 (0.0%) | 0 (0.0%) |
| Total | 1,497 (100.0%) | 785 (100.0%) |
Household Vehicle Usage in Orchard Homes
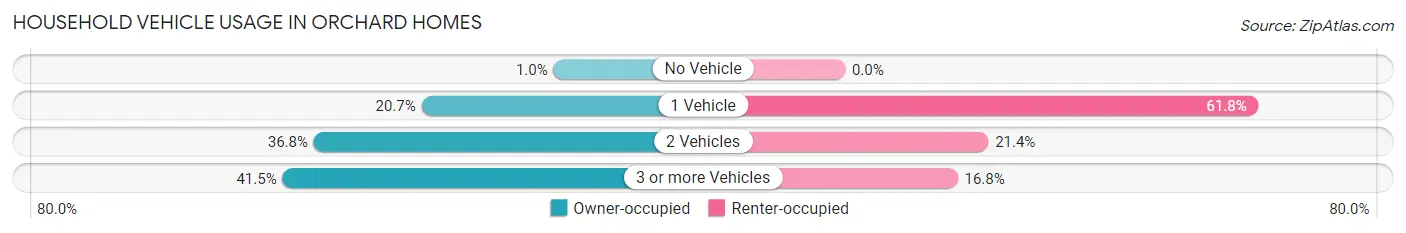
| Vehicles per Household | Owner-occupied | Renter-occupied |
| No Vehicle | 15 (1.0%) | 0 (0.0%) |
| 1 Vehicle | 310 (20.7%) | 485 (61.8%) |
| 2 Vehicles | 551 (36.8%) | 168 (21.4%) |
| 3 or more Vehicles | 621 (41.5%) | 132 (16.8%) |
| Total | 1,497 (100.0%) | 785 (100.0%) |
Real Estate & Mortgages in Orchard Homes
Real Estate and Mortgage Overview in Orchard Homes
| Characteristic | Without Mortgage | With Mortgage |
| Housing Units | 633 | 864 |
| Median Property Value | $385,500 | $435,400 |
| Median Household Income | $68,375 | $131 |
| Monthly Housing Costs | $613 | $89 |
| Real Estate Taxes | $3,632 | $18 |
Property Value by Mortgage Status in Orchard Homes
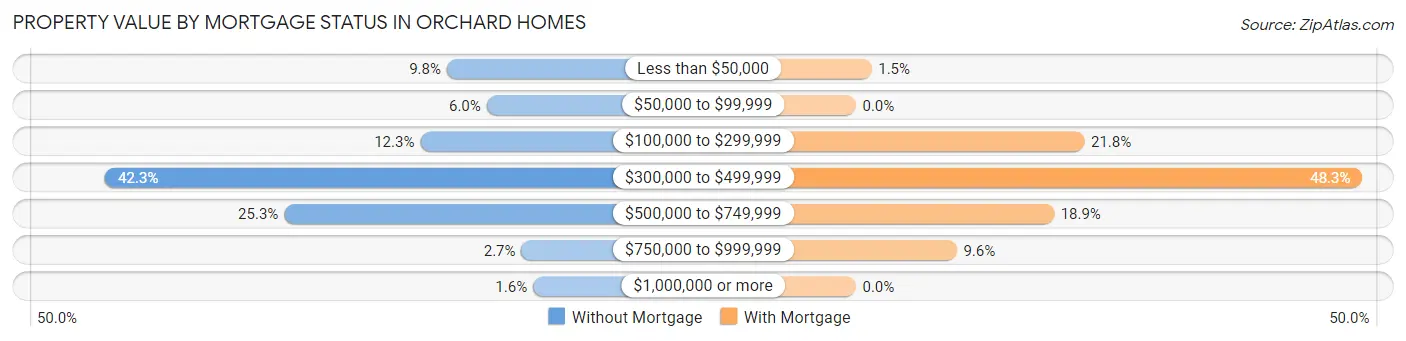
| Property Value | Without Mortgage | With Mortgage |
| Less than $50,000 | 62 (9.8%) | 13 (1.5%) |
| $50,000 to $99,999 | 38 (6.0%) | 0 (0.0%) |
| $100,000 to $299,999 | 78 (12.3%) | 188 (21.8%) |
| $300,000 to $499,999 | 268 (42.3%) | 417 (48.3%) |
| $500,000 to $749,999 | 160 (25.3%) | 163 (18.9%) |
| $750,000 to $999,999 | 17 (2.7%) | 83 (9.6%) |
| $1,000,000 or more | 10 (1.6%) | 0 (0.0%) |
| Total | 633 (100.0%) | 864 (100.0%) |
Household Income by Mortgage Status in Orchard Homes
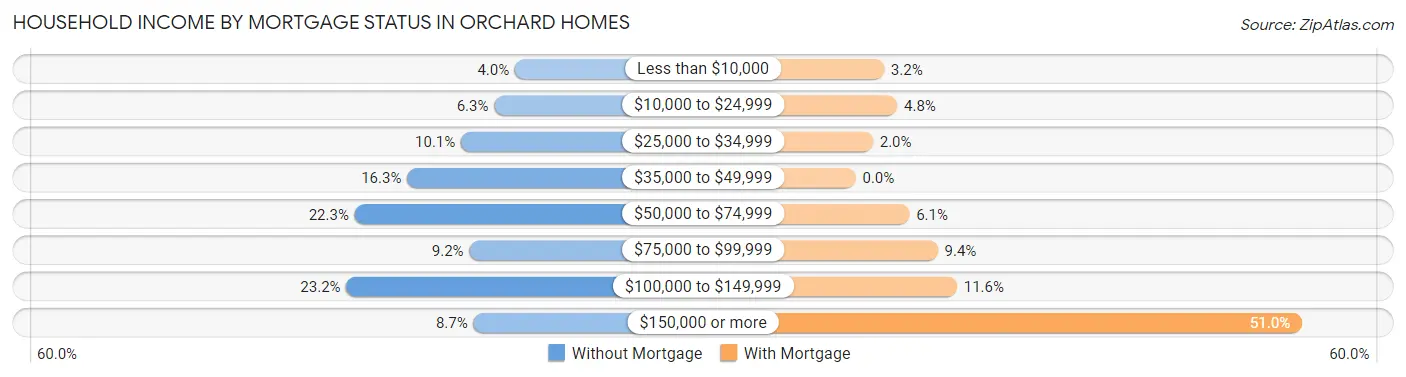
| Household Income | Without Mortgage | With Mortgage |
| Less than $10,000 | 25 (4.0%) | 28 (3.2%) |
| $10,000 to $24,999 | 40 (6.3%) | 41 (4.8%) |
| $25,000 to $34,999 | 64 (10.1%) | 17 (2.0%) |
| $35,000 to $49,999 | 103 (16.3%) | 0 (0.0%) |
| $50,000 to $74,999 | 141 (22.3%) | 53 (6.1%) |
| $75,000 to $99,999 | 58 (9.2%) | 81 (9.4%) |
| $100,000 to $149,999 | 147 (23.2%) | 100 (11.6%) |
| $150,000 or more | 55 (8.7%) | 441 (51.0%) |
| Total | 633 (100.0%) | 864 (100.0%) |
Property Value to Household Income Ratio in Orchard Homes
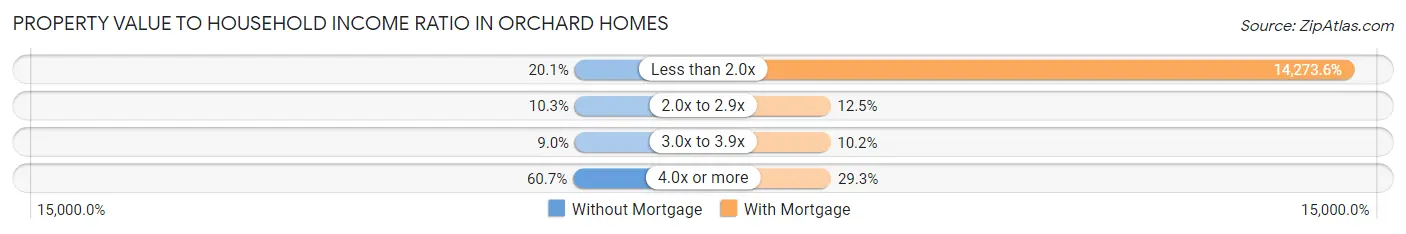
| Value-to-Income Ratio | Without Mortgage | With Mortgage |
| Less than 2.0x | 127 (20.1%) | 123,324 (14,273.6%) |
| 2.0x to 2.9x | 65 (10.3%) | 108 (12.5%) |
| 3.0x to 3.9x | 57 (9.0%) | 88 (10.2%) |
| 4.0x or more | 384 (60.7%) | 253 (29.3%) |
| Total | 633 (100.0%) | 864 (100.0%) |
Real Estate Taxes by Mortgage Status in Orchard Homes
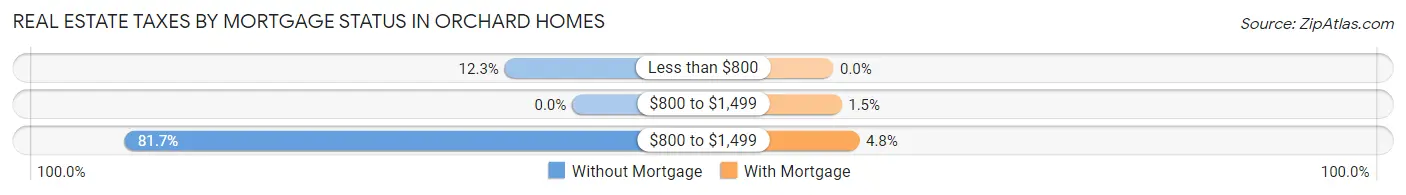
| Property Taxes | Without Mortgage | With Mortgage |
| Less than $800 | 78 (12.3%) | 0 (0.0%) |
| $800 to $1,499 | 0 (0.0%) | 13 (1.5%) |
| $800 to $1,499 | 517 (81.7%) | 41 (4.8%) |
| Total | 633 (100.0%) | 864 (100.0%) |
Health & Disability in Orchard Homes
Health Insurance Coverage by Age in Orchard Homes
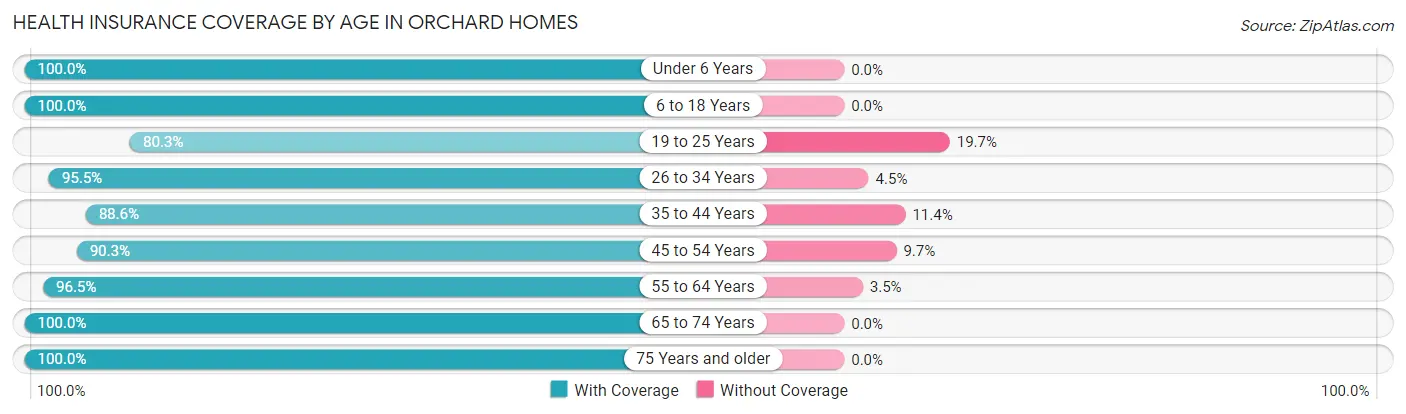
| Age Bracket | With Coverage | Without Coverage |
| Under 6 Years | 455 (100.0%) | 0 (0.0%) |
| 6 to 18 Years | 499 (100.0%) | 0 (0.0%) |
| 19 to 25 Years | 343 (80.3%) | 84 (19.7%) |
| 26 to 34 Years | 421 (95.5%) | 20 (4.5%) |
| 35 to 44 Years | 745 (88.6%) | 96 (11.4%) |
| 45 to 54 Years | 529 (90.3%) | 57 (9.7%) |
| 55 to 64 Years | 726 (96.5%) | 26 (3.5%) |
| 65 to 74 Years | 656 (100.0%) | 0 (0.0%) |
| 75 Years and older | 598 (100.0%) | 0 (0.0%) |
| Total | 4,972 (94.6%) | 283 (5.4%) |
Health Insurance Coverage by Citizenship Status in Orchard Homes
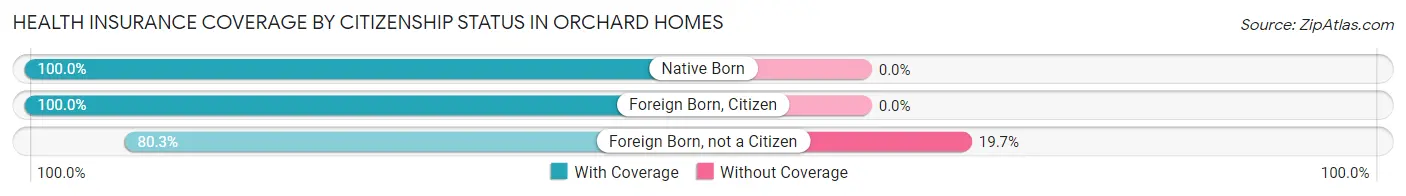
| Citizenship Status | With Coverage | Without Coverage |
| Native Born | 455 (100.0%) | 0 (0.0%) |
| Foreign Born, Citizen | 499 (100.0%) | 0 (0.0%) |
| Foreign Born, not a Citizen | 343 (80.3%) | 84 (19.7%) |
Health Insurance Coverage by Household Income in Orchard Homes
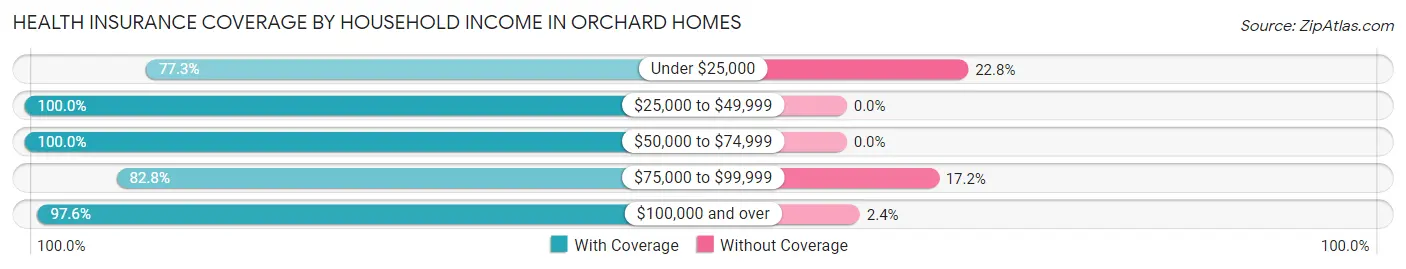
| Household Income | With Coverage | Without Coverage |
| Under $25,000 | 275 (77.2%) | 81 (22.8%) |
| $25,000 to $49,999 | 663 (100.0%) | 0 (0.0%) |
| $50,000 to $74,999 | 713 (100.0%) | 0 (0.0%) |
| $75,000 to $99,999 | 495 (82.8%) | 103 (17.2%) |
| $100,000 and over | 2,801 (97.6%) | 70 (2.4%) |
Public vs Private Health Insurance Coverage by Age in Orchard Homes
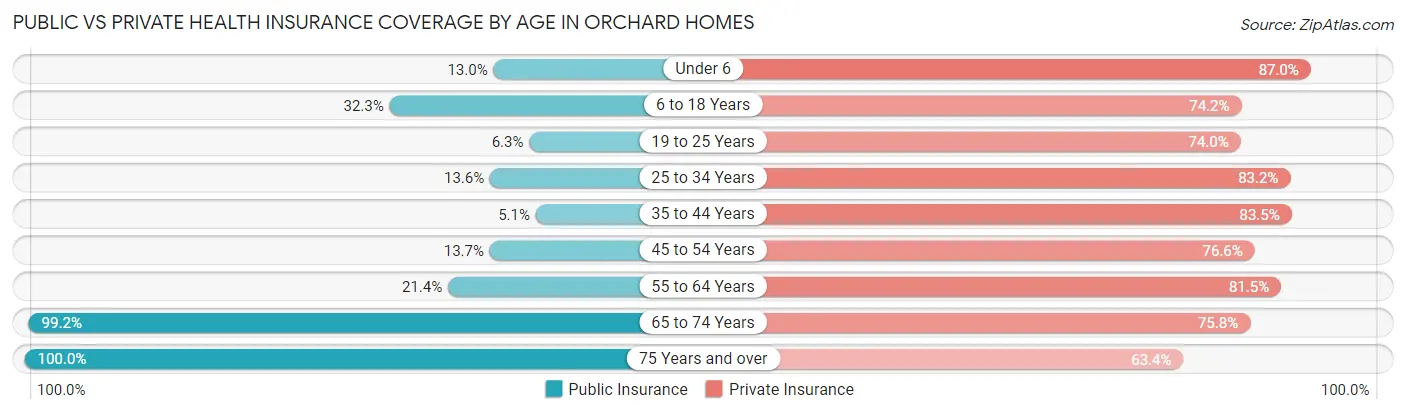
| Age Bracket | Public Insurance | Private Insurance |
| Under 6 | 59 (13.0%) | 396 (87.0%) |
| 6 to 18 Years | 161 (32.3%) | 370 (74.2%) |
| 19 to 25 Years | 27 (6.3%) | 316 (74.0%) |
| 25 to 34 Years | 60 (13.6%) | 367 (83.2%) |
| 35 to 44 Years | 43 (5.1%) | 702 (83.5%) |
| 45 to 54 Years | 80 (13.7%) | 449 (76.6%) |
| 55 to 64 Years | 161 (21.4%) | 613 (81.5%) |
| 65 to 74 Years | 651 (99.2%) | 497 (75.8%) |
| 75 Years and over | 598 (100.0%) | 379 (63.4%) |
| Total | 1,840 (35.0%) | 4,089 (77.8%) |
Disability Status by Sex by Age in Orchard Homes
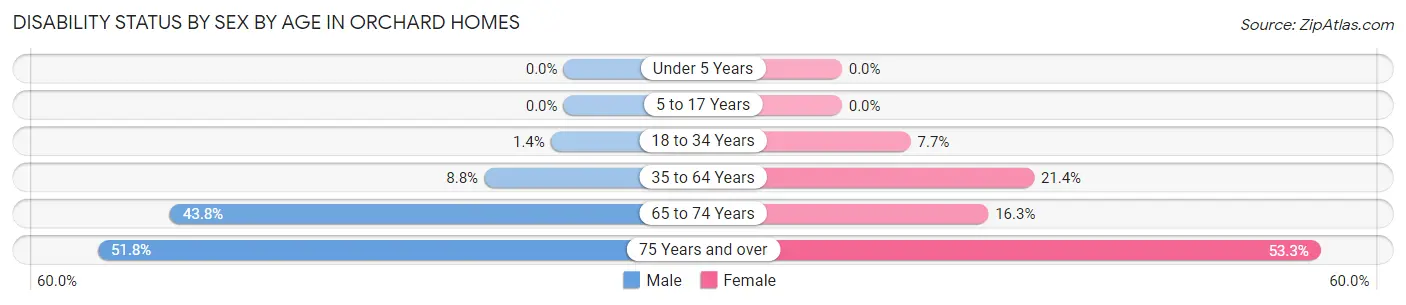
| Age Bracket | Male | Female |
| Under 5 Years | 0 (0.0%) | 0 (0.0%) |
| 5 to 17 Years | 0 (0.0%) | 0 (0.0%) |
| 18 to 34 Years | 6 (1.4%) | 40 (7.7%) |
| 35 to 64 Years | 103 (8.8%) | 217 (21.4%) |
| 65 to 74 Years | 145 (43.8%) | 53 (16.3%) |
| 75 Years and over | 170 (51.8%) | 144 (53.3%) |
Disability Class by Sex by Age in Orchard Homes
Disability Class: Hearing Difficulty
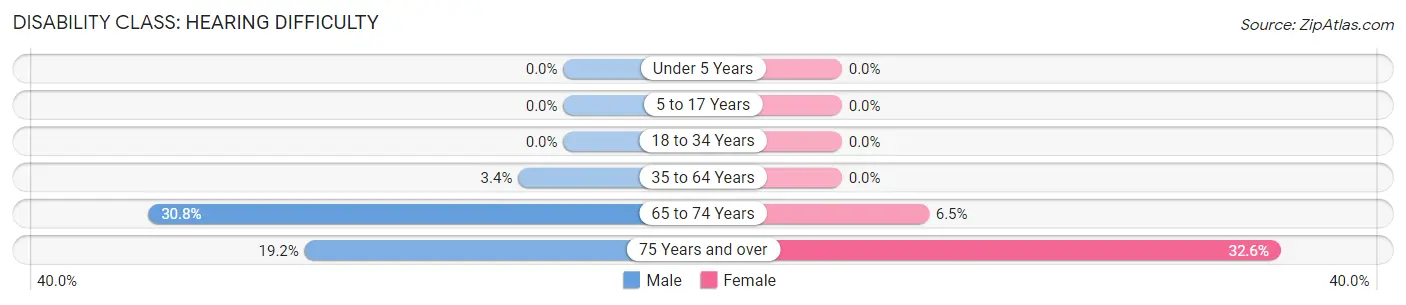
| Age Bracket | Male | Female |
| Under 5 Years | 0 (0.0%) | 0 (0.0%) |
| 5 to 17 Years | 0 (0.0%) | 0 (0.0%) |
| 18 to 34 Years | 0 (0.0%) | 0 (0.0%) |
| 35 to 64 Years | 39 (3.4%) | 0 (0.0%) |
| 65 to 74 Years | 102 (30.8%) | 21 (6.5%) |
| 75 Years and over | 63 (19.2%) | 88 (32.6%) |
Disability Class: Vision Difficulty
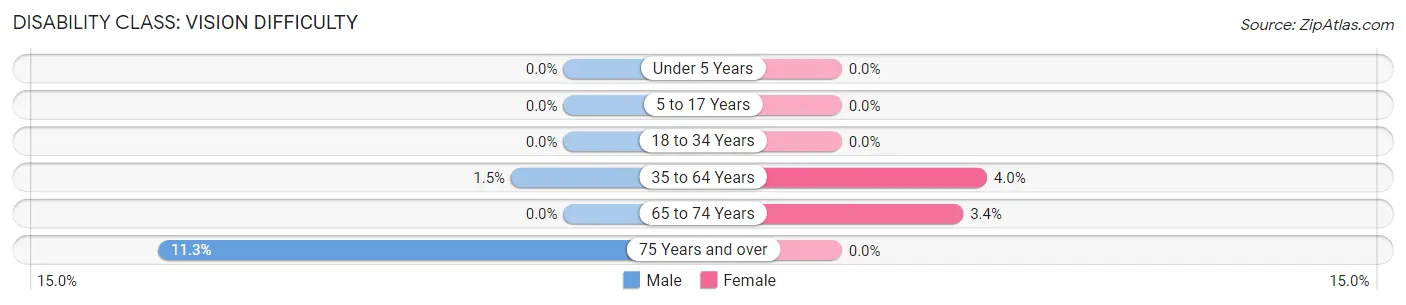
| Age Bracket | Male | Female |
| Under 5 Years | 0 (0.0%) | 0 (0.0%) |
| 5 to 17 Years | 0 (0.0%) | 0 (0.0%) |
| 18 to 34 Years | 0 (0.0%) | 0 (0.0%) |
| 35 to 64 Years | 17 (1.5%) | 41 (4.0%) |
| 65 to 74 Years | 0 (0.0%) | 11 (3.4%) |
| 75 Years and over | 37 (11.3%) | 0 (0.0%) |
Disability Class: Cognitive Difficulty
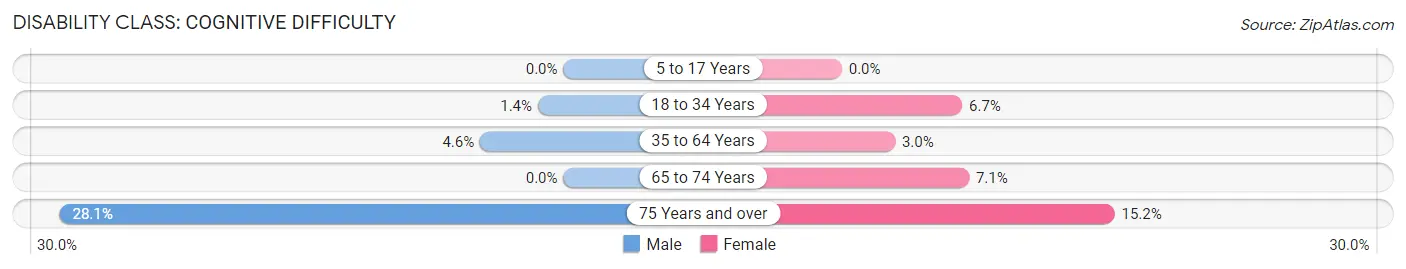
| Age Bracket | Male | Female |
| 5 to 17 Years | 0 (0.0%) | 0 (0.0%) |
| 18 to 34 Years | 6 (1.4%) | 35 (6.7%) |
| 35 to 64 Years | 54 (4.6%) | 30 (3.0%) |
| 65 to 74 Years | 0 (0.0%) | 23 (7.1%) |
| 75 Years and over | 92 (28.1%) | 41 (15.2%) |
Disability Class: Ambulatory Difficulty
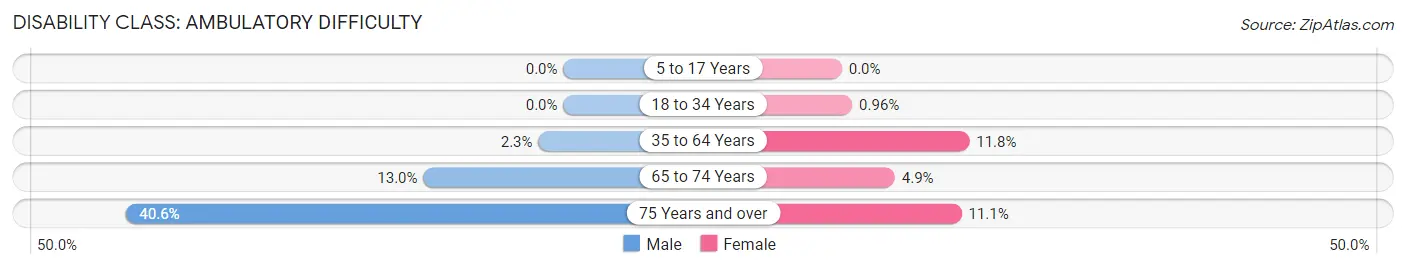
| Age Bracket | Male | Female |
| 5 to 17 Years | 0 (0.0%) | 0 (0.0%) |
| 18 to 34 Years | 0 (0.0%) | 5 (1.0%) |
| 35 to 64 Years | 27 (2.3%) | 120 (11.8%) |
| 65 to 74 Years | 43 (13.0%) | 16 (4.9%) |
| 75 Years and over | 133 (40.6%) | 30 (11.1%) |
Disability Class: Self-Care Difficulty
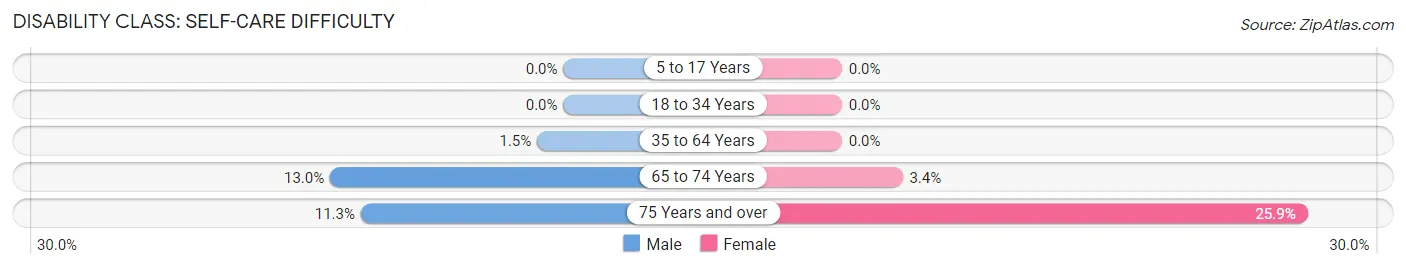
| Age Bracket | Male | Female |
| 5 to 17 Years | 0 (0.0%) | 0 (0.0%) |
| 18 to 34 Years | 0 (0.0%) | 0 (0.0%) |
| 35 to 64 Years | 17 (1.5%) | 0 (0.0%) |
| 65 to 74 Years | 43 (13.0%) | 11 (3.4%) |
| 75 Years and over | 37 (11.3%) | 70 (25.9%) |
Technology Access in Orchard Homes
Computing Device Access in Orchard Homes
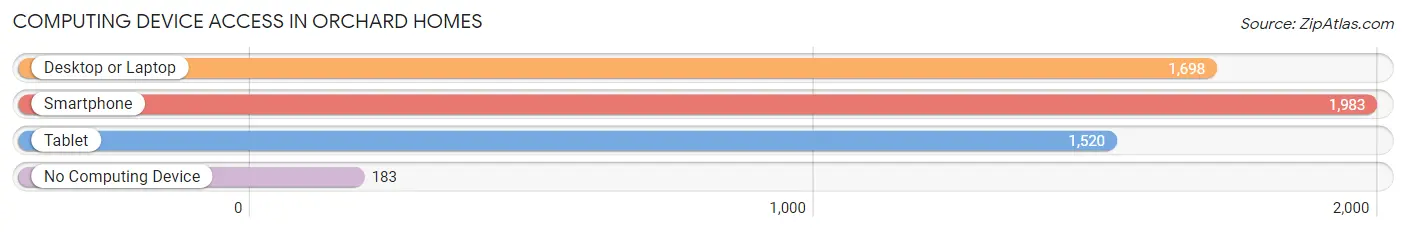
| Device Type | # Households | % Households |
| Desktop or Laptop | 1,698 | 74.4% |
| Smartphone | 1,983 | 86.9% |
| Tablet | 1,520 | 66.6% |
| No Computing Device | 183 | 8.0% |
| Total | 2,282 | 100.0% |
Internet Access in Orchard Homes
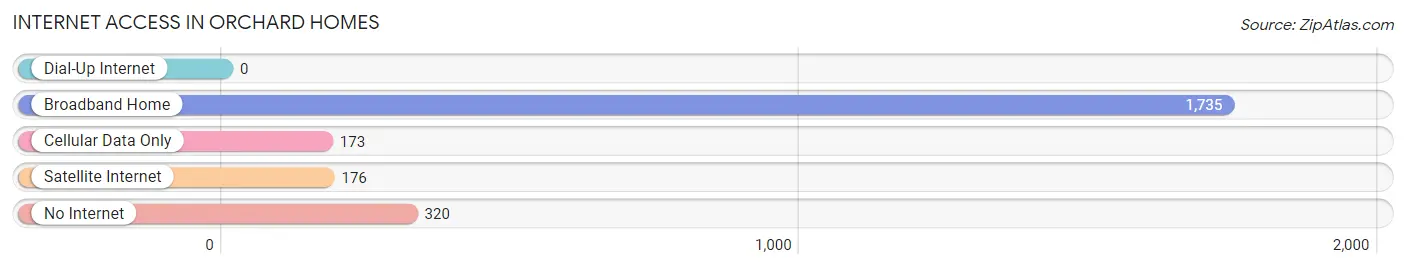
| Internet Type | # Households | % Households |
| Dial-Up Internet | 0 | 0.0% |
| Broadband Home | 1,735 | 76.0% |
| Cellular Data Only | 173 | 7.6% |
| Satellite Internet | 176 | 7.7% |
| No Internet | 320 | 14.0% |
| Total | 2,282 | 100.0% |
Orchard Homes Summary
Orchard Homes is a census-designated place (CDP) located in Missoula County, Montana. It is situated in the western part of the state, approximately 8 miles northwest of the city of Missoula. As of the 2010 census, the population of Orchard Homes was 1,845.
Geography
Orchard Homes is located at an elevation of 3,400 feet above sea level. It is situated in the western part of the state, approximately 8 miles northwest of the city of Missoula. The CDP has a total area of 4.2 square miles, all of which is land. The terrain is mostly flat, with some rolling hills. The area is surrounded by forests and is home to a variety of wildlife, including deer, elk, and moose.
History
The area that is now Orchard Homes was first settled in the late 1800s by homesteaders. The community was originally known as "Orchard Home," and was named after the many apple orchards that were planted in the area. The first post office was established in the area in 1891.
In the early 1900s, the area began to grow and develop. The first school was built in 1910, and the first church was built in 1912. The community was officially incorporated as a town in 1914.
In the 1950s, the area began to experience rapid growth. The population increased from just over 500 in 1950 to over 1,000 by 1960. The population has continued to grow since then, and as of the 2010 census, the population of Orchard Homes was 1,845.
Economy
The economy of Orchard Homes is largely based on agriculture and tourism. The area is home to several apple orchards, as well as other fruit and vegetable farms. The area also has several wineries and breweries, which attract tourists from all over the state.
In addition to agriculture and tourism, Orchard Homes is home to several small businesses, including restaurants, retail stores, and service providers. The area also has several manufacturing companies, which provide jobs for local residents.
Demographics
As of the 2010 census, the population of Orchard Homes was 1,845. The racial makeup of the CDP was 94.3% White, 0.7% African American, 0.7% Native American, 0.7% Asian, 0.2% Pacific Islander, 1.2% from other races, and 2.1% from two or more races. Hispanic or Latino of any race were 3.2% of the population.
The median household income in Orchard Homes was $45,938, and the median family income was $50,938. The per capita income was $20,938. About 8.3% of families and 10.3% of the population were below the poverty line, including 14.3% of those under age 18 and 5.3% of those age 65 or over.
Common Questions
What is Per Capita Income in Orchard Homes?
Per Capita income in Orchard Homes is $42,427.
What is the Median Family Income in Orchard Homes?
Median Family Income in Orchard Homes is $114,602.
What is the Median Household income in Orchard Homes?
Median Household Income in Orchard Homes is $78,108.
What is Income or Wage Gap in Orchard Homes?
Income or Wage Gap in Orchard Homes is 26.2%.
Women in Orchard Homes earn 73.8 cents for every dollar earned by a man.
What is Inequality or Gini Index in Orchard Homes?
Inequality or Gini Index in Orchard Homes is 0.44.
What is the Total Population of Orchard Homes?
Total Population of Orchard Homes is 5,265.
What is the Total Male Population of Orchard Homes?
Total Male Population of Orchard Homes is 2,766.
What is the Total Female Population of Orchard Homes?
Total Female Population of Orchard Homes is 2,499.
What is the Ratio of Males per 100 Females in Orchard Homes?
There are 110.68 Males per 100 Females in Orchard Homes.
What is the Ratio of Females per 100 Males in Orchard Homes?
There are 90.35 Females per 100 Males in Orchard Homes.
What is the Median Population Age in Orchard Homes?
Median Population Age in Orchard Homes is 44.2 Years.
What is the Average Family Size in Orchard Homes
Average Family Size in Orchard Homes is 2.8 People.
What is the Average Household Size in Orchard Homes
Average Household Size in Orchard Homes is 2.3 People.
How Large is the Labor Force in Orchard Homes?
There are 2,815 People in the Labor Forcein in Orchard Homes.
What is the Percentage of People in the Labor Force in Orchard Homes?
62.8% of People are in the Labor Force in Orchard Homes.
What is the Unemployment Rate in Orchard Homes?
Unemployment Rate in Orchard Homes is 5.9%.