Roosevelt County, MT Map & Demographics
Roosevelt County Map
Roosevelt County Overview
$20,564
PER CAPITA INCOME
$60,457
AVG FAMILY INCOME
$51,038
AVG HOUSEHOLD INCOME
12.3%
WAGE / INCOME GAP [ % ]
87.7¢/ $1
WAGE / INCOME GAP [ $ ]
$11,559
FAMILY INCOME DEFICIT
0.45
INEQUALITY / GINI INDEX
10,799
TOTAL POPULATION
5,464
MALE POPULATION
5,335
FEMALE POPULATION
102.42
MALES / 100 FEMALES
97.64
FEMALES / 100 MALES
30.4
MEDIAN AGE
4.8
AVG FAMILY SIZE
3.5
AVG HOUSEHOLD SIZE
4,028
LABOR FORCE [ PEOPLE ]
53.2%
PERCENT IN LABOR FORCE
8.6%
UNEMPLOYMENT RATE
Roosevelt County Area Codes
Income in Roosevelt County
Income Overview in Roosevelt County
Per Capita Income in Roosevelt County is $20,564, while median incomes of families and households are $60,457 and $51,038 respectively.
| Characteristic | Number | Measure |
| Per Capita Income | 10,799 | $20,564 |
| Median Family Income | 1,771 | $60,457 |
| Mean Family Income | 1,771 | $72,439 |
| Median Household Income | 3,050 | $51,038 |
| Mean Household Income | 3,050 | $61,485 |
| Income Deficit | 1,771 | $11,559 |
| Wage / Income Gap (%) | 10,799 | 12.34% |
| Wage / Income Gap ($) | 10,799 | 87.66¢ per $1 |
| Gini / Inequality Index | 10,799 | 0.45 |
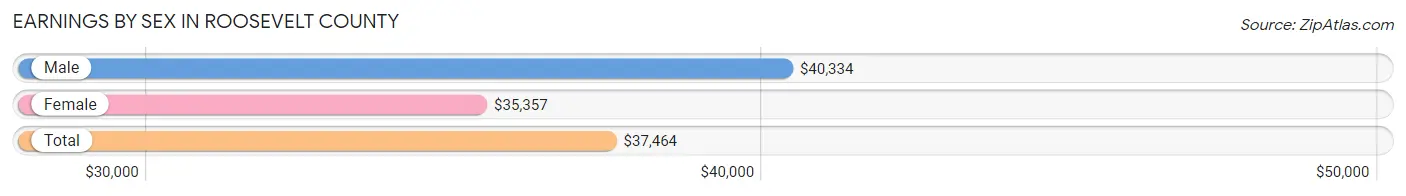
Earnings by Sex in Roosevelt County
Average Earnings in Roosevelt County are $37,464, $40,334 for men and $35,357 for women, a difference of 12.3%.
| Sex | Number | Average Earnings |
| Male | 2,139 (52.4%) | $40,334 |
| Female | 1,946 (47.6%) | $35,357 |
| Total | 4,085 (100.0%) | $37,464 |
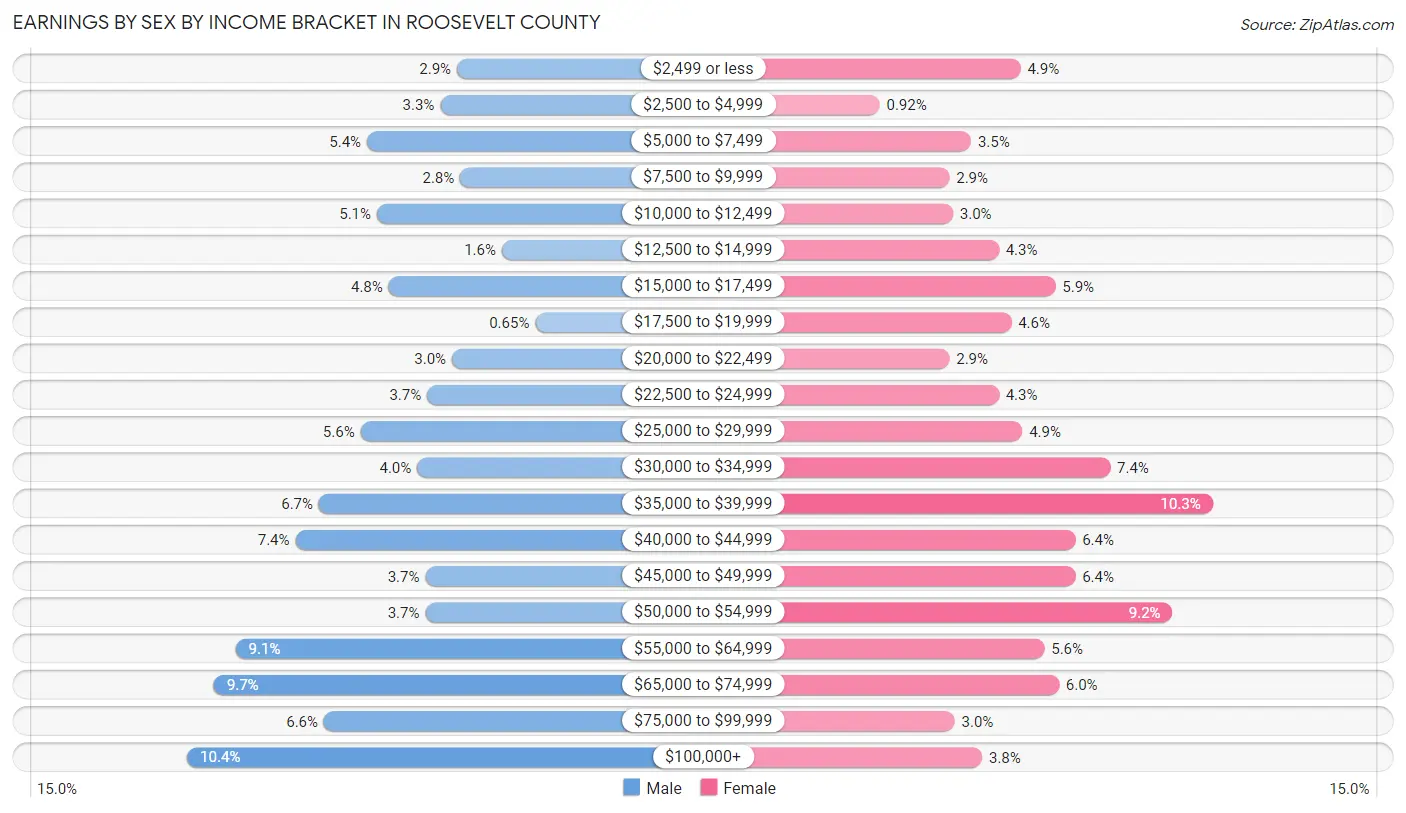
Earnings by Sex by Income Bracket in Roosevelt County
The most common earnings brackets in Roosevelt County are $100,000+ for men (223 | 10.4%) and $35,000 to $39,999 for women (200 | 10.3%).
| Income | Male | Female |
| $2,499 or less | 61 (2.9%) | 95 (4.9%) |
| $2,500 to $4,999 | 71 (3.3%) | 18 (0.9%) |
| $5,000 to $7,499 | 115 (5.4%) | 68 (3.5%) |
| $7,500 to $9,999 | 59 (2.8%) | 56 (2.9%) |
| $10,000 to $12,499 | 109 (5.1%) | 58 (3.0%) |
| $12,500 to $14,999 | 34 (1.6%) | 83 (4.3%) |
| $15,000 to $17,499 | 102 (4.8%) | 114 (5.9%) |
| $17,500 to $19,999 | 14 (0.6%) | 90 (4.6%) |
| $20,000 to $22,499 | 64 (3.0%) | 56 (2.9%) |
| $22,500 to $24,999 | 79 (3.7%) | 83 (4.3%) |
| $25,000 to $29,999 | 119 (5.6%) | 96 (4.9%) |
| $30,000 to $34,999 | 85 (4.0%) | 144 (7.4%) |
| $35,000 to $39,999 | 144 (6.7%) | 200 (10.3%) |
| $40,000 to $44,999 | 158 (7.4%) | 125 (6.4%) |
| $45,000 to $49,999 | 80 (3.7%) | 125 (6.4%) |
| $50,000 to $54,999 | 80 (3.7%) | 178 (9.1%) |
| $55,000 to $64,999 | 194 (9.1%) | 108 (5.6%) |
| $65,000 to $74,999 | 207 (9.7%) | 116 (6.0%) |
| $75,000 to $99,999 | 141 (6.6%) | 59 (3.0%) |
| $100,000+ | 223 (10.4%) | 74 (3.8%) |
| Total | 2,139 (100.0%) | 1,946 (100.0%) |
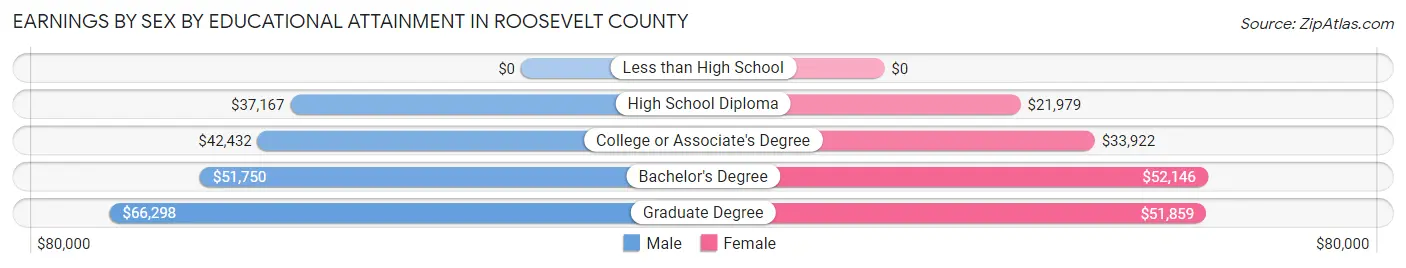
Earnings by Sex by Educational Attainment in Roosevelt County
Average earnings in Roosevelt County are $43,969 for men and $37,528 for women, a difference of 14.6%. Men with an educational attainment of graduate degree enjoy the highest average annual earnings of $66,298, while those with high school diploma education earn the least with $37,167. Women with an educational attainment of bachelor's degree earn the most with the average annual earnings of $52,146, while those with high school diploma education have the smallest earnings of $21,979.
| Educational Attainment | Male Income | Female Income |
| Less than High School | - | - |
| High School Diploma | $37,167 | $21,979 |
| College or Associate's Degree | $42,432 | $33,922 |
| Bachelor's Degree | $51,750 | $52,146 |
| Graduate Degree | $66,298 | $51,859 |
| Total | $43,969 | $37,528 |
Family Income in Roosevelt County
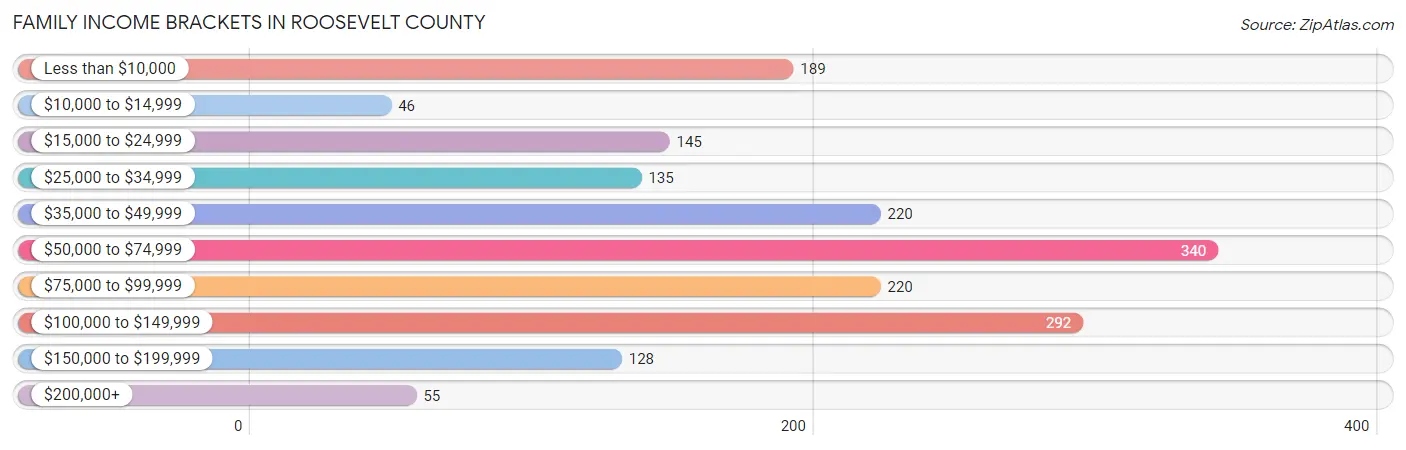
Family Income Brackets in Roosevelt County
According to the Roosevelt County family income data, there are 340 families falling into the $50,000 to $74,999 income range, which is the most common income bracket and makes up 19.2% of all families. Conversely, the $10,000 to $14,999 income bracket is the least frequent group with only 46 families (2.6%) belonging to this category.
| Income Bracket | # Families | % Families |
| Less than $10,000 | 189 | 10.7% |
| $10,000 to $14,999 | 46 | 2.6% |
| $15,000 to $24,999 | 145 | 8.2% |
| $25,000 to $34,999 | 135 | 7.6% |
| $35,000 to $49,999 | 220 | 12.4% |
| $50,000 to $74,999 | 340 | 19.2% |
| $75,000 to $99,999 | 220 | 12.4% |
| $100,000 to $149,999 | 292 | 16.5% |
| $150,000 to $199,999 | 128 | 7.2% |
| $200,000+ | 55 | 3.1% |
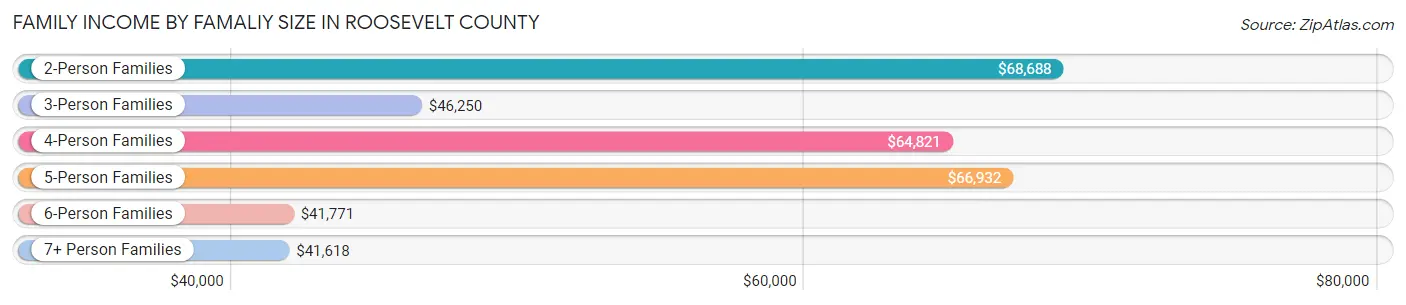
Family Income by Famaliy Size in Roosevelt County
2-person families (728 | 41.1%) account for the highest median family income in Roosevelt County with $68,688 per family, while 2-person families (728 | 41.1%) have the highest median income of $34,344 per family member.
| Income Bracket | # Families | Median Income |
| 2-Person Families | 728 (41.1%) | $68,688 |
| 3-Person Families | 360 (20.3%) | $46,250 |
| 4-Person Families | 277 (15.6%) | $64,821 |
| 5-Person Families | 259 (14.6%) | $66,932 |
| 6-Person Families | 97 (5.5%) | $41,771 |
| 7+ Person Families | 50 (2.8%) | $41,618 |
| Total | 1,771 (100.0%) | $60,457 |
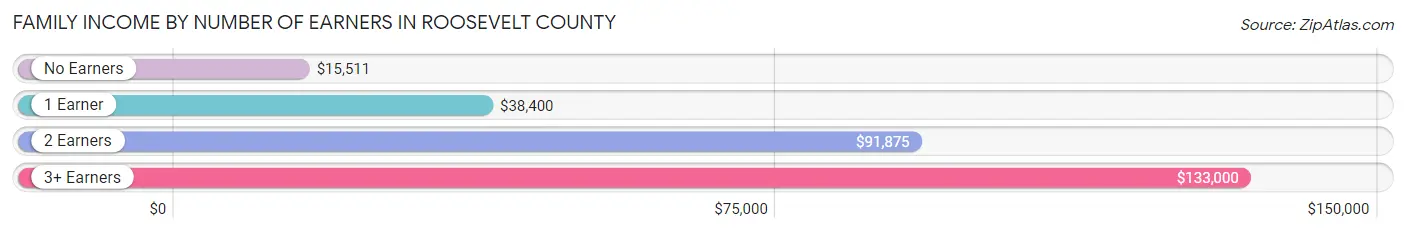
Family Income by Number of Earners in Roosevelt County
The median family income in Roosevelt County is $60,457, with families comprising 3+ earners (106) having the highest median family income of $133,000, while families with no earners (305) have the lowest median family income of $15,511, accounting for 6.0% and 17.2% of families, respectively.
| Number of Earners | # Families | Median Income |
| No Earners | 305 (17.2%) | $15,511 |
| 1 Earner | 654 (36.9%) | $38,400 |
| 2 Earners | 706 (39.9%) | $91,875 |
| 3+ Earners | 106 (6.0%) | $133,000 |
| Total | 1,771 (100.0%) | $60,457 |
Household Income in Roosevelt County
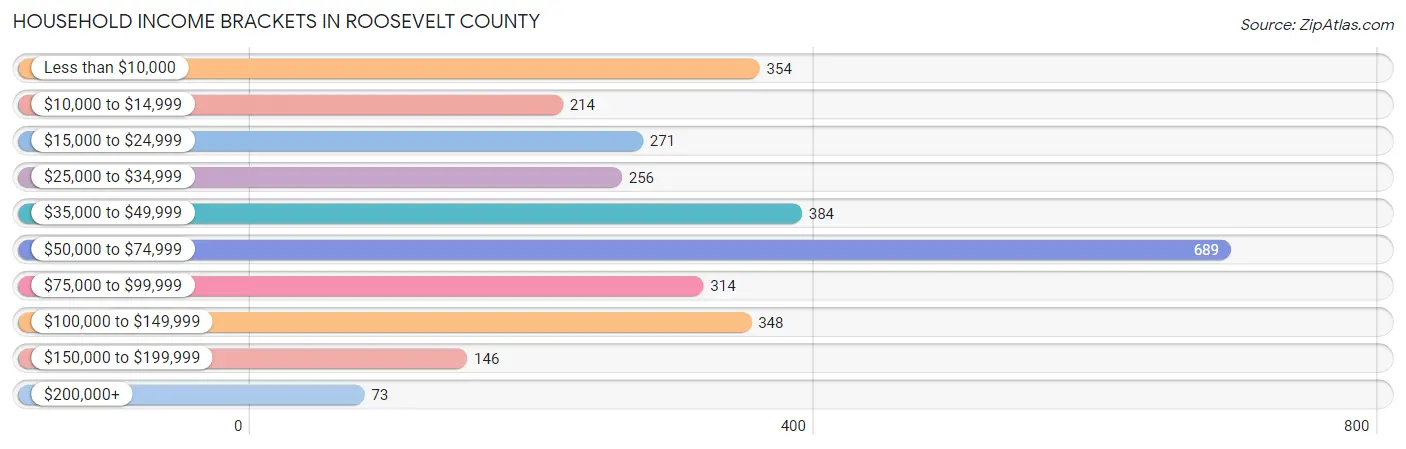
Household Income Brackets in Roosevelt County
With 689 households falling in the category, the $50,000 to $74,999 income range is the most frequent in Roosevelt County, accounting for 22.6% of all households. In contrast, only 73 households (2.4%) fall into the $200,000+ income bracket, making it the least populous group.
| Income Bracket | # Households | % Households |
| Less than $10,000 | 354 | 11.6% |
| $10,000 to $14,999 | 214 | 7.0% |
| $15,000 to $24,999 | 271 | 8.9% |
| $25,000 to $34,999 | 256 | 8.4% |
| $35,000 to $49,999 | 384 | 12.6% |
| $50,000 to $74,999 | 689 | 22.6% |
| $75,000 to $99,999 | 314 | 10.3% |
| $100,000 to $149,999 | 348 | 11.4% |
| $150,000 to $199,999 | 146 | 4.8% |
| $200,000+ | 73 | 2.4% |
Household Income by Householder Age in Roosevelt County
The median household income in Roosevelt County is $51,038, with the highest median household income of $54,167 found in the 65+ years age bracket for the primary householder. A total of 740 households (24.3%) fall into this category. Meanwhile, the 15 to 24 years age bracket for the primary householder has the lowest median household income of $33,462, with 68 households (2.2%) in this group.
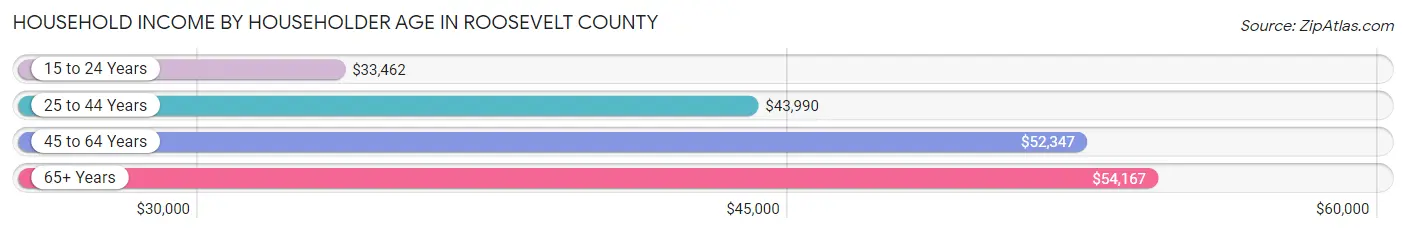
| Income Bracket | # Households | Median Income |
| 15 to 24 Years | 68 (2.2%) | $33,462 |
| 25 to 44 Years | 982 (32.2%) | $43,990 |
| 45 to 64 Years | 1,260 (41.3%) | $52,347 |
| 65+ Years | 740 (24.3%) | $54,167 |
| Total | 3,050 (100.0%) | $51,038 |
Poverty in Roosevelt County
Income Below Poverty by Sex and Age in Roosevelt County
With 29.1% poverty level for males and 34.1% for females among the residents of Roosevelt County, 16 and 17 year old males and 15 year old females are the most vulnerable to poverty, with 91 males (57.6%) and 50 females (59.5%) in their respective age groups living below the poverty level.
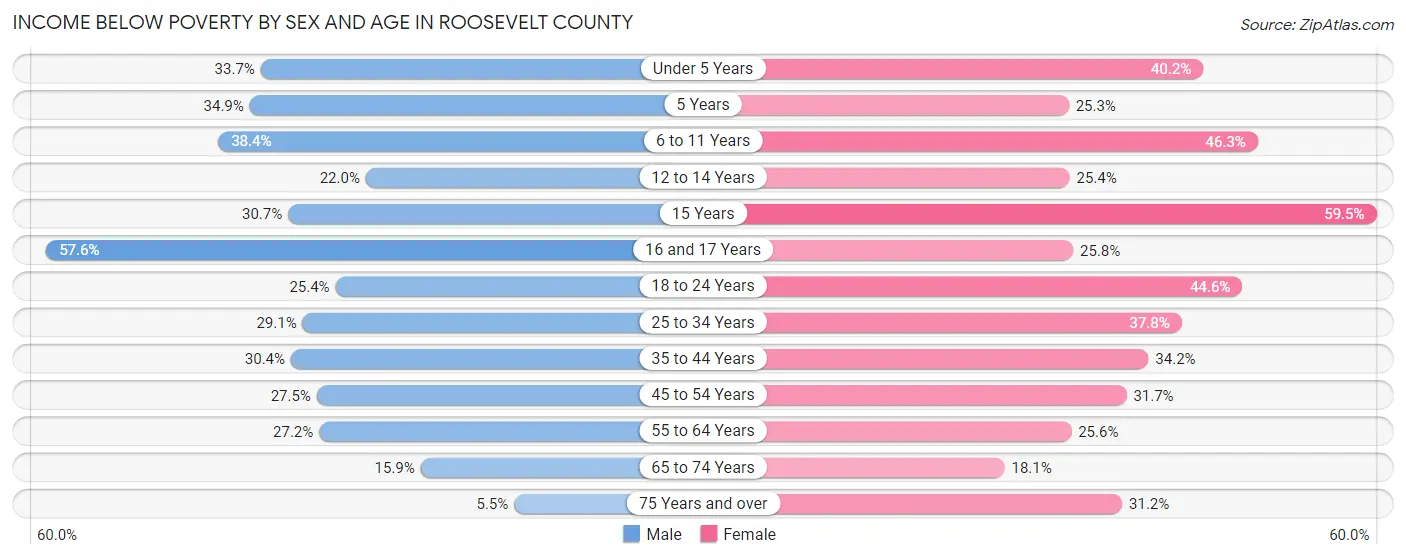
| Age Bracket | Male | Female |
| Under 5 Years | 179 (33.7%) | 165 (40.2%) |
| 5 Years | 29 (34.9%) | 23 (25.3%) |
| 6 to 11 Years | 254 (38.4%) | 226 (46.3%) |
| 12 to 14 Years | 70 (22.0%) | 51 (25.4%) |
| 15 Years | 42 (30.7%) | 50 (59.5%) |
| 16 and 17 Years | 91 (57.6%) | 59 (25.8%) |
| 18 to 24 Years | 134 (25.4%) | 206 (44.6%) |
| 25 to 34 Years | 208 (29.0%) | 269 (37.8%) |
| 35 to 44 Years | 183 (30.3%) | 210 (34.2%) |
| 45 to 54 Years | 136 (27.5%) | 155 (31.7%) |
| 55 to 64 Years | 161 (27.2%) | 164 (25.6%) |
| 65 to 74 Years | 59 (15.9%) | 70 (18.1%) |
| 75 Years and over | 8 (5.5%) | 69 (31.2%) |
| Total | 1,554 (29.1%) | 1,717 (34.1%) |
Income Above Poverty by Sex and Age in Roosevelt County
According to the poverty statistics in Roosevelt County, males aged 75 years and over and females aged 65 to 74 years are the age groups that are most secure financially, with 94.5% of males and 81.9% of females in these age groups living above the poverty line.
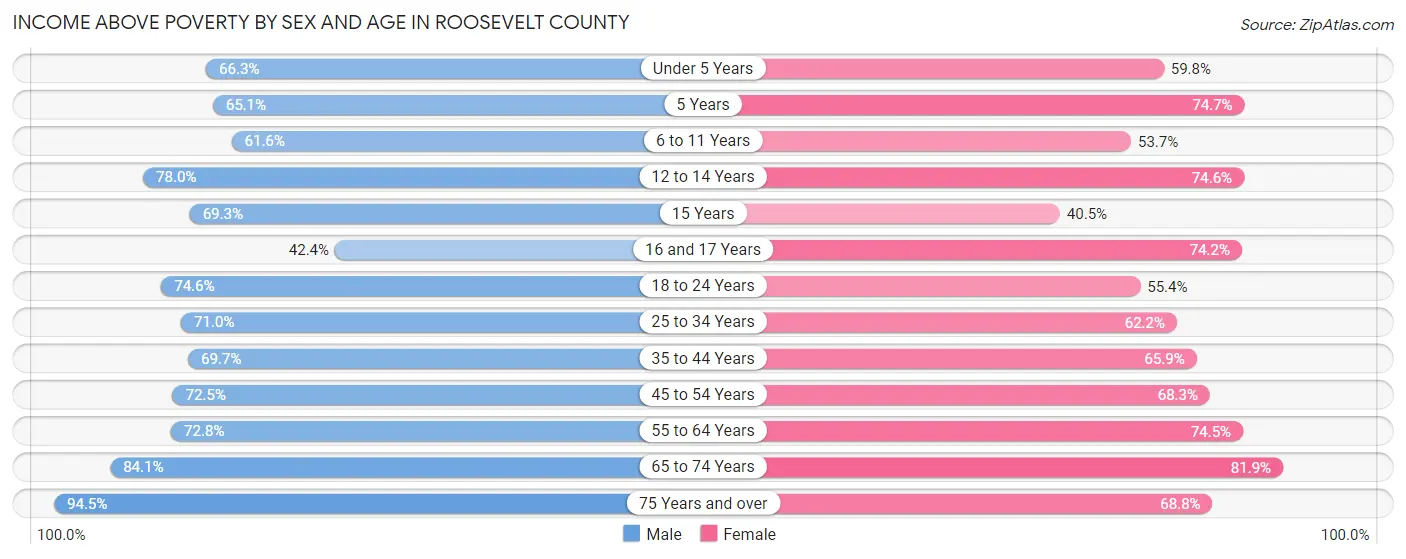
| Age Bracket | Male | Female |
| Under 5 Years | 352 (66.3%) | 245 (59.8%) |
| 5 Years | 54 (65.1%) | 68 (74.7%) |
| 6 to 11 Years | 407 (61.6%) | 262 (53.7%) |
| 12 to 14 Years | 248 (78.0%) | 150 (74.6%) |
| 15 Years | 95 (69.3%) | 34 (40.5%) |
| 16 and 17 Years | 67 (42.4%) | 170 (74.2%) |
| 18 to 24 Years | 394 (74.6%) | 256 (55.4%) |
| 25 to 34 Years | 508 (71.0%) | 442 (62.2%) |
| 35 to 44 Years | 420 (69.7%) | 405 (65.8%) |
| 45 to 54 Years | 359 (72.5%) | 334 (68.3%) |
| 55 to 64 Years | 431 (72.8%) | 478 (74.5%) |
| 65 to 74 Years | 312 (84.1%) | 316 (81.9%) |
| 75 Years and over | 138 (94.5%) | 152 (68.8%) |
| Total | 3,785 (70.9%) | 3,312 (65.9%) |
Income Below Poverty Among Married-Couple Families in Roosevelt County
The poverty statistics for married-couple families in Roosevelt County show that 12.4% or 139 of the total 1,124 families live below the poverty line. Families with 5 or more children have the highest poverty rate of 73.7%, comprising of 14 families. On the other hand, families with 3 or 4 children have the lowest poverty rate of 6.2%, which includes 16 families.
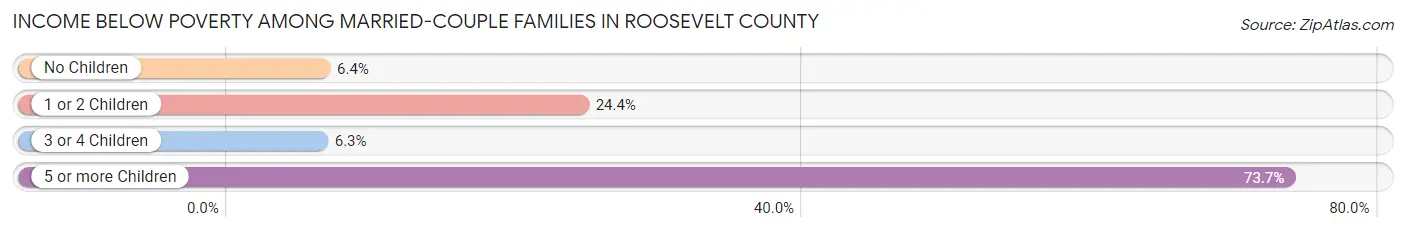
| Children | Above Poverty | Below Poverty |
| No Children | 511 (93.6%) | 35 (6.4%) |
| 1 or 2 Children | 229 (75.6%) | 74 (24.4%) |
| 3 or 4 Children | 240 (93.8%) | 16 (6.2%) |
| 5 or more Children | 5 (26.3%) | 14 (73.7%) |
| Total | 985 (87.6%) | 139 (12.4%) |
Income Below Poverty Among Single-Parent Households in Roosevelt County
According to the poverty data in Roosevelt County, 54.6% or 106 single-father households and 43.0% or 195 single-mother households are living below the poverty line. Among single-father households, those with 3 or 4 children have the highest poverty rate, with 11 households (100.0%) experiencing poverty. Likewise, among single-mother households, those with 5 or more children have the highest poverty rate, with 12 households (100.0%) falling below the poverty line.
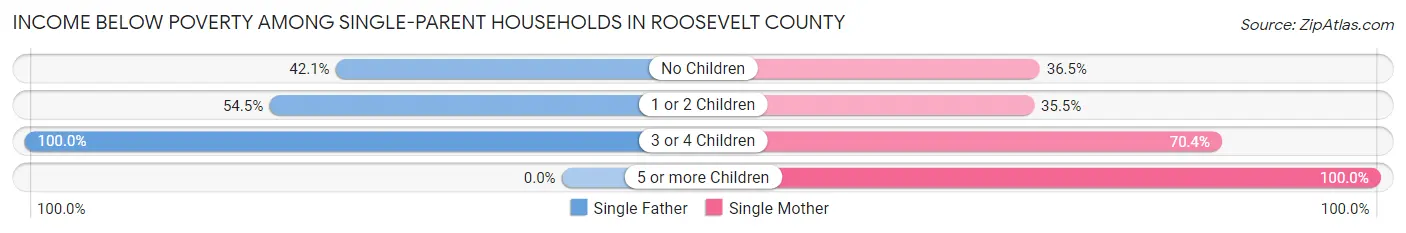
| Children | Single Father | Single Mother |
| No Children | 16 (42.1%) | 61 (36.5%) |
| 1 or 2 Children | 79 (54.5%) | 72 (35.5%) |
| 3 or 4 Children | 11 (100.0%) | 50 (70.4%) |
| 5 or more Children | 0 (0.0%) | 12 (100.0%) |
| Total | 106 (54.6%) | 195 (43.0%) |
Income Below Poverty Among Married-Couple vs Single-Parent Households in Roosevelt County
The poverty data for Roosevelt County shows that 139 of the married-couple family households (12.4%) and 301 of the single-parent households (46.5%) are living below the poverty level. Within the married-couple family households, those with 5 or more children have the highest poverty rate, with 14 households (73.7%) falling below the poverty line. Among the single-parent households, those with 5 or more children have the highest poverty rate, with 12 household (100.0%) living below poverty.
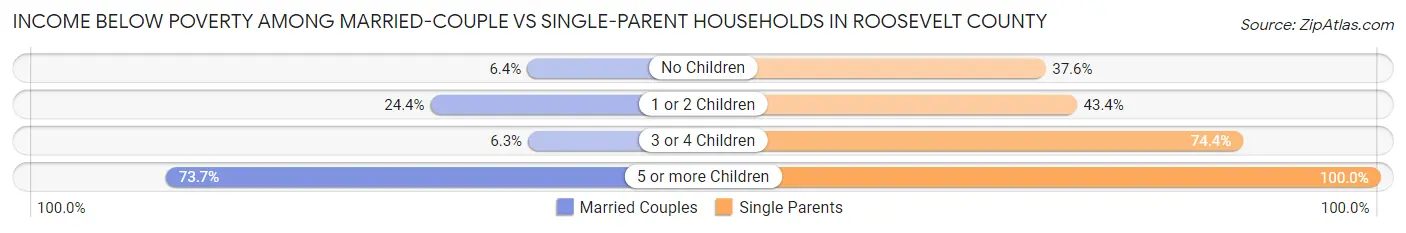
| Children | Married-Couple Families | Single-Parent Households |
| No Children | 35 (6.4%) | 77 (37.6%) |
| 1 or 2 Children | 74 (24.4%) | 151 (43.4%) |
| 3 or 4 Children | 16 (6.2%) | 61 (74.4%) |
| 5 or more Children | 14 (73.7%) | 12 (100.0%) |
| Total | 139 (12.4%) | 301 (46.5%) |
Race in Roosevelt County
The most populous races in Roosevelt County are Native / Alaskan (6,298 | 58.3%), White / Caucasian (3,586 | 33.2%), and Two or more Races (761 | 7.0%).
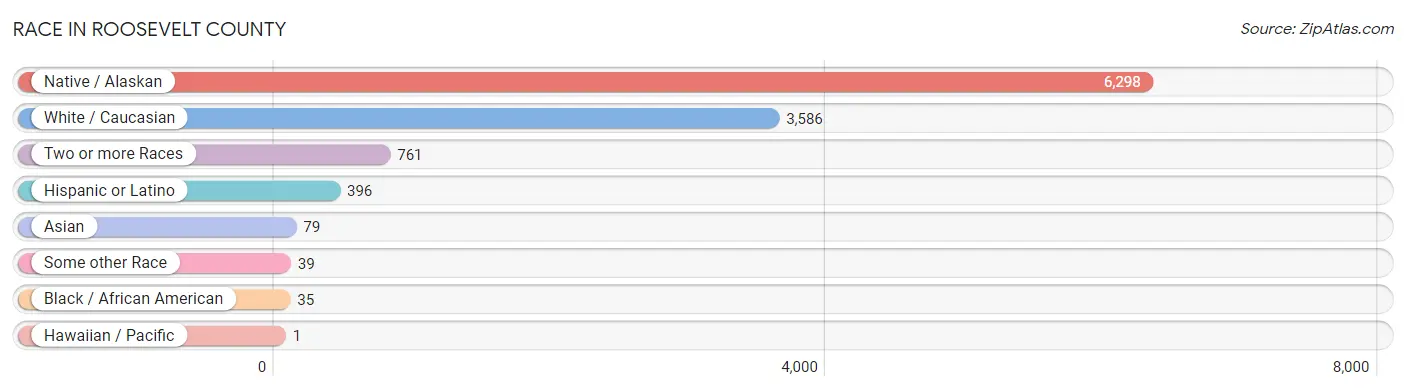
| Race | # Population | % Population |
| Asian | 79 | 0.7% |
| Black / African American | 35 | 0.3% |
| Hawaiian / Pacific | 1 | 0.0% |
| Hispanic or Latino | 396 | 3.7% |
| Native / Alaskan | 6,298 | 58.3% |
| White / Caucasian | 3,586 | 33.2% |
| Two or more Races | 761 | 7.0% |
| Some other Race | 39 | 0.4% |
| Total | 10,799 | 100.0% |
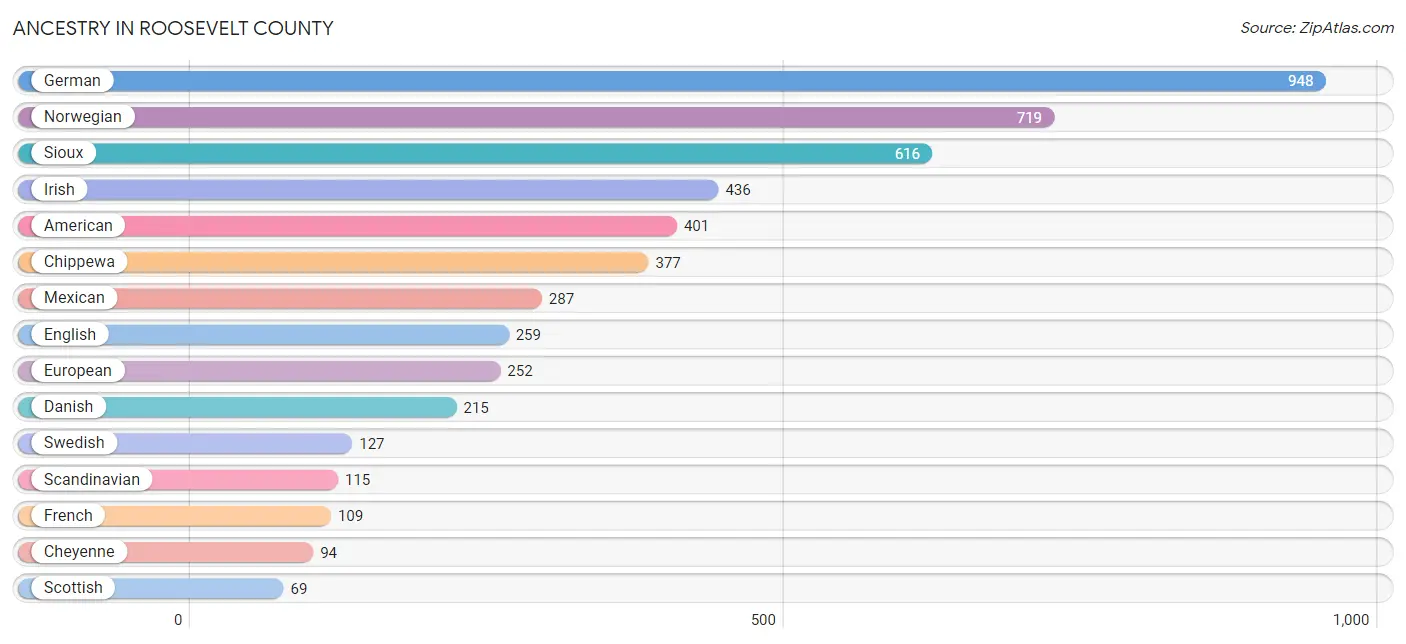
Ancestry in Roosevelt County
The most populous ancestries reported in Roosevelt County are German (948 | 8.8%), Norwegian (719 | 6.7%), Sioux (616 | 5.7%), Irish (436 | 4.0%), and American (401 | 3.7%), together accounting for 28.9% of all Roosevelt County residents.
| Ancestry | # Population | % Population |
| American | 401 | 3.7% |
| Arapaho | 25 | 0.2% |
| Armenian | 4 | 0.0% |
| Australian | 6 | 0.1% |
| Austrian | 6 | 0.1% |
| Belgian | 5 | 0.1% |
| Bhutanese | 9 | 0.1% |
| Blackfeet | 22 | 0.2% |
| Brazilian | 6 | 0.1% |
| British | 3 | 0.0% |
| Burmese | 22 | 0.2% |
| Canadian | 5 | 0.1% |
| Cherokee | 7 | 0.1% |
| Cheyenne | 94 | 0.9% |
| Chippewa | 377 | 3.5% |
| Choctaw | 5 | 0.1% |
| Cree | 3 | 0.0% |
| Croatian | 6 | 0.1% |
| Crow | 25 | 0.2% |
| Czech | 12 | 0.1% |
| Czechoslovakian | 10 | 0.1% |
| Danish | 215 | 2.0% |
| Dutch | 54 | 0.5% |
| Ecuadorian | 14 | 0.1% |
| English | 259 | 2.4% |
| European | 252 | 2.3% |
| Finnish | 2 | 0.0% |
| French | 109 | 1.0% |
| French American Indian | 21 | 0.2% |
| French Canadian | 54 | 0.5% |
| German | 948 | 8.8% |
| German Russian | 1 | 0.0% |
| Hungarian | 7 | 0.1% |
| Indian (Asian) | 22 | 0.2% |
| Irish | 436 | 4.0% |
| Israeli | 8 | 0.1% |
| Italian | 56 | 0.5% |
| Korean | 55 | 0.5% |
| Mexican | 287 | 2.7% |
| Native Hawaiian | 1 | 0.0% |
| Navajo | 18 | 0.2% |
| Northern European | 8 | 0.1% |
| Norwegian | 719 | 6.7% |
| Polish | 36 | 0.3% |
| Portuguese | 6 | 0.1% |
| Romanian | 5 | 0.1% |
| Russian | 23 | 0.2% |
| Scandinavian | 115 | 1.1% |
| Scotch-Irish | 35 | 0.3% |
| Scottish | 69 | 0.6% |
| Seminole | 17 | 0.2% |
| Sioux | 616 | 5.7% |
| Slovak | 7 | 0.1% |
| South American | 14 | 0.1% |
| Spaniard | 15 | 0.1% |
| Swedish | 127 | 1.2% |
| Swiss | 4 | 0.0% |
| Tohono O'Odham | 36 | 0.3% |
| Ukrainian | 36 | 0.3% |
| Welsh | 11 | 0.1% |
| Yugoslavian | 7 | 0.1% | View All 61 Rows |
Immigrants in Roosevelt County
The most numerous immigrant groups reported in Roosevelt County came from Asia (72 | 0.7%), South Eastern Asia (49 | 0.4%), Vietnam (34 | 0.3%), Latin America (29 | 0.3%), and Eastern Asia (23 | 0.2%), together accounting for 1.9% of all Roosevelt County residents.
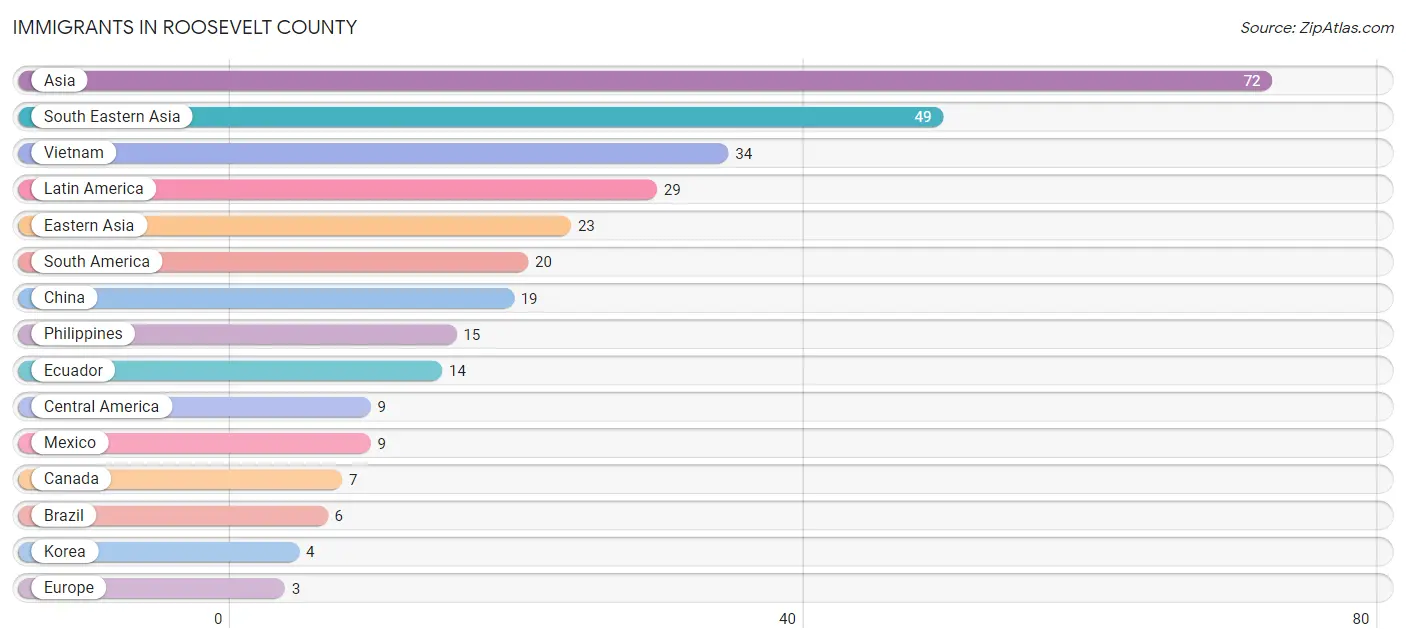
| Immigration Origin | # Population | % Population |
| Asia | 72 | 0.7% |
| Brazil | 6 | 0.1% |
| Canada | 7 | 0.1% |
| Central America | 9 | 0.1% |
| China | 19 | 0.2% |
| Denmark | 2 | 0.0% |
| Eastern Asia | 23 | 0.2% |
| Ecuador | 14 | 0.1% |
| Europe | 3 | 0.0% |
| Hong Kong | 1 | 0.0% |
| Korea | 4 | 0.0% |
| Latin America | 29 | 0.3% |
| Mexico | 9 | 0.1% |
| Northern Europe | 3 | 0.0% |
| Philippines | 15 | 0.1% |
| South America | 20 | 0.2% |
| South Eastern Asia | 49 | 0.4% |
| Vietnam | 34 | 0.3% | View All 18 Rows |
Sex and Age in Roosevelt County
Sex and Age in Roosevelt County
The most populous age groups in Roosevelt County are 10 to 14 Years (578 | 10.6%) for men and 5 to 9 Years (573 | 10.7%) for women.
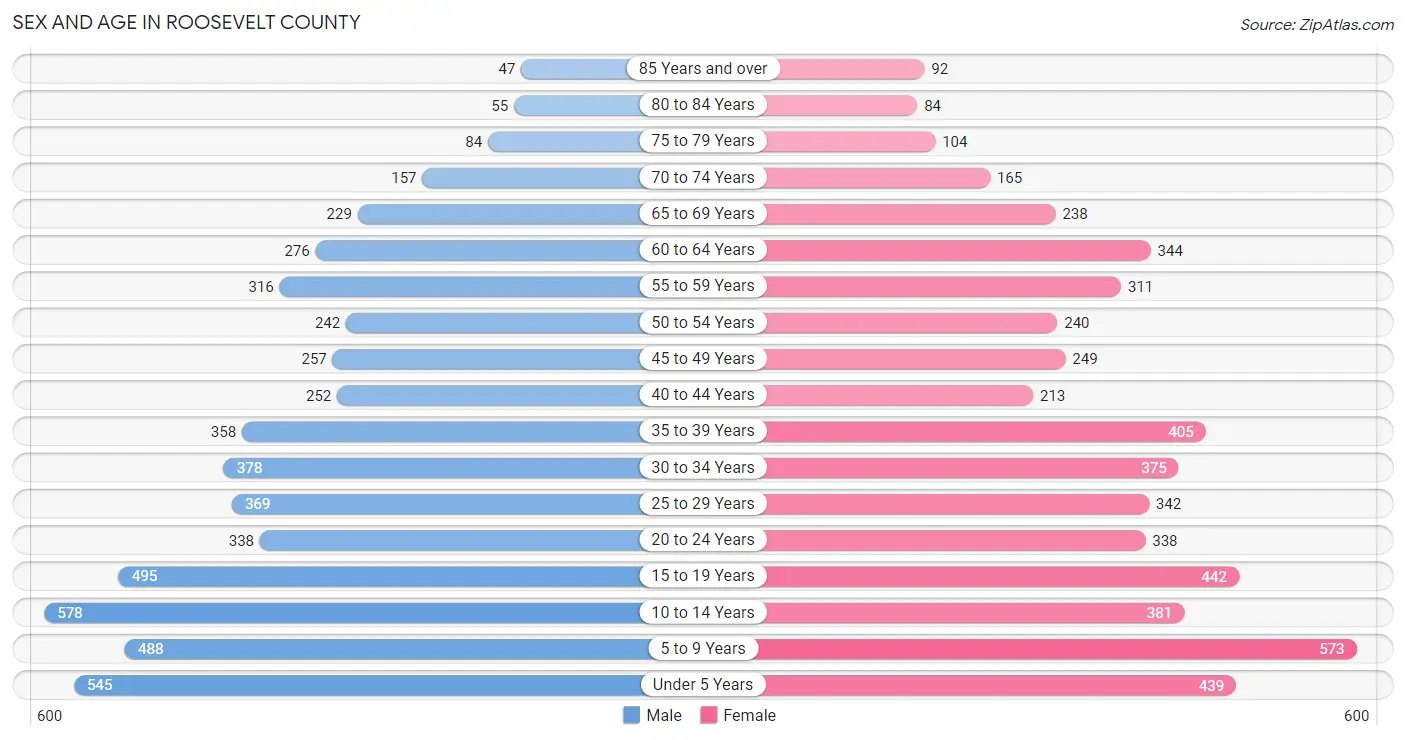
| Age Bracket | Male | Female |
| Under 5 Years | 545 (10.0%) | 439 (8.2%) |
| 5 to 9 Years | 488 (8.9%) | 573 (10.7%) |
| 10 to 14 Years | 578 (10.6%) | 381 (7.1%) |
| 15 to 19 Years | 495 (9.1%) | 442 (8.3%) |
| 20 to 24 Years | 338 (6.2%) | 338 (6.3%) |
| 25 to 29 Years | 369 (6.8%) | 342 (6.4%) |
| 30 to 34 Years | 378 (6.9%) | 375 (7.0%) |
| 35 to 39 Years | 358 (6.6%) | 405 (7.6%) |
| 40 to 44 Years | 252 (4.6%) | 213 (4.0%) |
| 45 to 49 Years | 257 (4.7%) | 249 (4.7%) |
| 50 to 54 Years | 242 (4.4%) | 240 (4.5%) |
| 55 to 59 Years | 316 (5.8%) | 311 (5.8%) |
| 60 to 64 Years | 276 (5.1%) | 344 (6.5%) |
| 65 to 69 Years | 229 (4.2%) | 238 (4.5%) |
| 70 to 74 Years | 157 (2.9%) | 165 (3.1%) |
| 75 to 79 Years | 84 (1.5%) | 104 (1.9%) |
| 80 to 84 Years | 55 (1.0%) | 84 (1.6%) |
| 85 Years and over | 47 (0.9%) | 92 (1.7%) |
| Total | 5,464 (100.0%) | 5,335 (100.0%) |
Families and Households in Roosevelt County
Median Family Size in Roosevelt County
The median family size in Roosevelt County is 4.80 persons per family, with single female/mother families (453 | 25.6%) accounting for the largest median family size of 6.11 persons per family. On the other hand, married-couple families (1,124 | 63.5%) represent the smallest median family size with 4.28 persons per family.
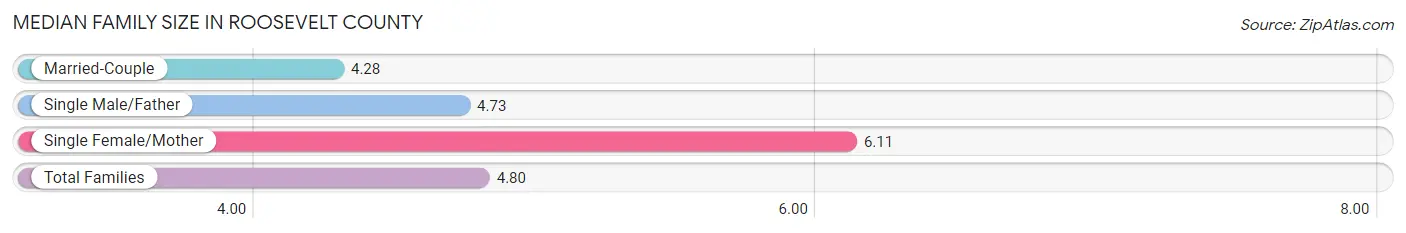
| Family Type | # Families | Family Size |
| Married-Couple | 1,124 (63.5%) | 4.28 |
| Single Male/Father | 194 (11.0%) | 4.73 |
| Single Female/Mother | 453 (25.6%) | 6.11 |
| Total Families | 1,771 (100.0%) | 4.80 |
Median Household Size in Roosevelt County
The median household size in Roosevelt County is 3.45 persons per household, with single female/mother households (453 | 14.8%) accounting for the largest median household size of 6.4 persons per household. non-family households (1,279 | 41.9%) represent the smallest median household size with 1.35 persons per household.
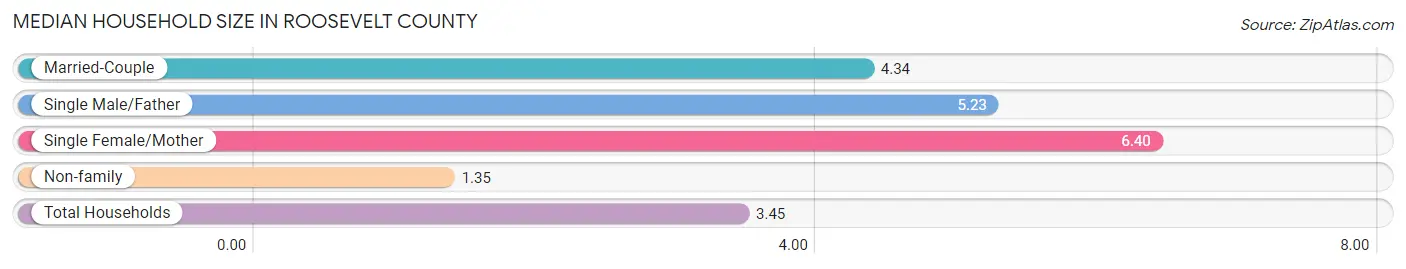
| Household Type | # Households | Household Size |
| Married-Couple | 1,124 (36.8%) | 4.34 |
| Single Male/Father | 194 (6.4%) | 5.23 |
| Single Female/Mother | 453 (14.8%) | 6.40 |
| Non-family | 1,279 (41.9%) | 1.35 |
| Total Households | 3,050 (100.0%) | 3.45 |
Household Size by Marriage Status in Roosevelt County
Out of a total of 3,050 households in Roosevelt County, 1,771 (58.1%) are family households, while 1,279 (41.9%) are nonfamily households. The most numerous type of family households are 2-person households, comprising 662, and the most common type of nonfamily households are 1-person households, comprising 1,146.
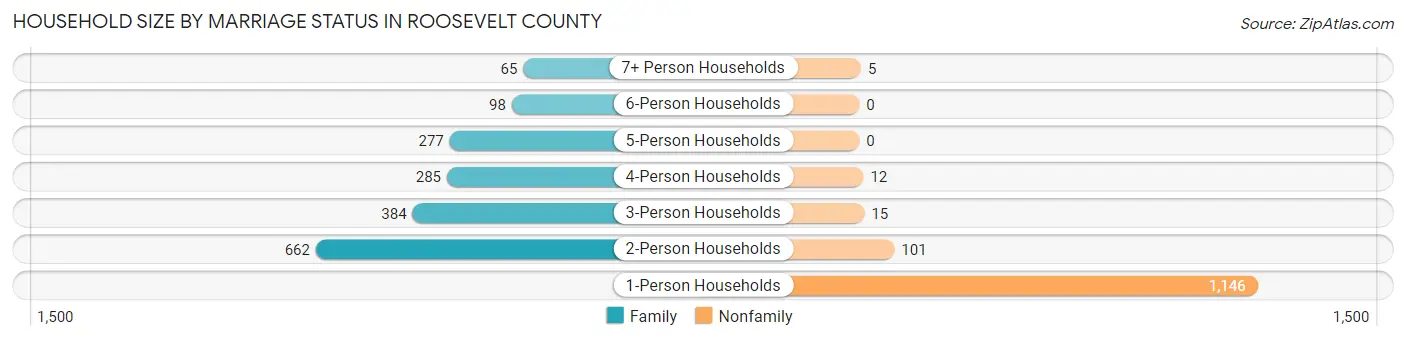
| Household Size | Family Households | Nonfamily Households |
| 1-Person Households | - | 1,146 (37.6%) |
| 2-Person Households | 662 (21.7%) | 101 (3.3%) |
| 3-Person Households | 384 (12.6%) | 15 (0.5%) |
| 4-Person Households | 285 (9.3%) | 12 (0.4%) |
| 5-Person Households | 277 (9.1%) | 0 (0.0%) |
| 6-Person Households | 98 (3.2%) | 0 (0.0%) |
| 7+ Person Households | 65 (2.1%) | 5 (0.2%) |
| Total | 1,771 (58.1%) | 1,279 (41.9%) |
Female Fertility in Roosevelt County
Fertility by Age in Roosevelt County
Average fertility rate in Roosevelt County is 30.0 births per 1,000 women. Women in the age bracket of 35 to 50 years have the highest fertility rate with 41.0 births per 1,000 women. Women in the age bracket of 35 to 50 years acount for 52.8% of all women with births.
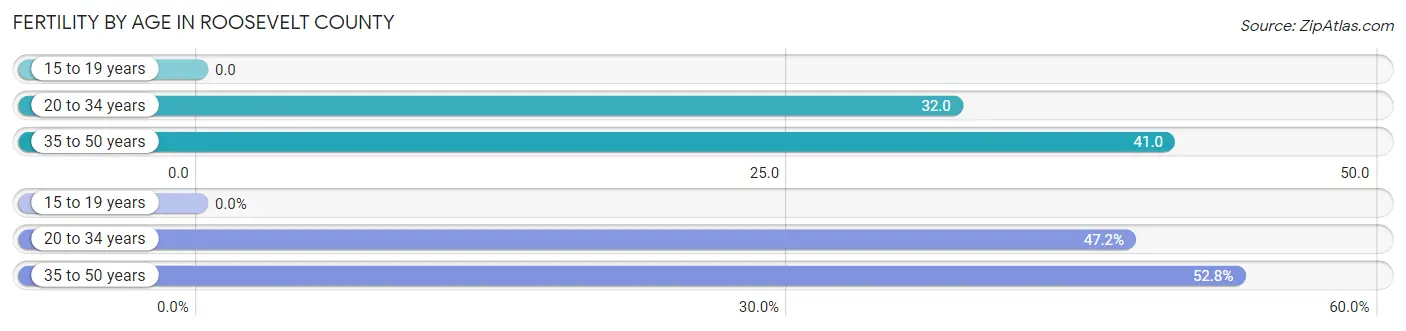
| Age Bracket | Women with Births | Births / 1,000 Women |
| 15 to 19 years | 0 (0.0%) | 0.0 |
| 20 to 34 years | 34 (47.2%) | 32.0 |
| 35 to 50 years | 38 (52.8%) | 41.0 |
| Total | 72 (100.0%) | 30.0 |
Fertility by Age by Marriage Status in Roosevelt County
59.7% of women with births (72) in Roosevelt County are married. The highest percentage of unmarried women with births falls into 20 to 34 years age bracket with 79.4% of them unmarried at the time of birth, while the lowest percentage of unmarried women with births belong to 35 to 50 years age bracket with 5.3% of them unmarried.
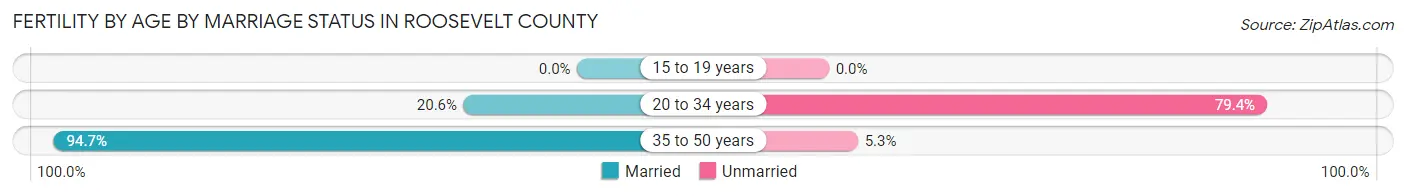
| Age Bracket | Married | Unmarried |
| 15 to 19 years | 0 (0.0%) | 0 (0.0%) |
| 20 to 34 years | 7 (20.6%) | 27 (79.4%) |
| 35 to 50 years | 36 (94.7%) | 2 (5.3%) |
| Total | 43 (59.7%) | 29 (40.3%) |
Fertility by Education in Roosevelt County
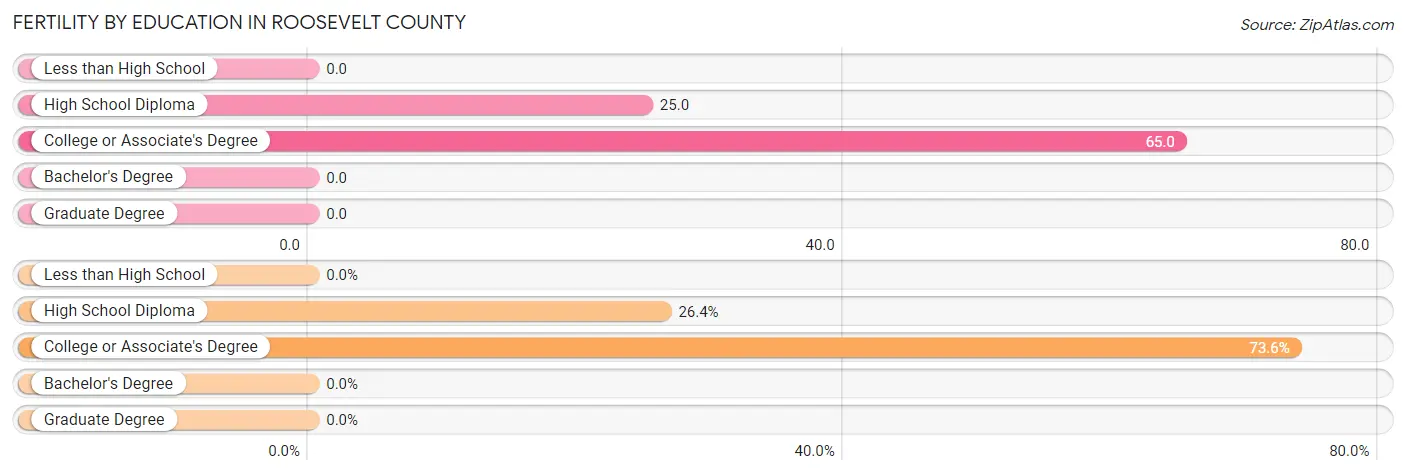
| Educational Attainment | Women with Births | Births / 1,000 Women |
| Less than High School | 0 (0.0%) | 0.0 |
| High School Diploma | 19 (26.4%) | 25.0 |
| College or Associate's Degree | 53 (73.6%) | 65.0 |
| Bachelor's Degree | 0 (0.0%) | 0.0 |
| Graduate Degree | 0 (0.0%) | 0.0 |
| Total | 72 (100.0%) | 30.0 |
Fertility by Education by Marriage Status in Roosevelt County
40.3% of women with births in Roosevelt County are unmarried. Women with the educational attainment of high school diploma are most likely to be married with 89.5% of them married at childbirth, while women with the educational attainment of college or associate's degree are least likely to be married with 50.9% of them unmarried at childbirth.
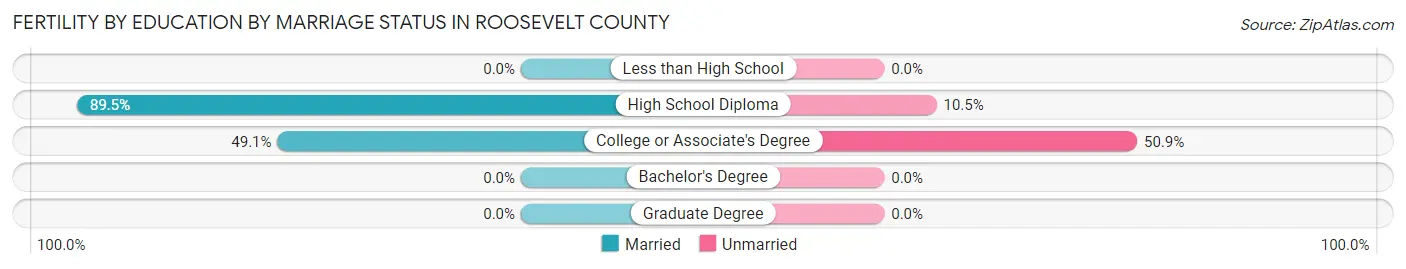
| Educational Attainment | Married | Unmarried |
| Less than High School | 0 (0.0%) | 0 (0.0%) |
| High School Diploma | 17 (89.5%) | 2 (10.5%) |
| College or Associate's Degree | 26 (49.1%) | 27 (50.9%) |
| Bachelor's Degree | 0 (0.0%) | 0 (0.0%) |
| Graduate Degree | 0 (0.0%) | 0 (0.0%) |
| Total | 43 (59.7%) | 29 (40.3%) |
Employment Characteristics in Roosevelt County
Employment by Class of Employer in Roosevelt County
Among the 3,650 employed individuals in Roosevelt County, private company employees (1,412 | 38.7%), local government employees (710 | 19.5%), and federal government employees (482 | 13.2%) make up the most common classes of employment.
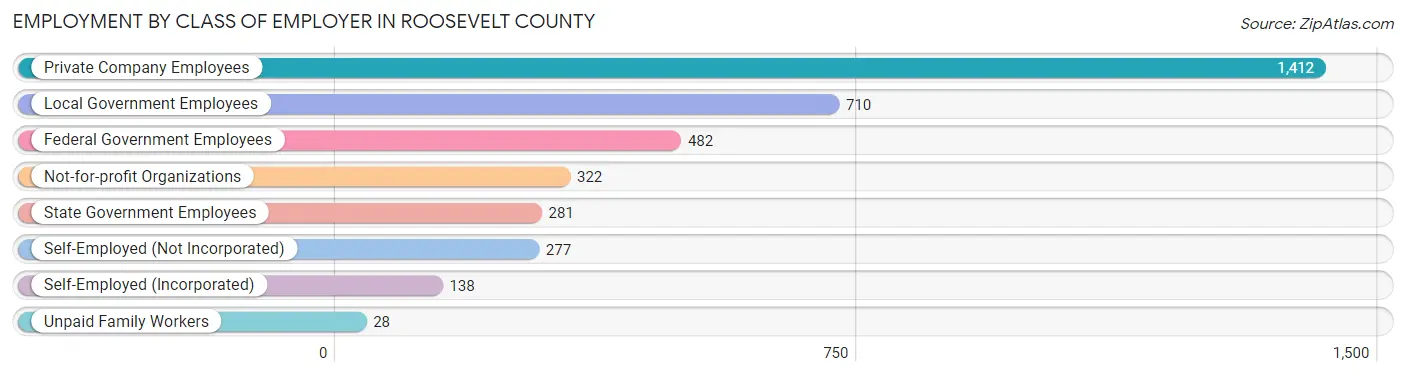
| Employer Class | # Employees | % Employees |
| Private Company Employees | 1,412 | 38.7% |
| Self-Employed (Incorporated) | 138 | 3.8% |
| Self-Employed (Not Incorporated) | 277 | 7.6% |
| Not-for-profit Organizations | 322 | 8.8% |
| Local Government Employees | 710 | 19.5% |
| State Government Employees | 281 | 7.7% |
| Federal Government Employees | 482 | 13.2% |
| Unpaid Family Workers | 28 | 0.8% |
| Total | 3,650 | 100.0% |
Employment Status by Age in Roosevelt County
According to the labor force statistics for Roosevelt County, out of the total population over 16 years of age (7,572), 53.2% or 4,028 individuals are in the labor force, with 8.6% or 346 of them unemployed. The age group with the highest labor force participation rate is 45 to 54 years, with 72.3% or 714 individuals in the labor force. Within the labor force, the 35 to 44 years age range has the highest percentage of unemployed individuals, with 18.1% or 151 of them being unemployed.
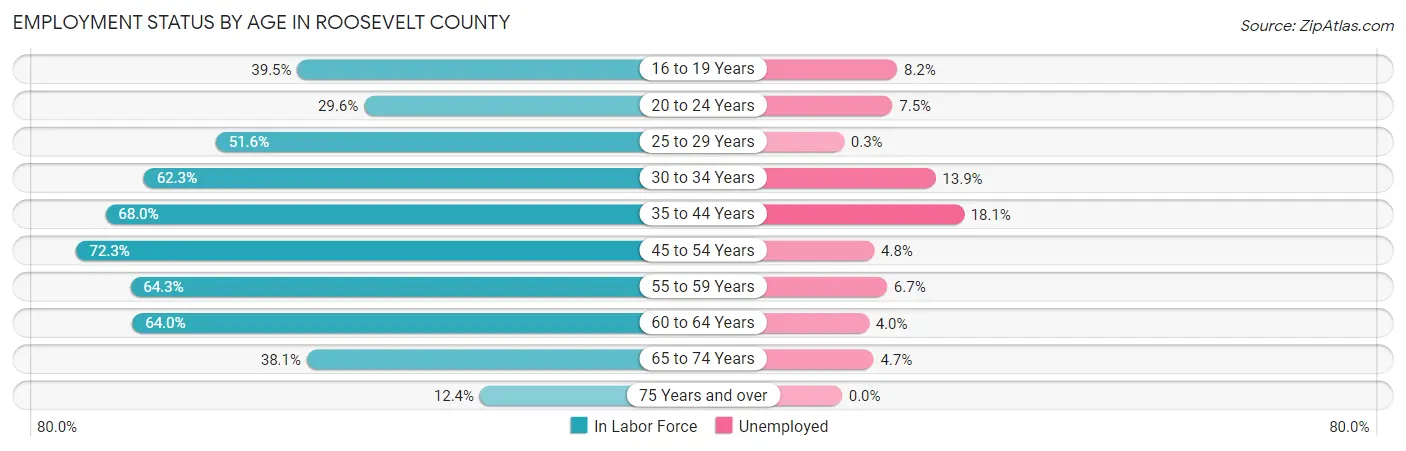
| Age Bracket | In Labor Force | Unemployed |
| 16 to 19 Years | 282 (39.5%) | 23 (8.2%) |
| 20 to 24 Years | 200 (29.6%) | 15 (7.5%) |
| 25 to 29 Years | 367 (51.6%) | 1 (0.3%) |
| 30 to 34 Years | 469 (62.3%) | 65 (13.9%) |
| 35 to 44 Years | 835 (68.0%) | 151 (18.1%) |
| 45 to 54 Years | 714 (72.3%) | 34 (4.8%) |
| 55 to 59 Years | 403 (64.3%) | 27 (6.7%) |
| 60 to 64 Years | 397 (64.0%) | 16 (4.0%) |
| 65 to 74 Years | 301 (38.1%) | 14 (4.7%) |
| 75 Years and over | 58 (12.4%) | 0 (0.0%) |
| Total | 4,028 (53.2%) | 346 (8.6%) |
Employment Status by Educational Attainment in Roosevelt County
According to labor force statistics for Roosevelt County, 64.6% of individuals (3,183) out of the total population between 25 and 64 years of age (4,927) are in the labor force, with 9.2% or 293 of them being unemployed. The group with the highest labor force participation rate are those with the educational attainment of bachelor's degree or higher, with 86.1% or 879 individuals in the labor force. Within the labor force, individuals with less than high school education have the highest percentage of unemployment, with 40.7% or 44 of them being unemployed.
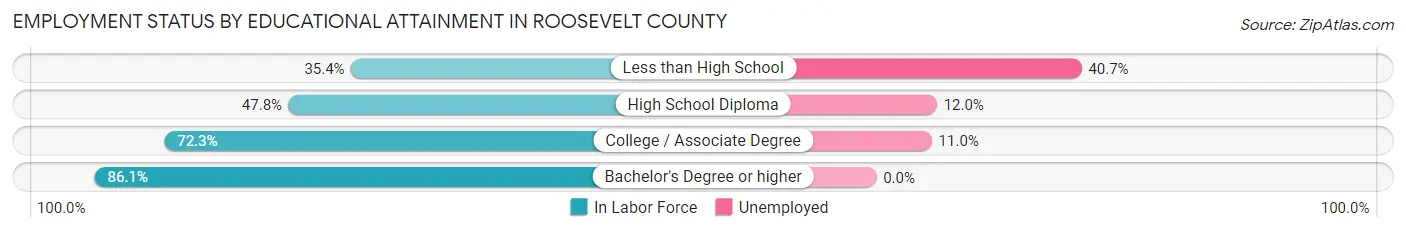
| Educational Attainment | In Labor Force | Unemployed |
| Less than High School | 108 (35.4%) | 124 (40.7%) |
| High School Diploma | 790 (47.8%) | 198 (12.0%) |
| College / Associate Degree | 1,409 (72.3%) | 214 (11.0%) |
| Bachelor's Degree or higher | 879 (86.1%) | 0 (0.0%) |
| Total | 3,183 (64.6%) | 453 (9.2%) |
Employment Occupations by Sex in Roosevelt County
Management, Business, Science and Arts Occupations
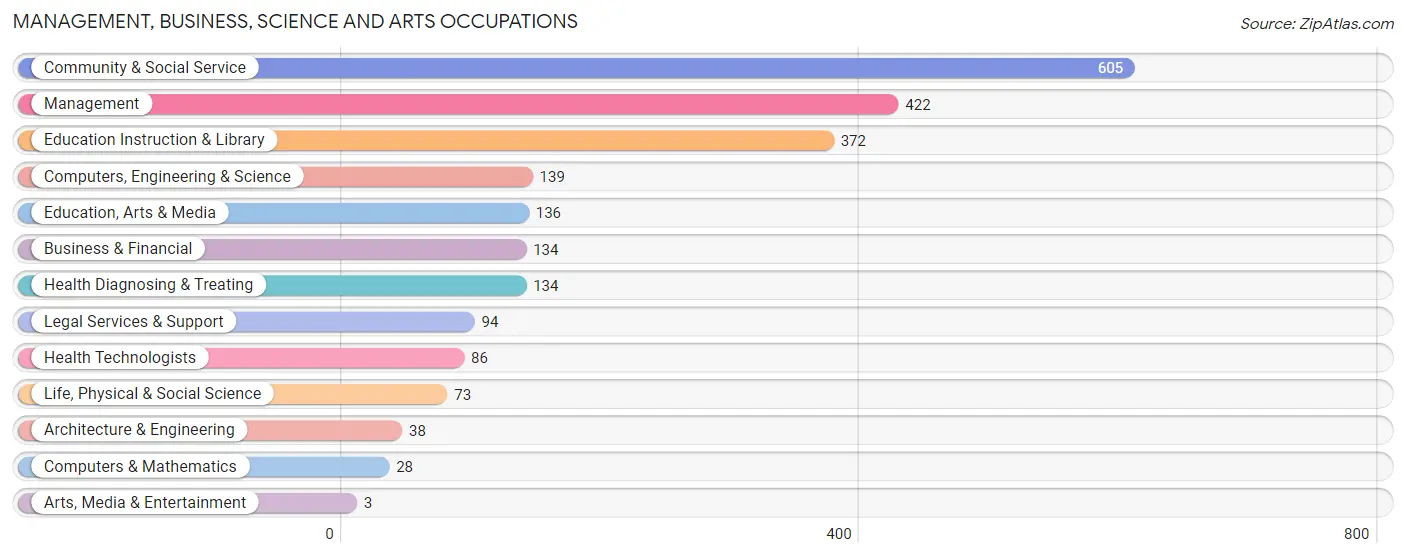
The most common Management, Business, Science and Arts occupations in Roosevelt County are Community & Social Service (605 | 16.5%), Management (422 | 11.5%), Education Instruction & Library (372 | 10.1%), Computers, Engineering & Science (139 | 3.8%), and Education, Arts & Media (136 | 3.7%).
Management, Business, Science and Arts Occupations by Sex
Within the Management, Business, Science and Arts occupations in Roosevelt County, the most male-oriented occupations are Arts, Media & Entertainment (100.0%), Architecture & Engineering (86.8%), and Computers & Mathematics (75.0%), while the most female-oriented occupations are Health Diagnosing & Treating (79.1%), Life, Physical & Social Science (72.6%), and Education Instruction & Library (71.0%).
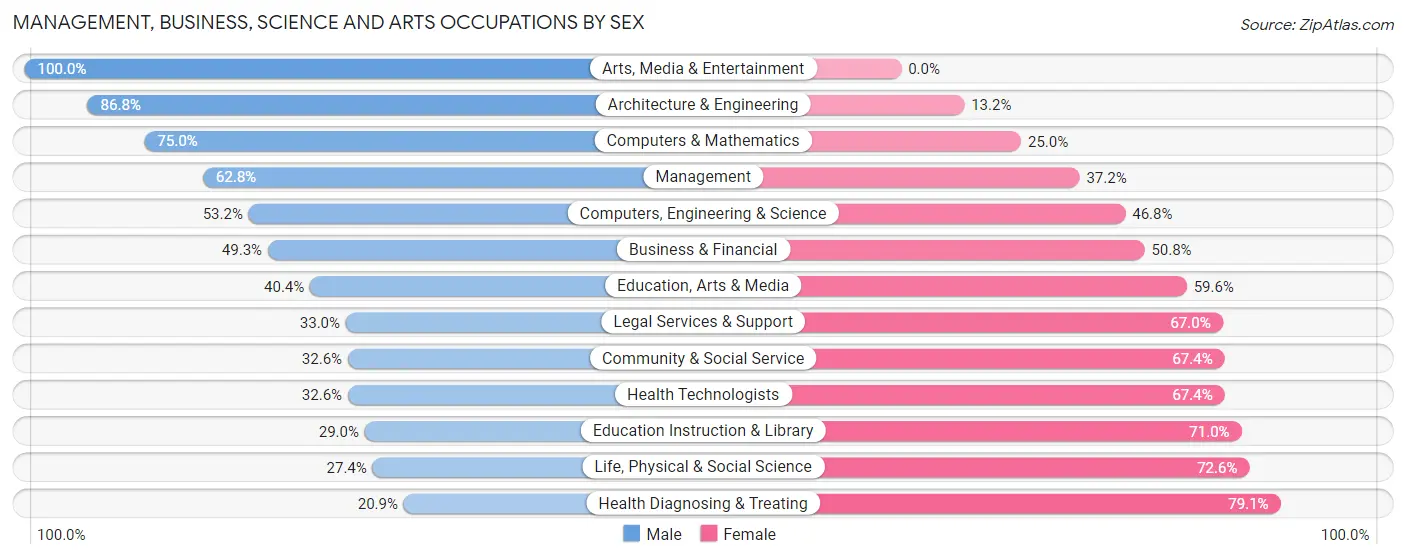
| Occupation | Male | Female |
| Management | 265 (62.8%) | 157 (37.2%) |
| Business & Financial | 66 (49.2%) | 68 (50.7%) |
| Computers, Engineering & Science | 74 (53.2%) | 65 (46.8%) |
| Computers & Mathematics | 21 (75.0%) | 7 (25.0%) |
| Architecture & Engineering | 33 (86.8%) | 5 (13.2%) |
| Life, Physical & Social Science | 20 (27.4%) | 53 (72.6%) |
| Community & Social Service | 197 (32.6%) | 408 (67.4%) |
| Education, Arts & Media | 55 (40.4%) | 81 (59.6%) |
| Legal Services & Support | 31 (33.0%) | 63 (67.0%) |
| Education Instruction & Library | 108 (29.0%) | 264 (71.0%) |
| Arts, Media & Entertainment | 3 (100.0%) | 0 (0.0%) |
| Health Diagnosing & Treating | 28 (20.9%) | 106 (79.1%) |
| Health Technologists | 28 (32.6%) | 58 (67.4%) |
| Total (Category) | 630 (43.9%) | 804 (56.1%) |
| Total (Overall) | 1,879 (51.1%) | 1,796 (48.9%) |
Services Occupations
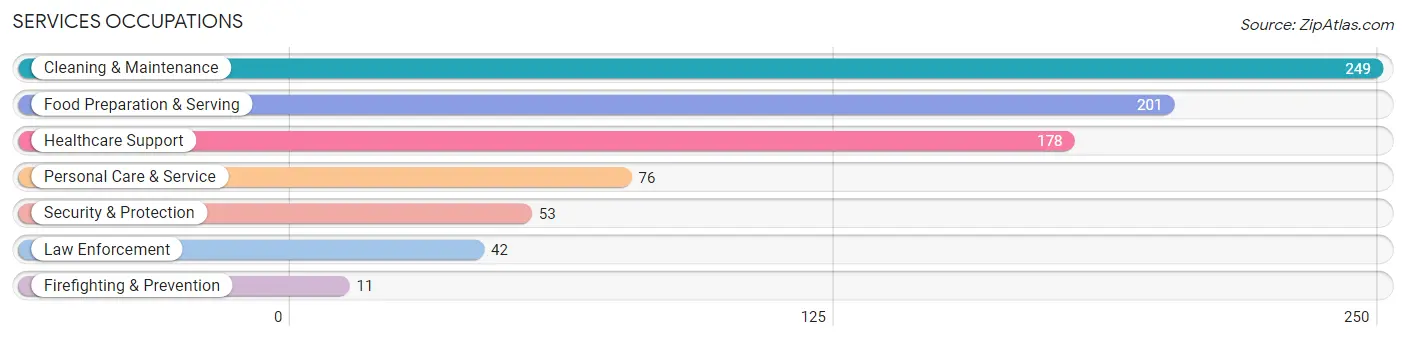
The most common Services occupations in Roosevelt County are Cleaning & Maintenance (249 | 6.8%), Food Preparation & Serving (201 | 5.5%), Healthcare Support (178 | 4.8%), Personal Care & Service (76 | 2.1%), and Security & Protection (53 | 1.4%).
Services Occupations by Sex
Within the Services occupations in Roosevelt County, the most male-oriented occupations are Law Enforcement (52.4%), Cleaning & Maintenance (52.2%), and Security & Protection (50.9%), while the most female-oriented occupations are Food Preparation & Serving (76.1%), Personal Care & Service (63.2%), and Healthcare Support (59.0%).
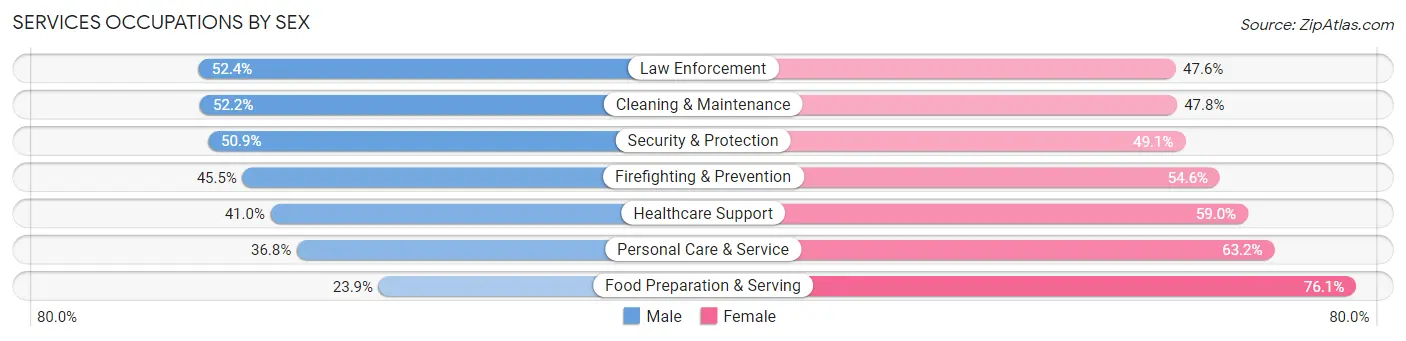
| Occupation | Male | Female |
| Healthcare Support | 73 (41.0%) | 105 (59.0%) |
| Security & Protection | 27 (50.9%) | 26 (49.1%) |
| Firefighting & Prevention | 5 (45.5%) | 6 (54.5%) |
| Law Enforcement | 22 (52.4%) | 20 (47.6%) |
| Food Preparation & Serving | 48 (23.9%) | 153 (76.1%) |
| Cleaning & Maintenance | 130 (52.2%) | 119 (47.8%) |
| Personal Care & Service | 28 (36.8%) | 48 (63.2%) |
| Total (Category) | 306 (40.4%) | 451 (59.6%) |
| Total (Overall) | 1,879 (51.1%) | 1,796 (48.9%) |
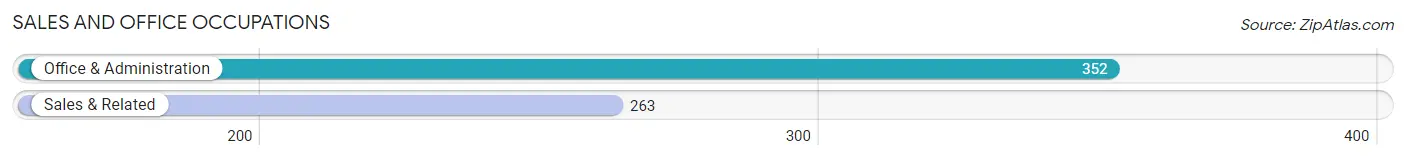
Sales and Office Occupations
The most common Sales and Office occupations in Roosevelt County are Office & Administration (352 | 9.6%), and Sales & Related (263 | 7.2%).
Sales and Office Occupations by Sex
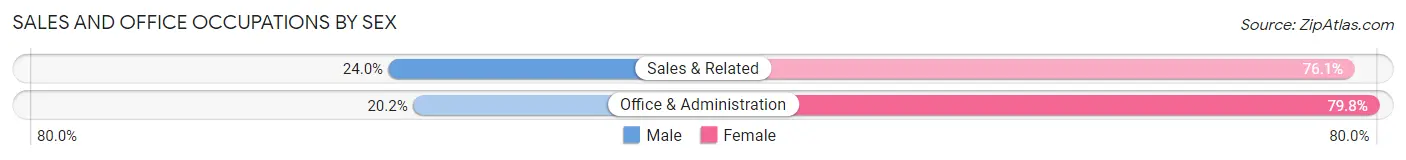
| Occupation | Male | Female |
| Sales & Related | 63 (23.9%) | 200 (76.0%) |
| Office & Administration | 71 (20.2%) | 281 (79.8%) |
| Total (Category) | 134 (21.8%) | 481 (78.2%) |
| Total (Overall) | 1,879 (51.1%) | 1,796 (48.9%) |
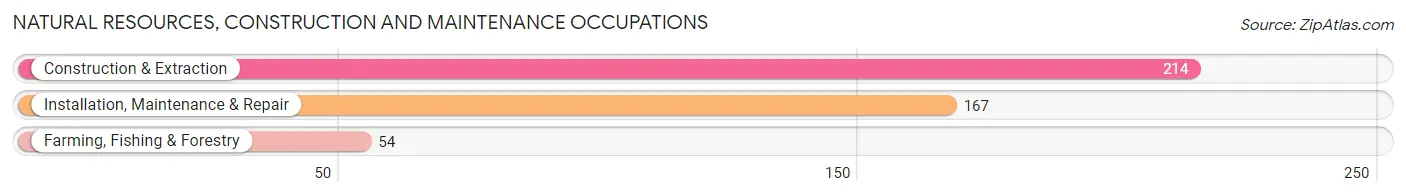
Natural Resources, Construction and Maintenance Occupations
The most common Natural Resources, Construction and Maintenance occupations in Roosevelt County are Construction & Extraction (214 | 5.8%), Installation, Maintenance & Repair (167 | 4.5%), and Farming, Fishing & Forestry (54 | 1.5%).
Natural Resources, Construction and Maintenance Occupations by Sex
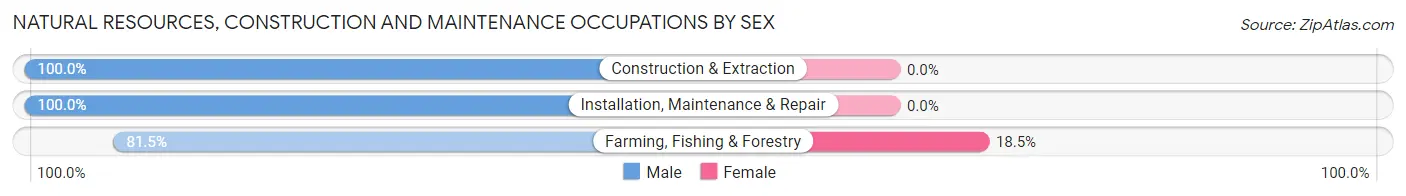
| Occupation | Male | Female |
| Farming, Fishing & Forestry | 44 (81.5%) | 10 (18.5%) |
| Construction & Extraction | 214 (100.0%) | 0 (0.0%) |
| Installation, Maintenance & Repair | 167 (100.0%) | 0 (0.0%) |
| Total (Category) | 425 (97.7%) | 10 (2.3%) |
| Total (Overall) | 1,879 (51.1%) | 1,796 (48.9%) |
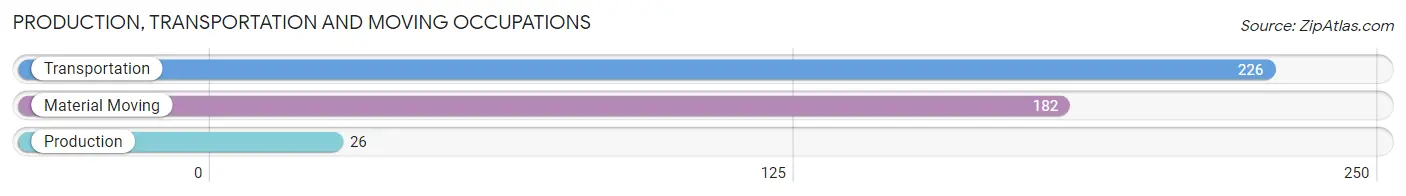
Production, Transportation and Moving Occupations
The most common Production, Transportation and Moving occupations in Roosevelt County are Transportation (226 | 6.1%), Material Moving (182 | 5.0%), and Production (26 | 0.7%).
Production, Transportation and Moving Occupations by Sex
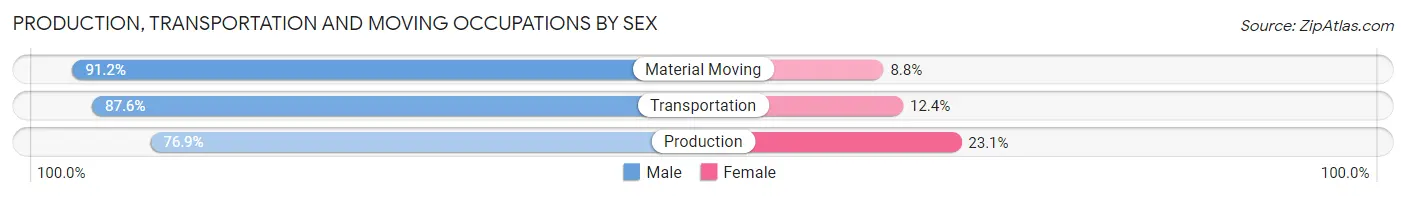
| Occupation | Male | Female |
| Production | 20 (76.9%) | 6 (23.1%) |
| Transportation | 198 (87.6%) | 28 (12.4%) |
| Material Moving | 166 (91.2%) | 16 (8.8%) |
| Total (Category) | 384 (88.5%) | 50 (11.5%) |
| Total (Overall) | 1,879 (51.1%) | 1,796 (48.9%) |
Employment Industries by Sex in Roosevelt County
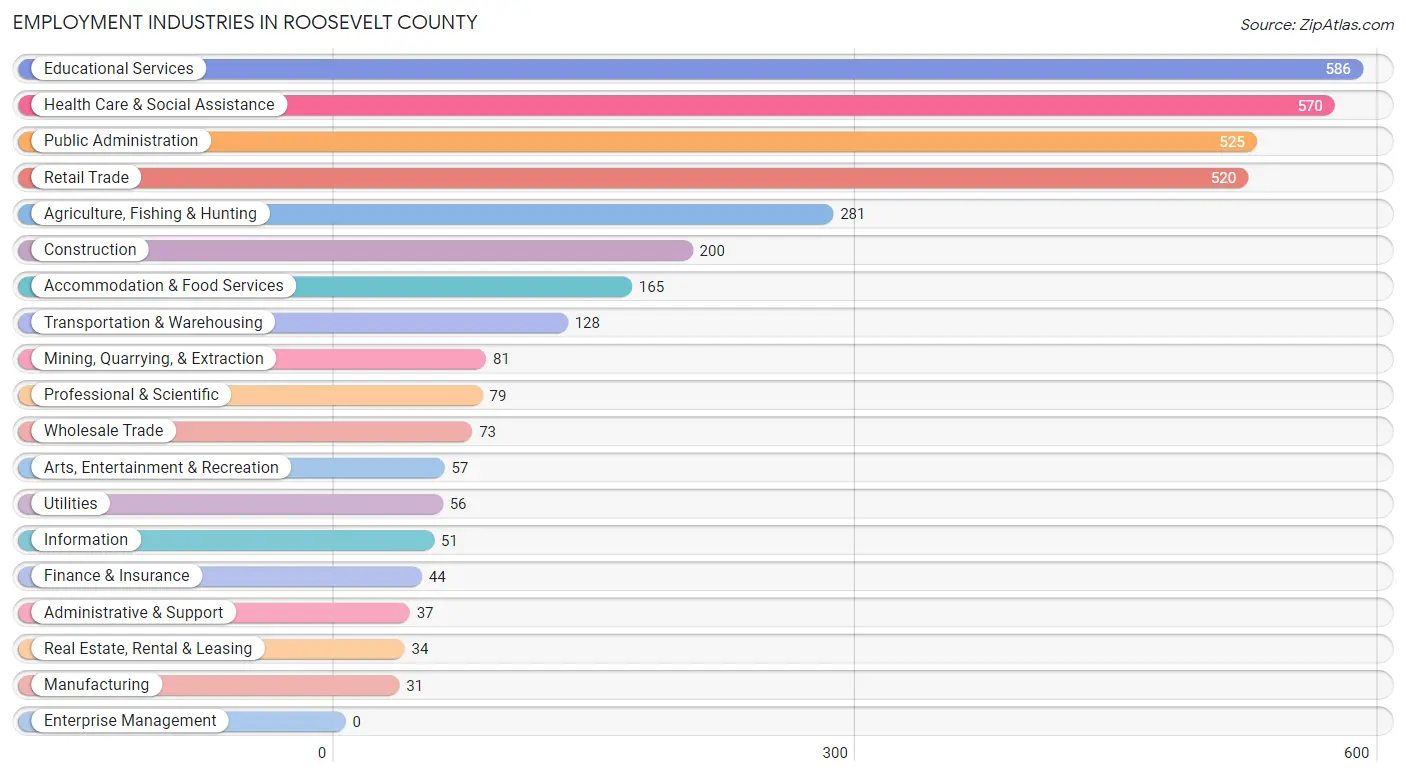
Employment Industries in Roosevelt County
The major employment industries in Roosevelt County include Educational Services (586 | 16.0%), Health Care & Social Assistance (570 | 15.5%), Public Administration (525 | 14.3%), Retail Trade (520 | 14.1%), and Agriculture, Fishing & Hunting (281 | 7.6%).
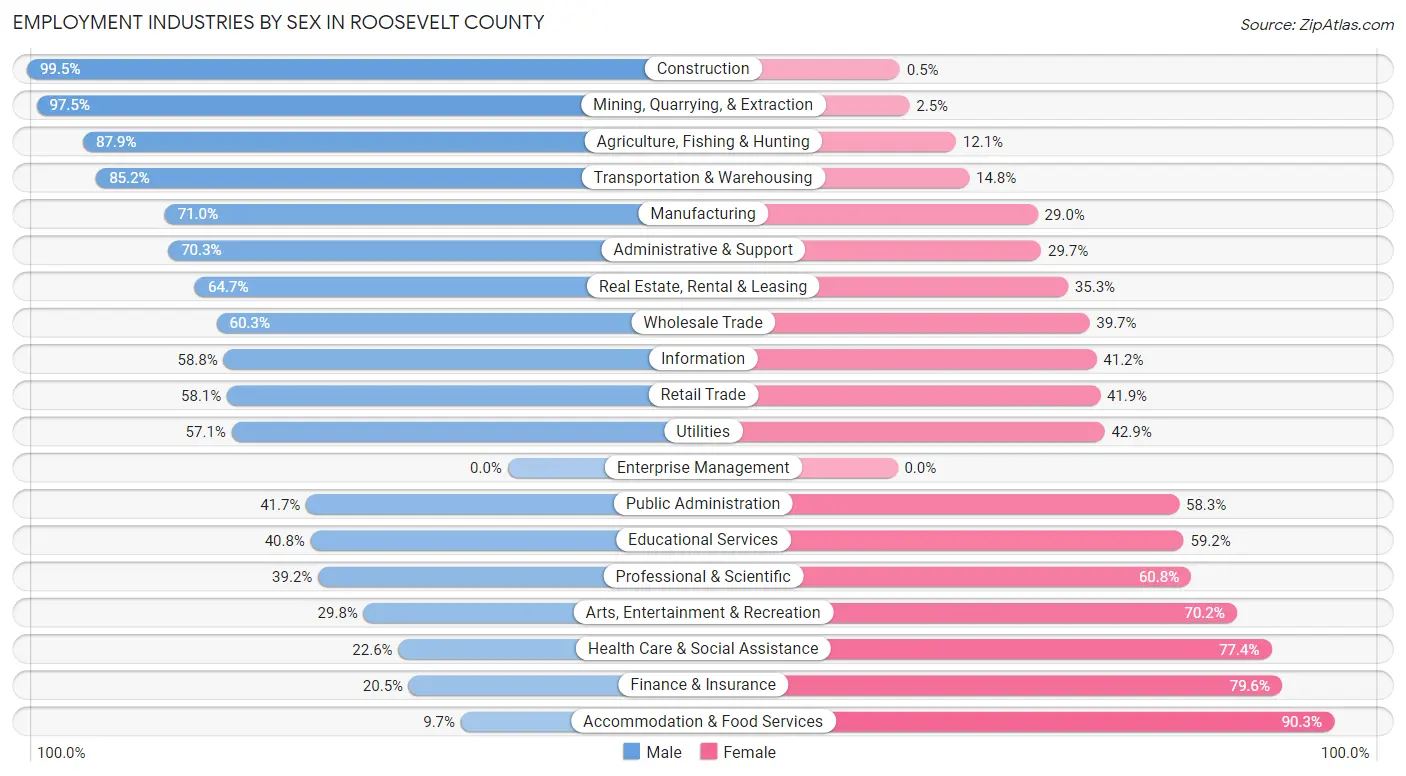
Employment Industries by Sex in Roosevelt County
The Roosevelt County industries that see more men than women are Construction (99.5%), Mining, Quarrying, & Extraction (97.5%), and Agriculture, Fishing & Hunting (87.9%), whereas the industries that tend to have a higher number of women are Accommodation & Food Services (90.3%), Finance & Insurance (79.5%), and Health Care & Social Assistance (77.4%).
| Industry | Male | Female |
| Agriculture, Fishing & Hunting | 247 (87.9%) | 34 (12.1%) |
| Mining, Quarrying, & Extraction | 79 (97.5%) | 2 (2.5%) |
| Construction | 199 (99.5%) | 1 (0.5%) |
| Manufacturing | 22 (71.0%) | 9 (29.0%) |
| Wholesale Trade | 44 (60.3%) | 29 (39.7%) |
| Retail Trade | 302 (58.1%) | 218 (41.9%) |
| Transportation & Warehousing | 109 (85.2%) | 19 (14.8%) |
| Utilities | 32 (57.1%) | 24 (42.9%) |
| Information | 30 (58.8%) | 21 (41.2%) |
| Finance & Insurance | 9 (20.4%) | 35 (79.5%) |
| Real Estate, Rental & Leasing | 22 (64.7%) | 12 (35.3%) |
| Professional & Scientific | 31 (39.2%) | 48 (60.8%) |
| Enterprise Management | 0 (0.0%) | 0 (0.0%) |
| Administrative & Support | 26 (70.3%) | 11 (29.7%) |
| Educational Services | 239 (40.8%) | 347 (59.2%) |
| Health Care & Social Assistance | 129 (22.6%) | 441 (77.4%) |
| Arts, Entertainment & Recreation | 17 (29.8%) | 40 (70.2%) |
| Accommodation & Food Services | 16 (9.7%) | 149 (90.3%) |
| Public Administration | 219 (41.7%) | 306 (58.3%) |
| Total | 1,879 (51.1%) | 1,796 (48.9%) |
Education in Roosevelt County
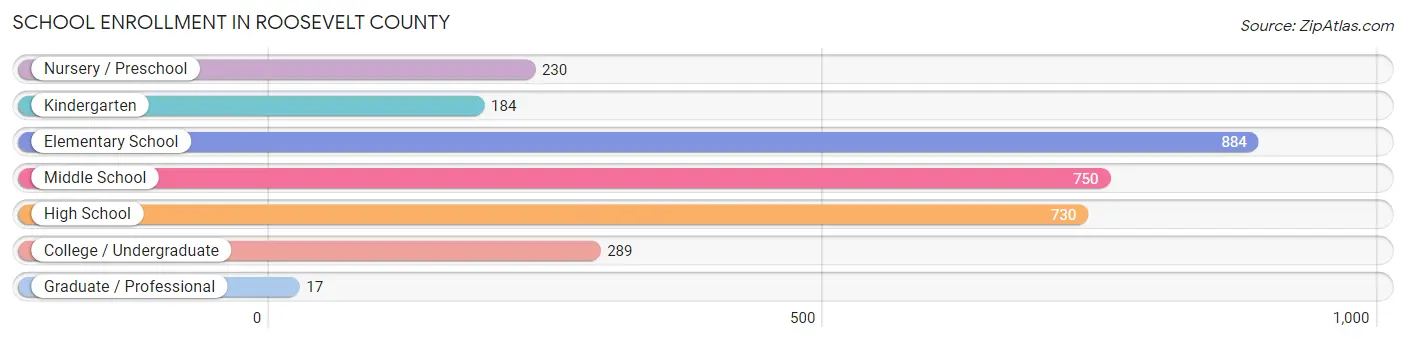
School Enrollment in Roosevelt County
The most common levels of schooling among the 3,084 students in Roosevelt County are elementary school (884 | 28.7%), middle school (750 | 24.3%), and high school (730 | 23.7%).
| School Level | # Students | % Students |
| Nursery / Preschool | 230 | 7.5% |
| Kindergarten | 184 | 6.0% |
| Elementary School | 884 | 28.7% |
| Middle School | 750 | 24.3% |
| High School | 730 | 23.7% |
| College / Undergraduate | 289 | 9.4% |
| Graduate / Professional | 17 | 0.5% |
| Total | 3,084 | 100.0% |
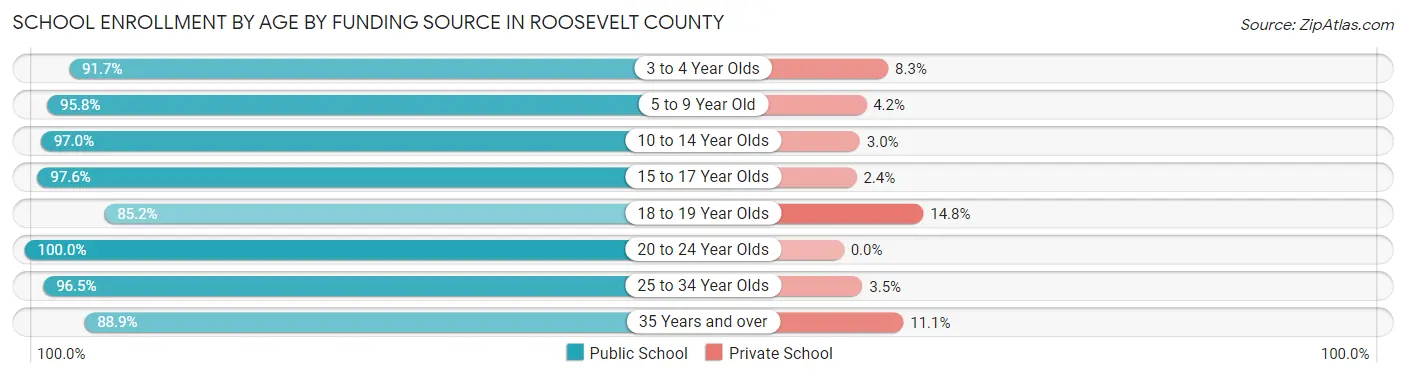
School Enrollment by Age by Funding Source in Roosevelt County
Out of a total of 3,084 students who are enrolled in schools in Roosevelt County, 139 (4.5%) attend a private institution, while the remaining 2,945 (95.5%) are enrolled in public schools. The age group of 18 to 19 year olds has the highest likelihood of being enrolled in private schools, with 31 (14.8% in the age bracket) enrolled. Conversely, the age group of 20 to 24 year olds has the lowest likelihood of being enrolled in a private school, with 87 (100.0% in the age bracket) attending a public institution.
| Age Bracket | Public School | Private School |
| 3 to 4 Year Olds | 177 (91.7%) | 16 (8.3%) |
| 5 to 9 Year Old | 936 (95.8%) | 41 (4.2%) |
| 10 to 14 Year Olds | 870 (97.0%) | 27 (3.0%) |
| 15 to 17 Year Olds | 530 (97.6%) | 13 (2.4%) |
| 18 to 19 Year Olds | 178 (85.2%) | 31 (14.8%) |
| 20 to 24 Year Olds | 87 (100.0%) | 0 (0.0%) |
| 25 to 34 Year Olds | 111 (96.5%) | 4 (3.5%) |
| 35 Years and over | 56 (88.9%) | 7 (11.1%) |
| Total | 2,945 (95.5%) | 139 (4.5%) |
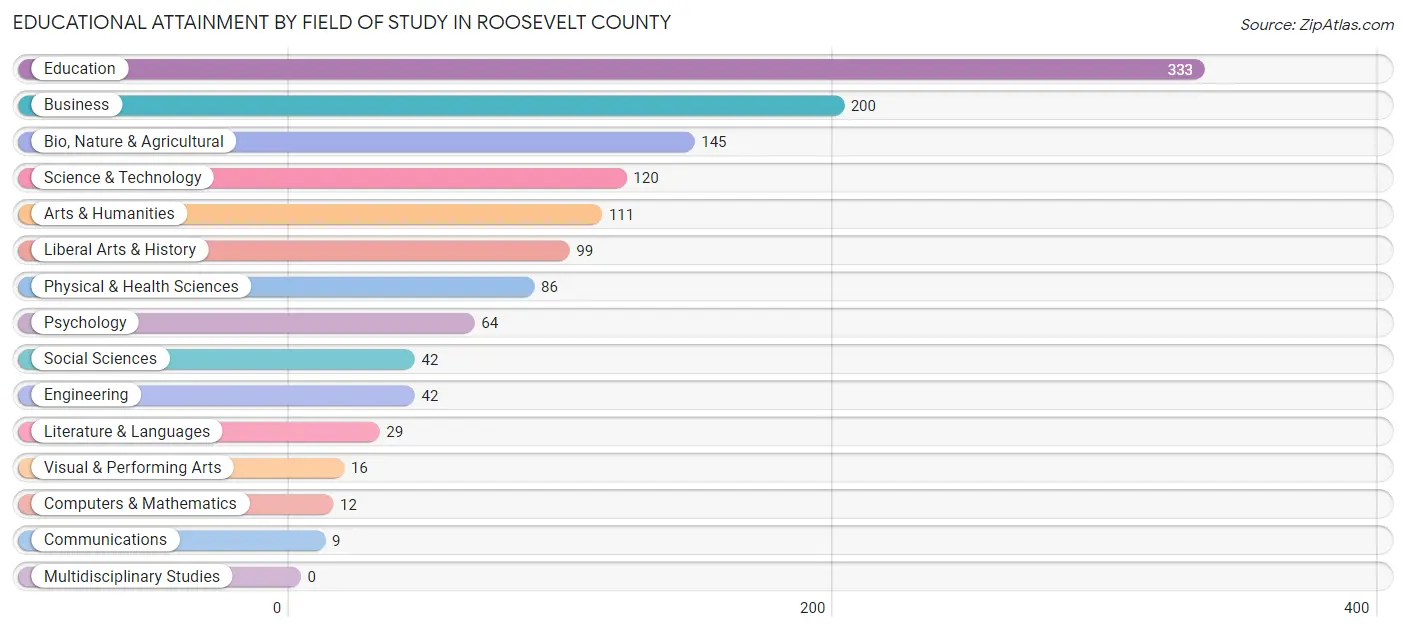
Educational Attainment by Field of Study in Roosevelt County
Education (333 | 25.5%), business (200 | 15.3%), bio, nature & agricultural (145 | 11.1%), science & technology (120 | 9.2%), and arts & humanities (111 | 8.5%) are the most common fields of study among 1,308 individuals in Roosevelt County who have obtained a bachelor's degree or higher.
| Field of Study | # Graduates | % Graduates |
| Computers & Mathematics | 12 | 0.9% |
| Bio, Nature & Agricultural | 145 | 11.1% |
| Physical & Health Sciences | 86 | 6.6% |
| Psychology | 64 | 4.9% |
| Social Sciences | 42 | 3.2% |
| Engineering | 42 | 3.2% |
| Multidisciplinary Studies | 0 | 0.0% |
| Science & Technology | 120 | 9.2% |
| Business | 200 | 15.3% |
| Education | 333 | 25.5% |
| Literature & Languages | 29 | 2.2% |
| Liberal Arts & History | 99 | 7.6% |
| Visual & Performing Arts | 16 | 1.2% |
| Communications | 9 | 0.7% |
| Arts & Humanities | 111 | 8.5% |
| Total | 1,308 | 100.0% |
Transportation & Commute in Roosevelt County
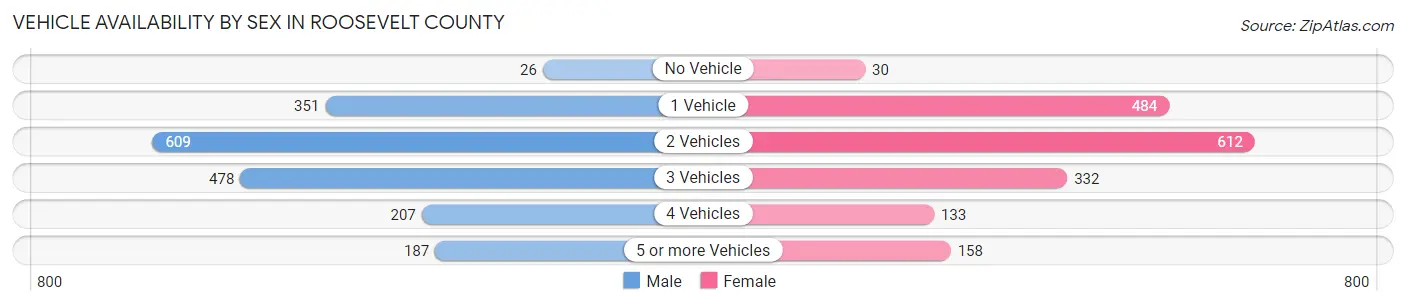
Vehicle Availability by Sex in Roosevelt County
The most prevalent vehicle ownership categories in Roosevelt County are males with 2 vehicles (609, accounting for 32.8%) and females with 2 vehicles (612, making up 34.8%).
| Vehicles Available | Male | Female |
| No Vehicle | 26 (1.4%) | 30 (1.7%) |
| 1 Vehicle | 351 (18.9%) | 484 (27.7%) |
| 2 Vehicles | 609 (32.8%) | 612 (35.0%) |
| 3 Vehicles | 478 (25.7%) | 332 (19.0%) |
| 4 Vehicles | 207 (11.1%) | 133 (7.6%) |
| 5 or more Vehicles | 187 (10.1%) | 158 (9.0%) |
| Total | 1,858 (100.0%) | 1,749 (100.0%) |
Commute Time in Roosevelt County
The most frequently occuring commute durations in Roosevelt County are 5 to 9 minutes (986 commuters, 28.3%), 10 to 14 minutes (571 commuters, 16.4%), and 30 to 34 minutes (416 commuters, 11.9%).
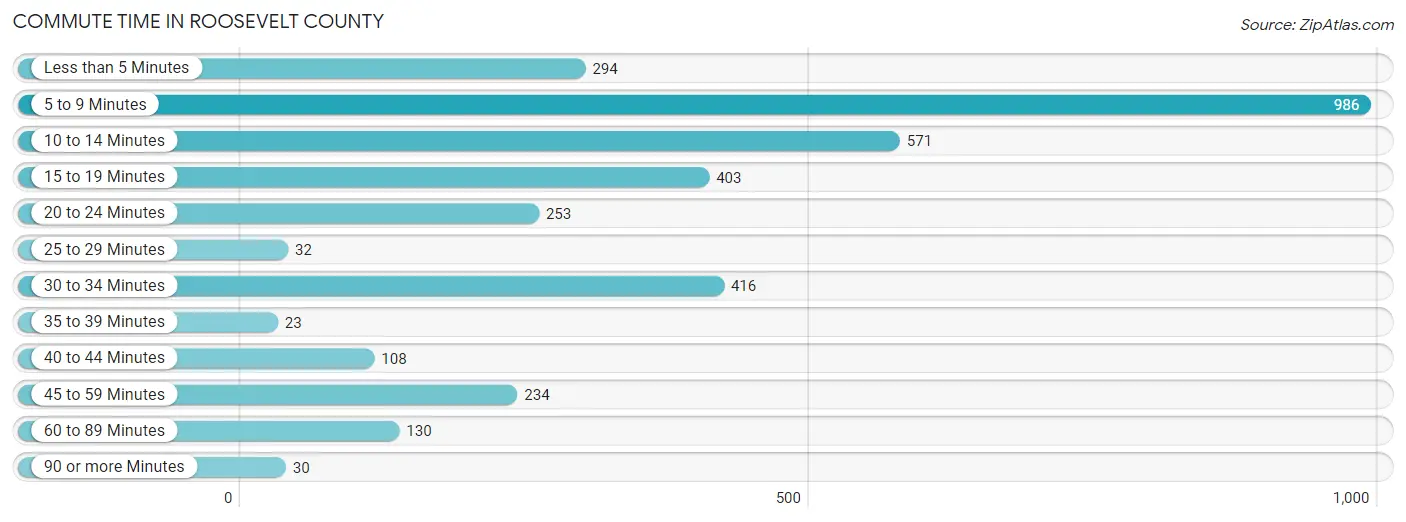
| Commute Time | # Commuters | % Commuters |
| Less than 5 Minutes | 294 | 8.5% |
| 5 to 9 Minutes | 986 | 28.3% |
| 10 to 14 Minutes | 571 | 16.4% |
| 15 to 19 Minutes | 403 | 11.6% |
| 20 to 24 Minutes | 253 | 7.3% |
| 25 to 29 Minutes | 32 | 0.9% |
| 30 to 34 Minutes | 416 | 11.9% |
| 35 to 39 Minutes | 23 | 0.7% |
| 40 to 44 Minutes | 108 | 3.1% |
| 45 to 59 Minutes | 234 | 6.7% |
| 60 to 89 Minutes | 130 | 3.7% |
| 90 or more Minutes | 30 | 0.9% |
Commute Time by Sex in Roosevelt County
The most common commute times in Roosevelt County are 5 to 9 minutes (420 commuters, 23.4%) for males and 5 to 9 minutes (566 commuters, 33.5%) for females.
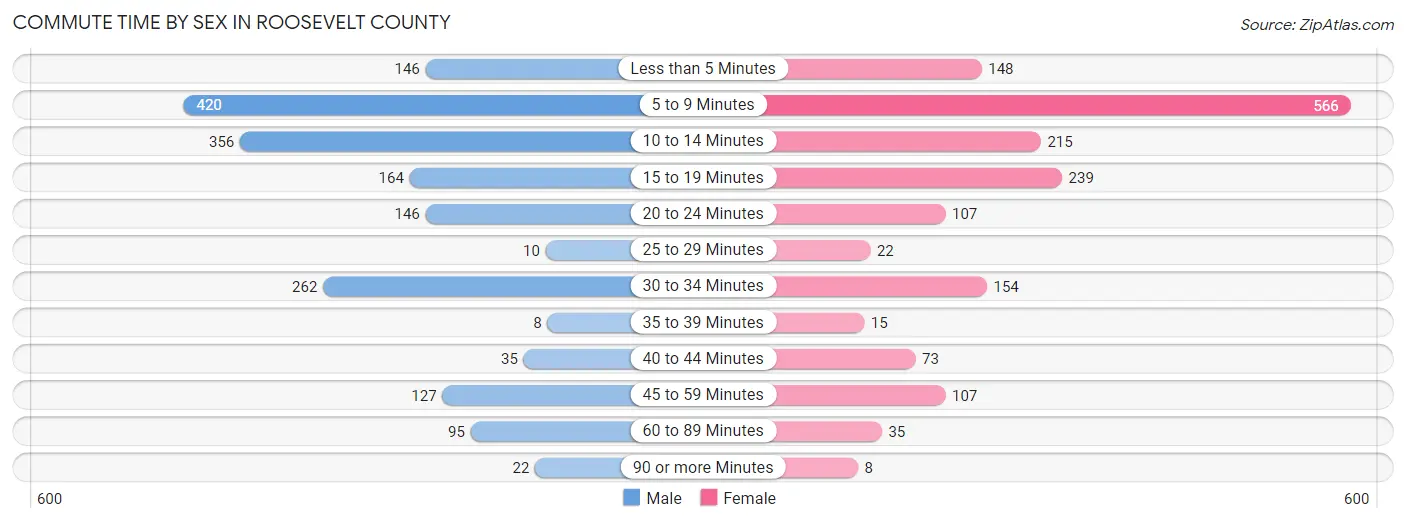
| Commute Time | Male | Female |
| Less than 5 Minutes | 146 (8.2%) | 148 (8.8%) |
| 5 to 9 Minutes | 420 (23.4%) | 566 (33.5%) |
| 10 to 14 Minutes | 356 (19.9%) | 215 (12.7%) |
| 15 to 19 Minutes | 164 (9.2%) | 239 (14.1%) |
| 20 to 24 Minutes | 146 (8.2%) | 107 (6.3%) |
| 25 to 29 Minutes | 10 (0.6%) | 22 (1.3%) |
| 30 to 34 Minutes | 262 (14.6%) | 154 (9.1%) |
| 35 to 39 Minutes | 8 (0.4%) | 15 (0.9%) |
| 40 to 44 Minutes | 35 (1.9%) | 73 (4.3%) |
| 45 to 59 Minutes | 127 (7.1%) | 107 (6.3%) |
| 60 to 89 Minutes | 95 (5.3%) | 35 (2.1%) |
| 90 or more Minutes | 22 (1.2%) | 8 (0.5%) |
Time of Departure to Work by Sex in Roosevelt County
The most frequent times of departure to work in Roosevelt County are 7:00 AM to 7:29 AM (432, 24.1%) for males and 7:30 AM to 7:59 AM (592, 35.0%) for females.
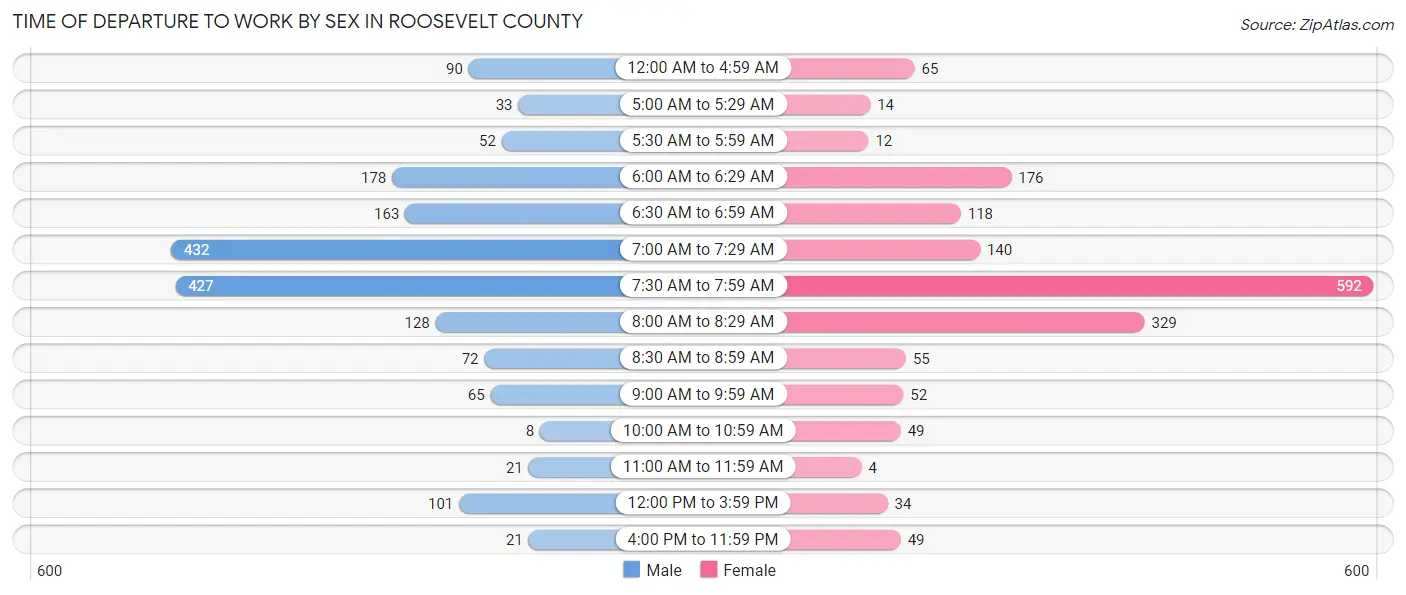
| Time of Departure | Male | Female |
| 12:00 AM to 4:59 AM | 90 (5.0%) | 65 (3.8%) |
| 5:00 AM to 5:29 AM | 33 (1.8%) | 14 (0.8%) |
| 5:30 AM to 5:59 AM | 52 (2.9%) | 12 (0.7%) |
| 6:00 AM to 6:29 AM | 178 (9.9%) | 176 (10.4%) |
| 6:30 AM to 6:59 AM | 163 (9.1%) | 118 (7.0%) |
| 7:00 AM to 7:29 AM | 432 (24.1%) | 140 (8.3%) |
| 7:30 AM to 7:59 AM | 427 (23.8%) | 592 (35.0%) |
| 8:00 AM to 8:29 AM | 128 (7.1%) | 329 (19.5%) |
| 8:30 AM to 8:59 AM | 72 (4.0%) | 55 (3.3%) |
| 9:00 AM to 9:59 AM | 65 (3.6%) | 52 (3.1%) |
| 10:00 AM to 10:59 AM | 8 (0.4%) | 49 (2.9%) |
| 11:00 AM to 11:59 AM | 21 (1.2%) | 4 (0.2%) |
| 12:00 PM to 3:59 PM | 101 (5.6%) | 34 (2.0%) |
| 4:00 PM to 11:59 PM | 21 (1.2%) | 49 (2.9%) |
| Total | 1,791 (100.0%) | 1,689 (100.0%) |
Housing Occupancy in Roosevelt County
Occupancy by Ownership in Roosevelt County
Of the total 3,050 dwellings in Roosevelt County, owner-occupied units account for 2,002 (65.6%), while renter-occupied units make up 1,048 (34.4%).
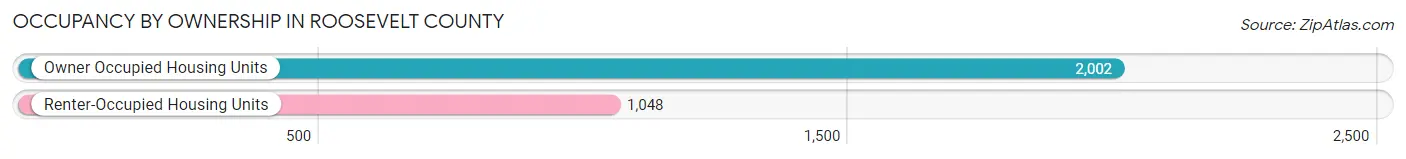
| Occupancy | # Housing Units | % Housing Units |
| Owner Occupied Housing Units | 2,002 | 65.6% |
| Renter-Occupied Housing Units | 1,048 | 34.4% |
| Total Occupied Housing Units | 3,050 | 100.0% |
Occupancy by Household Size in Roosevelt County
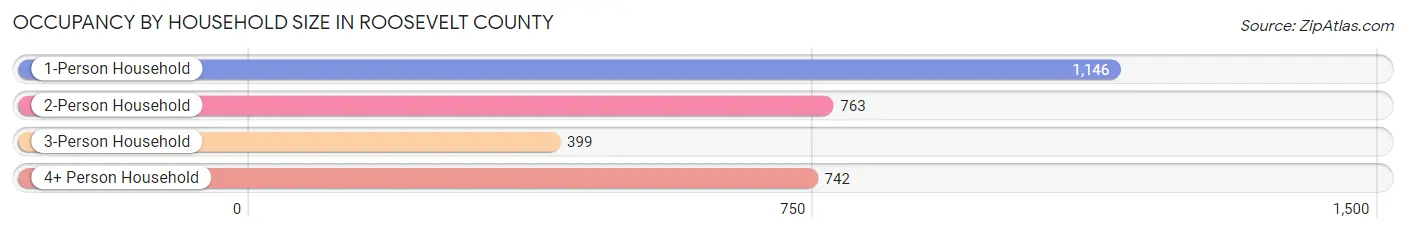
| Household Size | # Housing Units | % Housing Units |
| 1-Person Household | 1,146 | 37.6% |
| 2-Person Household | 763 | 25.0% |
| 3-Person Household | 399 | 13.1% |
| 4+ Person Household | 742 | 24.3% |
| Total Housing Units | 3,050 | 100.0% |
Occupancy by Ownership by Household Size in Roosevelt County
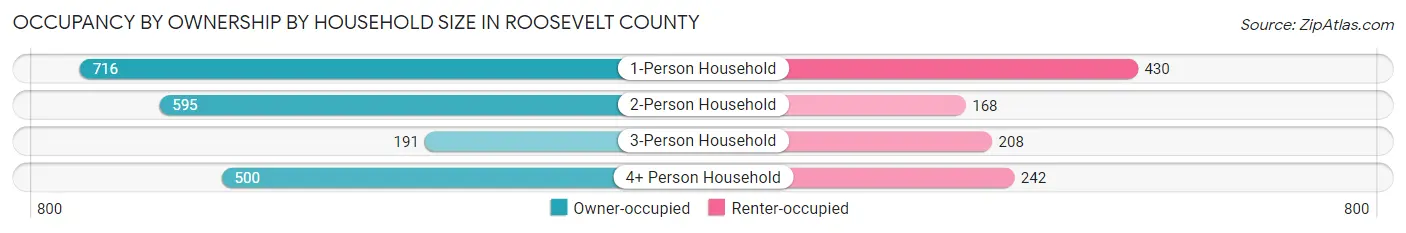
| Household Size | Owner-occupied | Renter-occupied |
| 1-Person Household | 716 (62.5%) | 430 (37.5%) |
| 2-Person Household | 595 (78.0%) | 168 (22.0%) |
| 3-Person Household | 191 (47.9%) | 208 (52.1%) |
| 4+ Person Household | 500 (67.4%) | 242 (32.6%) |
| Total Housing Units | 2,002 (65.6%) | 1,048 (34.4%) |
Occupancy by Educational Attainment in Roosevelt County
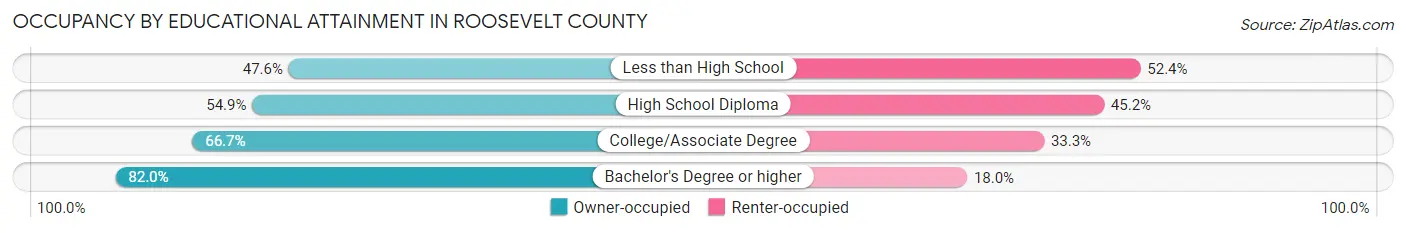
| Household Size | Owner-occupied | Renter-occupied |
| Less than High School | 90 (47.6%) | 99 (52.4%) |
| High School Diploma | 481 (54.8%) | 396 (45.2%) |
| College/Associate Degree | 857 (66.7%) | 427 (33.3%) |
| Bachelor's Degree or higher | 574 (82.0%) | 126 (18.0%) |
Occupancy by Age of Householder in Roosevelt County
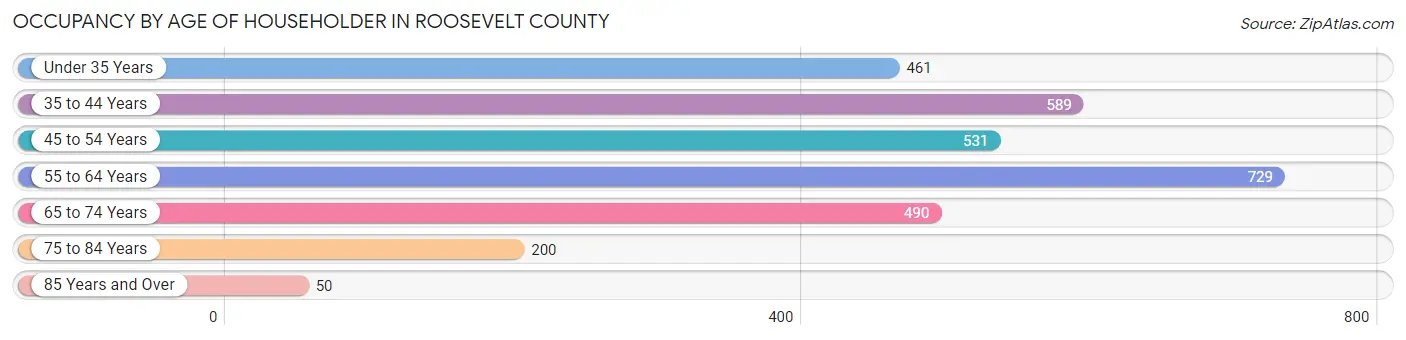
| Age Bracket | # Households | % Households |
| Under 35 Years | 461 | 15.1% |
| 35 to 44 Years | 589 | 19.3% |
| 45 to 54 Years | 531 | 17.4% |
| 55 to 64 Years | 729 | 23.9% |
| 65 to 74 Years | 490 | 16.1% |
| 75 to 84 Years | 200 | 6.6% |
| 85 Years and Over | 50 | 1.6% |
| Total | 3,050 | 100.0% |
Housing Finances in Roosevelt County
Median Income by Occupancy in Roosevelt County
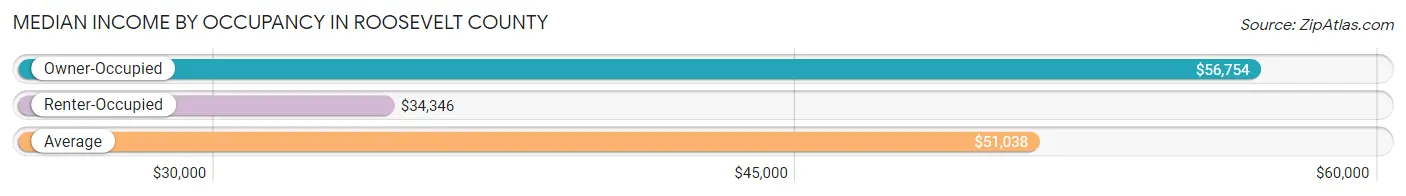
| Occupancy Type | # Households | Median Income |
| Owner-Occupied | 2,002 (65.6%) | $56,754 |
| Renter-Occupied | 1,048 (34.4%) | $34,346 |
| Average | 3,050 (100.0%) | $51,038 |
Occupancy by Householder Income Bracket in Roosevelt County
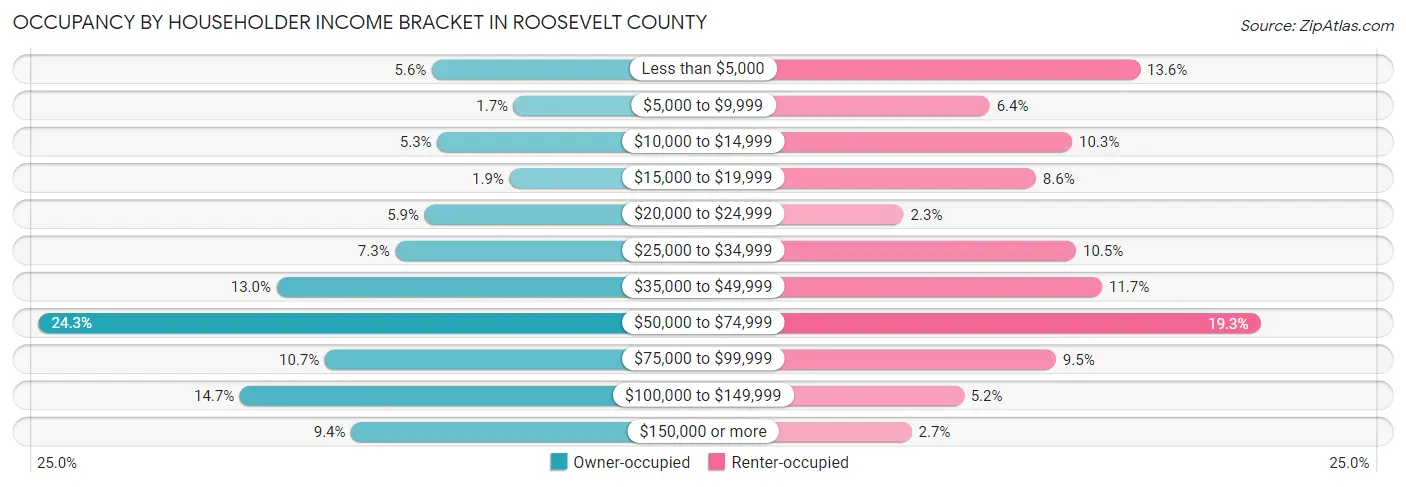
| Income Bracket | Owner-occupied | Renter-occupied |
| Less than $5,000 | 112 (5.6%) | 142 (13.6%) |
| $5,000 to $9,999 | 34 (1.7%) | 67 (6.4%) |
| $10,000 to $14,999 | 107 (5.3%) | 108 (10.3%) |
| $15,000 to $19,999 | 38 (1.9%) | 90 (8.6%) |
| $20,000 to $24,999 | 119 (5.9%) | 24 (2.3%) |
| $25,000 to $34,999 | 147 (7.3%) | 110 (10.5%) |
| $35,000 to $49,999 | 260 (13.0%) | 123 (11.7%) |
| $50,000 to $74,999 | 487 (24.3%) | 202 (19.3%) |
| $75,000 to $99,999 | 214 (10.7%) | 100 (9.5%) |
| $100,000 to $149,999 | 295 (14.7%) | 54 (5.1%) |
| $150,000 or more | 189 (9.4%) | 28 (2.7%) |
| Total | 2,002 (100.0%) | 1,048 (100.0%) |
Monthly Housing Cost Tiers in Roosevelt County
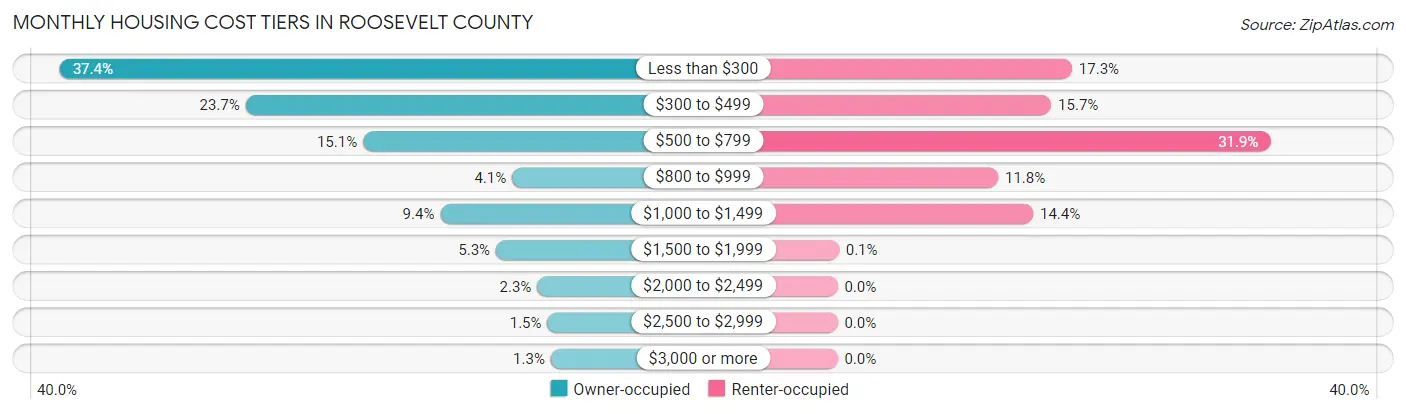
| Monthly Cost | Owner-occupied | Renter-occupied |
| Less than $300 | 749 (37.4%) | 181 (17.3%) |
| $300 to $499 | 475 (23.7%) | 165 (15.7%) |
| $500 to $799 | 302 (15.1%) | 334 (31.9%) |
| $800 to $999 | 82 (4.1%) | 124 (11.8%) |
| $1,000 to $1,499 | 188 (9.4%) | 151 (14.4%) |
| $1,500 to $1,999 | 106 (5.3%) | 1 (0.1%) |
| $2,000 to $2,499 | 45 (2.2%) | 0 (0.0%) |
| $2,500 to $2,999 | 30 (1.5%) | 0 (0.0%) |
| $3,000 or more | 25 (1.3%) | 0 (0.0%) |
| Total | 2,002 (100.0%) | 1,048 (100.0%) |
Physical Housing Characteristics in Roosevelt County
Housing Structures in Roosevelt County
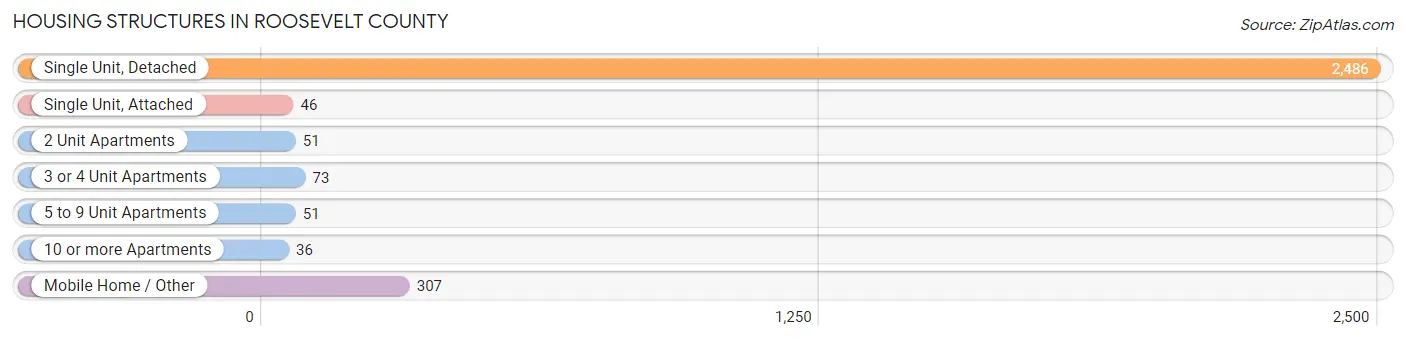
| Structure Type | # Housing Units | % Housing Units |
| Single Unit, Detached | 2,486 | 81.5% |
| Single Unit, Attached | 46 | 1.5% |
| 2 Unit Apartments | 51 | 1.7% |
| 3 or 4 Unit Apartments | 73 | 2.4% |
| 5 to 9 Unit Apartments | 51 | 1.7% |
| 10 or more Apartments | 36 | 1.2% |
| Mobile Home / Other | 307 | 10.1% |
| Total | 3,050 | 100.0% |
Housing Structures by Occupancy in Roosevelt County
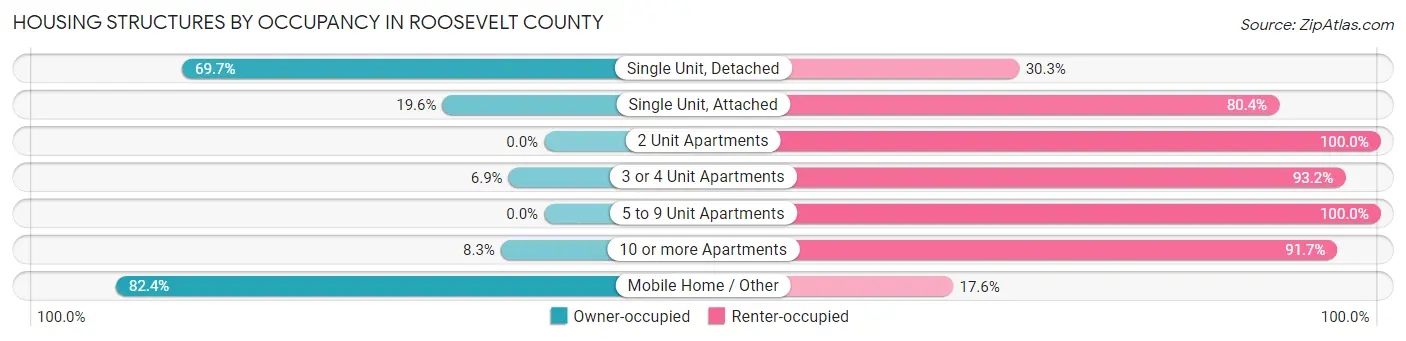
| Structure Type | Owner-occupied | Renter-occupied |
| Single Unit, Detached | 1,732 (69.7%) | 754 (30.3%) |
| Single Unit, Attached | 9 (19.6%) | 37 (80.4%) |
| 2 Unit Apartments | 0 (0.0%) | 51 (100.0%) |
| 3 or 4 Unit Apartments | 5 (6.9%) | 68 (93.1%) |
| 5 to 9 Unit Apartments | 0 (0.0%) | 51 (100.0%) |
| 10 or more Apartments | 3 (8.3%) | 33 (91.7%) |
| Mobile Home / Other | 253 (82.4%) | 54 (17.6%) |
| Total | 2,002 (65.6%) | 1,048 (34.4%) |
Housing Structures by Number of Rooms in Roosevelt County
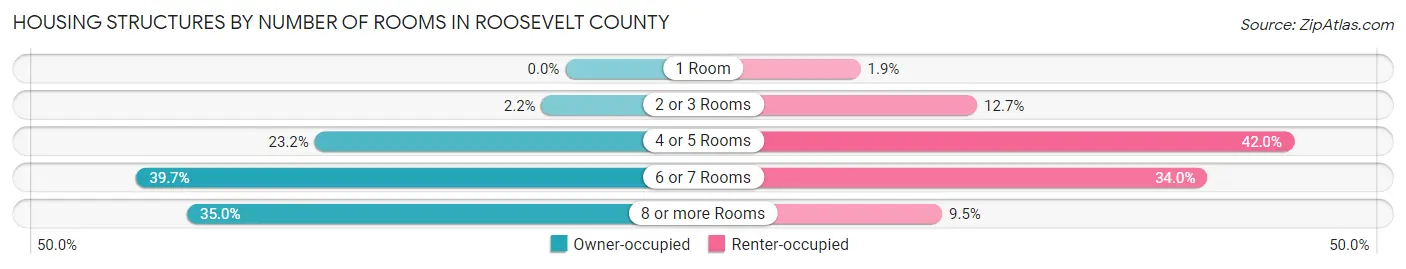
| Number of Rooms | Owner-occupied | Renter-occupied |
| 1 Room | 0 (0.0%) | 20 (1.9%) |
| 2 or 3 Rooms | 44 (2.2%) | 133 (12.7%) |
| 4 or 5 Rooms | 464 (23.2%) | 440 (42.0%) |
| 6 or 7 Rooms | 794 (39.7%) | 356 (34.0%) |
| 8 or more Rooms | 700 (35.0%) | 99 (9.5%) |
| Total | 2,002 (100.0%) | 1,048 (100.0%) |
Housing Structure by Heating Type in Roosevelt County
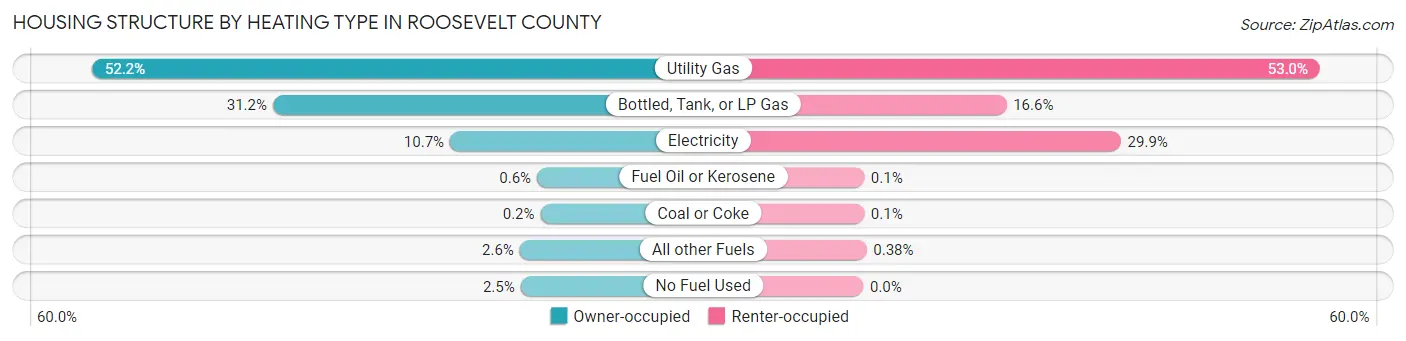
| Heating Type | Owner-occupied | Renter-occupied |
| Utility Gas | 1,045 (52.2%) | 555 (53.0%) |
| Bottled, Tank, or LP Gas | 625 (31.2%) | 174 (16.6%) |
| Electricity | 214 (10.7%) | 313 (29.9%) |
| Fuel Oil or Kerosene | 12 (0.6%) | 1 (0.1%) |
| Coal or Coke | 4 (0.2%) | 1 (0.1%) |
| All other Fuels | 52 (2.6%) | 4 (0.4%) |
| No Fuel Used | 50 (2.5%) | 0 (0.0%) |
| Total | 2,002 (100.0%) | 1,048 (100.0%) |
Household Vehicle Usage in Roosevelt County
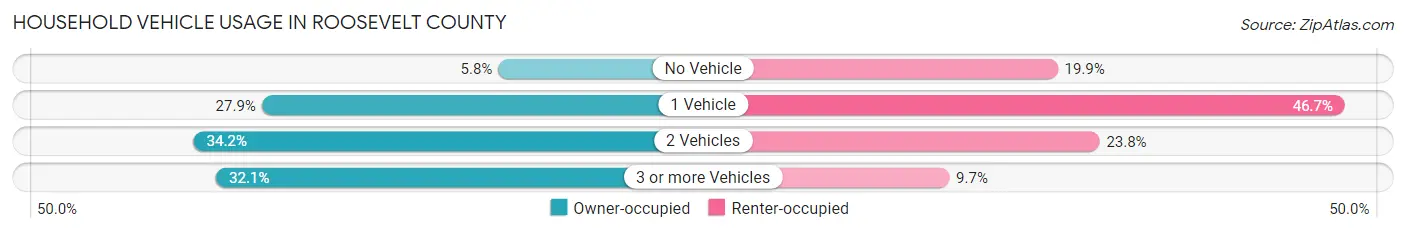
| Vehicles per Household | Owner-occupied | Renter-occupied |
| No Vehicle | 116 (5.8%) | 208 (19.9%) |
| 1 Vehicle | 558 (27.9%) | 489 (46.7%) |
| 2 Vehicles | 685 (34.2%) | 249 (23.8%) |
| 3 or more Vehicles | 643 (32.1%) | 102 (9.7%) |
| Total | 2,002 (100.0%) | 1,048 (100.0%) |
Real Estate & Mortgages in Roosevelt County
Real Estate and Mortgage Overview in Roosevelt County
| Characteristic | Without Mortgage | With Mortgage |
| Housing Units | 1,560 | 442 |
| Median Property Value | $94,800 | $205,300 |
| Median Household Income | $51,944 | $93 |
| Monthly Housing Costs | $311 | $22 |
| Real Estate Taxes | $1,435 | $17 |
Property Value by Mortgage Status in Roosevelt County
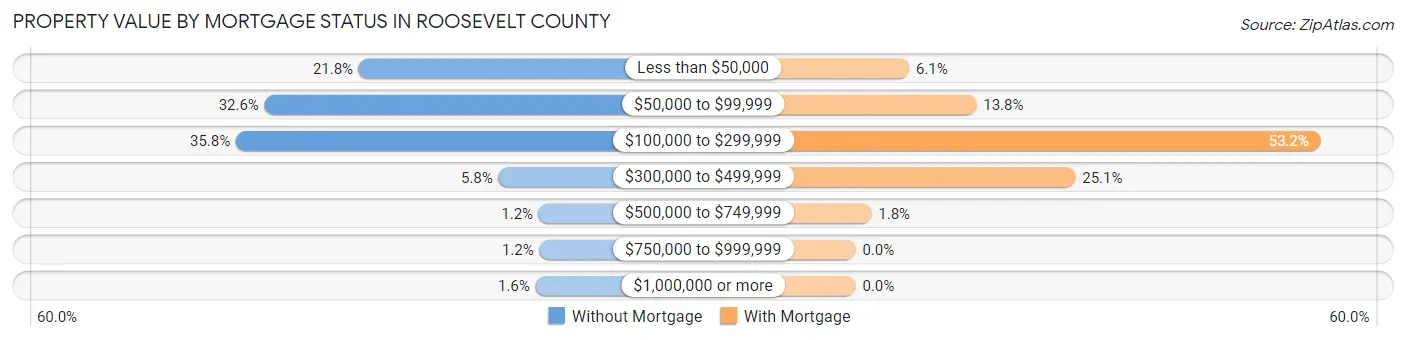
| Property Value | Without Mortgage | With Mortgage |
| Less than $50,000 | 340 (21.8%) | 27 (6.1%) |
| $50,000 to $99,999 | 508 (32.6%) | 61 (13.8%) |
| $100,000 to $299,999 | 559 (35.8%) | 235 (53.2%) |
| $300,000 to $499,999 | 91 (5.8%) | 111 (25.1%) |
| $500,000 to $749,999 | 19 (1.2%) | 8 (1.8%) |
| $750,000 to $999,999 | 18 (1.1%) | 0 (0.0%) |
| $1,000,000 or more | 25 (1.6%) | 0 (0.0%) |
| Total | 1,560 (100.0%) | 442 (100.0%) |
Household Income by Mortgage Status in Roosevelt County
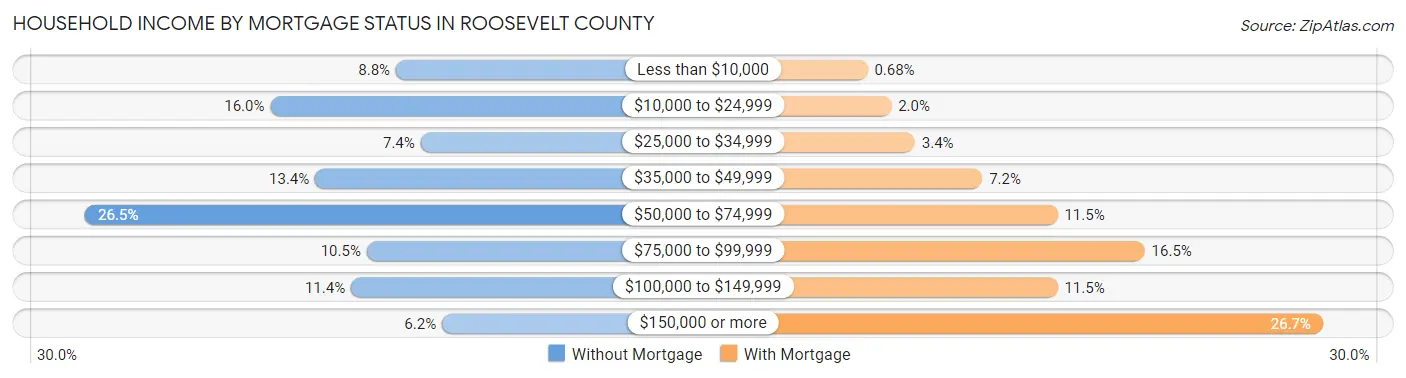
| Household Income | Without Mortgage | With Mortgage |
| Less than $10,000 | 137 (8.8%) | 3 (0.7%) |
| $10,000 to $24,999 | 249 (16.0%) | 9 (2.0%) |
| $25,000 to $34,999 | 115 (7.4%) | 15 (3.4%) |
| $35,000 to $49,999 | 209 (13.4%) | 32 (7.2%) |
| $50,000 to $74,999 | 414 (26.5%) | 51 (11.5%) |
| $75,000 to $99,999 | 163 (10.4%) | 73 (16.5%) |
| $100,000 to $149,999 | 177 (11.4%) | 51 (11.5%) |
| $150,000 or more | 96 (6.1%) | 118 (26.7%) |
| Total | 1,560 (100.0%) | 442 (100.0%) |
Property Value to Household Income Ratio in Roosevelt County
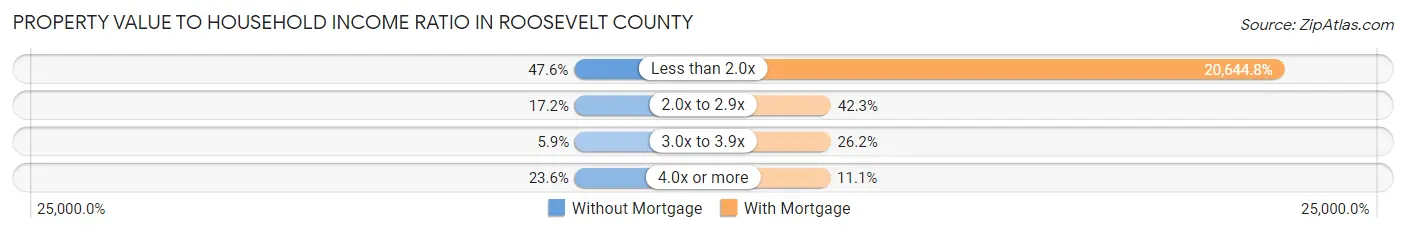
| Value-to-Income Ratio | Without Mortgage | With Mortgage |
| Less than 2.0x | 743 (47.6%) | 91,250 (20,644.8%) |
| 2.0x to 2.9x | 269 (17.2%) | 187 (42.3%) |
| 3.0x to 3.9x | 92 (5.9%) | 116 (26.2%) |
| 4.0x or more | 368 (23.6%) | 49 (11.1%) |
| Total | 1,560 (100.0%) | 442 (100.0%) |
Real Estate Taxes by Mortgage Status in Roosevelt County
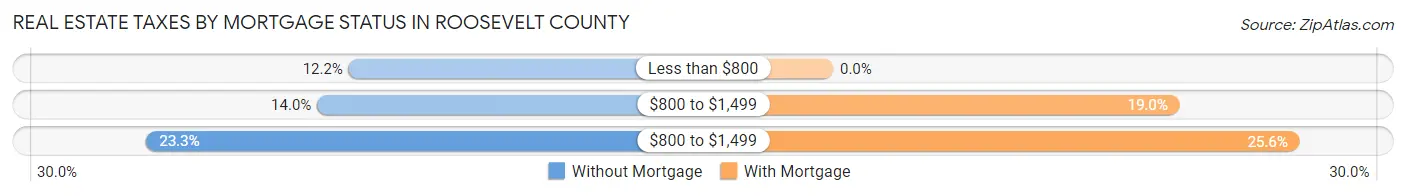
| Property Taxes | Without Mortgage | With Mortgage |
| Less than $800 | 191 (12.2%) | 0 (0.0%) |
| $800 to $1,499 | 218 (14.0%) | 84 (19.0%) |
| $800 to $1,499 | 364 (23.3%) | 113 (25.6%) |
| Total | 1,560 (100.0%) | 442 (100.0%) |
Health & Disability in Roosevelt County
Health Insurance Coverage by Age in Roosevelt County
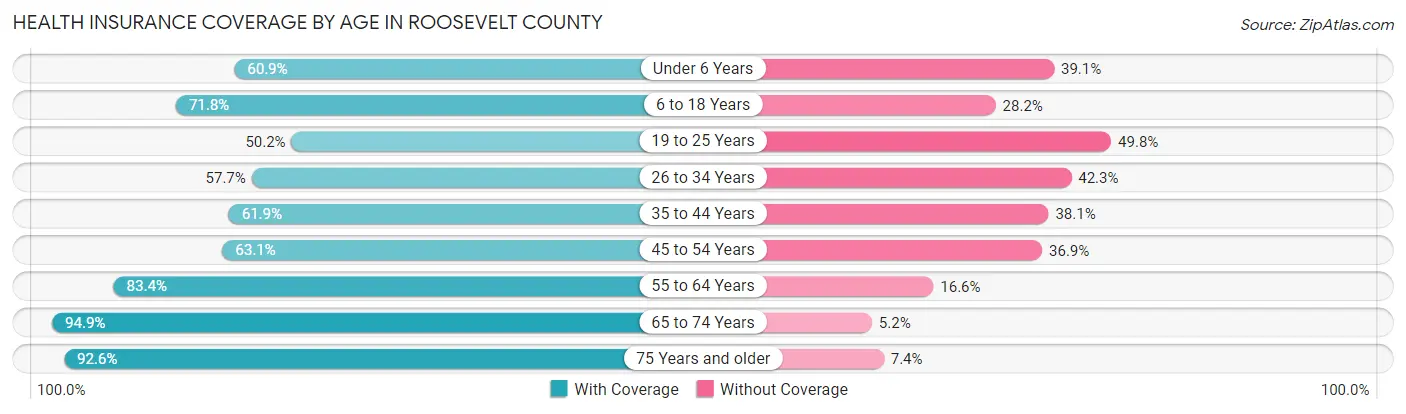
| Age Bracket | With Coverage | Without Coverage |
| Under 6 Years | 705 (60.9%) | 453 (39.1%) |
| 6 to 18 Years | 1,894 (71.8%) | 745 (28.2%) |
| 19 to 25 Years | 523 (50.2%) | 518 (49.8%) |
| 26 to 34 Years | 677 (57.7%) | 497 (42.3%) |
| 35 to 44 Years | 753 (61.9%) | 463 (38.1%) |
| 45 to 54 Years | 621 (63.1%) | 363 (36.9%) |
| 55 to 64 Years | 1,029 (83.4%) | 205 (16.6%) |
| 65 to 74 Years | 718 (94.9%) | 39 (5.1%) |
| 75 Years and older | 340 (92.6%) | 27 (7.4%) |
| Total | 7,260 (68.7%) | 3,310 (31.3%) |
Health Insurance Coverage by Citizenship Status in Roosevelt County
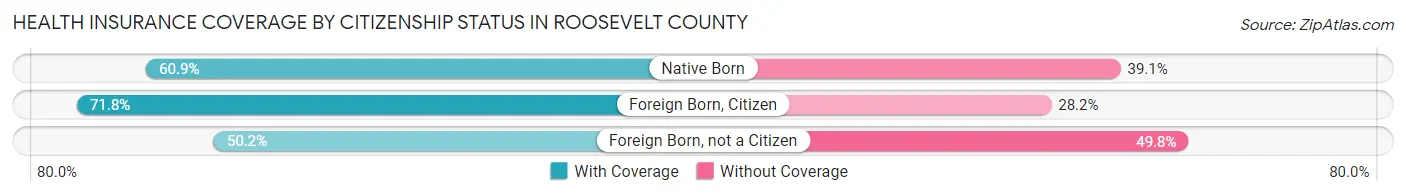
| Citizenship Status | With Coverage | Without Coverage |
| Native Born | 705 (60.9%) | 453 (39.1%) |
| Foreign Born, Citizen | 1,894 (71.8%) | 745 (28.2%) |
| Foreign Born, not a Citizen | 523 (50.2%) | 518 (49.8%) |
Health Insurance Coverage by Household Income in Roosevelt County
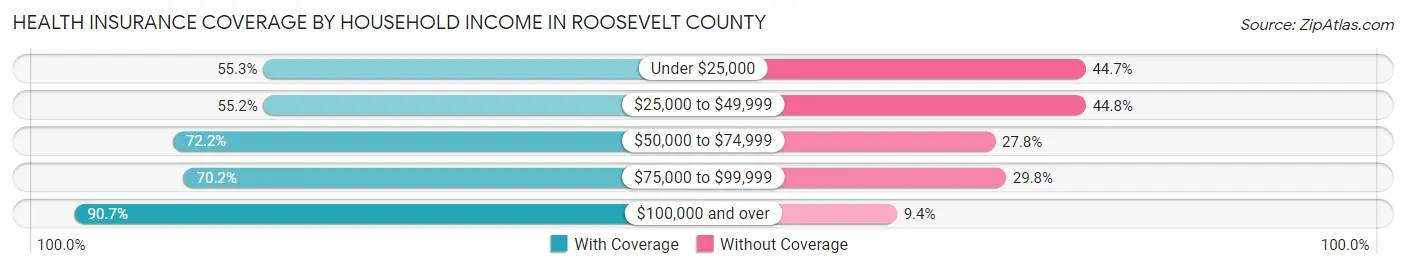
| Household Income | With Coverage | Without Coverage |
| Under $25,000 | 1,250 (55.3%) | 1,011 (44.7%) |
| $25,000 to $49,999 | 1,277 (55.2%) | 1,035 (44.8%) |
| $50,000 to $74,999 | 1,577 (72.2%) | 607 (27.8%) |
| $75,000 to $99,999 | 1,013 (70.2%) | 430 (29.8%) |
| $100,000 and over | 2,093 (90.6%) | 216 (9.3%) |
Public vs Private Health Insurance Coverage by Age in Roosevelt County
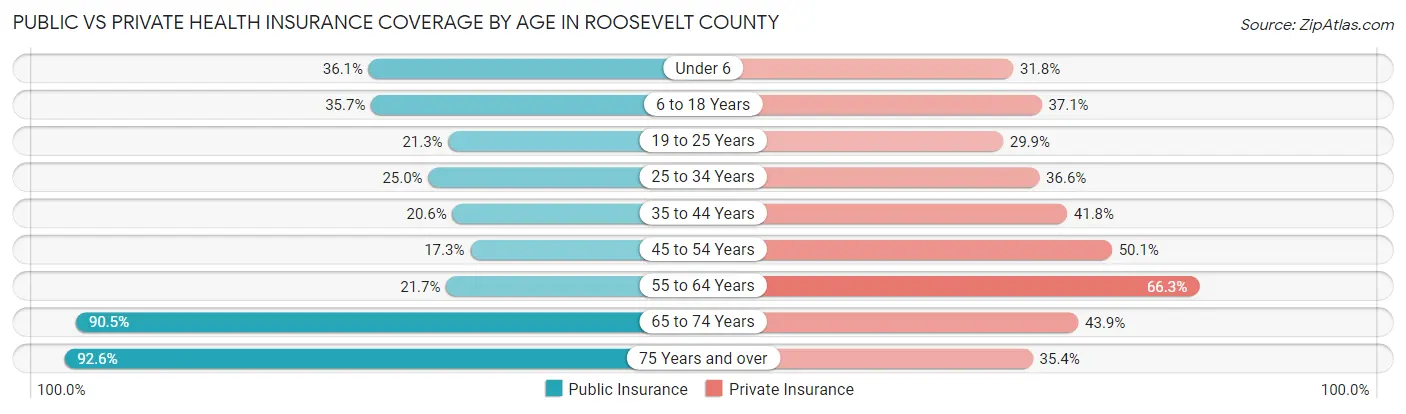
| Age Bracket | Public Insurance | Private Insurance |
| Under 6 | 418 (36.1%) | 368 (31.8%) |
| 6 to 18 Years | 941 (35.7%) | 978 (37.1%) |
| 19 to 25 Years | 222 (21.3%) | 311 (29.9%) |
| 25 to 34 Years | 294 (25.0%) | 430 (36.6%) |
| 35 to 44 Years | 250 (20.6%) | 508 (41.8%) |
| 45 to 54 Years | 170 (17.3%) | 493 (50.1%) |
| 55 to 64 Years | 268 (21.7%) | 818 (66.3%) |
| 65 to 74 Years | 685 (90.5%) | 332 (43.9%) |
| 75 Years and over | 340 (92.6%) | 130 (35.4%) |
| Total | 3,588 (34.0%) | 4,368 (41.3%) |
Disability Status by Sex by Age in Roosevelt County
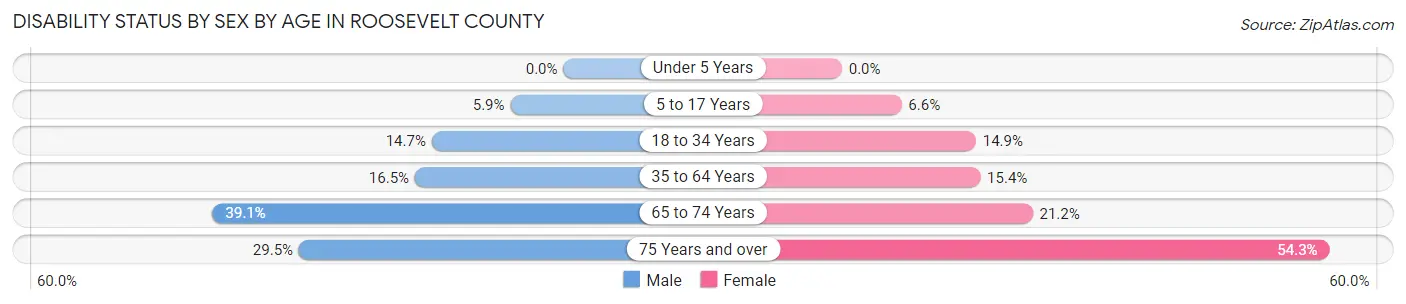
| Age Bracket | Male | Female |
| Under 5 Years | 0 (0.0%) | 0 (0.0%) |
| 5 to 17 Years | 80 (5.9%) | 83 (6.6%) |
| 18 to 34 Years | 183 (14.7%) | 175 (14.9%) |
| 35 to 64 Years | 279 (16.5%) | 269 (15.4%) |
| 65 to 74 Years | 145 (39.1%) | 82 (21.2%) |
| 75 Years and over | 43 (29.4%) | 120 (54.3%) |
Disability Class by Sex by Age in Roosevelt County
Disability Class: Hearing Difficulty
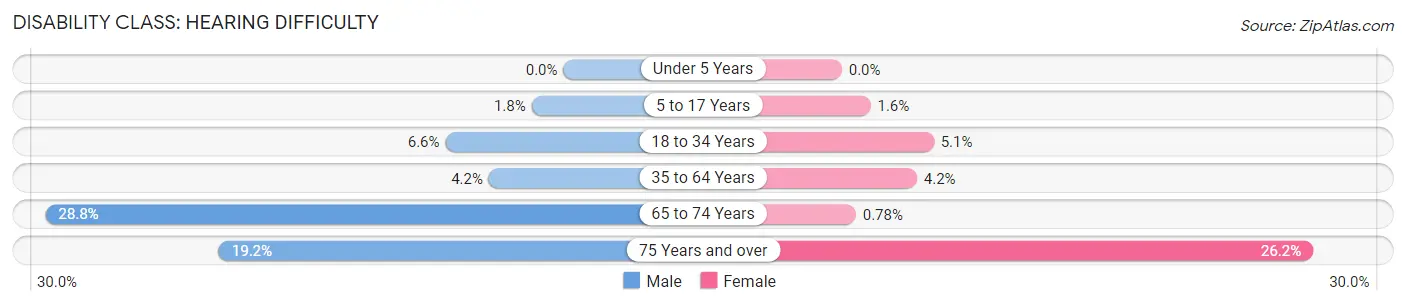
| Age Bracket | Male | Female |
| Under 5 Years | 0 (0.0%) | 0 (0.0%) |
| 5 to 17 Years | 24 (1.8%) | 20 (1.6%) |
| 18 to 34 Years | 82 (6.6%) | 60 (5.1%) |
| 35 to 64 Years | 70 (4.2%) | 73 (4.2%) |
| 65 to 74 Years | 107 (28.8%) | 3 (0.8%) |
| 75 Years and over | 28 (19.2%) | 58 (26.2%) |
Disability Class: Vision Difficulty
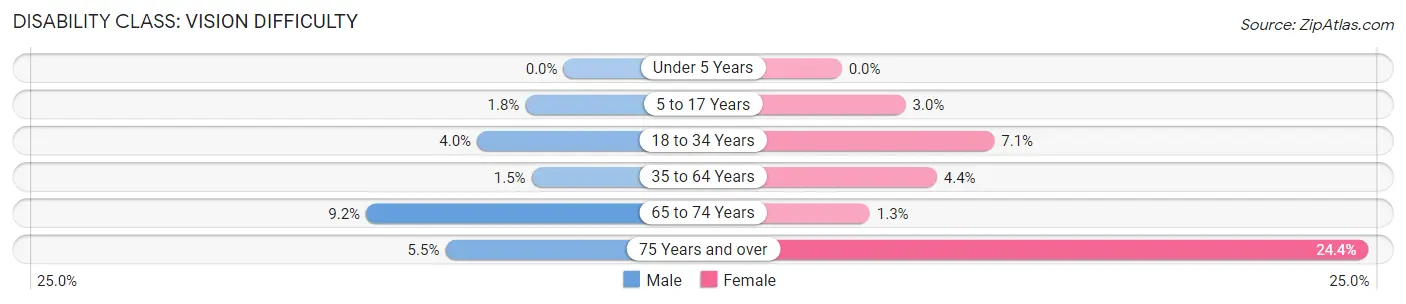
| Age Bracket | Male | Female |
| Under 5 Years | 0 (0.0%) | 0 (0.0%) |
| 5 to 17 Years | 24 (1.8%) | 37 (3.0%) |
| 18 to 34 Years | 50 (4.0%) | 83 (7.1%) |
| 35 to 64 Years | 25 (1.5%) | 77 (4.4%) |
| 65 to 74 Years | 34 (9.2%) | 5 (1.3%) |
| 75 Years and over | 8 (5.5%) | 54 (24.4%) |
Disability Class: Cognitive Difficulty
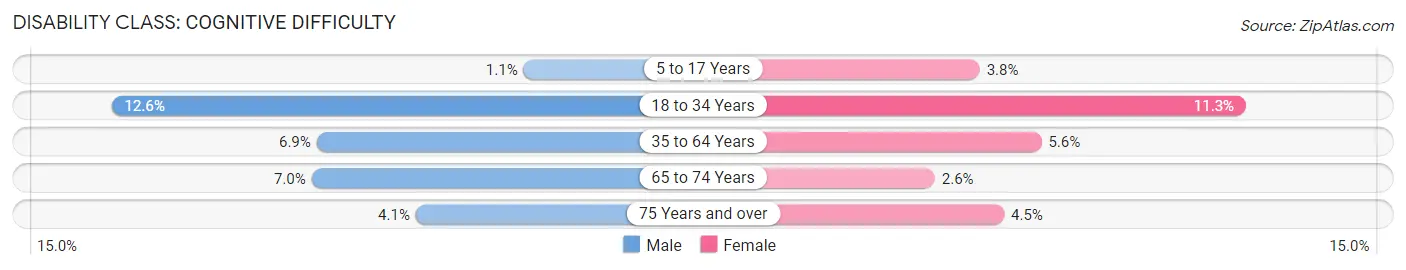
| Age Bracket | Male | Female |
| 5 to 17 Years | 15 (1.1%) | 48 (3.8%) |
| 18 to 34 Years | 157 (12.6%) | 132 (11.3%) |
| 35 to 64 Years | 116 (6.9%) | 97 (5.6%) |
| 65 to 74 Years | 26 (7.0%) | 10 (2.6%) |
| 75 Years and over | 6 (4.1%) | 10 (4.5%) |
Disability Class: Ambulatory Difficulty
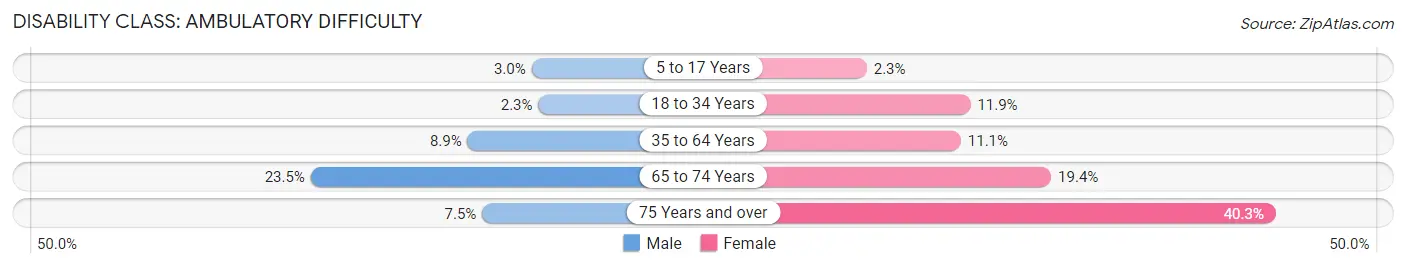
| Age Bracket | Male | Female |
| 5 to 17 Years | 40 (2.9%) | 29 (2.3%) |
| 18 to 34 Years | 29 (2.3%) | 140 (11.9%) |
| 35 to 64 Years | 150 (8.9%) | 193 (11.1%) |
| 65 to 74 Years | 87 (23.4%) | 75 (19.4%) |
| 75 Years and over | 11 (7.5%) | 89 (40.3%) |
Disability Class: Self-Care Difficulty
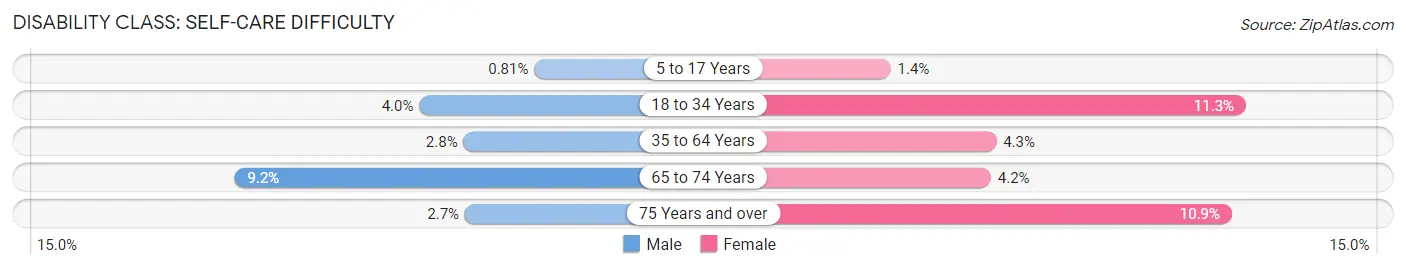
| Age Bracket | Male | Female |
| 5 to 17 Years | 11 (0.8%) | 17 (1.4%) |
| 18 to 34 Years | 50 (4.0%) | 132 (11.3%) |
| 35 to 64 Years | 47 (2.8%) | 75 (4.3%) |
| 65 to 74 Years | 34 (9.2%) | 16 (4.2%) |
| 75 Years and over | 4 (2.7%) | 24 (10.9%) |
Technology Access in Roosevelt County
Computing Device Access in Roosevelt County
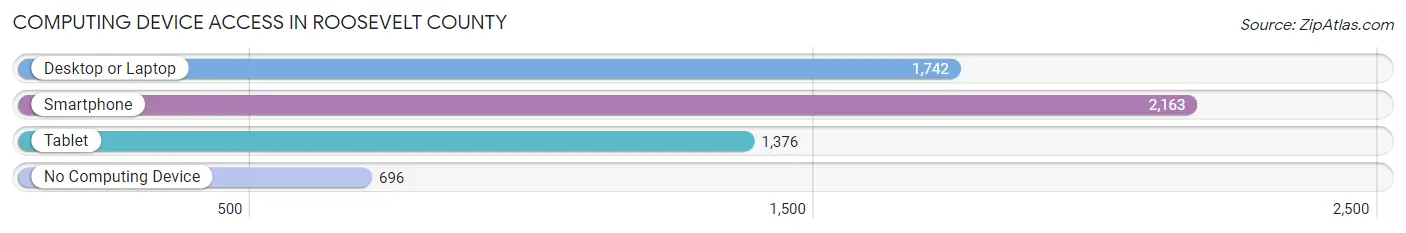
| Device Type | # Households | % Households |
| Desktop or Laptop | 1,742 | 57.1% |
| Smartphone | 2,163 | 70.9% |
| Tablet | 1,376 | 45.1% |
| No Computing Device | 696 | 22.8% |
| Total | 3,050 | 100.0% |
Internet Access in Roosevelt County
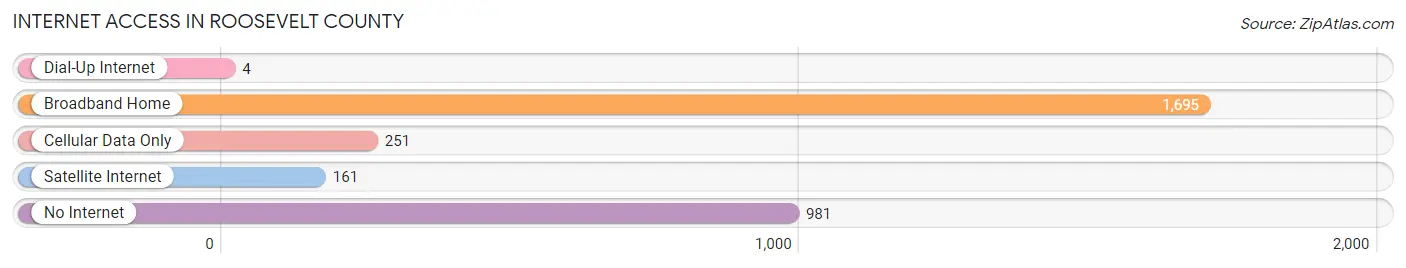
| Internet Type | # Households | % Households |
| Dial-Up Internet | 4 | 0.1% |
| Broadband Home | 1,695 | 55.6% |
| Cellular Data Only | 251 | 8.2% |
| Satellite Internet | 161 | 5.3% |
| No Internet | 981 | 32.2% |
| Total | 3,050 | 100.0% |
Roosevelt County Summary
Roosevelt County, Montana is located in the northeastern corner of the state, bordered by the Canadian provinces of Saskatchewan and Manitoba to the north, and the states of North Dakota and South Dakota to the east. The county seat is Wolf Point, and the county is named after former President Theodore Roosevelt.
Geography
Roosevelt County covers an area of 2,717 square miles, making it the fourth largest county in Montana. The terrain is mostly flat, with rolling hills in the east and south. The county is drained by the Milk River, which flows through the county from north to south. The county is home to several lakes, including Lake Elwell, Lake Elmo, and Lake Francis. The county is also home to the Fort Peck Indian Reservation, which covers a large portion of the county.
Climate
Roosevelt County has a semi-arid climate, with hot summers and cold winters. The average annual temperature is 48°F, with an average high of 79°F in July and an average low of 17°F in January. The average annual precipitation is 13.5 inches, with most of the precipitation falling in the spring and summer months.
Demographics
As of the 2010 census, Roosevelt County had a population of 10,425. The population was spread out, with 48.3% male and 51.7% female. The median age was 36.7 years. The racial makeup of the county was 84.2% White, 0.7% African American, 10.3% Native American, 0.3% Asian, 0.1% Pacific Islander, 0.7% from other races, and 3.7% from two or more races. Hispanic or Latino of any race were 3.2% of the population.
Economy
The economy of Roosevelt County is largely based on agriculture and ranching. The county is home to several large cattle ranches, as well as wheat, barley, and hay farms. The county is also home to several oil and gas fields, which provide jobs for many of the county's residents. The county is also home to several manufacturing companies, including a large meat packing plant.
The county is also home to several tourist attractions, including the Fort Peck Dam and Lake, the Fort Peck Indian Reservation, and the Charles M. Russell National Wildlife Refuge. These attractions bring in tourists from all over the country, providing a boost to the local economy.
Conclusion
Roosevelt County, Montana is a large, rural county located in the northeastern corner of the state. The county is home to a diverse population, with a strong agricultural and ranching economy. The county is also home to several tourist attractions, which bring in visitors from all over the country. Roosevelt County is a great place to live, work, and visit.
Common Questions
What is Per Capita Income in Roosevelt County?
Per Capita income in Roosevelt County is $20,564.
What is the Median Family Income in Roosevelt County?
Median Family Income in Roosevelt County is $60,457.
What is the Median Household income in Roosevelt County?
Median Household Income in Roosevelt County is $51,038.
What is Income or Wage Gap in Roosevelt County?
Income or Wage Gap in Roosevelt County is 12.3%.
Women in Roosevelt County earn 87.7 cents for every dollar earned by a man.
What is Family Income Deficit in Roosevelt County?
Family Income Deficit in Roosevelt County is $11,559.
Families that are below poverty line in Roosevelt County earn $11,559 less on average than the poverty threshold level.
What is Inequality or Gini Index in Roosevelt County?
Inequality or Gini Index in Roosevelt County is 0.45.
What is the Total Population of Roosevelt County?
Total Population of Roosevelt County is 10,799.
What is the Total Male Population of Roosevelt County?
Total Male Population of Roosevelt County is 5,464.
What is the Total Female Population of Roosevelt County?
Total Female Population of Roosevelt County is 5,335.
What is the Ratio of Males per 100 Females in Roosevelt County?
There are 102.42 Males per 100 Females in Roosevelt County.
What is the Ratio of Females per 100 Males in Roosevelt County?
There are 97.64 Females per 100 Males in Roosevelt County.
What is the Median Population Age in Roosevelt County?
Median Population Age in Roosevelt County is 30.4 Years.
What is the Average Family Size in Roosevelt County
Average Family Size in Roosevelt County is 4.8 People.
What is the Average Household Size in Roosevelt County
Average Household Size in Roosevelt County is 3.5 People.
How Large is the Labor Force in Roosevelt County?
There are 4,028 People in the Labor Forcein in Roosevelt County.
What is the Percentage of People in the Labor Force in Roosevelt County?
53.2% of People are in the Labor Force in Roosevelt County.
What is the Unemployment Rate in Roosevelt County?
Unemployment Rate in Roosevelt County is 8.6%.