Missoula County, MT Map & Demographics
Missoula County Map
Missoula County Overview
$40,311
PER CAPITA INCOME
$89,466
AVG FAMILY INCOME
$66,840
AVG HOUSEHOLD INCOME
16.1%
WAGE / INCOME GAP [ % ]
83.9¢/ $1
WAGE / INCOME GAP [ $ ]
$9,310
FAMILY INCOME DEFICIT
0.47
INEQUALITY / GINI INDEX
118,541
TOTAL POPULATION
59,633
MALE POPULATION
58,908
FEMALE POPULATION
101.23
MALES / 100 FEMALES
98.78
FEMALES / 100 MALES
36.7
MEDIAN AGE
2.9
AVG FAMILY SIZE
2.3
AVG HOUSEHOLD SIZE
69,490
LABOR FORCE [ PEOPLE ]
70.0%
PERCENT IN LABOR FORCE
4.5%
UNEMPLOYMENT RATE
Missoula County Area Codes
Income in Missoula County
Income Overview in Missoula County
Per Capita Income in Missoula County is $40,311, while median incomes of families and households are $89,466 and $66,840 respectively.
| Characteristic | Number | Measure |
| Per Capita Income | 118,541 | $40,311 |
| Median Family Income | 27,804 | $89,466 |
| Mean Family Income | 27,804 | $118,315 |
| Median Household Income | 50,446 | $66,840 |
| Mean Household Income | 50,446 | $92,834 |
| Income Deficit | 27,804 | $9,310 |
| Wage / Income Gap (%) | 118,541 | 16.09% |
| Wage / Income Gap ($) | 118,541 | 83.91¢ per $1 |
| Gini / Inequality Index | 118,541 | 0.47 |
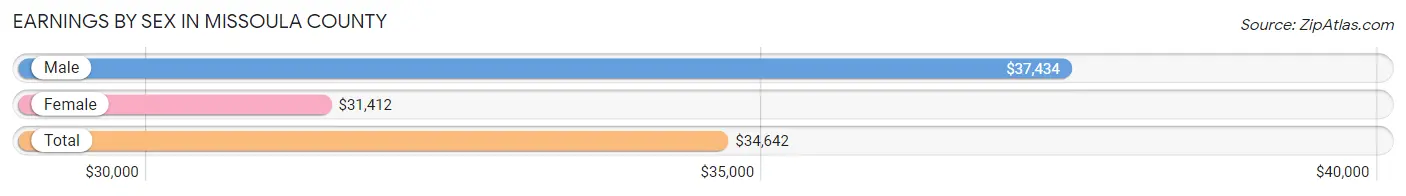
Earnings by Sex in Missoula County
Average Earnings in Missoula County are $34,642, $37,434 for men and $31,412 for women, a difference of 16.1%.
| Sex | Number | Average Earnings |
| Male | 38,756 (52.2%) | $37,434 |
| Female | 35,482 (47.8%) | $31,412 |
| Total | 74,238 (100.0%) | $34,642 |
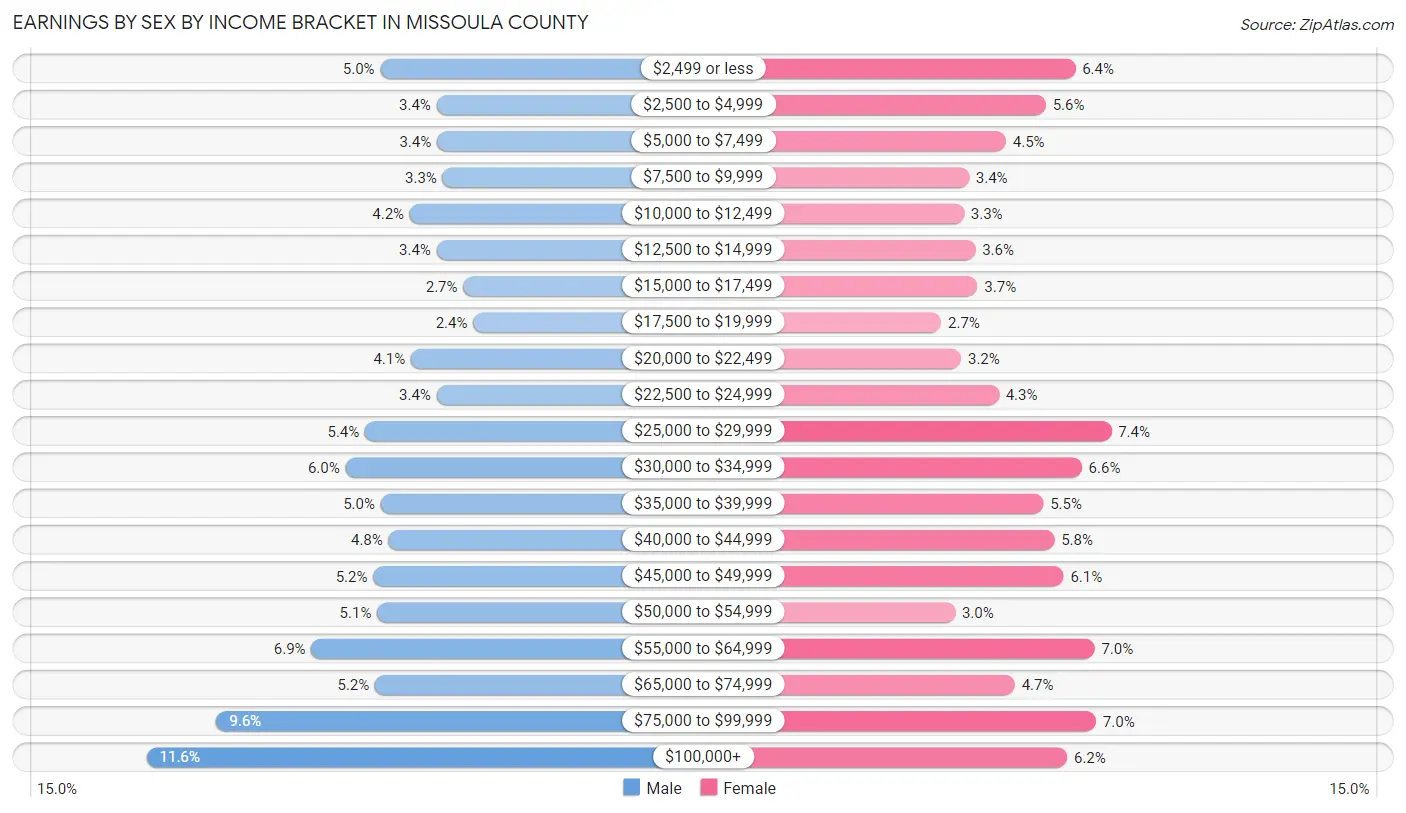
Earnings by Sex by Income Bracket in Missoula County
The most common earnings brackets in Missoula County are $100,000+ for men (4,483 | 11.6%) and $25,000 to $29,999 for women (2,635 | 7.4%).
| Income | Male | Female |
| $2,499 or less | 1,937 (5.0%) | 2,277 (6.4%) |
| $2,500 to $4,999 | 1,324 (3.4%) | 1,985 (5.6%) |
| $5,000 to $7,499 | 1,323 (3.4%) | 1,587 (4.5%) |
| $7,500 to $9,999 | 1,259 (3.3%) | 1,218 (3.4%) |
| $10,000 to $12,499 | 1,618 (4.2%) | 1,167 (3.3%) |
| $12,500 to $14,999 | 1,325 (3.4%) | 1,281 (3.6%) |
| $15,000 to $17,499 | 1,035 (2.7%) | 1,302 (3.7%) |
| $17,500 to $19,999 | 925 (2.4%) | 940 (2.6%) |
| $20,000 to $22,499 | 1,603 (4.1%) | 1,140 (3.2%) |
| $22,500 to $24,999 | 1,325 (3.4%) | 1,516 (4.3%) |
| $25,000 to $29,999 | 2,104 (5.4%) | 2,635 (7.4%) |
| $30,000 to $34,999 | 2,317 (6.0%) | 2,341 (6.6%) |
| $35,000 to $39,999 | 1,935 (5.0%) | 1,958 (5.5%) |
| $40,000 to $44,999 | 1,847 (4.8%) | 2,070 (5.8%) |
| $45,000 to $49,999 | 2,014 (5.2%) | 2,161 (6.1%) |
| $50,000 to $54,999 | 1,974 (5.1%) | 1,078 (3.0%) |
| $55,000 to $64,999 | 2,689 (6.9%) | 2,470 (7.0%) |
| $65,000 to $74,999 | 1,994 (5.1%) | 1,673 (4.7%) |
| $75,000 to $99,999 | 3,725 (9.6%) | 2,485 (7.0%) |
| $100,000+ | 4,483 (11.6%) | 2,198 (6.2%) |
| Total | 38,756 (100.0%) | 35,482 (100.0%) |
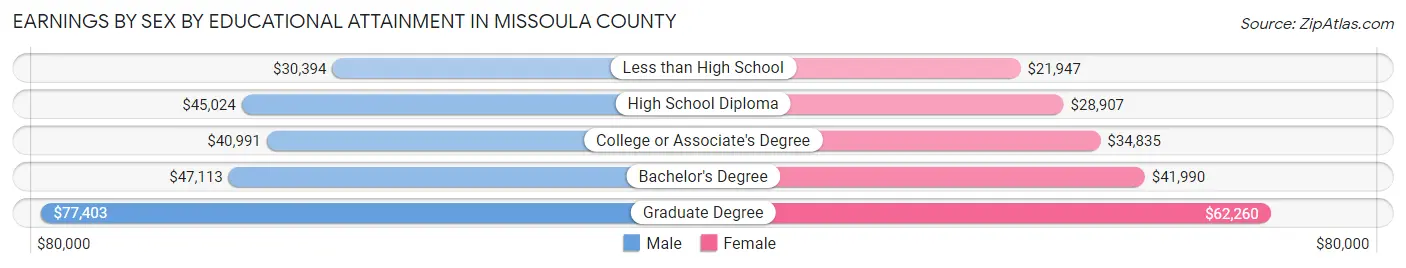
Earnings by Sex by Educational Attainment in Missoula County
Average earnings in Missoula County are $46,937 for men and $39,912 for women, a difference of 15.0%. Men with an educational attainment of graduate degree enjoy the highest average annual earnings of $77,403, while those with less than high school education earn the least with $30,394. Women with an educational attainment of graduate degree earn the most with the average annual earnings of $62,260, while those with less than high school education have the smallest earnings of $21,947.
| Educational Attainment | Male Income | Female Income |
| Less than High School | $30,394 | $21,947 |
| High School Diploma | $45,024 | $28,907 |
| College or Associate's Degree | $40,991 | $34,835 |
| Bachelor's Degree | $47,113 | $41,990 |
| Graduate Degree | $77,403 | $62,260 |
| Total | $46,937 | $39,912 |
Family Income in Missoula County
Family Income Brackets in Missoula County
According to the Missoula County family income data, there are 5,922 families falling into the $100,000 to $149,999 income range, which is the most common income bracket and makes up 21.3% of all families. Conversely, the $10,000 to $14,999 income bracket is the least frequent group with only 278 families (1.0%) belonging to this category.
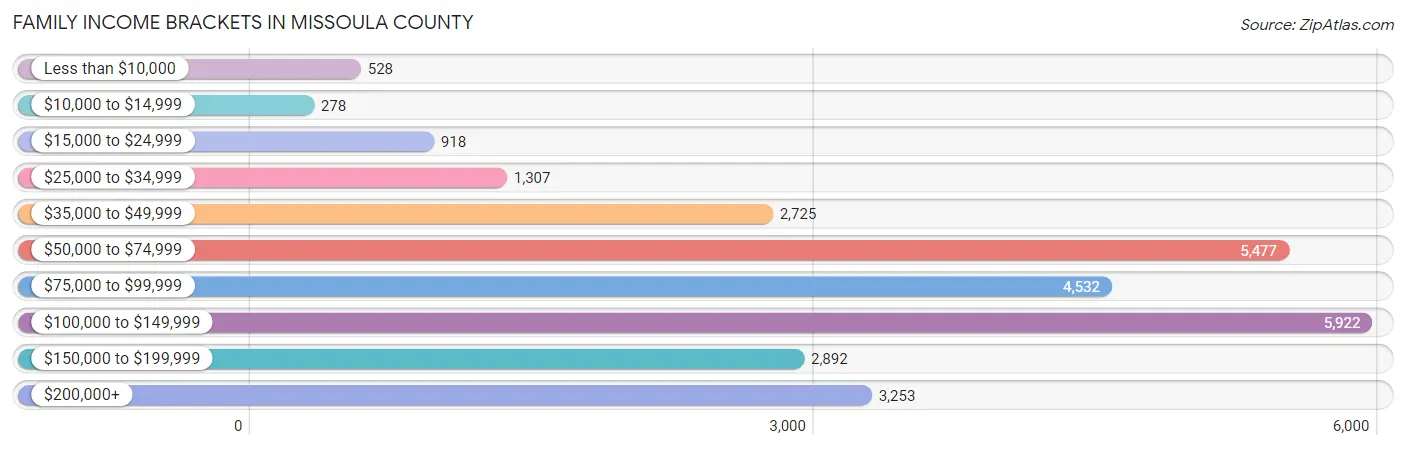
| Income Bracket | # Families | % Families |
| Less than $10,000 | 528 | 1.9% |
| $10,000 to $14,999 | 278 | 1.0% |
| $15,000 to $24,999 | 918 | 3.3% |
| $25,000 to $34,999 | 1,307 | 4.7% |
| $35,000 to $49,999 | 2,725 | 9.8% |
| $50,000 to $74,999 | 5,477 | 19.7% |
| $75,000 to $99,999 | 4,532 | 16.3% |
| $100,000 to $149,999 | 5,922 | 21.3% |
| $150,000 to $199,999 | 2,892 | 10.4% |
| $200,000+ | 3,253 | 11.7% |
Family Income by Famaliy Size in Missoula County
7+ person families (230 | 0.8%) account for the highest median family income in Missoula County with $139,100 per family, while 2-person families (14,792 | 53.2%) have the highest median income of $39,238 per family member.
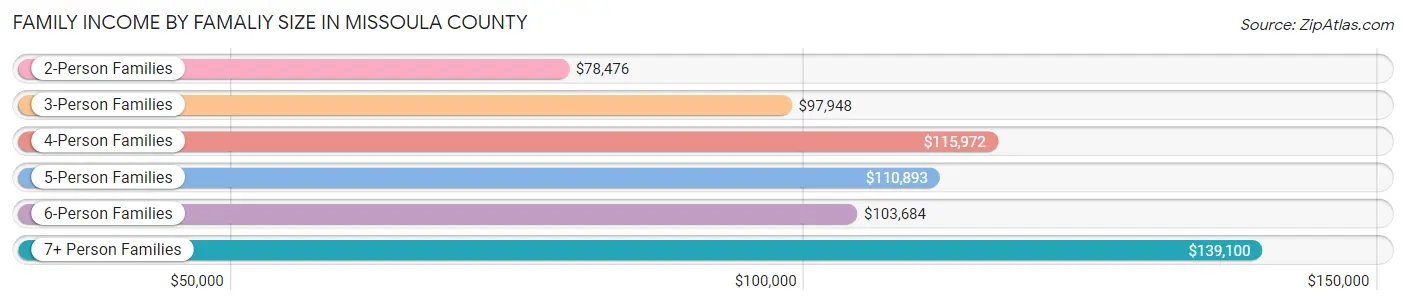
| Income Bracket | # Families | Median Income |
| 2-Person Families | 14,792 (53.2%) | $78,476 |
| 3-Person Families | 6,287 (22.6%) | $97,948 |
| 4-Person Families | 4,786 (17.2%) | $115,972 |
| 5-Person Families | 1,202 (4.3%) | $110,893 |
| 6-Person Families | 507 (1.8%) | $103,684 |
| 7+ Person Families | 230 (0.8%) | $139,100 |
| Total | 27,804 (100.0%) | $89,466 |
Family Income by Number of Earners in Missoula County
The median family income in Missoula County is $89,466, with families comprising 3+ earners (2,677) having the highest median family income of $141,544, while families with no earners (4,014) have the lowest median family income of $61,415, accounting for 9.6% and 14.4% of families, respectively.
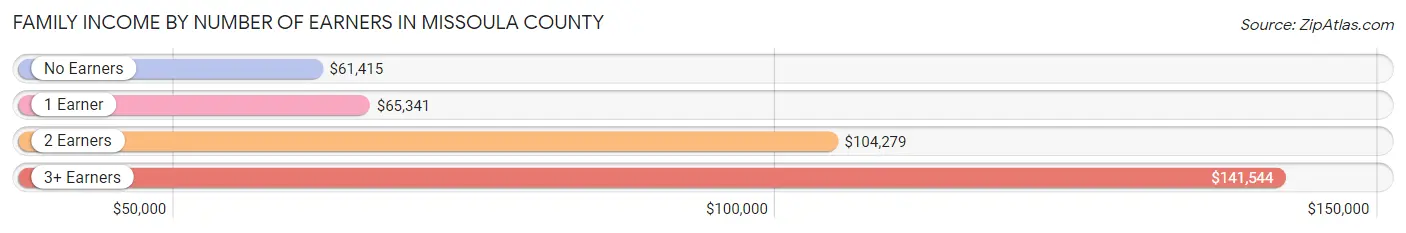
| Number of Earners | # Families | Median Income |
| No Earners | 4,014 (14.4%) | $61,415 |
| 1 Earner | 7,507 (27.0%) | $65,341 |
| 2 Earners | 13,606 (48.9%) | $104,279 |
| 3+ Earners | 2,677 (9.6%) | $141,544 |
| Total | 27,804 (100.0%) | $89,466 |
Household Income in Missoula County
Household Income Brackets in Missoula County
With 9,282 households falling in the category, the $50,000 to $74,999 income range is the most frequent in Missoula County, accounting for 18.4% of all households. In contrast, only 2,321 households (4.6%) fall into the $10,000 to $14,999 income bracket, making it the least populous group.
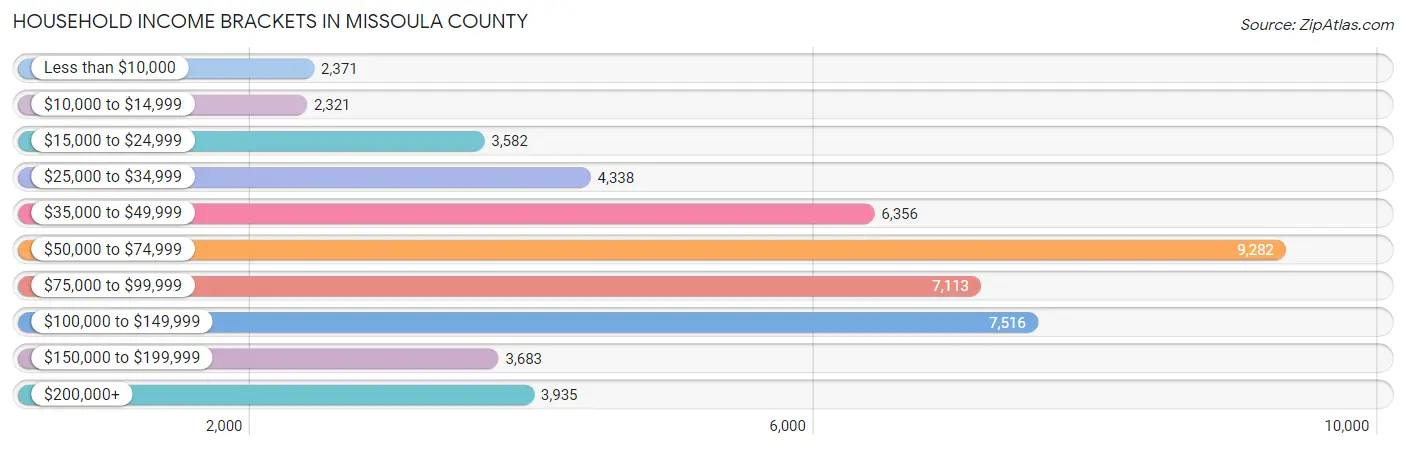
| Income Bracket | # Households | % Households |
| Less than $10,000 | 2,371 | 4.7% |
| $10,000 to $14,999 | 2,321 | 4.6% |
| $15,000 to $24,999 | 3,582 | 7.1% |
| $25,000 to $34,999 | 4,338 | 8.6% |
| $35,000 to $49,999 | 6,356 | 12.6% |
| $50,000 to $74,999 | 9,282 | 18.4% |
| $75,000 to $99,999 | 7,113 | 14.1% |
| $100,000 to $149,999 | 7,516 | 14.9% |
| $150,000 to $199,999 | 3,683 | 7.3% |
| $200,000+ | 3,935 | 7.8% |
Household Income by Householder Age in Missoula County
The median household income in Missoula County is $66,840, with the highest median household income of $86,570 found in the 45 to 64 years age bracket for the primary householder. A total of 15,203 households (30.1%) fall into this category. Meanwhile, the 15 to 24 years age bracket for the primary householder has the lowest median household income of $31,958, with 4,706 households (9.3%) in this group.
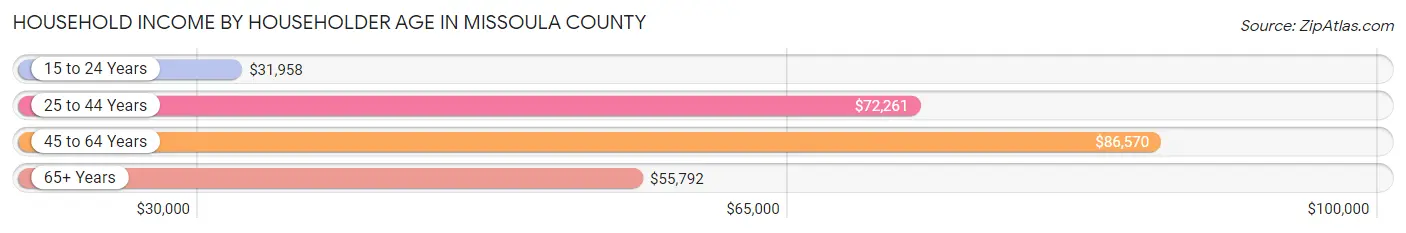
| Income Bracket | # Households | Median Income |
| 15 to 24 Years | 4,706 (9.3%) | $31,958 |
| 25 to 44 Years | 17,976 (35.6%) | $72,261 |
| 45 to 64 Years | 15,203 (30.1%) | $86,570 |
| 65+ Years | 12,561 (24.9%) | $55,792 |
| Total | 50,446 (100.0%) | $66,840 |
Poverty in Missoula County
Income Below Poverty by Sex and Age in Missoula County
With 11.4% poverty level for males and 12.4% for females among the residents of Missoula County, 18 to 24 year old males and 18 to 24 year old females are the most vulnerable to poverty, with 2,312 males (32.0%) and 2,174 females (31.3%) in their respective age groups living below the poverty level.
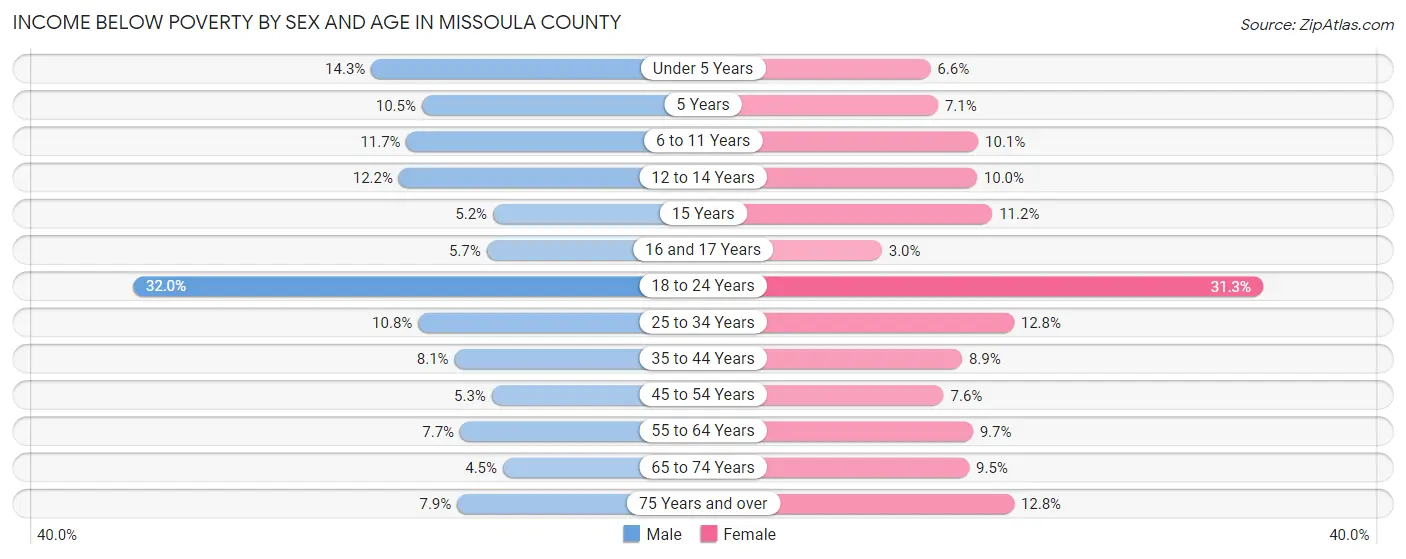
| Age Bracket | Male | Female |
| Under 5 Years | 410 (14.3%) | 172 (6.6%) |
| 5 Years | 47 (10.5%) | 47 (7.1%) |
| 6 to 11 Years | 435 (11.7%) | 336 (10.1%) |
| 12 to 14 Years | 241 (12.2%) | 199 (10.0%) |
| 15 Years | 29 (5.2%) | 85 (11.2%) |
| 16 and 17 Years | 71 (5.7%) | 35 (3.0%) |
| 18 to 24 Years | 2,312 (32.0%) | 2,174 (31.3%) |
| 25 to 34 Years | 1,032 (10.8%) | 1,154 (12.8%) |
| 35 to 44 Years | 676 (8.1%) | 693 (8.9%) |
| 45 to 54 Years | 350 (5.3%) | 470 (7.6%) |
| 55 to 64 Years | 513 (7.7%) | 688 (9.7%) |
| 65 to 74 Years | 266 (4.5%) | 579 (9.5%) |
| 75 Years and over | 255 (7.9%) | 487 (12.8%) |
| Total | 6,637 (11.4%) | 7,119 (12.4%) |
Income Above Poverty by Sex and Age in Missoula County
According to the poverty statistics in Missoula County, males aged 65 to 74 years and females aged 16 and 17 years are the age groups that are most secure financially, with 95.5% of males and 97.0% of females in these age groups living above the poverty line.
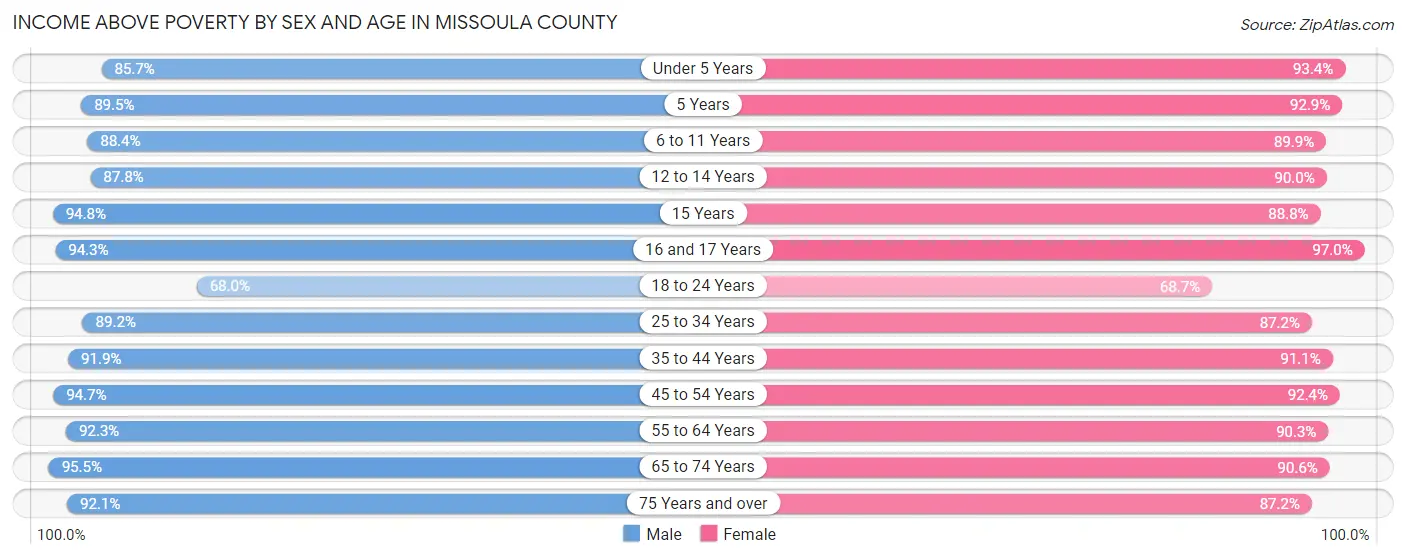
| Age Bracket | Male | Female |
| Under 5 Years | 2,463 (85.7%) | 2,440 (93.4%) |
| 5 Years | 400 (89.5%) | 611 (92.9%) |
| 6 to 11 Years | 3,299 (88.3%) | 2,984 (89.9%) |
| 12 to 14 Years | 1,731 (87.8%) | 1,786 (90.0%) |
| 15 Years | 525 (94.8%) | 676 (88.8%) |
| 16 and 17 Years | 1,174 (94.3%) | 1,144 (97.0%) |
| 18 to 24 Years | 4,921 (68.0%) | 4,780 (68.7%) |
| 25 to 34 Years | 8,538 (89.2%) | 7,882 (87.2%) |
| 35 to 44 Years | 7,676 (91.9%) | 7,072 (91.1%) |
| 45 to 54 Years | 6,232 (94.7%) | 5,745 (92.4%) |
| 55 to 64 Years | 6,166 (92.3%) | 6,393 (90.3%) |
| 65 to 74 Years | 5,654 (95.5%) | 5,547 (90.5%) |
| 75 Years and over | 2,976 (92.1%) | 3,324 (87.2%) |
| Total | 51,755 (88.6%) | 50,384 (87.6%) |
Income Below Poverty Among Married-Couple Families in Missoula County
The poverty statistics for married-couple families in Missoula County show that 2.4% or 514 of the total 21,638 families live below the poverty line. Families with 5 or more children have the highest poverty rate of 8.7%, comprising of 9 families. On the other hand, families with 1 or 2 children have the lowest poverty rate of 1.8%, which includes 126 families.
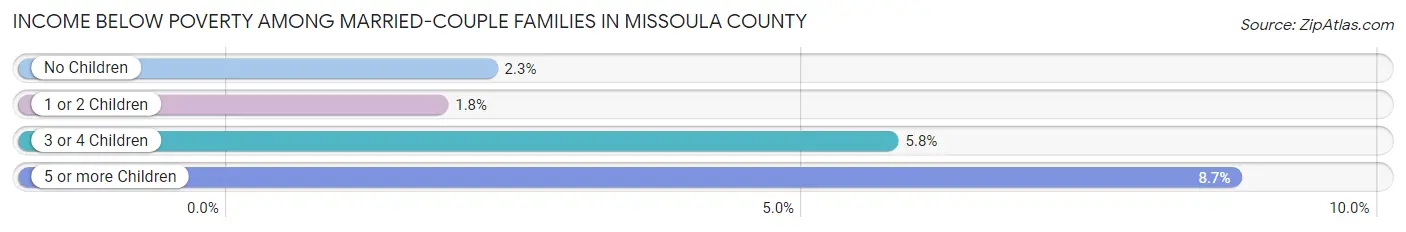
| Children | Above Poverty | Below Poverty |
| No Children | 12,991 (97.7%) | 300 (2.3%) |
| 1 or 2 Children | 6,744 (98.2%) | 126 (1.8%) |
| 3 or 4 Children | 1,295 (94.3%) | 79 (5.8%) |
| 5 or more Children | 94 (91.3%) | 9 (8.7%) |
| Total | 21,124 (97.6%) | 514 (2.4%) |
Income Below Poverty Among Single-Parent Households in Missoula County
According to the poverty data in Missoula County, 8.6% or 177 single-father households and 19.3% or 796 single-mother households are living below the poverty line. Among single-father households, those with 3 or 4 children have the highest poverty rate, with 51 households (72.9%) experiencing poverty. Likewise, among single-mother households, those with 3 or 4 children have the highest poverty rate, with 86 households (41.3%) falling below the poverty line.
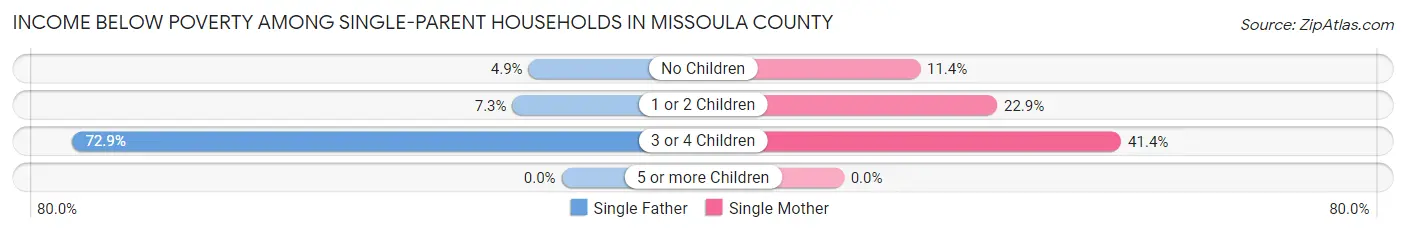
| Children | Single Father | Single Mother |
| No Children | 39 (4.9%) | 181 (11.4%) |
| 1 or 2 Children | 87 (7.3%) | 529 (22.9%) |
| 3 or 4 Children | 51 (72.9%) | 86 (41.3%) |
| 5 or more Children | 0 (0.0%) | 0 (0.0%) |
| Total | 177 (8.6%) | 796 (19.3%) |
Income Below Poverty Among Married-Couple vs Single-Parent Households in Missoula County
The poverty data for Missoula County shows that 514 of the married-couple family households (2.4%) and 973 of the single-parent households (15.8%) are living below the poverty level. Within the married-couple family households, those with 5 or more children have the highest poverty rate, with 9 households (8.7%) falling below the poverty line. Among the single-parent households, those with 3 or 4 children have the highest poverty rate, with 137 household (49.3%) living below poverty.
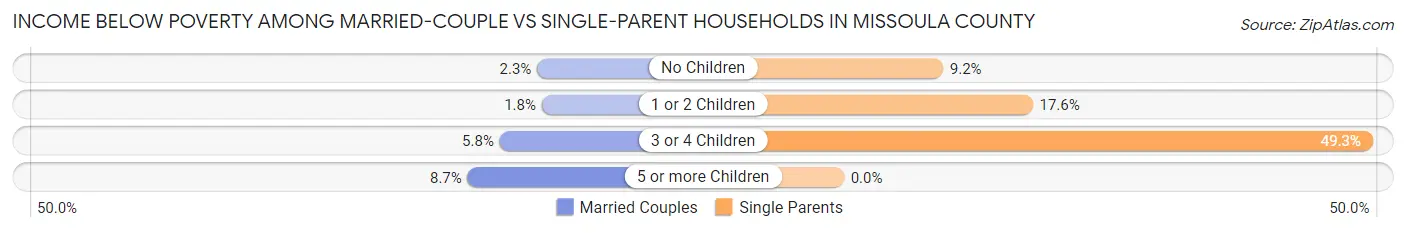
| Children | Married-Couple Families | Single-Parent Households |
| No Children | 300 (2.3%) | 220 (9.2%) |
| 1 or 2 Children | 126 (1.8%) | 616 (17.6%) |
| 3 or 4 Children | 79 (5.8%) | 137 (49.3%) |
| 5 or more Children | 9 (8.7%) | 0 (0.0%) |
| Total | 514 (2.4%) | 973 (15.8%) |
Race in Missoula County
The most populous races in Missoula County are White / Caucasian (105,605 | 89.1%), Two or more Races (6,315 | 5.3%), and Hispanic or Latino (4,310 | 3.6%).
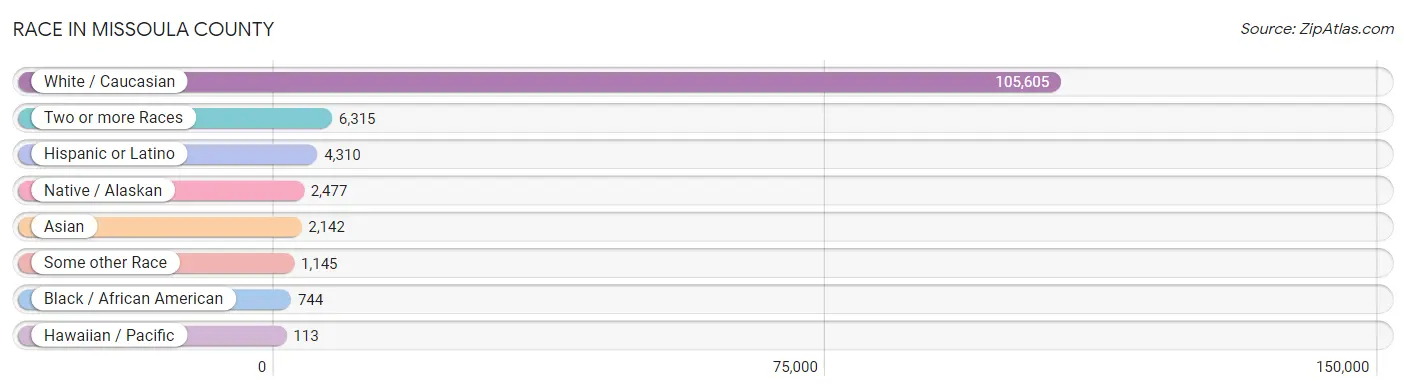
| Race | # Population | % Population |
| Asian | 2,142 | 1.8% |
| Black / African American | 744 | 0.6% |
| Hawaiian / Pacific | 113 | 0.1% |
| Hispanic or Latino | 4,310 | 3.6% |
| Native / Alaskan | 2,477 | 2.1% |
| White / Caucasian | 105,605 | 89.1% |
| Two or more Races | 6,315 | 5.3% |
| Some other Race | 1,145 | 1.0% |
| Total | 118,541 | 100.0% |
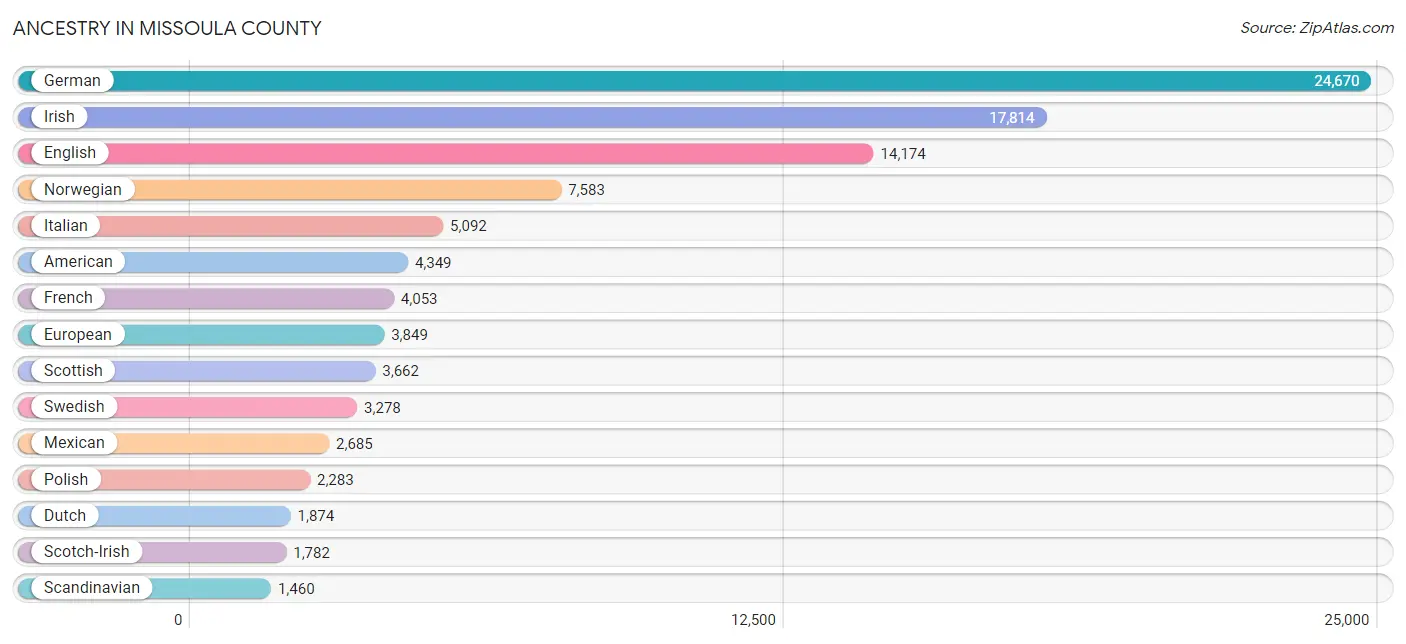
Ancestry in Missoula County
The most populous ancestries reported in Missoula County are German (24,670 | 20.8%), Irish (17,814 | 15.0%), English (14,174 | 12.0%), Norwegian (7,583 | 6.4%), and Italian (5,092 | 4.3%), together accounting for 58.5% of all Missoula County residents.
| Ancestry | # Population | % Population |
| African | 91 | 0.1% |
| Alaskan Athabascan | 37 | 0.0% |
| Albanian | 10 | 0.0% |
| Aleut | 33 | 0.0% |
| American | 4,349 | 3.7% |
| Apache | 18 | 0.0% |
| Arab | 220 | 0.2% |
| Argentinean | 75 | 0.1% |
| Armenian | 53 | 0.0% |
| Australian | 13 | 0.0% |
| Austrian | 296 | 0.3% |
| Bangladeshi | 382 | 0.3% |
| Barbadian | 31 | 0.0% |
| Basque | 84 | 0.1% |
| Belgian | 219 | 0.2% |
| Bermudan | 24 | 0.0% |
| Bhutanese | 429 | 0.4% |
| Blackfeet | 798 | 0.7% |
| British | 744 | 0.6% |
| Bulgarian | 8 | 0.0% |
| Burmese | 287 | 0.2% |
| Cajun | 14 | 0.0% |
| Canadian | 235 | 0.2% |
| Celtic | 13 | 0.0% |
| Central American | 85 | 0.1% |
| Central American Indian | 4 | 0.0% |
| Cherokee | 238 | 0.2% |
| Cheyenne | 78 | 0.1% |
| Chickasaw | 21 | 0.0% |
| Chilean | 179 | 0.2% |
| Chippewa | 152 | 0.1% |
| Choctaw | 102 | 0.1% |
| Colombian | 165 | 0.1% |
| Colville | 21 | 0.0% |
| Comanche | 30 | 0.0% |
| Costa Rican | 17 | 0.0% |
| Cree | 91 | 0.1% |
| Creek | 34 | 0.0% |
| Croatian | 346 | 0.3% |
| Crow | 72 | 0.1% |
| Cuban | 27 | 0.0% |
| Czech | 512 | 0.4% |
| Czechoslovakian | 96 | 0.1% |
| Danish | 997 | 0.8% |
| Dominican | 208 | 0.2% |
| Dutch | 1,874 | 1.6% |
| Eastern European | 250 | 0.2% |
| Ecuadorian | 10 | 0.0% |
| English | 14,174 | 12.0% |
| Ethiopian | 3 | 0.0% |
| European | 3,849 | 3.3% |
| Filipino | 59 | 0.1% |
| Finnish | 592 | 0.5% |
| French | 4,053 | 3.4% |
| French American Indian | 49 | 0.0% |
| French Canadian | 540 | 0.5% |
| German | 24,670 | 20.8% |
| German Russian | 8 | 0.0% |
| Ghanaian | 13 | 0.0% |
| Greek | 209 | 0.2% |
| Guamanian / Chamorro | 3 | 0.0% |
| Guatemalan | 10 | 0.0% |
| Haitian | 25 | 0.0% |
| Houma | 7 | 0.0% |
| Hungarian | 553 | 0.5% |
| Icelander | 82 | 0.1% |
| Indian (Asian) | 602 | 0.5% |
| Inupiat | 70 | 0.1% |
| Iranian | 35 | 0.0% |
| Irish | 17,814 | 15.0% |
| Iroquois | 40 | 0.0% |
| Italian | 5,092 | 4.3% |
| Jamaican | 15 | 0.0% |
| Japanese | 1 | 0.0% |
| Kiowa | 17 | 0.0% |
| Korean | 1,152 | 1.0% |
| Latvian | 9 | 0.0% |
| Lebanese | 116 | 0.1% |
| Lithuanian | 115 | 0.1% |
| Luxembourger | 188 | 0.2% |
| Malaysian | 59 | 0.1% |
| Maltese | 10 | 0.0% |
| Mexican | 2,685 | 2.3% |
| Mexican American Indian | 44 | 0.0% |
| Mongolian | 35 | 0.0% |
| Moroccan | 2 | 0.0% |
| Native Hawaiian | 143 | 0.1% |
| Navajo | 80 | 0.1% |
| New Zealander | 6 | 0.0% |
| Nicaraguan | 30 | 0.0% |
| Nigerian | 5 | 0.0% |
| Northern European | 623 | 0.5% |
| Norwegian | 7,583 | 6.4% |
| Pakistani | 124 | 0.1% |
| Palestinian | 9 | 0.0% |
| Panamanian | 11 | 0.0% |
| Pennsylvania German | 36 | 0.0% |
| Peruvian | 19 | 0.0% |
| Polish | 2,283 | 1.9% |
| Portuguese | 248 | 0.2% |
| Puerto Rican | 242 | 0.2% |
| Romanian | 54 | 0.1% |
| Russian | 920 | 0.8% |
| Salvadoran | 17 | 0.0% |
| Samoan | 69 | 0.1% |
| Scandinavian | 1,460 | 1.2% |
| Scotch-Irish | 1,782 | 1.5% |
| Scottish | 3,662 | 3.1% |
| Seminole | 24 | 0.0% |
| Serbian | 85 | 0.1% |
| Shoshone | 193 | 0.2% |
| Sioux | 211 | 0.2% |
| Slavic | 118 | 0.1% |
| Slovak | 87 | 0.1% |
| Slovene | 18 | 0.0% |
| South African | 62 | 0.1% |
| South American | 479 | 0.4% |
| Spaniard | 131 | 0.1% |
| Spanish | 364 | 0.3% |
| Sri Lankan | 159 | 0.1% |
| Subsaharan African | 178 | 0.2% |
| Swedish | 3,278 | 2.8% |
| Swiss | 534 | 0.4% |
| Syrian | 33 | 0.0% |
| Thai | 40 | 0.0% |
| Tlingit-Haida | 94 | 0.1% |
| Ukrainian | 450 | 0.4% |
| Uruguayan | 26 | 0.0% |
| Ute | 18 | 0.0% |
| Welsh | 808 | 0.7% |
| Yakama | 11 | 0.0% |
| Yugoslavian | 65 | 0.1% | View All 132 Rows |
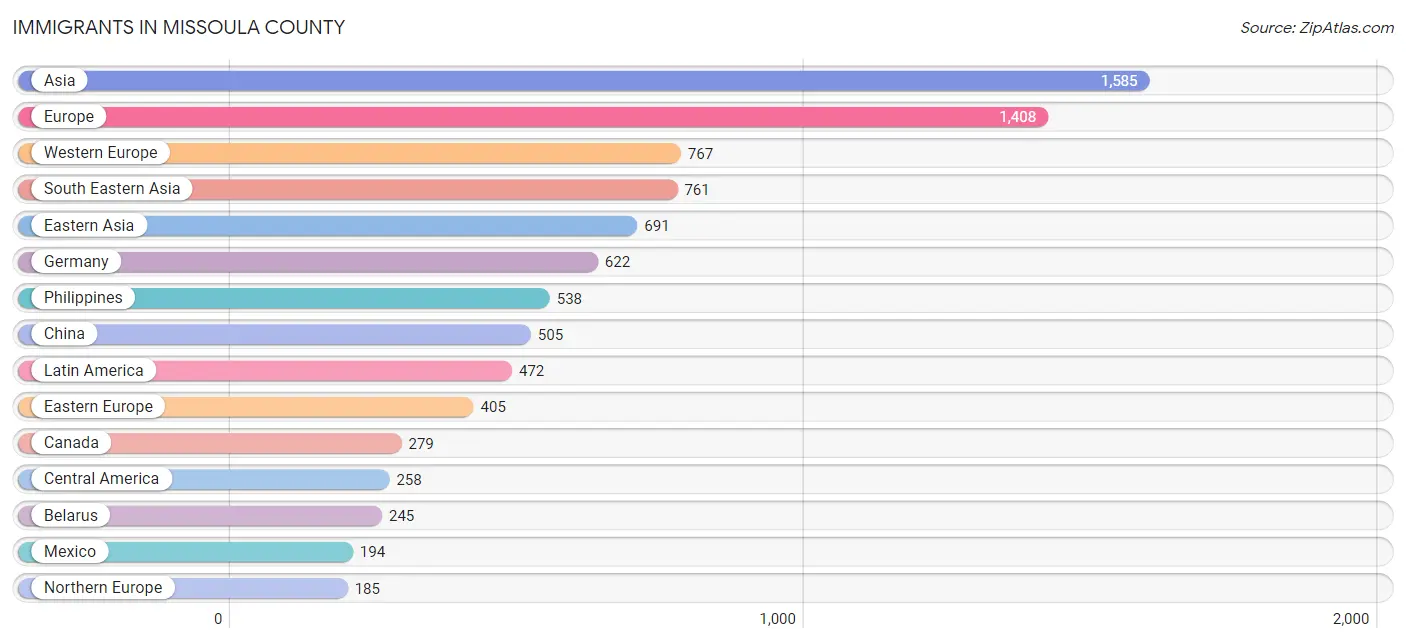
Immigrants in Missoula County
The most numerous immigrant groups reported in Missoula County came from Asia (1,585 | 1.3%), Europe (1,408 | 1.2%), Western Europe (767 | 0.6%), South Eastern Asia (761 | 0.6%), and Eastern Asia (691 | 0.6%), together accounting for 4.4% of all Missoula County residents.
| Immigration Origin | # Population | % Population |
| Africa | 101 | 0.1% |
| Argentina | 19 | 0.0% |
| Asia | 1,585 | 1.3% |
| Australia | 28 | 0.0% |
| Austria | 4 | 0.0% |
| Belarus | 245 | 0.2% |
| Belgium | 10 | 0.0% |
| Belize | 25 | 0.0% |
| Brazil | 132 | 0.1% |
| Canada | 279 | 0.2% |
| Caribbean | 29 | 0.0% |
| Central America | 258 | 0.2% |
| China | 505 | 0.4% |
| Eastern Africa | 6 | 0.0% |
| Eastern Asia | 691 | 0.6% |
| Eastern Europe | 405 | 0.3% |
| Ecuador | 10 | 0.0% |
| England | 11 | 0.0% |
| Ethiopia | 3 | 0.0% |
| Europe | 1,408 | 1.2% |
| Fiji | 15 | 0.0% |
| France | 51 | 0.0% |
| Germany | 622 | 0.5% |
| Ghana | 9 | 0.0% |
| Guatemala | 6 | 0.0% |
| Guyana | 2 | 0.0% |
| Haiti | 16 | 0.0% |
| Hong Kong | 62 | 0.1% |
| Hungary | 44 | 0.0% |
| Iran | 8 | 0.0% |
| Ireland | 2 | 0.0% |
| Italy | 44 | 0.0% |
| Jamaica | 13 | 0.0% |
| Japan | 48 | 0.0% |
| Korea | 138 | 0.1% |
| Laos | 85 | 0.1% |
| Latin America | 472 | 0.4% |
| Lebanon | 28 | 0.0% |
| Malaysia | 17 | 0.0% |
| Mexico | 194 | 0.2% |
| Middle Africa | 4 | 0.0% |
| Netherlands | 67 | 0.1% |
| Nicaragua | 23 | 0.0% |
| Northern Africa | 1 | 0.0% |
| Northern Europe | 185 | 0.2% |
| Oceania | 84 | 0.1% |
| Panama | 10 | 0.0% |
| Peru | 11 | 0.0% |
| Philippines | 538 | 0.4% |
| Romania | 31 | 0.0% |
| Russia | 6 | 0.0% |
| Scotland | 11 | 0.0% |
| South Africa | 39 | 0.0% |
| South America | 185 | 0.2% |
| South Central Asia | 105 | 0.1% |
| South Eastern Asia | 761 | 0.6% |
| Southern Europe | 47 | 0.0% |
| Spain | 3 | 0.0% |
| Sri Lanka | 47 | 0.0% |
| Sweden | 5 | 0.0% |
| Switzerland | 13 | 0.0% |
| Taiwan | 21 | 0.0% |
| Thailand | 58 | 0.1% |
| Ukraine | 71 | 0.1% |
| Uruguay | 11 | 0.0% |
| Vietnam | 63 | 0.1% |
| Western Africa | 51 | 0.0% |
| Western Asia | 28 | 0.0% |
| Western Europe | 767 | 0.6% |
| Zimbabwe | 3 | 0.0% | View All 70 Rows |
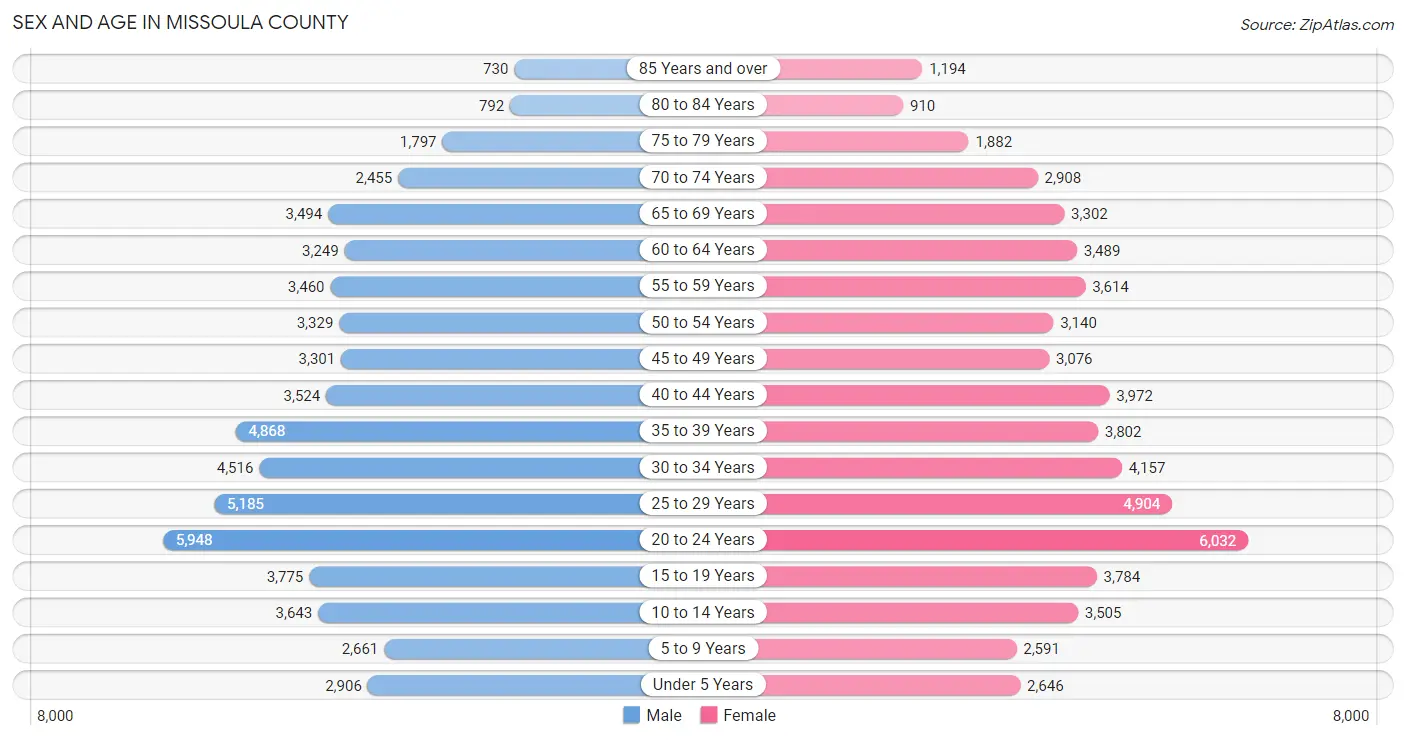
Sex and Age in Missoula County
Sex and Age in Missoula County
The most populous age groups in Missoula County are 20 to 24 Years (5,948 | 10.0%) for men and 20 to 24 Years (6,032 | 10.2%) for women.
| Age Bracket | Male | Female |
| Under 5 Years | 2,906 (4.9%) | 2,646 (4.5%) |
| 5 to 9 Years | 2,661 (4.5%) | 2,591 (4.4%) |
| 10 to 14 Years | 3,643 (6.1%) | 3,505 (5.9%) |
| 15 to 19 Years | 3,775 (6.3%) | 3,784 (6.4%) |
| 20 to 24 Years | 5,948 (10.0%) | 6,032 (10.2%) |
| 25 to 29 Years | 5,185 (8.7%) | 4,904 (8.3%) |
| 30 to 34 Years | 4,516 (7.6%) | 4,157 (7.1%) |
| 35 to 39 Years | 4,868 (8.2%) | 3,802 (6.5%) |
| 40 to 44 Years | 3,524 (5.9%) | 3,972 (6.7%) |
| 45 to 49 Years | 3,301 (5.5%) | 3,076 (5.2%) |
| 50 to 54 Years | 3,329 (5.6%) | 3,140 (5.3%) |
| 55 to 59 Years | 3,460 (5.8%) | 3,614 (6.1%) |
| 60 to 64 Years | 3,249 (5.4%) | 3,489 (5.9%) |
| 65 to 69 Years | 3,494 (5.9%) | 3,302 (5.6%) |
| 70 to 74 Years | 2,455 (4.1%) | 2,908 (4.9%) |
| 75 to 79 Years | 1,797 (3.0%) | 1,882 (3.2%) |
| 80 to 84 Years | 792 (1.3%) | 910 (1.5%) |
| 85 Years and over | 730 (1.2%) | 1,194 (2.0%) |
| Total | 59,633 (100.0%) | 58,908 (100.0%) |
Families and Households in Missoula County
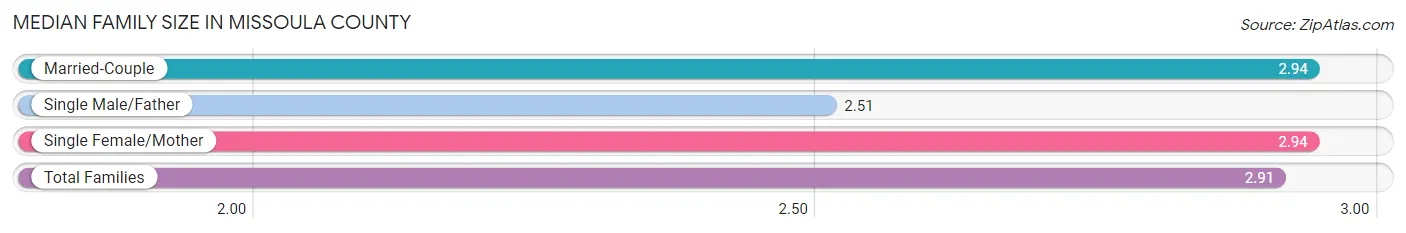
Median Family Size in Missoula County
The median family size in Missoula County is 2.91 persons per family, with married-couple families (21,638 | 77.8%) accounting for the largest median family size of 2.94 persons per family. On the other hand, single male/father families (2,049 | 7.4%) represent the smallest median family size with 2.51 persons per family.
| Family Type | # Families | Family Size |
| Married-Couple | 21,638 (77.8%) | 2.94 |
| Single Male/Father | 2,049 (7.4%) | 2.51 |
| Single Female/Mother | 4,117 (14.8%) | 2.94 |
| Total Families | 27,804 (100.0%) | 2.91 |
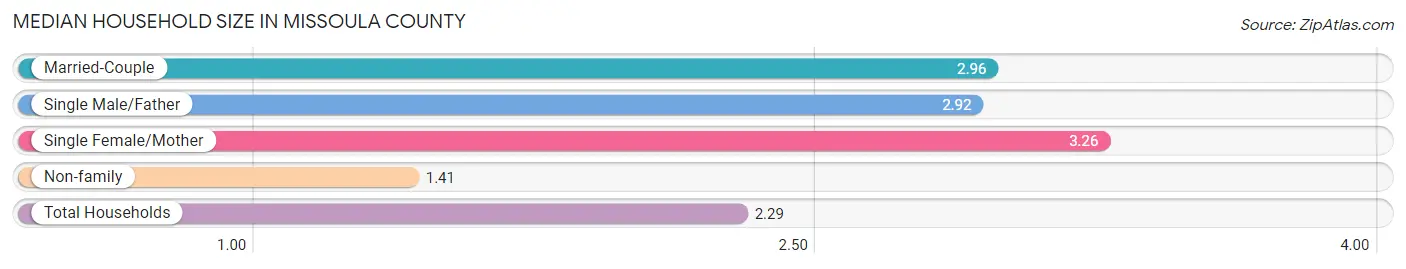
Median Household Size in Missoula County
The median household size in Missoula County is 2.29 persons per household, with single female/mother households (4,117 | 8.2%) accounting for the largest median household size of 3.26 persons per household. non-family households (22,642 | 44.9%) represent the smallest median household size with 1.41 persons per household.
| Household Type | # Households | Household Size |
| Married-Couple | 21,638 (42.9%) | 2.96 |
| Single Male/Father | 2,049 (4.1%) | 2.92 |
| Single Female/Mother | 4,117 (8.2%) | 3.26 |
| Non-family | 22,642 (44.9%) | 1.41 |
| Total Households | 50,446 (100.0%) | 2.29 |
Household Size by Marriage Status in Missoula County
Out of a total of 50,446 households in Missoula County, 27,804 (55.1%) are family households, while 22,642 (44.9%) are nonfamily households. The most numerous type of family households are 2-person households, comprising 13,676, and the most common type of nonfamily households are 1-person households, comprising 15,856.
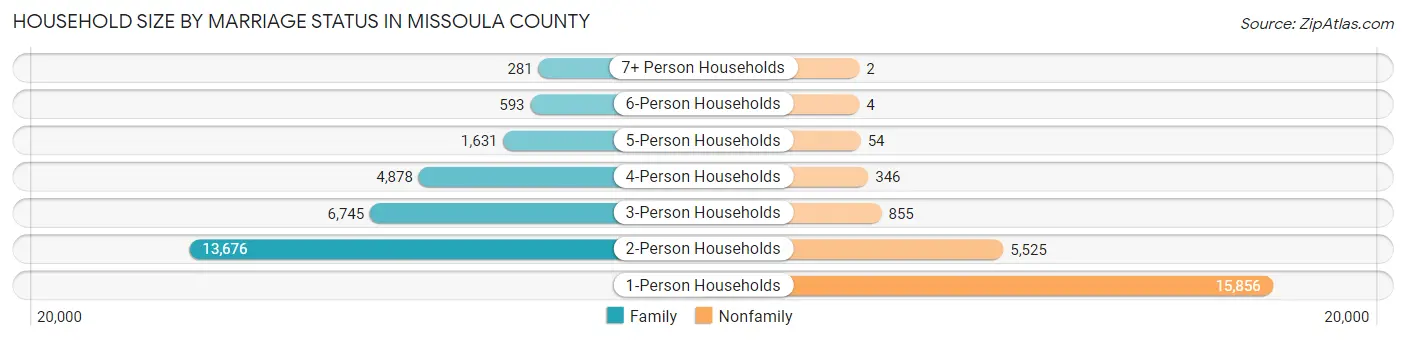
| Household Size | Family Households | Nonfamily Households |
| 1-Person Households | - | 15,856 (31.4%) |
| 2-Person Households | 13,676 (27.1%) | 5,525 (11.0%) |
| 3-Person Households | 6,745 (13.4%) | 855 (1.7%) |
| 4-Person Households | 4,878 (9.7%) | 346 (0.7%) |
| 5-Person Households | 1,631 (3.2%) | 54 (0.1%) |
| 6-Person Households | 593 (1.2%) | 4 (0.0%) |
| 7+ Person Households | 281 (0.6%) | 2 (0.0%) |
| Total | 27,804 (55.1%) | 22,642 (44.9%) |
Female Fertility in Missoula County
Fertility by Age in Missoula County
Average fertility rate in Missoula County is 40.0 births per 1,000 women. Women in the age bracket of 20 to 34 years have the highest fertility rate with 50.0 births per 1,000 women. Women in the age bracket of 20 to 34 years acount for 62.0% of all women with births.
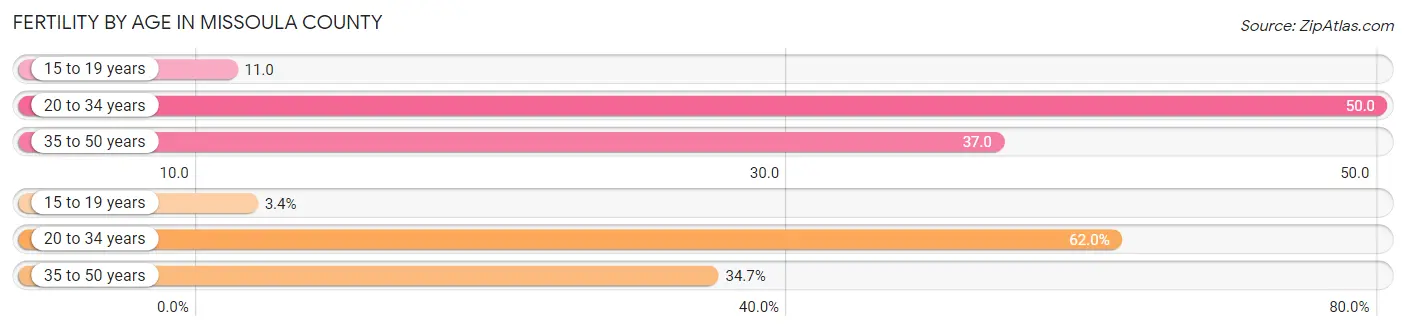
| Age Bracket | Women with Births | Births / 1,000 Women |
| 15 to 19 years | 41 (3.4%) | 11.0 |
| 20 to 34 years | 755 (62.0%) | 50.0 |
| 35 to 50 years | 422 (34.6%) | 37.0 |
| Total | 1,218 (100.0%) | 40.0 |
Fertility by Age by Marriage Status in Missoula County
72.2% of women with births (1,218) in Missoula County are married. The highest percentage of unmarried women with births falls into 15 to 19 years age bracket with 100.0% of them unmarried at the time of birth, while the lowest percentage of unmarried women with births belong to 35 to 50 years age bracket with 12.1% of them unmarried.
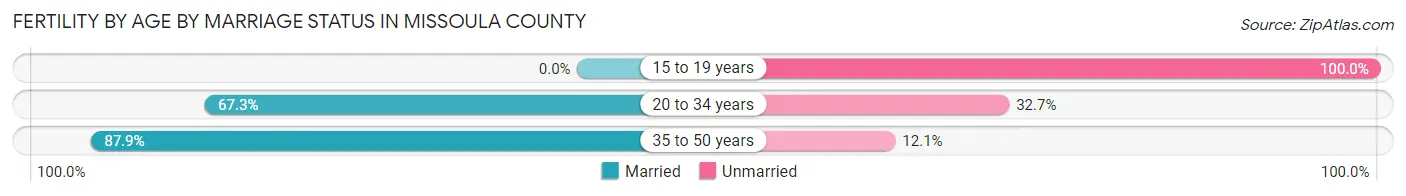
| Age Bracket | Married | Unmarried |
| 15 to 19 years | 0 (0.0%) | 41 (100.0%) |
| 20 to 34 years | 508 (67.3%) | 247 (32.7%) |
| 35 to 50 years | 371 (87.9%) | 51 (12.1%) |
| Total | 879 (72.2%) | 339 (27.8%) |
Fertility by Education in Missoula County
Average fertility rate in Missoula County is 40.0 births per 1,000 women. Women with the education attainment of graduate degree have the highest fertility rate of 53.0 births per 1,000 women, while women with the education attainment of less than high school have the lowest fertility at 30.0 births per 1,000 women. Women with the education attainment of bachelor's degree represent 29.8% of all women with births.
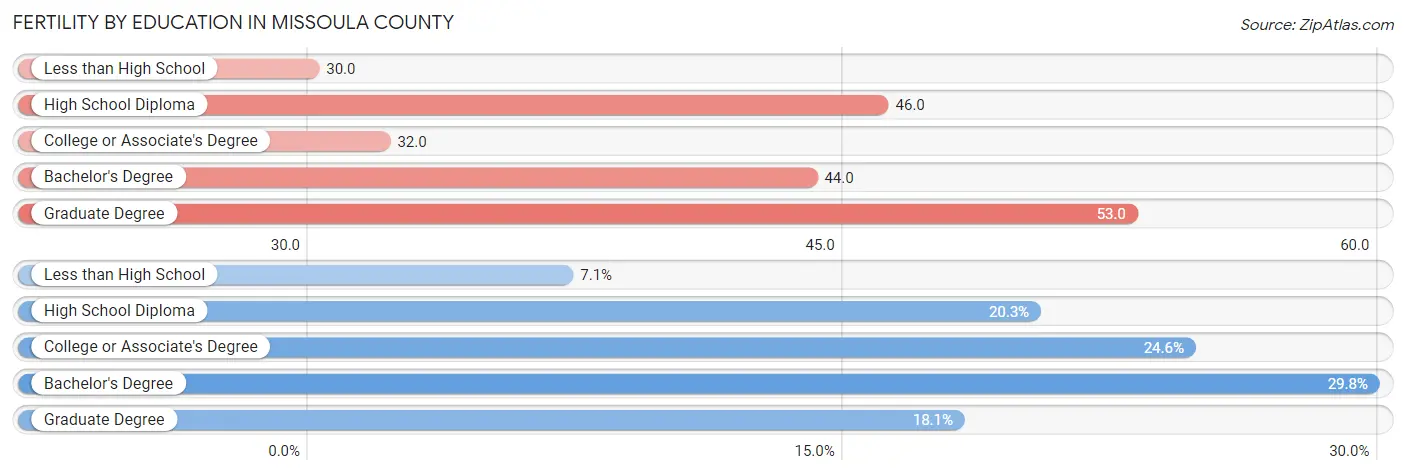
| Educational Attainment | Women with Births | Births / 1,000 Women |
| Less than High School | 87 (7.1%) | 30.0 |
| High School Diploma | 247 (20.3%) | 46.0 |
| College or Associate's Degree | 300 (24.6%) | 32.0 |
| Bachelor's Degree | 363 (29.8%) | 44.0 |
| Graduate Degree | 221 (18.1%) | 53.0 |
| Total | 1,218 (100.0%) | 40.0 |
Fertility by Education by Marriage Status in Missoula County
27.8% of women with births in Missoula County are unmarried. Women with the educational attainment of college or associate's degree are most likely to be married with 86.0% of them married at childbirth, while women with the educational attainment of high school diploma are least likely to be married with 69.6% of them unmarried at childbirth.
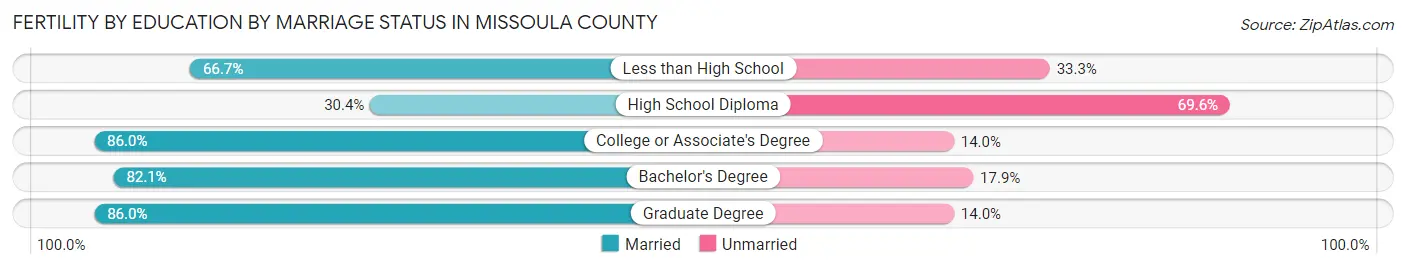
| Educational Attainment | Married | Unmarried |
| Less than High School | 58 (66.7%) | 29 (33.3%) |
| High School Diploma | 75 (30.4%) | 172 (69.6%) |
| College or Associate's Degree | 258 (86.0%) | 42 (14.0%) |
| Bachelor's Degree | 298 (82.1%) | 65 (17.9%) |
| Graduate Degree | 190 (86.0%) | 31 (14.0%) |
| Total | 879 (72.2%) | 339 (27.8%) |
Employment Characteristics in Missoula County
Employment by Class of Employer in Missoula County
Among the 64,821 employed individuals in Missoula County, private company employees (40,297 | 62.2%), not-for-profit organizations (6,391 | 9.9%), and self-employed (not incorporated) (5,495 | 8.5%) make up the most common classes of employment.
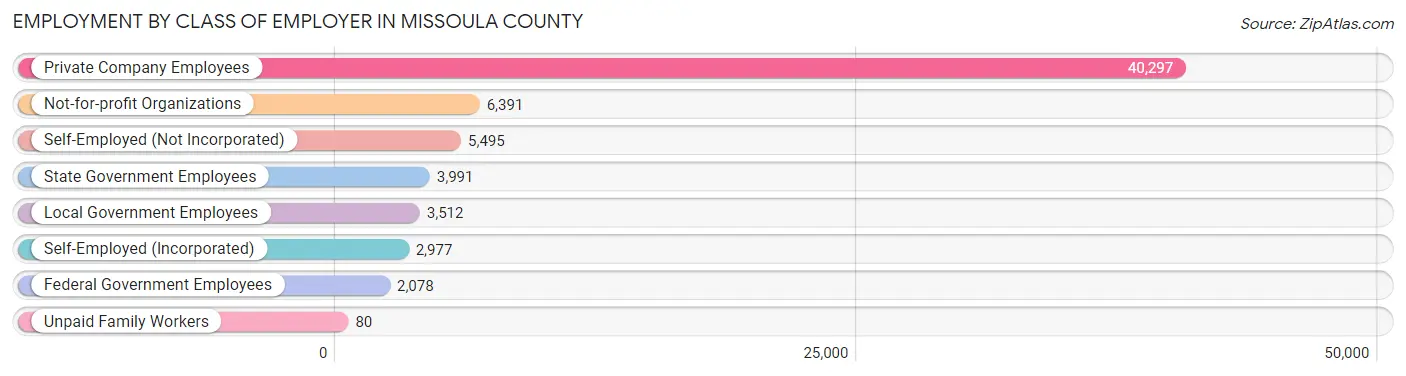
| Employer Class | # Employees | % Employees |
| Private Company Employees | 40,297 | 62.2% |
| Self-Employed (Incorporated) | 2,977 | 4.6% |
| Self-Employed (Not Incorporated) | 5,495 | 8.5% |
| Not-for-profit Organizations | 6,391 | 9.9% |
| Local Government Employees | 3,512 | 5.4% |
| State Government Employees | 3,991 | 6.2% |
| Federal Government Employees | 2,078 | 3.2% |
| Unpaid Family Workers | 80 | 0.1% |
| Total | 64,821 | 100.0% |
Employment Status by Age in Missoula County
According to the labor force statistics for Missoula County, out of the total population over 16 years of age (99,271), 70.0% or 69,490 individuals are in the labor force, with 4.5% or 3,127 of them unemployed. The age group with the highest labor force participation rate is 35 to 44 years, with 90.8% or 14,679 individuals in the labor force. Within the labor force, the 16 to 19 years age range has the highest percentage of unemployed individuals, with 14.0% or 478 of them being unemployed.
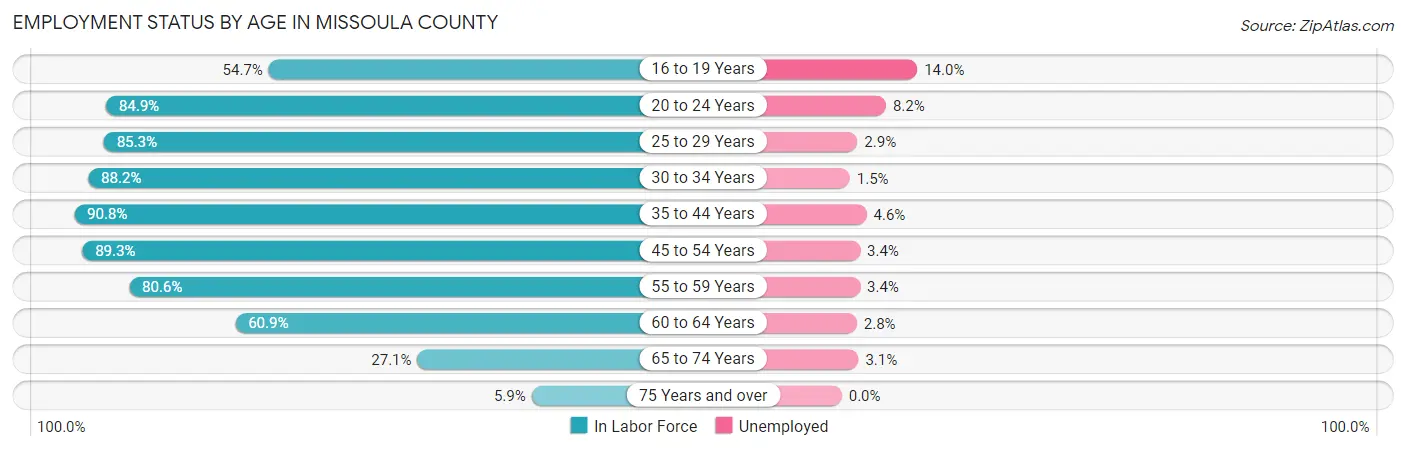
| Age Bracket | In Labor Force | Unemployed |
| 16 to 19 Years | 3,414 (54.7%) | 478 (14.0%) |
| 20 to 24 Years | 10,171 (84.9%) | 834 (8.2%) |
| 25 to 29 Years | 8,606 (85.3%) | 250 (2.9%) |
| 30 to 34 Years | 7,650 (88.2%) | 115 (1.5%) |
| 35 to 44 Years | 14,679 (90.8%) | 675 (4.6%) |
| 45 to 54 Years | 11,471 (89.3%) | 390 (3.4%) |
| 55 to 59 Years | 5,702 (80.6%) | 194 (3.4%) |
| 60 to 64 Years | 4,103 (60.9%) | 115 (2.8%) |
| 65 to 74 Years | 3,295 (27.1%) | 102 (3.1%) |
| 75 Years and over | 431 (5.9%) | 0 (0.0%) |
| Total | 69,490 (70.0%) | 3,127 (4.5%) |
Employment Status by Educational Attainment in Missoula County
According to labor force statistics for Missoula County, 84.8% of individuals (52,225) out of the total population between 25 and 64 years of age (61,586) are in the labor force, with 3.3% or 1,723 of them being unemployed. The group with the highest labor force participation rate are those with the educational attainment of bachelor's degree or higher, with 90.6% or 25,361 individuals in the labor force. Within the labor force, individuals with less than high school education have the highest percentage of unemployment, with 8.5% or 127 of them being unemployed.
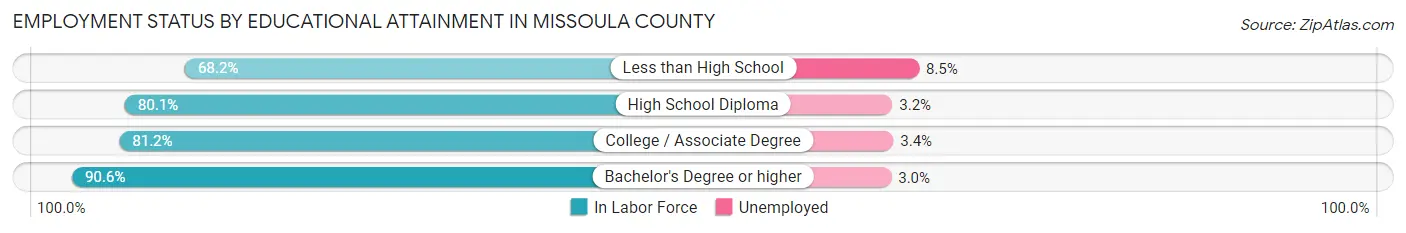
| Educational Attainment | In Labor Force | Unemployed |
| Less than High School | 1,493 (68.2%) | 186 (8.5%) |
| High School Diploma | 9,759 (80.1%) | 390 (3.2%) |
| College / Associate Degree | 15,607 (81.2%) | 654 (3.4%) |
| Bachelor's Degree or higher | 25,361 (90.6%) | 840 (3.0%) |
| Total | 52,225 (84.8%) | 2,032 (3.3%) |
Employment Occupations by Sex in Missoula County
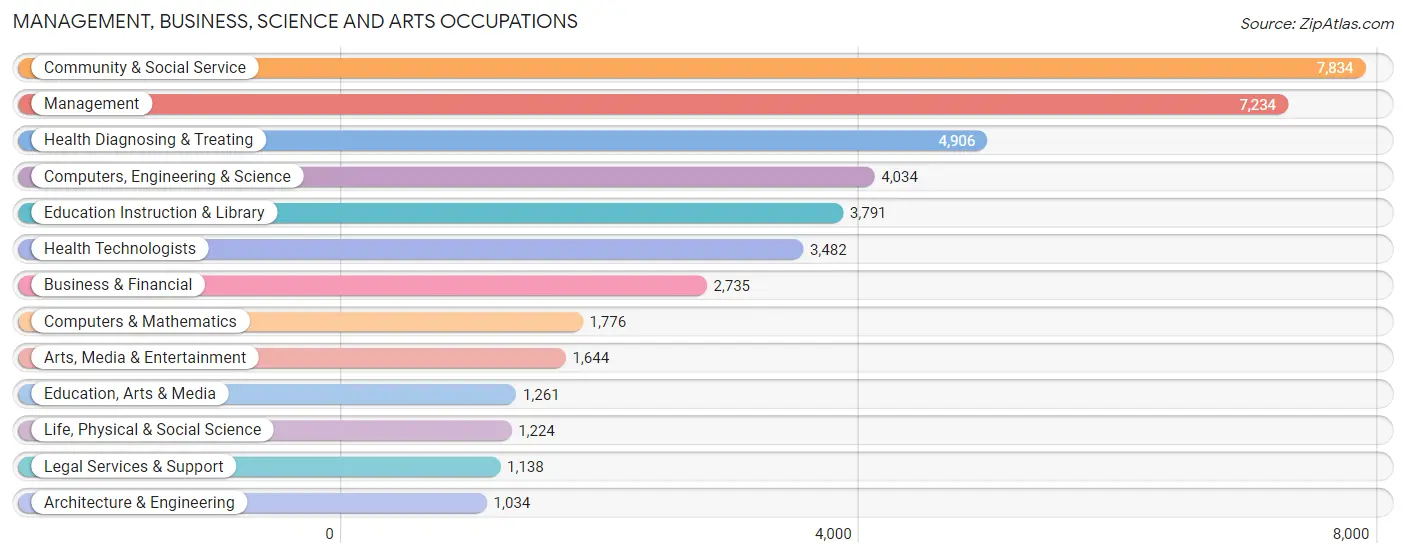
Management, Business, Science and Arts Occupations
The most common Management, Business, Science and Arts occupations in Missoula County are Community & Social Service (7,834 | 11.8%), Management (7,234 | 10.9%), Health Diagnosing & Treating (4,906 | 7.4%), Computers, Engineering & Science (4,034 | 6.1%), and Education Instruction & Library (3,791 | 5.7%).
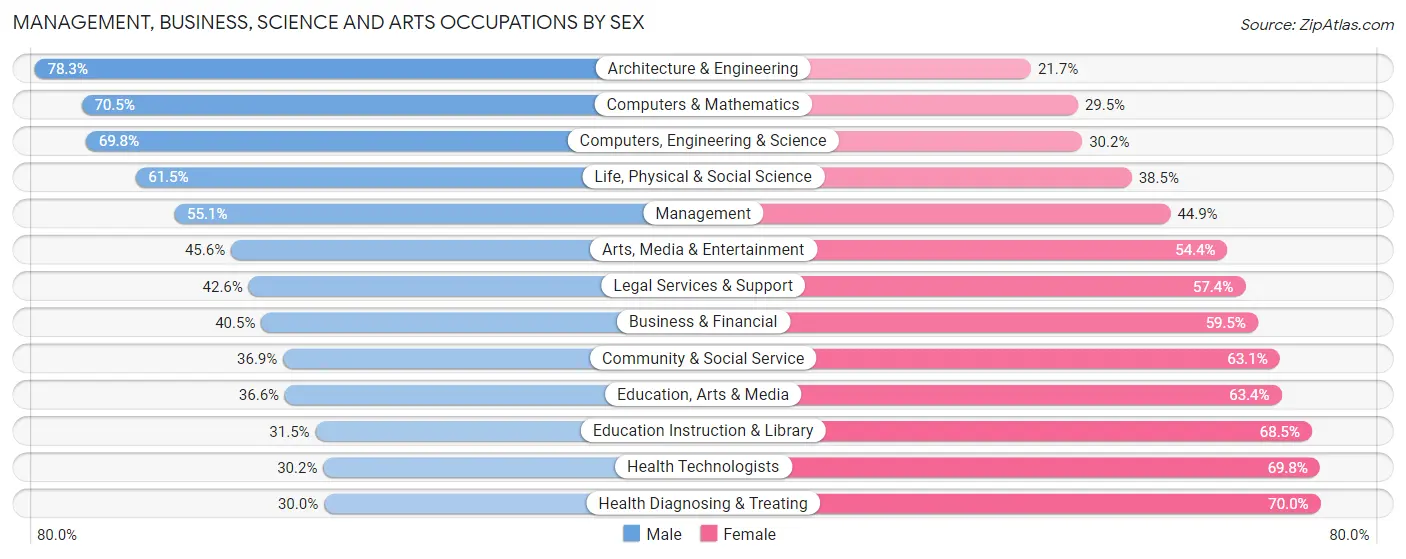
Management, Business, Science and Arts Occupations by Sex
Within the Management, Business, Science and Arts occupations in Missoula County, the most male-oriented occupations are Architecture & Engineering (78.3%), Computers & Mathematics (70.5%), and Computers, Engineering & Science (69.8%), while the most female-oriented occupations are Health Diagnosing & Treating (70.0%), Health Technologists (69.8%), and Education Instruction & Library (68.5%).
| Occupation | Male | Female |
| Management | 3,983 (55.1%) | 3,251 (44.9%) |
| Business & Financial | 1,108 (40.5%) | 1,627 (59.5%) |
| Computers, Engineering & Science | 2,815 (69.8%) | 1,219 (30.2%) |
| Computers & Mathematics | 1,252 (70.5%) | 524 (29.5%) |
| Architecture & Engineering | 810 (78.3%) | 224 (21.7%) |
| Life, Physical & Social Science | 753 (61.5%) | 471 (38.5%) |
| Community & Social Service | 2,888 (36.9%) | 4,946 (63.1%) |
| Education, Arts & Media | 461 (36.6%) | 800 (63.4%) |
| Legal Services & Support | 485 (42.6%) | 653 (57.4%) |
| Education Instruction & Library | 1,193 (31.5%) | 2,598 (68.5%) |
| Arts, Media & Entertainment | 749 (45.6%) | 895 (54.4%) |
| Health Diagnosing & Treating | 1,474 (30.0%) | 3,432 (70.0%) |
| Health Technologists | 1,050 (30.2%) | 2,432 (69.8%) |
| Total (Category) | 12,268 (45.9%) | 14,475 (54.1%) |
| Total (Overall) | 34,251 (51.7%) | 31,956 (48.3%) |
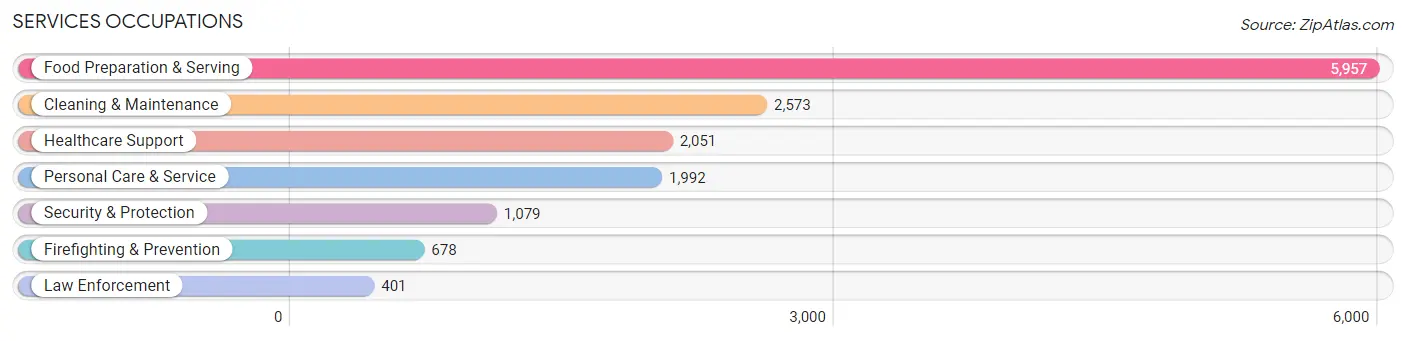
Services Occupations
The most common Services occupations in Missoula County are Food Preparation & Serving (5,957 | 9.0%), Cleaning & Maintenance (2,573 | 3.9%), Healthcare Support (2,051 | 3.1%), Personal Care & Service (1,992 | 3.0%), and Security & Protection (1,079 | 1.6%).
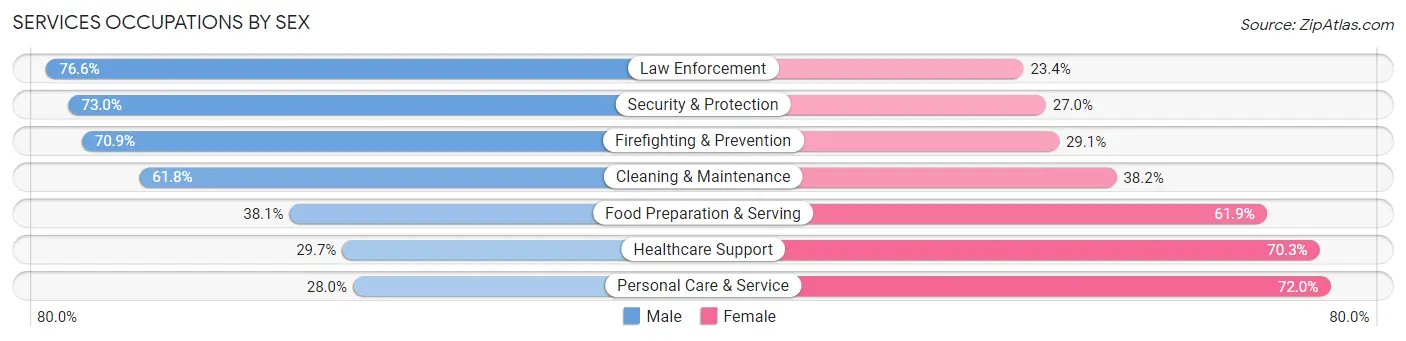
Services Occupations by Sex
Within the Services occupations in Missoula County, the most male-oriented occupations are Law Enforcement (76.6%), Security & Protection (73.0%), and Firefighting & Prevention (70.9%), while the most female-oriented occupations are Personal Care & Service (72.0%), Healthcare Support (70.3%), and Food Preparation & Serving (61.9%).
| Occupation | Male | Female |
| Healthcare Support | 609 (29.7%) | 1,442 (70.3%) |
| Security & Protection | 788 (73.0%) | 291 (27.0%) |
| Firefighting & Prevention | 481 (70.9%) | 197 (29.1%) |
| Law Enforcement | 307 (76.6%) | 94 (23.4%) |
| Food Preparation & Serving | 2,268 (38.1%) | 3,689 (61.9%) |
| Cleaning & Maintenance | 1,591 (61.8%) | 982 (38.2%) |
| Personal Care & Service | 558 (28.0%) | 1,434 (72.0%) |
| Total (Category) | 5,814 (42.6%) | 7,838 (57.4%) |
| Total (Overall) | 34,251 (51.7%) | 31,956 (48.3%) |
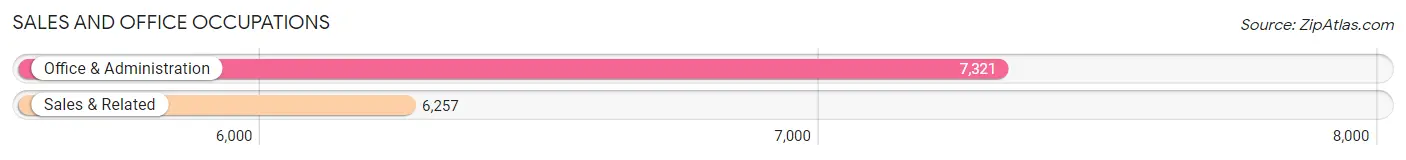
Sales and Office Occupations
The most common Sales and Office occupations in Missoula County are Office & Administration (7,321 | 11.1%), and Sales & Related (6,257 | 9.5%).
Sales and Office Occupations by Sex
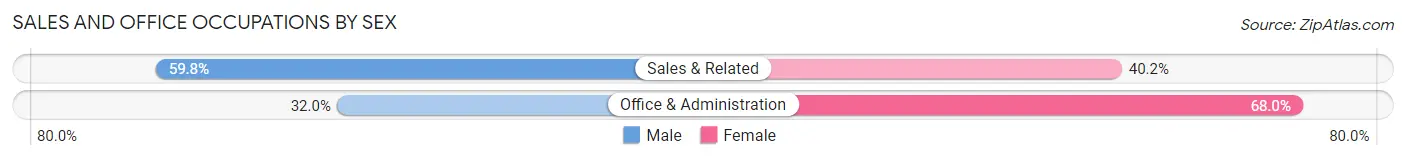
| Occupation | Male | Female |
| Sales & Related | 3,742 (59.8%) | 2,515 (40.2%) |
| Office & Administration | 2,341 (32.0%) | 4,980 (68.0%) |
| Total (Category) | 6,083 (44.8%) | 7,495 (55.2%) |
| Total (Overall) | 34,251 (51.7%) | 31,956 (48.3%) |
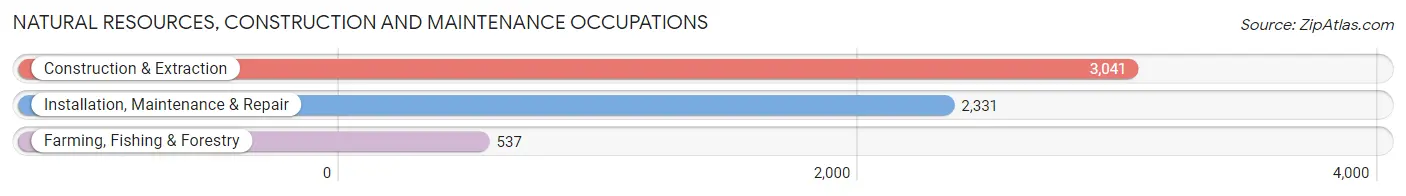
Natural Resources, Construction and Maintenance Occupations
The most common Natural Resources, Construction and Maintenance occupations in Missoula County are Construction & Extraction (3,041 | 4.6%), Installation, Maintenance & Repair (2,331 | 3.5%), and Farming, Fishing & Forestry (537 | 0.8%).
Natural Resources, Construction and Maintenance Occupations by Sex
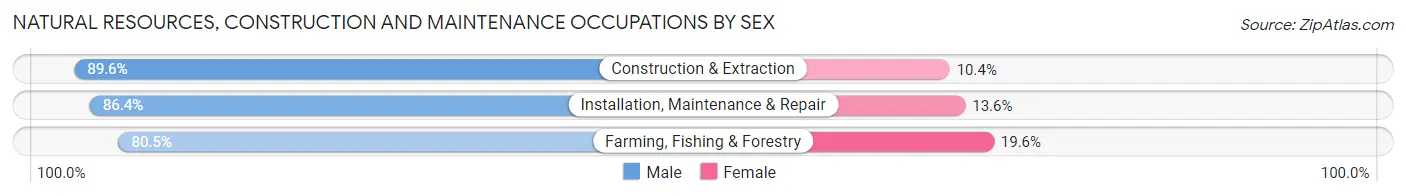
| Occupation | Male | Female |
| Farming, Fishing & Forestry | 432 (80.4%) | 105 (19.6%) |
| Construction & Extraction | 2,726 (89.6%) | 315 (10.4%) |
| Installation, Maintenance & Repair | 2,014 (86.4%) | 317 (13.6%) |
| Total (Category) | 5,172 (87.5%) | 737 (12.5%) |
| Total (Overall) | 34,251 (51.7%) | 31,956 (48.3%) |
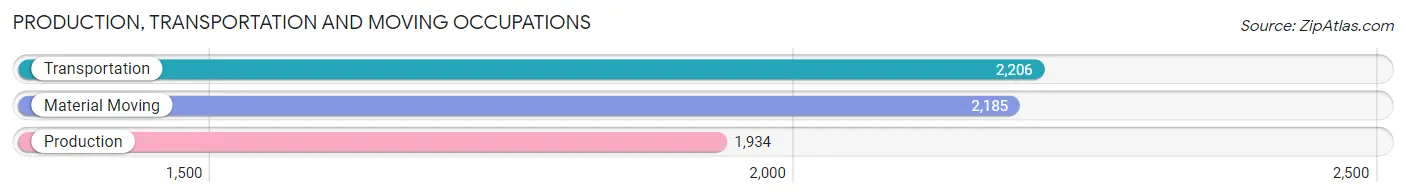
Production, Transportation and Moving Occupations
The most common Production, Transportation and Moving occupations in Missoula County are Transportation (2,206 | 3.3%), Material Moving (2,185 | 3.3%), and Production (1,934 | 2.9%).
Production, Transportation and Moving Occupations by Sex
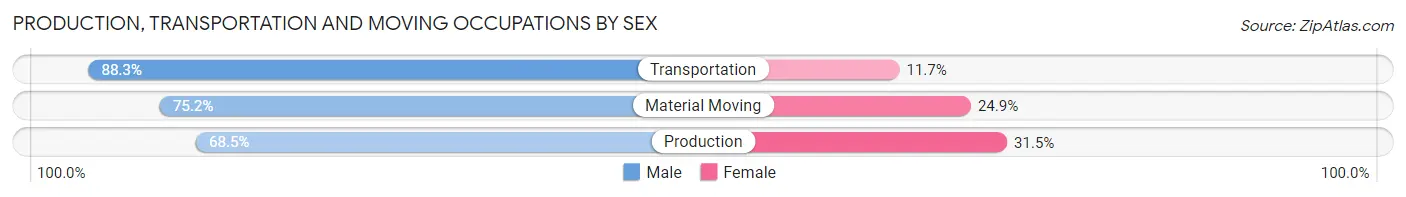
| Occupation | Male | Female |
| Production | 1,325 (68.5%) | 609 (31.5%) |
| Transportation | 1,947 (88.3%) | 259 (11.7%) |
| Material Moving | 1,642 (75.1%) | 543 (24.8%) |
| Total (Category) | 4,914 (77.7%) | 1,411 (22.3%) |
| Total (Overall) | 34,251 (51.7%) | 31,956 (48.3%) |
Employment Industries by Sex in Missoula County
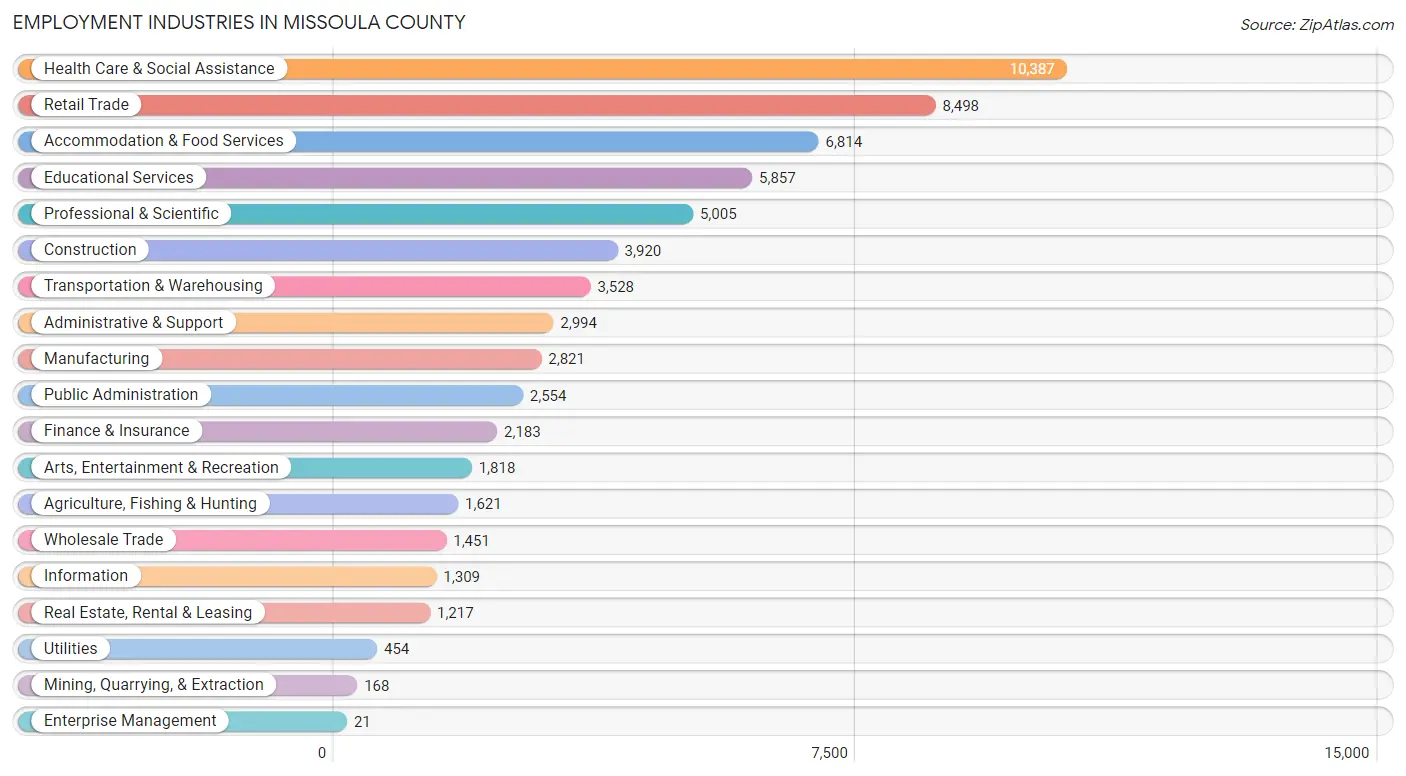
Employment Industries in Missoula County
The major employment industries in Missoula County include Health Care & Social Assistance (10,387 | 15.7%), Retail Trade (8,498 | 12.8%), Accommodation & Food Services (6,814 | 10.3%), Educational Services (5,857 | 8.8%), and Professional & Scientific (5,005 | 7.6%).
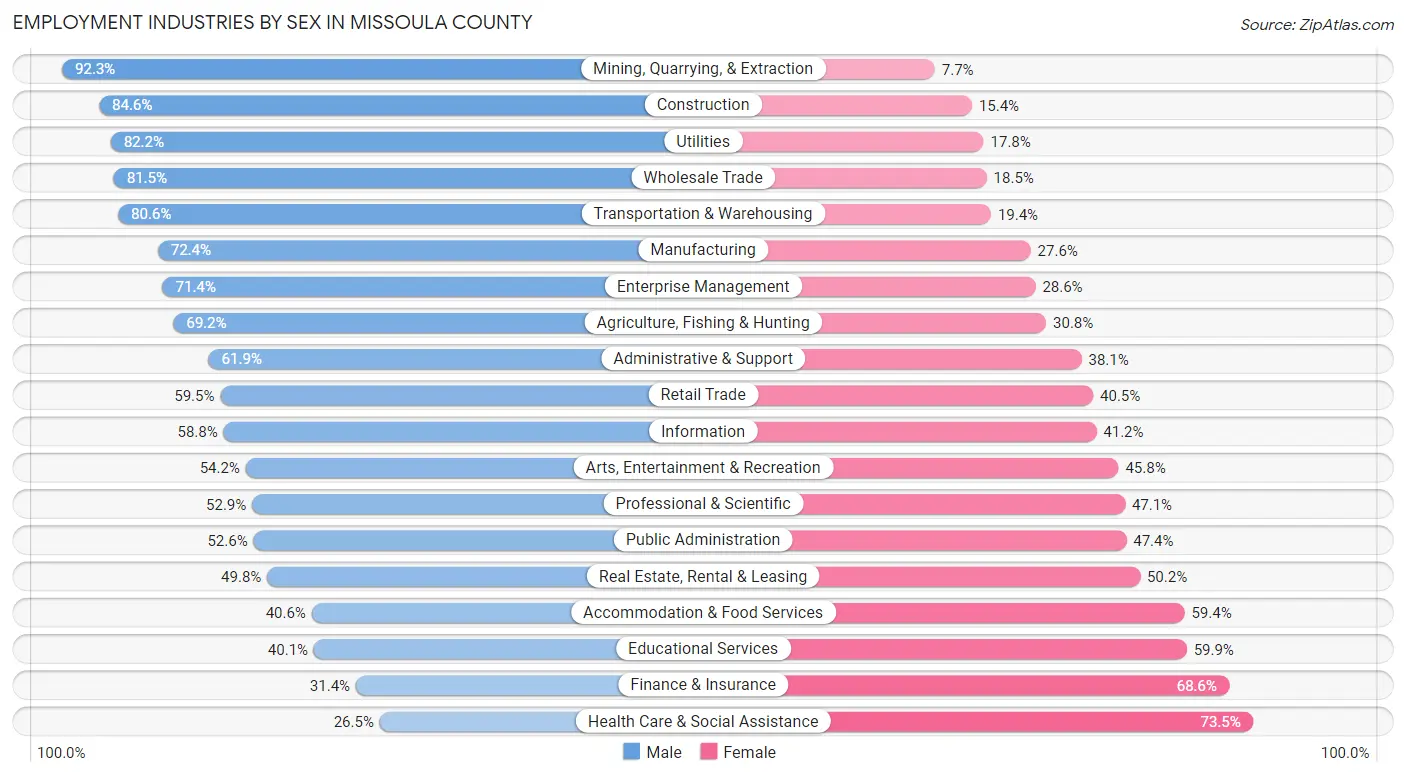
Employment Industries by Sex in Missoula County
The Missoula County industries that see more men than women are Mining, Quarrying, & Extraction (92.3%), Construction (84.6%), and Utilities (82.2%), whereas the industries that tend to have a higher number of women are Health Care & Social Assistance (73.5%), Finance & Insurance (68.6%), and Educational Services (59.9%).
| Industry | Male | Female |
| Agriculture, Fishing & Hunting | 1,122 (69.2%) | 499 (30.8%) |
| Mining, Quarrying, & Extraction | 155 (92.3%) | 13 (7.7%) |
| Construction | 3,315 (84.6%) | 605 (15.4%) |
| Manufacturing | 2,043 (72.4%) | 778 (27.6%) |
| Wholesale Trade | 1,183 (81.5%) | 268 (18.5%) |
| Retail Trade | 5,056 (59.5%) | 3,442 (40.5%) |
| Transportation & Warehousing | 2,845 (80.6%) | 683 (19.4%) |
| Utilities | 373 (82.2%) | 81 (17.8%) |
| Information | 770 (58.8%) | 539 (41.2%) |
| Finance & Insurance | 686 (31.4%) | 1,497 (68.6%) |
| Real Estate, Rental & Leasing | 606 (49.8%) | 611 (50.2%) |
| Professional & Scientific | 2,648 (52.9%) | 2,357 (47.1%) |
| Enterprise Management | 15 (71.4%) | 6 (28.6%) |
| Administrative & Support | 1,853 (61.9%) | 1,141 (38.1%) |
| Educational Services | 2,350 (40.1%) | 3,507 (59.9%) |
| Health Care & Social Assistance | 2,752 (26.5%) | 7,635 (73.5%) |
| Arts, Entertainment & Recreation | 986 (54.2%) | 832 (45.8%) |
| Accommodation & Food Services | 2,765 (40.6%) | 4,049 (59.4%) |
| Public Administration | 1,344 (52.6%) | 1,210 (47.4%) |
| Total | 34,251 (51.7%) | 31,956 (48.3%) |
Education in Missoula County
School Enrollment in Missoula County
The most common levels of schooling among the 28,448 students in Missoula County are college / undergraduate (8,663 | 30.4%), middle school (5,521 | 19.4%), and high school (5,180 | 18.2%).
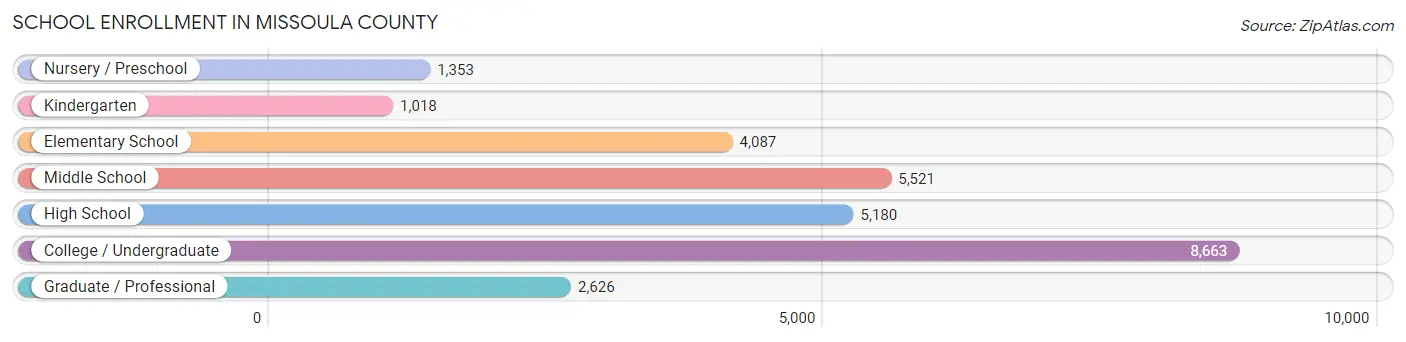
| School Level | # Students | % Students |
| Nursery / Preschool | 1,353 | 4.8% |
| Kindergarten | 1,018 | 3.6% |
| Elementary School | 4,087 | 14.4% |
| Middle School | 5,521 | 19.4% |
| High School | 5,180 | 18.2% |
| College / Undergraduate | 8,663 | 30.4% |
| Graduate / Professional | 2,626 | 9.2% |
| Total | 28,448 | 100.0% |
School Enrollment by Age by Funding Source in Missoula County
Out of a total of 28,448 students who are enrolled in schools in Missoula County, 2,987 (10.5%) attend a private institution, while the remaining 25,461 (89.5%) are enrolled in public schools. The age group of 3 to 4 year olds has the highest likelihood of being enrolled in private schools, with 522 (51.3% in the age bracket) enrolled. Conversely, the age group of 20 to 24 year olds has the lowest likelihood of being enrolled in a private school, with 4,542 (96.3% in the age bracket) attending a public institution.
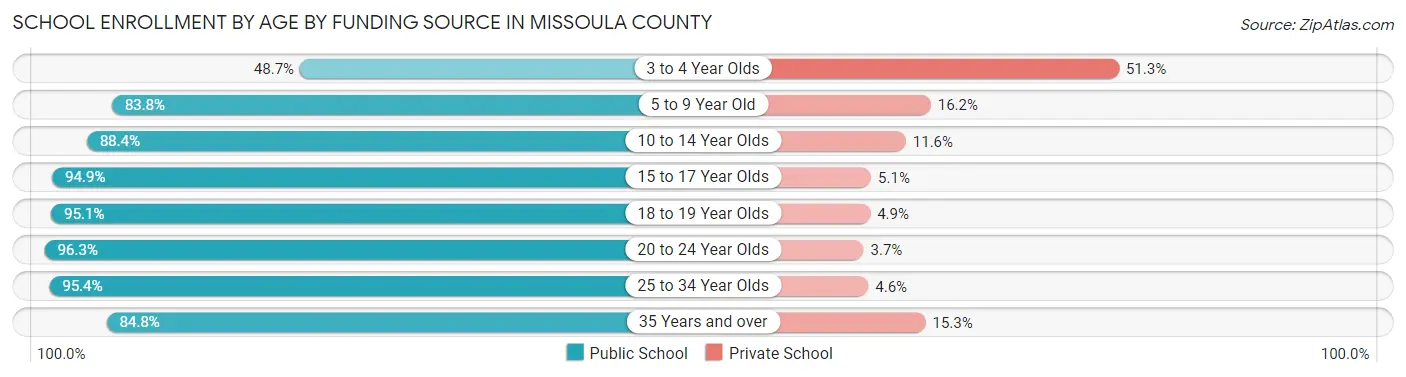
| Age Bracket | Public School | Private School |
| 3 to 4 Year Olds | 496 (48.7%) | 522 (51.3%) |
| 5 to 9 Year Old | 3,907 (83.8%) | 757 (16.2%) |
| 10 to 14 Year Olds | 6,024 (88.4%) | 789 (11.6%) |
| 15 to 17 Year Olds | 3,506 (94.9%) | 189 (5.1%) |
| 18 to 19 Year Olds | 2,789 (95.1%) | 145 (4.9%) |
| 20 to 24 Year Olds | 4,542 (96.3%) | 175 (3.7%) |
| 25 to 34 Year Olds | 2,593 (95.4%) | 125 (4.6%) |
| 35 Years and over | 1,601 (84.8%) | 288 (15.2%) |
| Total | 25,461 (89.5%) | 2,987 (10.5%) |
Educational Attainment by Field of Study in Missoula County
Business (5,888 | 14.5%), education (4,654 | 11.5%), bio, nature & agricultural (4,565 | 11.3%), social sciences (4,515 | 11.2%), and science & technology (3,665 | 9.0%) are the most common fields of study among 40,505 individuals in Missoula County who have obtained a bachelor's degree or higher.
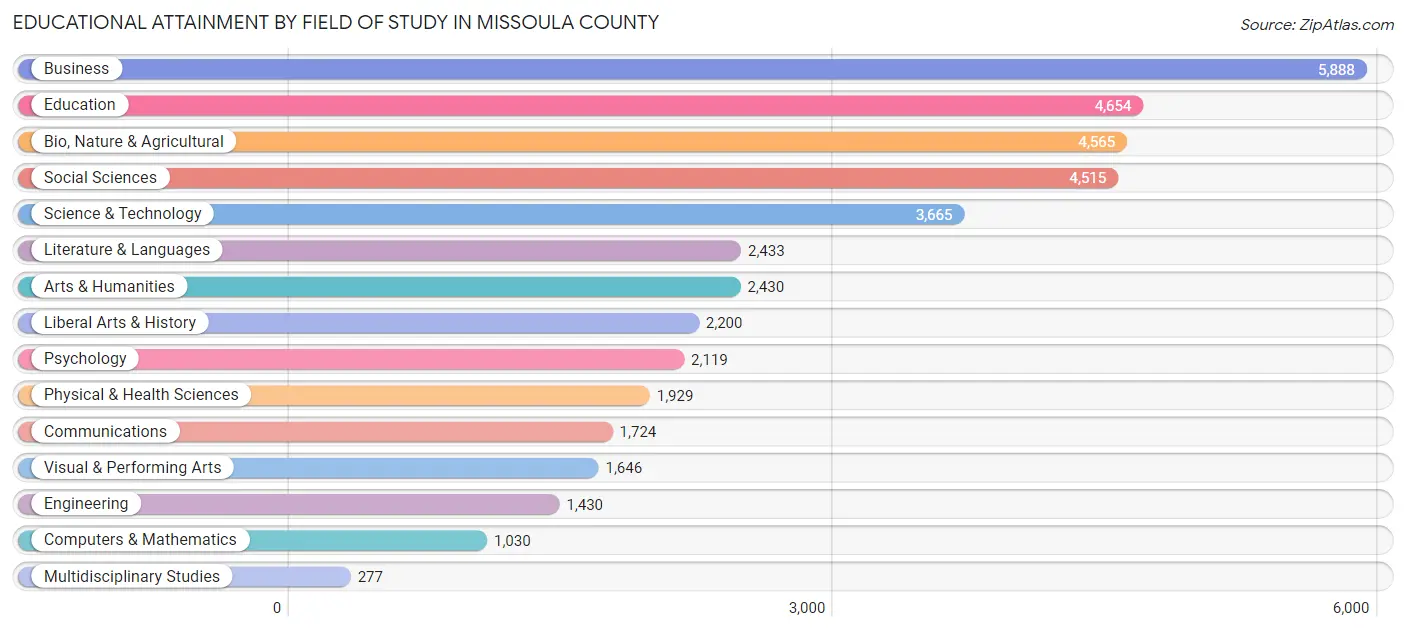
| Field of Study | # Graduates | % Graduates |
| Computers & Mathematics | 1,030 | 2.5% |
| Bio, Nature & Agricultural | 4,565 | 11.3% |
| Physical & Health Sciences | 1,929 | 4.8% |
| Psychology | 2,119 | 5.2% |
| Social Sciences | 4,515 | 11.2% |
| Engineering | 1,430 | 3.5% |
| Multidisciplinary Studies | 277 | 0.7% |
| Science & Technology | 3,665 | 9.0% |
| Business | 5,888 | 14.5% |
| Education | 4,654 | 11.5% |
| Literature & Languages | 2,433 | 6.0% |
| Liberal Arts & History | 2,200 | 5.4% |
| Visual & Performing Arts | 1,646 | 4.1% |
| Communications | 1,724 | 4.3% |
| Arts & Humanities | 2,430 | 6.0% |
| Total | 40,505 | 100.0% |
Transportation & Commute in Missoula County
Vehicle Availability by Sex in Missoula County
The most prevalent vehicle ownership categories in Missoula County are males with 2 vehicles (13,724, accounting for 41.5%) and females with 2 vehicles (12,701, making up 44.6%).
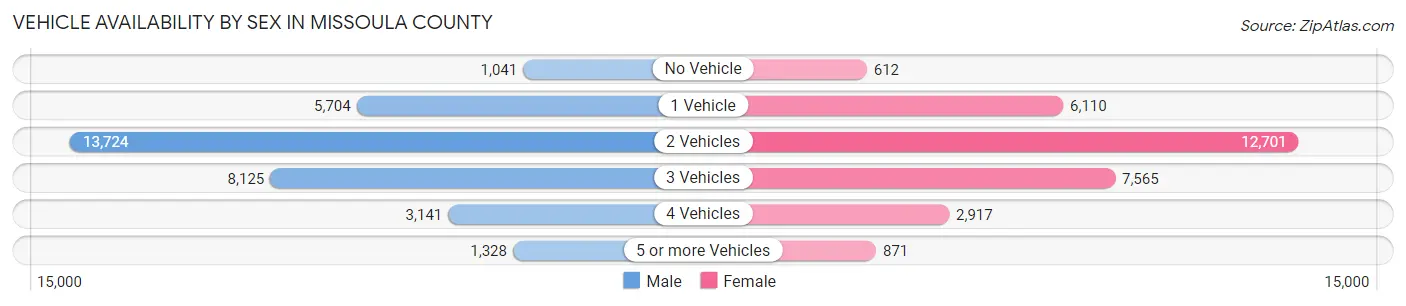
| Vehicles Available | Male | Female |
| No Vehicle | 1,041 (3.2%) | 612 (2.0%) |
| 1 Vehicle | 5,704 (17.2%) | 6,110 (19.9%) |
| 2 Vehicles | 13,724 (41.5%) | 12,701 (41.3%) |
| 3 Vehicles | 8,125 (24.6%) | 7,565 (24.6%) |
| 4 Vehicles | 3,141 (9.5%) | 2,917 (9.5%) |
| 5 or more Vehicles | 1,328 (4.0%) | 871 (2.8%) |
| Total | 33,063 (100.0%) | 30,776 (100.0%) |
Commute Time in Missoula County
The most frequently occuring commute durations in Missoula County are 10 to 14 minutes (13,086 commuters, 22.5%), 15 to 19 minutes (12,884 commuters, 22.2%), and 5 to 9 minutes (9,856 commuters, 17.0%).
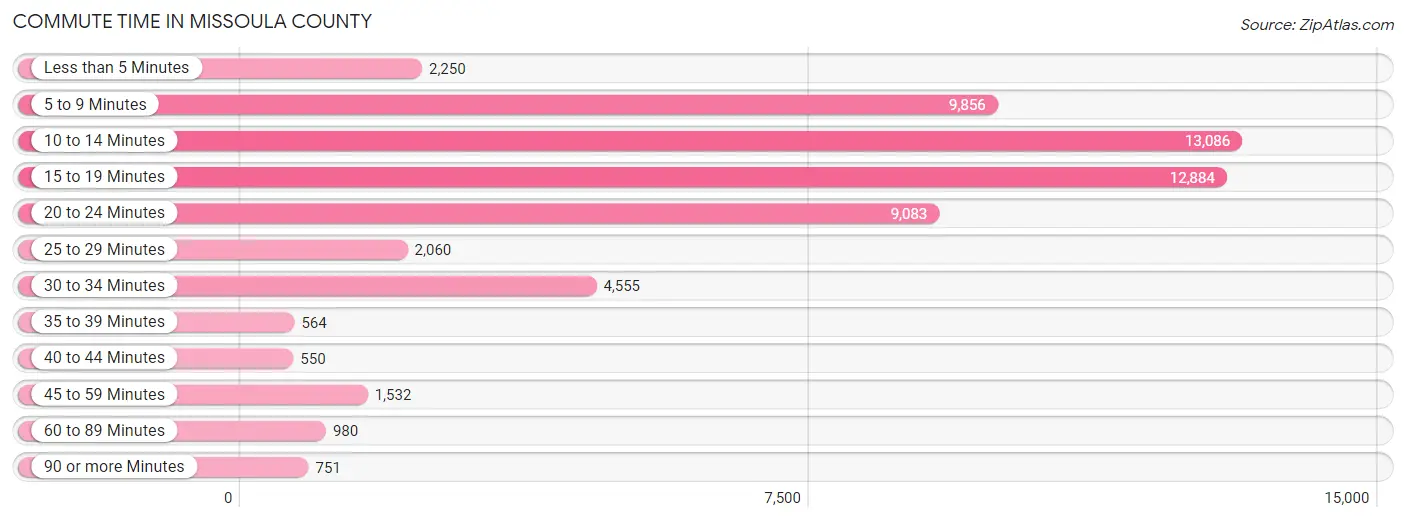
| Commute Time | # Commuters | % Commuters |
| Less than 5 Minutes | 2,250 | 3.9% |
| 5 to 9 Minutes | 9,856 | 17.0% |
| 10 to 14 Minutes | 13,086 | 22.5% |
| 15 to 19 Minutes | 12,884 | 22.2% |
| 20 to 24 Minutes | 9,083 | 15.6% |
| 25 to 29 Minutes | 2,060 | 3.5% |
| 30 to 34 Minutes | 4,555 | 7.8% |
| 35 to 39 Minutes | 564 | 1.0% |
| 40 to 44 Minutes | 550 | 0.9% |
| 45 to 59 Minutes | 1,532 | 2.6% |
| 60 to 89 Minutes | 980 | 1.7% |
| 90 or more Minutes | 751 | 1.3% |
Commute Time by Sex in Missoula County
The most common commute times in Missoula County are 15 to 19 minutes (6,948 commuters, 23.1%) for males and 10 to 14 minutes (6,276 commuters, 22.4%) for females.
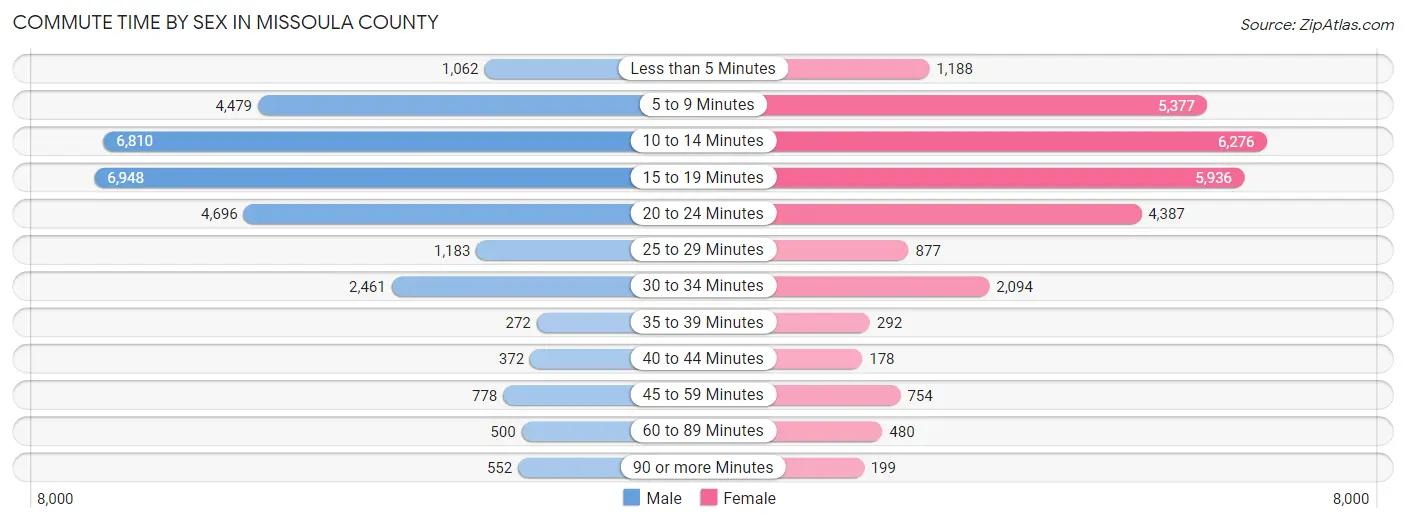
| Commute Time | Male | Female |
| Less than 5 Minutes | 1,062 (3.5%) | 1,188 (4.2%) |
| 5 to 9 Minutes | 4,479 (14.9%) | 5,377 (19.2%) |
| 10 to 14 Minutes | 6,810 (22.6%) | 6,276 (22.4%) |
| 15 to 19 Minutes | 6,948 (23.1%) | 5,936 (21.2%) |
| 20 to 24 Minutes | 4,696 (15.6%) | 4,387 (15.7%) |
| 25 to 29 Minutes | 1,183 (3.9%) | 877 (3.1%) |
| 30 to 34 Minutes | 2,461 (8.2%) | 2,094 (7.5%) |
| 35 to 39 Minutes | 272 (0.9%) | 292 (1.0%) |
| 40 to 44 Minutes | 372 (1.2%) | 178 (0.6%) |
| 45 to 59 Minutes | 778 (2.6%) | 754 (2.7%) |
| 60 to 89 Minutes | 500 (1.7%) | 480 (1.7%) |
| 90 or more Minutes | 552 (1.8%) | 199 (0.7%) |
Time of Departure to Work by Sex in Missoula County
The most frequent times of departure to work in Missoula County are 7:30 AM to 7:59 AM (5,502, 18.3%) for males and 7:30 AM to 7:59 AM (5,294, 18.9%) for females.
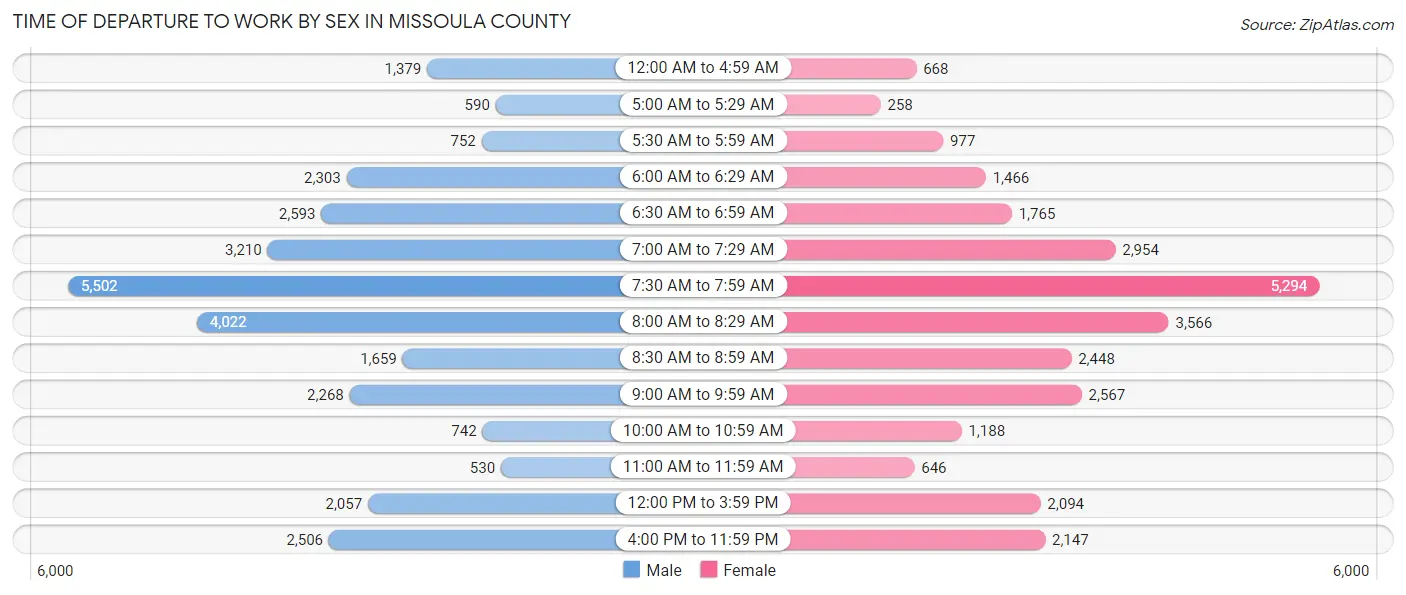
| Time of Departure | Male | Female |
| 12:00 AM to 4:59 AM | 1,379 (4.6%) | 668 (2.4%) |
| 5:00 AM to 5:29 AM | 590 (2.0%) | 258 (0.9%) |
| 5:30 AM to 5:59 AM | 752 (2.5%) | 977 (3.5%) |
| 6:00 AM to 6:29 AM | 2,303 (7.6%) | 1,466 (5.2%) |
| 6:30 AM to 6:59 AM | 2,593 (8.6%) | 1,765 (6.3%) |
| 7:00 AM to 7:29 AM | 3,210 (10.7%) | 2,954 (10.5%) |
| 7:30 AM to 7:59 AM | 5,502 (18.3%) | 5,294 (18.9%) |
| 8:00 AM to 8:29 AM | 4,022 (13.4%) | 3,566 (12.7%) |
| 8:30 AM to 8:59 AM | 1,659 (5.5%) | 2,448 (8.7%) |
| 9:00 AM to 9:59 AM | 2,268 (7.5%) | 2,567 (9.2%) |
| 10:00 AM to 10:59 AM | 742 (2.5%) | 1,188 (4.2%) |
| 11:00 AM to 11:59 AM | 530 (1.8%) | 646 (2.3%) |
| 12:00 PM to 3:59 PM | 2,057 (6.8%) | 2,094 (7.5%) |
| 4:00 PM to 11:59 PM | 2,506 (8.3%) | 2,147 (7.7%) |
| Total | 30,113 (100.0%) | 28,038 (100.0%) |
Housing Occupancy in Missoula County
Occupancy by Ownership in Missoula County
Of the total 50,446 dwellings in Missoula County, owner-occupied units account for 29,672 (58.8%), while renter-occupied units make up 20,774 (41.2%).
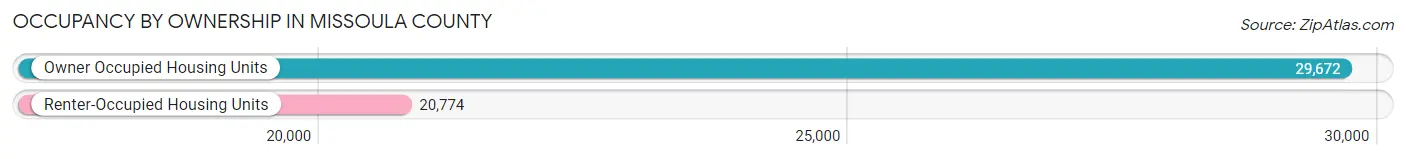
| Occupancy | # Housing Units | % Housing Units |
| Owner Occupied Housing Units | 29,672 | 58.8% |
| Renter-Occupied Housing Units | 20,774 | 41.2% |
| Total Occupied Housing Units | 50,446 | 100.0% |
Occupancy by Household Size in Missoula County
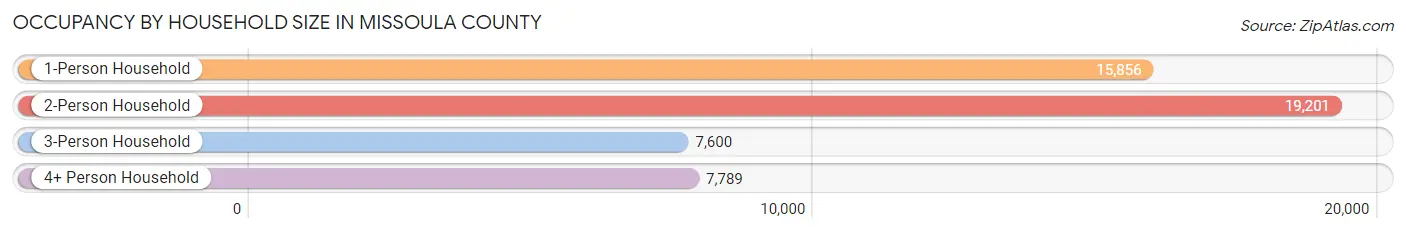
| Household Size | # Housing Units | % Housing Units |
| 1-Person Household | 15,856 | 31.4% |
| 2-Person Household | 19,201 | 38.1% |
| 3-Person Household | 7,600 | 15.1% |
| 4+ Person Household | 7,789 | 15.4% |
| Total Housing Units | 50,446 | 100.0% |
Occupancy by Ownership by Household Size in Missoula County
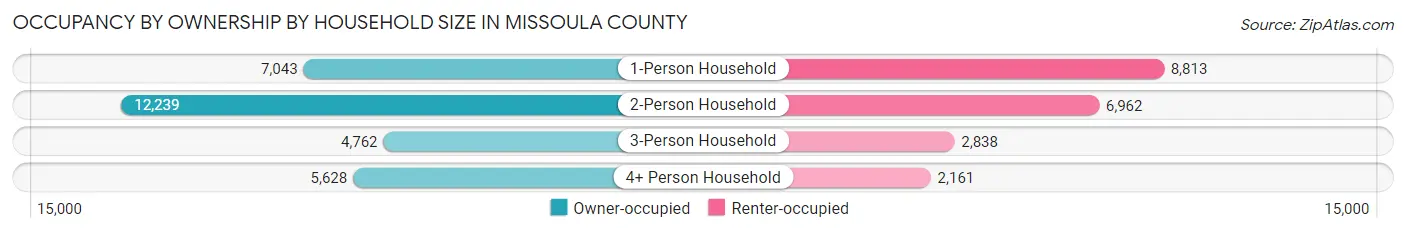
| Household Size | Owner-occupied | Renter-occupied |
| 1-Person Household | 7,043 (44.4%) | 8,813 (55.6%) |
| 2-Person Household | 12,239 (63.7%) | 6,962 (36.3%) |
| 3-Person Household | 4,762 (62.7%) | 2,838 (37.3%) |
| 4+ Person Household | 5,628 (72.3%) | 2,161 (27.7%) |
| Total Housing Units | 29,672 (58.8%) | 20,774 (41.2%) |
Occupancy by Educational Attainment in Missoula County
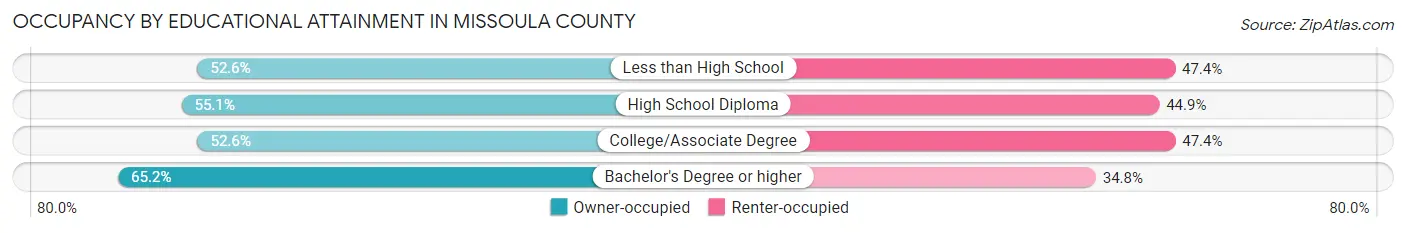
| Household Size | Owner-occupied | Renter-occupied |
| Less than High School | 728 (52.6%) | 656 (47.4%) |
| High School Diploma | 4,864 (55.1%) | 3,963 (44.9%) |
| College/Associate Degree | 8,908 (52.6%) | 8,041 (47.4%) |
| Bachelor's Degree or higher | 15,172 (65.2%) | 8,114 (34.8%) |
Occupancy by Age of Householder in Missoula County
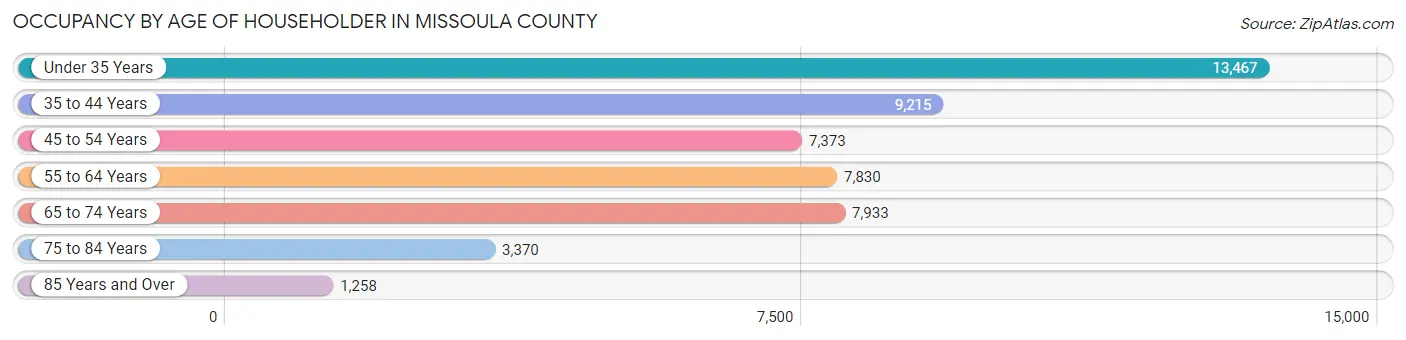
| Age Bracket | # Households | % Households |
| Under 35 Years | 13,467 | 26.7% |
| 35 to 44 Years | 9,215 | 18.3% |
| 45 to 54 Years | 7,373 | 14.6% |
| 55 to 64 Years | 7,830 | 15.5% |
| 65 to 74 Years | 7,933 | 15.7% |
| 75 to 84 Years | 3,370 | 6.7% |
| 85 Years and Over | 1,258 | 2.5% |
| Total | 50,446 | 100.0% |
Housing Finances in Missoula County
Median Income by Occupancy in Missoula County
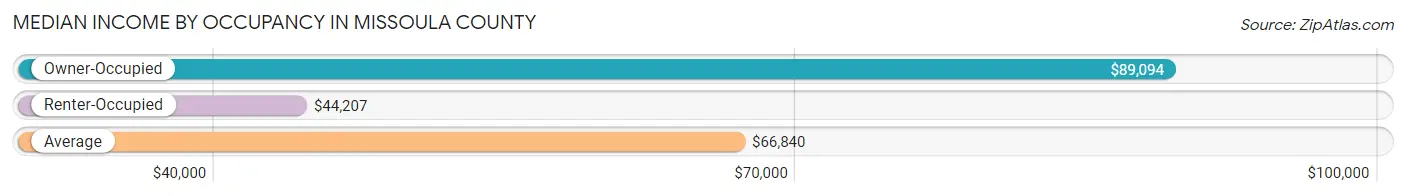
| Occupancy Type | # Households | Median Income |
| Owner-Occupied | 29,672 (58.8%) | $89,094 |
| Renter-Occupied | 20,774 (41.2%) | $44,207 |
| Average | 50,446 (100.0%) | $66,840 |
Occupancy by Householder Income Bracket in Missoula County
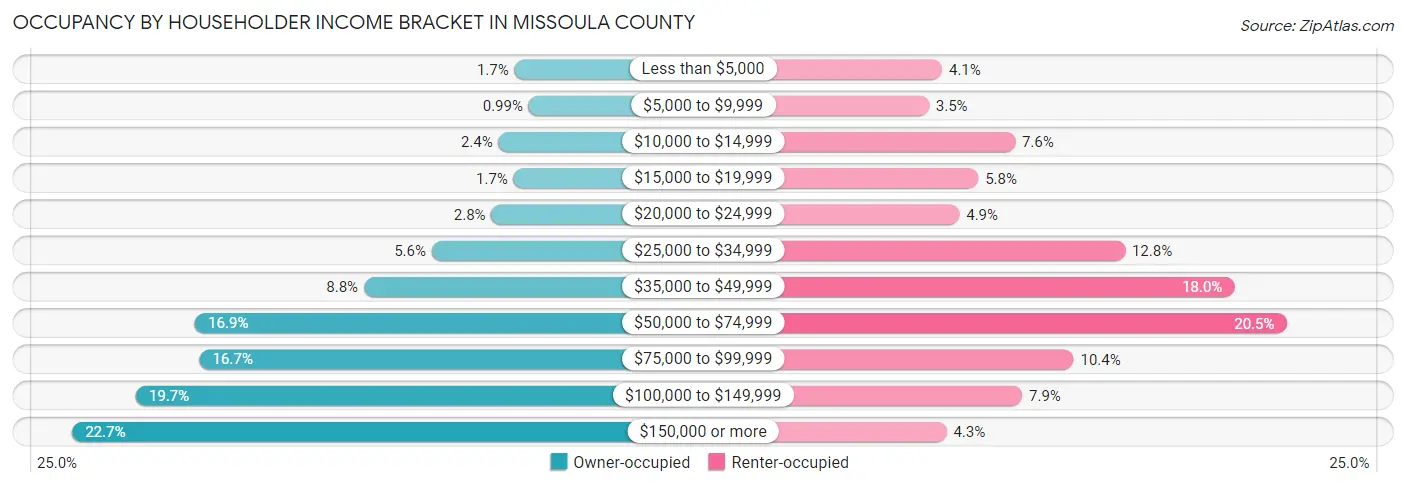
| Income Bracket | Owner-occupied | Renter-occupied |
| Less than $5,000 | 495 (1.7%) | 856 (4.1%) |
| $5,000 to $9,999 | 294 (1.0%) | 725 (3.5%) |
| $10,000 to $14,999 | 721 (2.4%) | 1,576 (7.6%) |
| $15,000 to $19,999 | 508 (1.7%) | 1,213 (5.8%) |
| $20,000 to $24,999 | 822 (2.8%) | 1,027 (4.9%) |
| $25,000 to $34,999 | 1,666 (5.6%) | 2,666 (12.8%) |
| $35,000 to $49,999 | 2,623 (8.8%) | 3,746 (18.0%) |
| $50,000 to $74,999 | 5,009 (16.9%) | 4,261 (20.5%) |
| $75,000 to $99,999 | 4,946 (16.7%) | 2,157 (10.4%) |
| $100,000 to $149,999 | 5,845 (19.7%) | 1,648 (7.9%) |
| $150,000 or more | 6,743 (22.7%) | 899 (4.3%) |
| Total | 29,672 (100.0%) | 20,774 (100.0%) |
Monthly Housing Cost Tiers in Missoula County
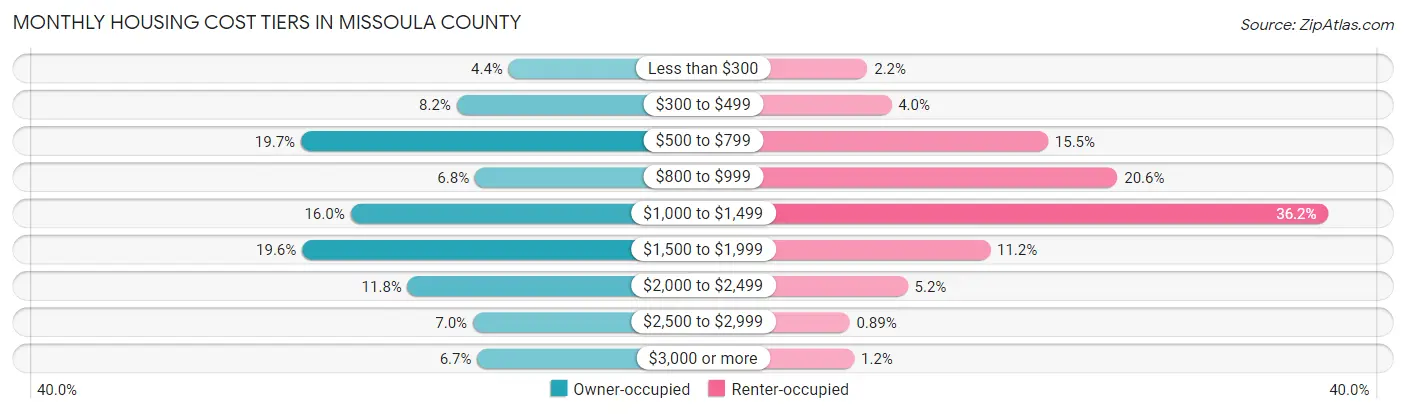
| Monthly Cost | Owner-occupied | Renter-occupied |
| Less than $300 | 1,290 (4.3%) | 458 (2.2%) |
| $300 to $499 | 2,426 (8.2%) | 823 (4.0%) |
| $500 to $799 | 5,831 (19.7%) | 3,221 (15.5%) |
| $800 to $999 | 2,027 (6.8%) | 4,282 (20.6%) |
| $1,000 to $1,499 | 4,748 (16.0%) | 7,509 (36.1%) |
| $1,500 to $1,999 | 5,805 (19.6%) | 2,334 (11.2%) |
| $2,000 to $2,499 | 3,498 (11.8%) | 1,074 (5.2%) |
| $2,500 to $2,999 | 2,072 (7.0%) | 185 (0.9%) |
| $3,000 or more | 1,975 (6.7%) | 255 (1.2%) |
| Total | 29,672 (100.0%) | 20,774 (100.0%) |
Physical Housing Characteristics in Missoula County
Housing Structures in Missoula County

| Structure Type | # Housing Units | % Housing Units |
| Single Unit, Detached | 29,457 | 58.4% |
| Single Unit, Attached | 2,268 | 4.5% |
| 2 Unit Apartments | 2,116 | 4.2% |
| 3 or 4 Unit Apartments | 3,125 | 6.2% |
| 5 to 9 Unit Apartments | 2,472 | 4.9% |
| 10 or more Apartments | 6,428 | 12.7% |
| Mobile Home / Other | 4,580 | 9.1% |
| Total | 50,446 | 100.0% |
Housing Structures by Occupancy in Missoula County
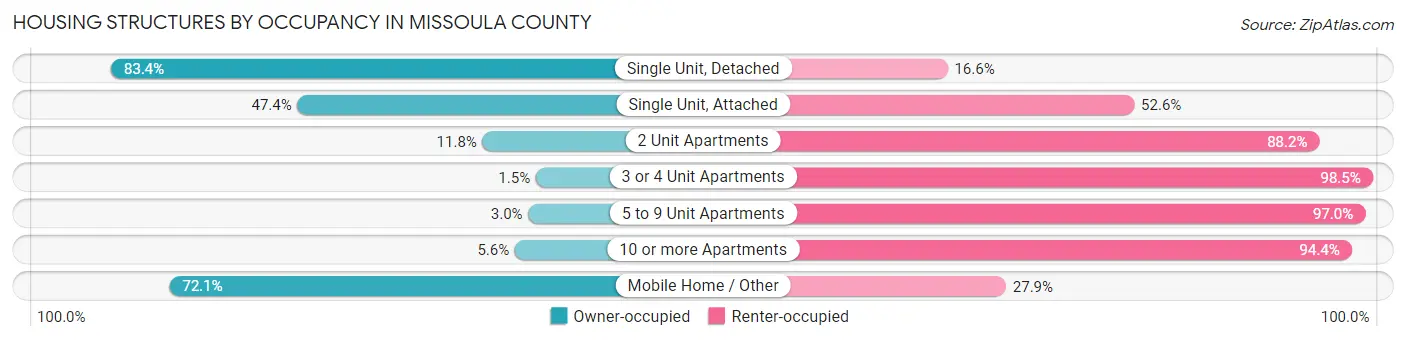
| Structure Type | Owner-occupied | Renter-occupied |
| Single Unit, Detached | 24,562 (83.4%) | 4,895 (16.6%) |
| Single Unit, Attached | 1,076 (47.4%) | 1,192 (52.6%) |
| 2 Unit Apartments | 250 (11.8%) | 1,866 (88.2%) |
| 3 or 4 Unit Apartments | 48 (1.5%) | 3,077 (98.5%) |
| 5 to 9 Unit Apartments | 74 (3.0%) | 2,398 (97.0%) |
| 10 or more Apartments | 358 (5.6%) | 6,070 (94.4%) |
| Mobile Home / Other | 3,304 (72.1%) | 1,276 (27.9%) |
| Total | 29,672 (58.8%) | 20,774 (41.2%) |
Housing Structures by Number of Rooms in Missoula County
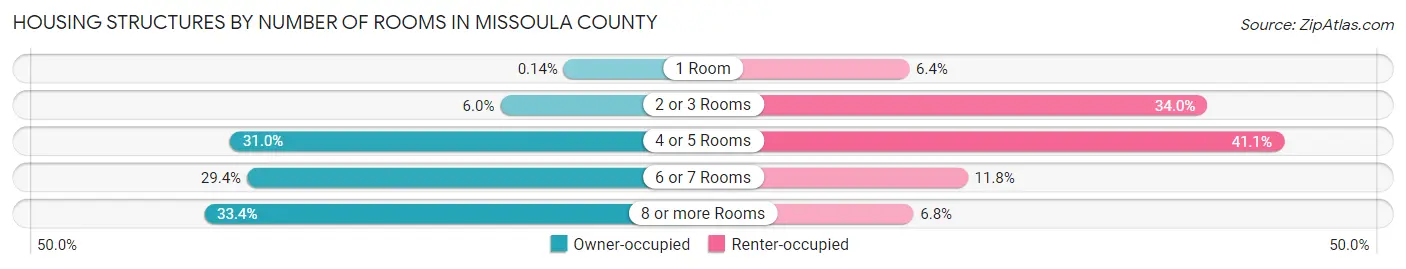
| Number of Rooms | Owner-occupied | Renter-occupied |
| 1 Room | 42 (0.1%) | 1,329 (6.4%) |
| 2 or 3 Rooms | 1,784 (6.0%) | 7,054 (34.0%) |
| 4 or 5 Rooms | 9,200 (31.0%) | 8,527 (41.0%) |
| 6 or 7 Rooms | 8,735 (29.4%) | 2,453 (11.8%) |
| 8 or more Rooms | 9,911 (33.4%) | 1,411 (6.8%) |
| Total | 29,672 (100.0%) | 20,774 (100.0%) |
Housing Structure by Heating Type in Missoula County
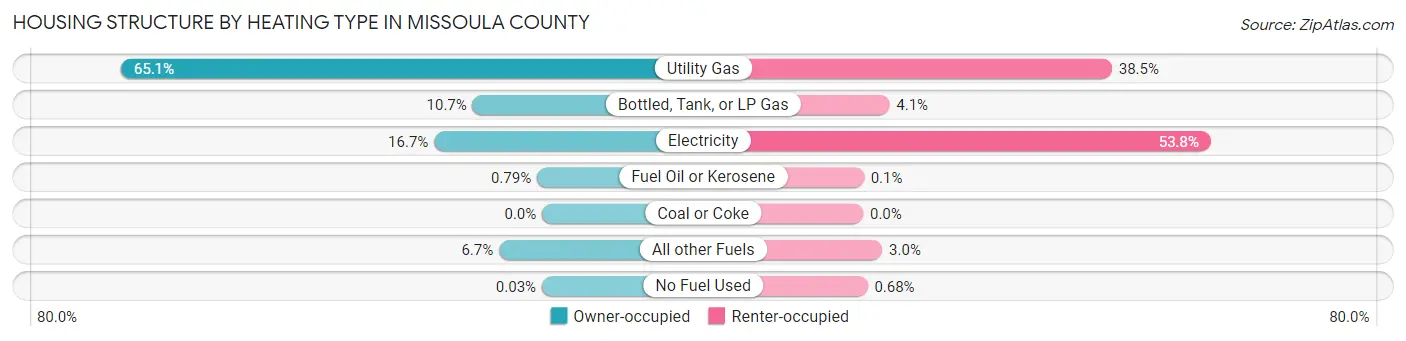
| Heating Type | Owner-occupied | Renter-occupied |
| Utility Gas | 19,319 (65.1%) | 7,989 (38.5%) |
| Bottled, Tank, or LP Gas | 3,187 (10.7%) | 846 (4.1%) |
| Electricity | 4,952 (16.7%) | 11,165 (53.7%) |
| Fuel Oil or Kerosene | 233 (0.8%) | 20 (0.1%) |
| Coal or Coke | 0 (0.0%) | 0 (0.0%) |
| All other Fuels | 1,973 (6.7%) | 612 (2.9%) |
| No Fuel Used | 8 (0.0%) | 142 (0.7%) |
| Total | 29,672 (100.0%) | 20,774 (100.0%) |
Household Vehicle Usage in Missoula County
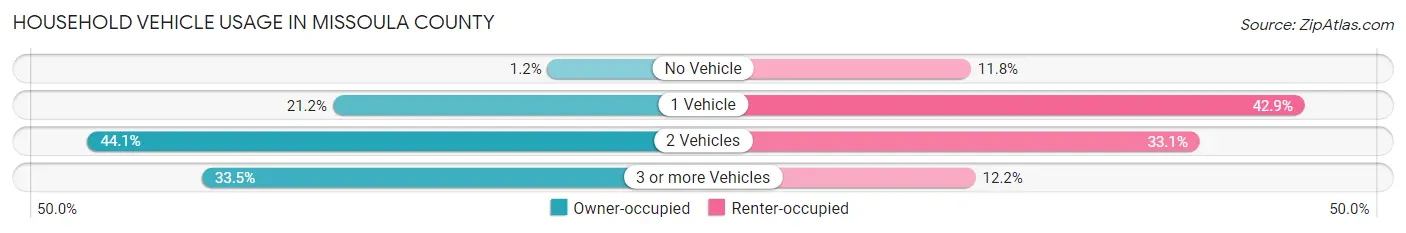
| Vehicles per Household | Owner-occupied | Renter-occupied |
| No Vehicle | 353 (1.2%) | 2,444 (11.8%) |
| 1 Vehicle | 6,299 (21.2%) | 8,916 (42.9%) |
| 2 Vehicles | 13,094 (44.1%) | 6,880 (33.1%) |
| 3 or more Vehicles | 9,926 (33.5%) | 2,534 (12.2%) |
| Total | 29,672 (100.0%) | 20,774 (100.0%) |
Real Estate & Mortgages in Missoula County
Real Estate and Mortgage Overview in Missoula County
| Characteristic | Without Mortgage | With Mortgage |
| Housing Units | 11,179 | 18,493 |
| Median Property Value | $345,200 | $398,900 |
| Median Household Income | $60,220 | $5,092 |
| Monthly Housing Costs | $601 | $1,914 |
| Real Estate Taxes | $3,247 | $224 |
Property Value by Mortgage Status in Missoula County
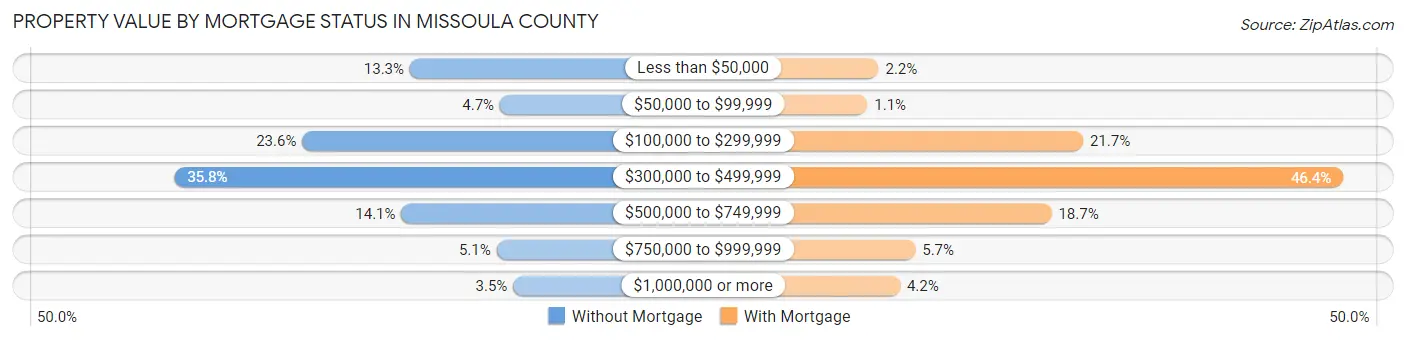
| Property Value | Without Mortgage | With Mortgage |
| Less than $50,000 | 1,488 (13.3%) | 405 (2.2%) |
| $50,000 to $99,999 | 529 (4.7%) | 208 (1.1%) |
| $100,000 to $299,999 | 2,634 (23.6%) | 4,005 (21.7%) |
| $300,000 to $499,999 | 3,996 (35.7%) | 8,589 (46.4%) |
| $500,000 to $749,999 | 1,579 (14.1%) | 3,450 (18.7%) |
| $750,000 to $999,999 | 565 (5.1%) | 1,053 (5.7%) |
| $1,000,000 or more | 388 (3.5%) | 783 (4.2%) |
| Total | 11,179 (100.0%) | 18,493 (100.0%) |
Household Income by Mortgage Status in Missoula County
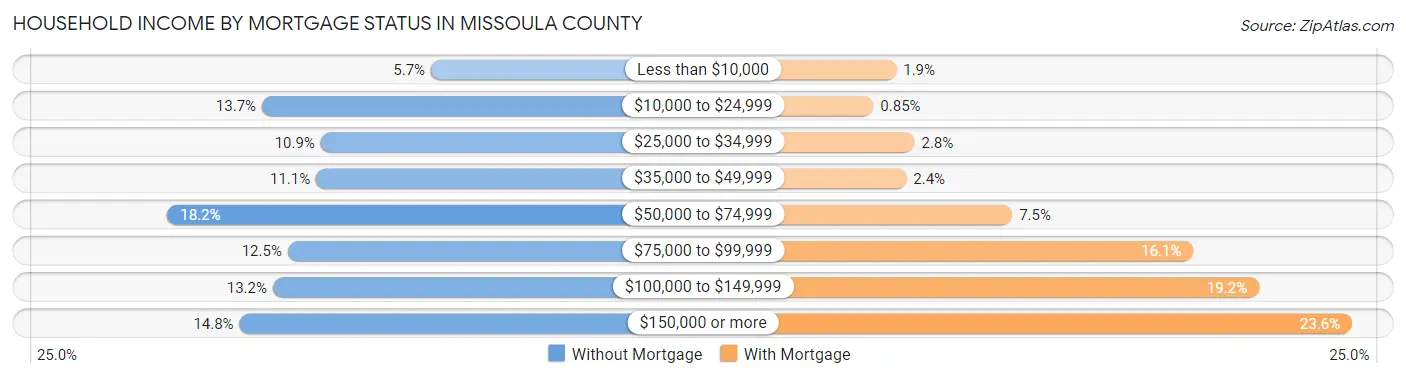
| Household Income | Without Mortgage | With Mortgage |
| Less than $10,000 | 632 (5.7%) | 359 (1.9%) |
| $10,000 to $24,999 | 1,532 (13.7%) | 157 (0.9%) |
| $25,000 to $34,999 | 1,219 (10.9%) | 519 (2.8%) |
| $35,000 to $49,999 | 1,243 (11.1%) | 447 (2.4%) |
| $50,000 to $74,999 | 2,035 (18.2%) | 1,380 (7.5%) |
| $75,000 to $99,999 | 1,394 (12.5%) | 2,974 (16.1%) |
| $100,000 to $149,999 | 1,473 (13.2%) | 3,552 (19.2%) |
| $150,000 or more | 1,651 (14.8%) | 4,372 (23.6%) |
| Total | 11,179 (100.0%) | 18,493 (100.0%) |
Property Value to Household Income Ratio in Missoula County
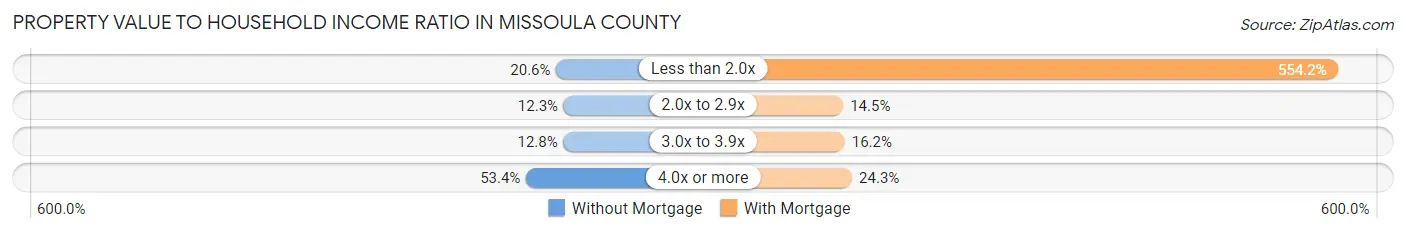
| Value-to-Income Ratio | Without Mortgage | With Mortgage |
| Less than 2.0x | 2,299 (20.6%) | 102,494 (554.2%) |
| 2.0x to 2.9x | 1,379 (12.3%) | 2,683 (14.5%) |
| 3.0x to 3.9x | 1,426 (12.8%) | 3,000 (16.2%) |
| 4.0x or more | 5,974 (53.4%) | 4,486 (24.3%) |
| Total | 11,179 (100.0%) | 18,493 (100.0%) |
Real Estate Taxes by Mortgage Status in Missoula County
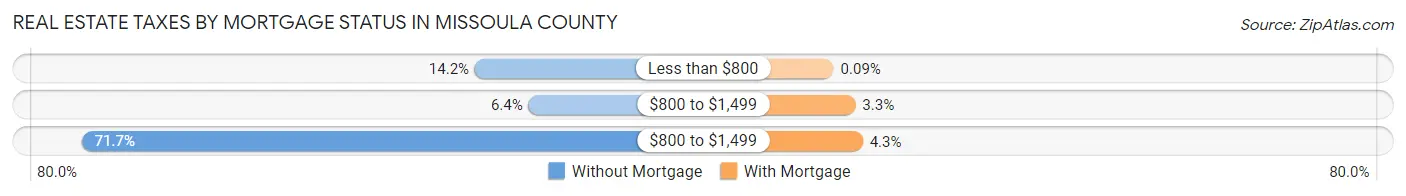
| Property Taxes | Without Mortgage | With Mortgage |
| Less than $800 | 1,587 (14.2%) | 17 (0.1%) |
| $800 to $1,499 | 711 (6.4%) | 604 (3.3%) |
| $800 to $1,499 | 8,012 (71.7%) | 802 (4.3%) |
| Total | 11,179 (100.0%) | 18,493 (100.0%) |
Health & Disability in Missoula County
Health Insurance Coverage by Age in Missoula County
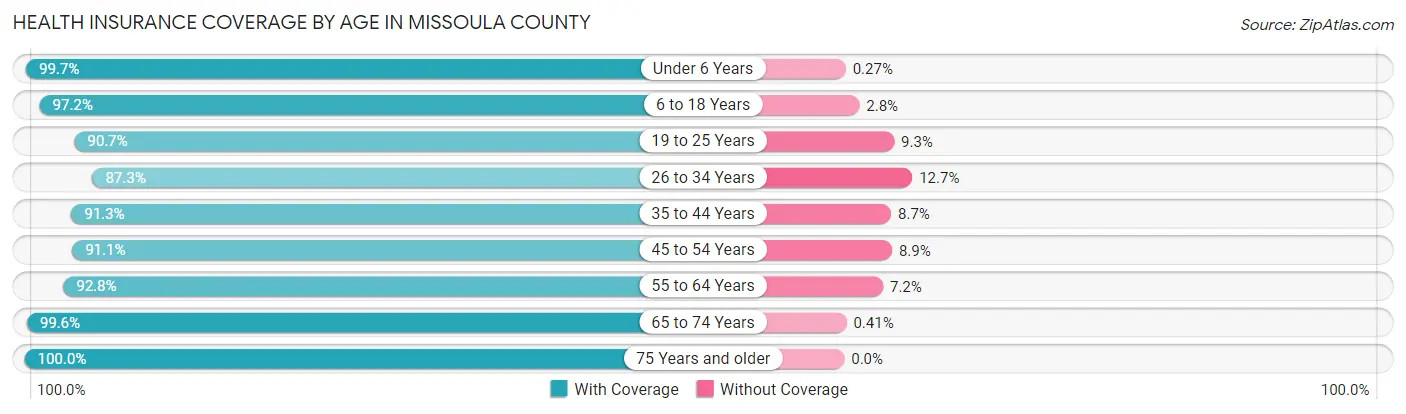
| Age Bracket | With Coverage | Without Coverage |
| Under 6 Years | 6,643 (99.7%) | 18 (0.3%) |
| 6 to 18 Years | 16,332 (97.2%) | 472 (2.8%) |
| 19 to 25 Years | 14,766 (90.7%) | 1,513 (9.3%) |
| 26 to 34 Years | 14,259 (87.3%) | 2,068 (12.7%) |
| 35 to 44 Years | 14,623 (91.3%) | 1,397 (8.7%) |
| 45 to 54 Years | 11,650 (91.1%) | 1,137 (8.9%) |
| 55 to 64 Years | 12,753 (92.8%) | 993 (7.2%) |
| 65 to 74 Years | 11,997 (99.6%) | 49 (0.4%) |
| 75 Years and older | 7,042 (100.0%) | 0 (0.0%) |
| Total | 110,065 (93.5%) | 7,647 (6.5%) |
Health Insurance Coverage by Citizenship Status in Missoula County
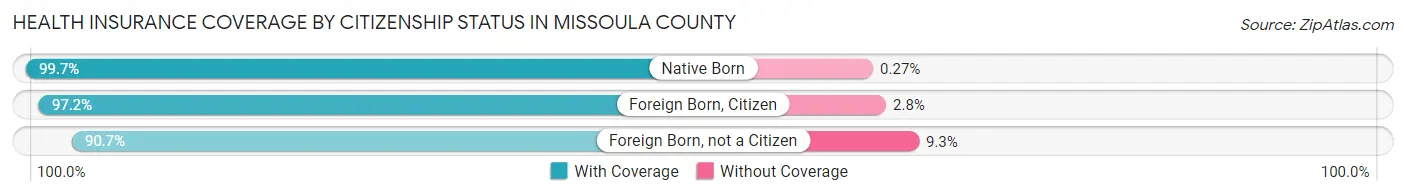
| Citizenship Status | With Coverage | Without Coverage |
| Native Born | 6,643 (99.7%) | 18 (0.3%) |
| Foreign Born, Citizen | 16,332 (97.2%) | 472 (2.8%) |
| Foreign Born, not a Citizen | 14,766 (90.7%) | 1,513 (9.3%) |
Health Insurance Coverage by Household Income in Missoula County
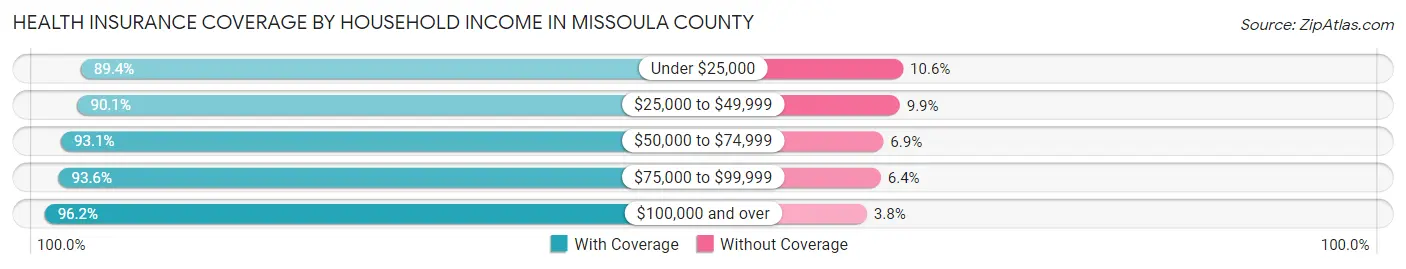
| Household Income | With Coverage | Without Coverage |
| Under $25,000 | 10,729 (89.4%) | 1,267 (10.6%) |
| $25,000 to $49,999 | 17,119 (90.1%) | 1,887 (9.9%) |
| $50,000 to $74,999 | 20,256 (93.1%) | 1,493 (6.9%) |
| $75,000 to $99,999 | 16,158 (93.6%) | 1,101 (6.4%) |
| $100,000 and over | 43,539 (96.2%) | 1,704 (3.8%) |
Public vs Private Health Insurance Coverage by Age in Missoula County
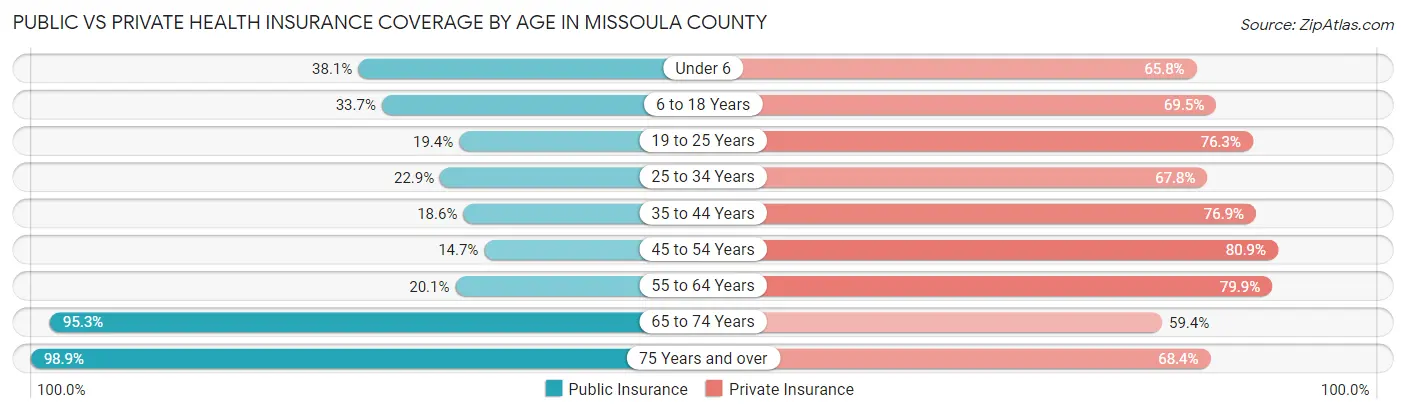
| Age Bracket | Public Insurance | Private Insurance |
| Under 6 | 2,538 (38.1%) | 4,384 (65.8%) |
| 6 to 18 Years | 5,665 (33.7%) | 11,674 (69.5%) |
| 19 to 25 Years | 3,152 (19.4%) | 12,418 (76.3%) |
| 25 to 34 Years | 3,736 (22.9%) | 11,077 (67.8%) |
| 35 to 44 Years | 2,977 (18.6%) | 12,313 (76.9%) |
| 45 to 54 Years | 1,879 (14.7%) | 10,348 (80.9%) |
| 55 to 64 Years | 2,757 (20.1%) | 10,976 (79.8%) |
| 65 to 74 Years | 11,480 (95.3%) | 7,160 (59.4%) |
| 75 Years and over | 6,962 (98.9%) | 4,817 (68.4%) |
| Total | 41,146 (34.9%) | 85,167 (72.4%) |
Disability Status by Sex by Age in Missoula County
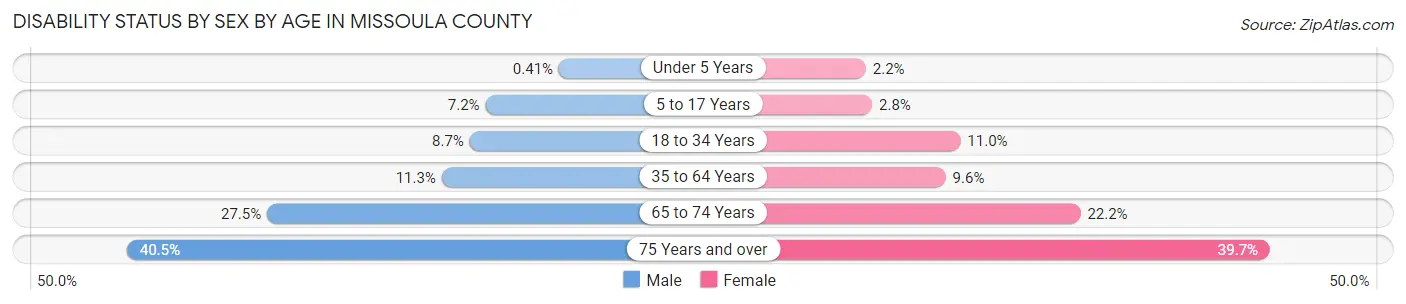
| Age Bracket | Male | Female |
| Under 5 Years | 12 (0.4%) | 59 (2.2%) |
| 5 to 17 Years | 586 (7.2%) | 226 (2.8%) |
| 18 to 34 Years | 1,519 (8.7%) | 1,860 (11.0%) |
| 35 to 64 Years | 2,435 (11.3%) | 2,024 (9.6%) |
| 65 to 74 Years | 1,628 (27.5%) | 1,357 (22.2%) |
| 75 Years and over | 1,309 (40.5%) | 1,514 (39.7%) |
Disability Class by Sex by Age in Missoula County
Disability Class: Hearing Difficulty
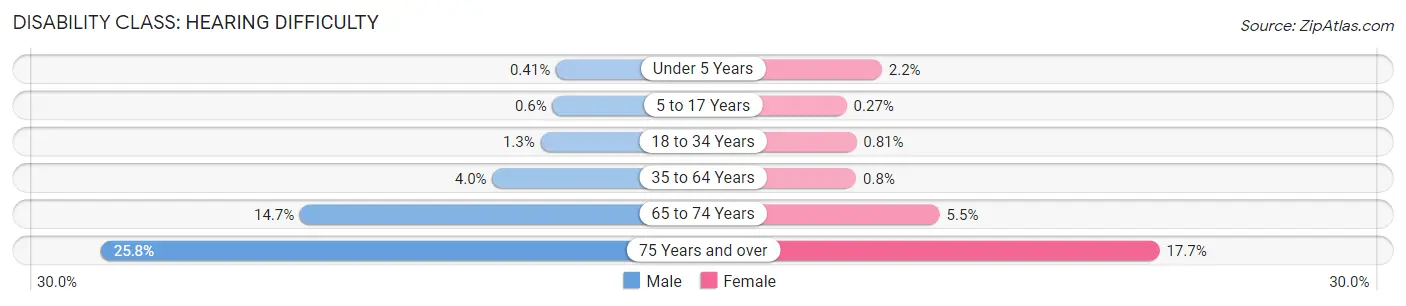
| Age Bracket | Male | Female |
| Under 5 Years | 12 (0.4%) | 59 (2.2%) |
| 5 to 17 Years | 49 (0.6%) | 22 (0.3%) |
| 18 to 34 Years | 222 (1.3%) | 136 (0.8%) |
| 35 to 64 Years | 851 (4.0%) | 167 (0.8%) |
| 65 to 74 Years | 868 (14.7%) | 334 (5.4%) |
| 75 Years and over | 832 (25.8%) | 674 (17.7%) |
Disability Class: Vision Difficulty
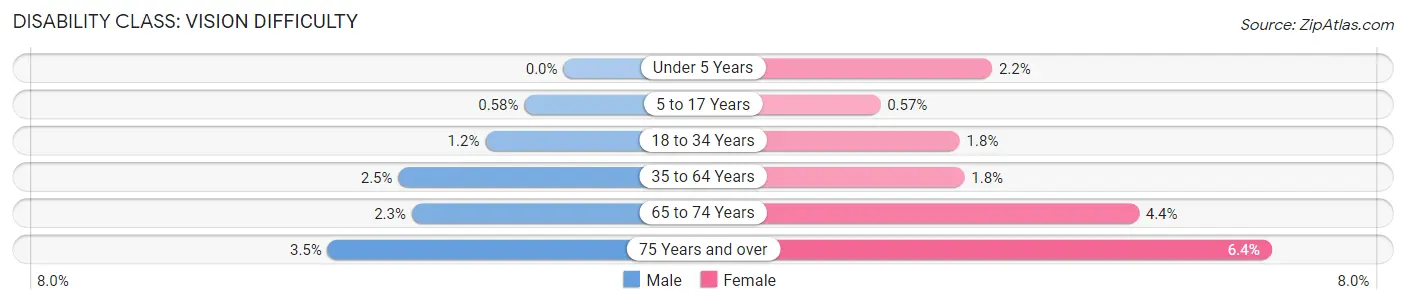
| Age Bracket | Male | Female |
| Under 5 Years | 0 (0.0%) | 59 (2.2%) |
| 5 to 17 Years | 47 (0.6%) | 46 (0.6%) |
| 18 to 34 Years | 202 (1.2%) | 295 (1.8%) |
| 35 to 64 Years | 529 (2.5%) | 382 (1.8%) |
| 65 to 74 Years | 133 (2.2%) | 270 (4.4%) |
| 75 Years and over | 113 (3.5%) | 243 (6.4%) |
Disability Class: Cognitive Difficulty
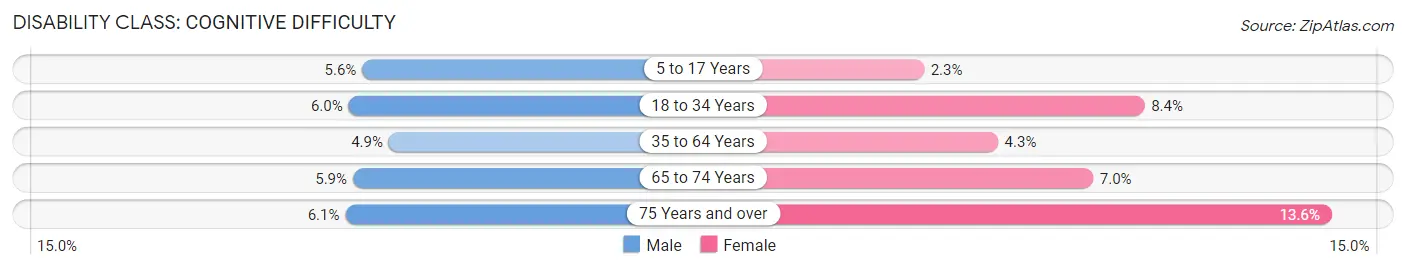
| Age Bracket | Male | Female |
| 5 to 17 Years | 454 (5.6%) | 183 (2.3%) |
| 18 to 34 Years | 1,046 (6.0%) | 1,422 (8.4%) |
| 35 to 64 Years | 1,048 (4.9%) | 911 (4.3%) |
| 65 to 74 Years | 347 (5.9%) | 428 (7.0%) |
| 75 Years and over | 196 (6.1%) | 520 (13.6%) |
Disability Class: Ambulatory Difficulty
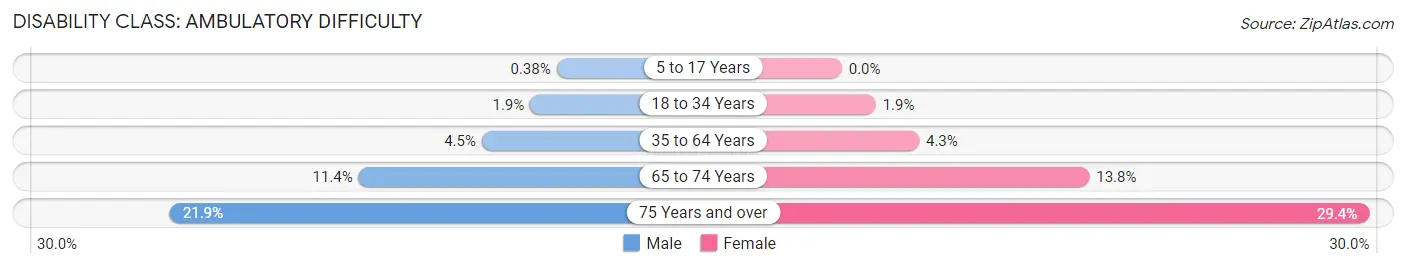
| Age Bracket | Male | Female |
| 5 to 17 Years | 31 (0.4%) | 0 (0.0%) |
| 18 to 34 Years | 323 (1.8%) | 319 (1.9%) |
| 35 to 64 Years | 980 (4.5%) | 903 (4.3%) |
| 65 to 74 Years | 675 (11.4%) | 844 (13.8%) |
| 75 Years and over | 708 (21.9%) | 1,119 (29.4%) |
Disability Class: Self-Care Difficulty
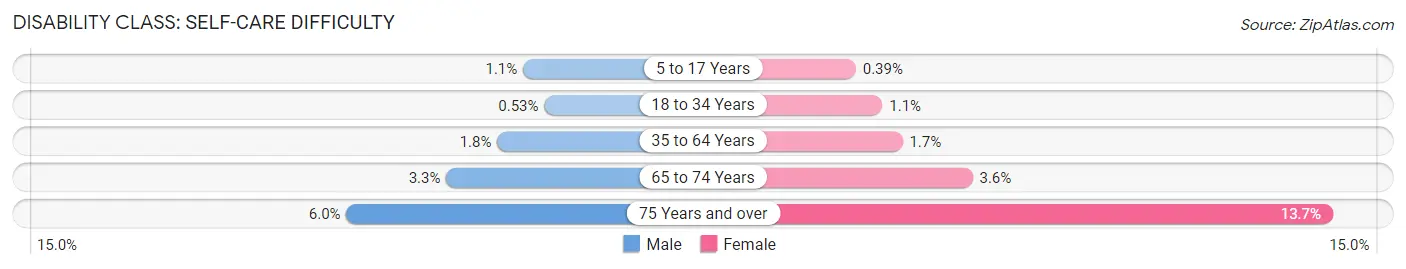
| Age Bracket | Male | Female |
| 5 to 17 Years | 91 (1.1%) | 31 (0.4%) |
| 18 to 34 Years | 93 (0.5%) | 191 (1.1%) |
| 35 to 64 Years | 397 (1.8%) | 355 (1.7%) |
| 65 to 74 Years | 193 (3.3%) | 223 (3.6%) |
| 75 Years and over | 195 (6.0%) | 521 (13.7%) |
Technology Access in Missoula County
Computing Device Access in Missoula County
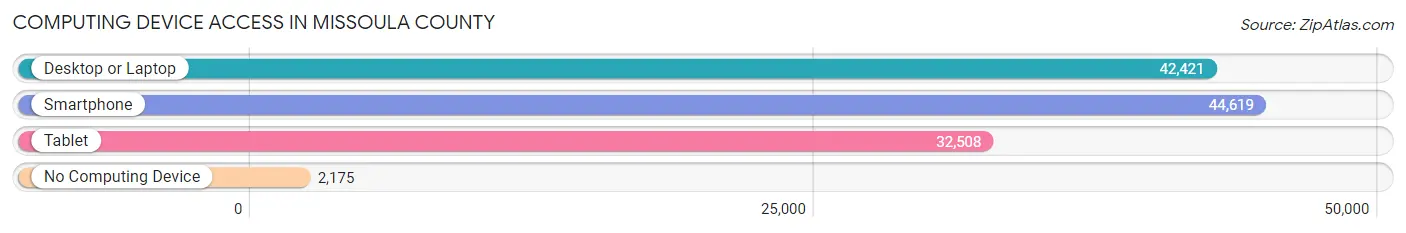
| Device Type | # Households | % Households |
| Desktop or Laptop | 42,421 | 84.1% |
| Smartphone | 44,619 | 88.4% |
| Tablet | 32,508 | 64.4% |
| No Computing Device | 2,175 | 4.3% |
| Total | 50,446 | 100.0% |
Internet Access in Missoula County
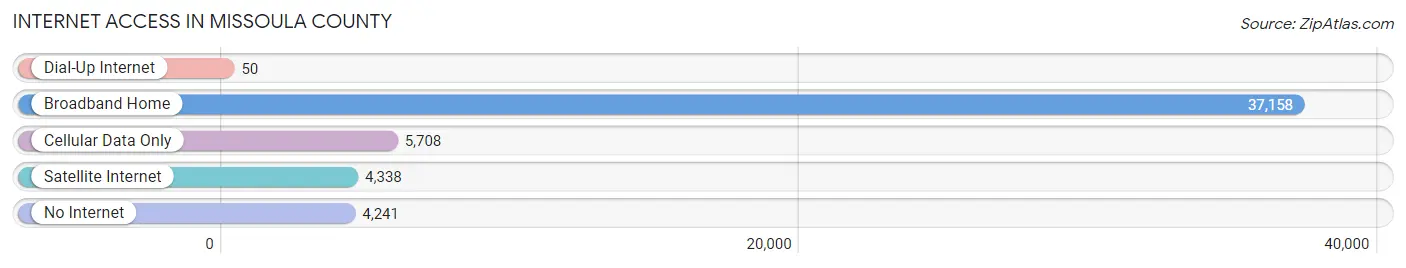
| Internet Type | # Households | % Households |
| Dial-Up Internet | 50 | 0.1% |
| Broadband Home | 37,158 | 73.7% |
| Cellular Data Only | 5,708 | 11.3% |
| Satellite Internet | 4,338 | 8.6% |
| No Internet | 4,241 | 8.4% |
| Total | 50,446 | 100.0% |
Missoula County Summary
Missoula County, Montana is located in the western part of the state and is the second most populous county in the state. It is bordered by Ravalli County to the south, Granite County to the east, Flathead County to the north, and Sanders County to the west. The county seat is Missoula, the largest city in the county.
History
Missoula County was established in 1864, when the Montana Territory was created. The county was named after the Salish word for the Clark Fork River, which runs through the county. The area was originally inhabited by the Salish, Kootenai, and Pend d'Oreille tribes. The first white settlers arrived in the area in the 1860s, and the city of Missoula was founded in 1860.
The county was an important center of commerce and transportation in the early days of Montana. The Northern Pacific Railroad arrived in Missoula in 1883, and the city quickly became a major hub for the timber and mining industries. The University of Montana was founded in Missoula in 1893, and the city has since become a major educational and cultural center in the state.
Geography
Missoula County covers an area of 2,622 square miles, making it the fourth largest county in Montana. The county is located in the western part of the state, and is bordered by Ravalli County to the south, Granite County to the east, Flathead County to the north, and Sanders County to the west. The county is located in the Rocky Mountain Front Range, and is home to several mountain ranges, including the Bitterroot Mountains, the Sapphire Mountains, and the Rattlesnake Mountains. The county is also home to several rivers, including the Clark Fork River, the Bitterroot River, and the Blackfoot River.
The county has a variety of terrain, ranging from the rugged mountains in the west to the rolling hills in the east. The county is home to several lakes, including Flathead Lake, Seeley Lake, and Salmon Lake. The county also has several protected areas, including the Lolo National Forest, the Rattlesnake National Recreation Area, and the Lee Metcalf National Wildlife Refuge.
Economy
Missoula County has a diverse economy, with a variety of industries providing employment opportunities. The county is home to several large employers, including the University of Montana, St. Patrick Hospital, and the Missoula County Public Schools. The county is also home to several major industries, including timber, agriculture, and tourism.
The county is home to several large timber companies, including Weyerhaeuser, Plum Creek, and Stimson Lumber. The county is also home to several agricultural operations, including cattle ranches, wheat farms, and vegetable farms. The county is also a popular tourist destination, with several ski resorts, hiking trails, and other outdoor recreation opportunities.
Demographics
As of the 2010 census, Missoula County had a population of 109,299. The population was spread out, with 24.3% under the age of 18, 11.7% from 18 to 24, 28.2% from 25 to 44, 22.2% from 45 to 64, and 13.6% who were 65 years of age or older. The median age was 34.7 years.
The racial makeup of the county was 90.2% White, 1.2% Native American, 2.3% Asian, 0.3% Black or African American, 0.1% Pacific Islander, 3.2% from other races, and 2.9% from two or more races. Hispanic or Latino of any race were 6.7% of the population.
The median income for a household in the county was $41,945, and the median income for a family was $51,914. The per capita income for the county was $22,945. About 11.2% of families and 16.2% of the population were below the poverty line, including 20.2% of those under age 18 and 8.2% of those age 65 or over.
Common Questions
What is Per Capita Income in Missoula County?
Per Capita income in Missoula County is $40,311.
What is the Median Family Income in Missoula County?
Median Family Income in Missoula County is $89,466.
What is the Median Household income in Missoula County?
Median Household Income in Missoula County is $66,840.
What is Income or Wage Gap in Missoula County?
Income or Wage Gap in Missoula County is 16.1%.
Women in Missoula County earn 83.9 cents for every dollar earned by a man.
What is Family Income Deficit in Missoula County?
Family Income Deficit in Missoula County is $9,310.
Families that are below poverty line in Missoula County earn $9,310 less on average than the poverty threshold level.
What is Inequality or Gini Index in Missoula County?
Inequality or Gini Index in Missoula County is 0.47.
What is the Total Population of Missoula County?
Total Population of Missoula County is 118,541.
What is the Total Male Population of Missoula County?
Total Male Population of Missoula County is 59,633.
What is the Total Female Population of Missoula County?
Total Female Population of Missoula County is 58,908.
What is the Ratio of Males per 100 Females in Missoula County?
There are 101.23 Males per 100 Females in Missoula County.
What is the Ratio of Females per 100 Males in Missoula County?
There are 98.78 Females per 100 Males in Missoula County.
What is the Median Population Age in Missoula County?
Median Population Age in Missoula County is 36.7 Years.
What is the Average Family Size in Missoula County
Average Family Size in Missoula County is 2.9 People.
What is the Average Household Size in Missoula County
Average Household Size in Missoula County is 2.3 People.
How Large is the Labor Force in Missoula County?
There are 69,490 People in the Labor Forcein in Missoula County.
What is the Percentage of People in the Labor Force in Missoula County?
70.0% of People are in the Labor Force in Missoula County.
What is the Unemployment Rate in Missoula County?
Unemployment Rate in Missoula County is 4.5%.