Madison County, MT Map & Demographics
Madison County Overview
$40,358
PER CAPITA INCOME
$72,652
AVG FAMILY INCOME
$61,226
AVG HOUSEHOLD INCOME
39.7%
WAGE / INCOME GAP [ % ]
60.3¢/ $1
WAGE / INCOME GAP [ $ ]
0.42
INEQUALITY / GINI INDEX
8,742
TOTAL POPULATION
4,593
MALE POPULATION
4,149
FEMALE POPULATION
110.70
MALES / 100 FEMALES
90.33
FEMALES / 100 MALES
54.3
MEDIAN AGE
3.0
AVG FAMILY SIZE
2.4
AVG HOUSEHOLD SIZE
4,172
LABOR FORCE [ PEOPLE ]
54.8%
PERCENT IN LABOR FORCE
2.3%
UNEMPLOYMENT RATE
Madison County Area Codes
Income in Madison County
Income Overview in Madison County
Per Capita Income in Madison County is $40,358, while median incomes of families and households are $72,652 and $61,226 respectively.
| Characteristic | Number | Measure |
| Per Capita Income | 8,742 | $40,358 |
| Median Family Income | 2,185 | $72,652 |
| Mean Family Income | 2,185 | $92,380 |
| Median Household Income | 3,559 | $61,226 |
| Mean Household Income | 3,559 | $80,200 |
| Income Deficit | 2,185 | $0 |
| Wage / Income Gap (%) | 8,742 | 39.71% |
| Wage / Income Gap ($) | 8,742 | 60.29¢ per $1 |
| Gini / Inequality Index | 8,742 | 0.42 |
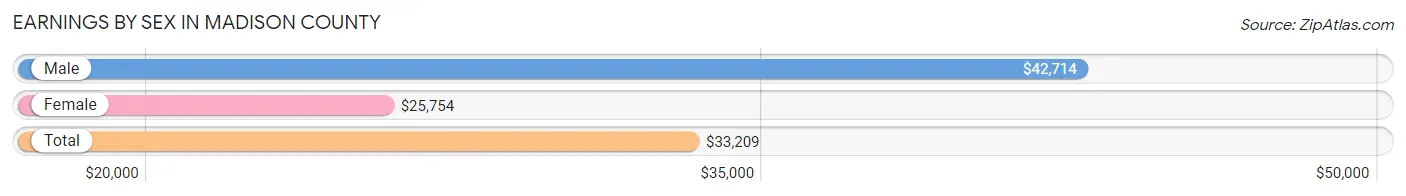
Earnings by Sex in Madison County
Average Earnings in Madison County are $33,209, $42,714 for men and $25,754 for women, a difference of 39.7%.
| Sex | Number | Average Earnings |
| Male | 2,466 (54.4%) | $42,714 |
| Female | 2,070 (45.6%) | $25,754 |
| Total | 4,536 (100.0%) | $33,209 |
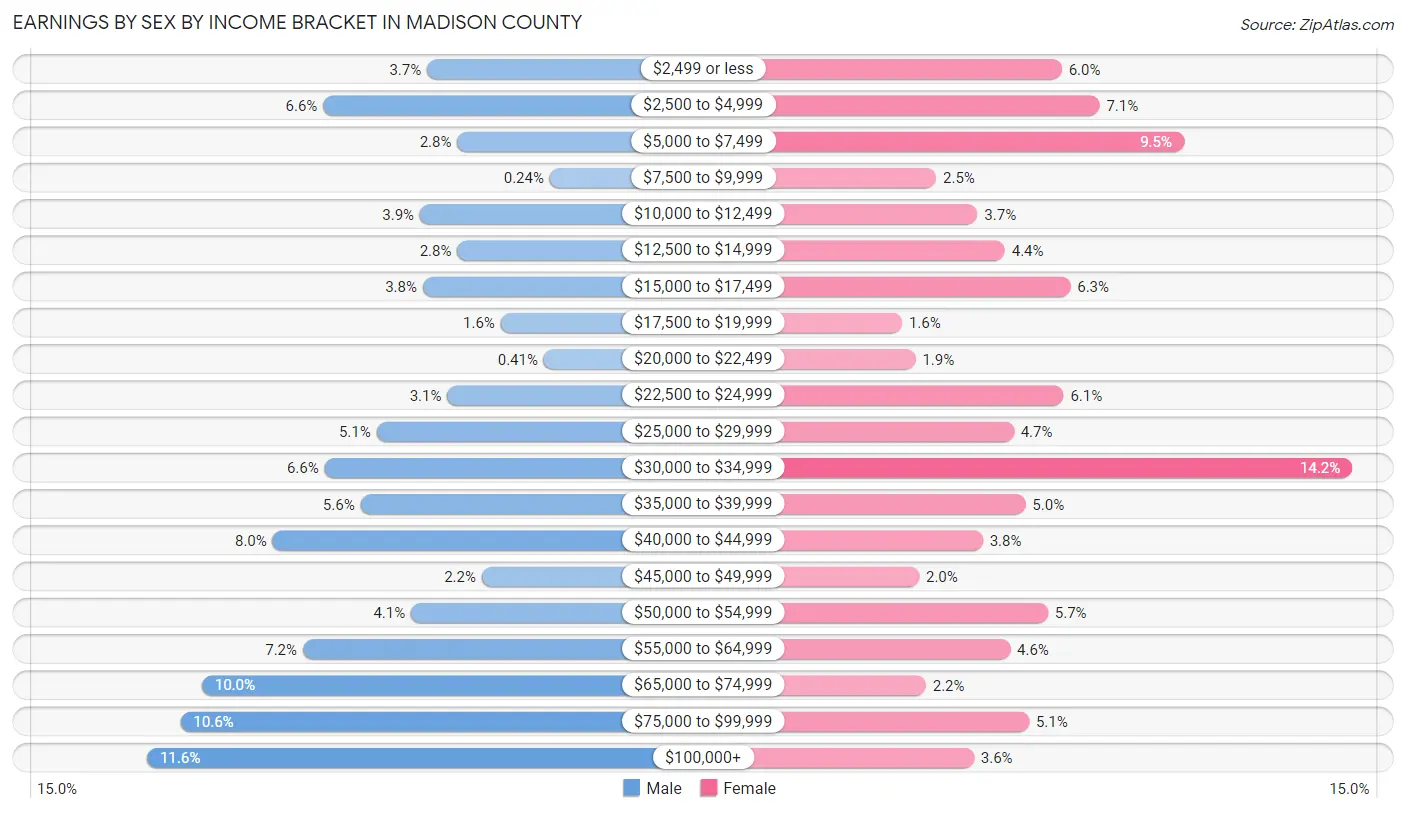
Earnings by Sex by Income Bracket in Madison County
The most common earnings brackets in Madison County are $100,000+ for men (285 | 11.6%) and $30,000 to $34,999 for women (294 | 14.2%).
| Income | Male | Female |
| $2,499 or less | 91 (3.7%) | 125 (6.0%) |
| $2,500 to $4,999 | 163 (6.6%) | 147 (7.1%) |
| $5,000 to $7,499 | 70 (2.8%) | 196 (9.5%) |
| $7,500 to $9,999 | 6 (0.2%) | 52 (2.5%) |
| $10,000 to $12,499 | 96 (3.9%) | 76 (3.7%) |
| $12,500 to $14,999 | 70 (2.8%) | 92 (4.4%) |
| $15,000 to $17,499 | 94 (3.8%) | 130 (6.3%) |
| $17,500 to $19,999 | 40 (1.6%) | 32 (1.5%) |
| $20,000 to $22,499 | 10 (0.4%) | 40 (1.9%) |
| $22,500 to $24,999 | 77 (3.1%) | 126 (6.1%) |
| $25,000 to $29,999 | 126 (5.1%) | 97 (4.7%) |
| $30,000 to $34,999 | 162 (6.6%) | 294 (14.2%) |
| $35,000 to $39,999 | 137 (5.6%) | 104 (5.0%) |
| $40,000 to $44,999 | 198 (8.0%) | 79 (3.8%) |
| $45,000 to $49,999 | 53 (2.1%) | 42 (2.0%) |
| $50,000 to $54,999 | 102 (4.1%) | 117 (5.7%) |
| $55,000 to $64,999 | 177 (7.2%) | 95 (4.6%) |
| $65,000 to $74,999 | 247 (10.0%) | 46 (2.2%) |
| $75,000 to $99,999 | 262 (10.6%) | 106 (5.1%) |
| $100,000+ | 285 (11.6%) | 74 (3.6%) |
| Total | 2,466 (100.0%) | 2,070 (100.0%) |
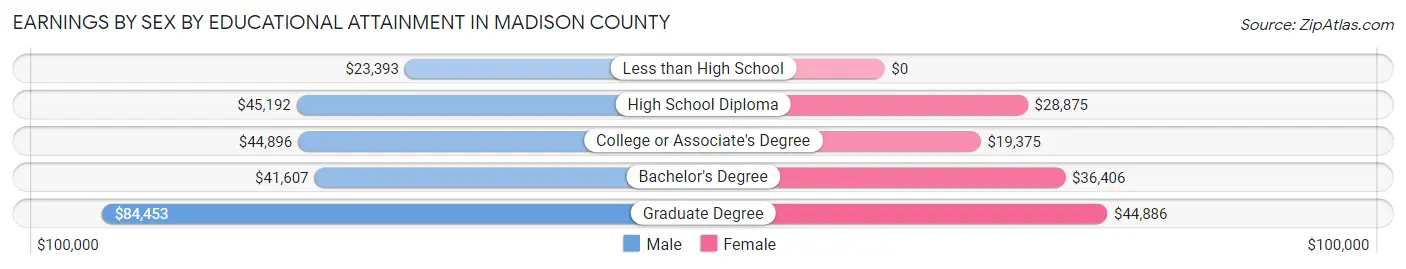
Earnings by Sex by Educational Attainment in Madison County
Average earnings in Madison County are $44,561 for men and $30,089 for women, a difference of 32.5%. Men with an educational attainment of graduate degree enjoy the highest average annual earnings of $84,453, while those with less than high school education earn the least with $23,393. Women with an educational attainment of graduate degree earn the most with the average annual earnings of $44,886, while those with college or associate's degree education have the smallest earnings of $19,375.
| Educational Attainment | Male Income | Female Income |
| Less than High School | $23,393 | $0 |
| High School Diploma | $45,192 | $28,875 |
| College or Associate's Degree | $44,896 | $19,375 |
| Bachelor's Degree | $41,607 | $36,406 |
| Graduate Degree | $84,453 | $44,886 |
| Total | $44,561 | $30,089 |
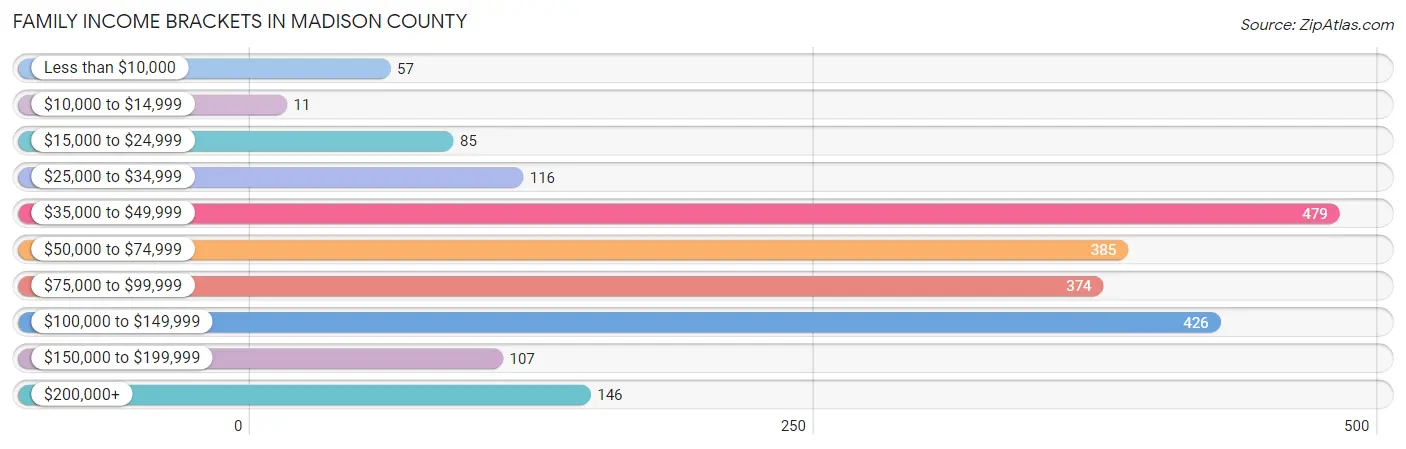
Family Income in Madison County
Family Income Brackets in Madison County
According to the Madison County family income data, there are 479 families falling into the $35,000 to $49,999 income range, which is the most common income bracket and makes up 21.9% of all families. Conversely, the $10,000 to $14,999 income bracket is the least frequent group with only 11 families (0.5%) belonging to this category.
| Income Bracket | # Families | % Families |
| Less than $10,000 | 57 | 2.6% |
| $10,000 to $14,999 | 11 | 0.5% |
| $15,000 to $24,999 | 85 | 3.9% |
| $25,000 to $34,999 | 116 | 5.3% |
| $35,000 to $49,999 | 479 | 21.9% |
| $50,000 to $74,999 | 385 | 17.6% |
| $75,000 to $99,999 | 374 | 17.1% |
| $100,000 to $149,999 | 426 | 19.5% |
| $150,000 to $199,999 | 107 | 4.9% |
| $200,000+ | 146 | 6.7% |
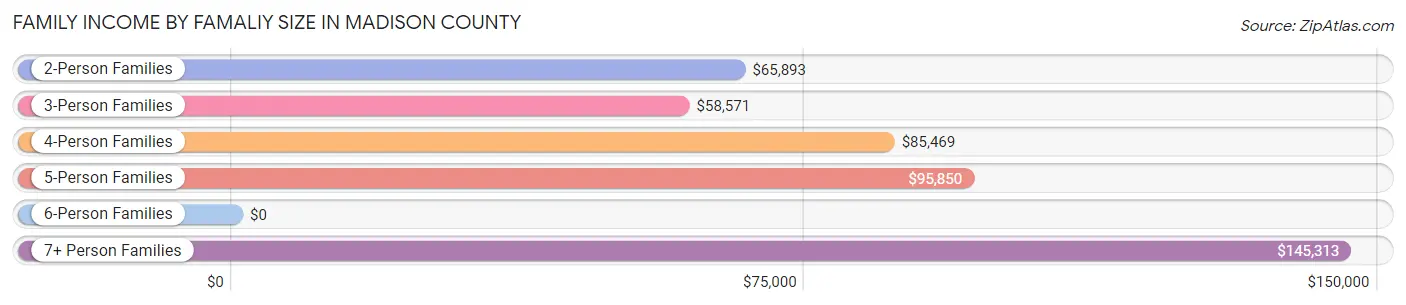
Family Income by Famaliy Size in Madison County
7+ person families (19 | 0.9%) account for the highest median family income in Madison County with $145,313 per family, while 2-person families (1,560 | 71.4%) have the highest median income of $32,946 per family member.
| Income Bracket | # Families | Median Income |
| 2-Person Families | 1,560 (71.4%) | $65,893 |
| 3-Person Families | 194 (8.9%) | $58,571 |
| 4-Person Families | 243 (11.1%) | $85,469 |
| 5-Person Families | 127 (5.8%) | $95,850 |
| 6-Person Families | 42 (1.9%) | $0 |
| 7+ Person Families | 19 (0.9%) | $145,313 |
| Total | 2,185 (100.0%) | $72,652 |
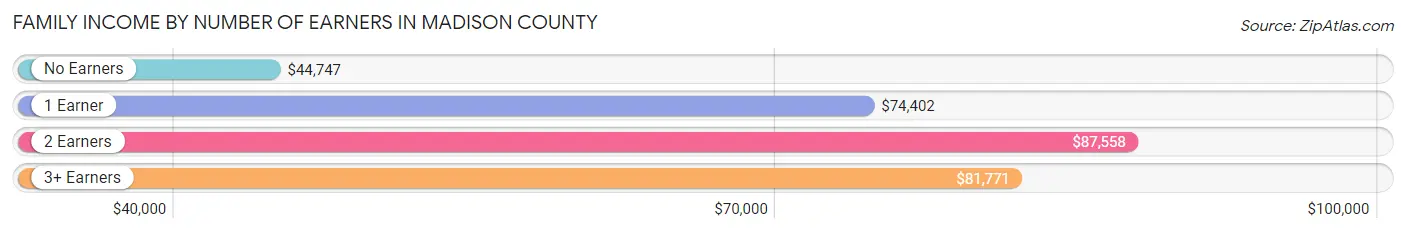
Family Income by Number of Earners in Madison County
The median family income in Madison County is $72,652, with families comprising 2 earners (938) having the highest median family income of $87,558, while families with no earners (652) have the lowest median family income of $44,747, accounting for 42.9% and 29.8% of families, respectively.
| Number of Earners | # Families | Median Income |
| No Earners | 652 (29.8%) | $44,747 |
| 1 Earner | 465 (21.3%) | $74,402 |
| 2 Earners | 938 (42.9%) | $87,558 |
| 3+ Earners | 130 (5.9%) | $81,771 |
| Total | 2,185 (100.0%) | $72,652 |
Household Income in Madison County
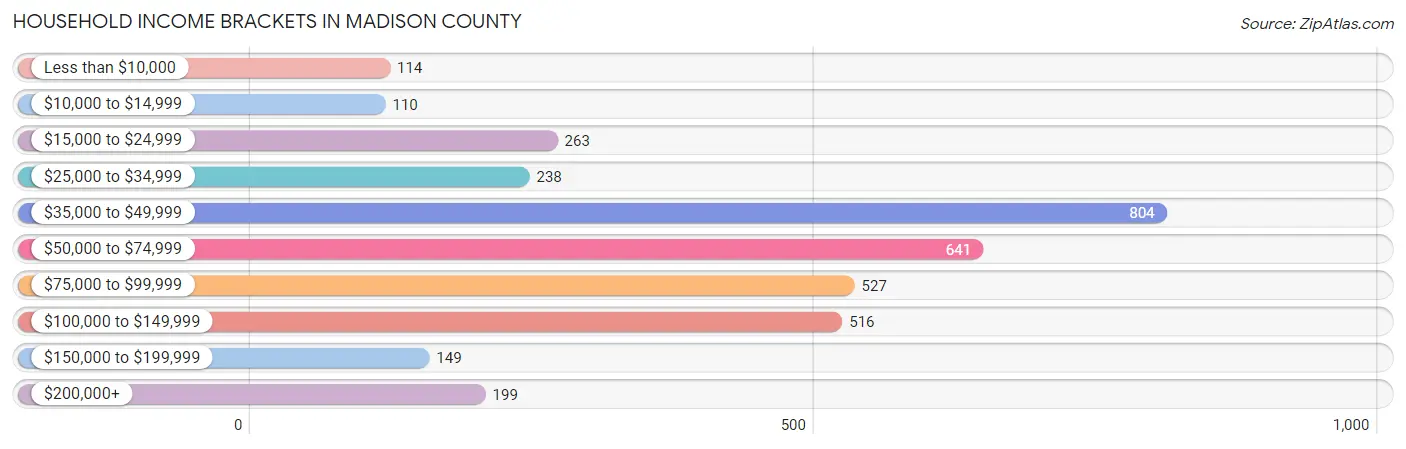
Household Income Brackets in Madison County
With 804 households falling in the category, the $35,000 to $49,999 income range is the most frequent in Madison County, accounting for 22.6% of all households. In contrast, only 110 households (3.1%) fall into the $10,000 to $14,999 income bracket, making it the least populous group.
| Income Bracket | # Households | % Households |
| Less than $10,000 | 114 | 3.2% |
| $10,000 to $14,999 | 110 | 3.1% |
| $15,000 to $24,999 | 263 | 7.4% |
| $25,000 to $34,999 | 238 | 6.7% |
| $35,000 to $49,999 | 804 | 22.6% |
| $50,000 to $74,999 | 641 | 18.0% |
| $75,000 to $99,999 | 527 | 14.8% |
| $100,000 to $149,999 | 516 | 14.5% |
| $150,000 to $199,999 | 149 | 4.2% |
| $200,000+ | 199 | 5.6% |
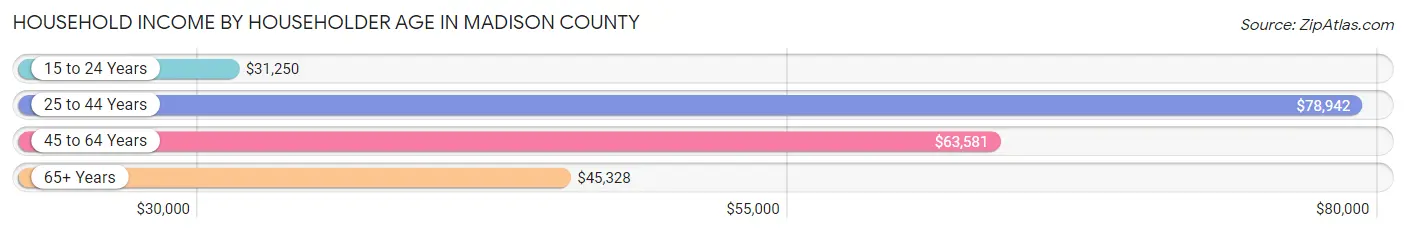
Household Income by Householder Age in Madison County
The median household income in Madison County is $61,226, with the highest median household income of $78,942 found in the 25 to 44 years age bracket for the primary householder. A total of 828 households (23.3%) fall into this category. Meanwhile, the 15 to 24 years age bracket for the primary householder has the lowest median household income of $31,250, with 13 households (0.4%) in this group.
| Income Bracket | # Households | Median Income |
| 15 to 24 Years | 13 (0.4%) | $31,250 |
| 25 to 44 Years | 828 (23.3%) | $78,942 |
| 45 to 64 Years | 1,134 (31.9%) | $63,581 |
| 65+ Years | 1,584 (44.5%) | $45,328 |
| Total | 3,559 (100.0%) | $61,226 |
Poverty in Madison County
Income Below Poverty by Sex and Age in Madison County
With 6.3% poverty level for males and 7.4% for females among the residents of Madison County, 25 to 34 year old males and 12 to 14 year old females are the most vulnerable to poverty, with 53 males (12.7%) and 26 females (40.6%) in their respective age groups living below the poverty level.
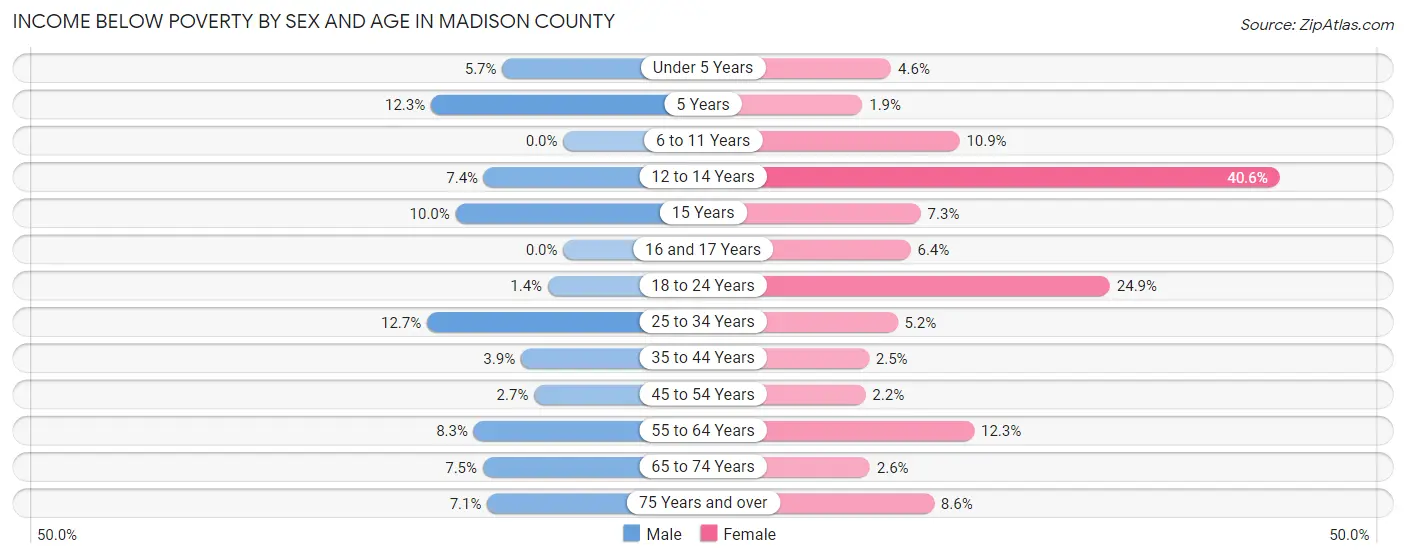
| Age Bracket | Male | Female |
| Under 5 Years | 9 (5.7%) | 7 (4.6%) |
| 5 Years | 7 (12.3%) | 2 (1.9%) |
| 6 to 11 Years | 0 (0.0%) | 19 (10.9%) |
| 12 to 14 Years | 7 (7.4%) | 26 (40.6%) |
| 15 Years | 3 (10.0%) | 3 (7.3%) |
| 16 and 17 Years | 0 (0.0%) | 6 (6.4%) |
| 18 to 24 Years | 4 (1.4%) | 51 (24.9%) |
| 25 to 34 Years | 53 (12.7%) | 26 (5.2%) |
| 35 to 44 Years | 19 (3.9%) | 11 (2.5%) |
| 45 to 54 Years | 13 (2.7%) | 9 (2.2%) |
| 55 to 64 Years | 70 (8.3%) | 87 (12.3%) |
| 65 to 74 Years | 71 (7.5%) | 20 (2.6%) |
| 75 Years and over | 32 (7.1%) | 37 (8.6%) |
| Total | 288 (6.3%) | 304 (7.4%) |
Income Above Poverty by Sex and Age in Madison County
According to the poverty statistics in Madison County, males aged 6 to 11 years and females aged 5 years are the age groups that are most secure financially, with 100.0% of males and 98.1% of females in these age groups living above the poverty line.
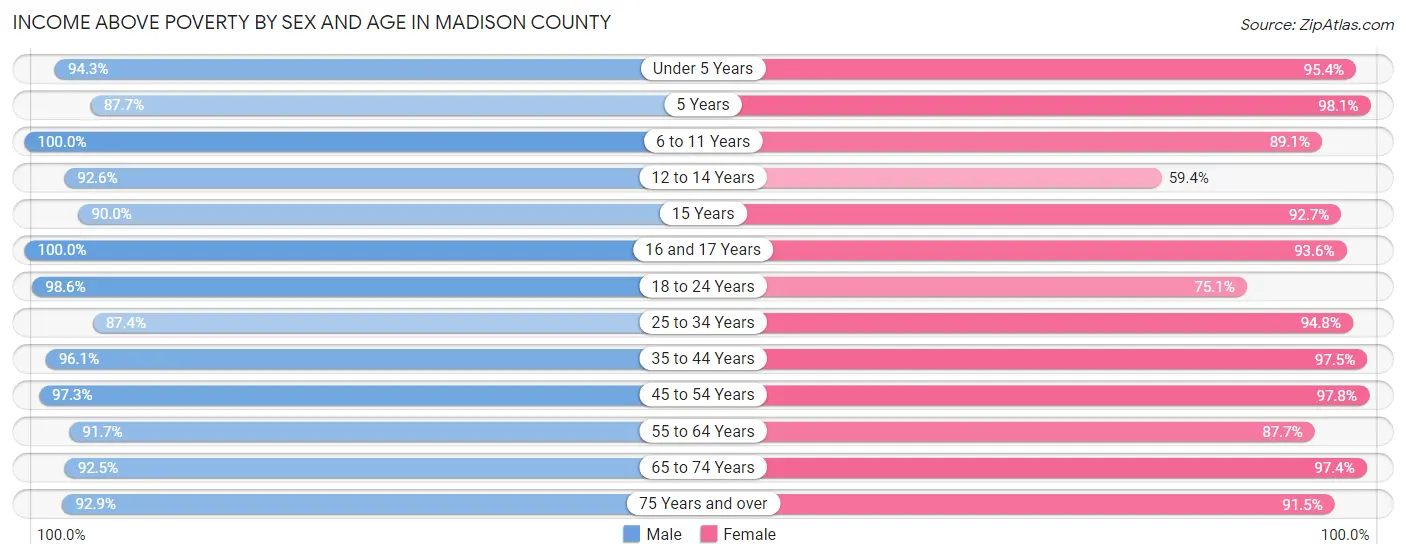
| Age Bracket | Male | Female |
| Under 5 Years | 150 (94.3%) | 146 (95.4%) |
| 5 Years | 50 (87.7%) | 103 (98.1%) |
| 6 to 11 Years | 220 (100.0%) | 155 (89.1%) |
| 12 to 14 Years | 88 (92.6%) | 38 (59.4%) |
| 15 Years | 27 (90.0%) | 38 (92.7%) |
| 16 and 17 Years | 84 (100.0%) | 88 (93.6%) |
| 18 to 24 Years | 275 (98.6%) | 154 (75.1%) |
| 25 to 34 Years | 366 (87.4%) | 477 (94.8%) |
| 35 to 44 Years | 465 (96.1%) | 428 (97.5%) |
| 45 to 54 Years | 469 (97.3%) | 402 (97.8%) |
| 55 to 64 Years | 772 (91.7%) | 622 (87.7%) |
| 65 to 74 Years | 879 (92.5%) | 748 (97.4%) |
| 75 Years and over | 421 (92.9%) | 396 (91.4%) |
| Total | 4,266 (93.7%) | 3,795 (92.6%) |
Income Below Poverty Among Married-Couple Families in Madison County
The poverty statistics for married-couple families in Madison County show that 4.2% or 87 of the total 2,067 families live below the poverty line. Families with 3 or 4 children have the highest poverty rate of 11.9%, comprising of 19 families. On the other hand, families with 5 or more children have the lowest poverty rate of 0.0%, which includes 0 families.
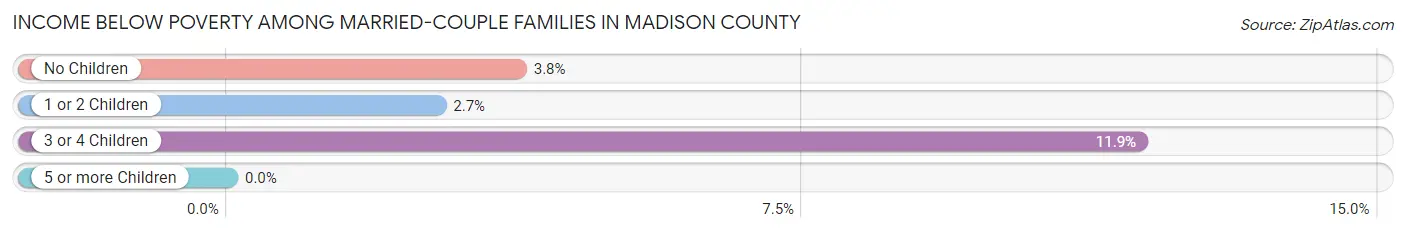
| Children | Above Poverty | Below Poverty |
| No Children | 1,506 (96.2%) | 59 (3.8%) |
| 1 or 2 Children | 322 (97.3%) | 9 (2.7%) |
| 3 or 4 Children | 141 (88.1%) | 19 (11.9%) |
| 5 or more Children | 11 (100.0%) | 0 (0.0%) |
| Total | 1,980 (95.8%) | 87 (4.2%) |
Income Below Poverty Among Single-Parent Households in Madison County
According to the poverty data in Madison County, 23.0% or 14 single-father households and 14.0% or 8 single-mother households are living below the poverty line. Among single-father households, those with 1 or 2 children have the highest poverty rate, with 9 households (50.0%) experiencing poverty. Likewise, among single-mother households, those with 3 or 4 children have the highest poverty rate, with 8 households (100.0%) falling below the poverty line.
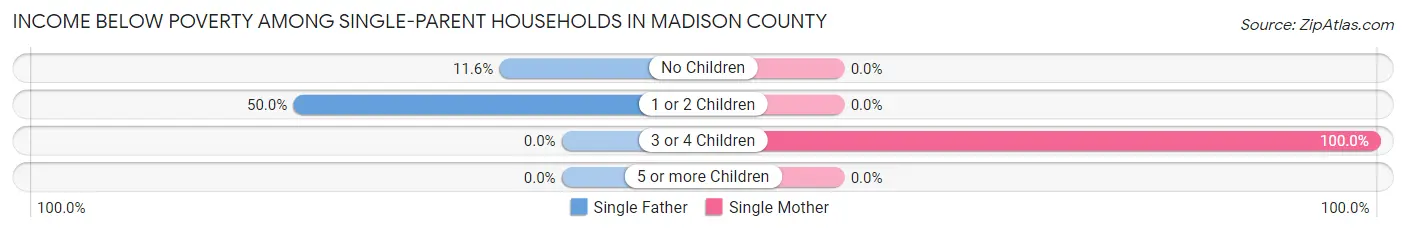
| Children | Single Father | Single Mother |
| No Children | 5 (11.6%) | 0 (0.0%) |
| 1 or 2 Children | 9 (50.0%) | 0 (0.0%) |
| 3 or 4 Children | 0 (0.0%) | 8 (100.0%) |
| 5 or more Children | 0 (0.0%) | 0 (0.0%) |
| Total | 14 (23.0%) | 8 (14.0%) |
Income Below Poverty Among Married-Couple vs Single-Parent Households in Madison County
The poverty data for Madison County shows that 87 of the married-couple family households (4.2%) and 22 of the single-parent households (18.6%) are living below the poverty level. Within the married-couple family households, those with 3 or 4 children have the highest poverty rate, with 19 households (11.9%) falling below the poverty line. Among the single-parent households, those with 3 or 4 children have the highest poverty rate, with 8 household (100.0%) living below poverty.
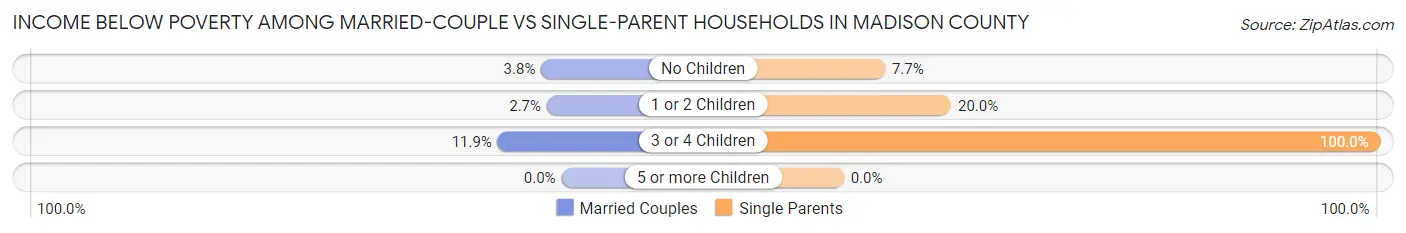
| Children | Married-Couple Families | Single-Parent Households |
| No Children | 59 (3.8%) | 5 (7.7%) |
| 1 or 2 Children | 9 (2.7%) | 9 (20.0%) |
| 3 or 4 Children | 19 (11.9%) | 8 (100.0%) |
| 5 or more Children | 0 (0.0%) | 0 (0.0%) |
| Total | 87 (4.2%) | 22 (18.6%) |
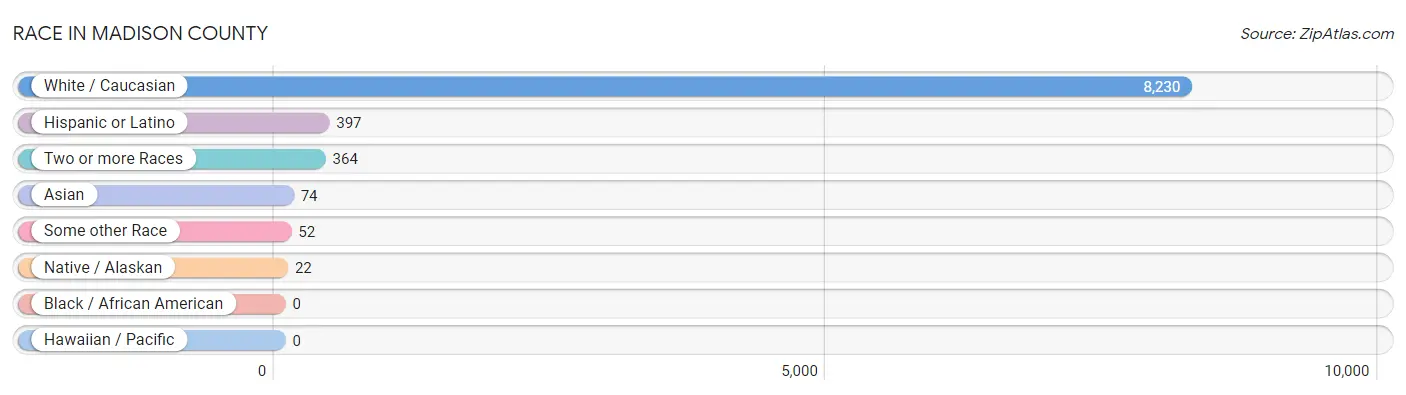
Race in Madison County
The most populous races in Madison County are White / Caucasian (8,230 | 94.1%), Hispanic or Latino (397 | 4.5%), and Two or more Races (364 | 4.2%).
| Race | # Population | % Population |
| Asian | 74 | 0.9% |
| Black / African American | 0 | 0.0% |
| Hawaiian / Pacific | 0 | 0.0% |
| Hispanic or Latino | 397 | 4.5% |
| Native / Alaskan | 22 | 0.3% |
| White / Caucasian | 8,230 | 94.1% |
| Two or more Races | 364 | 4.2% |
| Some other Race | 52 | 0.6% |
| Total | 8,742 | 100.0% |
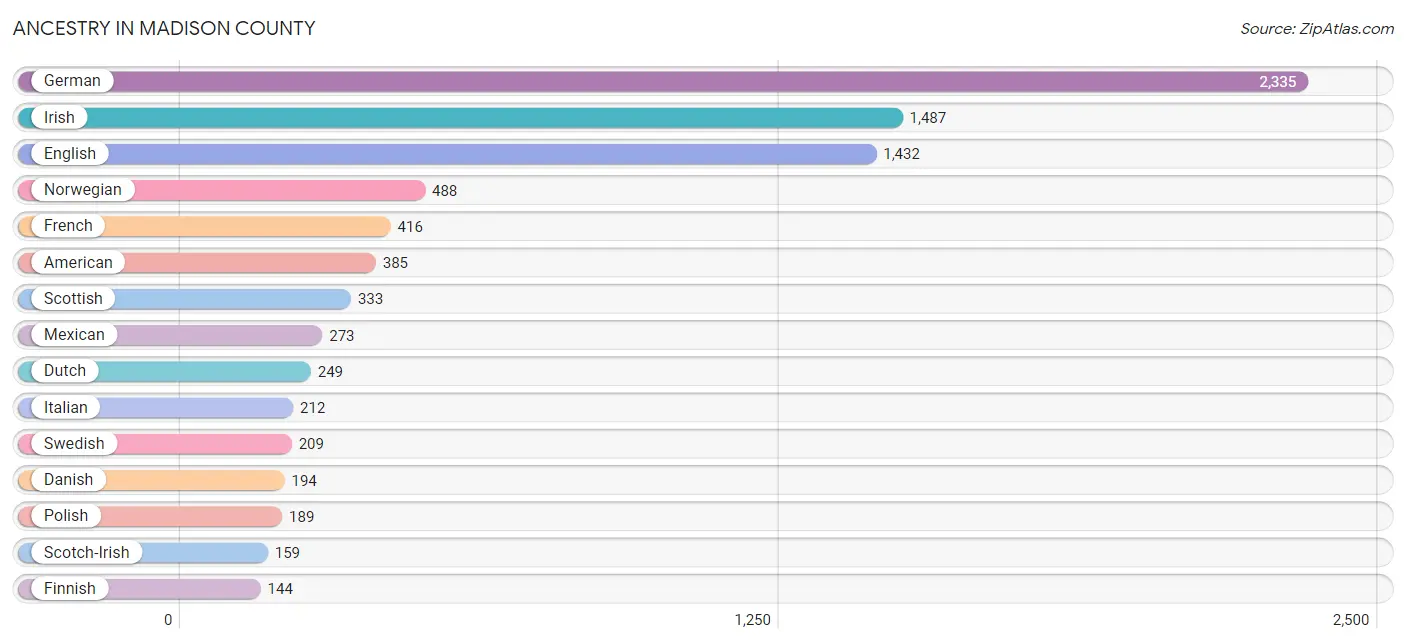
Ancestry in Madison County
The most populous ancestries reported in Madison County are German (2,335 | 26.7%), Irish (1,487 | 17.0%), English (1,432 | 16.4%), Norwegian (488 | 5.6%), and French (416 | 4.8%), together accounting for 70.4% of all Madison County residents.
| Ancestry | # Population | % Population |
| Alaska Native | 4 | 0.1% |
| Alaskan Athabascan | 2 | 0.0% |
| American | 385 | 4.4% |
| Arab | 10 | 0.1% |
| Armenian | 10 | 0.1% |
| Austrian | 73 | 0.8% |
| Basque | 41 | 0.5% |
| Belgian | 1 | 0.0% |
| Bhutanese | 67 | 0.8% |
| Blackfeet | 24 | 0.3% |
| British | 59 | 0.7% |
| Celtic | 6 | 0.1% |
| Central American | 26 | 0.3% |
| Central American Indian | 4 | 0.1% |
| Cherokee | 82 | 0.9% |
| Cheyenne | 3 | 0.0% |
| Chippewa | 6 | 0.1% |
| Croatian | 3 | 0.0% |
| Czech | 12 | 0.1% |
| Czechoslovakian | 12 | 0.1% |
| Danish | 194 | 2.2% |
| Dutch | 249 | 2.9% |
| Eastern European | 116 | 1.3% |
| English | 1,432 | 16.4% |
| European | 115 | 1.3% |
| Finnish | 144 | 1.7% |
| French | 416 | 4.8% |
| French Canadian | 32 | 0.4% |
| German | 2,335 | 26.7% |
| Greek | 20 | 0.2% |
| Hopi | 4 | 0.1% |
| Hungarian | 23 | 0.3% |
| Indian (Asian) | 4 | 0.1% |
| Irish | 1,487 | 17.0% |
| Iroquois | 2 | 0.0% |
| Italian | 212 | 2.4% |
| Korean | 5 | 0.1% |
| Laotian | 17 | 0.2% |
| Lebanese | 3 | 0.0% |
| Lithuanian | 77 | 0.9% |
| Mexican | 273 | 3.1% |
| Northern European | 40 | 0.5% |
| Norwegian | 488 | 5.6% |
| Panamanian | 26 | 0.3% |
| Peruvian | 57 | 0.6% |
| Polish | 189 | 2.2% |
| Portuguese | 99 | 1.1% |
| Romanian | 3 | 0.0% |
| Russian | 6 | 0.1% |
| Samoan | 3 | 0.0% |
| Scandinavian | 60 | 0.7% |
| Scotch-Irish | 159 | 1.8% |
| Scottish | 333 | 3.8% |
| Serbian | 40 | 0.5% |
| Slovak | 12 | 0.1% |
| South African | 2 | 0.0% |
| South American | 57 | 0.6% |
| Spaniard | 41 | 0.5% |
| Subsaharan African | 5 | 0.1% |
| Swedish | 209 | 2.4% |
| Swiss | 23 | 0.3% |
| Ukrainian | 37 | 0.4% |
| Welsh | 83 | 0.9% |
| Yugoslavian | 36 | 0.4% | View All 64 Rows |
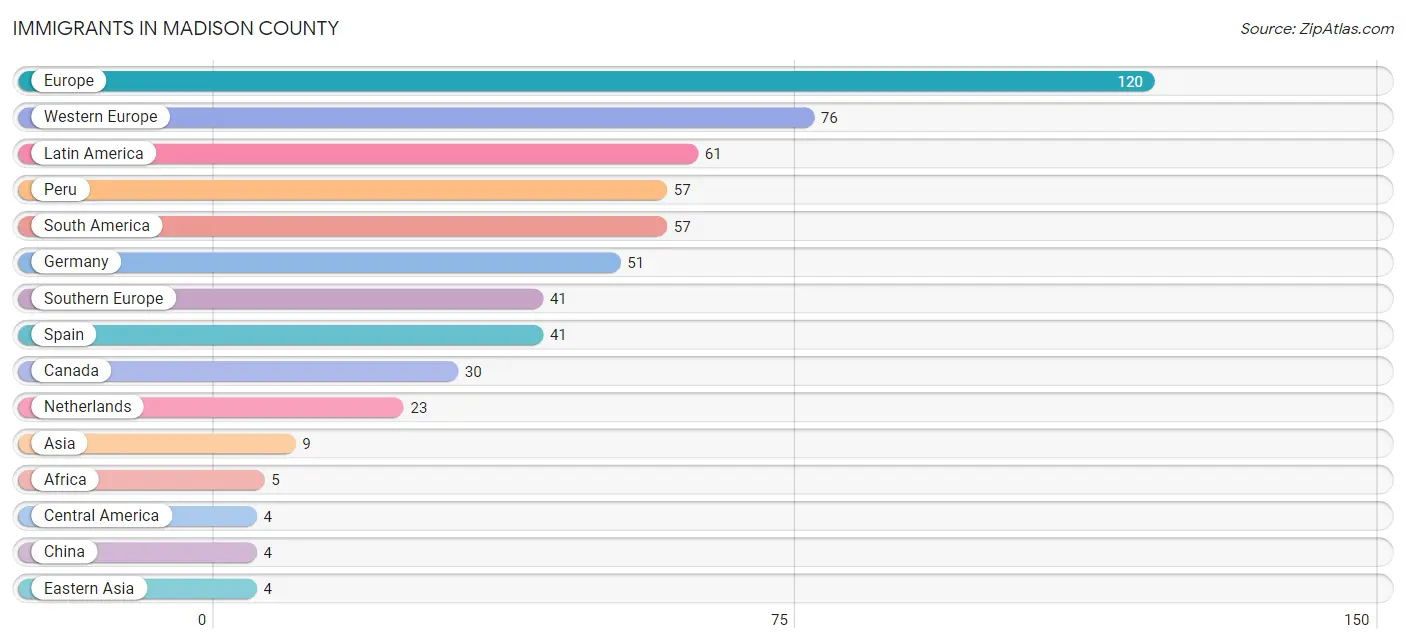
Immigrants in Madison County
The most numerous immigrant groups reported in Madison County came from Europe (120 | 1.4%), Western Europe (76 | 0.9%), Latin America (61 | 0.7%), Peru (57 | 0.6%), and South America (57 | 0.6%), together accounting for 4.2% of all Madison County residents.
| Immigration Origin | # Population | % Population |
| Africa | 5 | 0.1% |
| Asia | 9 | 0.1% |
| Austria | 2 | 0.0% |
| Canada | 30 | 0.3% |
| Central America | 4 | 0.1% |
| China | 4 | 0.1% |
| Eastern Africa | 3 | 0.0% |
| Eastern Asia | 4 | 0.1% |
| Europe | 120 | 1.4% |
| Germany | 51 | 0.6% |
| Guatemala | 4 | 0.1% |
| Hong Kong | 4 | 0.1% |
| Kazakhstan | 2 | 0.0% |
| Latin America | 61 | 0.7% |
| Netherlands | 23 | 0.3% |
| Northern Europe | 3 | 0.0% |
| Peru | 57 | 0.6% |
| Philippines | 3 | 0.0% |
| Scotland | 3 | 0.0% |
| South Africa | 2 | 0.0% |
| South America | 57 | 0.6% |
| South Central Asia | 2 | 0.0% |
| South Eastern Asia | 3 | 0.0% |
| Southern Europe | 41 | 0.5% |
| Spain | 41 | 0.5% |
| Western Europe | 76 | 0.9% | View All 26 Rows |
Sex and Age in Madison County
Sex and Age in Madison County
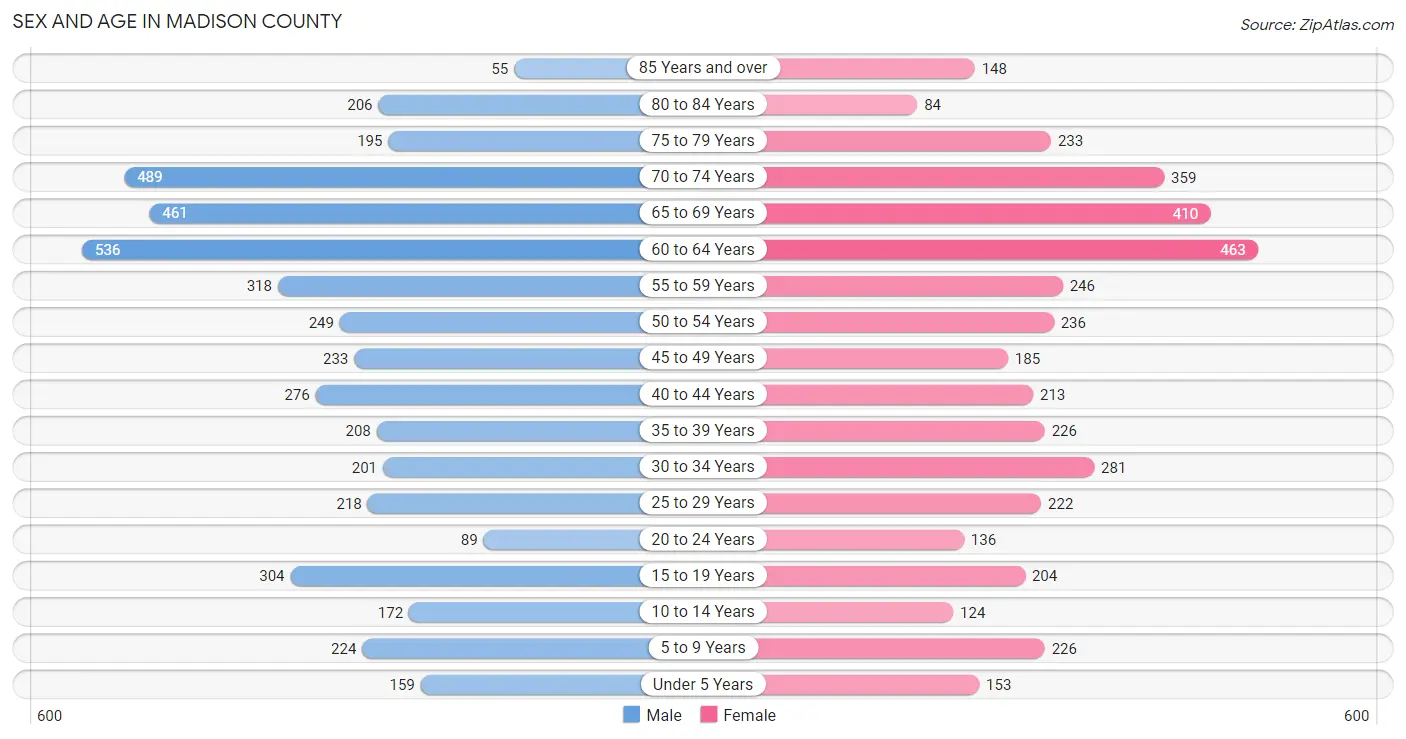
The most populous age groups in Madison County are 60 to 64 Years (536 | 11.7%) for men and 60 to 64 Years (463 | 11.2%) for women.
| Age Bracket | Male | Female |
| Under 5 Years | 159 (3.5%) | 153 (3.7%) |
| 5 to 9 Years | 224 (4.9%) | 226 (5.4%) |
| 10 to 14 Years | 172 (3.7%) | 124 (3.0%) |
| 15 to 19 Years | 304 (6.6%) | 204 (4.9%) |
| 20 to 24 Years | 89 (1.9%) | 136 (3.3%) |
| 25 to 29 Years | 218 (4.8%) | 222 (5.3%) |
| 30 to 34 Years | 201 (4.4%) | 281 (6.8%) |
| 35 to 39 Years | 208 (4.5%) | 226 (5.4%) |
| 40 to 44 Years | 276 (6.0%) | 213 (5.1%) |
| 45 to 49 Years | 233 (5.1%) | 185 (4.5%) |
| 50 to 54 Years | 249 (5.4%) | 236 (5.7%) |
| 55 to 59 Years | 318 (6.9%) | 246 (5.9%) |
| 60 to 64 Years | 536 (11.7%) | 463 (11.2%) |
| 65 to 69 Years | 461 (10.0%) | 410 (9.9%) |
| 70 to 74 Years | 489 (10.6%) | 359 (8.6%) |
| 75 to 79 Years | 195 (4.3%) | 233 (5.6%) |
| 80 to 84 Years | 206 (4.5%) | 84 (2.0%) |
| 85 Years and over | 55 (1.2%) | 148 (3.6%) |
| Total | 4,593 (100.0%) | 4,149 (100.0%) |
Families and Households in Madison County
Median Family Size in Madison County
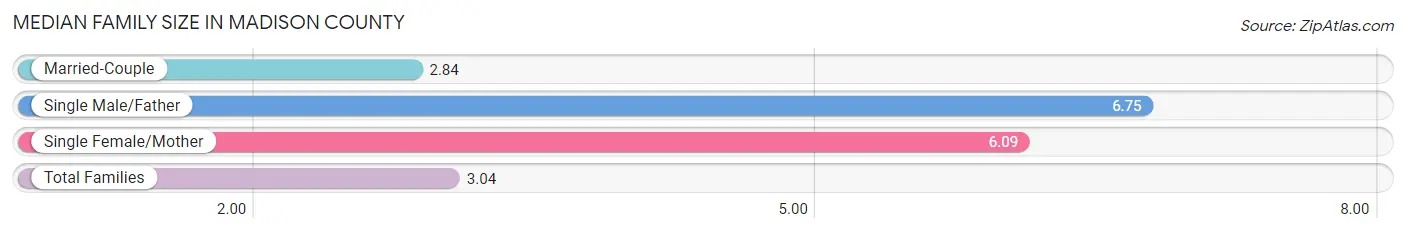
The median family size in Madison County is 3.04 persons per family, with single male/father families (61 | 2.8%) accounting for the largest median family size of 6.75 persons per family. On the other hand, married-couple families (2,067 | 94.6%) represent the smallest median family size with 2.84 persons per family.
| Family Type | # Families | Family Size |
| Married-Couple | 2,067 (94.6%) | 2.84 |
| Single Male/Father | 61 (2.8%) | 6.75 |
| Single Female/Mother | 57 (2.6%) | 6.09 |
| Total Families | 2,185 (100.0%) | 3.04 |
Median Household Size in Madison County
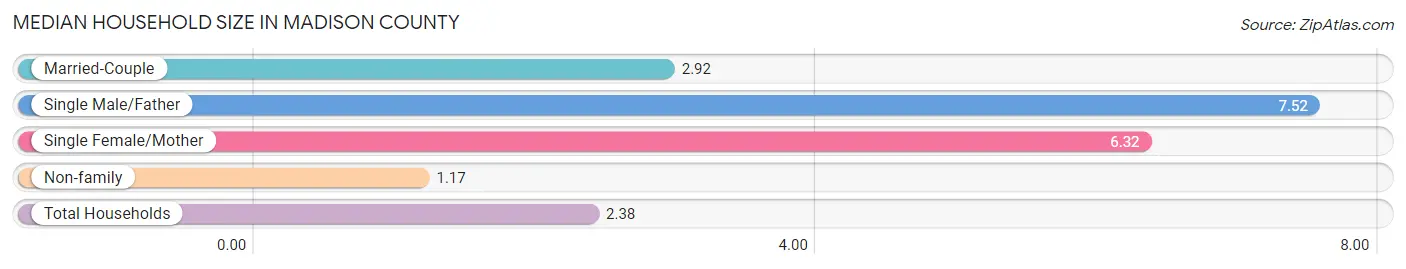
The median household size in Madison County is 2.38 persons per household, with single male/father households (61 | 1.7%) accounting for the largest median household size of 7.52 persons per household. non-family households (1,374 | 38.6%) represent the smallest median household size with 1.17 persons per household.
| Household Type | # Households | Household Size |
| Married-Couple | 2,067 (58.1%) | 2.92 |
| Single Male/Father | 61 (1.7%) | 7.52 |
| Single Female/Mother | 57 (1.6%) | 6.32 |
| Non-family | 1,374 (38.6%) | 1.17 |
| Total Households | 3,559 (100.0%) | 2.38 |
Household Size by Marriage Status in Madison County
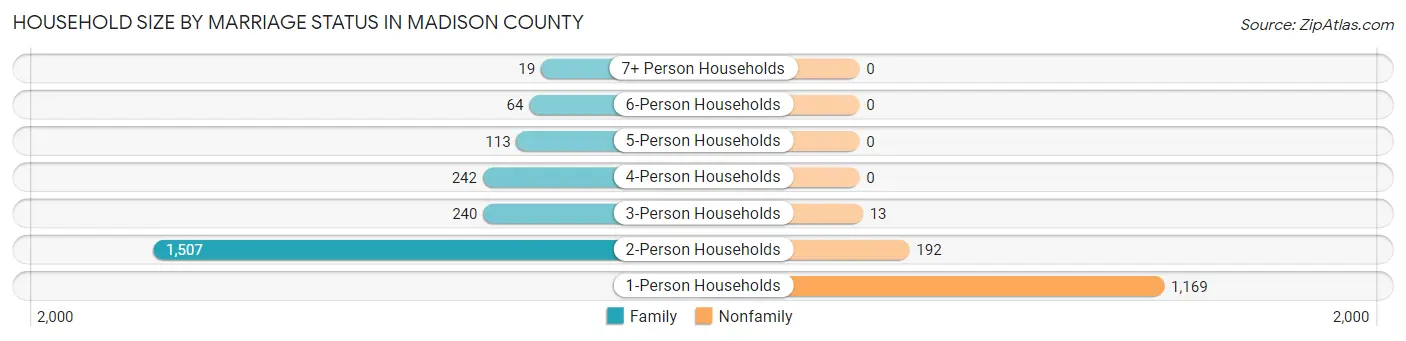
Out of a total of 3,559 households in Madison County, 2,185 (61.4%) are family households, while 1,374 (38.6%) are nonfamily households. The most numerous type of family households are 2-person households, comprising 1,507, and the most common type of nonfamily households are 1-person households, comprising 1,169.
| Household Size | Family Households | Nonfamily Households |
| 1-Person Households | - | 1,169 (32.9%) |
| 2-Person Households | 1,507 (42.3%) | 192 (5.4%) |
| 3-Person Households | 240 (6.7%) | 13 (0.4%) |
| 4-Person Households | 242 (6.8%) | 0 (0.0%) |
| 5-Person Households | 113 (3.2%) | 0 (0.0%) |
| 6-Person Households | 64 (1.8%) | 0 (0.0%) |
| 7+ Person Households | 19 (0.5%) | 0 (0.0%) |
| Total | 2,185 (61.4%) | 1,374 (38.6%) |
Female Fertility in Madison County
Fertility by Age in Madison County
Average fertility rate in Madison County is 63.0 births per 1,000 women. Women in the age bracket of 35 to 50 years have the highest fertility rate with 107.0 births per 1,000 women. Women in the age bracket of 35 to 50 years acount for 73.7% of all women with births.
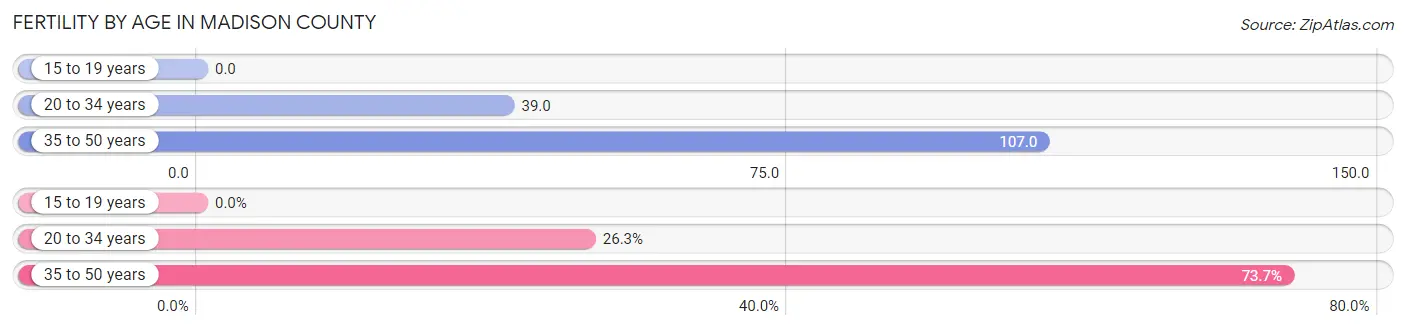
| Age Bracket | Women with Births | Births / 1,000 Women |
| 15 to 19 years | 0 (0.0%) | 0.0 |
| 20 to 34 years | 25 (26.3%) | 39.0 |
| 35 to 50 years | 70 (73.7%) | 107.0 |
| Total | 95 (100.0%) | 63.0 |
Fertility by Age by Marriage Status in Madison County
29.5% of women with births (95) in Madison County are married. The highest percentage of unmarried women with births falls into 35 to 50 years age bracket with 95.7% of them unmarried at the time of birth, while the lowest percentage of unmarried women with births belong to 20 to 34 years age bracket with 0.0% of them unmarried.
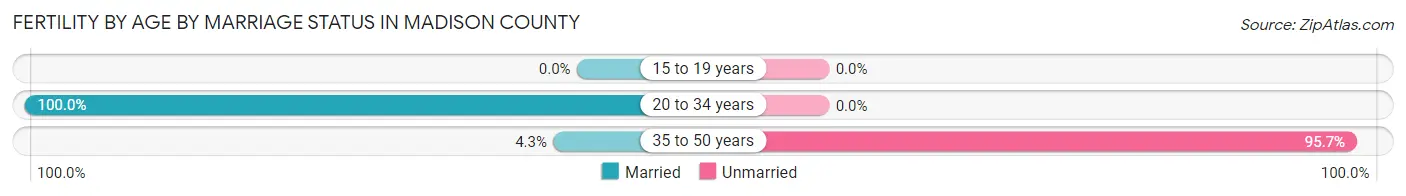
| Age Bracket | Married | Unmarried |
| 15 to 19 years | 0 (0.0%) | 0 (0.0%) |
| 20 to 34 years | 25 (100.0%) | 0 (0.0%) |
| 35 to 50 years | 3 (4.3%) | 67 (95.7%) |
| Total | 28 (29.5%) | 67 (70.5%) |
Fertility by Education in Madison County
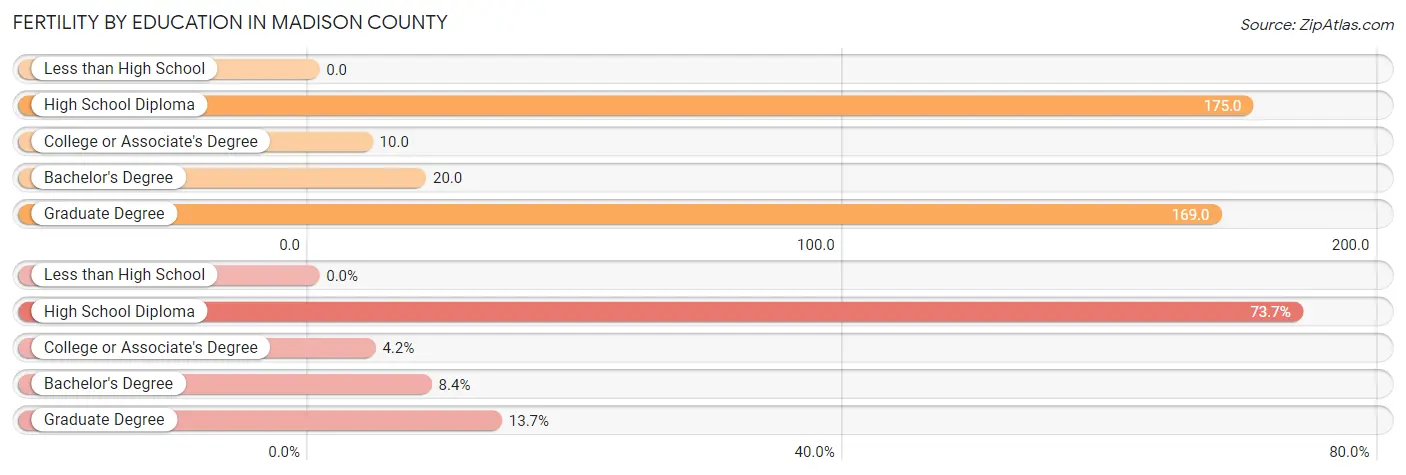
| Educational Attainment | Women with Births | Births / 1,000 Women |
| Less than High School | 0 (0.0%) | 0.0 |
| High School Diploma | 70 (73.7%) | 175.0 |
| College or Associate's Degree | 4 (4.2%) | 10.0 |
| Bachelor's Degree | 8 (8.4%) | 20.0 |
| Graduate Degree | 13 (13.7%) | 169.0 |
| Total | 95 (100.0%) | 63.0 |
Fertility by Education by Marriage Status in Madison County
70.5% of women with births in Madison County are unmarried. Women with the educational attainment of college or associate's degree are most likely to be married with 100.0% of them married at childbirth, while women with the educational attainment of high school diploma are least likely to be married with 95.7% of them unmarried at childbirth.
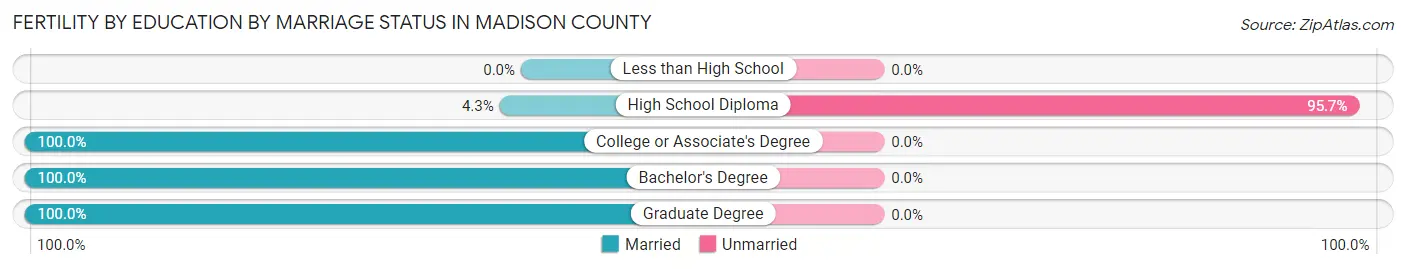
| Educational Attainment | Married | Unmarried |
| Less than High School | 0 (0.0%) | 0 (0.0%) |
| High School Diploma | 3 (4.3%) | 67 (95.7%) |
| College or Associate's Degree | 4 (100.0%) | 0 (0.0%) |
| Bachelor's Degree | 8 (100.0%) | 0 (0.0%) |
| Graduate Degree | 13 (100.0%) | 0 (0.0%) |
| Total | 28 (29.5%) | 67 (70.5%) |
Employment Characteristics in Madison County
Employment by Class of Employer in Madison County
Among the 3,962 employed individuals in Madison County, private company employees (2,252 | 56.8%), self-employed (not incorporated) (608 | 15.3%), and self-employed (incorporated) (332 | 8.4%) make up the most common classes of employment.
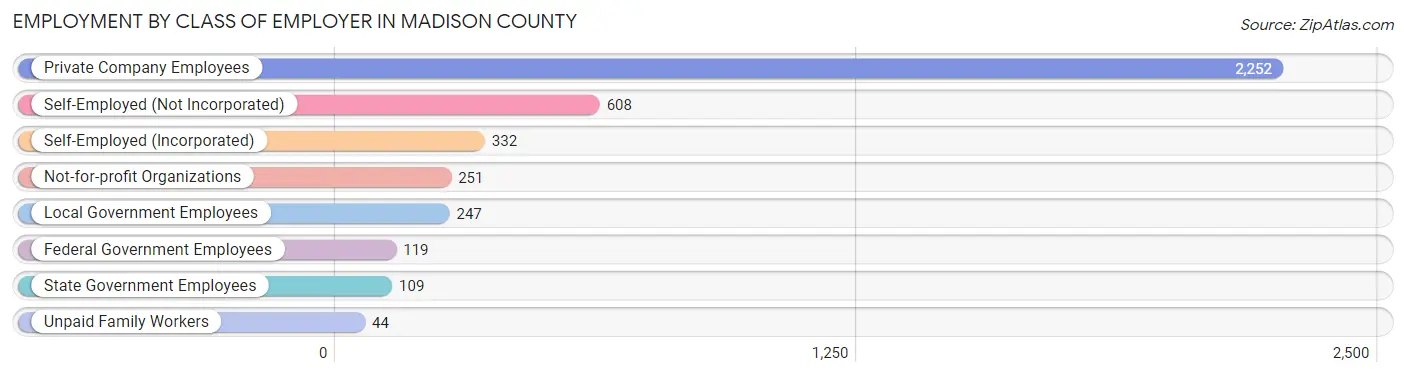
| Employer Class | # Employees | % Employees |
| Private Company Employees | 2,252 | 56.8% |
| Self-Employed (Incorporated) | 332 | 8.4% |
| Self-Employed (Not Incorporated) | 608 | 15.3% |
| Not-for-profit Organizations | 251 | 6.3% |
| Local Government Employees | 247 | 6.2% |
| State Government Employees | 109 | 2.8% |
| Federal Government Employees | 119 | 3.0% |
| Unpaid Family Workers | 44 | 1.1% |
| Total | 3,962 | 100.0% |
Employment Status by Age in Madison County
According to the labor force statistics for Madison County, out of the total population over 16 years of age (7,613), 54.8% or 4,172 individuals are in the labor force, with 2.3% or 96 of them unemployed. The age group with the highest labor force participation rate is 25 to 29 years, with 91.6% or 403 individuals in the labor force. Within the labor force, the 45 to 54 years age range has the highest percentage of unemployed individuals, with 4.7% or 35 of them being unemployed.
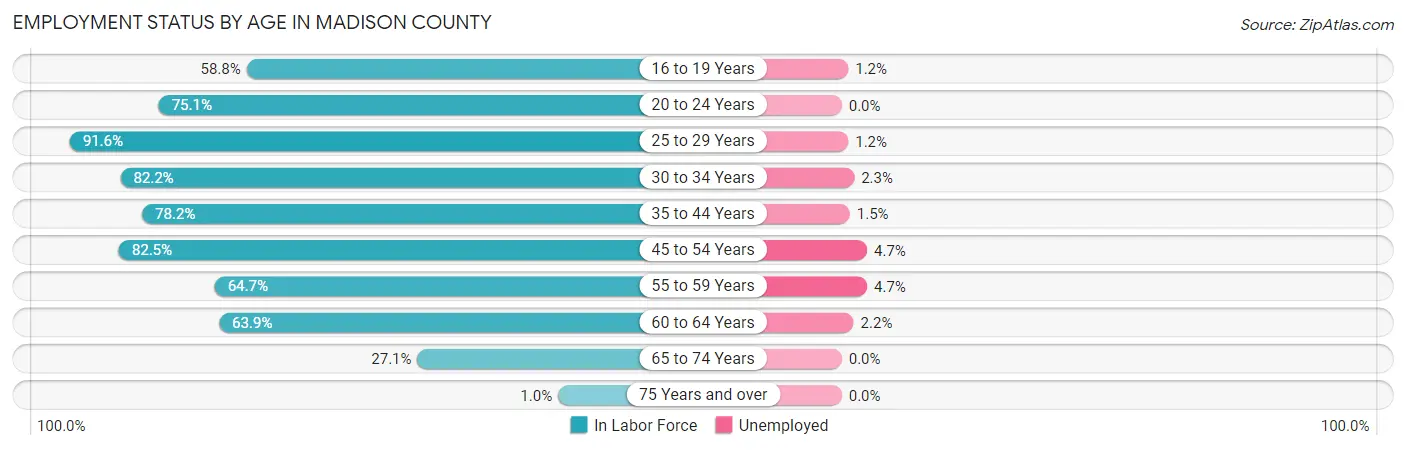
| Age Bracket | In Labor Force | Unemployed |
| 16 to 19 Years | 257 (58.8%) | 3 (1.2%) |
| 20 to 24 Years | 169 (75.1%) | 0 (0.0%) |
| 25 to 29 Years | 403 (91.6%) | 5 (1.2%) |
| 30 to 34 Years | 396 (82.2%) | 9 (2.3%) |
| 35 to 44 Years | 722 (78.2%) | 11 (1.5%) |
| 45 to 54 Years | 745 (82.5%) | 35 (4.7%) |
| 55 to 59 Years | 365 (64.7%) | 17 (4.7%) |
| 60 to 64 Years | 638 (63.9%) | 14 (2.2%) |
| 65 to 74 Years | 466 (27.1%) | 0 (0.0%) |
| 75 Years and over | 9 (1.0%) | 0 (0.0%) |
| Total | 4,172 (54.8%) | 96 (2.3%) |
Employment Status by Educational Attainment in Madison County
According to labor force statistics for Madison County, 75.8% of individuals (3,268) out of the total population between 25 and 64 years of age (4,311) are in the labor force, with 2.8% or 92 of them being unemployed. The group with the highest labor force participation rate are those with the educational attainment of bachelor's degree or higher, with 86.2% or 1,158 individuals in the labor force. Within the labor force, individuals with college / associate degree education have the highest percentage of unemployment, with 5.6% or 61 of them being unemployed.
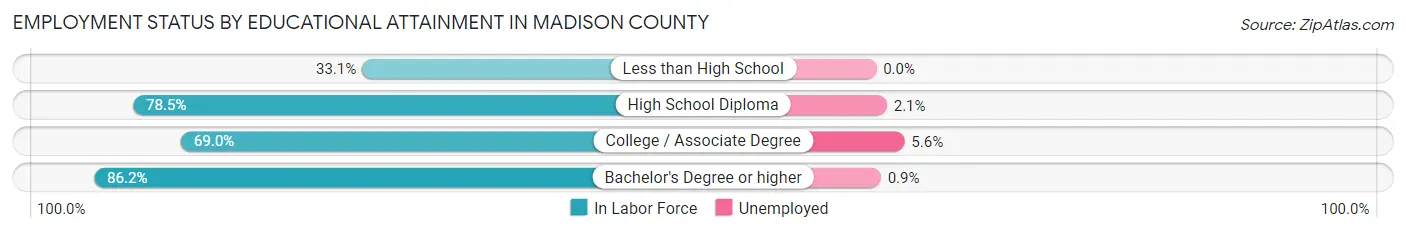
| Educational Attainment | In Labor Force | Unemployed |
| Less than High School | 50 (33.1%) | 0 (0.0%) |
| High School Diploma | 962 (78.5%) | 26 (2.1%) |
| College / Associate Degree | 1,098 (69.0%) | 89 (5.6%) |
| Bachelor's Degree or higher | 1,158 (86.2%) | 12 (0.9%) |
| Total | 3,268 (75.8%) | 121 (2.8%) |
Employment Occupations by Sex in Madison County
Management, Business, Science and Arts Occupations
The most common Management, Business, Science and Arts occupations in Madison County are Management (608 | 14.9%), Community & Social Service (292 | 7.2%), Health Diagnosing & Treating (227 | 5.6%), Health Technologists (180 | 4.4%), and Business & Financial (143 | 3.5%).
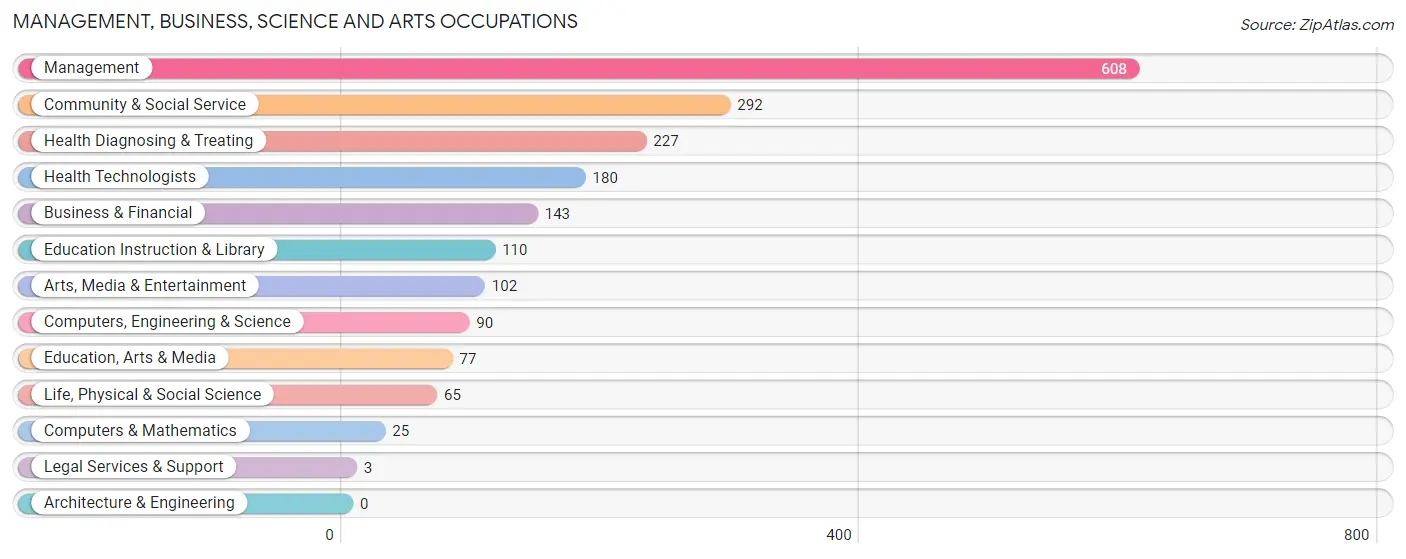
Management, Business, Science and Arts Occupations by Sex
Within the Management, Business, Science and Arts occupations in Madison County, the most male-oriented occupations are Legal Services & Support (100.0%), Life, Physical & Social Science (70.8%), and Education, Arts & Media (68.8%), while the most female-oriented occupations are Education Instruction & Library (69.1%), Health Diagnosing & Treating (64.8%), and Health Technologists (64.4%).
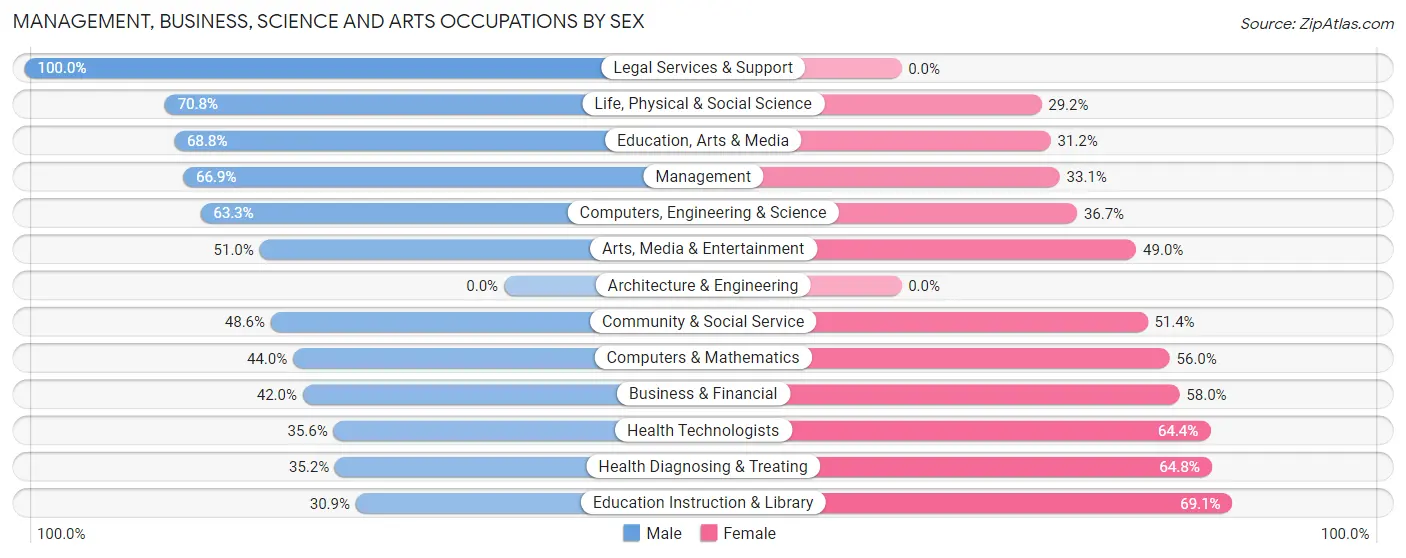
| Occupation | Male | Female |
| Management | 407 (66.9%) | 201 (33.1%) |
| Business & Financial | 60 (42.0%) | 83 (58.0%) |
| Computers, Engineering & Science | 57 (63.3%) | 33 (36.7%) |
| Computers & Mathematics | 11 (44.0%) | 14 (56.0%) |
| Architecture & Engineering | 0 (0.0%) | 0 (0.0%) |
| Life, Physical & Social Science | 46 (70.8%) | 19 (29.2%) |
| Community & Social Service | 142 (48.6%) | 150 (51.4%) |
| Education, Arts & Media | 53 (68.8%) | 24 (31.2%) |
| Legal Services & Support | 3 (100.0%) | 0 (0.0%) |
| Education Instruction & Library | 34 (30.9%) | 76 (69.1%) |
| Arts, Media & Entertainment | 52 (51.0%) | 50 (49.0%) |
| Health Diagnosing & Treating | 80 (35.2%) | 147 (64.8%) |
| Health Technologists | 64 (35.6%) | 116 (64.4%) |
| Total (Category) | 746 (54.8%) | 614 (45.2%) |
| Total (Overall) | 2,248 (55.2%) | 1,827 (44.8%) |
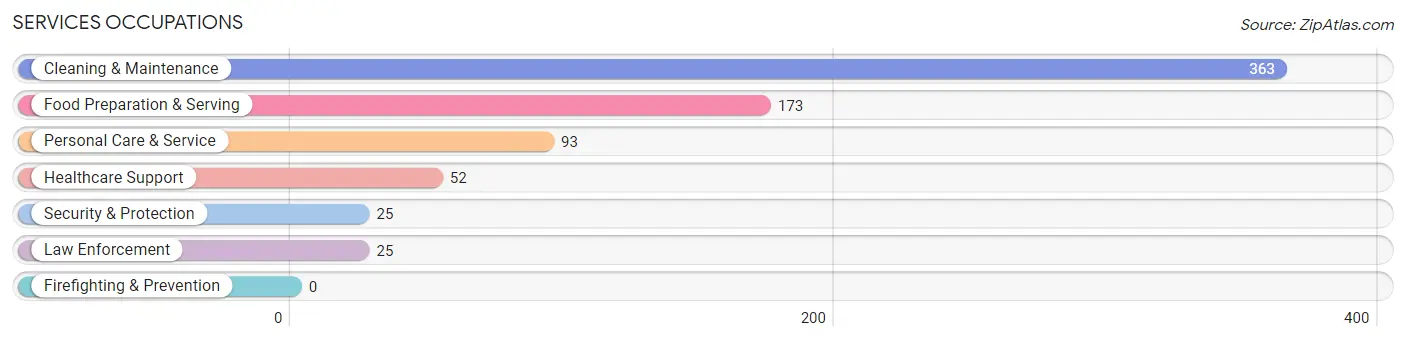
Services Occupations
The most common Services occupations in Madison County are Cleaning & Maintenance (363 | 8.9%), Food Preparation & Serving (173 | 4.3%), Personal Care & Service (93 | 2.3%), Healthcare Support (52 | 1.3%), and Security & Protection (25 | 0.6%).
Services Occupations by Sex
Within the Services occupations in Madison County, the most male-oriented occupations are Security & Protection (100.0%), Law Enforcement (100.0%), and Personal Care & Service (38.7%), while the most female-oriented occupations are Healthcare Support (100.0%), Food Preparation & Serving (82.7%), and Cleaning & Maintenance (69.2%).
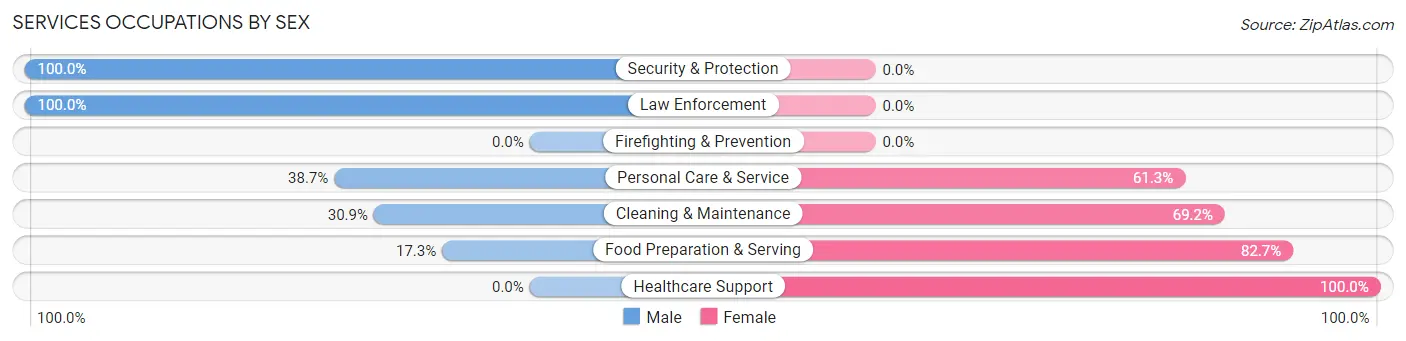
| Occupation | Male | Female |
| Healthcare Support | 0 (0.0%) | 52 (100.0%) |
| Security & Protection | 25 (100.0%) | 0 (0.0%) |
| Firefighting & Prevention | 0 (0.0%) | 0 (0.0%) |
| Law Enforcement | 25 (100.0%) | 0 (0.0%) |
| Food Preparation & Serving | 30 (17.3%) | 143 (82.7%) |
| Cleaning & Maintenance | 112 (30.8%) | 251 (69.2%) |
| Personal Care & Service | 36 (38.7%) | 57 (61.3%) |
| Total (Category) | 203 (28.7%) | 503 (71.3%) |
| Total (Overall) | 2,248 (55.2%) | 1,827 (44.8%) |
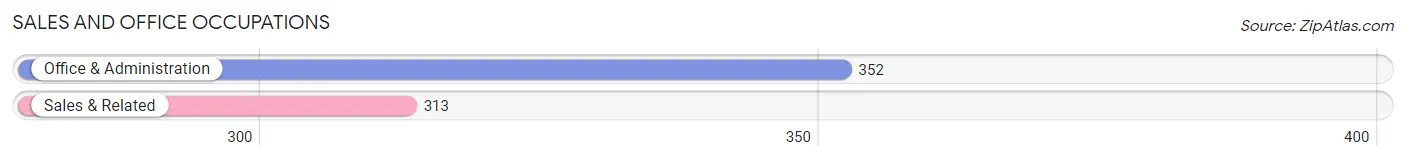
Sales and Office Occupations
The most common Sales and Office occupations in Madison County are Office & Administration (352 | 8.6%), and Sales & Related (313 | 7.7%).
Sales and Office Occupations by Sex
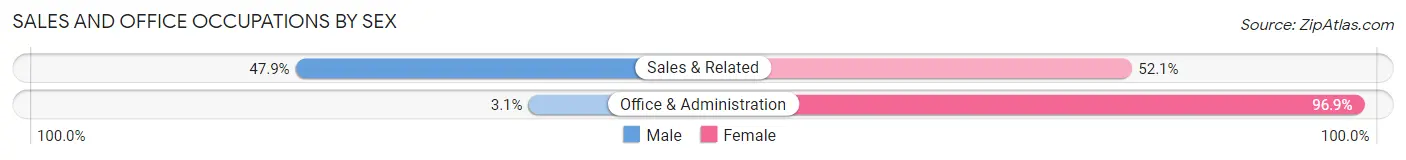
| Occupation | Male | Female |
| Sales & Related | 150 (47.9%) | 163 (52.1%) |
| Office & Administration | 11 (3.1%) | 341 (96.9%) |
| Total (Category) | 161 (24.2%) | 504 (75.8%) |
| Total (Overall) | 2,248 (55.2%) | 1,827 (44.8%) |
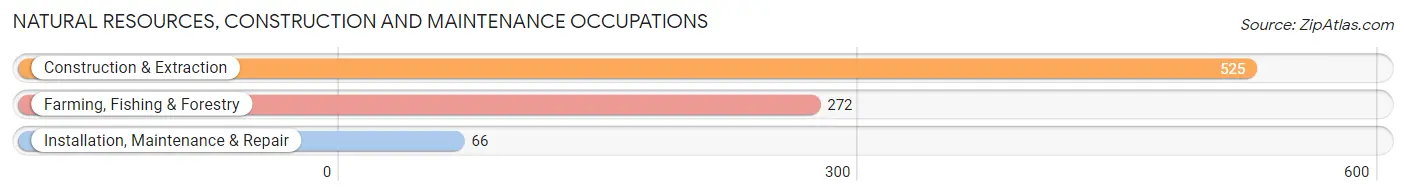
Natural Resources, Construction and Maintenance Occupations
The most common Natural Resources, Construction and Maintenance occupations in Madison County are Construction & Extraction (525 | 12.9%), Farming, Fishing & Forestry (272 | 6.7%), and Installation, Maintenance & Repair (66 | 1.6%).
Natural Resources, Construction and Maintenance Occupations by Sex
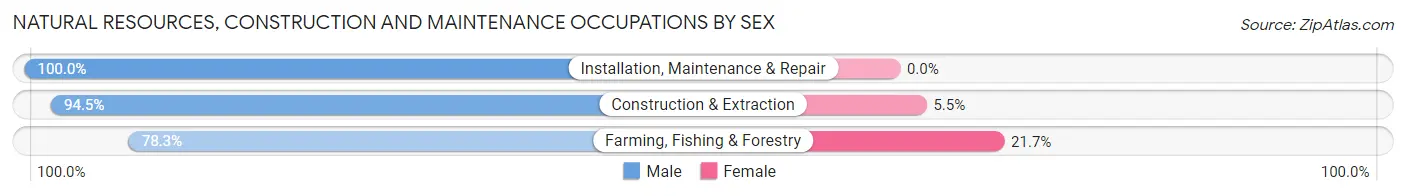
| Occupation | Male | Female |
| Farming, Fishing & Forestry | 213 (78.3%) | 59 (21.7%) |
| Construction & Extraction | 496 (94.5%) | 29 (5.5%) |
| Installation, Maintenance & Repair | 66 (100.0%) | 0 (0.0%) |
| Total (Category) | 775 (89.8%) | 88 (10.2%) |
| Total (Overall) | 2,248 (55.2%) | 1,827 (44.8%) |
Production, Transportation and Moving Occupations
The most common Production, Transportation and Moving occupations in Madison County are Production (209 | 5.1%), Transportation (197 | 4.8%), and Material Moving (75 | 1.8%).

Production, Transportation and Moving Occupations by Sex
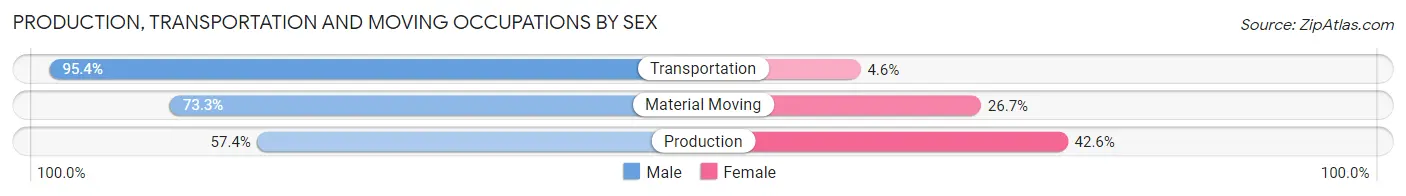
| Occupation | Male | Female |
| Production | 120 (57.4%) | 89 (42.6%) |
| Transportation | 188 (95.4%) | 9 (4.6%) |
| Material Moving | 55 (73.3%) | 20 (26.7%) |
| Total (Category) | 363 (75.5%) | 118 (24.5%) |
| Total (Overall) | 2,248 (55.2%) | 1,827 (44.8%) |
Employment Industries by Sex in Madison County
Employment Industries in Madison County
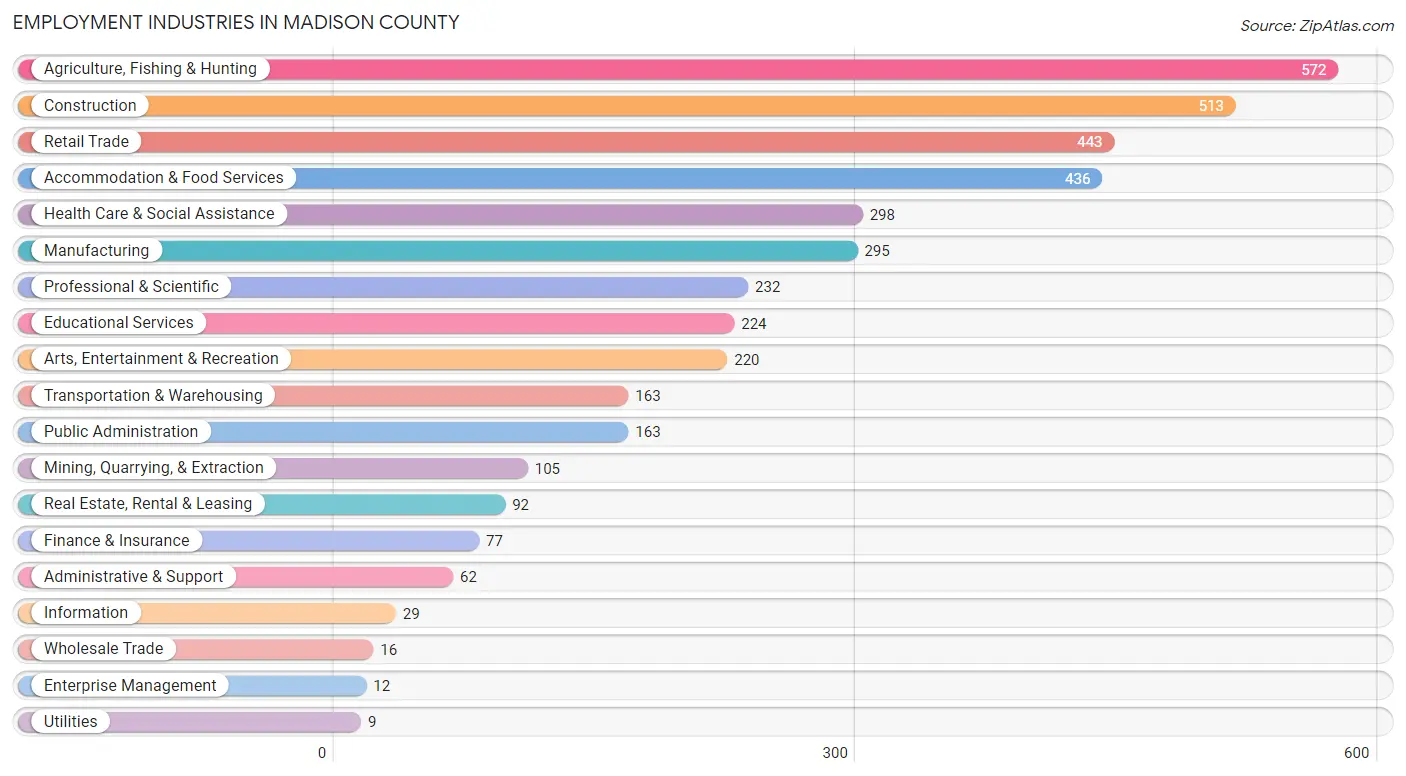
The major employment industries in Madison County include Agriculture, Fishing & Hunting (572 | 14.0%), Construction (513 | 12.6%), Retail Trade (443 | 10.9%), Accommodation & Food Services (436 | 10.7%), and Health Care & Social Assistance (298 | 7.3%).
Employment Industries by Sex in Madison County
The Madison County industries that see more men than women are Wholesale Trade (100.0%), Information (100.0%), and Enterprise Management (100.0%), whereas the industries that tend to have a higher number of women are Accommodation & Food Services (74.3%), Educational Services (73.2%), and Health Care & Social Assistance (73.2%).
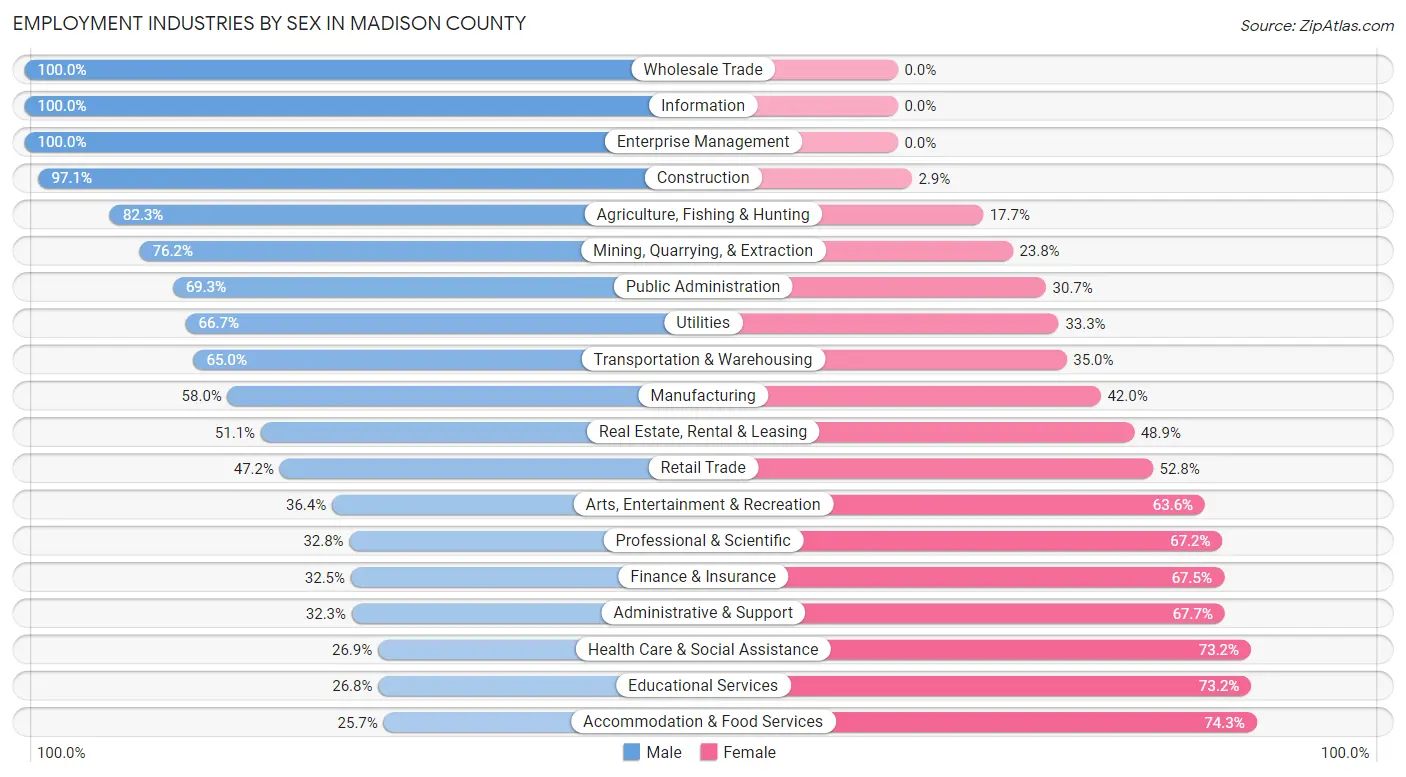
| Industry | Male | Female |
| Agriculture, Fishing & Hunting | 471 (82.3%) | 101 (17.7%) |
| Mining, Quarrying, & Extraction | 80 (76.2%) | 25 (23.8%) |
| Construction | 498 (97.1%) | 15 (2.9%) |
| Manufacturing | 171 (58.0%) | 124 (42.0%) |
| Wholesale Trade | 16 (100.0%) | 0 (0.0%) |
| Retail Trade | 209 (47.2%) | 234 (52.8%) |
| Transportation & Warehousing | 106 (65.0%) | 57 (35.0%) |
| Utilities | 6 (66.7%) | 3 (33.3%) |
| Information | 29 (100.0%) | 0 (0.0%) |
| Finance & Insurance | 25 (32.5%) | 52 (67.5%) |
| Real Estate, Rental & Leasing | 47 (51.1%) | 45 (48.9%) |
| Professional & Scientific | 76 (32.8%) | 156 (67.2%) |
| Enterprise Management | 12 (100.0%) | 0 (0.0%) |
| Administrative & Support | 20 (32.3%) | 42 (67.7%) |
| Educational Services | 60 (26.8%) | 164 (73.2%) |
| Health Care & Social Assistance | 80 (26.9%) | 218 (73.2%) |
| Arts, Entertainment & Recreation | 80 (36.4%) | 140 (63.6%) |
| Accommodation & Food Services | 112 (25.7%) | 324 (74.3%) |
| Public Administration | 113 (69.3%) | 50 (30.7%) |
| Total | 2,248 (55.2%) | 1,827 (44.8%) |
Education in Madison County
School Enrollment in Madison County
The most common levels of schooling among the 1,416 students in Madison County are high school (443 | 31.3%), elementary school (312 | 22.0%), and middle school (222 | 15.7%).
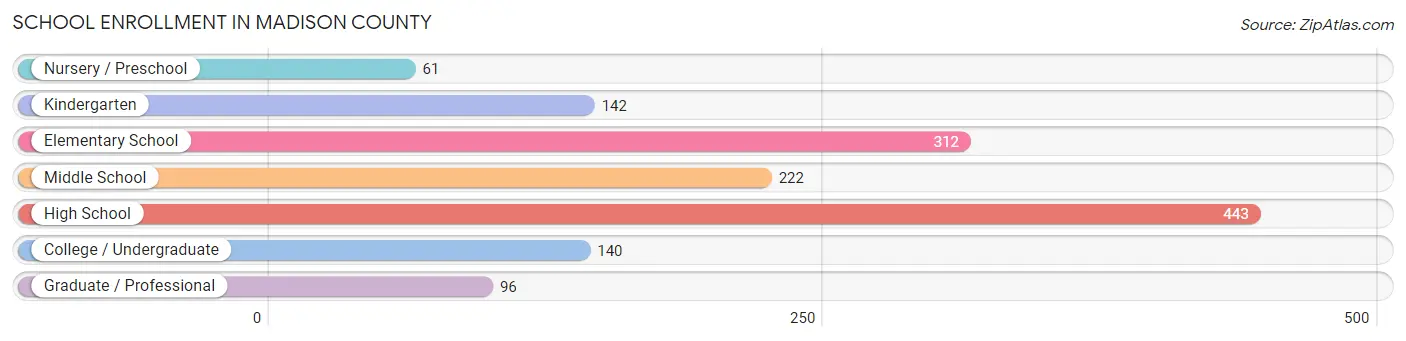
| School Level | # Students | % Students |
| Nursery / Preschool | 61 | 4.3% |
| Kindergarten | 142 | 10.0% |
| Elementary School | 312 | 22.0% |
| Middle School | 222 | 15.7% |
| High School | 443 | 31.3% |
| College / Undergraduate | 140 | 9.9% |
| Graduate / Professional | 96 | 6.8% |
| Total | 1,416 | 100.0% |
School Enrollment by Age by Funding Source in Madison County
Out of a total of 1,416 students who are enrolled in schools in Madison County, 249 (17.6%) attend a private institution, while the remaining 1,167 (82.4%) are enrolled in public schools. The age group of 18 to 19 year olds has the highest likelihood of being enrolled in private schools, with 127 (57.2% in the age bracket) enrolled. Conversely, the age group of 5 to 9 year old has the lowest likelihood of being enrolled in a private school, with 395 (97.1% in the age bracket) attending a public institution.
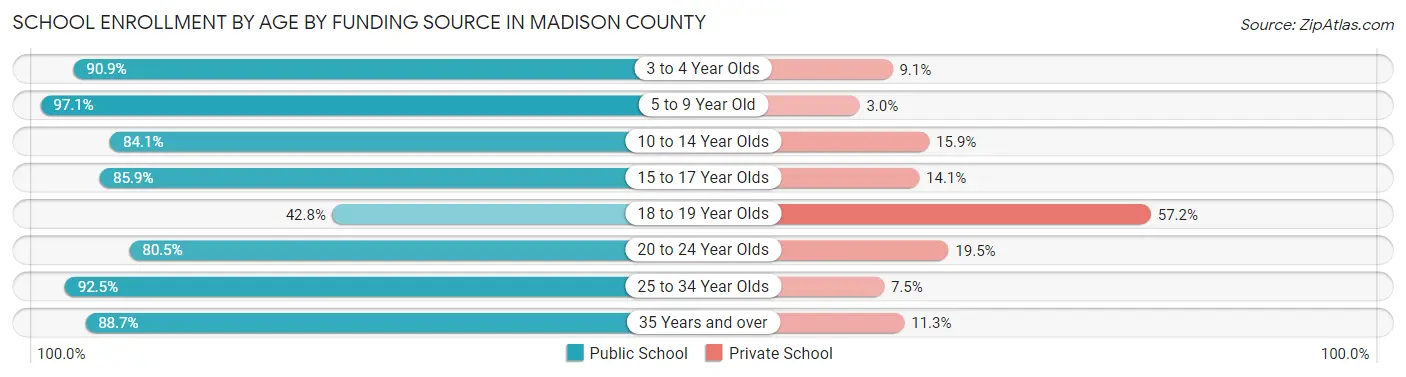
| Age Bracket | Public School | Private School |
| 3 to 4 Year Olds | 40 (90.9%) | 4 (9.1%) |
| 5 to 9 Year Old | 395 (97.1%) | 12 (2.9%) |
| 10 to 14 Year Olds | 243 (84.1%) | 46 (15.9%) |
| 15 to 17 Year Olds | 214 (85.9%) | 35 (14.1%) |
| 18 to 19 Year Olds | 95 (42.8%) | 127 (57.2%) |
| 20 to 24 Year Olds | 33 (80.5%) | 8 (19.5%) |
| 25 to 34 Year Olds | 37 (92.5%) | 3 (7.5%) |
| 35 Years and over | 110 (88.7%) | 14 (11.3%) |
| Total | 1,167 (82.4%) | 249 (17.6%) |
Educational Attainment by Field of Study in Madison County
Education (471 | 20.0%), bio, nature & agricultural (450 | 19.1%), business (418 | 17.8%), science & technology (212 | 9.0%), and liberal arts & history (127 | 5.4%) are the most common fields of study among 2,352 individuals in Madison County who have obtained a bachelor's degree or higher.
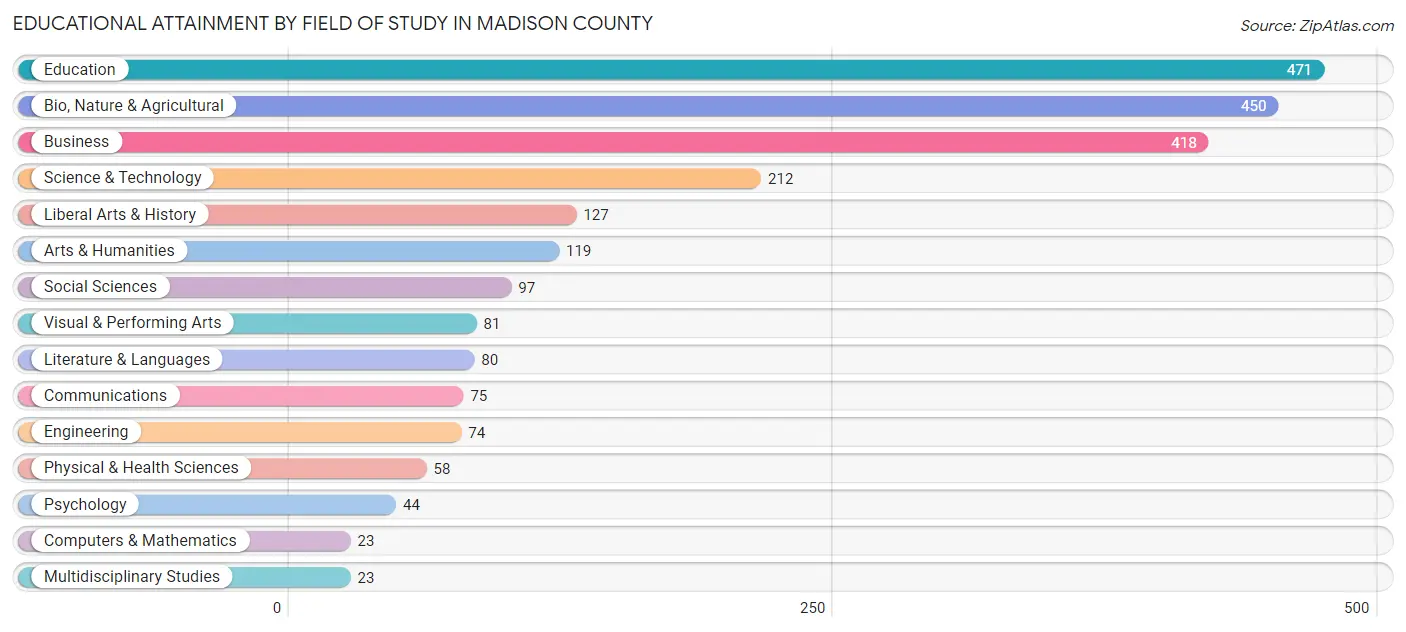
| Field of Study | # Graduates | % Graduates |
| Computers & Mathematics | 23 | 1.0% |
| Bio, Nature & Agricultural | 450 | 19.1% |
| Physical & Health Sciences | 58 | 2.5% |
| Psychology | 44 | 1.9% |
| Social Sciences | 97 | 4.1% |
| Engineering | 74 | 3.2% |
| Multidisciplinary Studies | 23 | 1.0% |
| Science & Technology | 212 | 9.0% |
| Business | 418 | 17.8% |
| Education | 471 | 20.0% |
| Literature & Languages | 80 | 3.4% |
| Liberal Arts & History | 127 | 5.4% |
| Visual & Performing Arts | 81 | 3.4% |
| Communications | 75 | 3.2% |
| Arts & Humanities | 119 | 5.1% |
| Total | 2,352 | 100.0% |
Transportation & Commute in Madison County
Vehicle Availability by Sex in Madison County
The most prevalent vehicle ownership categories in Madison County are males with 2 vehicles (602, accounting for 29.3%) and females with 2 vehicles (554, making up 34.3%).
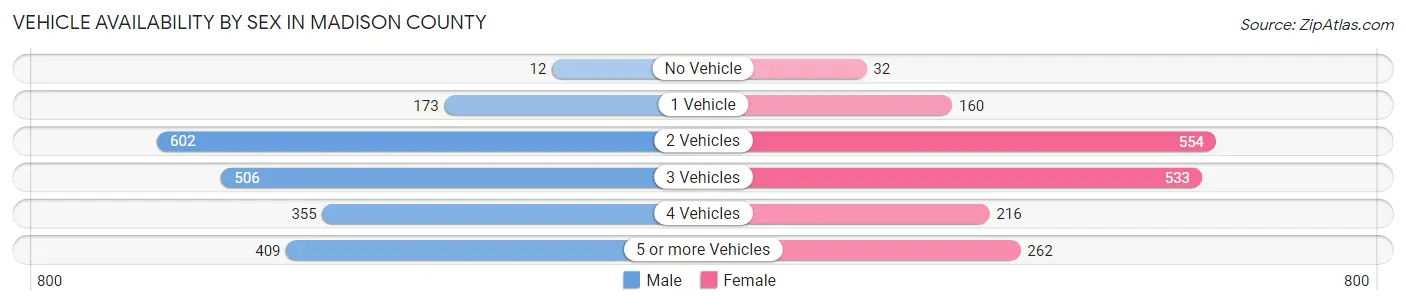
| Vehicles Available | Male | Female |
| No Vehicle | 12 (0.6%) | 32 (1.8%) |
| 1 Vehicle | 173 (8.4%) | 160 (9.1%) |
| 2 Vehicles | 602 (29.3%) | 554 (31.5%) |
| 3 Vehicles | 506 (24.6%) | 533 (30.3%) |
| 4 Vehicles | 355 (17.3%) | 216 (12.3%) |
| 5 or more Vehicles | 409 (19.9%) | 262 (14.9%) |
| Total | 2,057 (100.0%) | 1,757 (100.0%) |
Commute Time in Madison County
The most frequently occuring commute durations in Madison County are 5 to 9 minutes (589 commuters, 17.6%), 10 to 14 minutes (427 commuters, 12.8%), and 15 to 19 minutes (425 commuters, 12.7%).
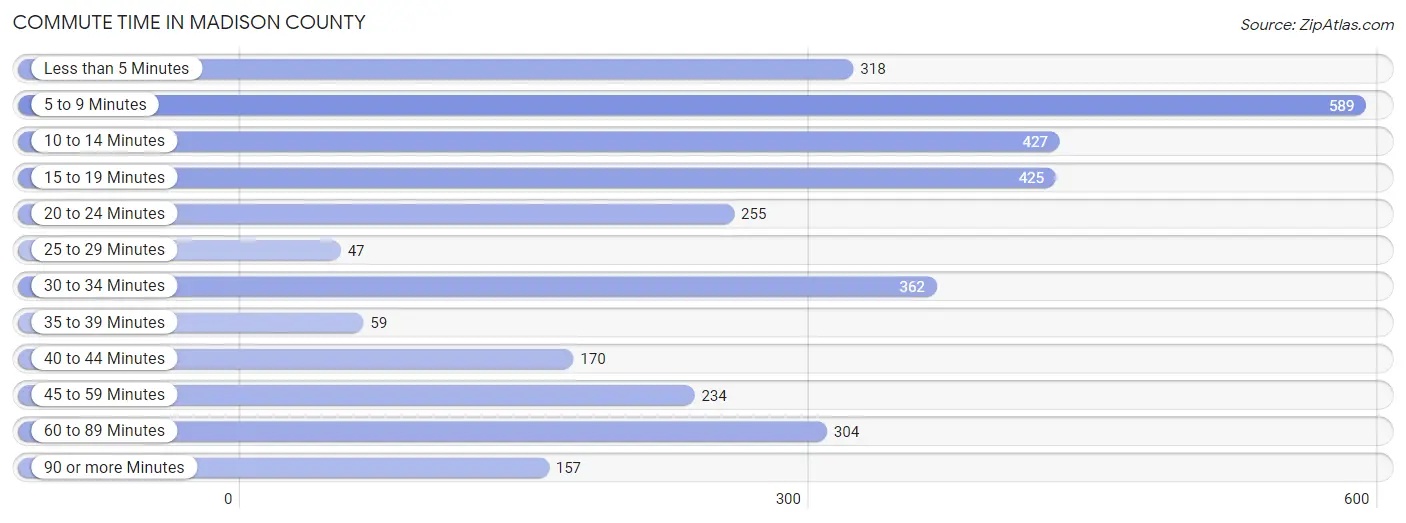
| Commute Time | # Commuters | % Commuters |
| Less than 5 Minutes | 318 | 9.5% |
| 5 to 9 Minutes | 589 | 17.6% |
| 10 to 14 Minutes | 427 | 12.8% |
| 15 to 19 Minutes | 425 | 12.7% |
| 20 to 24 Minutes | 255 | 7.6% |
| 25 to 29 Minutes | 47 | 1.4% |
| 30 to 34 Minutes | 362 | 10.8% |
| 35 to 39 Minutes | 59 | 1.8% |
| 40 to 44 Minutes | 170 | 5.1% |
| 45 to 59 Minutes | 234 | 7.0% |
| 60 to 89 Minutes | 304 | 9.1% |
| 90 or more Minutes | 157 | 4.7% |
Commute Time by Sex in Madison County
The most common commute times in Madison County are 30 to 34 minutes (275 commuters, 14.6%) for males and 5 to 9 minutes (338 commuters, 23.0%) for females.
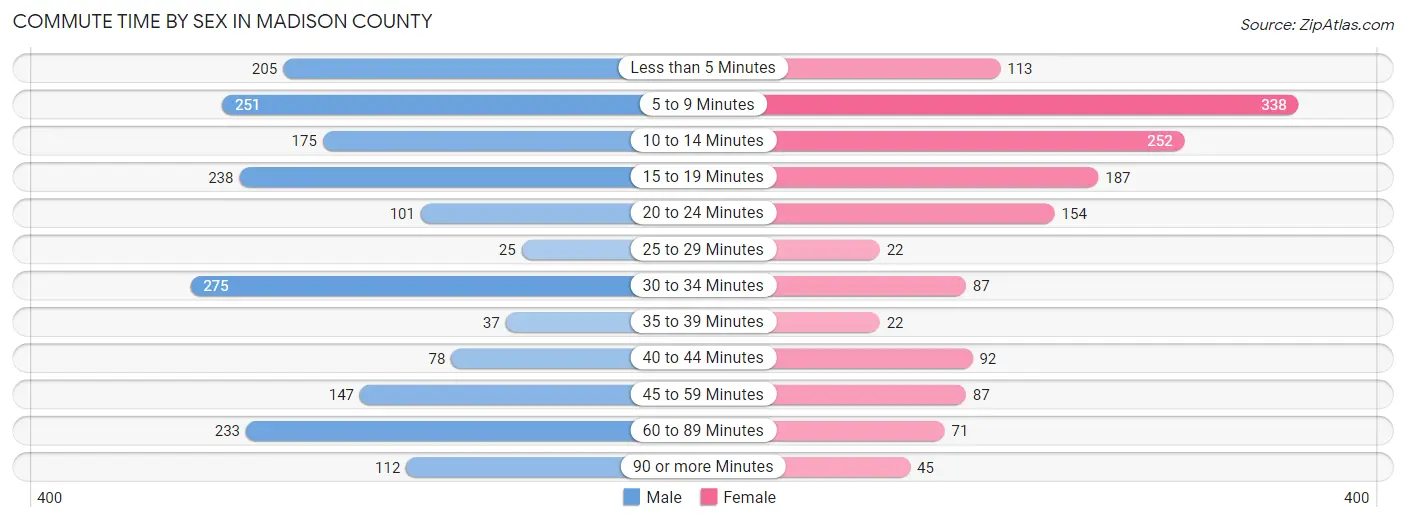
| Commute Time | Male | Female |
| Less than 5 Minutes | 205 (10.9%) | 113 (7.7%) |
| 5 to 9 Minutes | 251 (13.4%) | 338 (23.0%) |
| 10 to 14 Minutes | 175 (9.3%) | 252 (17.1%) |
| 15 to 19 Minutes | 238 (12.7%) | 187 (12.7%) |
| 20 to 24 Minutes | 101 (5.4%) | 154 (10.5%) |
| 25 to 29 Minutes | 25 (1.3%) | 22 (1.5%) |
| 30 to 34 Minutes | 275 (14.6%) | 87 (5.9%) |
| 35 to 39 Minutes | 37 (2.0%) | 22 (1.5%) |
| 40 to 44 Minutes | 78 (4.2%) | 92 (6.3%) |
| 45 to 59 Minutes | 147 (7.8%) | 87 (5.9%) |
| 60 to 89 Minutes | 233 (12.4%) | 71 (4.8%) |
| 90 or more Minutes | 112 (6.0%) | 45 (3.1%) |
Time of Departure to Work by Sex in Madison County
The most frequent times of departure to work in Madison County are 7:00 AM to 7:29 AM (303, 16.1%) for males and 7:00 AM to 7:29 AM (270, 18.4%) for females.
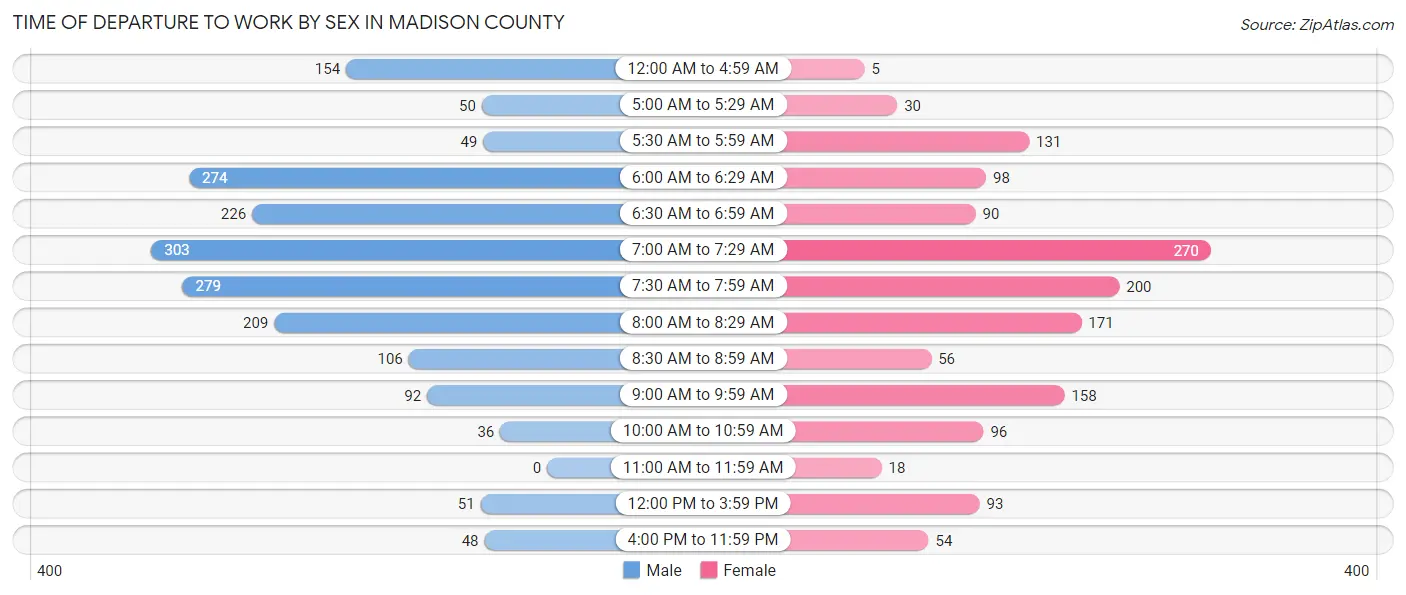
| Time of Departure | Male | Female |
| 12:00 AM to 4:59 AM | 154 (8.2%) | 5 (0.3%) |
| 5:00 AM to 5:29 AM | 50 (2.7%) | 30 (2.0%) |
| 5:30 AM to 5:59 AM | 49 (2.6%) | 131 (8.9%) |
| 6:00 AM to 6:29 AM | 274 (14.6%) | 98 (6.7%) |
| 6:30 AM to 6:59 AM | 226 (12.0%) | 90 (6.1%) |
| 7:00 AM to 7:29 AM | 303 (16.1%) | 270 (18.4%) |
| 7:30 AM to 7:59 AM | 279 (14.9%) | 200 (13.6%) |
| 8:00 AM to 8:29 AM | 209 (11.1%) | 171 (11.6%) |
| 8:30 AM to 8:59 AM | 106 (5.7%) | 56 (3.8%) |
| 9:00 AM to 9:59 AM | 92 (4.9%) | 158 (10.7%) |
| 10:00 AM to 10:59 AM | 36 (1.9%) | 96 (6.5%) |
| 11:00 AM to 11:59 AM | 0 (0.0%) | 18 (1.2%) |
| 12:00 PM to 3:59 PM | 51 (2.7%) | 93 (6.3%) |
| 4:00 PM to 11:59 PM | 48 (2.6%) | 54 (3.7%) |
| Total | 1,877 (100.0%) | 1,470 (100.0%) |
Housing Occupancy in Madison County
Occupancy by Ownership in Madison County
Of the total 3,559 dwellings in Madison County, owner-occupied units account for 2,762 (77.6%), while renter-occupied units make up 797 (22.4%).
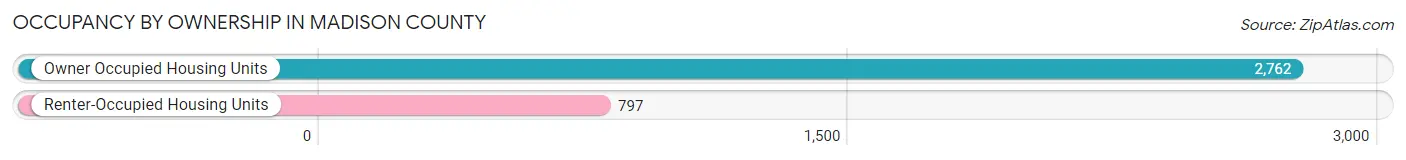
| Occupancy | # Housing Units | % Housing Units |
| Owner Occupied Housing Units | 2,762 | 77.6% |
| Renter-Occupied Housing Units | 797 | 22.4% |
| Total Occupied Housing Units | 3,559 | 100.0% |
Occupancy by Household Size in Madison County
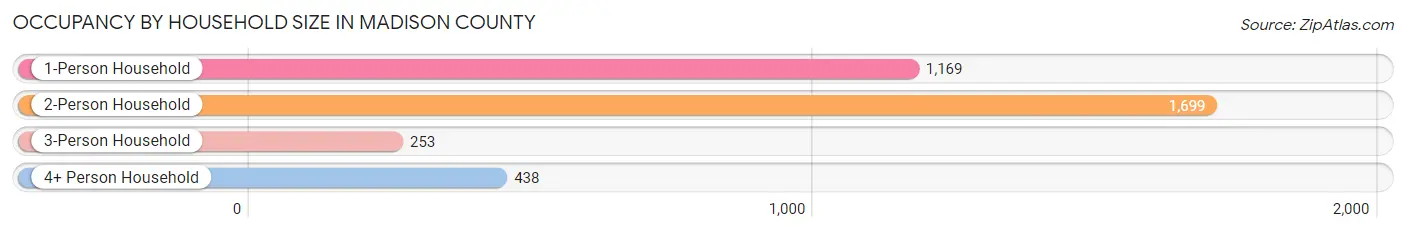
| Household Size | # Housing Units | % Housing Units |
| 1-Person Household | 1,169 | 32.9% |
| 2-Person Household | 1,699 | 47.7% |
| 3-Person Household | 253 | 7.1% |
| 4+ Person Household | 438 | 12.3% |
| Total Housing Units | 3,559 | 100.0% |
Occupancy by Ownership by Household Size in Madison County
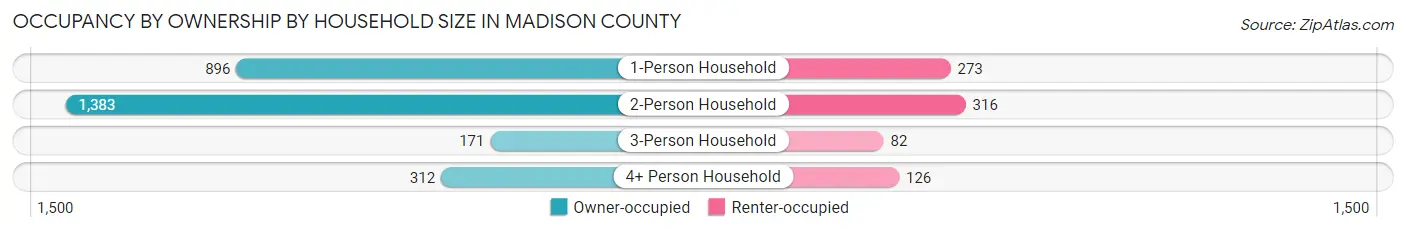
| Household Size | Owner-occupied | Renter-occupied |
| 1-Person Household | 896 (76.6%) | 273 (23.4%) |
| 2-Person Household | 1,383 (81.4%) | 316 (18.6%) |
| 3-Person Household | 171 (67.6%) | 82 (32.4%) |
| 4+ Person Household | 312 (71.2%) | 126 (28.8%) |
| Total Housing Units | 2,762 (77.6%) | 797 (22.4%) |
Occupancy by Educational Attainment in Madison County
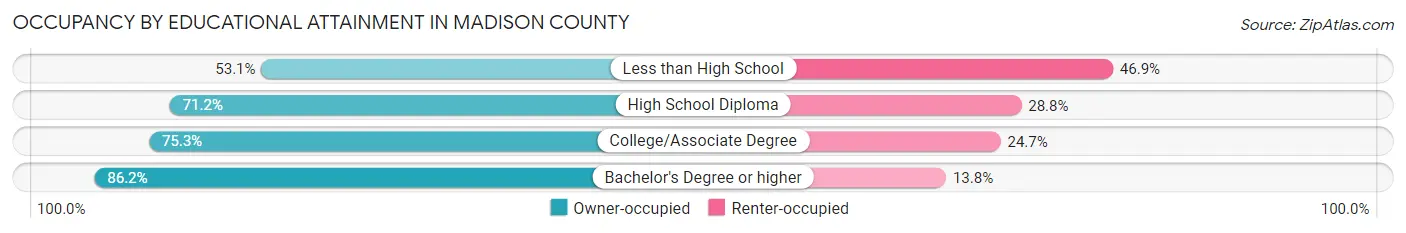
| Household Size | Owner-occupied | Renter-occupied |
| Less than High School | 52 (53.1%) | 46 (46.9%) |
| High School Diploma | 624 (71.2%) | 252 (28.8%) |
| College/Associate Degree | 984 (75.3%) | 322 (24.7%) |
| Bachelor's Degree or higher | 1,102 (86.2%) | 177 (13.8%) |
Occupancy by Age of Householder in Madison County
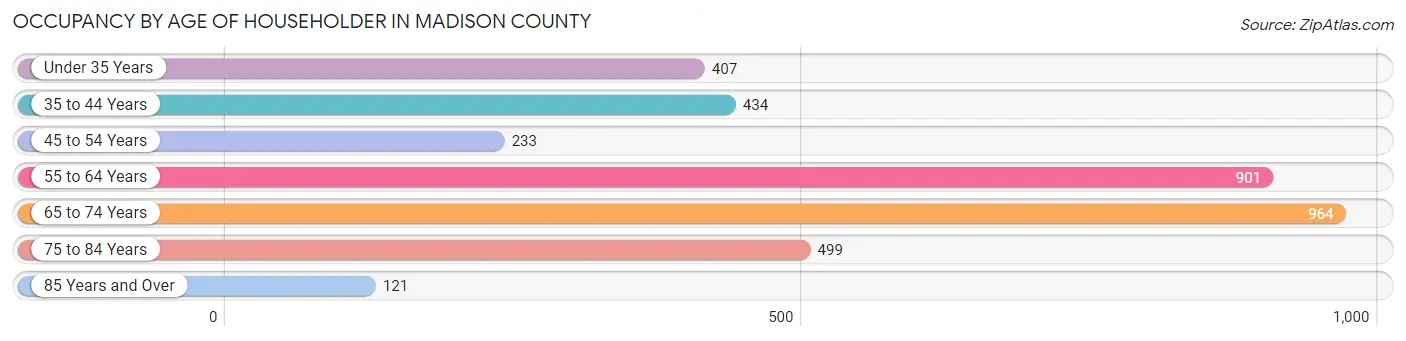
| Age Bracket | # Households | % Households |
| Under 35 Years | 407 | 11.4% |
| 35 to 44 Years | 434 | 12.2% |
| 45 to 54 Years | 233 | 6.6% |
| 55 to 64 Years | 901 | 25.3% |
| 65 to 74 Years | 964 | 27.1% |
| 75 to 84 Years | 499 | 14.0% |
| 85 Years and Over | 121 | 3.4% |
| Total | 3,559 | 100.0% |
Housing Finances in Madison County
Median Income by Occupancy in Madison County
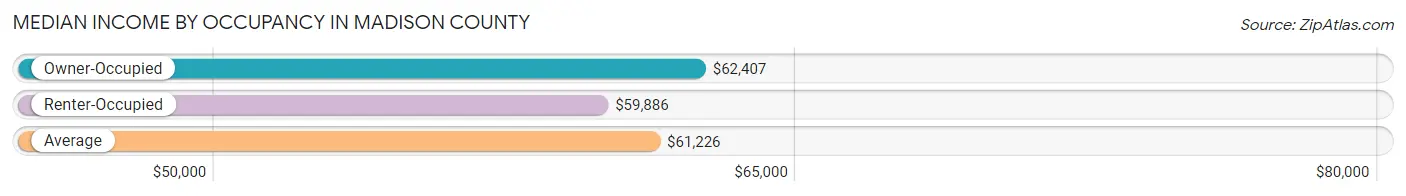
| Occupancy Type | # Households | Median Income |
| Owner-Occupied | 2,762 (77.6%) | $62,407 |
| Renter-Occupied | 797 (22.4%) | $59,886 |
| Average | 3,559 (100.0%) | $61,226 |
Occupancy by Householder Income Bracket in Madison County
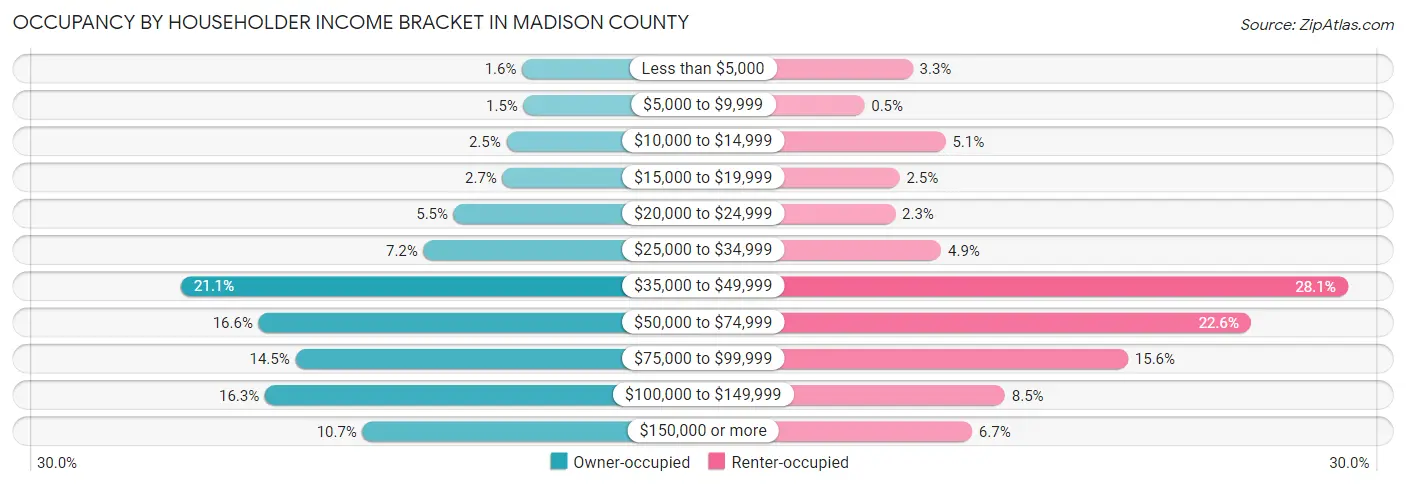
| Income Bracket | Owner-occupied | Renter-occupied |
| Less than $5,000 | 43 (1.6%) | 26 (3.3%) |
| $5,000 to $9,999 | 41 (1.5%) | 4 (0.5%) |
| $10,000 to $14,999 | 68 (2.5%) | 41 (5.1%) |
| $15,000 to $19,999 | 74 (2.7%) | 20 (2.5%) |
| $20,000 to $24,999 | 151 (5.5%) | 18 (2.3%) |
| $25,000 to $34,999 | 199 (7.2%) | 39 (4.9%) |
| $35,000 to $49,999 | 582 (21.1%) | 224 (28.1%) |
| $50,000 to $74,999 | 459 (16.6%) | 180 (22.6%) |
| $75,000 to $99,999 | 401 (14.5%) | 124 (15.6%) |
| $100,000 to $149,999 | 449 (16.3%) | 68 (8.5%) |
| $150,000 or more | 295 (10.7%) | 53 (6.7%) |
| Total | 2,762 (100.0%) | 797 (100.0%) |
Monthly Housing Cost Tiers in Madison County
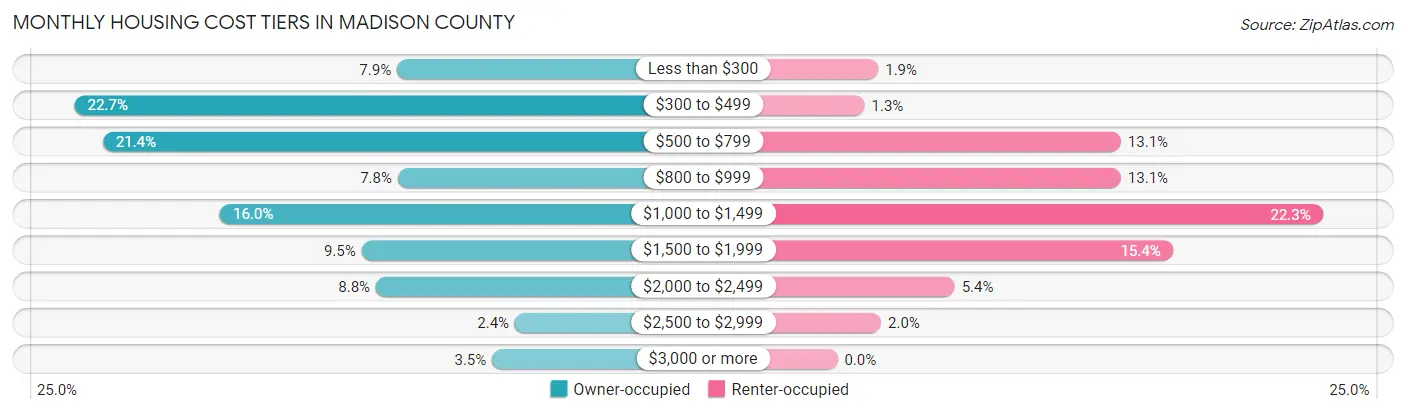
| Monthly Cost | Owner-occupied | Renter-occupied |
| Less than $300 | 217 (7.9%) | 15 (1.9%) |
| $300 to $499 | 627 (22.7%) | 10 (1.3%) |
| $500 to $799 | 591 (21.4%) | 104 (13.1%) |
| $800 to $999 | 216 (7.8%) | 104 (13.1%) |
| $1,000 to $1,499 | 442 (16.0%) | 178 (22.3%) |
| $1,500 to $1,999 | 262 (9.5%) | 123 (15.4%) |
| $2,000 to $2,499 | 244 (8.8%) | 43 (5.4%) |
| $2,500 to $2,999 | 67 (2.4%) | 16 (2.0%) |
| $3,000 or more | 96 (3.5%) | 0 (0.0%) |
| Total | 2,762 (100.0%) | 797 (100.0%) |
Physical Housing Characteristics in Madison County
Housing Structures in Madison County
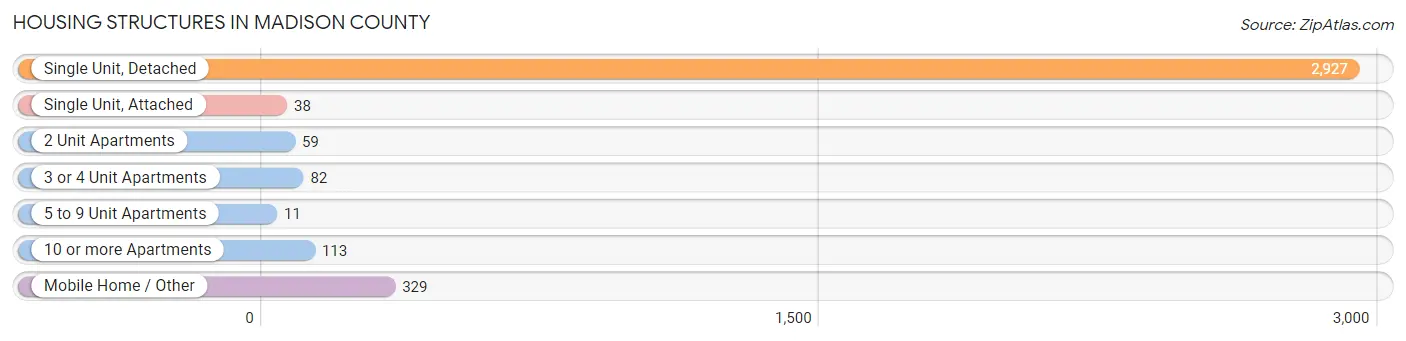
| Structure Type | # Housing Units | % Housing Units |
| Single Unit, Detached | 2,927 | 82.2% |
| Single Unit, Attached | 38 | 1.1% |
| 2 Unit Apartments | 59 | 1.7% |
| 3 or 4 Unit Apartments | 82 | 2.3% |
| 5 to 9 Unit Apartments | 11 | 0.3% |
| 10 or more Apartments | 113 | 3.2% |
| Mobile Home / Other | 329 | 9.2% |
| Total | 3,559 | 100.0% |
Housing Structures by Occupancy in Madison County
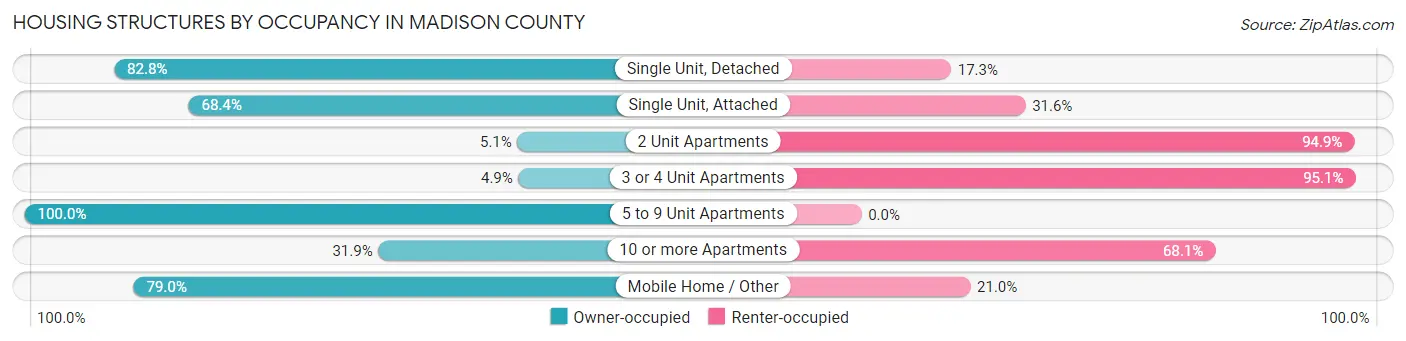
| Structure Type | Owner-occupied | Renter-occupied |
| Single Unit, Detached | 2,422 (82.8%) | 505 (17.2%) |
| Single Unit, Attached | 26 (68.4%) | 12 (31.6%) |
| 2 Unit Apartments | 3 (5.1%) | 56 (94.9%) |
| 3 or 4 Unit Apartments | 4 (4.9%) | 78 (95.1%) |
| 5 to 9 Unit Apartments | 11 (100.0%) | 0 (0.0%) |
| 10 or more Apartments | 36 (31.9%) | 77 (68.1%) |
| Mobile Home / Other | 260 (79.0%) | 69 (21.0%) |
| Total | 2,762 (77.6%) | 797 (22.4%) |
Housing Structures by Number of Rooms in Madison County
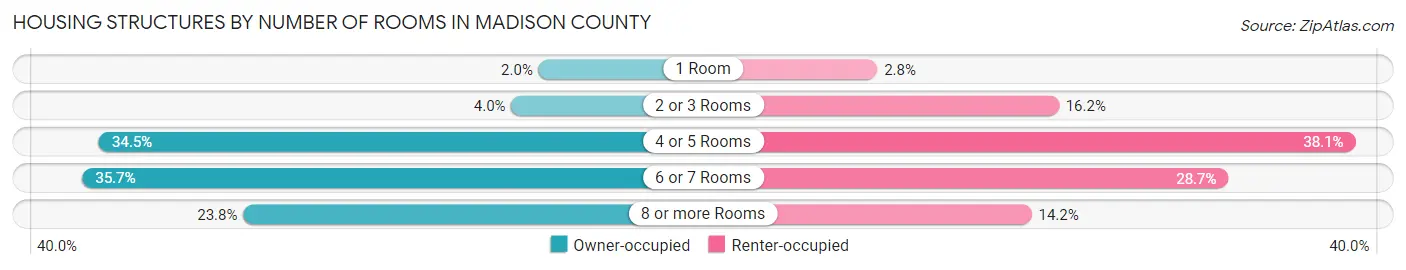
| Number of Rooms | Owner-occupied | Renter-occupied |
| 1 Room | 54 (2.0%) | 22 (2.8%) |
| 2 or 3 Rooms | 110 (4.0%) | 129 (16.2%) |
| 4 or 5 Rooms | 953 (34.5%) | 304 (38.1%) |
| 6 or 7 Rooms | 987 (35.7%) | 229 (28.7%) |
| 8 or more Rooms | 658 (23.8%) | 113 (14.2%) |
| Total | 2,762 (100.0%) | 797 (100.0%) |
Housing Structure by Heating Type in Madison County
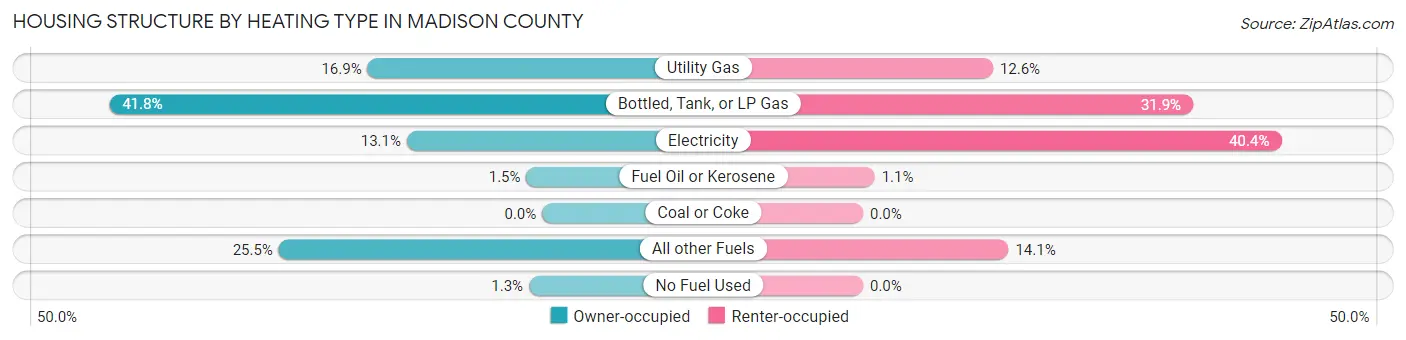
| Heating Type | Owner-occupied | Renter-occupied |
| Utility Gas | 466 (16.9%) | 100 (12.6%) |
| Bottled, Tank, or LP Gas | 1,155 (41.8%) | 254 (31.9%) |
| Electricity | 361 (13.1%) | 322 (40.4%) |
| Fuel Oil or Kerosene | 42 (1.5%) | 9 (1.1%) |
| Coal or Coke | 0 (0.0%) | 0 (0.0%) |
| All other Fuels | 703 (25.5%) | 112 (14.1%) |
| No Fuel Used | 35 (1.3%) | 0 (0.0%) |
| Total | 2,762 (100.0%) | 797 (100.0%) |
Household Vehicle Usage in Madison County
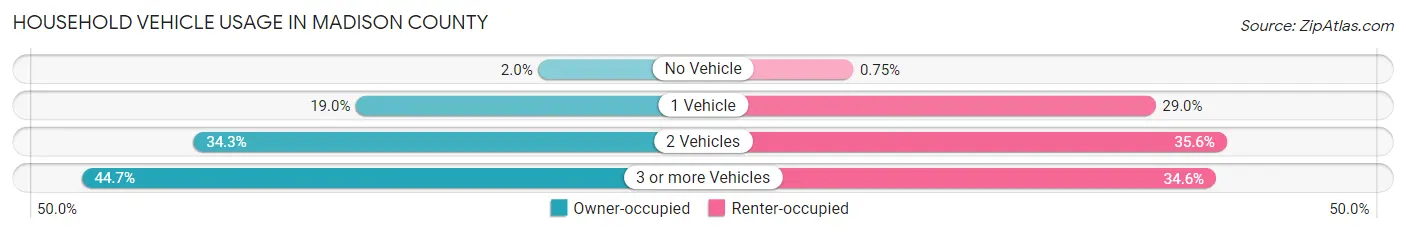
| Vehicles per Household | Owner-occupied | Renter-occupied |
| No Vehicle | 56 (2.0%) | 6 (0.7%) |
| 1 Vehicle | 526 (19.0%) | 231 (29.0%) |
| 2 Vehicles | 946 (34.3%) | 284 (35.6%) |
| 3 or more Vehicles | 1,234 (44.7%) | 276 (34.6%) |
| Total | 2,762 (100.0%) | 797 (100.0%) |
Real Estate & Mortgages in Madison County
Real Estate and Mortgage Overview in Madison County
| Characteristic | Without Mortgage | With Mortgage |
| Housing Units | 1,546 | 1,216 |
| Median Property Value | $372,500 | $380,900 |
| Median Household Income | $53,939 | $199 |
| Monthly Housing Costs | $484 | $93 |
| Real Estate Taxes | $1,772 | $20 |
Property Value by Mortgage Status in Madison County
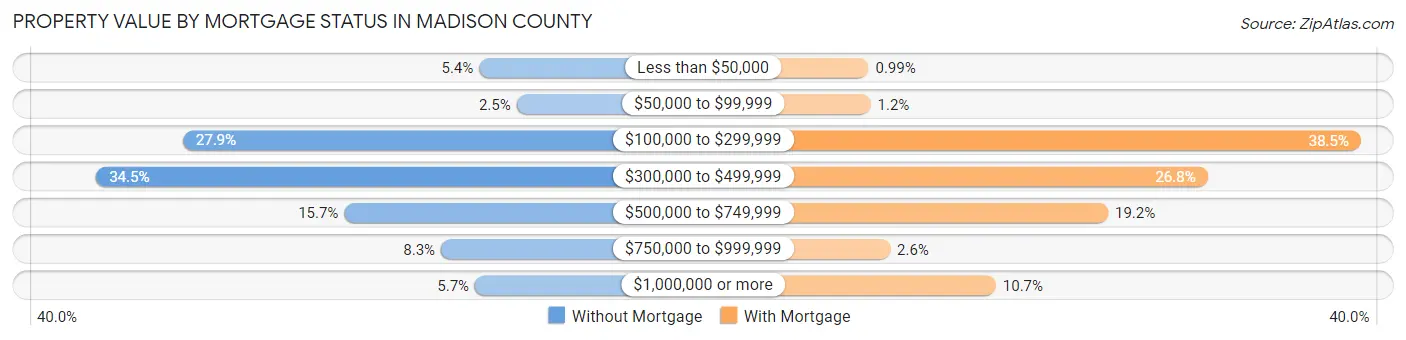
| Property Value | Without Mortgage | With Mortgage |
| Less than $50,000 | 83 (5.4%) | 12 (1.0%) |
| $50,000 to $99,999 | 39 (2.5%) | 14 (1.1%) |
| $100,000 to $299,999 | 432 (27.9%) | 468 (38.5%) |
| $300,000 to $499,999 | 534 (34.5%) | 326 (26.8%) |
| $500,000 to $749,999 | 242 (15.7%) | 234 (19.2%) |
| $750,000 to $999,999 | 128 (8.3%) | 32 (2.6%) |
| $1,000,000 or more | 88 (5.7%) | 130 (10.7%) |
| Total | 1,546 (100.0%) | 1,216 (100.0%) |
Household Income by Mortgage Status in Madison County
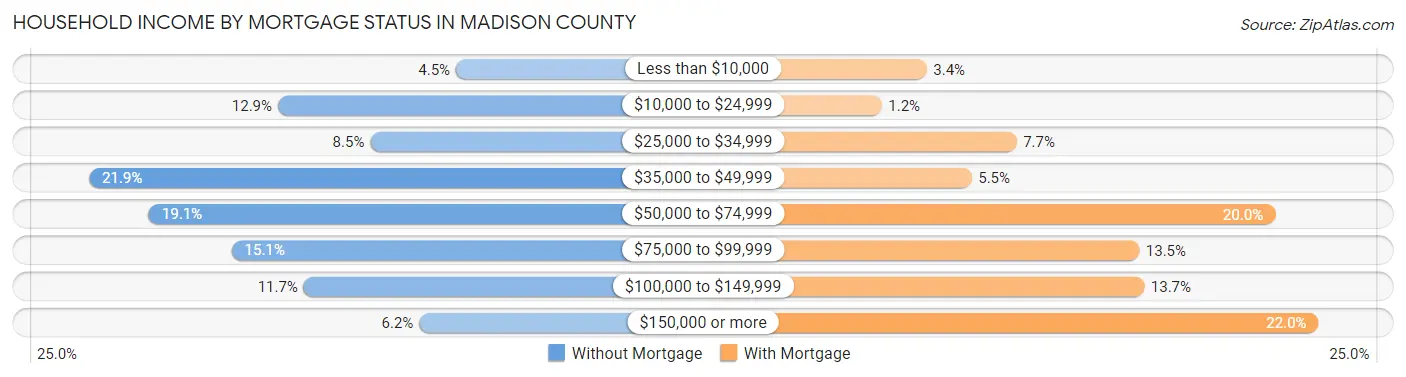
| Household Income | Without Mortgage | With Mortgage |
| Less than $10,000 | 69 (4.5%) | 41 (3.4%) |
| $10,000 to $24,999 | 200 (12.9%) | 15 (1.2%) |
| $25,000 to $34,999 | 132 (8.5%) | 93 (7.6%) |
| $35,000 to $49,999 | 339 (21.9%) | 67 (5.5%) |
| $50,000 to $74,999 | 295 (19.1%) | 243 (20.0%) |
| $75,000 to $99,999 | 234 (15.1%) | 164 (13.5%) |
| $100,000 to $149,999 | 181 (11.7%) | 167 (13.7%) |
| $150,000 or more | 96 (6.2%) | 268 (22.0%) |
| Total | 1,546 (100.0%) | 1,216 (100.0%) |
Property Value to Household Income Ratio in Madison County
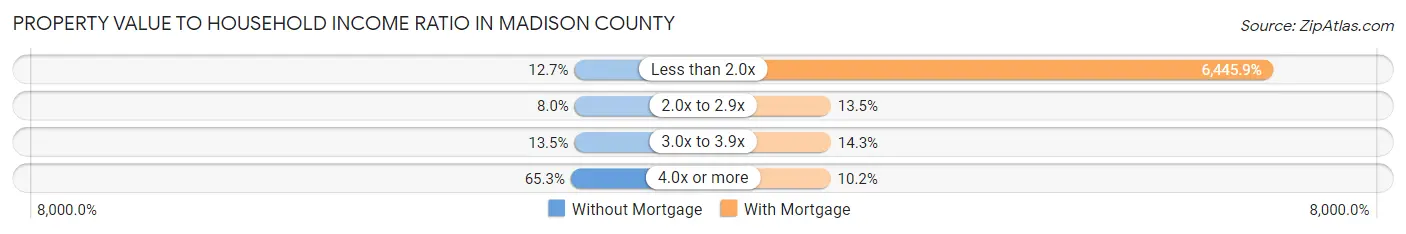
| Value-to-Income Ratio | Without Mortgage | With Mortgage |
| Less than 2.0x | 197 (12.7%) | 78,382 (6,445.9%) |
| 2.0x to 2.9x | 123 (8.0%) | 164 (13.5%) |
| 3.0x to 3.9x | 209 (13.5%) | 174 (14.3%) |
| 4.0x or more | 1,009 (65.3%) | 124 (10.2%) |
| Total | 1,546 (100.0%) | 1,216 (100.0%) |
Real Estate Taxes by Mortgage Status in Madison County
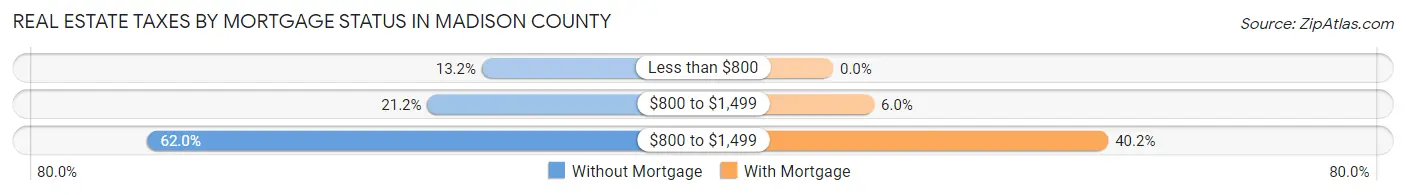
| Property Taxes | Without Mortgage | With Mortgage |
| Less than $800 | 204 (13.2%) | 0 (0.0%) |
| $800 to $1,499 | 327 (21.1%) | 73 (6.0%) |
| $800 to $1,499 | 959 (62.0%) | 489 (40.2%) |
| Total | 1,546 (100.0%) | 1,216 (100.0%) |
Health & Disability in Madison County
Health Insurance Coverage by Age in Madison County
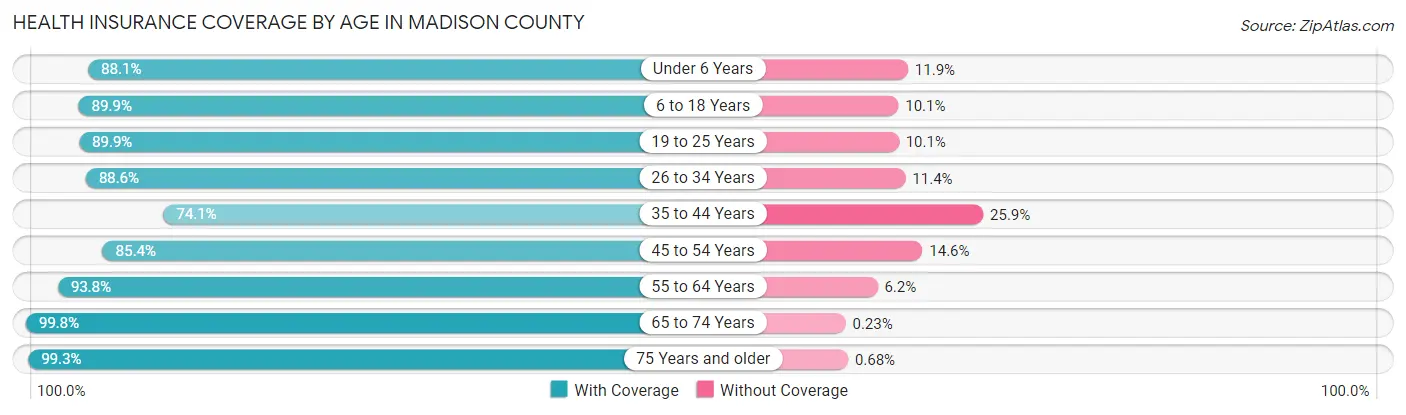
| Age Bracket | With Coverage | Without Coverage |
| Under 6 Years | 431 (88.1%) | 58 (11.9%) |
| 6 to 18 Years | 938 (89.9%) | 105 (10.1%) |
| 19 to 25 Years | 257 (89.9%) | 29 (10.1%) |
| 26 to 34 Years | 793 (88.6%) | 102 (11.4%) |
| 35 to 44 Years | 684 (74.1%) | 239 (25.9%) |
| 45 to 54 Years | 763 (85.4%) | 130 (14.6%) |
| 55 to 64 Years | 1,455 (93.8%) | 96 (6.2%) |
| 65 to 74 Years | 1,714 (99.8%) | 4 (0.2%) |
| 75 Years and older | 880 (99.3%) | 6 (0.7%) |
| Total | 7,915 (91.1%) | 769 (8.9%) |
Health Insurance Coverage by Citizenship Status in Madison County
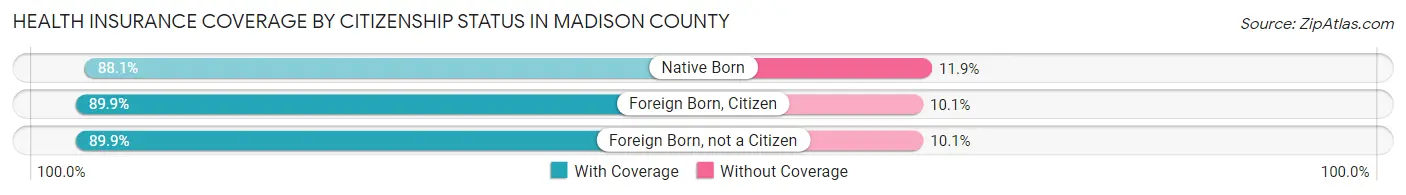
| Citizenship Status | With Coverage | Without Coverage |
| Native Born | 431 (88.1%) | 58 (11.9%) |
| Foreign Born, Citizen | 938 (89.9%) | 105 (10.1%) |
| Foreign Born, not a Citizen | 257 (89.9%) | 29 (10.1%) |
Health Insurance Coverage by Household Income in Madison County
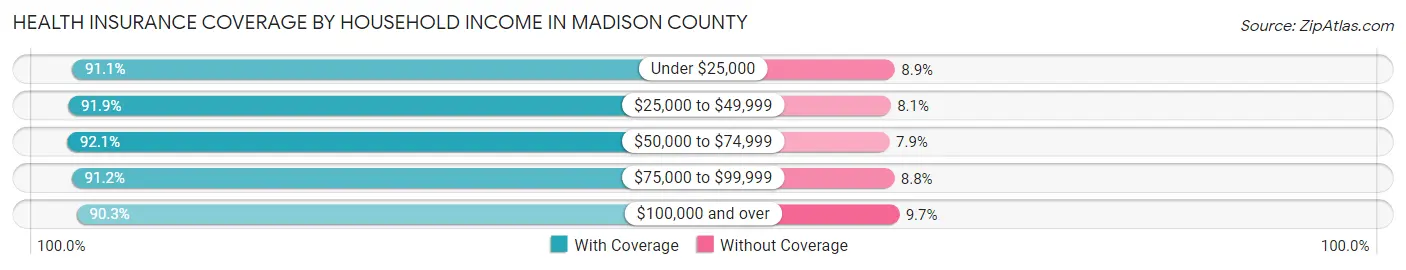
| Household Income | With Coverage | Without Coverage |
| Under $25,000 | 654 (91.1%) | 64 (8.9%) |
| $25,000 to $49,999 | 1,749 (91.9%) | 155 (8.1%) |
| $50,000 to $74,999 | 1,349 (92.1%) | 116 (7.9%) |
| $75,000 to $99,999 | 1,344 (91.2%) | 130 (8.8%) |
| $100,000 and over | 2,620 (90.3%) | 282 (9.7%) |
Public vs Private Health Insurance Coverage by Age in Madison County
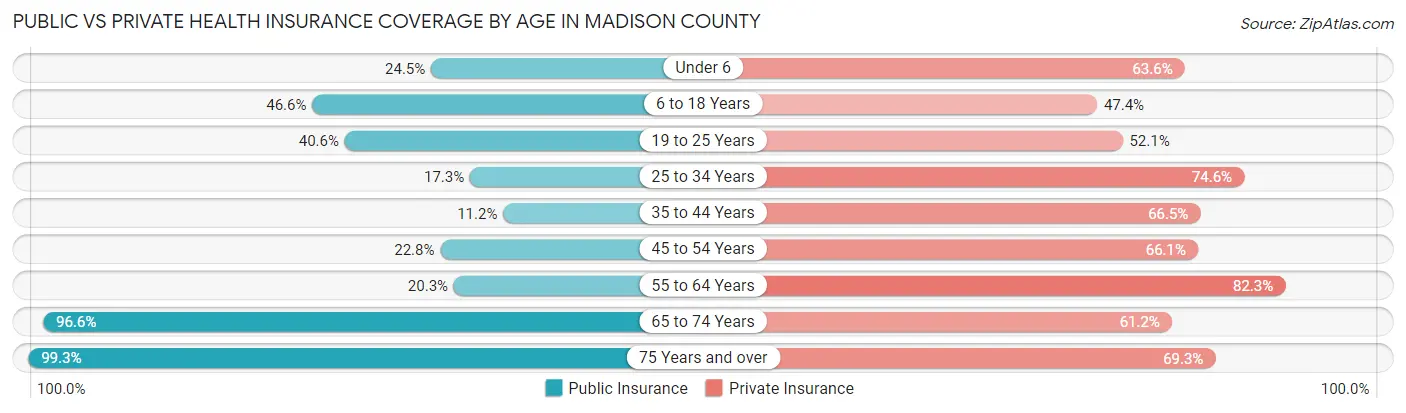
| Age Bracket | Public Insurance | Private Insurance |
| Under 6 | 120 (24.5%) | 311 (63.6%) |
| 6 to 18 Years | 486 (46.6%) | 494 (47.4%) |
| 19 to 25 Years | 116 (40.6%) | 149 (52.1%) |
| 25 to 34 Years | 155 (17.3%) | 668 (74.6%) |
| 35 to 44 Years | 103 (11.2%) | 614 (66.5%) |
| 45 to 54 Years | 204 (22.8%) | 590 (66.1%) |
| 55 to 64 Years | 315 (20.3%) | 1,276 (82.3%) |
| 65 to 74 Years | 1,659 (96.6%) | 1,052 (61.2%) |
| 75 Years and over | 880 (99.3%) | 614 (69.3%) |
| Total | 4,038 (46.5%) | 5,768 (66.4%) |
Disability Status by Sex by Age in Madison County
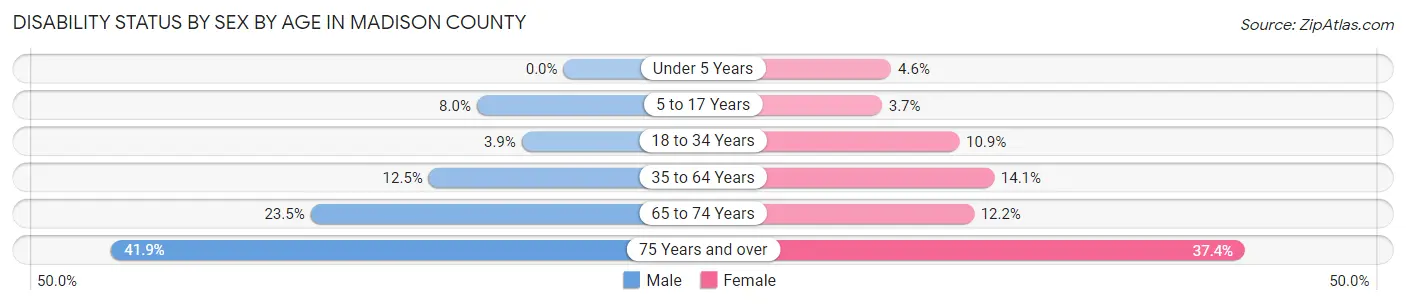
| Age Bracket | Male | Female |
| Under 5 Years | 0 (0.0%) | 7 (4.6%) |
| 5 to 17 Years | 41 (8.0%) | 18 (3.7%) |
| 18 to 34 Years | 27 (3.9%) | 77 (10.9%) |
| 35 to 64 Years | 226 (12.5%) | 220 (14.1%) |
| 65 to 74 Years | 223 (23.5%) | 94 (12.2%) |
| 75 Years and over | 190 (41.9%) | 162 (37.4%) |
Disability Class by Sex by Age in Madison County
Disability Class: Hearing Difficulty
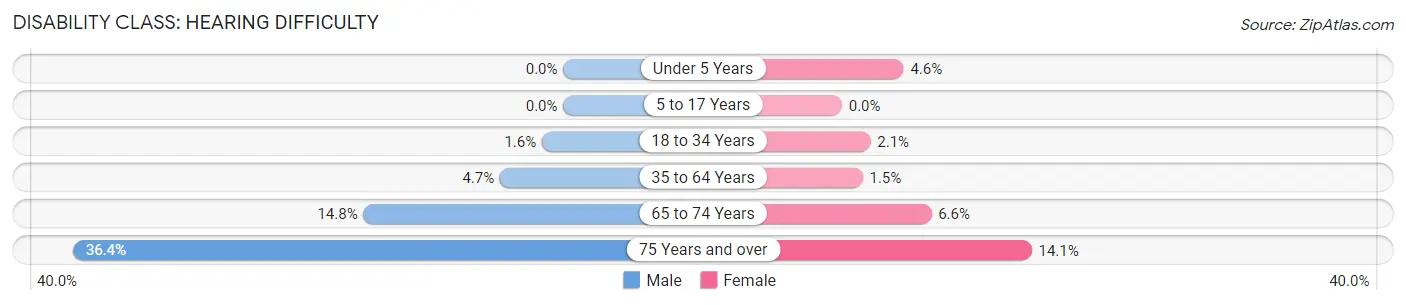
| Age Bracket | Male | Female |
| Under 5 Years | 0 (0.0%) | 7 (4.6%) |
| 5 to 17 Years | 0 (0.0%) | 0 (0.0%) |
| 18 to 34 Years | 11 (1.6%) | 15 (2.1%) |
| 35 to 64 Years | 85 (4.7%) | 24 (1.5%) |
| 65 to 74 Years | 141 (14.8%) | 51 (6.6%) |
| 75 Years and over | 165 (36.4%) | 61 (14.1%) |
Disability Class: Vision Difficulty
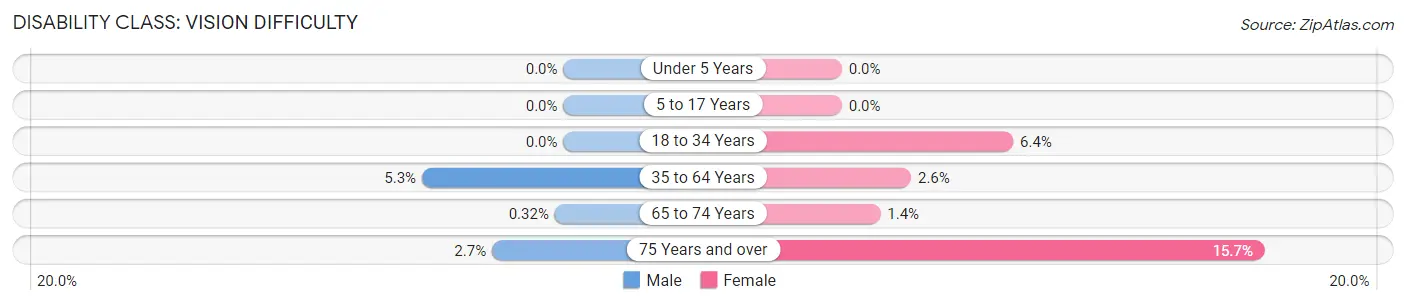
| Age Bracket | Male | Female |
| Under 5 Years | 0 (0.0%) | 0 (0.0%) |
| 5 to 17 Years | 0 (0.0%) | 0 (0.0%) |
| 18 to 34 Years | 0 (0.0%) | 45 (6.4%) |
| 35 to 64 Years | 95 (5.2%) | 40 (2.6%) |
| 65 to 74 Years | 3 (0.3%) | 11 (1.4%) |
| 75 Years and over | 12 (2.6%) | 68 (15.7%) |
Disability Class: Cognitive Difficulty
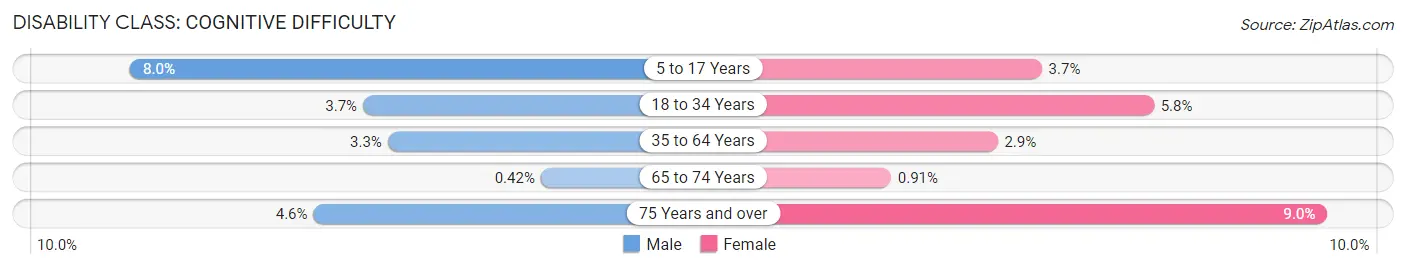
| Age Bracket | Male | Female |
| 5 to 17 Years | 41 (8.0%) | 18 (3.7%) |
| 18 to 34 Years | 26 (3.7%) | 41 (5.8%) |
| 35 to 64 Years | 59 (3.3%) | 45 (2.9%) |
| 65 to 74 Years | 4 (0.4%) | 7 (0.9%) |
| 75 Years and over | 21 (4.6%) | 39 (9.0%) |
Disability Class: Ambulatory Difficulty
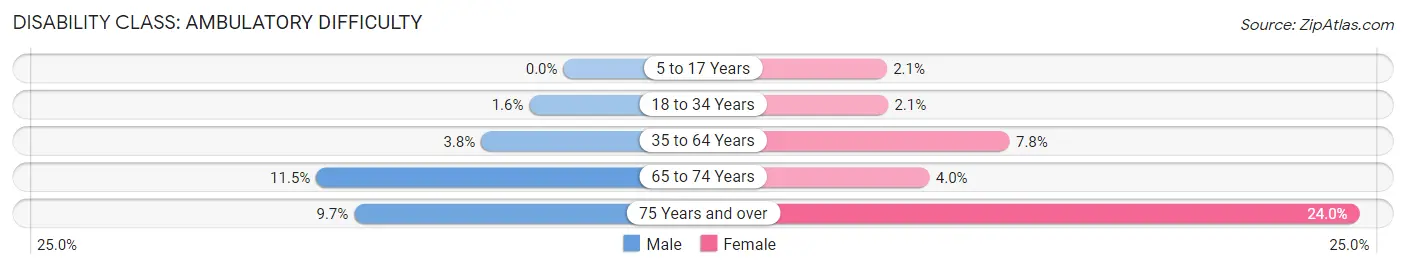
| Age Bracket | Male | Female |
| 5 to 17 Years | 0 (0.0%) | 10 (2.1%) |
| 18 to 34 Years | 11 (1.6%) | 15 (2.1%) |
| 35 to 64 Years | 69 (3.8%) | 121 (7.8%) |
| 65 to 74 Years | 109 (11.5%) | 31 (4.0%) |
| 75 Years and over | 44 (9.7%) | 104 (24.0%) |
Disability Class: Self-Care Difficulty
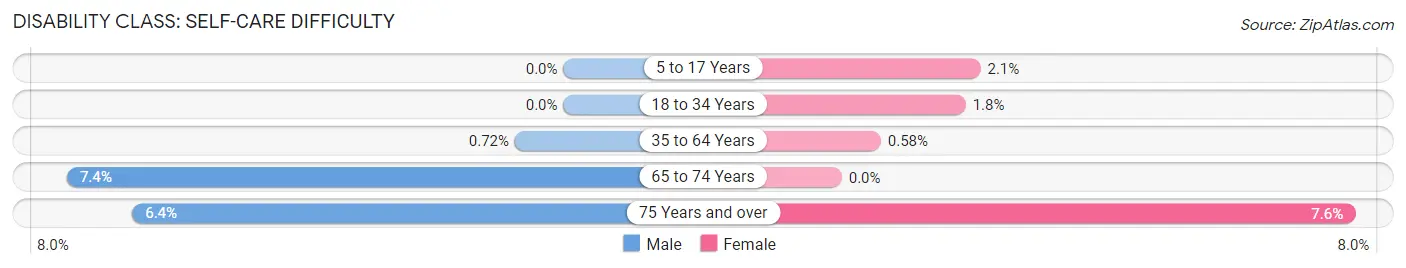
| Age Bracket | Male | Female |
| 5 to 17 Years | 0 (0.0%) | 10 (2.1%) |
| 18 to 34 Years | 0 (0.0%) | 13 (1.8%) |
| 35 to 64 Years | 13 (0.7%) | 9 (0.6%) |
| 65 to 74 Years | 70 (7.4%) | 0 (0.0%) |
| 75 Years and over | 29 (6.4%) | 33 (7.6%) |
Technology Access in Madison County
Computing Device Access in Madison County
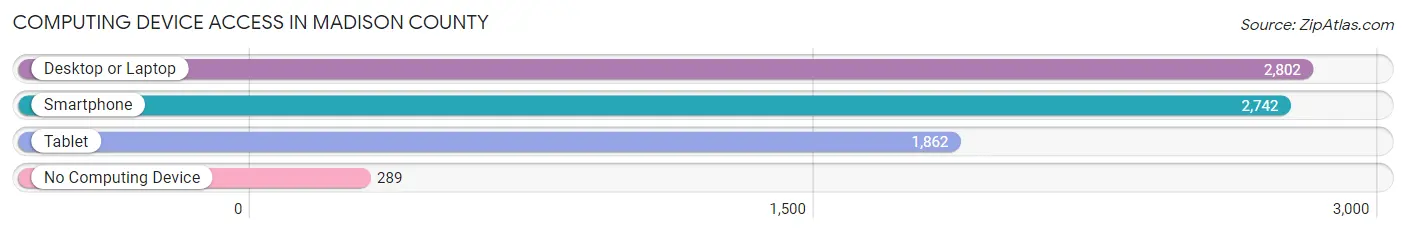
| Device Type | # Households | % Households |
| Desktop or Laptop | 2,802 | 78.7% |
| Smartphone | 2,742 | 77.0% |
| Tablet | 1,862 | 52.3% |
| No Computing Device | 289 | 8.1% |
| Total | 3,559 | 100.0% |
Internet Access in Madison County
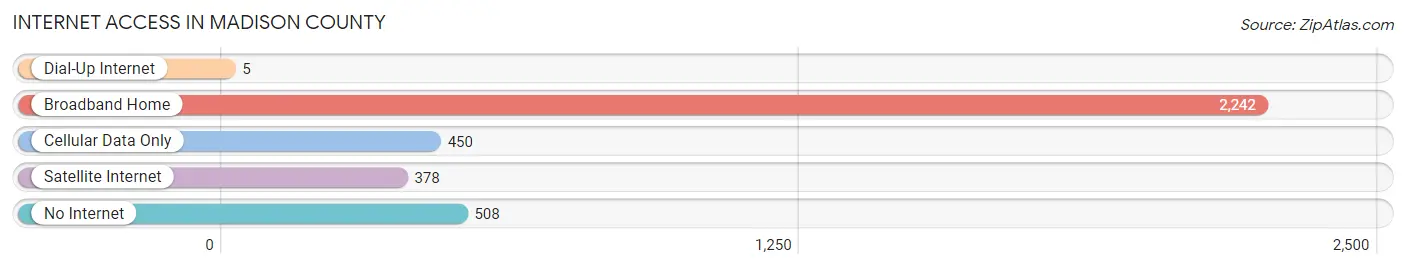
| Internet Type | # Households | % Households |
| Dial-Up Internet | 5 | 0.1% |
| Broadband Home | 2,242 | 63.0% |
| Cellular Data Only | 450 | 12.6% |
| Satellite Internet | 378 | 10.6% |
| No Internet | 508 | 14.3% |
| Total | 3,559 | 100.0% |
Madison County Summary
Madison County is located in the southwestern part of Montana, and is bordered by Beaverhead County to the north, Gallatin County to the east, and Idaho to the west. The county seat is Virginia City, and the largest city is Ennis. The county was established in 1865 and named after James Madison, the fourth President of the United States.
Geography
Madison County covers an area of 2,619 square miles, making it the fourth largest county in Montana. The county is located in the Rocky Mountains and is home to the Madison Range, which includes the highest peak in the state, Granite Peak. The county is also home to the Madison River, which is a popular destination for fishing and rafting. The county is mostly mountainous, with the majority of the land being used for ranching and farming.
Climate
Madison County has a semi-arid climate, with hot summers and cold winters. The average temperature in the summer is around 80°F, and the average temperature in the winter is around 20°F. The county receives an average of 16 inches of precipitation per year, with most of it falling in the form of snow.
Demographics
As of the 2010 census, Madison County had a population of 7,691. The population was spread out, with 37.2% under the age of 18, 8.2% from 18 to 24, 28.2% from 25 to 44, 20.2% from 45 to 64, and 6.2% who were 65 years of age or older. The median age was 34.4 years. The gender makeup of the county was 50.2% male and 49.8% female.
Economy
Madison County is largely rural and agricultural, with the majority of the population employed in the agricultural sector. The county is home to several large ranches, as well as several small farms. The county is also home to several small businesses, including restaurants, retail stores, and service providers. The county is also home to several tourist attractions, including the Madison River, the Madison Range, and the historic town of Virginia City.
The county is also home to several mining operations, including gold, silver, and copper. The county is also home to several energy companies, including wind and solar energy.
Conclusion
Madison County is a rural county located in the southwestern part of Montana. The county is home to the Madison Range, the Madison River, and the historic town of Virginia City. The county is largely agricultural, with the majority of the population employed in the agricultural sector. The county is also home to several small businesses, tourist attractions, and mining operations.
Common Questions
What is Per Capita Income in Madison County?
Per Capita income in Madison County is $40,358.
What is the Median Family Income in Madison County?
Median Family Income in Madison County is $72,652.
What is the Median Household income in Madison County?
Median Household Income in Madison County is $61,226.
What is Income or Wage Gap in Madison County?
Income or Wage Gap in Madison County is 39.7%.
Women in Madison County earn 60.3 cents for every dollar earned by a man.
What is Inequality or Gini Index in Madison County?
Inequality or Gini Index in Madison County is 0.42.
What is the Total Population of Madison County?
Total Population of Madison County is 8,742.
What is the Total Male Population of Madison County?
Total Male Population of Madison County is 4,593.
What is the Total Female Population of Madison County?
Total Female Population of Madison County is 4,149.
What is the Ratio of Males per 100 Females in Madison County?
There are 110.70 Males per 100 Females in Madison County.
What is the Ratio of Females per 100 Males in Madison County?
There are 90.33 Females per 100 Males in Madison County.
What is the Median Population Age in Madison County?
Median Population Age in Madison County is 54.3 Years.
What is the Average Family Size in Madison County
Average Family Size in Madison County is 3.0 People.
What is the Average Household Size in Madison County
Average Household Size in Madison County is 2.4 People.
How Large is the Labor Force in Madison County?
There are 4,172 People in the Labor Forcein in Madison County.
What is the Percentage of People in the Labor Force in Madison County?
54.8% of People are in the Labor Force in Madison County.
What is the Unemployment Rate in Madison County?
Unemployment Rate in Madison County is 2.3%.