Silver Bow County, MT Map & Demographics
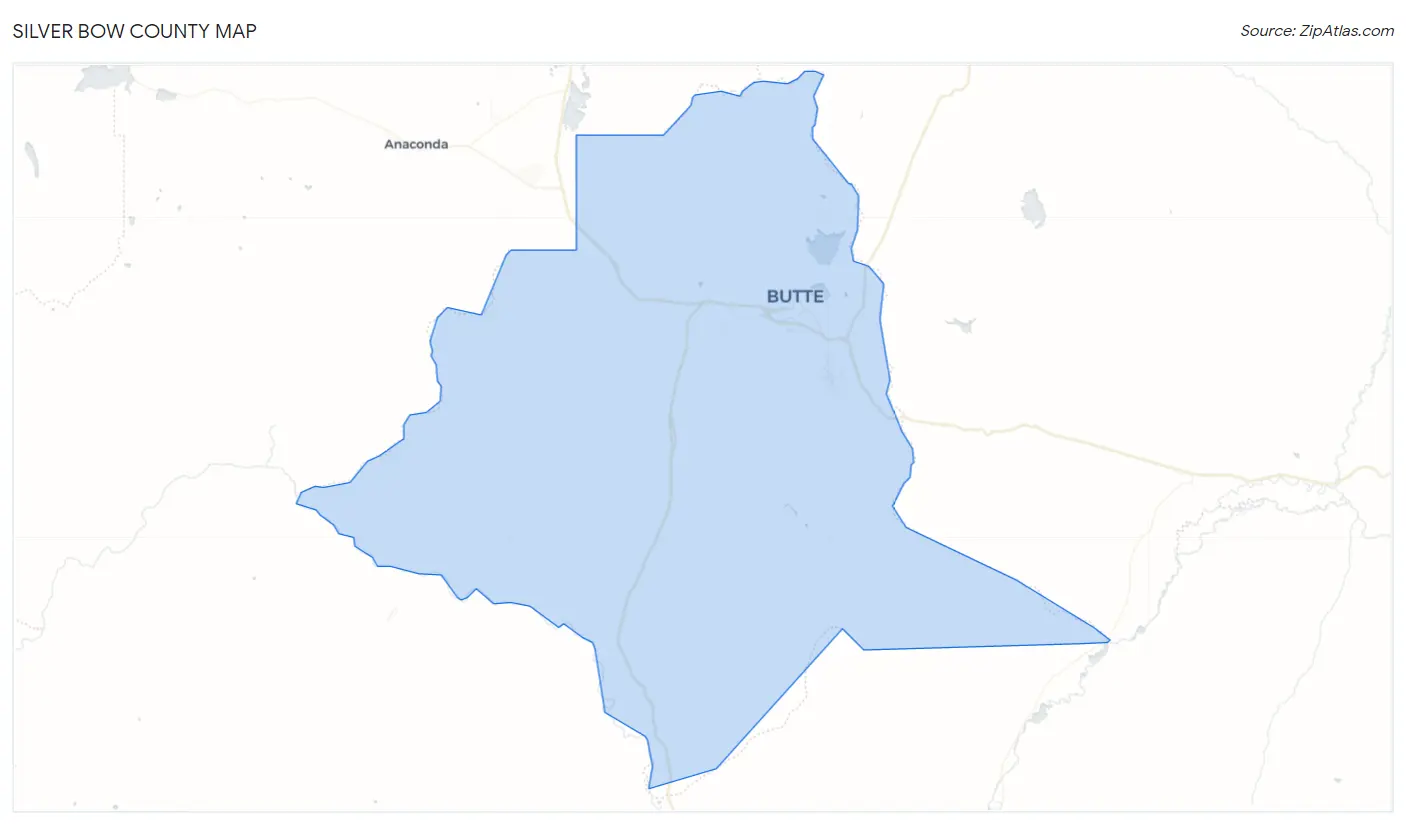
Silver Bow County Map
Silver Bow County Overview
$35,047
PER CAPITA INCOME
$74,509
AVG FAMILY INCOME
$56,297
AVG HOUSEHOLD INCOME
27.5%
WAGE / INCOME GAP [ % ]
72.5¢/ $1
WAGE / INCOME GAP [ $ ]
$10,687
FAMILY INCOME DEFICIT
0.50
INEQUALITY / GINI INDEX
35,306
TOTAL POPULATION
18,120
MALE POPULATION
17,186
FEMALE POPULATION
105.43
MALES / 100 FEMALES
94.85
FEMALES / 100 MALES
40.3
MEDIAN AGE
3.1
AVG FAMILY SIZE
2.2
AVG HOUSEHOLD SIZE
17,320
LABOR FORCE [ PEOPLE ]
60.1%
PERCENT IN LABOR FORCE
4.6%
UNEMPLOYMENT RATE
Silver Bow County Area Codes
Income in Silver Bow County
Income Overview in Silver Bow County
Per Capita Income in Silver Bow County is $35,047, while median incomes of families and households are $74,509 and $56,297 respectively.
| Characteristic | Number | Measure |
| Per Capita Income | 35,306 | $35,047 |
| Median Family Income | 8,076 | $74,509 |
| Mean Family Income | 8,076 | $104,767 |
| Median Household Income | 15,080 | $56,297 |
| Mean Household Income | 15,080 | $79,287 |
| Income Deficit | 8,076 | $10,687 |
| Wage / Income Gap (%) | 35,306 | 27.47% |
| Wage / Income Gap ($) | 35,306 | 72.53¢ per $1 |
| Gini / Inequality Index | 35,306 | 0.50 |
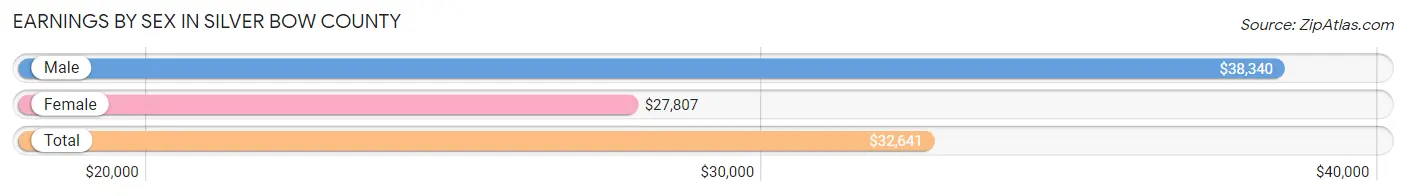
Earnings by Sex in Silver Bow County
Average Earnings in Silver Bow County are $32,641, $38,340 for men and $27,807 for women, a difference of 27.5%.
| Sex | Number | Average Earnings |
| Male | 10,212 (53.9%) | $38,340 |
| Female | 8,717 (46.1%) | $27,807 |
| Total | 18,929 (100.0%) | $32,641 |
Earnings by Sex by Income Bracket in Silver Bow County
The most common earnings brackets in Silver Bow County are $100,000+ for men (1,361 | 13.3%) and $25,000 to $29,999 for women (761 | 8.7%).
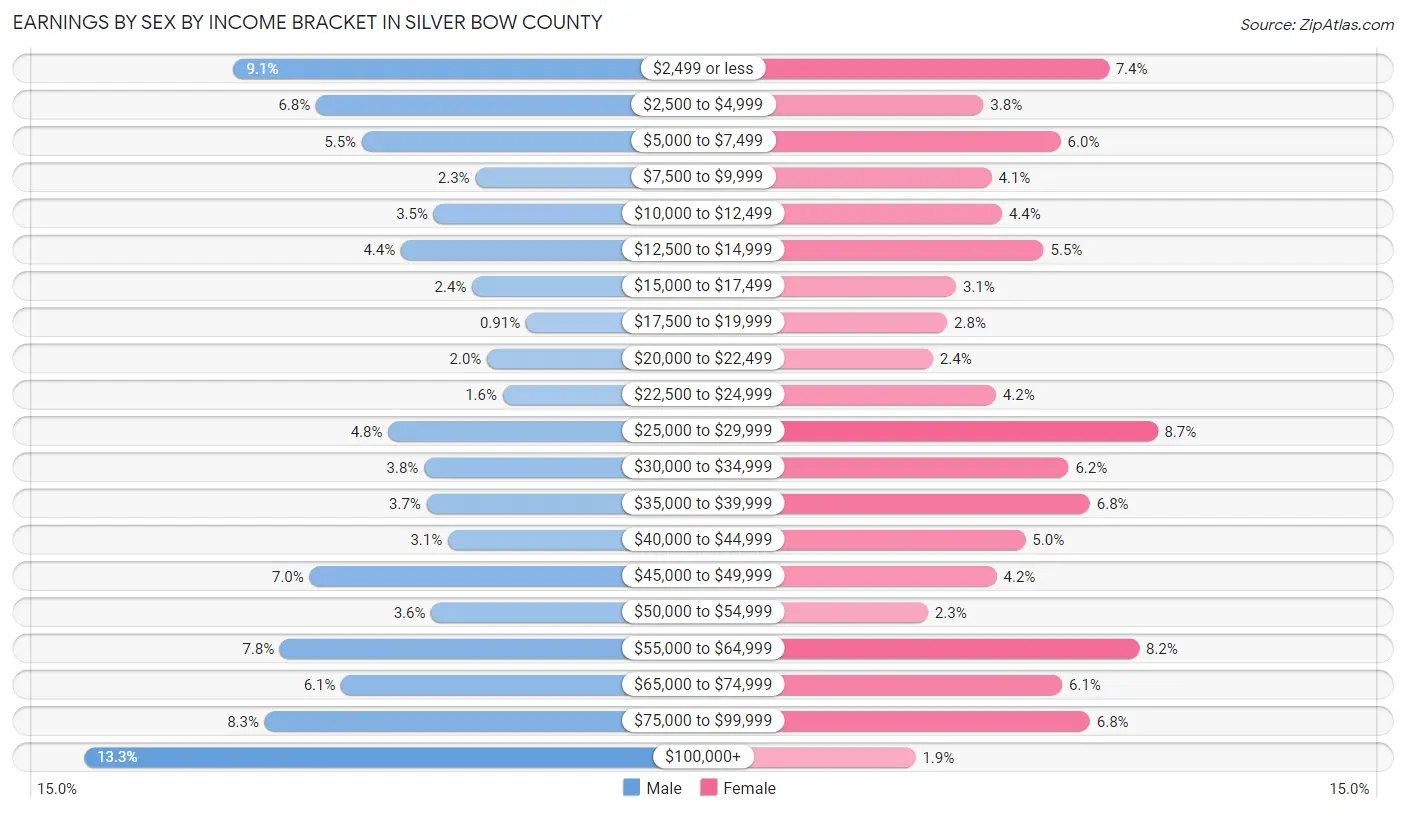
| Income | Male | Female |
| $2,499 or less | 932 (9.1%) | 642 (7.4%) |
| $2,500 to $4,999 | 695 (6.8%) | 335 (3.8%) |
| $5,000 to $7,499 | 564 (5.5%) | 524 (6.0%) |
| $7,500 to $9,999 | 238 (2.3%) | 355 (4.1%) |
| $10,000 to $12,499 | 357 (3.5%) | 380 (4.4%) |
| $12,500 to $14,999 | 451 (4.4%) | 482 (5.5%) |
| $15,000 to $17,499 | 247 (2.4%) | 268 (3.1%) |
| $17,500 to $19,999 | 93 (0.9%) | 246 (2.8%) |
| $20,000 to $22,499 | 204 (2.0%) | 211 (2.4%) |
| $22,500 to $24,999 | 159 (1.6%) | 365 (4.2%) |
| $25,000 to $29,999 | 488 (4.8%) | 761 (8.7%) |
| $30,000 to $34,999 | 385 (3.8%) | 543 (6.2%) |
| $35,000 to $39,999 | 378 (3.7%) | 595 (6.8%) |
| $40,000 to $44,999 | 317 (3.1%) | 438 (5.0%) |
| $45,000 to $49,999 | 714 (7.0%) | 367 (4.2%) |
| $50,000 to $54,999 | 365 (3.6%) | 199 (2.3%) |
| $55,000 to $64,999 | 799 (7.8%) | 716 (8.2%) |
| $65,000 to $74,999 | 623 (6.1%) | 527 (6.0%) |
| $75,000 to $99,999 | 842 (8.3%) | 595 (6.8%) |
| $100,000+ | 1,361 (13.3%) | 168 (1.9%) |
| Total | 10,212 (100.0%) | 8,717 (100.0%) |
Earnings by Sex by Educational Attainment in Silver Bow County
Average earnings in Silver Bow County are $48,139 for men and $33,159 for women, a difference of 31.1%. Men with an educational attainment of graduate degree enjoy the highest average annual earnings of $86,469, while those with high school diploma education earn the least with $39,800. Women with an educational attainment of graduate degree earn the most with the average annual earnings of $62,857, while those with less than high school education have the smallest earnings of $16,609.
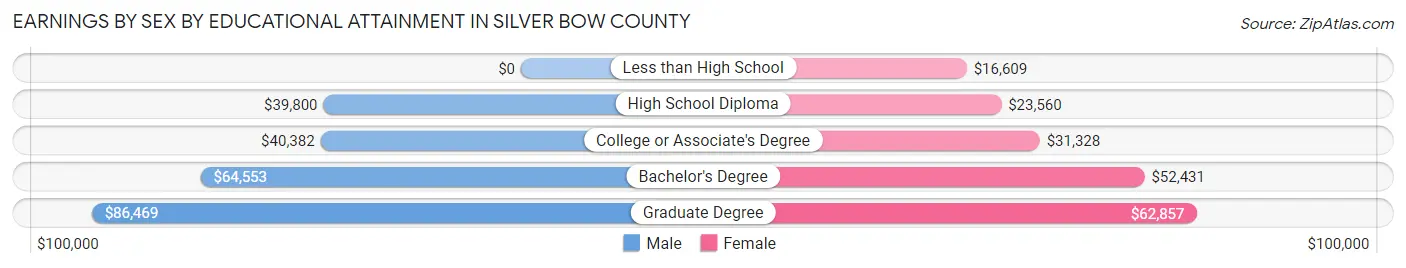
| Educational Attainment | Male Income | Female Income |
| Less than High School | - | - |
| High School Diploma | $39,800 | $23,560 |
| College or Associate's Degree | $40,382 | $31,328 |
| Bachelor's Degree | $64,553 | $52,431 |
| Graduate Degree | $86,469 | $62,857 |
| Total | $48,139 | $33,159 |
Family Income in Silver Bow County
Family Income Brackets in Silver Bow County
According to the Silver Bow County family income data, there are 1,793 families falling into the $50,000 to $74,999 income range, which is the most common income bracket and makes up 22.2% of all families. Conversely, the $10,000 to $14,999 income bracket is the least frequent group with only 153 families (1.9%) belonging to this category.
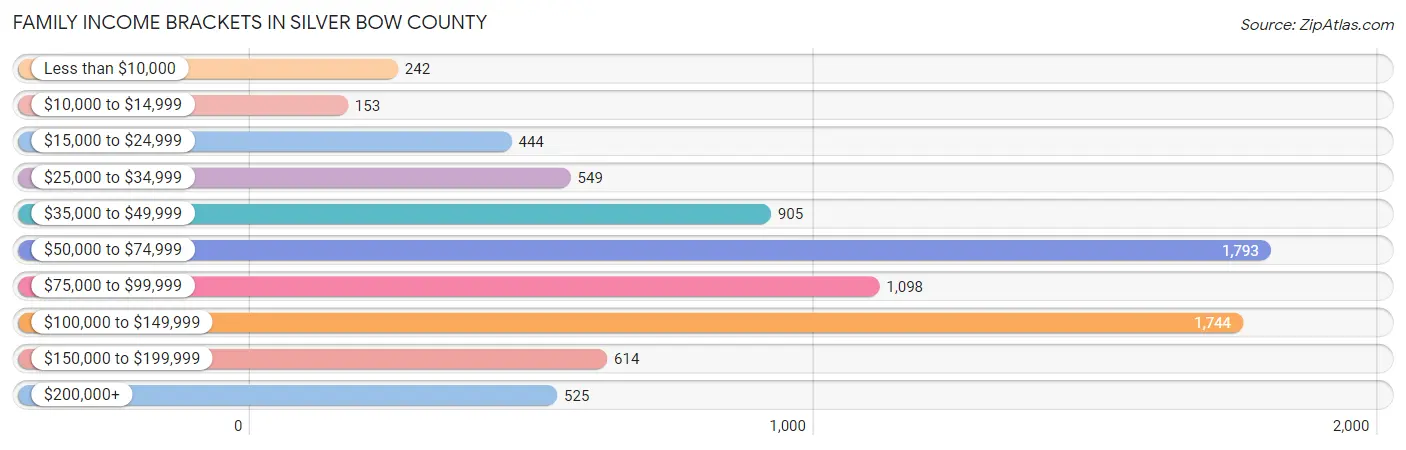
| Income Bracket | # Families | % Families |
| Less than $10,000 | 242 | 3.0% |
| $10,000 to $14,999 | 153 | 1.9% |
| $15,000 to $24,999 | 444 | 5.5% |
| $25,000 to $34,999 | 549 | 6.8% |
| $35,000 to $49,999 | 905 | 11.2% |
| $50,000 to $74,999 | 1,793 | 22.2% |
| $75,000 to $99,999 | 1,098 | 13.6% |
| $100,000 to $149,999 | 1,744 | 21.6% |
| $150,000 to $199,999 | 614 | 7.6% |
| $200,000+ | 525 | 6.5% |
Family Income by Famaliy Size in Silver Bow County
4-person families (1,543 | 19.1%) account for the highest median family income in Silver Bow County with $104,063 per family, while 2-person families (4,219 | 52.2%) have the highest median income of $33,956 per family member.
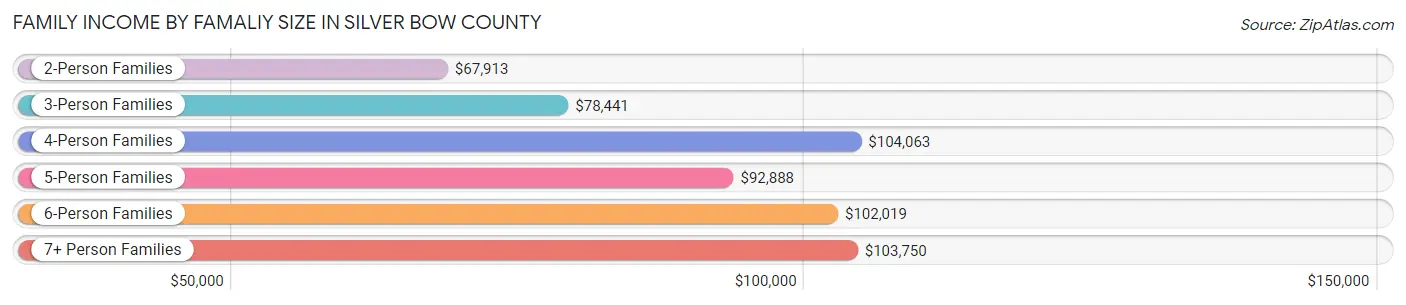
| Income Bracket | # Families | Median Income |
| 2-Person Families | 4,219 (52.2%) | $67,913 |
| 3-Person Families | 1,578 (19.5%) | $78,441 |
| 4-Person Families | 1,543 (19.1%) | $104,063 |
| 5-Person Families | 545 (6.8%) | $92,888 |
| 6-Person Families | 143 (1.8%) | $102,019 |
| 7+ Person Families | 48 (0.6%) | $103,750 |
| Total | 8,076 (100.0%) | $74,509 |
Family Income by Number of Earners in Silver Bow County
The median family income in Silver Bow County is $74,509, with families comprising 3+ earners (850) having the highest median family income of $132,727, while families with no earners (1,339) have the lowest median family income of $51,399, accounting for 10.5% and 16.6% of families, respectively.
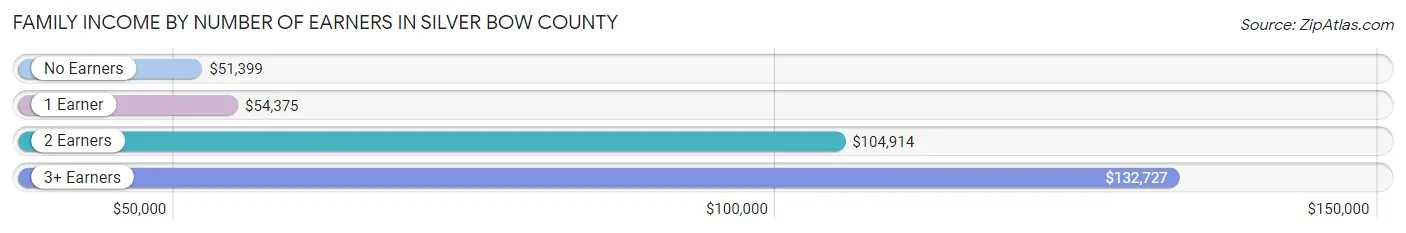
| Number of Earners | # Families | Median Income |
| No Earners | 1,339 (16.6%) | $51,399 |
| 1 Earner | 2,651 (32.8%) | $54,375 |
| 2 Earners | 3,236 (40.1%) | $104,914 |
| 3+ Earners | 850 (10.5%) | $132,727 |
| Total | 8,076 (100.0%) | $74,509 |
Household Income in Silver Bow County
Household Income Brackets in Silver Bow County
With 3,046 households falling in the category, the $50,000 to $74,999 income range is the most frequent in Silver Bow County, accounting for 20.2% of all households. In contrast, only 648 households (4.3%) fall into the $200,000+ income bracket, making it the least populous group.
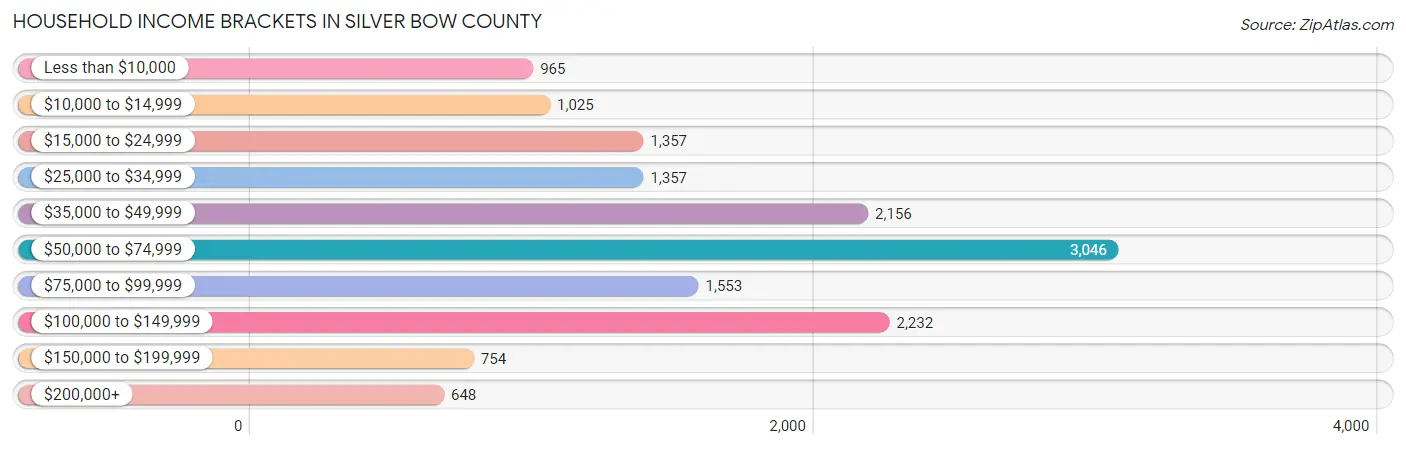
| Income Bracket | # Households | % Households |
| Less than $10,000 | 965 | 6.4% |
| $10,000 to $14,999 | 1,025 | 6.8% |
| $15,000 to $24,999 | 1,357 | 9.0% |
| $25,000 to $34,999 | 1,357 | 9.0% |
| $35,000 to $49,999 | 2,156 | 14.3% |
| $50,000 to $74,999 | 3,046 | 20.2% |
| $75,000 to $99,999 | 1,553 | 10.3% |
| $100,000 to $149,999 | 2,232 | 14.8% |
| $150,000 to $199,999 | 754 | 5.0% |
| $200,000+ | 648 | 4.3% |
Household Income by Householder Age in Silver Bow County
The median household income in Silver Bow County is $56,297, with the highest median household income of $70,050 found in the 45 to 64 years age bracket for the primary householder. A total of 5,271 households (34.9%) fall into this category. Meanwhile, the 15 to 24 years age bracket for the primary householder has the lowest median household income of $39,563, with 958 households (6.4%) in this group.
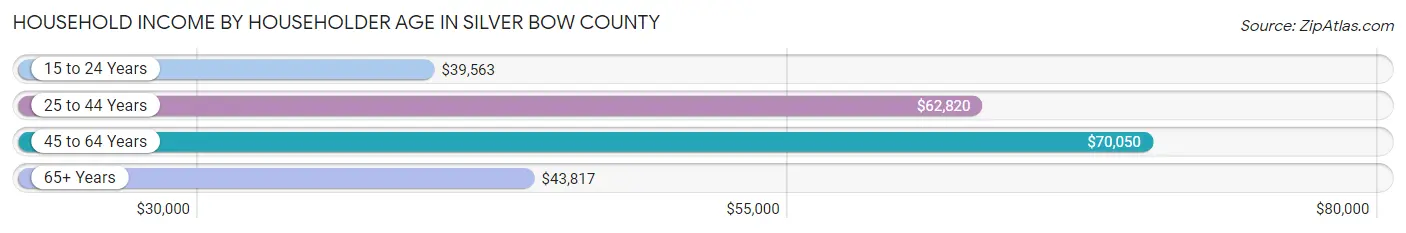
| Income Bracket | # Households | Median Income |
| 15 to 24 Years | 958 (6.4%) | $39,563 |
| 25 to 44 Years | 4,229 (28.0%) | $62,820 |
| 45 to 64 Years | 5,271 (34.9%) | $70,050 |
| 65+ Years | 4,622 (30.6%) | $43,817 |
| Total | 15,080 (100.0%) | $56,297 |
Poverty in Silver Bow County
Income Below Poverty by Sex and Age in Silver Bow County
With 15.6% poverty level for males and 16.2% for females among the residents of Silver Bow County, 5 year old males and 5 year old females are the most vulnerable to poverty, with 59 males (42.7%) and 26 females (60.5%) in their respective age groups living below the poverty level.
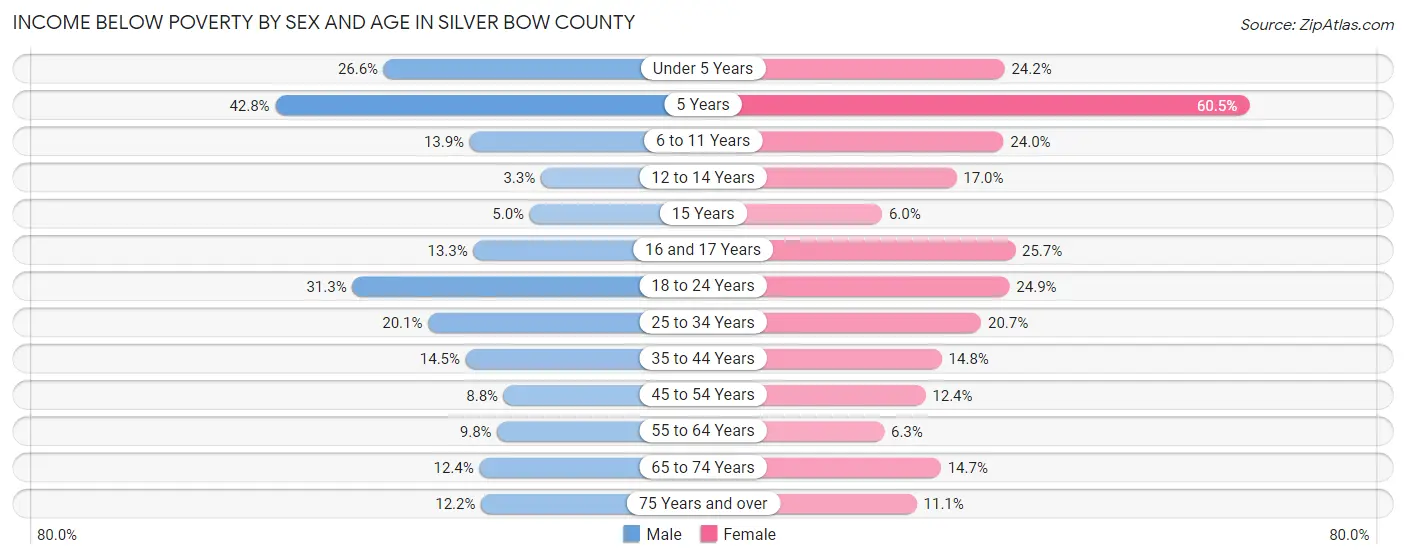
| Age Bracket | Male | Female |
| Under 5 Years | 280 (26.6%) | 217 (24.2%) |
| 5 Years | 59 (42.7%) | 26 (60.5%) |
| 6 to 11 Years | 161 (13.9%) | 299 (24.0%) |
| 12 to 14 Years | 23 (3.3%) | 98 (17.0%) |
| 15 Years | 14 (5.0%) | 13 (6.0%) |
| 16 and 17 Years | 40 (13.3%) | 89 (25.7%) |
| 18 to 24 Years | 604 (31.3%) | 409 (24.9%) |
| 25 to 34 Years | 443 (20.1%) | 424 (20.7%) |
| 35 to 44 Years | 316 (14.5%) | 278 (14.8%) |
| 45 to 54 Years | 182 (8.8%) | 232 (12.4%) |
| 55 to 64 Years | 239 (9.8%) | 150 (6.3%) |
| 65 to 74 Years | 247 (12.4%) | 304 (14.7%) |
| 75 Years and over | 136 (12.2%) | 155 (11.1%) |
| Total | 2,744 (15.6%) | 2,694 (16.2%) |
Income Above Poverty by Sex and Age in Silver Bow County
According to the poverty statistics in Silver Bow County, males aged 12 to 14 years and females aged 15 years are the age groups that are most secure financially, with 96.7% of males and 94.0% of females in these age groups living above the poverty line.
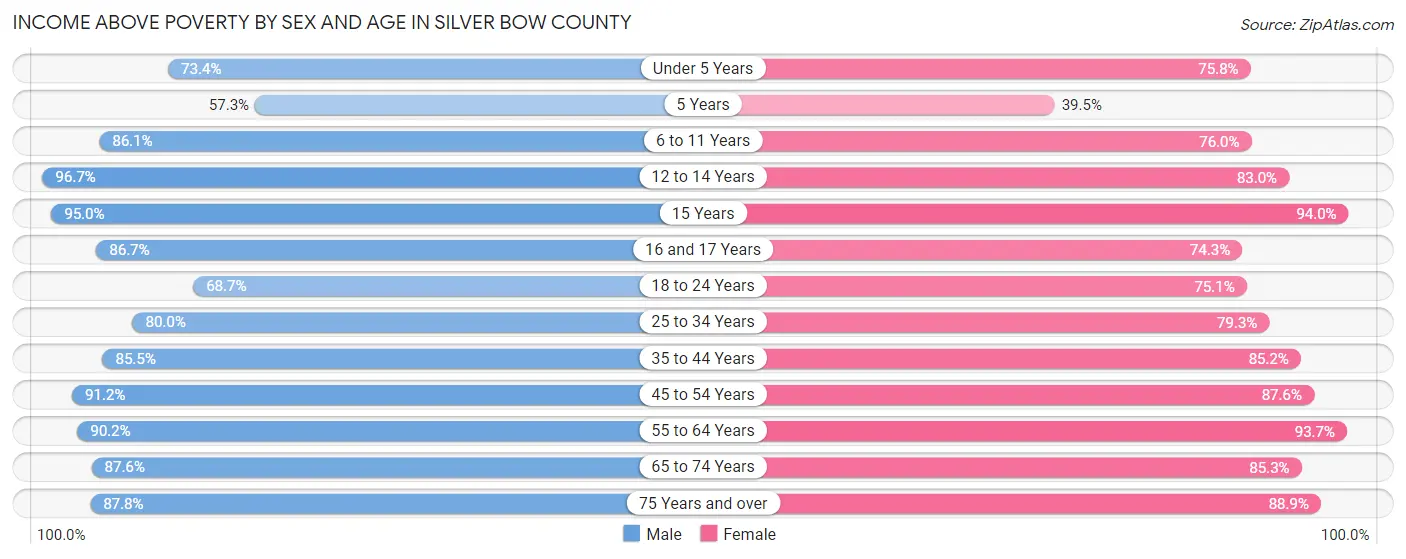
| Age Bracket | Male | Female |
| Under 5 Years | 771 (73.4%) | 681 (75.8%) |
| 5 Years | 79 (57.3%) | 17 (39.5%) |
| 6 to 11 Years | 1,000 (86.1%) | 947 (76.0%) |
| 12 to 14 Years | 671 (96.7%) | 478 (83.0%) |
| 15 Years | 268 (95.0%) | 205 (94.0%) |
| 16 and 17 Years | 260 (86.7%) | 257 (74.3%) |
| 18 to 24 Years | 1,325 (68.7%) | 1,234 (75.1%) |
| 25 to 34 Years | 1,767 (79.9%) | 1,626 (79.3%) |
| 35 to 44 Years | 1,866 (85.5%) | 1,597 (85.2%) |
| 45 to 54 Years | 1,882 (91.2%) | 1,638 (87.6%) |
| 55 to 64 Years | 2,202 (90.2%) | 2,243 (93.7%) |
| 65 to 74 Years | 1,739 (87.6%) | 1,766 (85.3%) |
| 75 Years and over | 981 (87.8%) | 1,240 (88.9%) |
| Total | 14,811 (84.4%) | 13,929 (83.8%) |
Income Below Poverty Among Married-Couple Families in Silver Bow County
The poverty statistics for married-couple families in Silver Bow County show that 3.5% or 215 of the total 6,186 families live below the poverty line. Families with 3 or 4 children have the highest poverty rate of 5.6%, comprising of 25 families. On the other hand, families with 5 or more children have the lowest poverty rate of 0.0%, which includes 0 families.
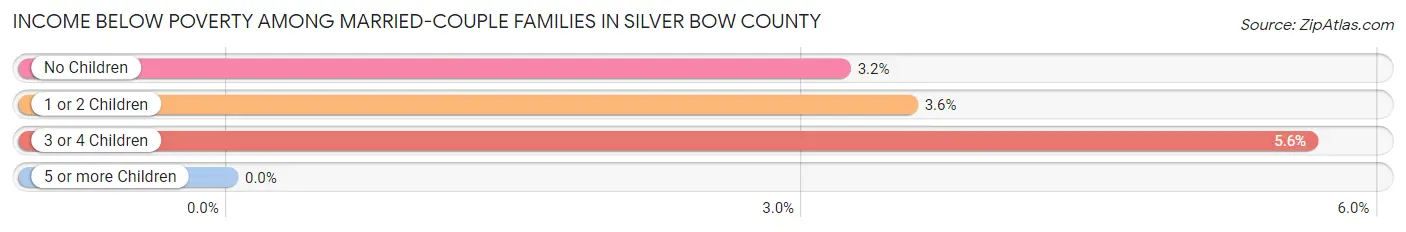
| Children | Above Poverty | Below Poverty |
| No Children | 3,783 (96.8%) | 125 (3.2%) |
| 1 or 2 Children | 1,768 (96.5%) | 65 (3.5%) |
| 3 or 4 Children | 418 (94.4%) | 25 (5.6%) |
| 5 or more Children | 2 (100.0%) | 0 (0.0%) |
| Total | 5,971 (96.5%) | 215 (3.5%) |
Income Below Poverty Among Single-Parent Households in Silver Bow County
According to the poverty data in Silver Bow County, 22.5% or 156 single-father households and 28.6% or 343 single-mother households are living below the poverty line. Among single-father households, those with 1 or 2 children have the highest poverty rate, with 117 households (42.7%) experiencing poverty. Likewise, among single-mother households, those with 3 or 4 children have the highest poverty rate, with 114 households (63.0%) falling below the poverty line.
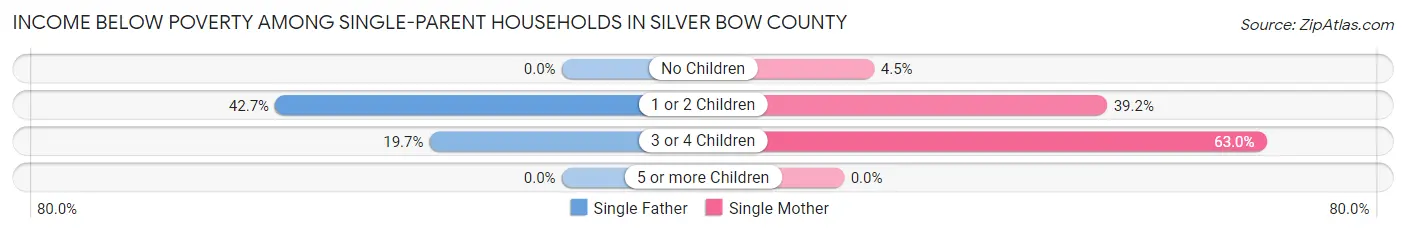
| Children | Single Father | Single Mother |
| No Children | 0 (0.0%) | 22 (4.5%) |
| 1 or 2 Children | 117 (42.7%) | 207 (39.2%) |
| 3 or 4 Children | 39 (19.7%) | 114 (63.0%) |
| 5 or more Children | 0 (0.0%) | 0 (0.0%) |
| Total | 156 (22.5%) | 343 (28.6%) |
Income Below Poverty Among Married-Couple vs Single-Parent Households in Silver Bow County
The poverty data for Silver Bow County shows that 215 of the married-couple family households (3.5%) and 499 of the single-parent households (26.4%) are living below the poverty level. Within the married-couple family households, those with 3 or 4 children have the highest poverty rate, with 25 households (5.6%) falling below the poverty line. Among the single-parent households, those with 1 or 2 children have the highest poverty rate, with 324 household (40.4%) living below poverty.
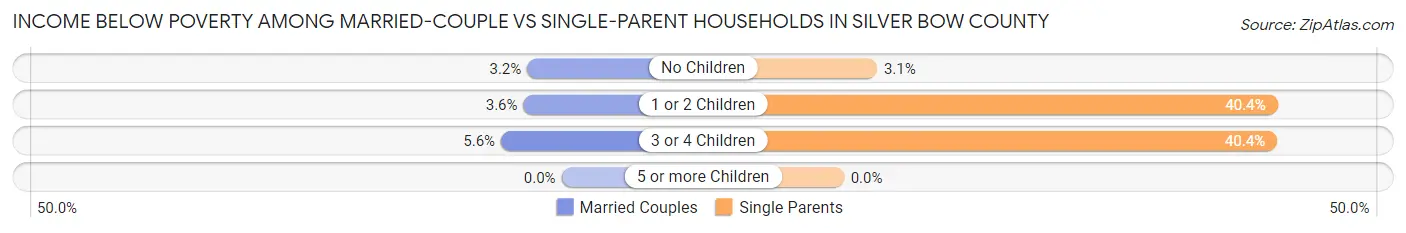
| Children | Married-Couple Families | Single-Parent Households |
| No Children | 125 (3.2%) | 22 (3.1%) |
| 1 or 2 Children | 65 (3.5%) | 324 (40.4%) |
| 3 or 4 Children | 25 (5.6%) | 153 (40.4%) |
| 5 or more Children | 0 (0.0%) | 0 (0.0%) |
| Total | 215 (3.5%) | 499 (26.4%) |
Race in Silver Bow County
The most populous races in Silver Bow County are White / Caucasian (32,662 | 92.5%), Hispanic or Latino (1,636 | 4.6%), and Two or more Races (1,572 | 4.4%).
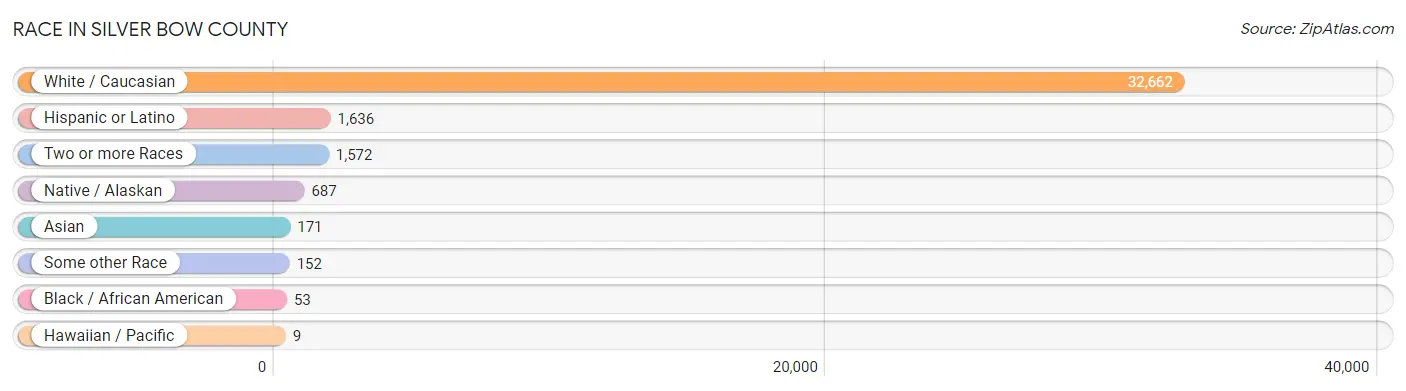
| Race | # Population | % Population |
| Asian | 171 | 0.5% |
| Black / African American | 53 | 0.2% |
| Hawaiian / Pacific | 9 | 0.0% |
| Hispanic or Latino | 1,636 | 4.6% |
| Native / Alaskan | 687 | 1.9% |
| White / Caucasian | 32,662 | 92.5% |
| Two or more Races | 1,572 | 4.4% |
| Some other Race | 152 | 0.4% |
| Total | 35,306 | 100.0% |
Ancestry in Silver Bow County
The most populous ancestries reported in Silver Bow County are Irish (8,968 | 25.4%), German (6,910 | 19.6%), English (3,836 | 10.9%), Italian (2,285 | 6.5%), and Norwegian (1,379 | 3.9%), together accounting for 66.2% of all Silver Bow County residents.
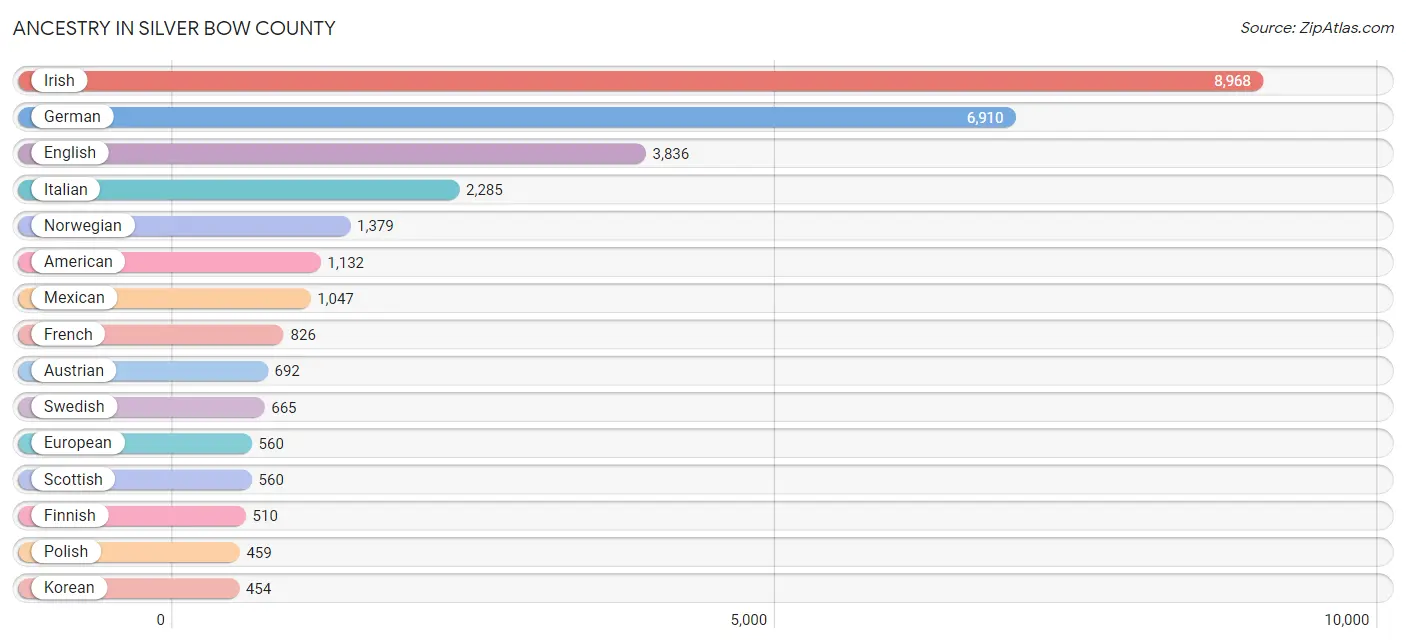
| Ancestry | # Population | % Population |
| African | 13 | 0.0% |
| American | 1,132 | 3.2% |
| Apache | 8 | 0.0% |
| Arab | 236 | 0.7% |
| Armenian | 17 | 0.1% |
| Austrian | 692 | 2.0% |
| Basque | 3 | 0.0% |
| Belgian | 34 | 0.1% |
| Bhutanese | 65 | 0.2% |
| Blackfeet | 210 | 0.6% |
| British | 172 | 0.5% |
| Bulgarian | 7 | 0.0% |
| Burmese | 63 | 0.2% |
| Canadian | 49 | 0.1% |
| Celtic | 1 | 0.0% |
| Central American | 70 | 0.2% |
| Cherokee | 79 | 0.2% |
| Cheyenne | 68 | 0.2% |
| Chippewa | 97 | 0.3% |
| Choctaw | 36 | 0.1% |
| Cree | 102 | 0.3% |
| Creek | 27 | 0.1% |
| Croatian | 227 | 0.6% |
| Cuban | 48 | 0.1% |
| Czech | 152 | 0.4% |
| Danish | 290 | 0.8% |
| Dominican | 5 | 0.0% |
| Dutch | 418 | 1.2% |
| Eastern European | 15 | 0.0% |
| English | 3,836 | 10.9% |
| European | 560 | 1.6% |
| Finnish | 510 | 1.4% |
| French | 826 | 2.3% |
| French Canadian | 314 | 0.9% |
| German | 6,910 | 19.6% |
| German Russian | 11 | 0.0% |
| Greek | 53 | 0.2% |
| Honduran | 6 | 0.0% |
| Hungarian | 64 | 0.2% |
| Indian (Asian) | 45 | 0.1% |
| Iranian | 2 | 0.0% |
| Irish | 8,968 | 25.4% |
| Iroquois | 17 | 0.1% |
| Italian | 2,285 | 6.5% |
| Korean | 454 | 1.3% |
| Lebanese | 121 | 0.3% |
| Lithuanian | 28 | 0.1% |
| Mexican | 1,047 | 3.0% |
| Native Hawaiian | 78 | 0.2% |
| Navajo | 10 | 0.0% |
| Northern European | 212 | 0.6% |
| Norwegian | 1,379 | 3.9% |
| Pakistani | 32 | 0.1% |
| Panamanian | 64 | 0.2% |
| Polish | 459 | 1.3% |
| Portuguese | 35 | 0.1% |
| Puerto Rican | 10 | 0.0% |
| Russian | 56 | 0.2% |
| Samoan | 4 | 0.0% |
| Scandinavian | 223 | 0.6% |
| Scotch-Irish | 265 | 0.7% |
| Scottish | 560 | 1.6% |
| Serbian | 63 | 0.2% |
| Shoshone | 64 | 0.2% |
| Sioux | 11 | 0.0% |
| Slavic | 223 | 0.6% |
| Slovak | 162 | 0.5% |
| Slovene | 89 | 0.3% |
| Spaniard | 52 | 0.2% |
| Spanish | 213 | 0.6% |
| Sri Lankan | 2 | 0.0% |
| Subsaharan African | 13 | 0.0% |
| Swedish | 665 | 1.9% |
| Swiss | 52 | 0.2% |
| Turkish | 26 | 0.1% |
| Ukrainian | 54 | 0.2% |
| Welsh | 357 | 1.0% |
| Yugoslavian | 353 | 1.0% | View All 78 Rows |
Immigrants in Silver Bow County
The most numerous immigrant groups reported in Silver Bow County came from Asia (334 | 0.9%), Western Asia (251 | 0.7%), Kuwait (110 | 0.3%), Europe (97 | 0.3%), and Saudi Arabia (94 | 0.3%), together accounting for 2.5% of all Silver Bow County residents.
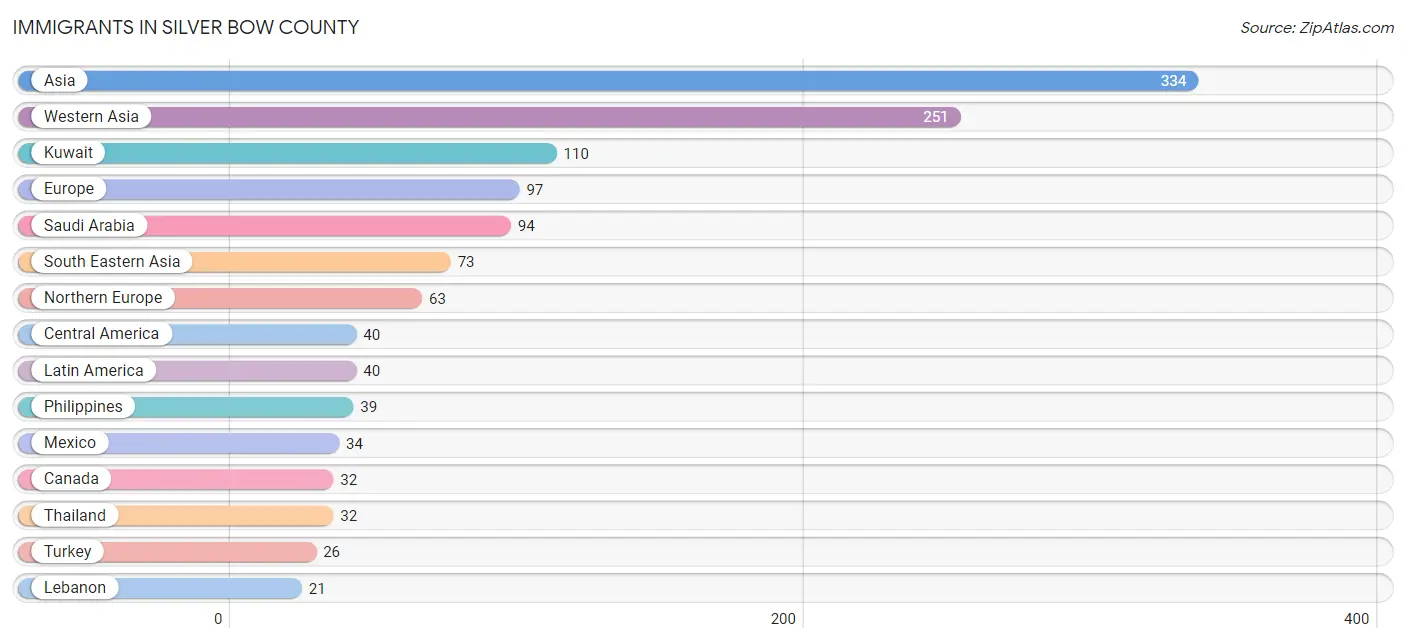
| Immigration Origin | # Population | % Population |
| Africa | 13 | 0.0% |
| Asia | 334 | 0.9% |
| Canada | 32 | 0.1% |
| Central America | 40 | 0.1% |
| Croatia | 8 | 0.0% |
| Eastern Asia | 7 | 0.0% |
| Eastern Europe | 15 | 0.0% |
| Europe | 97 | 0.3% |
| France | 19 | 0.1% |
| Ghana | 13 | 0.0% |
| Honduras | 6 | 0.0% |
| India | 1 | 0.0% |
| Iran | 2 | 0.0% |
| Korea | 7 | 0.0% |
| Kuwait | 110 | 0.3% |
| Latin America | 40 | 0.1% |
| Lebanon | 21 | 0.1% |
| Mexico | 34 | 0.1% |
| Northern Europe | 63 | 0.2% |
| Philippines | 39 | 0.1% |
| Russia | 7 | 0.0% |
| Saudi Arabia | 94 | 0.3% |
| Scotland | 10 | 0.0% |
| South Central Asia | 3 | 0.0% |
| South Eastern Asia | 73 | 0.2% |
| Thailand | 32 | 0.1% |
| Turkey | 26 | 0.1% |
| Vietnam | 2 | 0.0% |
| Western Africa | 13 | 0.0% |
| Western Asia | 251 | 0.7% |
| Western Europe | 19 | 0.1% | View All 31 Rows |
Sex and Age in Silver Bow County
Sex and Age in Silver Bow County
The most populous age groups in Silver Bow County are 20 to 24 Years (1,604 | 8.8%) for men and 60 to 64 Years (1,349 | 7.9%) for women.
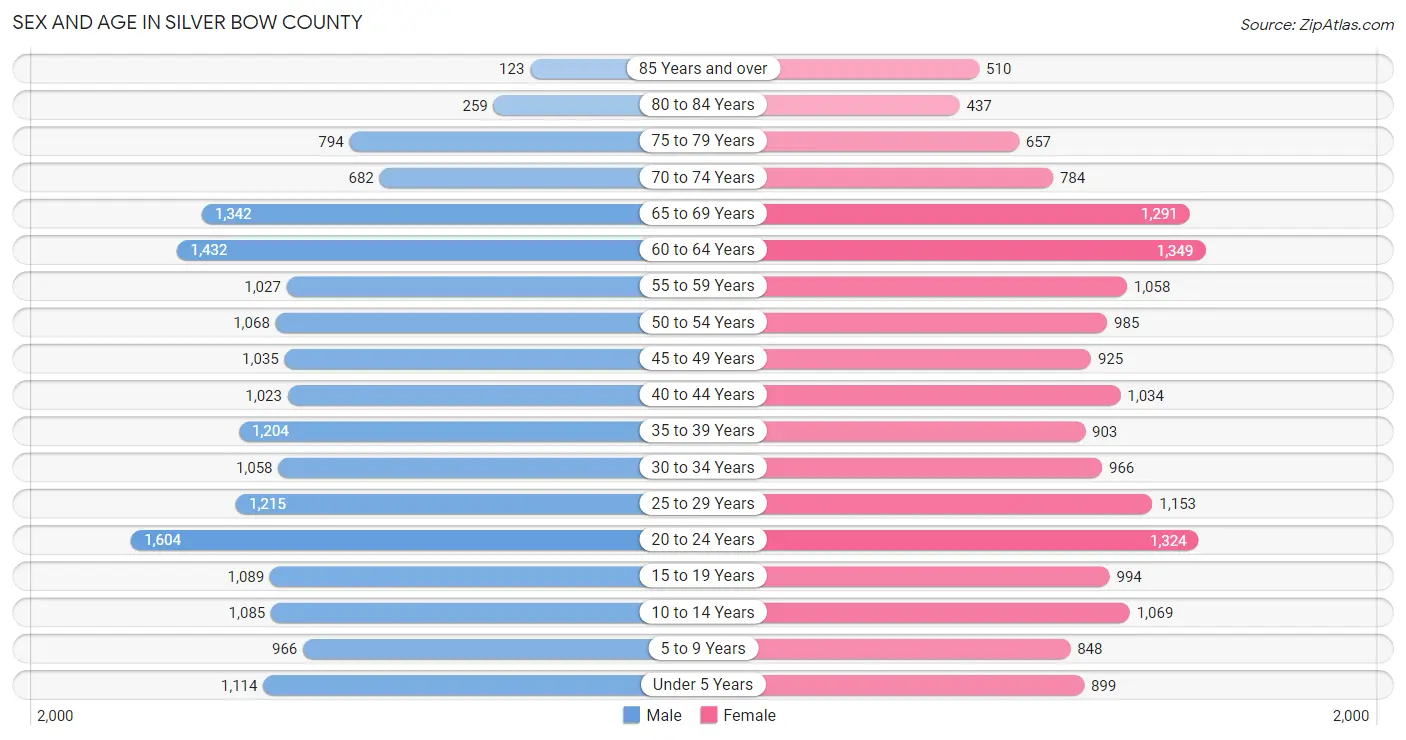
| Age Bracket | Male | Female |
| Under 5 Years | 1,114 (6.1%) | 899 (5.2%) |
| 5 to 9 Years | 966 (5.3%) | 848 (4.9%) |
| 10 to 14 Years | 1,085 (6.0%) | 1,069 (6.2%) |
| 15 to 19 Years | 1,089 (6.0%) | 994 (5.8%) |
| 20 to 24 Years | 1,604 (8.8%) | 1,324 (7.7%) |
| 25 to 29 Years | 1,215 (6.7%) | 1,153 (6.7%) |
| 30 to 34 Years | 1,058 (5.8%) | 966 (5.6%) |
| 35 to 39 Years | 1,204 (6.6%) | 903 (5.2%) |
| 40 to 44 Years | 1,023 (5.7%) | 1,034 (6.0%) |
| 45 to 49 Years | 1,035 (5.7%) | 925 (5.4%) |
| 50 to 54 Years | 1,068 (5.9%) | 985 (5.7%) |
| 55 to 59 Years | 1,027 (5.7%) | 1,058 (6.2%) |
| 60 to 64 Years | 1,432 (7.9%) | 1,349 (7.9%) |
| 65 to 69 Years | 1,342 (7.4%) | 1,291 (7.5%) |
| 70 to 74 Years | 682 (3.8%) | 784 (4.6%) |
| 75 to 79 Years | 794 (4.4%) | 657 (3.8%) |
| 80 to 84 Years | 259 (1.4%) | 437 (2.5%) |
| 85 Years and over | 123 (0.7%) | 510 (3.0%) |
| Total | 18,120 (100.0%) | 17,186 (100.0%) |
Families and Households in Silver Bow County
Median Family Size in Silver Bow County
The median family size in Silver Bow County is 3.09 persons per family, with single female/mother families (1,198 | 14.8%) accounting for the largest median family size of 3.37 persons per family. On the other hand, single male/father families (692 | 8.6%) represent the smallest median family size with 2.99 persons per family.
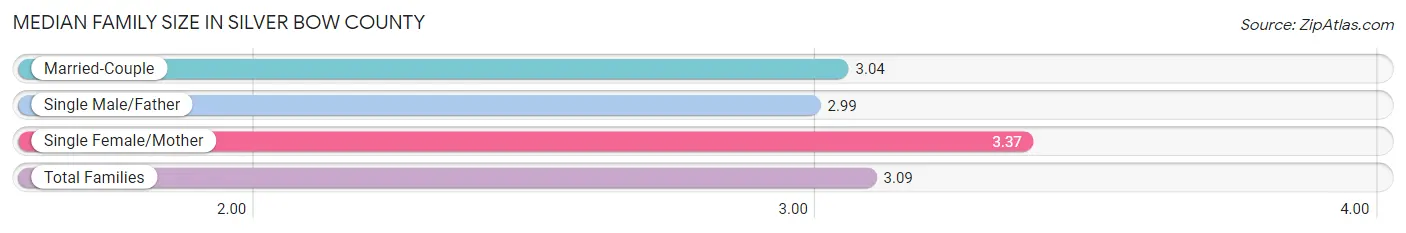
| Family Type | # Families | Family Size |
| Married-Couple | 6,186 (76.6%) | 3.04 |
| Single Male/Father | 692 (8.6%) | 2.99 |
| Single Female/Mother | 1,198 (14.8%) | 3.37 |
| Total Families | 8,076 (100.0%) | 3.09 |
Median Household Size in Silver Bow County
The median household size in Silver Bow County is 2.25 persons per household, with single female/mother households (1,198 | 7.9%) accounting for the largest median household size of 3.55 persons per household. non-family households (7,004 | 46.5%) represent the smallest median household size with 1.22 persons per household.
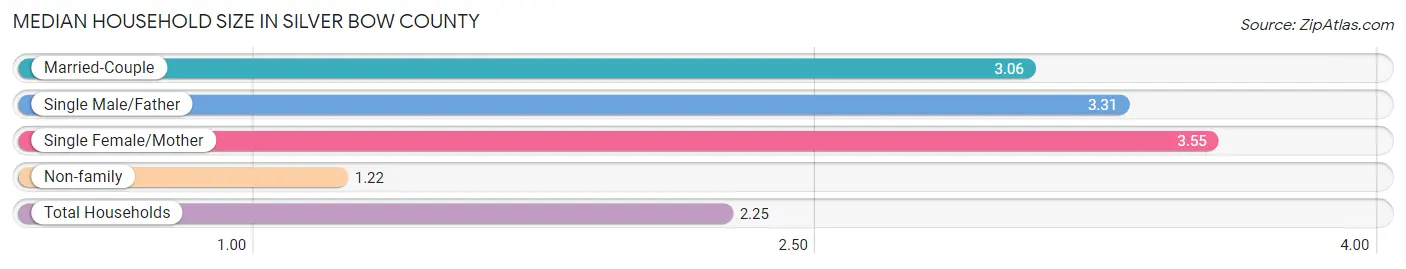
| Household Type | # Households | Household Size |
| Married-Couple | 6,186 (41.0%) | 3.06 |
| Single Male/Father | 692 (4.6%) | 3.31 |
| Single Female/Mother | 1,198 (7.9%) | 3.55 |
| Non-family | 7,004 (46.5%) | 1.22 |
| Total Households | 15,080 (100.0%) | 2.25 |
Household Size by Marriage Status in Silver Bow County
Out of a total of 15,080 households in Silver Bow County, 8,076 (53.5%) are family households, while 7,004 (46.5%) are nonfamily households. The most numerous type of family households are 2-person households, comprising 4,071, and the most common type of nonfamily households are 1-person households, comprising 5,946.
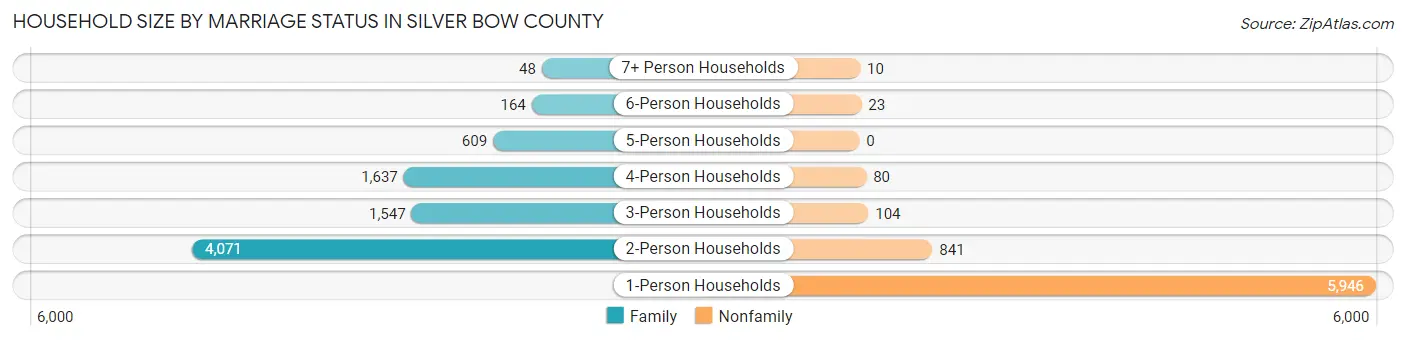
| Household Size | Family Households | Nonfamily Households |
| 1-Person Households | - | 5,946 (39.4%) |
| 2-Person Households | 4,071 (27.0%) | 841 (5.6%) |
| 3-Person Households | 1,547 (10.3%) | 104 (0.7%) |
| 4-Person Households | 1,637 (10.9%) | 80 (0.5%) |
| 5-Person Households | 609 (4.0%) | 0 (0.0%) |
| 6-Person Households | 164 (1.1%) | 23 (0.2%) |
| 7+ Person Households | 48 (0.3%) | 10 (0.1%) |
| Total | 8,076 (53.5%) | 7,004 (46.5%) |
Female Fertility in Silver Bow County
Fertility by Age in Silver Bow County
Average fertility rate in Silver Bow County is 29.0 births per 1,000 women. Women in the age bracket of 20 to 34 years have the highest fertility rate with 46.0 births per 1,000 women. Women in the age bracket of 20 to 34 years acount for 72.6% of all women with births.
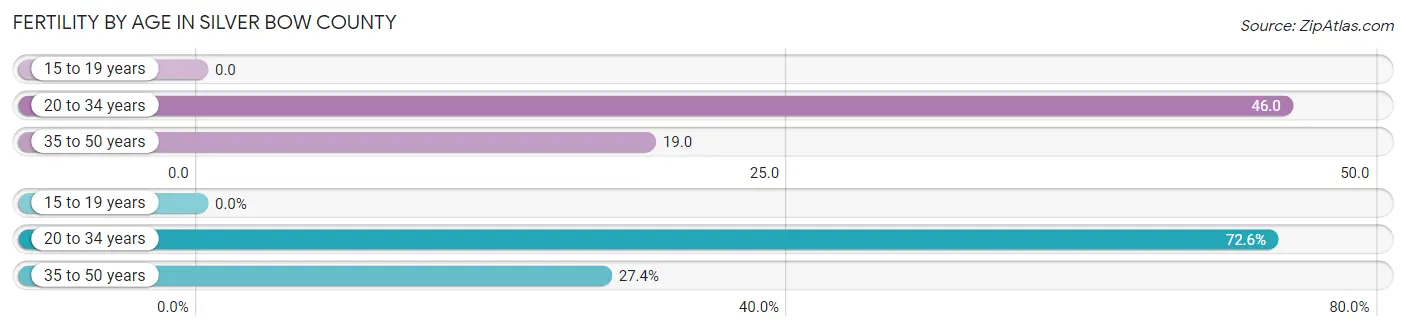
| Age Bracket | Women with Births | Births / 1,000 Women |
| 15 to 19 years | 0 (0.0%) | 0.0 |
| 20 to 34 years | 159 (72.6%) | 46.0 |
| 35 to 50 years | 60 (27.4%) | 19.0 |
| Total | 219 (100.0%) | 29.0 |
Fertility by Age by Marriage Status in Silver Bow County
67.1% of women with births (219) in Silver Bow County are married. The highest percentage of unmarried women with births falls into 35 to 50 years age bracket with 33.3% of them unmarried at the time of birth, while the lowest percentage of unmarried women with births belong to 20 to 34 years age bracket with 32.7% of them unmarried.
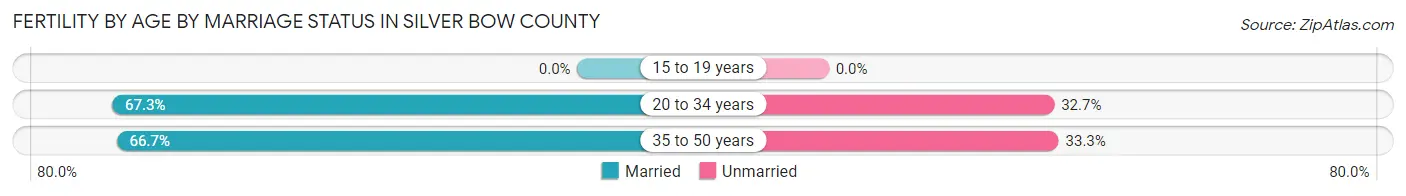
| Age Bracket | Married | Unmarried |
| 15 to 19 years | 0 (0.0%) | 0 (0.0%) |
| 20 to 34 years | 107 (67.3%) | 52 (32.7%) |
| 35 to 50 years | 40 (66.7%) | 20 (33.3%) |
| Total | 147 (67.1%) | 72 (32.9%) |
Fertility by Education in Silver Bow County
Average fertility rate in Silver Bow County is 29.0 births per 1,000 women. Women with the education attainment of graduate degree have the highest fertility rate of 61.0 births per 1,000 women, while women with the education attainment of less than high school have the lowest fertility at 4.0 births per 1,000 women. Women with the education attainment of high school diploma represent 45.2% of all women with births.
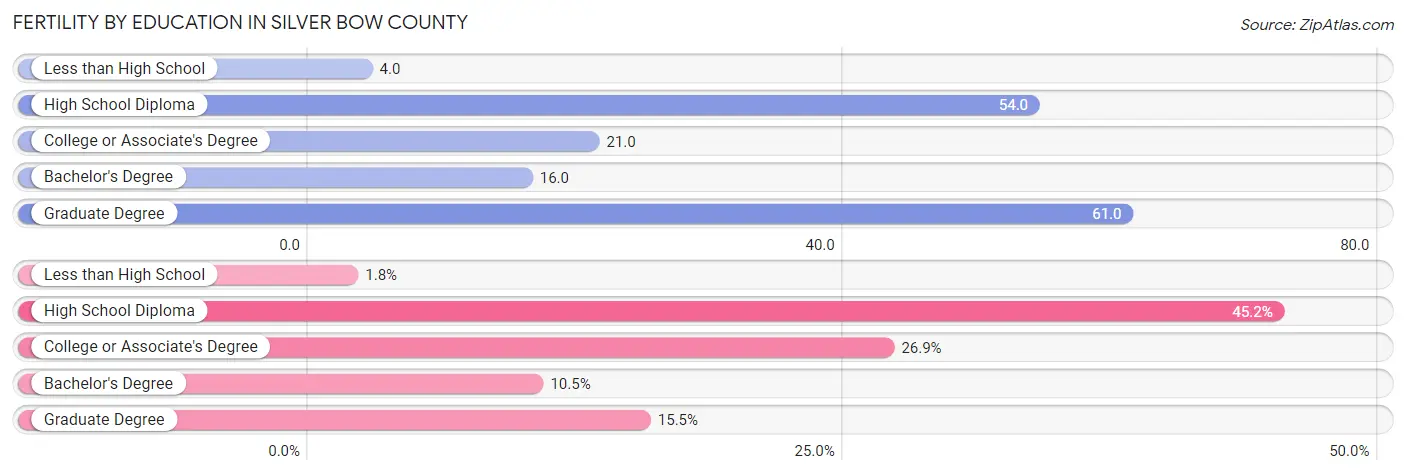
| Educational Attainment | Women with Births | Births / 1,000 Women |
| Less than High School | 4 (1.8%) | 4.0 |
| High School Diploma | 99 (45.2%) | 54.0 |
| College or Associate's Degree | 59 (26.9%) | 21.0 |
| Bachelor's Degree | 23 (10.5%) | 16.0 |
| Graduate Degree | 34 (15.5%) | 61.0 |
| Total | 219 (100.0%) | 29.0 |
Fertility by Education by Marriage Status in Silver Bow County
32.9% of women with births in Silver Bow County are unmarried. Women with the educational attainment of bachelor's degree are most likely to be married with 100.0% of them married at childbirth, while women with the educational attainment of less than high school are least likely to be married with 100.0% of them unmarried at childbirth.
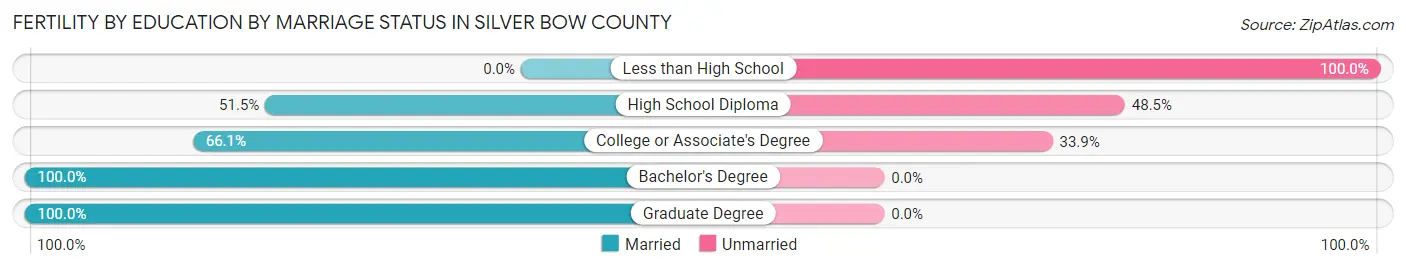
| Educational Attainment | Married | Unmarried |
| Less than High School | 0 (0.0%) | 4 (100.0%) |
| High School Diploma | 51 (51.5%) | 48 (48.5%) |
| College or Associate's Degree | 39 (66.1%) | 20 (33.9%) |
| Bachelor's Degree | 23 (100.0%) | 0 (0.0%) |
| Graduate Degree | 34 (100.0%) | 0 (0.0%) |
| Total | 147 (67.1%) | 72 (32.9%) |
Employment Characteristics in Silver Bow County
Employment by Class of Employer in Silver Bow County
Among the 16,296 employed individuals in Silver Bow County, private company employees (9,685 | 59.4%), not-for-profit organizations (2,026 | 12.4%), and local government employees (1,175 | 7.2%) make up the most common classes of employment.
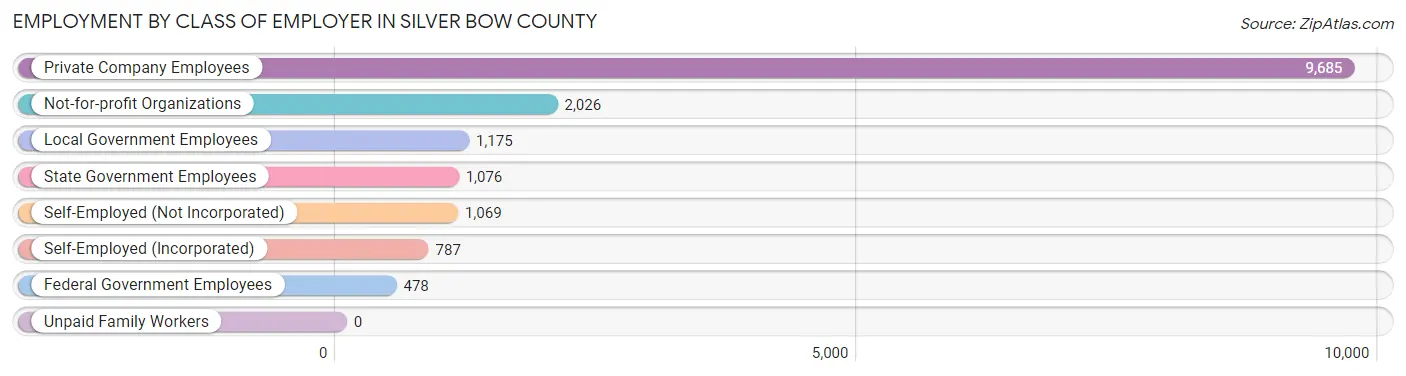
| Employer Class | # Employees | % Employees |
| Private Company Employees | 9,685 | 59.4% |
| Self-Employed (Incorporated) | 787 | 4.8% |
| Self-Employed (Not Incorporated) | 1,069 | 6.6% |
| Not-for-profit Organizations | 2,026 | 12.4% |
| Local Government Employees | 1,175 | 7.2% |
| State Government Employees | 1,076 | 6.6% |
| Federal Government Employees | 478 | 2.9% |
| Unpaid Family Workers | 0 | 0.0% |
| Total | 16,296 | 100.0% |
Employment Status by Age in Silver Bow County
According to the labor force statistics for Silver Bow County, out of the total population over 16 years of age (28,818), 60.1% or 17,320 individuals are in the labor force, with 4.6% or 797 of them unemployed. The age group with the highest labor force participation rate is 20 to 24 years, with 84.4% or 2,471 individuals in the labor force. Within the labor force, the 16 to 19 years age range has the highest percentage of unemployed individuals, with 19.1% or 128 of them being unemployed.
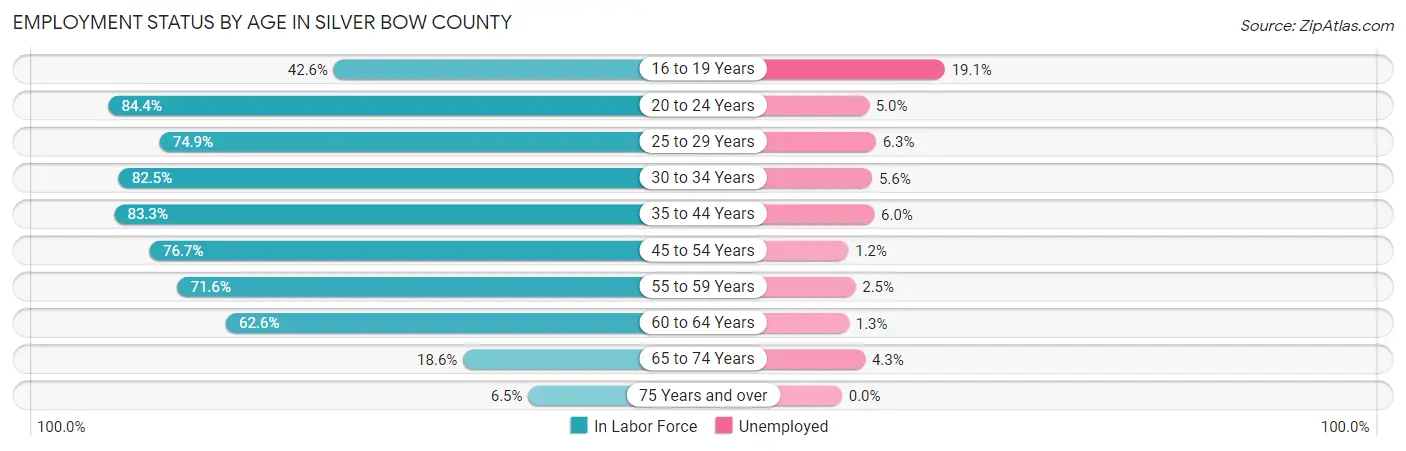
| Age Bracket | In Labor Force | Unemployed |
| 16 to 19 Years | 671 (42.6%) | 128 (19.1%) |
| 20 to 24 Years | 2,471 (84.4%) | 124 (5.0%) |
| 25 to 29 Years | 1,774 (74.9%) | 112 (6.3%) |
| 30 to 34 Years | 1,670 (82.5%) | 94 (5.6%) |
| 35 to 44 Years | 3,469 (83.3%) | 208 (6.0%) |
| 45 to 54 Years | 3,078 (76.7%) | 37 (1.2%) |
| 55 to 59 Years | 1,493 (71.6%) | 37 (2.5%) |
| 60 to 64 Years | 1,741 (62.6%) | 23 (1.3%) |
| 65 to 74 Years | 762 (18.6%) | 33 (4.3%) |
| 75 Years and over | 181 (6.5%) | 0 (0.0%) |
| Total | 17,320 (60.1%) | 797 (4.6%) |
Employment Status by Educational Attainment in Silver Bow County
According to labor force statistics for Silver Bow County, 75.8% of individuals (13,216) out of the total population between 25 and 64 years of age (17,435) are in the labor force, with 3.9% or 515 of them being unemployed. The group with the highest labor force participation rate are those with the educational attainment of bachelor's degree or higher, with 86.9% or 4,303 individuals in the labor force. Within the labor force, individuals with high school diploma education have the highest percentage of unemployment, with 5.9% or 230 of them being unemployed.
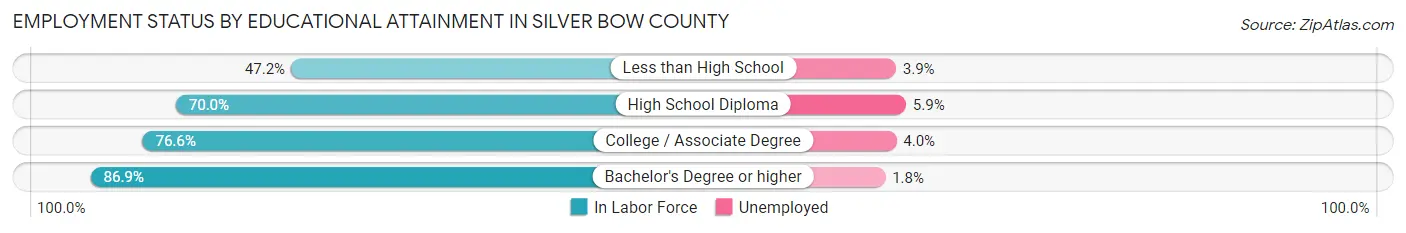
| Educational Attainment | In Labor Force | Unemployed |
| Less than High School | 436 (47.2%) | 36 (3.9%) |
| High School Diploma | 3,900 (70.0%) | 329 (5.9%) |
| College / Associate Degree | 4,587 (76.6%) | 240 (4.0%) |
| Bachelor's Degree or higher | 4,303 (86.9%) | 89 (1.8%) |
| Total | 13,216 (75.8%) | 680 (3.9%) |
Employment Occupations by Sex in Silver Bow County
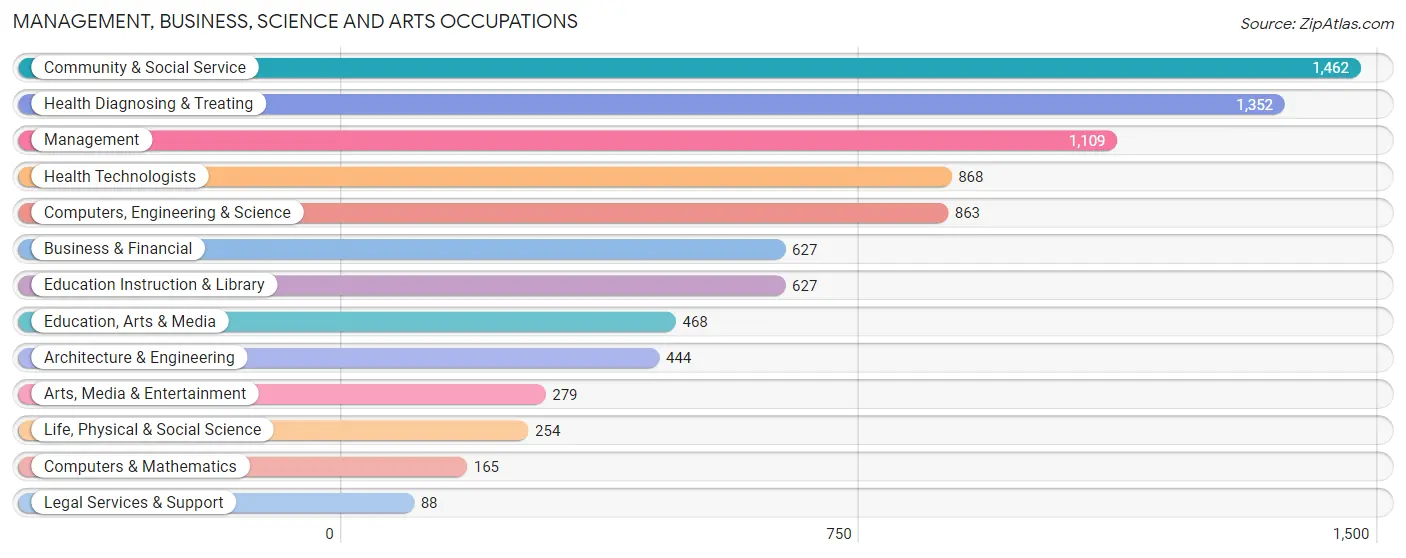
Management, Business, Science and Arts Occupations
The most common Management, Business, Science and Arts occupations in Silver Bow County are Community & Social Service (1,462 | 8.9%), Health Diagnosing & Treating (1,352 | 8.2%), Management (1,109 | 6.7%), Health Technologists (868 | 5.3%), and Computers, Engineering & Science (863 | 5.2%).
Management, Business, Science and Arts Occupations by Sex
Within the Management, Business, Science and Arts occupations in Silver Bow County, the most male-oriented occupations are Architecture & Engineering (94.6%), Legal Services & Support (69.3%), and Computers, Engineering & Science (68.2%), while the most female-oriented occupations are Health Technologists (81.7%), Health Diagnosing & Treating (81.2%), and Education Instruction & Library (81.0%).
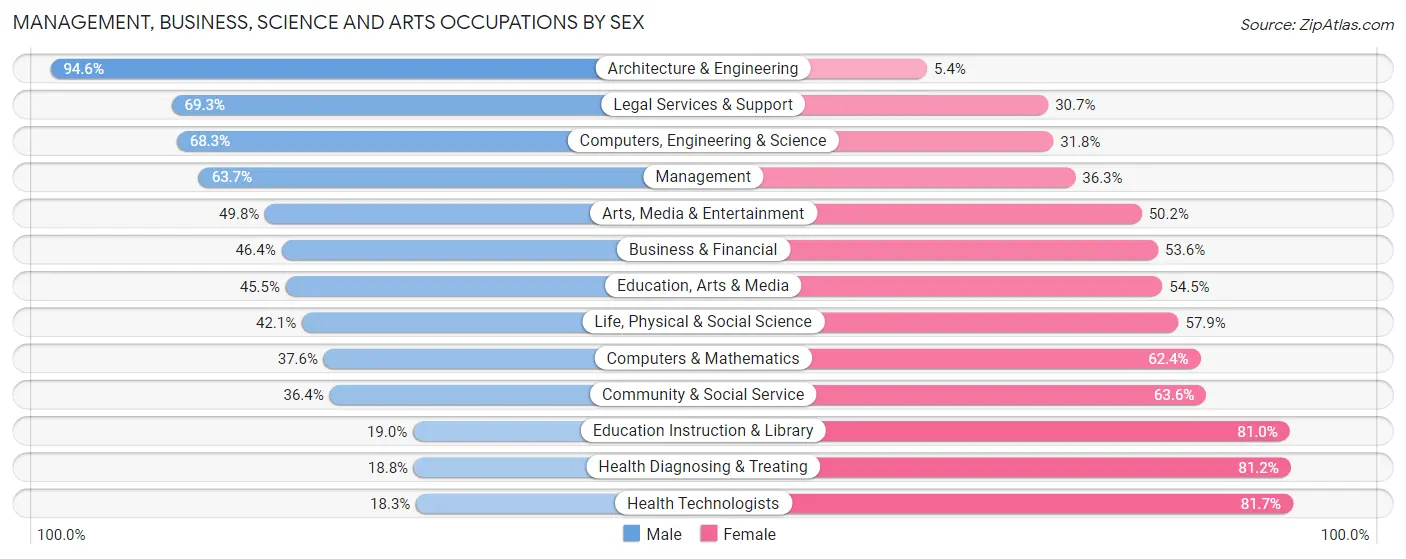
| Occupation | Male | Female |
| Management | 706 (63.7%) | 403 (36.3%) |
| Business & Financial | 291 (46.4%) | 336 (53.6%) |
| Computers, Engineering & Science | 589 (68.2%) | 274 (31.8%) |
| Computers & Mathematics | 62 (37.6%) | 103 (62.4%) |
| Architecture & Engineering | 420 (94.6%) | 24 (5.4%) |
| Life, Physical & Social Science | 107 (42.1%) | 147 (57.9%) |
| Community & Social Service | 532 (36.4%) | 930 (63.6%) |
| Education, Arts & Media | 213 (45.5%) | 255 (54.5%) |
| Legal Services & Support | 61 (69.3%) | 27 (30.7%) |
| Education Instruction & Library | 119 (19.0%) | 508 (81.0%) |
| Arts, Media & Entertainment | 139 (49.8%) | 140 (50.2%) |
| Health Diagnosing & Treating | 254 (18.8%) | 1,098 (81.2%) |
| Health Technologists | 159 (18.3%) | 709 (81.7%) |
| Total (Category) | 2,372 (43.8%) | 3,041 (56.2%) |
| Total (Overall) | 8,733 (53.1%) | 7,715 (46.9%) |
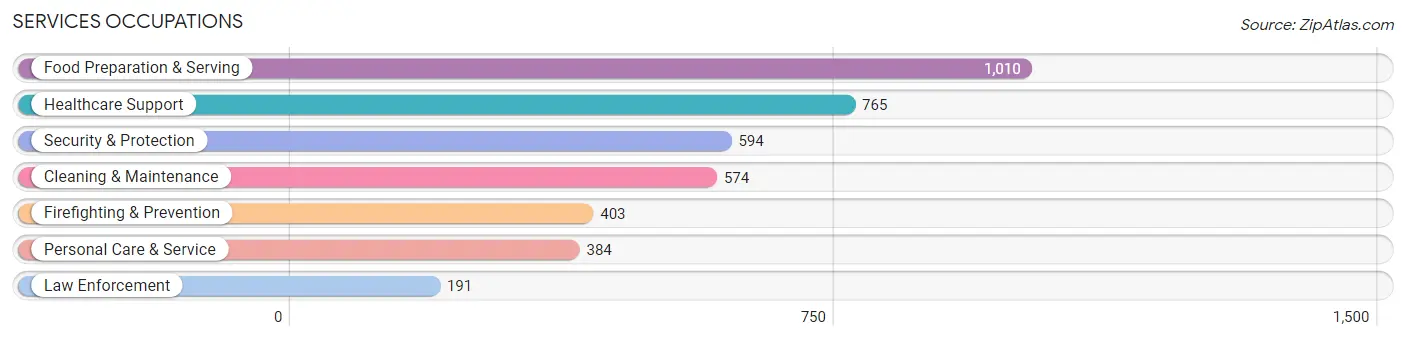
Services Occupations
The most common Services occupations in Silver Bow County are Food Preparation & Serving (1,010 | 6.1%), Healthcare Support (765 | 4.6%), Security & Protection (594 | 3.6%), Cleaning & Maintenance (574 | 3.5%), and Firefighting & Prevention (403 | 2.5%).
Services Occupations by Sex
Within the Services occupations in Silver Bow County, the most male-oriented occupations are Law Enforcement (88.0%), Cleaning & Maintenance (85.4%), and Food Preparation & Serving (60.1%), while the most female-oriented occupations are Healthcare Support (80.0%), Personal Care & Service (59.6%), and Firefighting & Prevention (56.3%).
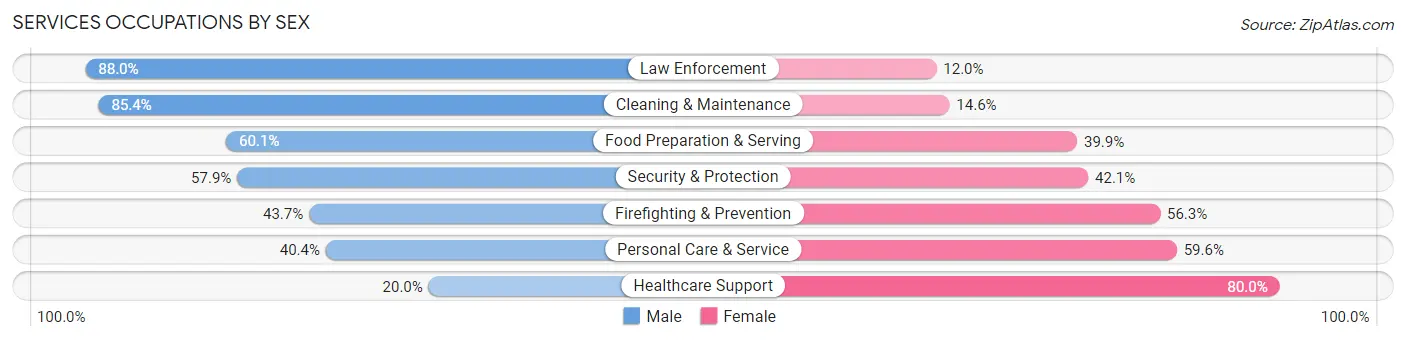
| Occupation | Male | Female |
| Healthcare Support | 153 (20.0%) | 612 (80.0%) |
| Security & Protection | 344 (57.9%) | 250 (42.1%) |
| Firefighting & Prevention | 176 (43.7%) | 227 (56.3%) |
| Law Enforcement | 168 (88.0%) | 23 (12.0%) |
| Food Preparation & Serving | 607 (60.1%) | 403 (39.9%) |
| Cleaning & Maintenance | 490 (85.4%) | 84 (14.6%) |
| Personal Care & Service | 155 (40.4%) | 229 (59.6%) |
| Total (Category) | 1,749 (52.6%) | 1,578 (47.4%) |
| Total (Overall) | 8,733 (53.1%) | 7,715 (46.9%) |
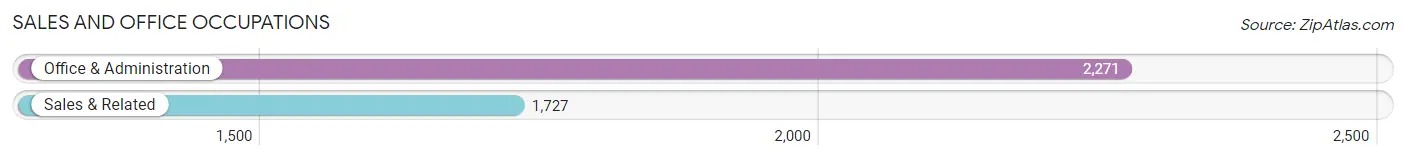
Sales and Office Occupations
The most common Sales and Office occupations in Silver Bow County are Office & Administration (2,271 | 13.8%), and Sales & Related (1,727 | 10.5%).
Sales and Office Occupations by Sex
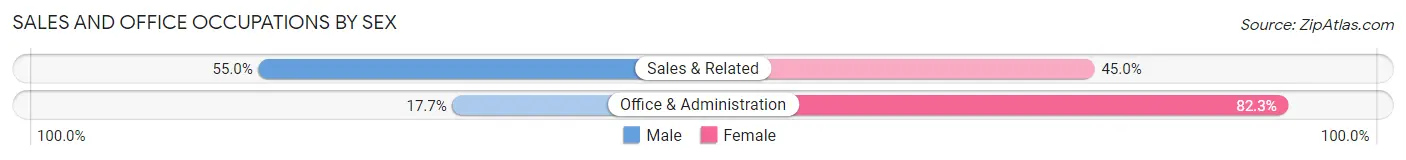
| Occupation | Male | Female |
| Sales & Related | 950 (55.0%) | 777 (45.0%) |
| Office & Administration | 402 (17.7%) | 1,869 (82.3%) |
| Total (Category) | 1,352 (33.8%) | 2,646 (66.2%) |
| Total (Overall) | 8,733 (53.1%) | 7,715 (46.9%) |
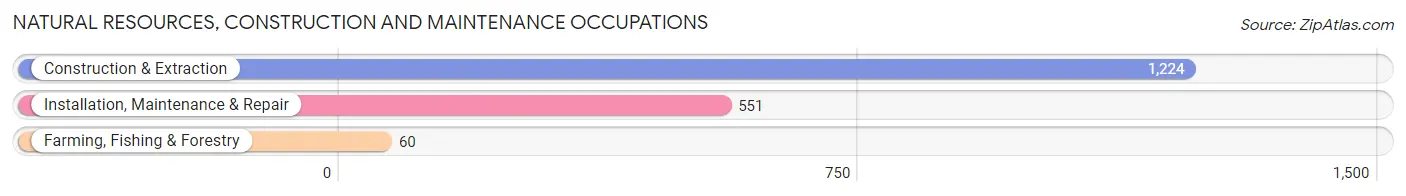
Natural Resources, Construction and Maintenance Occupations
The most common Natural Resources, Construction and Maintenance occupations in Silver Bow County are Construction & Extraction (1,224 | 7.4%), Installation, Maintenance & Repair (551 | 3.4%), and Farming, Fishing & Forestry (60 | 0.4%).
Natural Resources, Construction and Maintenance Occupations by Sex
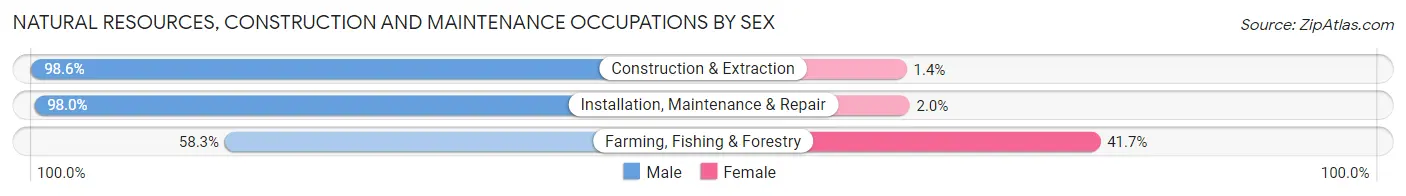
| Occupation | Male | Female |
| Farming, Fishing & Forestry | 35 (58.3%) | 25 (41.7%) |
| Construction & Extraction | 1,207 (98.6%) | 17 (1.4%) |
| Installation, Maintenance & Repair | 540 (98.0%) | 11 (2.0%) |
| Total (Category) | 1,782 (97.1%) | 53 (2.9%) |
| Total (Overall) | 8,733 (53.1%) | 7,715 (46.9%) |
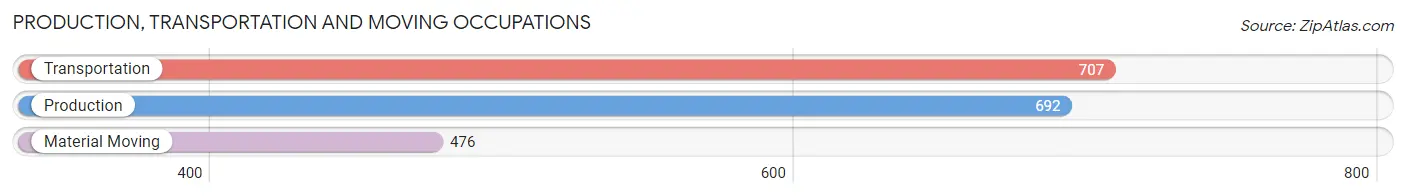
Production, Transportation and Moving Occupations
The most common Production, Transportation and Moving occupations in Silver Bow County are Transportation (707 | 4.3%), Production (692 | 4.2%), and Material Moving (476 | 2.9%).
Production, Transportation and Moving Occupations by Sex
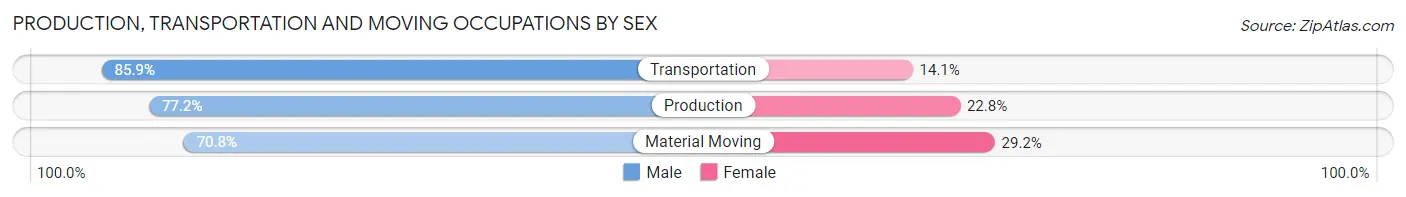
| Occupation | Male | Female |
| Production | 534 (77.2%) | 158 (22.8%) |
| Transportation | 607 (85.9%) | 100 (14.1%) |
| Material Moving | 337 (70.8%) | 139 (29.2%) |
| Total (Category) | 1,478 (78.8%) | 397 (21.2%) |
| Total (Overall) | 8,733 (53.1%) | 7,715 (46.9%) |
Employment Industries by Sex in Silver Bow County
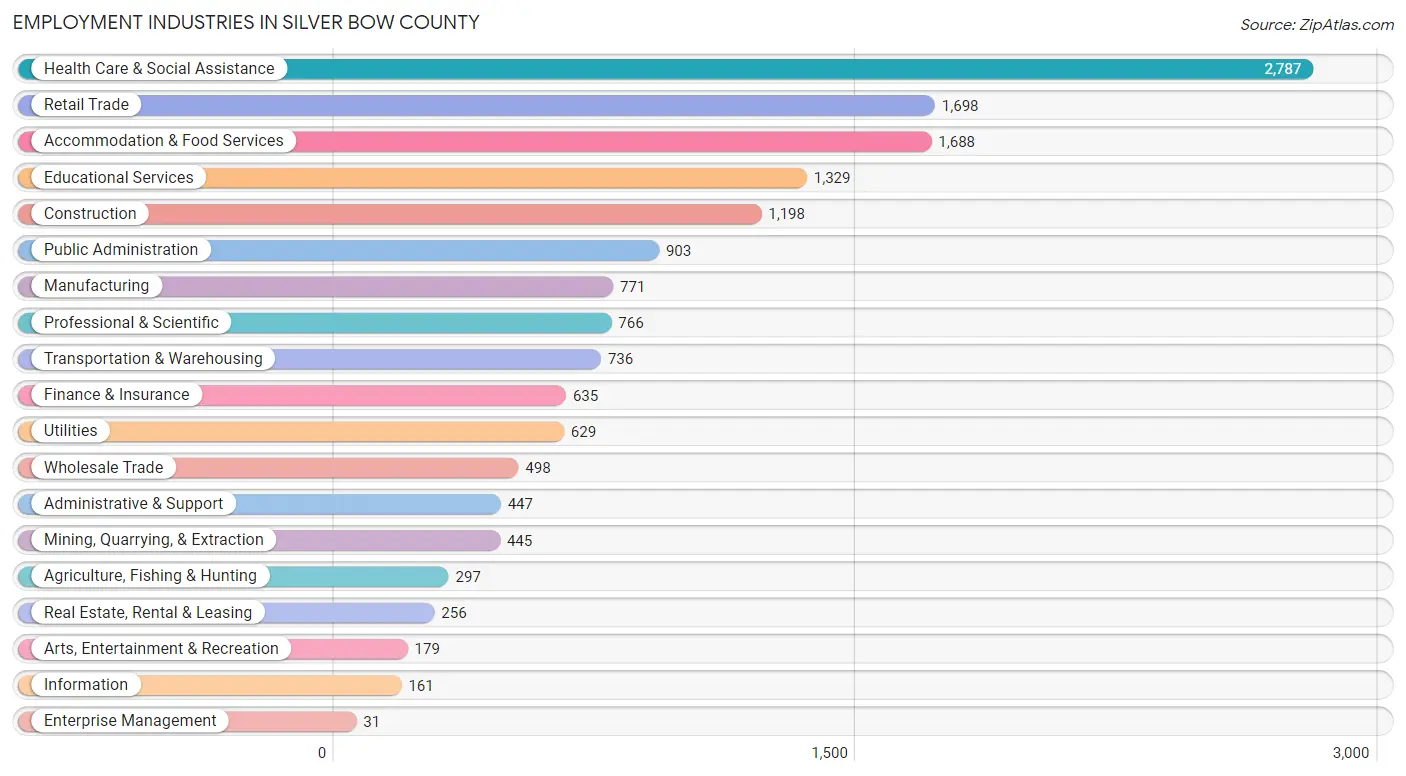
Employment Industries in Silver Bow County
The major employment industries in Silver Bow County include Health Care & Social Assistance (2,787 | 16.9%), Retail Trade (1,698 | 10.3%), Accommodation & Food Services (1,688 | 10.3%), Educational Services (1,329 | 8.1%), and Construction (1,198 | 7.3%).
Employment Industries by Sex in Silver Bow County
The Silver Bow County industries that see more men than women are Construction (94.3%), Mining, Quarrying, & Extraction (93.9%), and Manufacturing (82.1%), whereas the industries that tend to have a higher number of women are Enterprise Management (100.0%), Health Care & Social Assistance (78.3%), and Educational Services (71.8%).
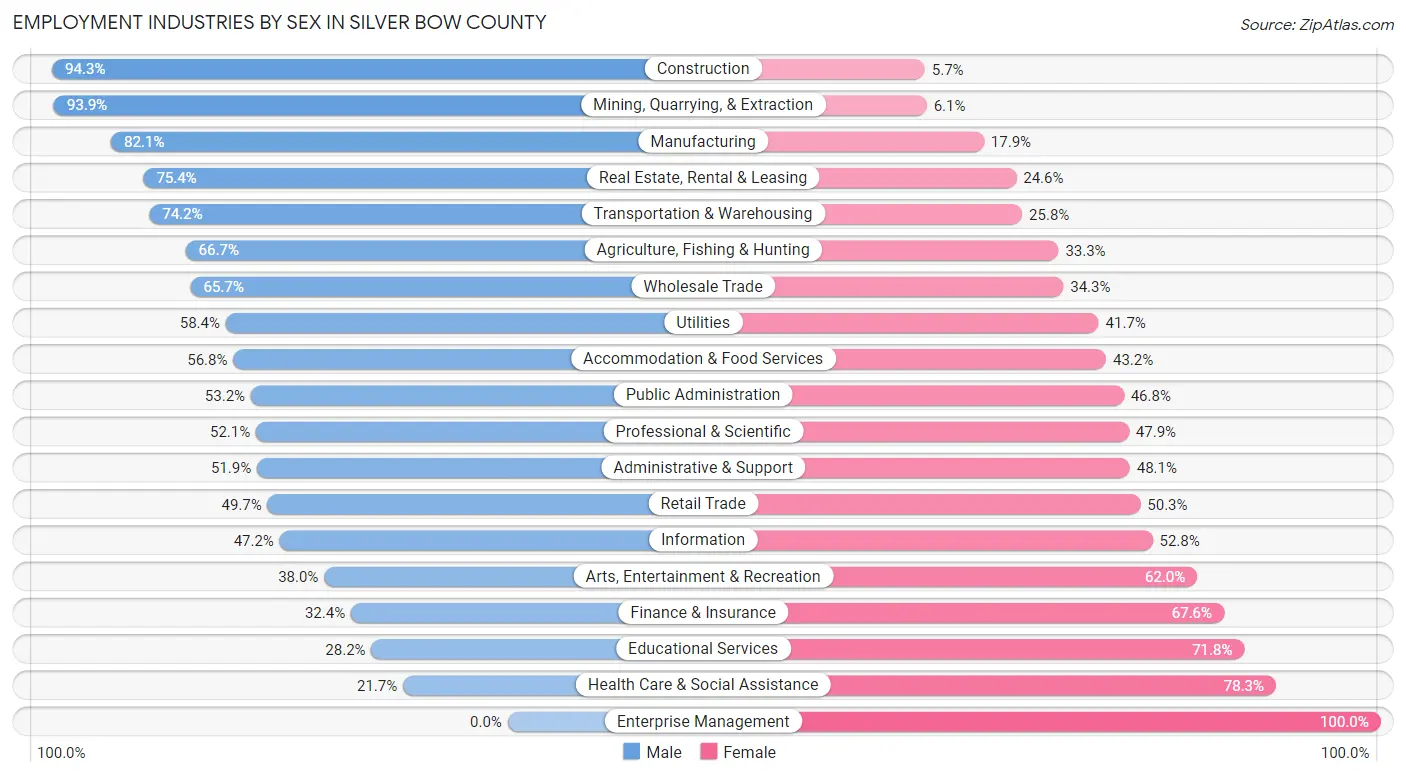
| Industry | Male | Female |
| Agriculture, Fishing & Hunting | 198 (66.7%) | 99 (33.3%) |
| Mining, Quarrying, & Extraction | 418 (93.9%) | 27 (6.1%) |
| Construction | 1,130 (94.3%) | 68 (5.7%) |
| Manufacturing | 633 (82.1%) | 138 (17.9%) |
| Wholesale Trade | 327 (65.7%) | 171 (34.3%) |
| Retail Trade | 844 (49.7%) | 854 (50.3%) |
| Transportation & Warehousing | 546 (74.2%) | 190 (25.8%) |
| Utilities | 367 (58.4%) | 262 (41.6%) |
| Information | 76 (47.2%) | 85 (52.8%) |
| Finance & Insurance | 206 (32.4%) | 429 (67.6%) |
| Real Estate, Rental & Leasing | 193 (75.4%) | 63 (24.6%) |
| Professional & Scientific | 399 (52.1%) | 367 (47.9%) |
| Enterprise Management | 0 (0.0%) | 31 (100.0%) |
| Administrative & Support | 232 (51.9%) | 215 (48.1%) |
| Educational Services | 375 (28.2%) | 954 (71.8%) |
| Health Care & Social Assistance | 604 (21.7%) | 2,183 (78.3%) |
| Arts, Entertainment & Recreation | 68 (38.0%) | 111 (62.0%) |
| Accommodation & Food Services | 959 (56.8%) | 729 (43.2%) |
| Public Administration | 480 (53.2%) | 423 (46.8%) |
| Total | 8,733 (53.1%) | 7,715 (46.9%) |
Education in Silver Bow County
School Enrollment in Silver Bow County
The most common levels of schooling among the 8,178 students in Silver Bow County are college / undergraduate (2,215 | 27.1%), middle school (1,638 | 20.0%), and high school (1,494 | 18.3%).
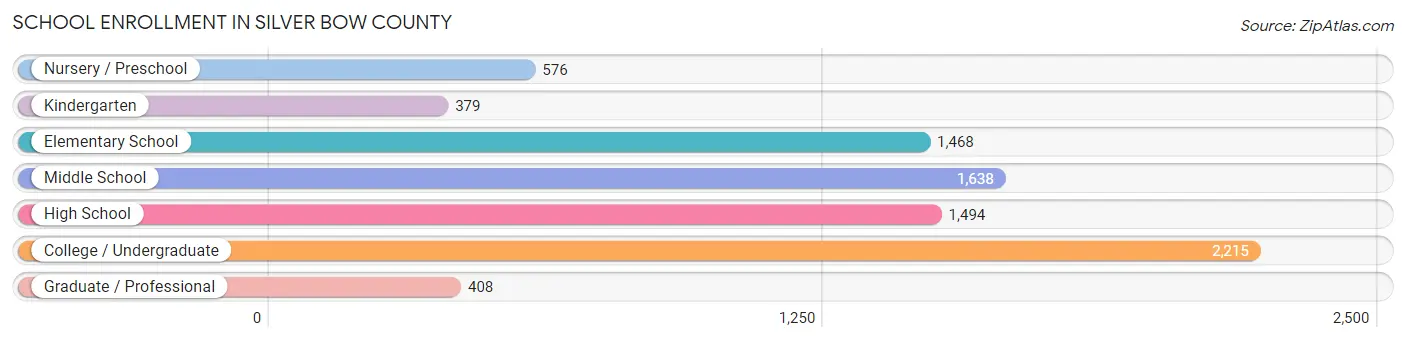
| School Level | # Students | % Students |
| Nursery / Preschool | 576 | 7.0% |
| Kindergarten | 379 | 4.6% |
| Elementary School | 1,468 | 17.9% |
| Middle School | 1,638 | 20.0% |
| High School | 1,494 | 18.3% |
| College / Undergraduate | 2,215 | 27.1% |
| Graduate / Professional | 408 | 5.0% |
| Total | 8,178 | 100.0% |
School Enrollment by Age by Funding Source in Silver Bow County
Out of a total of 8,178 students who are enrolled in schools in Silver Bow County, 998 (12.2%) attend a private institution, while the remaining 7,180 (87.8%) are enrolled in public schools. The age group of 3 to 4 year olds has the highest likelihood of being enrolled in private schools, with 298 (59.1% in the age bracket) enrolled. Conversely, the age group of 20 to 24 year olds has the lowest likelihood of being enrolled in a private school, with 1,442 (99.6% in the age bracket) attending a public institution.
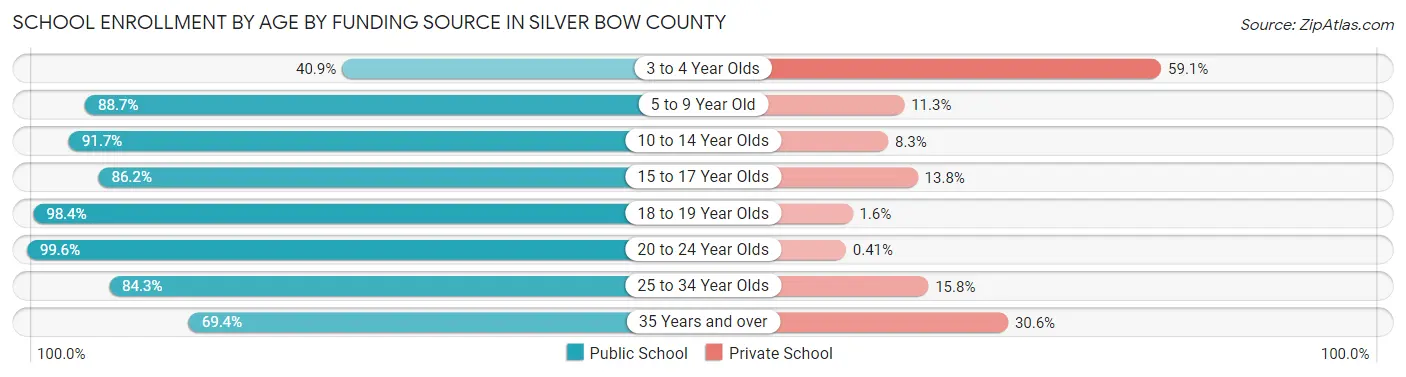
| Age Bracket | Public School | Private School |
| 3 to 4 Year Olds | 206 (40.9%) | 298 (59.1%) |
| 5 to 9 Year Old | 1,486 (88.7%) | 189 (11.3%) |
| 10 to 14 Year Olds | 1,867 (91.7%) | 168 (8.3%) |
| 15 to 17 Year Olds | 945 (86.2%) | 151 (13.8%) |
| 18 to 19 Year Olds | 662 (98.4%) | 11 (1.6%) |
| 20 to 24 Year Olds | 1,442 (99.6%) | 6 (0.4%) |
| 25 to 34 Year Olds | 321 (84.3%) | 60 (15.8%) |
| 35 Years and over | 254 (69.4%) | 112 (30.6%) |
| Total | 7,180 (87.8%) | 998 (12.2%) |
Educational Attainment by Field of Study in Silver Bow County
Education (1,274 | 16.6%), business (1,255 | 16.4%), science & technology (1,079 | 14.1%), engineering (738 | 9.6%), and computers & mathematics (596 | 7.8%) are the most common fields of study among 7,676 individuals in Silver Bow County who have obtained a bachelor's degree or higher.
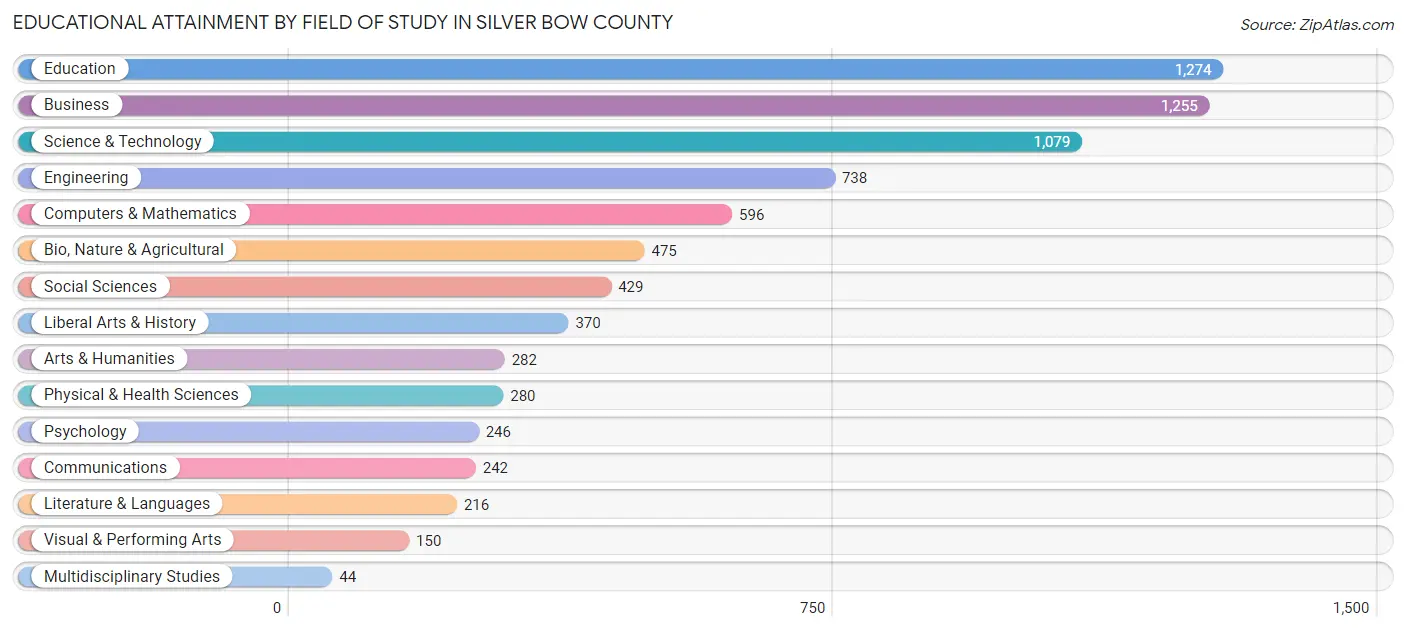
| Field of Study | # Graduates | % Graduates |
| Computers & Mathematics | 596 | 7.8% |
| Bio, Nature & Agricultural | 475 | 6.2% |
| Physical & Health Sciences | 280 | 3.6% |
| Psychology | 246 | 3.2% |
| Social Sciences | 429 | 5.6% |
| Engineering | 738 | 9.6% |
| Multidisciplinary Studies | 44 | 0.6% |
| Science & Technology | 1,079 | 14.1% |
| Business | 1,255 | 16.4% |
| Education | 1,274 | 16.6% |
| Literature & Languages | 216 | 2.8% |
| Liberal Arts & History | 370 | 4.8% |
| Visual & Performing Arts | 150 | 1.9% |
| Communications | 242 | 3.2% |
| Arts & Humanities | 282 | 3.7% |
| Total | 7,676 | 100.0% |
Transportation & Commute in Silver Bow County
Vehicle Availability by Sex in Silver Bow County
The most prevalent vehicle ownership categories in Silver Bow County are males with 2 vehicles (3,040, accounting for 35.7%) and females with 2 vehicles (2,337, making up 40.6%).
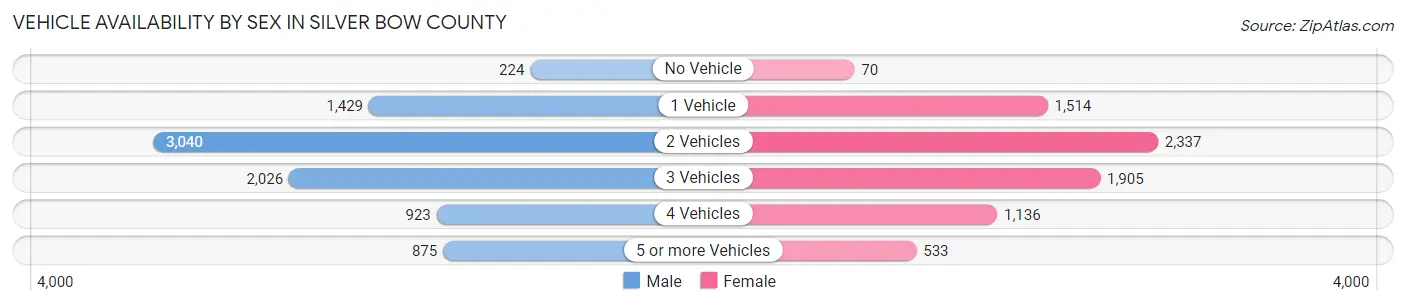
| Vehicles Available | Male | Female |
| No Vehicle | 224 (2.6%) | 70 (0.9%) |
| 1 Vehicle | 1,429 (16.8%) | 1,514 (20.2%) |
| 2 Vehicles | 3,040 (35.7%) | 2,337 (31.2%) |
| 3 Vehicles | 2,026 (23.8%) | 1,905 (25.4%) |
| 4 Vehicles | 923 (10.8%) | 1,136 (15.2%) |
| 5 or more Vehicles | 875 (10.3%) | 533 (7.1%) |
| Total | 8,517 (100.0%) | 7,495 (100.0%) |
Commute Time in Silver Bow County
The most frequently occuring commute durations in Silver Bow County are 10 to 14 minutes (3,929 commuters, 25.8%), 5 to 9 minutes (3,065 commuters, 20.1%), and 15 to 19 minutes (2,914 commuters, 19.1%).
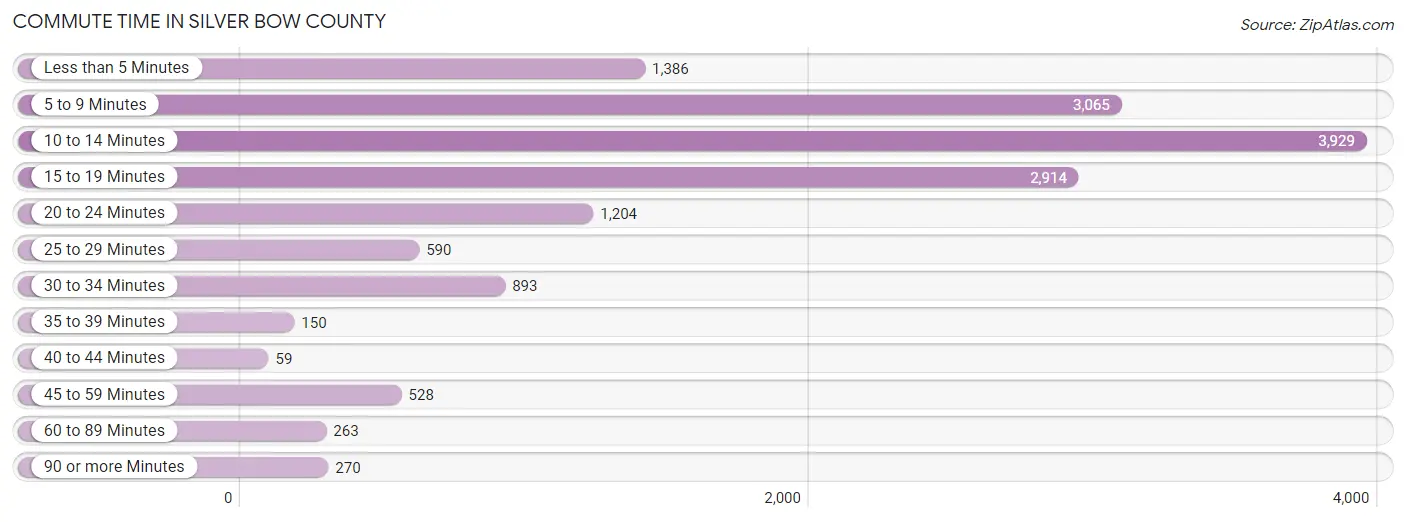
| Commute Time | # Commuters | % Commuters |
| Less than 5 Minutes | 1,386 | 9.1% |
| 5 to 9 Minutes | 3,065 | 20.1% |
| 10 to 14 Minutes | 3,929 | 25.8% |
| 15 to 19 Minutes | 2,914 | 19.1% |
| 20 to 24 Minutes | 1,204 | 7.9% |
| 25 to 29 Minutes | 590 | 3.9% |
| 30 to 34 Minutes | 893 | 5.9% |
| 35 to 39 Minutes | 150 | 1.0% |
| 40 to 44 Minutes | 59 | 0.4% |
| 45 to 59 Minutes | 528 | 3.5% |
| 60 to 89 Minutes | 263 | 1.7% |
| 90 or more Minutes | 270 | 1.8% |
Commute Time by Sex in Silver Bow County
The most common commute times in Silver Bow County are 10 to 14 minutes (2,168 commuters, 26.3%) for males and 10 to 14 minutes (1,761 commuters, 25.2%) for females.
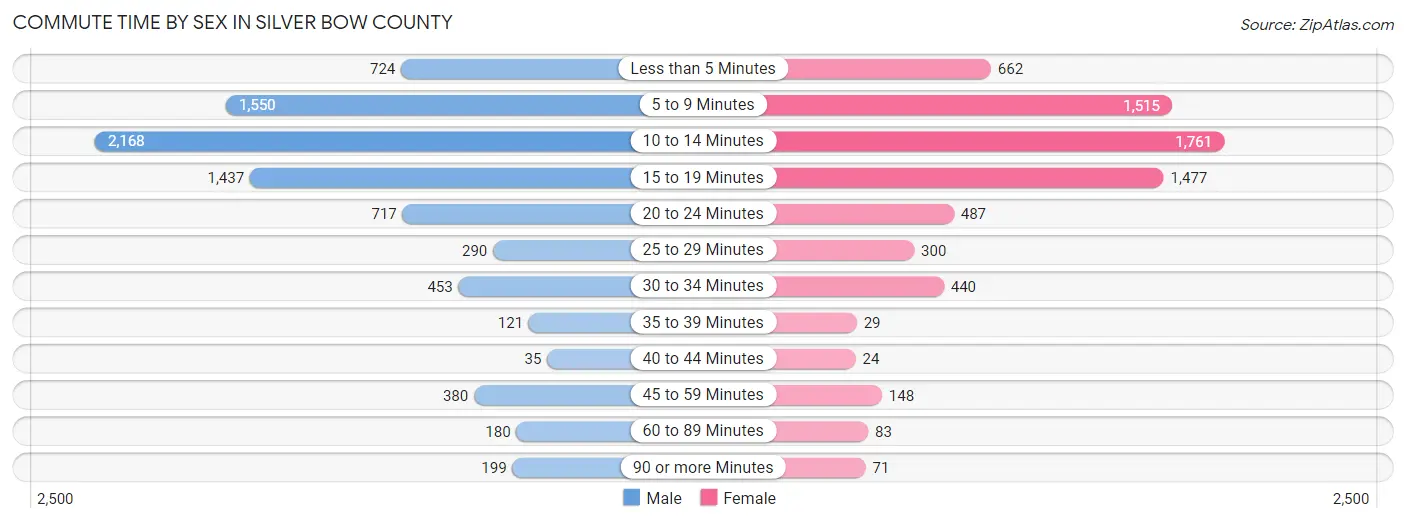
| Commute Time | Male | Female |
| Less than 5 Minutes | 724 (8.8%) | 662 (9.5%) |
| 5 to 9 Minutes | 1,550 (18.8%) | 1,515 (21.6%) |
| 10 to 14 Minutes | 2,168 (26.3%) | 1,761 (25.2%) |
| 15 to 19 Minutes | 1,437 (17.4%) | 1,477 (21.1%) |
| 20 to 24 Minutes | 717 (8.7%) | 487 (7.0%) |
| 25 to 29 Minutes | 290 (3.5%) | 300 (4.3%) |
| 30 to 34 Minutes | 453 (5.5%) | 440 (6.3%) |
| 35 to 39 Minutes | 121 (1.5%) | 29 (0.4%) |
| 40 to 44 Minutes | 35 (0.4%) | 24 (0.3%) |
| 45 to 59 Minutes | 380 (4.6%) | 148 (2.1%) |
| 60 to 89 Minutes | 180 (2.2%) | 83 (1.2%) |
| 90 or more Minutes | 199 (2.4%) | 71 (1.0%) |
Time of Departure to Work by Sex in Silver Bow County
The most frequent times of departure to work in Silver Bow County are 7:30 AM to 7:59 AM (1,439, 17.4%) for males and 7:30 AM to 7:59 AM (1,596, 22.8%) for females.
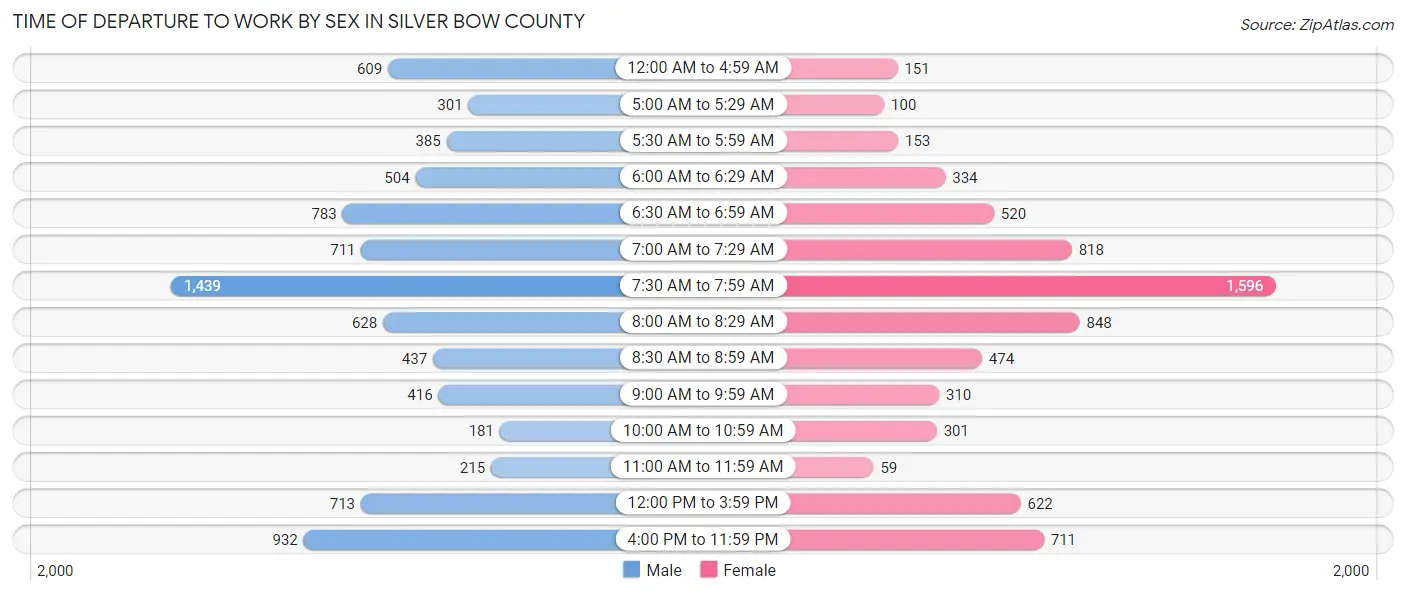
| Time of Departure | Male | Female |
| 12:00 AM to 4:59 AM | 609 (7.4%) | 151 (2.2%) |
| 5:00 AM to 5:29 AM | 301 (3.6%) | 100 (1.4%) |
| 5:30 AM to 5:59 AM | 385 (4.7%) | 153 (2.2%) |
| 6:00 AM to 6:29 AM | 504 (6.1%) | 334 (4.8%) |
| 6:30 AM to 6:59 AM | 783 (9.5%) | 520 (7.4%) |
| 7:00 AM to 7:29 AM | 711 (8.6%) | 818 (11.7%) |
| 7:30 AM to 7:59 AM | 1,439 (17.4%) | 1,596 (22.8%) |
| 8:00 AM to 8:29 AM | 628 (7.6%) | 848 (12.1%) |
| 8:30 AM to 8:59 AM | 437 (5.3%) | 474 (6.8%) |
| 9:00 AM to 9:59 AM | 416 (5.0%) | 310 (4.4%) |
| 10:00 AM to 10:59 AM | 181 (2.2%) | 301 (4.3%) |
| 11:00 AM to 11:59 AM | 215 (2.6%) | 59 (0.8%) |
| 12:00 PM to 3:59 PM | 713 (8.6%) | 622 (8.9%) |
| 4:00 PM to 11:59 PM | 932 (11.3%) | 711 (10.2%) |
| Total | 8,254 (100.0%) | 6,997 (100.0%) |
Housing Occupancy in Silver Bow County
Occupancy by Ownership in Silver Bow County
Of the total 15,080 dwellings in Silver Bow County, owner-occupied units account for 10,578 (70.2%), while renter-occupied units make up 4,502 (29.8%).
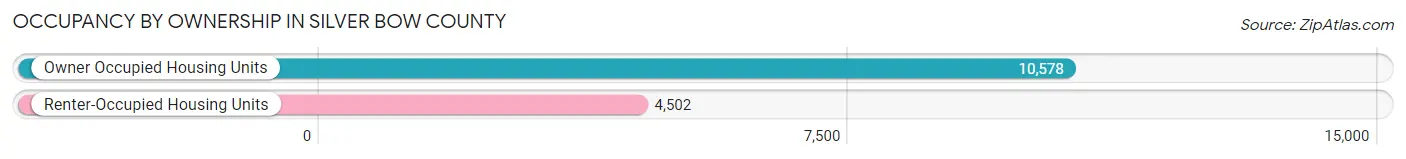
| Occupancy | # Housing Units | % Housing Units |
| Owner Occupied Housing Units | 10,578 | 70.2% |
| Renter-Occupied Housing Units | 4,502 | 29.8% |
| Total Occupied Housing Units | 15,080 | 100.0% |
Occupancy by Household Size in Silver Bow County
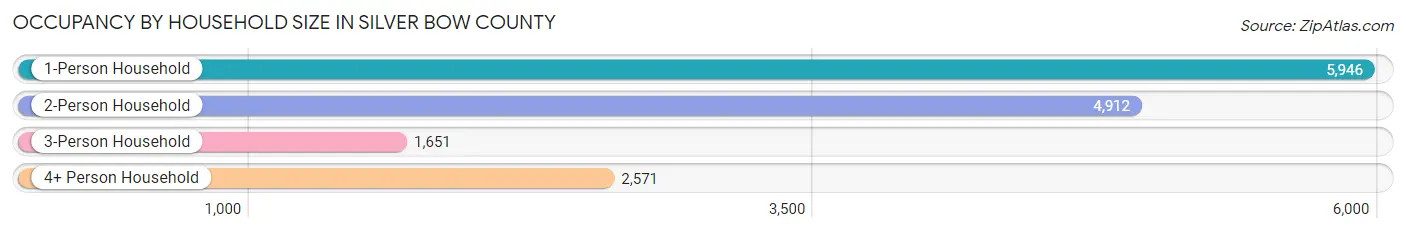
| Household Size | # Housing Units | % Housing Units |
| 1-Person Household | 5,946 | 39.4% |
| 2-Person Household | 4,912 | 32.6% |
| 3-Person Household | 1,651 | 11.0% |
| 4+ Person Household | 2,571 | 17.1% |
| Total Housing Units | 15,080 | 100.0% |
Occupancy by Ownership by Household Size in Silver Bow County
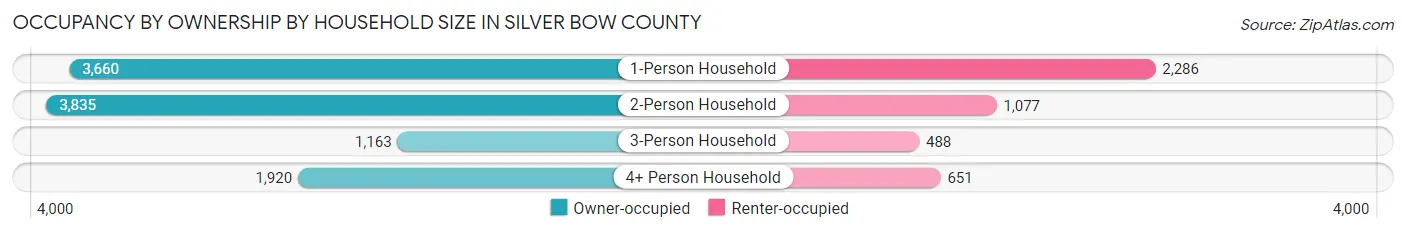
| Household Size | Owner-occupied | Renter-occupied |
| 1-Person Household | 3,660 (61.6%) | 2,286 (38.5%) |
| 2-Person Household | 3,835 (78.1%) | 1,077 (21.9%) |
| 3-Person Household | 1,163 (70.4%) | 488 (29.6%) |
| 4+ Person Household | 1,920 (74.7%) | 651 (25.3%) |
| Total Housing Units | 10,578 (70.2%) | 4,502 (29.8%) |
Occupancy by Educational Attainment in Silver Bow County
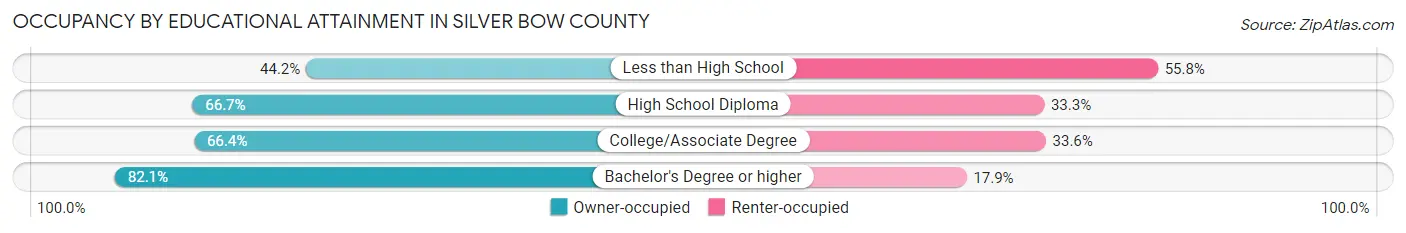
| Household Size | Owner-occupied | Renter-occupied |
| Less than High School | 349 (44.2%) | 441 (55.8%) |
| High School Diploma | 3,025 (66.7%) | 1,508 (33.3%) |
| College/Associate Degree | 3,412 (66.4%) | 1,726 (33.6%) |
| Bachelor's Degree or higher | 3,792 (82.1%) | 827 (17.9%) |
Occupancy by Age of Householder in Silver Bow County
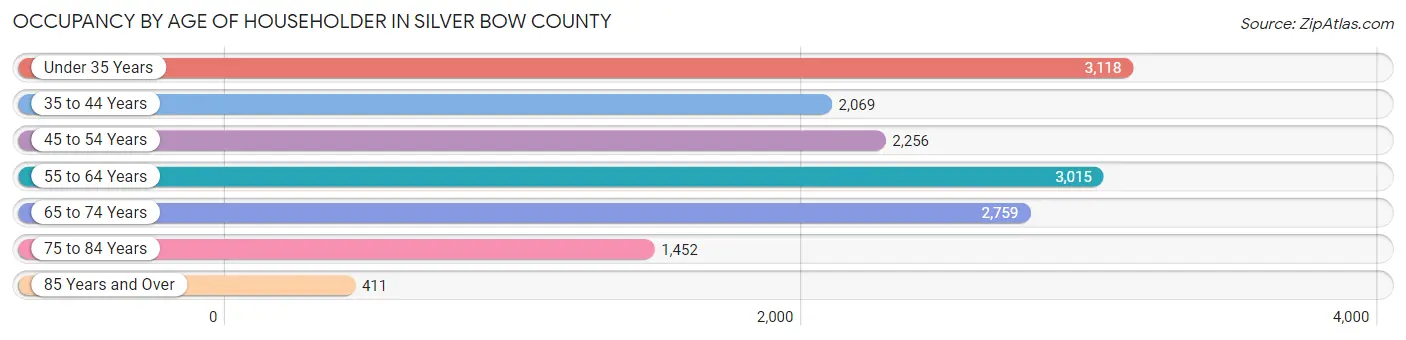
| Age Bracket | # Households | % Households |
| Under 35 Years | 3,118 | 20.7% |
| 35 to 44 Years | 2,069 | 13.7% |
| 45 to 54 Years | 2,256 | 15.0% |
| 55 to 64 Years | 3,015 | 20.0% |
| 65 to 74 Years | 2,759 | 18.3% |
| 75 to 84 Years | 1,452 | 9.6% |
| 85 Years and Over | 411 | 2.7% |
| Total | 15,080 | 100.0% |
Housing Finances in Silver Bow County
Median Income by Occupancy in Silver Bow County
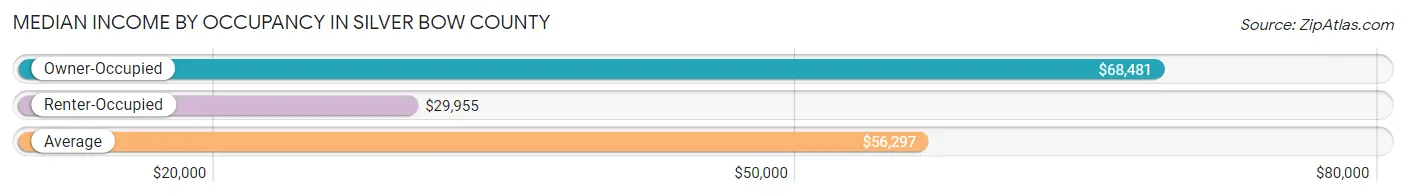
| Occupancy Type | # Households | Median Income |
| Owner-Occupied | 10,578 (70.2%) | $68,481 |
| Renter-Occupied | 4,502 (29.8%) | $29,955 |
| Average | 15,080 (100.0%) | $56,297 |
Occupancy by Householder Income Bracket in Silver Bow County
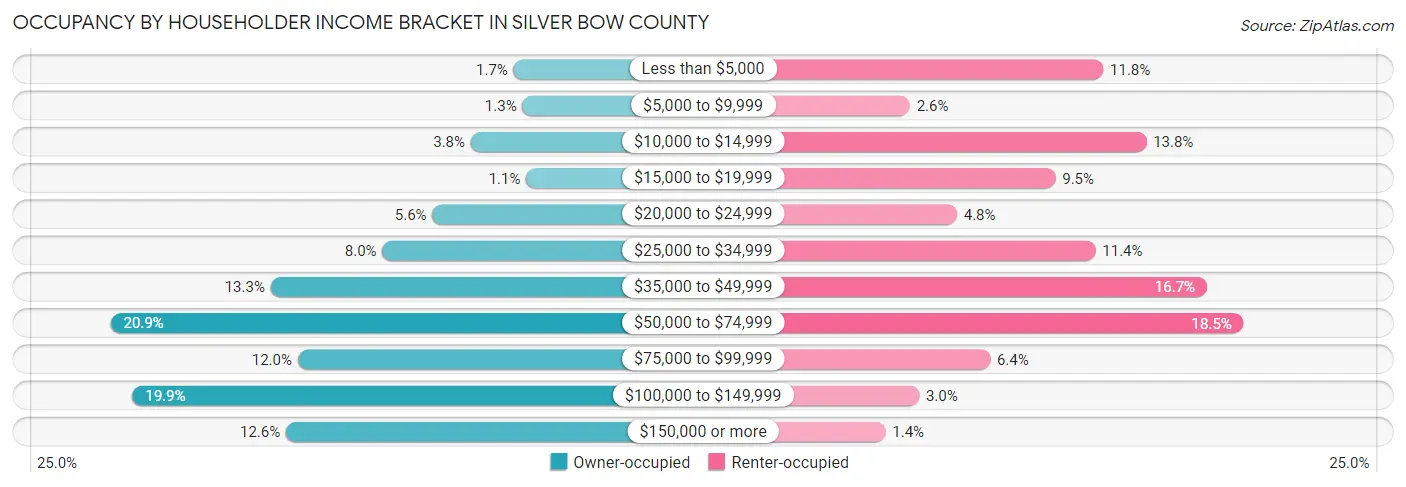
| Income Bracket | Owner-occupied | Renter-occupied |
| Less than $5,000 | 181 (1.7%) | 531 (11.8%) |
| $5,000 to $9,999 | 136 (1.3%) | 116 (2.6%) |
| $10,000 to $14,999 | 397 (3.7%) | 623 (13.8%) |
| $15,000 to $19,999 | 117 (1.1%) | 428 (9.5%) |
| $20,000 to $24,999 | 590 (5.6%) | 217 (4.8%) |
| $25,000 to $34,999 | 842 (8.0%) | 514 (11.4%) |
| $35,000 to $49,999 | 1,405 (13.3%) | 753 (16.7%) |
| $50,000 to $74,999 | 2,212 (20.9%) | 832 (18.5%) |
| $75,000 to $99,999 | 1,268 (12.0%) | 288 (6.4%) |
| $100,000 to $149,999 | 2,102 (19.9%) | 136 (3.0%) |
| $150,000 or more | 1,328 (12.6%) | 64 (1.4%) |
| Total | 10,578 (100.0%) | 4,502 (100.0%) |
Monthly Housing Cost Tiers in Silver Bow County
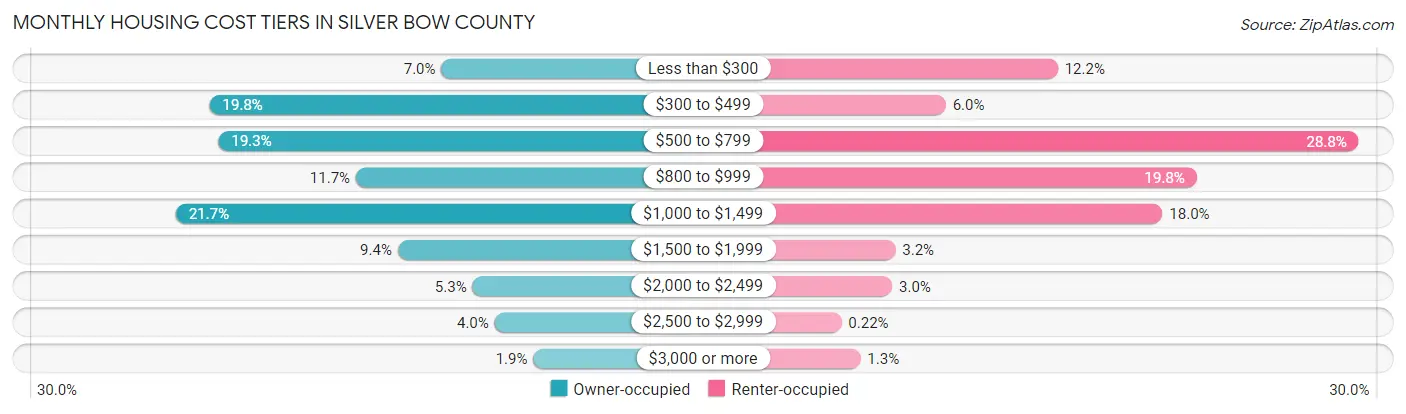
| Monthly Cost | Owner-occupied | Renter-occupied |
| Less than $300 | 738 (7.0%) | 548 (12.2%) |
| $300 to $499 | 2,093 (19.8%) | 269 (6.0%) |
| $500 to $799 | 2,042 (19.3%) | 1,296 (28.8%) |
| $800 to $999 | 1,238 (11.7%) | 893 (19.8%) |
| $1,000 to $1,499 | 2,290 (21.6%) | 808 (17.9%) |
| $1,500 to $1,999 | 993 (9.4%) | 144 (3.2%) |
| $2,000 to $2,499 | 556 (5.3%) | 136 (3.0%) |
| $2,500 to $2,999 | 427 (4.0%) | 10 (0.2%) |
| $3,000 or more | 201 (1.9%) | 57 (1.3%) |
| Total | 10,578 (100.0%) | 4,502 (100.0%) |
Physical Housing Characteristics in Silver Bow County
Housing Structures in Silver Bow County
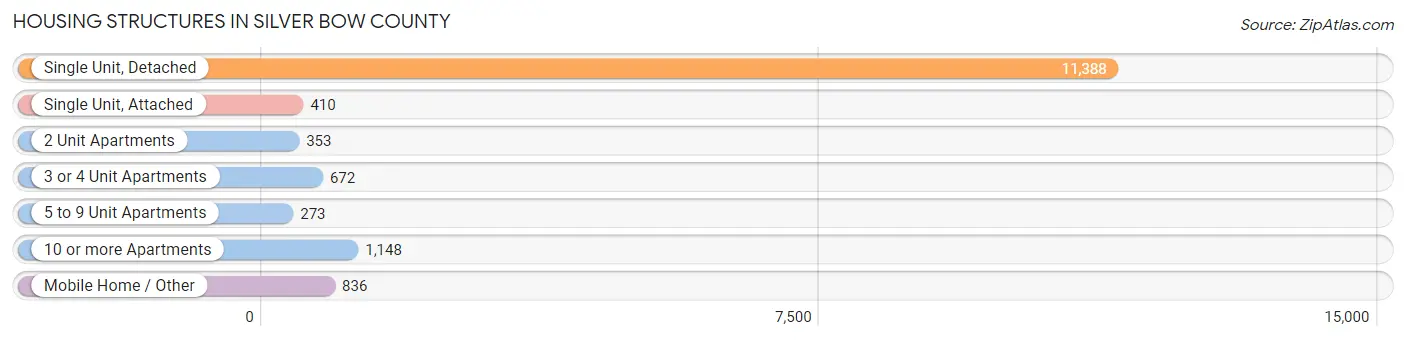
| Structure Type | # Housing Units | % Housing Units |
| Single Unit, Detached | 11,388 | 75.5% |
| Single Unit, Attached | 410 | 2.7% |
| 2 Unit Apartments | 353 | 2.3% |
| 3 or 4 Unit Apartments | 672 | 4.5% |
| 5 to 9 Unit Apartments | 273 | 1.8% |
| 10 or more Apartments | 1,148 | 7.6% |
| Mobile Home / Other | 836 | 5.5% |
| Total | 15,080 | 100.0% |
Housing Structures by Occupancy in Silver Bow County
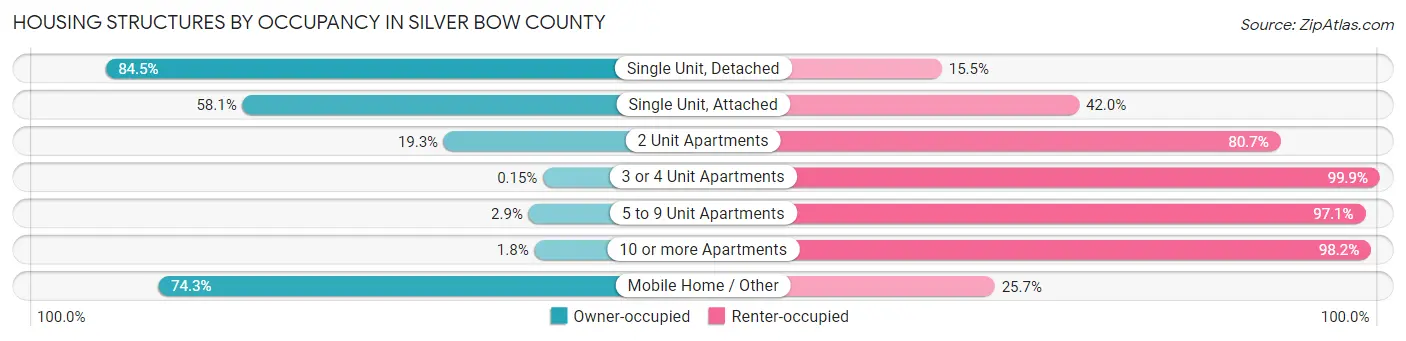
| Structure Type | Owner-occupied | Renter-occupied |
| Single Unit, Detached | 9,621 (84.5%) | 1,767 (15.5%) |
| Single Unit, Attached | 238 (58.1%) | 172 (41.9%) |
| 2 Unit Apartments | 68 (19.3%) | 285 (80.7%) |
| 3 or 4 Unit Apartments | 1 (0.2%) | 671 (99.9%) |
| 5 to 9 Unit Apartments | 8 (2.9%) | 265 (97.1%) |
| 10 or more Apartments | 21 (1.8%) | 1,127 (98.2%) |
| Mobile Home / Other | 621 (74.3%) | 215 (25.7%) |
| Total | 10,578 (70.2%) | 4,502 (29.8%) |
Housing Structures by Number of Rooms in Silver Bow County
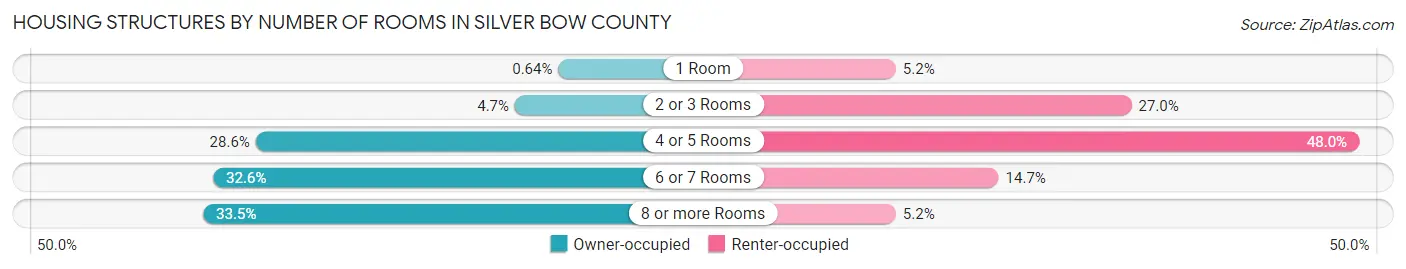
| Number of Rooms | Owner-occupied | Renter-occupied |
| 1 Room | 68 (0.6%) | 233 (5.2%) |
| 2 or 3 Rooms | 493 (4.7%) | 1,214 (27.0%) |
| 4 or 5 Rooms | 3,029 (28.6%) | 2,161 (48.0%) |
| 6 or 7 Rooms | 3,445 (32.6%) | 661 (14.7%) |
| 8 or more Rooms | 3,543 (33.5%) | 233 (5.2%) |
| Total | 10,578 (100.0%) | 4,502 (100.0%) |
Housing Structure by Heating Type in Silver Bow County
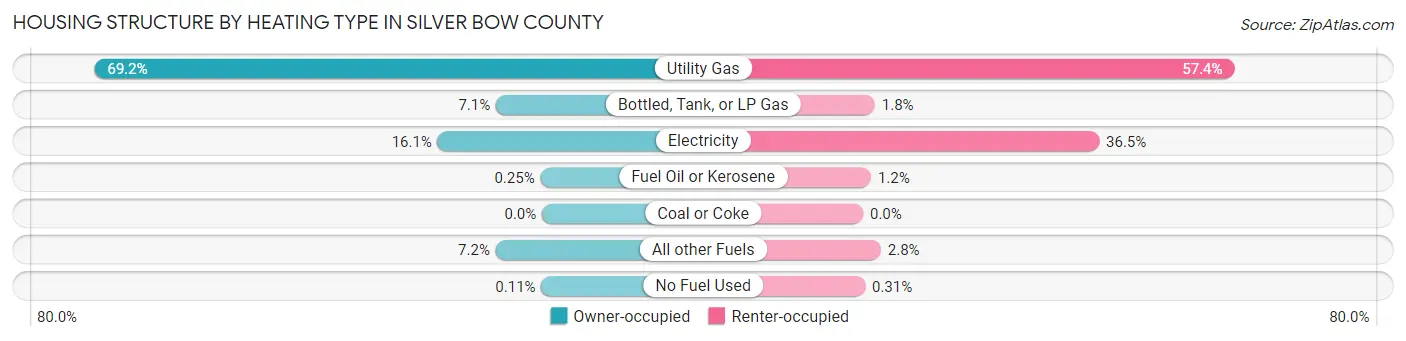
| Heating Type | Owner-occupied | Renter-occupied |
| Utility Gas | 7,322 (69.2%) | 2,584 (57.4%) |
| Bottled, Tank, or LP Gas | 753 (7.1%) | 82 (1.8%) |
| Electricity | 1,707 (16.1%) | 1,643 (36.5%) |
| Fuel Oil or Kerosene | 26 (0.3%) | 55 (1.2%) |
| Coal or Coke | 0 (0.0%) | 0 (0.0%) |
| All other Fuels | 758 (7.2%) | 124 (2.8%) |
| No Fuel Used | 12 (0.1%) | 14 (0.3%) |
| Total | 10,578 (100.0%) | 4,502 (100.0%) |
Household Vehicle Usage in Silver Bow County
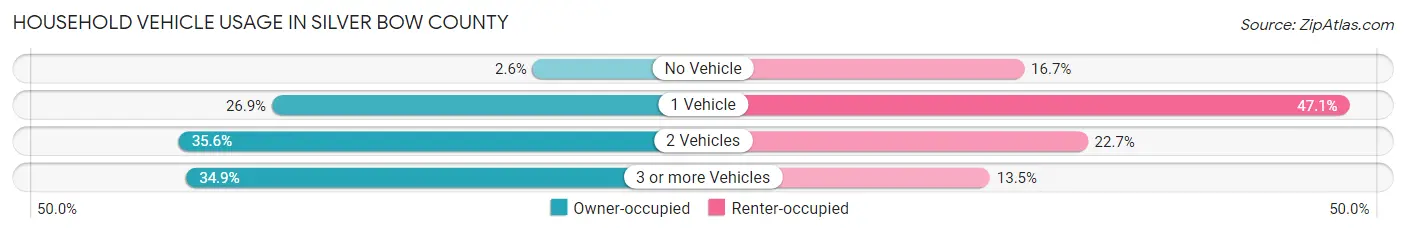
| Vehicles per Household | Owner-occupied | Renter-occupied |
| No Vehicle | 272 (2.6%) | 753 (16.7%) |
| 1 Vehicle | 2,847 (26.9%) | 2,120 (47.1%) |
| 2 Vehicles | 3,767 (35.6%) | 1,020 (22.7%) |
| 3 or more Vehicles | 3,692 (34.9%) | 609 (13.5%) |
| Total | 10,578 (100.0%) | 4,502 (100.0%) |
Real Estate & Mortgages in Silver Bow County
Real Estate and Mortgage Overview in Silver Bow County
| Characteristic | Without Mortgage | With Mortgage |
| Housing Units | 4,782 | 5,796 |
| Median Property Value | $165,700 | $215,500 |
| Median Household Income | $57,175 | $979 |
| Monthly Housing Costs | $469 | $201 |
| Real Estate Taxes | $2,035 | $110 |
Property Value by Mortgage Status in Silver Bow County
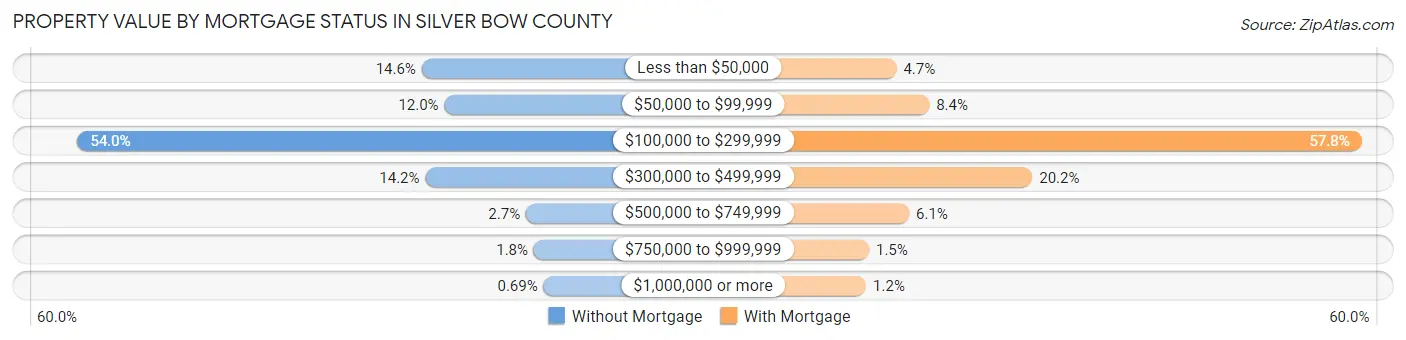
| Property Value | Without Mortgage | With Mortgage |
| Less than $50,000 | 699 (14.6%) | 271 (4.7%) |
| $50,000 to $99,999 | 575 (12.0%) | 488 (8.4%) |
| $100,000 to $299,999 | 2,581 (54.0%) | 3,352 (57.8%) |
| $300,000 to $499,999 | 679 (14.2%) | 1,171 (20.2%) |
| $500,000 to $749,999 | 129 (2.7%) | 355 (6.1%) |
| $750,000 to $999,999 | 86 (1.8%) | 89 (1.5%) |
| $1,000,000 or more | 33 (0.7%) | 70 (1.2%) |
| Total | 4,782 (100.0%) | 5,796 (100.0%) |
Household Income by Mortgage Status in Silver Bow County
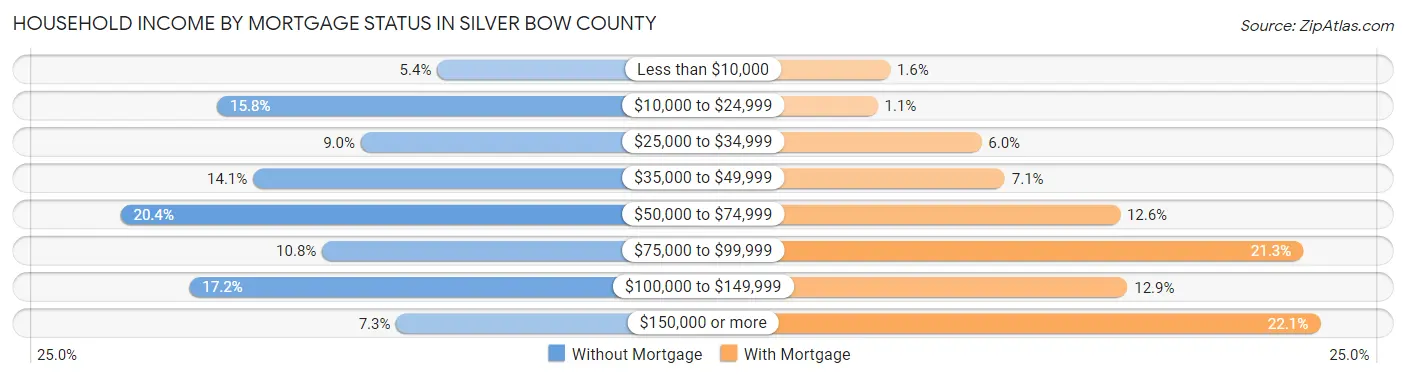
| Household Income | Without Mortgage | With Mortgage |
| Less than $10,000 | 256 (5.3%) | 95 (1.6%) |
| $10,000 to $24,999 | 757 (15.8%) | 61 (1.1%) |
| $25,000 to $34,999 | 430 (9.0%) | 347 (6.0%) |
| $35,000 to $49,999 | 675 (14.1%) | 412 (7.1%) |
| $50,000 to $74,999 | 977 (20.4%) | 730 (12.6%) |
| $75,000 to $99,999 | 518 (10.8%) | 1,235 (21.3%) |
| $100,000 to $149,999 | 820 (17.2%) | 750 (12.9%) |
| $150,000 or more | 349 (7.3%) | 1,282 (22.1%) |
| Total | 4,782 (100.0%) | 5,796 (100.0%) |
Property Value to Household Income Ratio in Silver Bow County
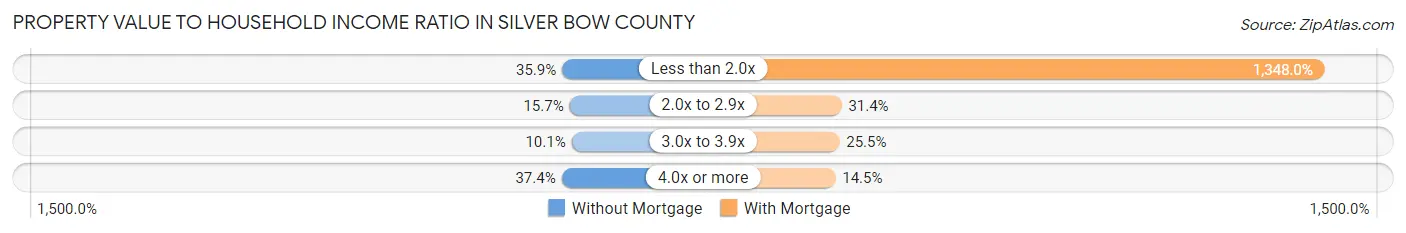
| Value-to-Income Ratio | Without Mortgage | With Mortgage |
| Less than 2.0x | 1,716 (35.9%) | 78,129 (1,348.0%) |
| 2.0x to 2.9x | 750 (15.7%) | 1,820 (31.4%) |
| 3.0x to 3.9x | 484 (10.1%) | 1,480 (25.5%) |
| 4.0x or more | 1,790 (37.4%) | 843 (14.5%) |
| Total | 4,782 (100.0%) | 5,796 (100.0%) |
Real Estate Taxes by Mortgage Status in Silver Bow County
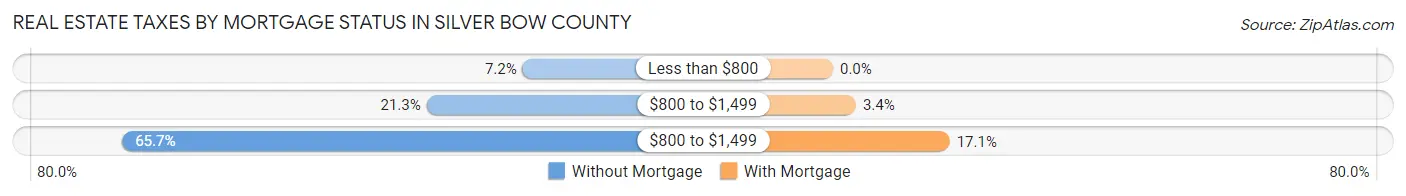
| Property Taxes | Without Mortgage | With Mortgage |
| Less than $800 | 346 (7.2%) | 0 (0.0%) |
| $800 to $1,499 | 1,017 (21.3%) | 194 (3.4%) |
| $800 to $1,499 | 3,143 (65.7%) | 988 (17.1%) |
| Total | 4,782 (100.0%) | 5,796 (100.0%) |
Health & Disability in Silver Bow County
Health Insurance Coverage by Age in Silver Bow County
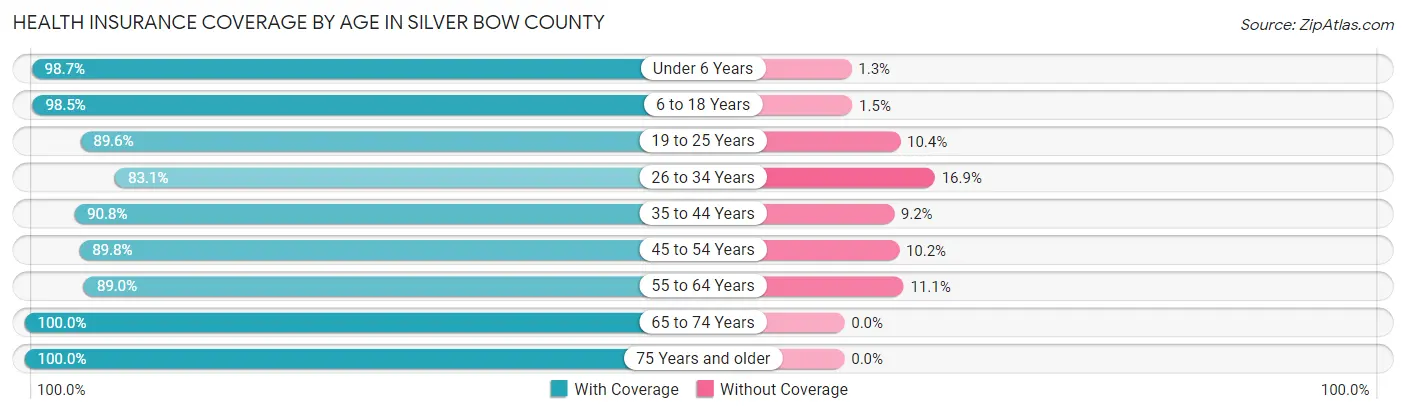
| Age Bracket | With Coverage | Without Coverage |
| Under 6 Years | 2,167 (98.7%) | 29 (1.3%) |
| 6 to 18 Years | 5,344 (98.5%) | 80 (1.5%) |
| 19 to 25 Years | 3,305 (89.6%) | 383 (10.4%) |
| 26 to 34 Years | 3,169 (83.1%) | 643 (16.9%) |
| 35 to 44 Years | 3,682 (90.8%) | 375 (9.2%) |
| 45 to 54 Years | 3,533 (89.8%) | 401 (10.2%) |
| 55 to 64 Years | 4,300 (88.9%) | 534 (11.1%) |
| 65 to 74 Years | 4,056 (100.0%) | 0 (0.0%) |
| 75 Years and older | 2,512 (100.0%) | 0 (0.0%) |
| Total | 32,068 (92.9%) | 2,445 (7.1%) |
Health Insurance Coverage by Citizenship Status in Silver Bow County
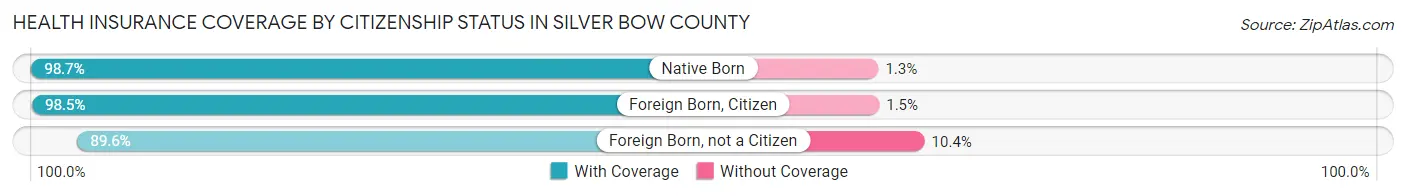
| Citizenship Status | With Coverage | Without Coverage |
| Native Born | 2,167 (98.7%) | 29 (1.3%) |
| Foreign Born, Citizen | 5,344 (98.5%) | 80 (1.5%) |
| Foreign Born, not a Citizen | 3,305 (89.6%) | 383 (10.4%) |
Health Insurance Coverage by Household Income in Silver Bow County
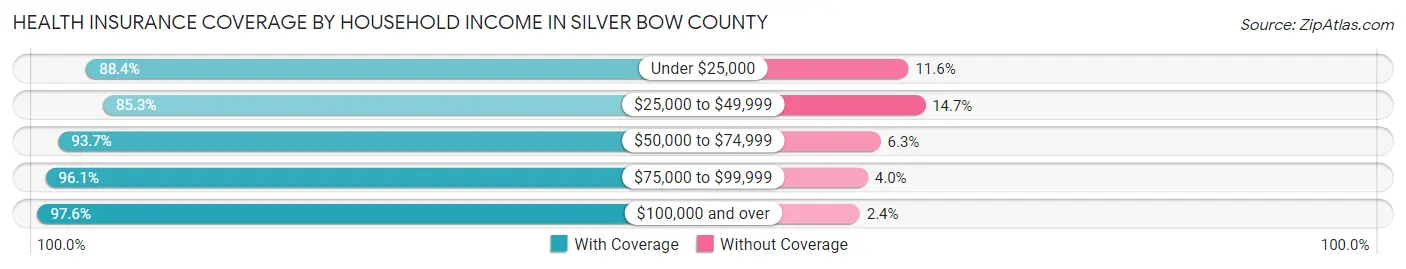
| Household Income | With Coverage | Without Coverage |
| Under $25,000 | 4,628 (88.4%) | 605 (11.6%) |
| $25,000 to $49,999 | 5,406 (85.3%) | 931 (14.7%) |
| $50,000 to $74,999 | 6,712 (93.7%) | 454 (6.3%) |
| $75,000 to $99,999 | 4,016 (96.1%) | 165 (4.0%) |
| $100,000 and over | 10,740 (97.6%) | 267 (2.4%) |
Public vs Private Health Insurance Coverage by Age in Silver Bow County
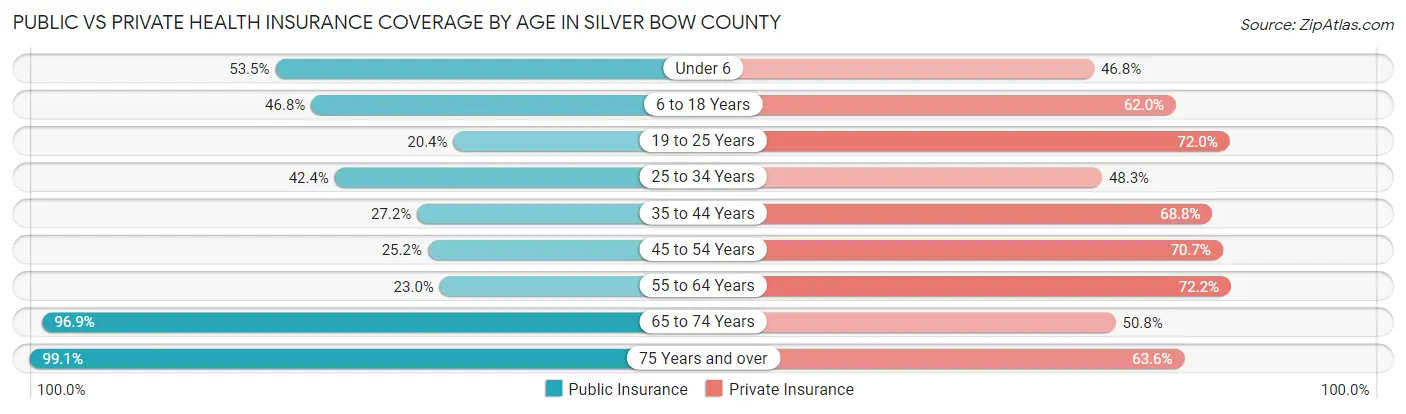
| Age Bracket | Public Insurance | Private Insurance |
| Under 6 | 1,174 (53.5%) | 1,028 (46.8%) |
| 6 to 18 Years | 2,539 (46.8%) | 3,364 (62.0%) |
| 19 to 25 Years | 753 (20.4%) | 2,655 (72.0%) |
| 25 to 34 Years | 1,618 (42.4%) | 1,841 (48.3%) |
| 35 to 44 Years | 1,102 (27.2%) | 2,790 (68.8%) |
| 45 to 54 Years | 990 (25.2%) | 2,781 (70.7%) |
| 55 to 64 Years | 1,110 (23.0%) | 3,491 (72.2%) |
| 65 to 74 Years | 3,929 (96.9%) | 2,061 (50.8%) |
| 75 Years and over | 2,489 (99.1%) | 1,597 (63.6%) |
| Total | 15,704 (45.5%) | 21,608 (62.6%) |
Disability Status by Sex by Age in Silver Bow County
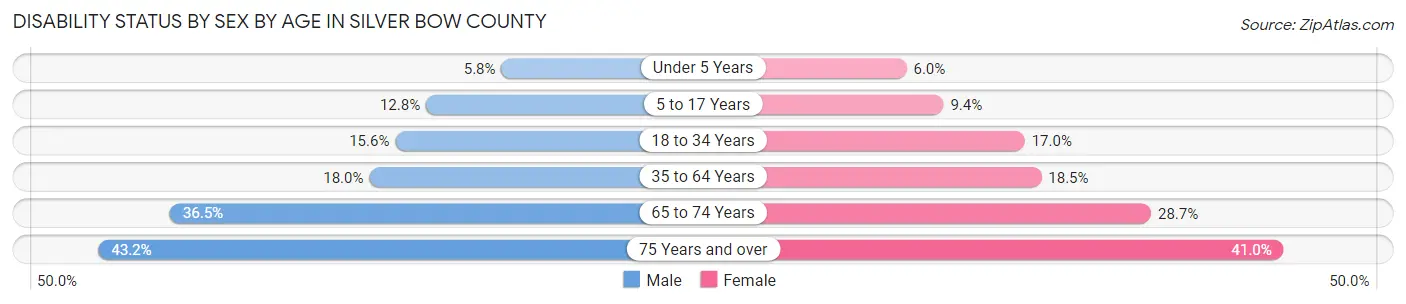
| Age Bracket | Male | Female |
| Under 5 Years | 64 (5.8%) | 54 (6.0%) |
| 5 to 17 Years | 334 (12.8%) | 233 (9.4%) |
| 18 to 34 Years | 666 (15.6%) | 637 (17.0%) |
| 35 to 64 Years | 1,204 (18.0%) | 1,137 (18.5%) |
| 65 to 74 Years | 725 (36.5%) | 594 (28.7%) |
| 75 Years and over | 482 (43.1%) | 572 (41.0%) |
Disability Class by Sex by Age in Silver Bow County
Disability Class: Hearing Difficulty
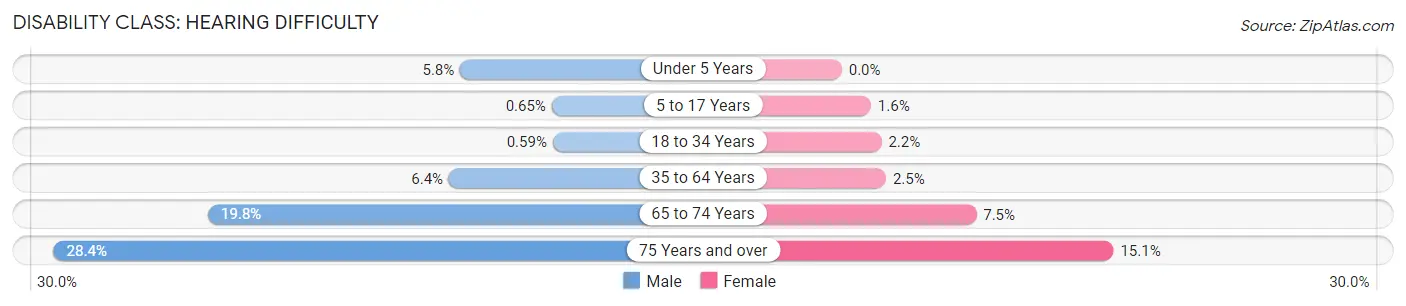
| Age Bracket | Male | Female |
| Under 5 Years | 64 (5.8%) | 0 (0.0%) |
| 5 to 17 Years | 17 (0.6%) | 40 (1.6%) |
| 18 to 34 Years | 25 (0.6%) | 83 (2.2%) |
| 35 to 64 Years | 426 (6.4%) | 151 (2.5%) |
| 65 to 74 Years | 393 (19.8%) | 155 (7.5%) |
| 75 Years and over | 317 (28.4%) | 211 (15.1%) |
Disability Class: Vision Difficulty
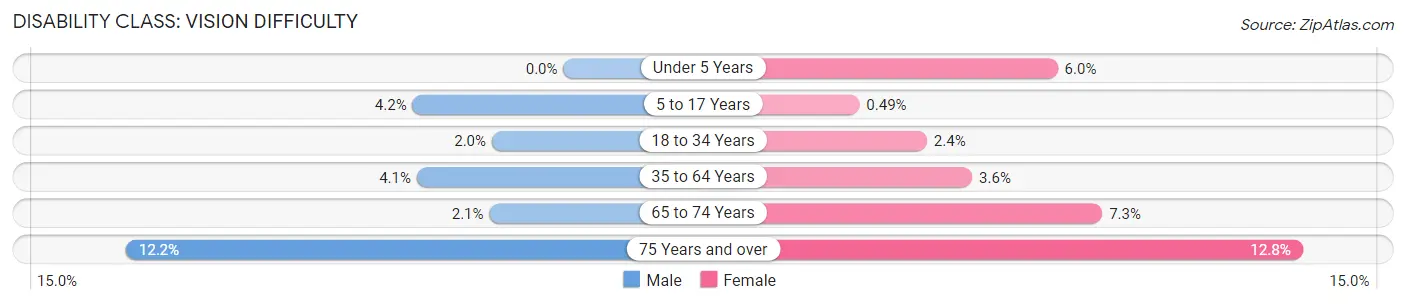
| Age Bracket | Male | Female |
| Under 5 Years | 0 (0.0%) | 54 (6.0%) |
| 5 to 17 Years | 110 (4.2%) | 12 (0.5%) |
| 18 to 34 Years | 85 (2.0%) | 89 (2.4%) |
| 35 to 64 Years | 273 (4.1%) | 223 (3.6%) |
| 65 to 74 Years | 41 (2.1%) | 150 (7.2%) |
| 75 Years and over | 136 (12.2%) | 179 (12.8%) |
Disability Class: Cognitive Difficulty
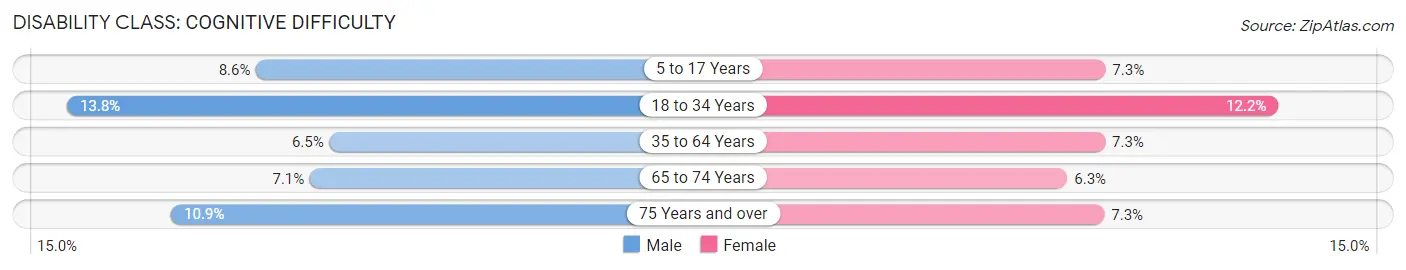
| Age Bracket | Male | Female |
| 5 to 17 Years | 224 (8.6%) | 181 (7.3%) |
| 18 to 34 Years | 590 (13.8%) | 456 (12.1%) |
| 35 to 64 Years | 435 (6.5%) | 450 (7.3%) |
| 65 to 74 Years | 140 (7.0%) | 130 (6.3%) |
| 75 Years and over | 122 (10.9%) | 102 (7.3%) |
Disability Class: Ambulatory Difficulty
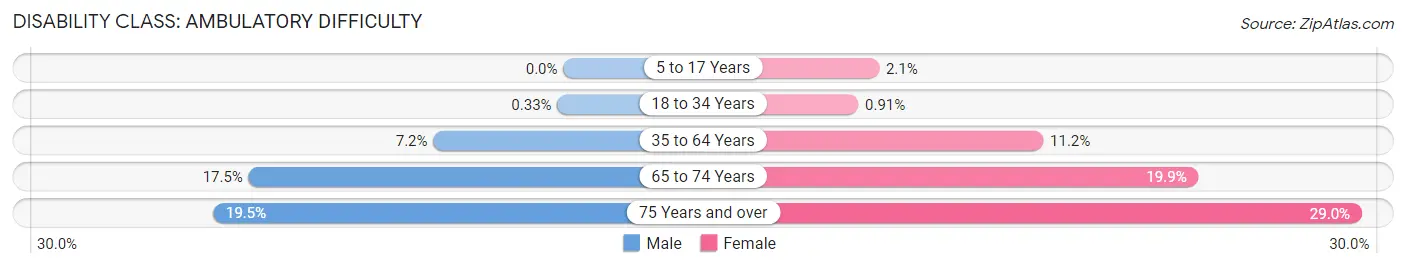
| Age Bracket | Male | Female |
| 5 to 17 Years | 0 (0.0%) | 51 (2.1%) |
| 18 to 34 Years | 14 (0.3%) | 34 (0.9%) |
| 35 to 64 Years | 484 (7.2%) | 688 (11.2%) |
| 65 to 74 Years | 348 (17.5%) | 411 (19.9%) |
| 75 Years and over | 218 (19.5%) | 404 (29.0%) |
Disability Class: Self-Care Difficulty
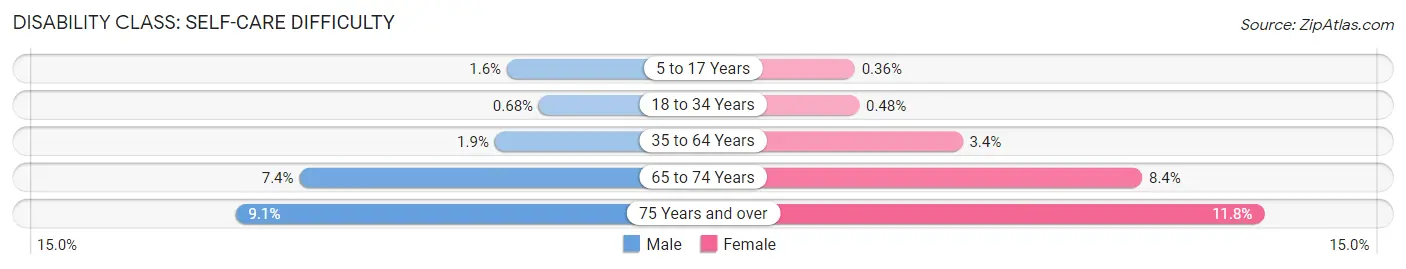
| Age Bracket | Male | Female |
| 5 to 17 Years | 41 (1.6%) | 9 (0.4%) |
| 18 to 34 Years | 29 (0.7%) | 18 (0.5%) |
| 35 to 64 Years | 128 (1.9%) | 206 (3.4%) |
| 65 to 74 Years | 146 (7.3%) | 173 (8.4%) |
| 75 Years and over | 102 (9.1%) | 164 (11.8%) |
Technology Access in Silver Bow County
Computing Device Access in Silver Bow County
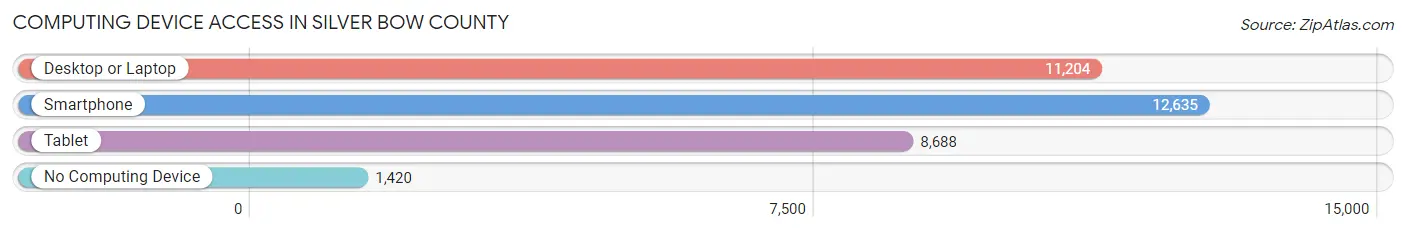
| Device Type | # Households | % Households |
| Desktop or Laptop | 11,204 | 74.3% |
| Smartphone | 12,635 | 83.8% |
| Tablet | 8,688 | 57.6% |
| No Computing Device | 1,420 | 9.4% |
| Total | 15,080 | 100.0% |
Internet Access in Silver Bow County
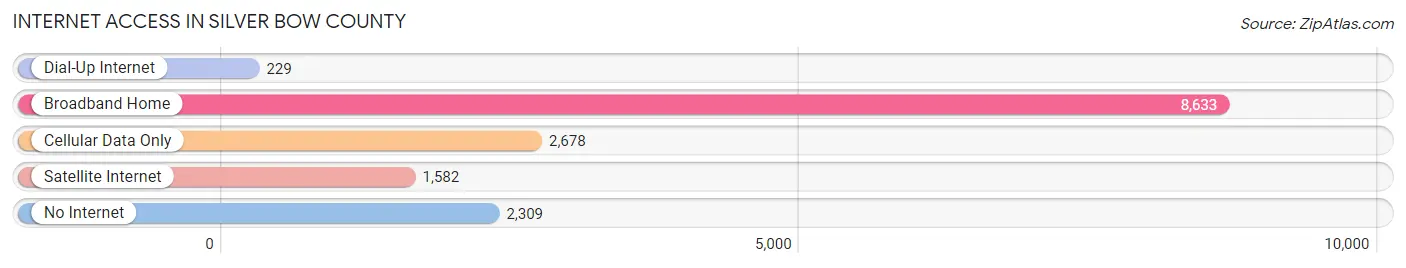
| Internet Type | # Households | % Households |
| Dial-Up Internet | 229 | 1.5% |
| Broadband Home | 8,633 | 57.3% |
| Cellular Data Only | 2,678 | 17.8% |
| Satellite Internet | 1,582 | 10.5% |
| No Internet | 2,309 | 15.3% |
| Total | 15,080 | 100.0% |
Silver Bow County Summary
Introduction
Silver Bow County is located in the southwestern part of Montana, and is part of the Butte-Silver Bow metropolitan area. It is the second most populous county in the state, with a population of 34,200 in 2019. The county seat is Butte, which is also the largest city in the county. Silver Bow County is home to a diverse population, with a mix of Native American, European, and Hispanic residents. The county is known for its rich mining history, and is home to the World Museum of Mining, which is dedicated to preserving the history of the area’s mining industry.
Geography
Silver Bow County is located in the southwestern part of Montana, and is bordered by Beaverhead County to the north, Madison County to the east, Jefferson County to the south, and Deer Lodge County to the west. The county covers an area of 1,717 square miles, and is the second largest county in the state. The county is located in the Rocky Mountains, and is home to several mountain ranges, including the Anaconda Range, the Big Belt Mountains, and the Highland Mountains. The highest point in the county is Mount Haggin, which has an elevation of 9,890 feet. The county is also home to several rivers, including the Big Hole River, the Beaverhead River, and the Jefferson River.
The climate of Silver Bow County is semi-arid, with hot summers and cold winters. The average annual temperature is 44 degrees Fahrenheit, and the average annual precipitation is 13.5 inches.
Economy
Silver Bow County’s economy is largely based on mining and tourism. The county is home to several large mining companies, including the Anaconda Copper Mining Company, which is the largest employer in the county. The county is also home to several tourist attractions, including the World Museum of Mining, the Butte-Silver Bow Historic District, and the Berkeley Pit.
The county’s unemployment rate was 4.2% in 2019, which is lower than the national average of 3.7%. The median household income in the county was $45,845 in 2019, which is lower than the national average of $61,937.
Demographics
As of 2019, Silver Bow County had a population of 34,200, which is an increase of 1.3% from the 2010 census. The population is made up of a mix of Native American, European, and Hispanic residents. The largest ethnic group in the county is white, which makes up 79.3% of the population. The second largest ethnic group is Native American, which makes up 8.3% of the population. The third largest ethnic group is Hispanic, which makes up 6.2% of the population.
The median age in the county is 40.3, and the median household income is $45,845. The poverty rate in the county is 13.2%, which is higher than the national average of 11.8%.
Conclusion
Silver Bow County is located in the southwestern part of Montana, and is home to a diverse population. The county is known for its rich mining history, and is home to several large mining companies. The county’s economy is largely based on mining and tourism, and the unemployment rate is lower than the national average. The population of the county is made up of a mix of Native American, European, and Hispanic residents, and the median household income is lower than the national average.
Common Questions
What is Per Capita Income in Silver Bow County?
Per Capita income in Silver Bow County is $35,047.
What is the Median Family Income in Silver Bow County?
Median Family Income in Silver Bow County is $74,509.
What is the Median Household income in Silver Bow County?
Median Household Income in Silver Bow County is $56,297.
What is Income or Wage Gap in Silver Bow County?
Income or Wage Gap in Silver Bow County is 27.5%.
Women in Silver Bow County earn 72.5 cents for every dollar earned by a man.
What is Family Income Deficit in Silver Bow County?
Family Income Deficit in Silver Bow County is $10,687.
Families that are below poverty line in Silver Bow County earn $10,687 less on average than the poverty threshold level.
What is Inequality or Gini Index in Silver Bow County?
Inequality or Gini Index in Silver Bow County is 0.50.
What is the Total Population of Silver Bow County?
Total Population of Silver Bow County is 35,306.
What is the Total Male Population of Silver Bow County?
Total Male Population of Silver Bow County is 18,120.
What is the Total Female Population of Silver Bow County?
Total Female Population of Silver Bow County is 17,186.
What is the Ratio of Males per 100 Females in Silver Bow County?
There are 105.43 Males per 100 Females in Silver Bow County.
What is the Ratio of Females per 100 Males in Silver Bow County?
There are 94.85 Females per 100 Males in Silver Bow County.
What is the Median Population Age in Silver Bow County?
Median Population Age in Silver Bow County is 40.3 Years.
What is the Average Family Size in Silver Bow County
Average Family Size in Silver Bow County is 3.1 People.
What is the Average Household Size in Silver Bow County
Average Household Size in Silver Bow County is 2.2 People.
How Large is the Labor Force in Silver Bow County?
There are 17,320 People in the Labor Forcein in Silver Bow County.
What is the Percentage of People in the Labor Force in Silver Bow County?
60.1% of People are in the Labor Force in Silver Bow County.
What is the Unemployment Rate in Silver Bow County?
Unemployment Rate in Silver Bow County is 4.6%.