Blaine County, MT Map & Demographics
Blaine County Map
Blaine County Overview
$24,353
PER CAPITA INCOME
$69,949
AVG FAMILY INCOME
$58,507
AVG HOUSEHOLD INCOME
6.9%
WAGE / INCOME GAP [ % ]
93.1¢/ $1
WAGE / INCOME GAP [ $ ]
$11,523
FAMILY INCOME DEFICIT
0.44
INEQUALITY / GINI INDEX
7,030
TOTAL POPULATION
3,530
MALE POPULATION
3,500
FEMALE POPULATION
100.86
MALES / 100 FEMALES
99.15
FEMALES / 100 MALES
33.6
MEDIAN AGE
3.8
AVG FAMILY SIZE
3.0
AVG HOUSEHOLD SIZE
3,084
LABOR FORCE [ PEOPLE ]
60.0%
PERCENT IN LABOR FORCE
13.2%
UNEMPLOYMENT RATE
Blaine County Area Codes
Income in Blaine County
Income Overview in Blaine County
Per Capita Income in Blaine County is $24,353, while median incomes of families and households are $69,949 and $58,507 respectively.
| Characteristic | Number | Measure |
| Per Capita Income | 7,030 | $24,353 |
| Median Family Income | 1,540 | $69,949 |
| Mean Family Income | 1,540 | $82,613 |
| Median Household Income | 2,271 | $58,507 |
| Mean Household Income | 2,271 | $68,530 |
| Income Deficit | 1,540 | $11,523 |
| Wage / Income Gap (%) | 7,030 | 6.91% |
| Wage / Income Gap ($) | 7,030 | 93.09¢ per $1 |
| Gini / Inequality Index | 7,030 | 0.44 |
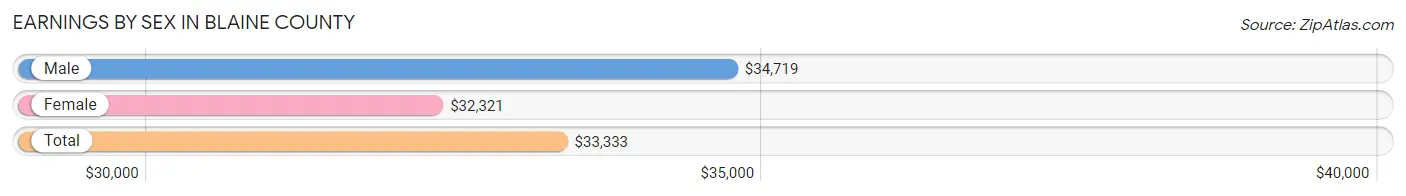
Earnings by Sex in Blaine County
Average Earnings in Blaine County are $33,333, $34,719 for men and $32,321 for women, a difference of 6.9%.
| Sex | Number | Average Earnings |
| Male | 1,671 (51.1%) | $34,719 |
| Female | 1,599 (48.9%) | $32,321 |
| Total | 3,270 (100.0%) | $33,333 |
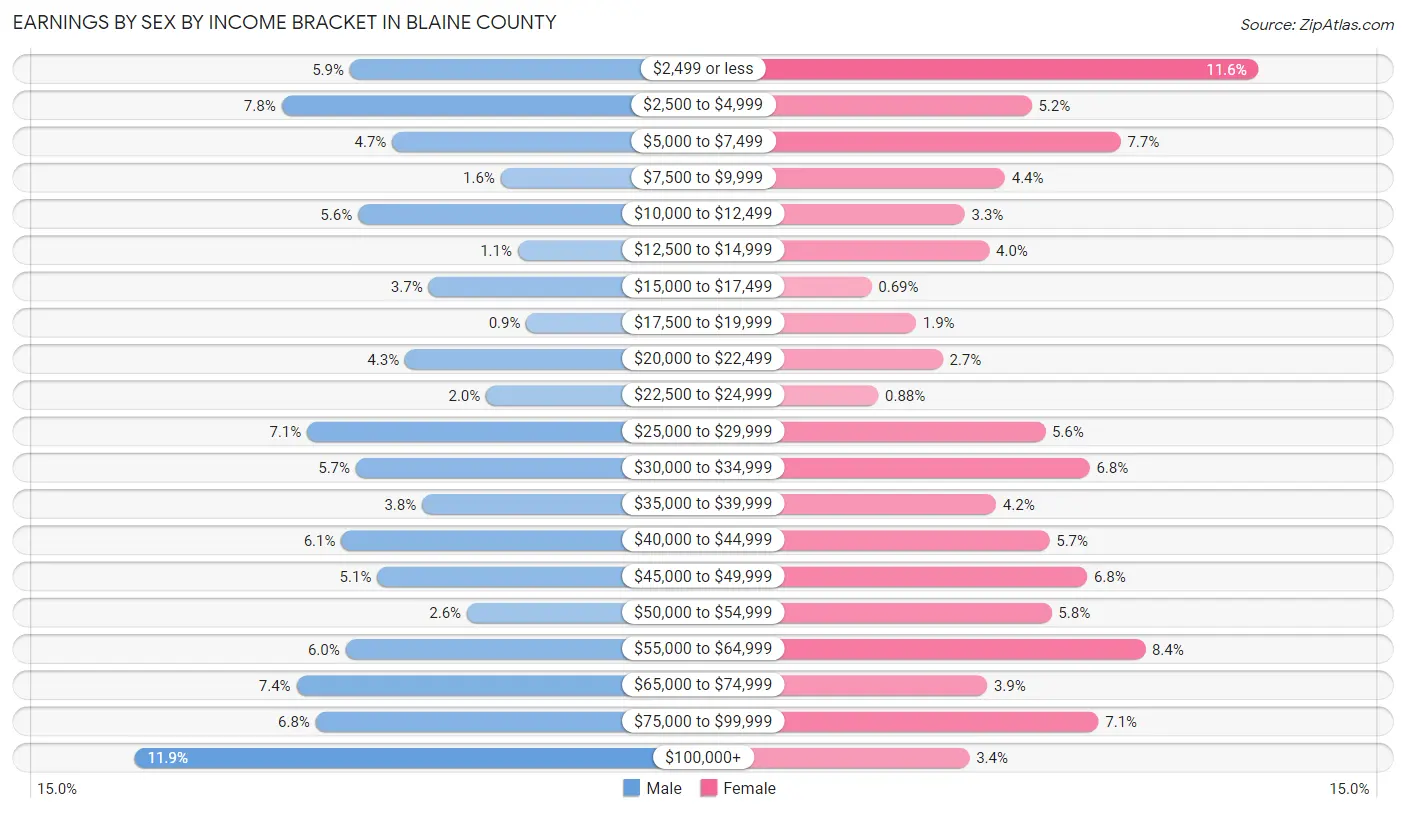
Earnings by Sex by Income Bracket in Blaine County
The most common earnings brackets in Blaine County are $100,000+ for men (199 | 11.9%) and $2,499 or less for women (185 | 11.6%).
| Income | Male | Female |
| $2,499 or less | 98 (5.9%) | 185 (11.6%) |
| $2,500 to $4,999 | 130 (7.8%) | 83 (5.2%) |
| $5,000 to $7,499 | 78 (4.7%) | 123 (7.7%) |
| $7,500 to $9,999 | 27 (1.6%) | 71 (4.4%) |
| $10,000 to $12,499 | 94 (5.6%) | 53 (3.3%) |
| $12,500 to $14,999 | 19 (1.1%) | 64 (4.0%) |
| $15,000 to $17,499 | 61 (3.6%) | 11 (0.7%) |
| $17,500 to $19,999 | 15 (0.9%) | 31 (1.9%) |
| $20,000 to $22,499 | 72 (4.3%) | 43 (2.7%) |
| $22,500 to $24,999 | 34 (2.0%) | 14 (0.9%) |
| $25,000 to $29,999 | 118 (7.1%) | 89 (5.6%) |
| $30,000 to $34,999 | 95 (5.7%) | 109 (6.8%) |
| $35,000 to $39,999 | 64 (3.8%) | 67 (4.2%) |
| $40,000 to $44,999 | 102 (6.1%) | 91 (5.7%) |
| $45,000 to $49,999 | 85 (5.1%) | 108 (6.8%) |
| $50,000 to $54,999 | 43 (2.6%) | 92 (5.8%) |
| $55,000 to $64,999 | 100 (6.0%) | 134 (8.4%) |
| $65,000 to $74,999 | 123 (7.4%) | 63 (3.9%) |
| $75,000 to $99,999 | 114 (6.8%) | 113 (7.1%) |
| $100,000+ | 199 (11.9%) | 55 (3.4%) |
| Total | 1,671 (100.0%) | 1,599 (100.0%) |
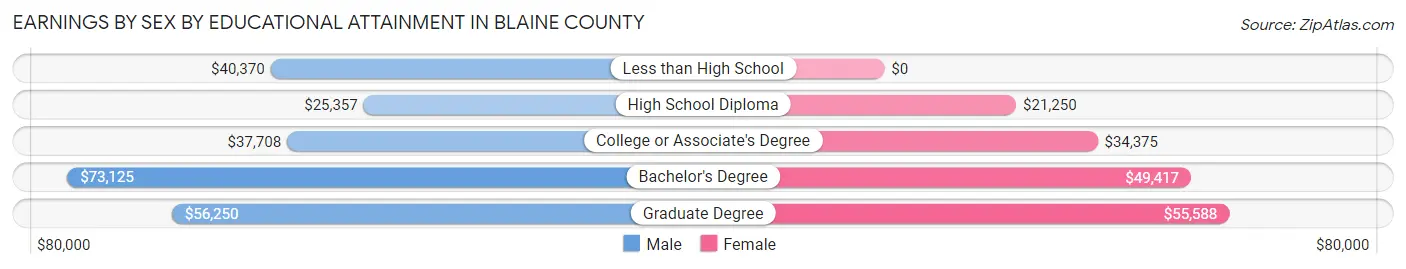
Earnings by Sex by Educational Attainment in Blaine County
Average earnings in Blaine County are $40,519 for men and $38,333 for women, a difference of 5.4%. Men with an educational attainment of bachelor's degree enjoy the highest average annual earnings of $73,125, while those with high school diploma education earn the least with $25,357. Women with an educational attainment of graduate degree earn the most with the average annual earnings of $55,588, while those with high school diploma education have the smallest earnings of $21,250.
| Educational Attainment | Male Income | Female Income |
| Less than High School | $40,370 | $0 |
| High School Diploma | $25,357 | $21,250 |
| College or Associate's Degree | $37,708 | $34,375 |
| Bachelor's Degree | $73,125 | $49,417 |
| Graduate Degree | $56,250 | $55,588 |
| Total | $40,519 | $38,333 |
Family Income in Blaine County
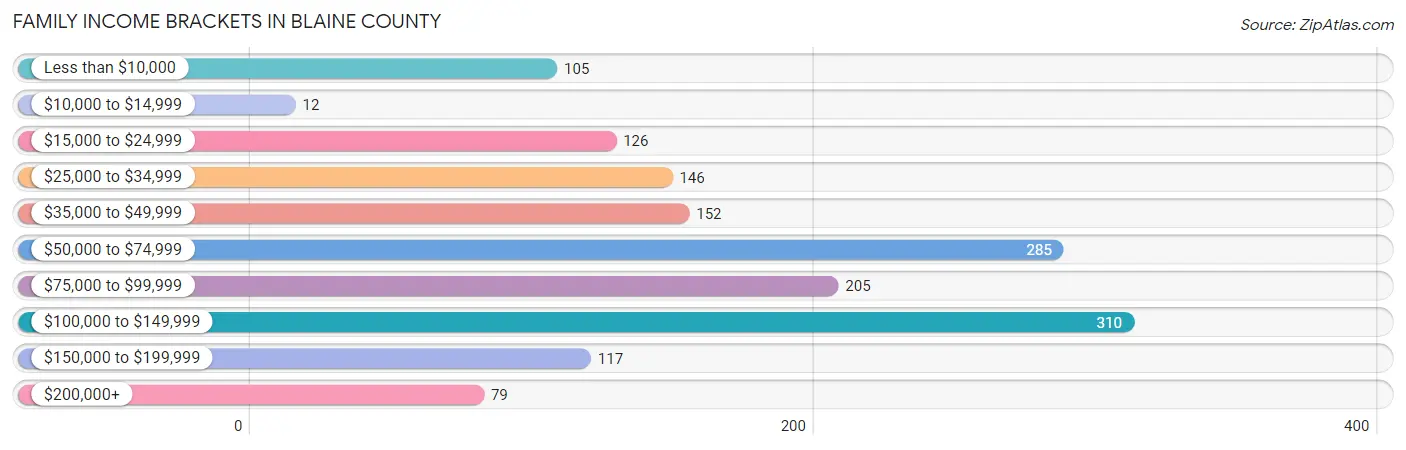
Family Income Brackets in Blaine County
According to the Blaine County family income data, there are 310 families falling into the $100,000 to $149,999 income range, which is the most common income bracket and makes up 20.1% of all families. Conversely, the $10,000 to $14,999 income bracket is the least frequent group with only 12 families (0.8%) belonging to this category.
| Income Bracket | # Families | % Families |
| Less than $10,000 | 105 | 6.8% |
| $10,000 to $14,999 | 12 | 0.8% |
| $15,000 to $24,999 | 126 | 8.2% |
| $25,000 to $34,999 | 146 | 9.5% |
| $35,000 to $49,999 | 152 | 9.9% |
| $50,000 to $74,999 | 285 | 18.5% |
| $75,000 to $99,999 | 205 | 13.3% |
| $100,000 to $149,999 | 310 | 20.1% |
| $150,000 to $199,999 | 117 | 7.6% |
| $200,000+ | 79 | 5.1% |
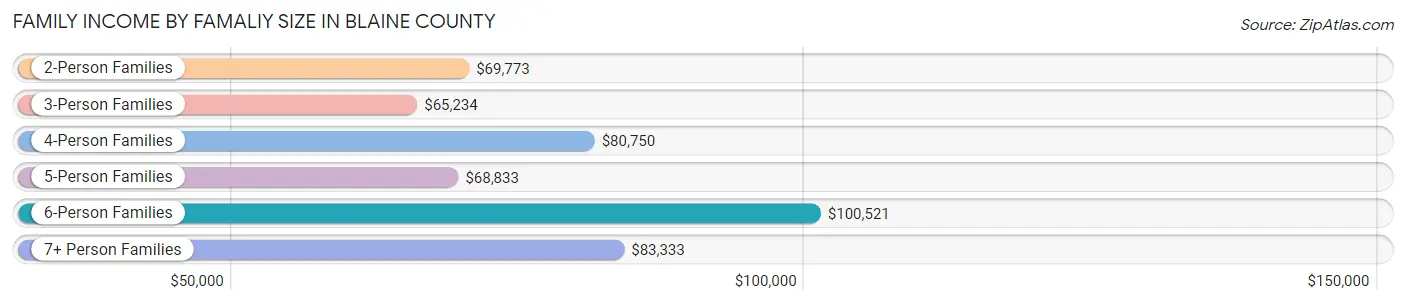
Family Income by Famaliy Size in Blaine County
6-person families (81 | 5.3%) account for the highest median family income in Blaine County with $100,521 per family, while 2-person families (672 | 43.6%) have the highest median income of $34,886 per family member.
| Income Bracket | # Families | Median Income |
| 2-Person Families | 672 (43.6%) | $69,773 |
| 3-Person Families | 305 (19.8%) | $65,234 |
| 4-Person Families | 296 (19.2%) | $80,750 |
| 5-Person Families | 132 (8.6%) | $68,833 |
| 6-Person Families | 81 (5.3%) | $100,521 |
| 7+ Person Families | 54 (3.5%) | $83,333 |
| Total | 1,540 (100.0%) | $69,949 |
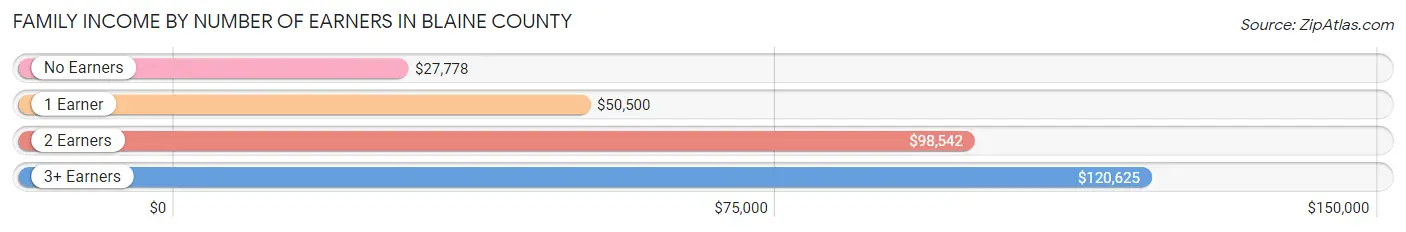
Family Income by Number of Earners in Blaine County
The median family income in Blaine County is $69,949, with families comprising 3+ earners (119) having the highest median family income of $120,625, while families with no earners (176) have the lowest median family income of $27,778, accounting for 7.7% and 11.4% of families, respectively.
| Number of Earners | # Families | Median Income |
| No Earners | 176 (11.4%) | $27,778 |
| 1 Earner | 618 (40.1%) | $50,500 |
| 2 Earners | 627 (40.7%) | $98,542 |
| 3+ Earners | 119 (7.7%) | $120,625 |
| Total | 1,540 (100.0%) | $69,949 |
Household Income in Blaine County
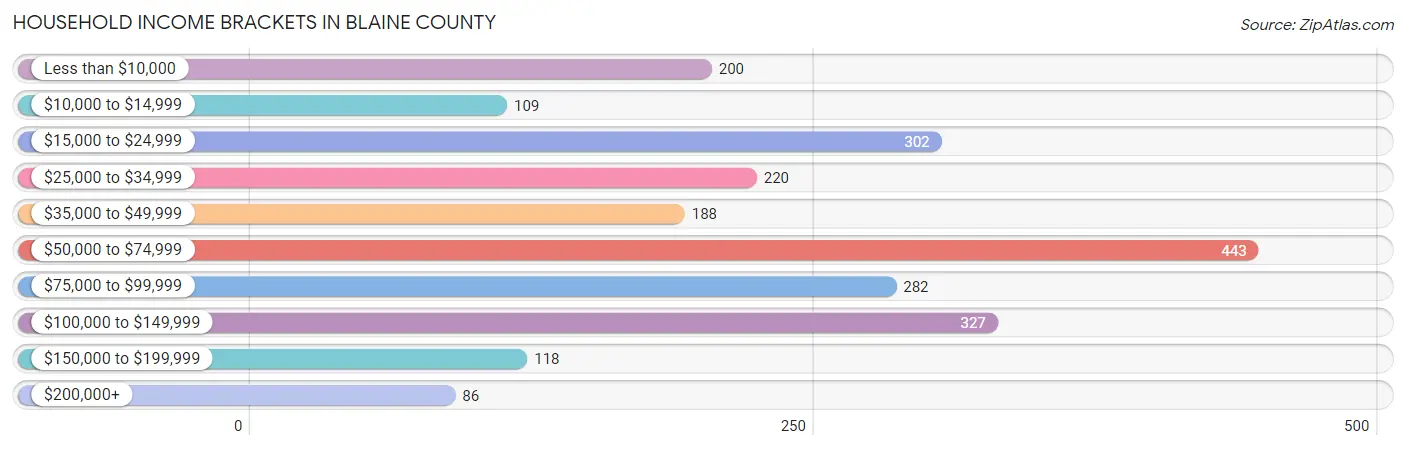
Household Income Brackets in Blaine County
With 443 households falling in the category, the $50,000 to $74,999 income range is the most frequent in Blaine County, accounting for 19.5% of all households. In contrast, only 86 households (3.8%) fall into the $200,000+ income bracket, making it the least populous group.
| Income Bracket | # Households | % Households |
| Less than $10,000 | 200 | 8.8% |
| $10,000 to $14,999 | 109 | 4.8% |
| $15,000 to $24,999 | 302 | 13.3% |
| $25,000 to $34,999 | 220 | 9.7% |
| $35,000 to $49,999 | 188 | 8.3% |
| $50,000 to $74,999 | 443 | 19.5% |
| $75,000 to $99,999 | 282 | 12.4% |
| $100,000 to $149,999 | 327 | 14.4% |
| $150,000 to $199,999 | 118 | 5.2% |
| $200,000+ | 86 | 3.8% |
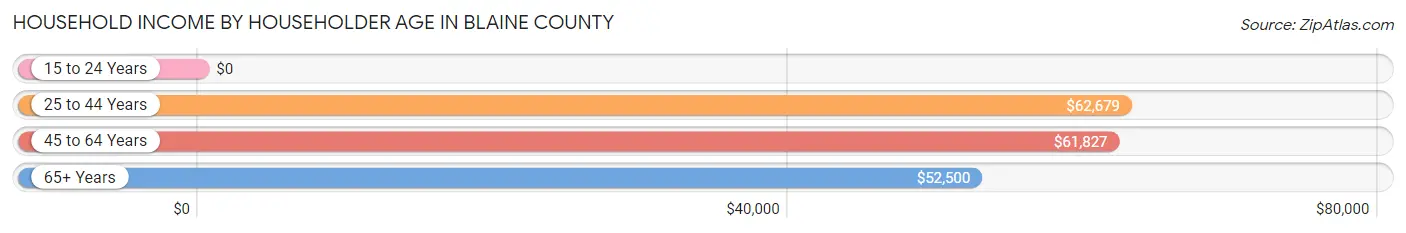
Household Income by Householder Age in Blaine County
The median household income in Blaine County is $58,507, with the highest median household income of $62,679 found in the 25 to 44 years age bracket for the primary householder. A total of 695 households (30.6%) fall into this category. Meanwhile, the 15 to 24 years age bracket for the primary householder has the lowest median household income of $0, with 39 households (1.7%) in this group.
| Income Bracket | # Households | Median Income |
| 15 to 24 Years | 39 (1.7%) | $0 |
| 25 to 44 Years | 695 (30.6%) | $62,679 |
| 45 to 64 Years | 805 (35.4%) | $61,827 |
| 65+ Years | 732 (32.2%) | $52,500 |
| Total | 2,271 (100.0%) | $58,507 |
Poverty in Blaine County
Income Below Poverty by Sex and Age in Blaine County
With 18.6% poverty level for males and 21.8% for females among the residents of Blaine County, 15 year old males and 25 to 34 year old females are the most vulnerable to poverty, with 38 males (53.5%) and 151 females (32.6%) in their respective age groups living below the poverty level.
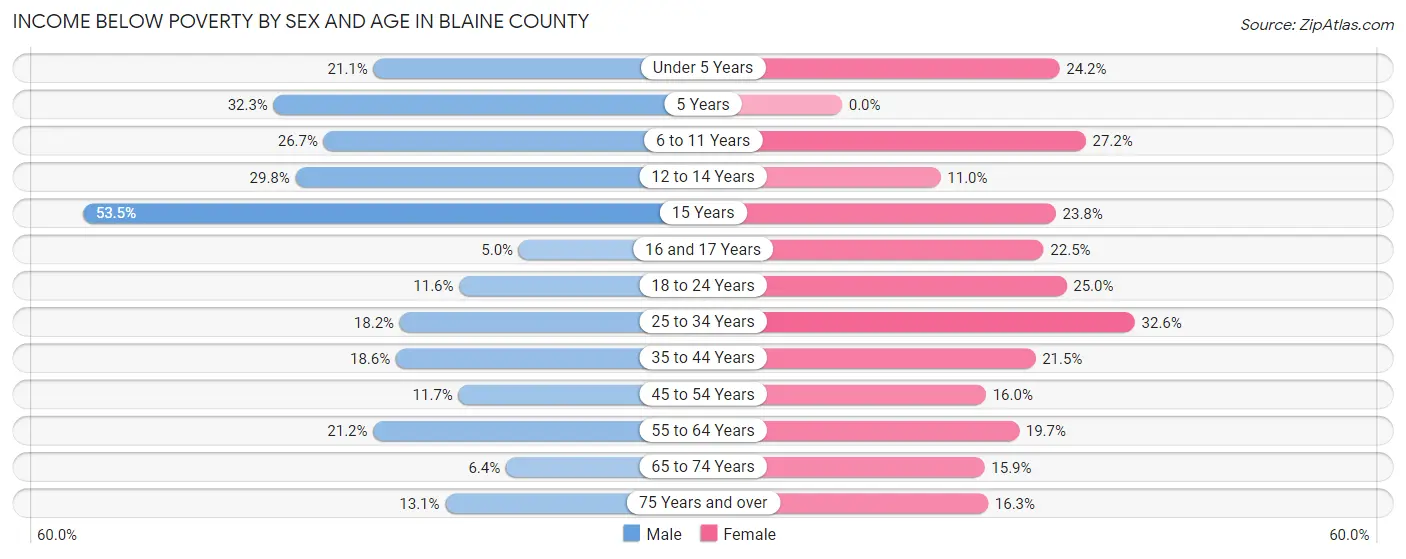
| Age Bracket | Male | Female |
| Under 5 Years | 56 (21.1%) | 63 (24.2%) |
| 5 Years | 30 (32.3%) | 0 (0.0%) |
| 6 to 11 Years | 103 (26.7%) | 98 (27.2%) |
| 12 to 14 Years | 51 (29.8%) | 18 (11.0%) |
| 15 Years | 38 (53.5%) | 15 (23.8%) |
| 16 and 17 Years | 5 (5.0%) | 22 (22.5%) |
| 18 to 24 Years | 36 (11.6%) | 68 (25.0%) |
| 25 to 34 Years | 79 (18.2%) | 151 (32.6%) |
| 35 to 44 Years | 76 (18.6%) | 95 (21.5%) |
| 45 to 54 Years | 38 (11.7%) | 46 (16.0%) |
| 55 to 64 Years | 91 (21.2%) | 83 (19.7%) |
| 65 to 74 Years | 19 (6.4%) | 57 (15.9%) |
| 75 Years and over | 23 (13.1%) | 34 (16.3%) |
| Total | 645 (18.6%) | 750 (21.8%) |
Income Above Poverty by Sex and Age in Blaine County
According to the poverty statistics in Blaine County, males aged 16 and 17 years and females aged 5 years are the age groups that are most secure financially, with 95.1% of males and 100.0% of females in these age groups living above the poverty line.
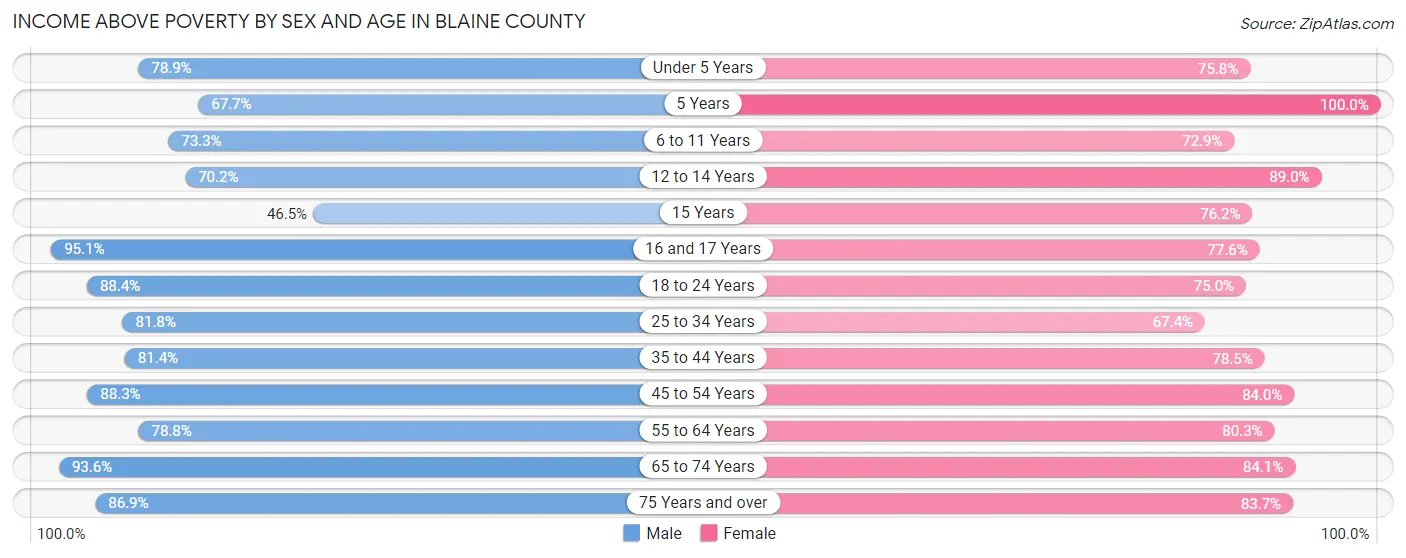
| Age Bracket | Male | Female |
| Under 5 Years | 209 (78.9%) | 197 (75.8%) |
| 5 Years | 63 (67.7%) | 42 (100.0%) |
| 6 to 11 Years | 283 (73.3%) | 263 (72.9%) |
| 12 to 14 Years | 120 (70.2%) | 146 (89.0%) |
| 15 Years | 33 (46.5%) | 48 (76.2%) |
| 16 and 17 Years | 96 (95.1%) | 76 (77.5%) |
| 18 to 24 Years | 275 (88.4%) | 204 (75.0%) |
| 25 to 34 Years | 355 (81.8%) | 312 (67.4%) |
| 35 to 44 Years | 332 (81.4%) | 346 (78.5%) |
| 45 to 54 Years | 288 (88.3%) | 241 (84.0%) |
| 55 to 64 Years | 339 (78.8%) | 338 (80.3%) |
| 65 to 74 Years | 279 (93.6%) | 302 (84.1%) |
| 75 Years and over | 152 (86.9%) | 175 (83.7%) |
| Total | 2,824 (81.4%) | 2,690 (78.2%) |
Income Below Poverty Among Married-Couple Families in Blaine County
The poverty statistics for married-couple families in Blaine County show that 7.3% or 69 of the total 944 families live below the poverty line. Families with 5 or more children have the highest poverty rate of 44.0%, comprising of 11 families. On the other hand, families with 1 or 2 children have the lowest poverty rate of 2.5%, which includes 7 families.
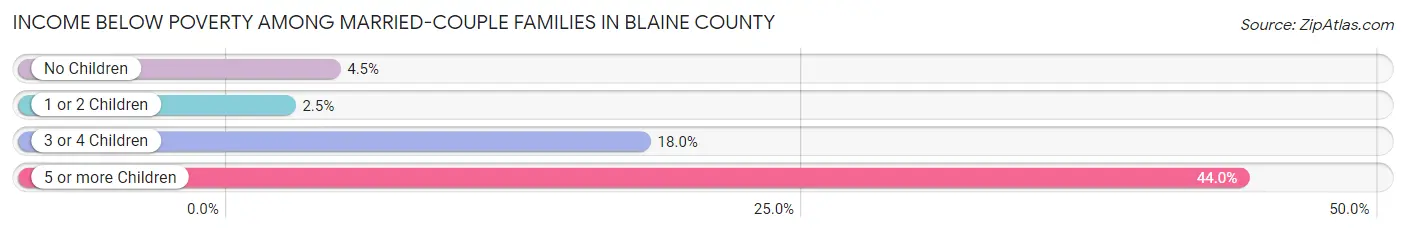
| Children | Above Poverty | Below Poverty |
| No Children | 451 (95.6%) | 21 (4.4%) |
| 1 or 2 Children | 273 (97.5%) | 7 (2.5%) |
| 3 or 4 Children | 137 (82.0%) | 30 (18.0%) |
| 5 or more Children | 14 (56.0%) | 11 (44.0%) |
| Total | 875 (92.7%) | 69 (7.3%) |
Income Below Poverty Among Single-Parent Households in Blaine County
According to the poverty data in Blaine County, 38.5% or 79 single-father households and 23.5% or 92 single-mother households are living below the poverty line. Among single-father households, those with 3 or 4 children have the highest poverty rate, with 27 households (52.9%) experiencing poverty. Likewise, among single-mother households, those with 3 or 4 children have the highest poverty rate, with 27 households (51.9%) falling below the poverty line.
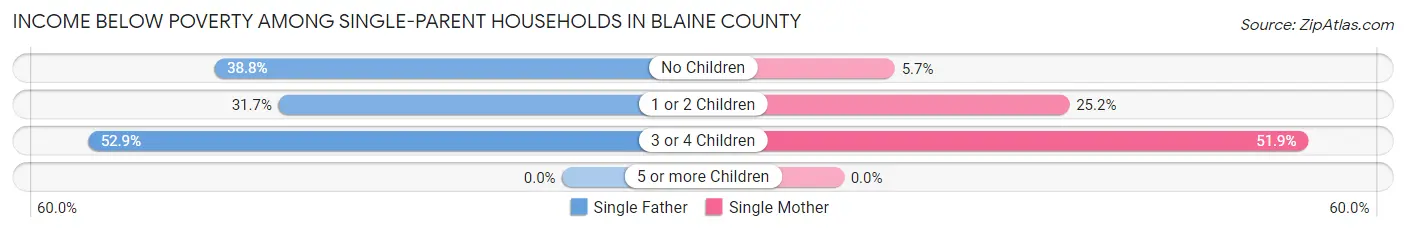
| Children | Single Father | Single Mother |
| No Children | 26 (38.8%) | 6 (5.7%) |
| 1 or 2 Children | 26 (31.7%) | 59 (25.2%) |
| 3 or 4 Children | 27 (52.9%) | 27 (51.9%) |
| 5 or more Children | 0 (0.0%) | 0 (0.0%) |
| Total | 79 (38.5%) | 92 (23.5%) |
Income Below Poverty Among Married-Couple vs Single-Parent Households in Blaine County
The poverty data for Blaine County shows that 69 of the married-couple family households (7.3%) and 171 of the single-parent households (28.7%) are living below the poverty level. Within the married-couple family households, those with 5 or more children have the highest poverty rate, with 11 households (44.0%) falling below the poverty line. Among the single-parent households, those with 3 or 4 children have the highest poverty rate, with 54 household (52.4%) living below poverty.
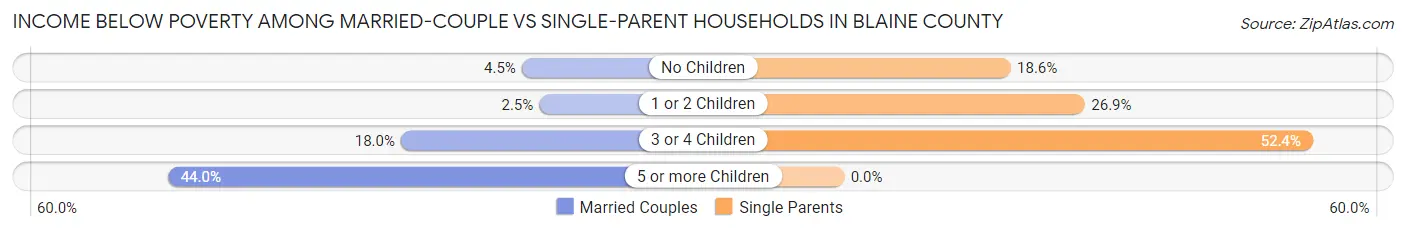
| Children | Married-Couple Families | Single-Parent Households |
| No Children | 21 (4.4%) | 32 (18.6%) |
| 1 or 2 Children | 7 (2.5%) | 85 (26.9%) |
| 3 or 4 Children | 30 (18.0%) | 54 (52.4%) |
| 5 or more Children | 11 (44.0%) | 0 (0.0%) |
| Total | 69 (7.3%) | 171 (28.7%) |
Race in Blaine County
The most populous races in Blaine County are Native / Alaskan (3,636 | 51.7%), White / Caucasian (3,060 | 43.5%), and Two or more Races (256 | 3.6%).
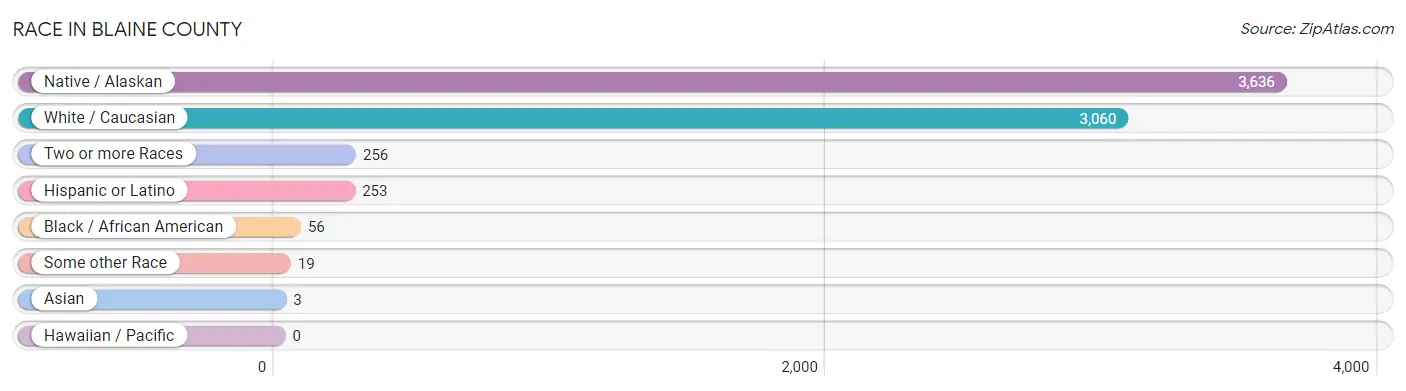
| Race | # Population | % Population |
| Asian | 3 | 0.0% |
| Black / African American | 56 | 0.8% |
| Hawaiian / Pacific | 0 | 0.0% |
| Hispanic or Latino | 253 | 3.6% |
| Native / Alaskan | 3,636 | 51.7% |
| White / Caucasian | 3,060 | 43.5% |
| Two or more Races | 256 | 3.6% |
| Some other Race | 19 | 0.3% |
| Total | 7,030 | 100.0% |
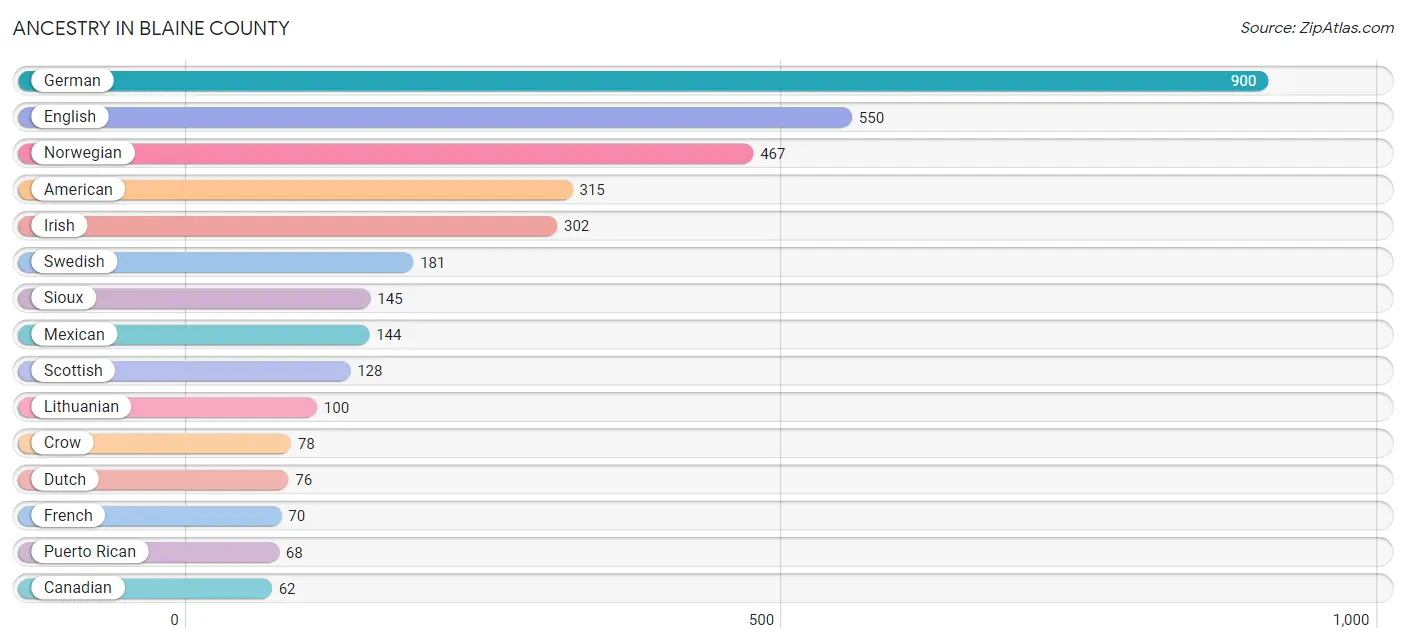
Ancestry in Blaine County
The most populous ancestries reported in Blaine County are German (900 | 12.8%), English (550 | 7.8%), Norwegian (467 | 6.6%), American (315 | 4.5%), and Irish (302 | 4.3%), together accounting for 36.0% of all Blaine County residents.
| Ancestry | # Population | % Population |
| African | 11 | 0.2% |
| Alaska Native | 3 | 0.0% |
| American | 315 | 4.5% |
| Austrian | 23 | 0.3% |
| Belgian | 2 | 0.0% |
| Blackfeet | 54 | 0.8% |
| British | 2 | 0.0% |
| Burmese | 3 | 0.0% |
| Canadian | 62 | 0.9% |
| Central American | 30 | 0.4% |
| Cheyenne | 5 | 0.1% |
| Chippewa | 38 | 0.5% |
| Cree | 35 | 0.5% |
| Croatian | 1 | 0.0% |
| Crow | 78 | 1.1% |
| Czech | 5 | 0.1% |
| Danish | 35 | 0.5% |
| Dutch | 76 | 1.1% |
| English | 550 | 7.8% |
| European | 22 | 0.3% |
| Finnish | 34 | 0.5% |
| French | 70 | 1.0% |
| French American Indian | 11 | 0.2% |
| French Canadian | 3 | 0.0% |
| German | 900 | 12.8% |
| Guatemalan | 16 | 0.2% |
| Irish | 302 | 4.3% |
| Italian | 29 | 0.4% |
| Lithuanian | 100 | 1.4% |
| Luxembourger | 1 | 0.0% |
| Mexican | 144 | 2.1% |
| Nicaraguan | 14 | 0.2% |
| Nigerian | 2 | 0.0% |
| Norwegian | 467 | 6.6% |
| Paiute | 40 | 0.6% |
| Pennsylvania German | 59 | 0.8% |
| Polish | 47 | 0.7% |
| Puerto Rican | 68 | 1.0% |
| Russian | 8 | 0.1% |
| Scandinavian | 25 | 0.4% |
| Scotch-Irish | 23 | 0.3% |
| Scottish | 128 | 1.8% |
| Sioux | 145 | 2.1% |
| Slovak | 5 | 0.1% |
| Slovene | 3 | 0.0% |
| Spaniard | 10 | 0.1% |
| Spanish | 1 | 0.0% |
| Subsaharan African | 13 | 0.2% |
| Swedish | 181 | 2.6% |
| Swiss | 4 | 0.1% |
| Ukrainian | 10 | 0.1% |
| Welsh | 16 | 0.2% |
| Yaqui | 7 | 0.1% |
| Yugoslavian | 2 | 0.0% | View All 54 Rows |
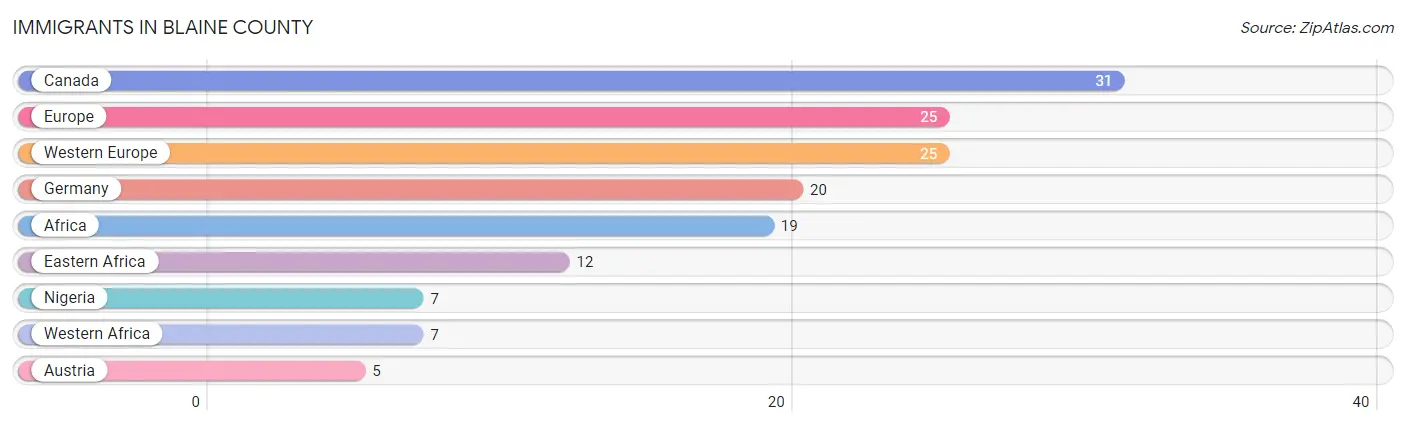
Immigrants in Blaine County
The most numerous immigrant groups reported in Blaine County came from Canada (31 | 0.4%), Europe (25 | 0.4%), Western Europe (25 | 0.4%), Germany (20 | 0.3%), and Africa (19 | 0.3%), together accounting for 1.7% of all Blaine County residents.
| Immigration Origin | # Population | % Population |
| Africa | 19 | 0.3% |
| Austria | 5 | 0.1% |
| Canada | 31 | 0.4% |
| Eastern Africa | 12 | 0.2% |
| Europe | 25 | 0.4% |
| Germany | 20 | 0.3% |
| Nigeria | 7 | 0.1% |
| Western Africa | 7 | 0.1% |
| Western Europe | 25 | 0.4% | View All 9 Rows |
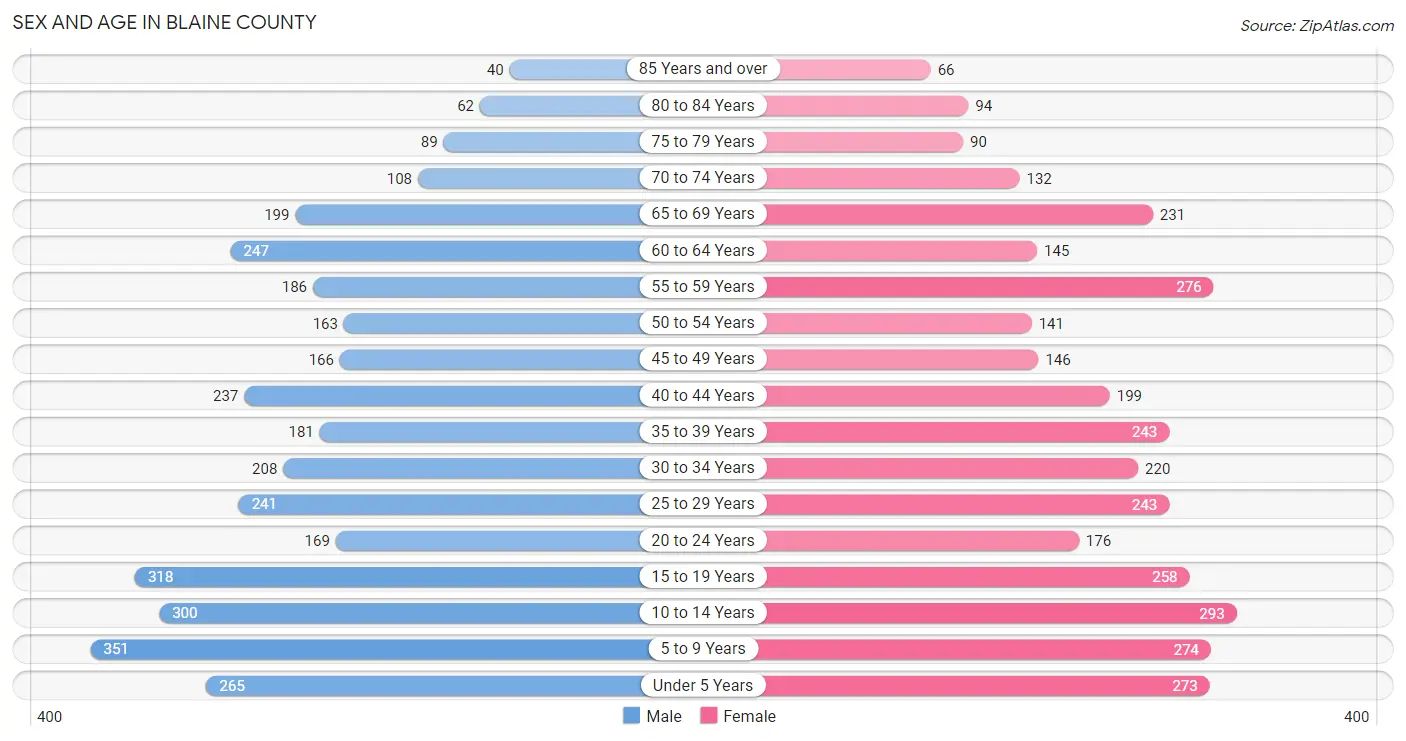
Sex and Age in Blaine County
Sex and Age in Blaine County
The most populous age groups in Blaine County are 5 to 9 Years (351 | 9.9%) for men and 10 to 14 Years (293 | 8.4%) for women.
| Age Bracket | Male | Female |
| Under 5 Years | 265 (7.5%) | 273 (7.8%) |
| 5 to 9 Years | 351 (9.9%) | 274 (7.8%) |
| 10 to 14 Years | 300 (8.5%) | 293 (8.4%) |
| 15 to 19 Years | 318 (9.0%) | 258 (7.4%) |
| 20 to 24 Years | 169 (4.8%) | 176 (5.0%) |
| 25 to 29 Years | 241 (6.8%) | 243 (6.9%) |
| 30 to 34 Years | 208 (5.9%) | 220 (6.3%) |
| 35 to 39 Years | 181 (5.1%) | 243 (6.9%) |
| 40 to 44 Years | 237 (6.7%) | 199 (5.7%) |
| 45 to 49 Years | 166 (4.7%) | 146 (4.2%) |
| 50 to 54 Years | 163 (4.6%) | 141 (4.0%) |
| 55 to 59 Years | 186 (5.3%) | 276 (7.9%) |
| 60 to 64 Years | 247 (7.0%) | 145 (4.1%) |
| 65 to 69 Years | 199 (5.6%) | 231 (6.6%) |
| 70 to 74 Years | 108 (3.1%) | 132 (3.8%) |
| 75 to 79 Years | 89 (2.5%) | 90 (2.6%) |
| 80 to 84 Years | 62 (1.8%) | 94 (2.7%) |
| 85 Years and over | 40 (1.1%) | 66 (1.9%) |
| Total | 3,530 (100.0%) | 3,500 (100.0%) |
Families and Households in Blaine County
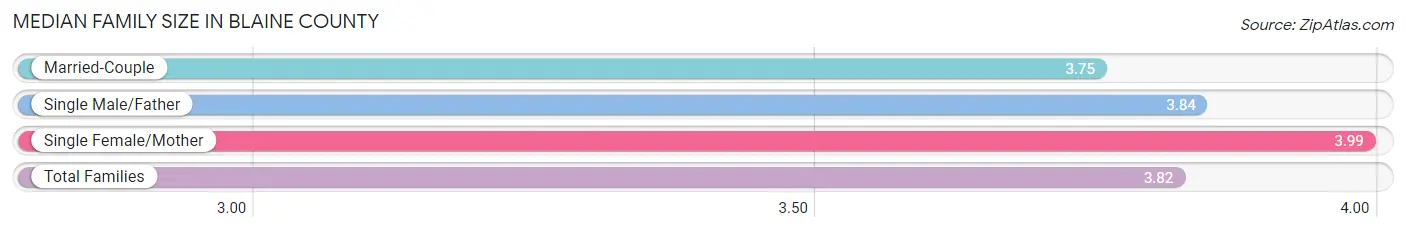
Median Family Size in Blaine County
The median family size in Blaine County is 3.82 persons per family, with single female/mother families (391 | 25.4%) accounting for the largest median family size of 3.99 persons per family. On the other hand, married-couple families (944 | 61.3%) represent the smallest median family size with 3.75 persons per family.
| Family Type | # Families | Family Size |
| Married-Couple | 944 (61.3%) | 3.75 |
| Single Male/Father | 205 (13.3%) | 3.84 |
| Single Female/Mother | 391 (25.4%) | 3.99 |
| Total Families | 1,540 (100.0%) | 3.82 |
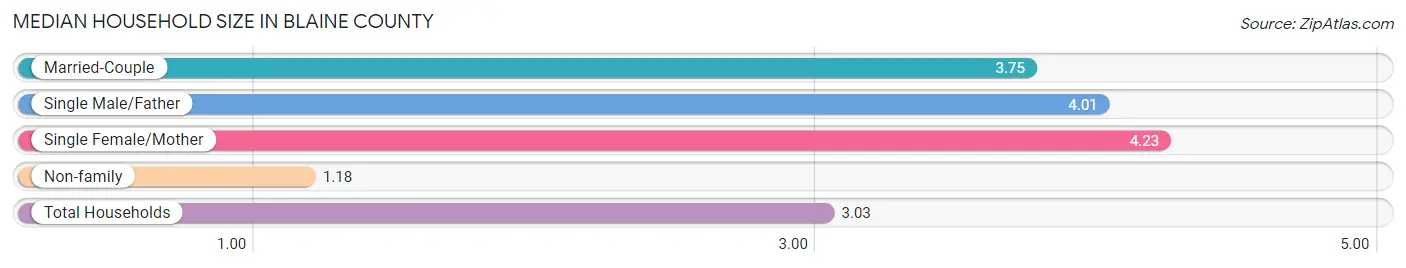
Median Household Size in Blaine County
The median household size in Blaine County is 3.03 persons per household, with single female/mother households (391 | 17.2%) accounting for the largest median household size of 4.23 persons per household. non-family households (731 | 32.2%) represent the smallest median household size with 1.18 persons per household.
| Household Type | # Households | Household Size |
| Married-Couple | 944 (41.6%) | 3.75 |
| Single Male/Father | 205 (9.0%) | 4.01 |
| Single Female/Mother | 391 (17.2%) | 4.23 |
| Non-family | 731 (32.2%) | 1.18 |
| Total Households | 2,271 (100.0%) | 3.03 |
Household Size by Marriage Status in Blaine County
Out of a total of 2,271 households in Blaine County, 1,540 (67.8%) are family households, while 731 (32.2%) are nonfamily households. The most numerous type of family households are 2-person households, comprising 657, and the most common type of nonfamily households are 1-person households, comprising 661.
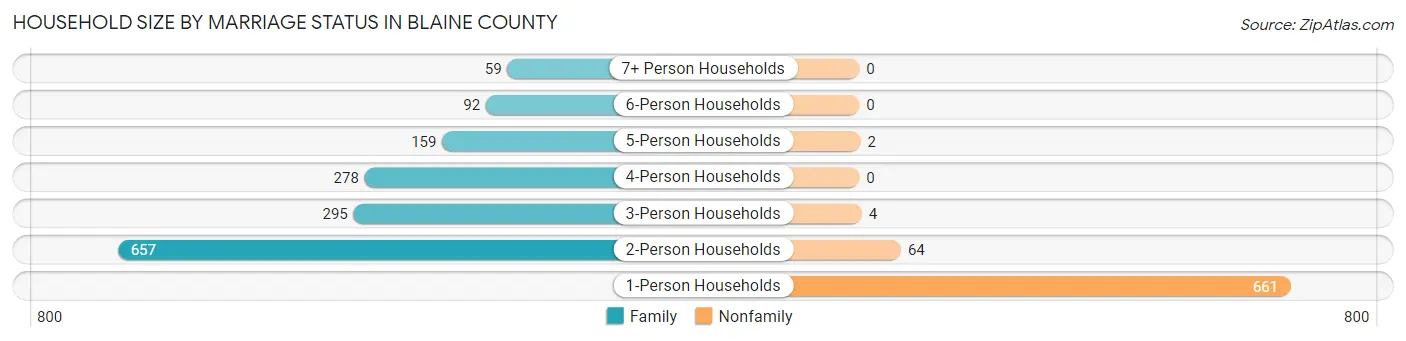
| Household Size | Family Households | Nonfamily Households |
| 1-Person Households | - | 661 (29.1%) |
| 2-Person Households | 657 (28.9%) | 64 (2.8%) |
| 3-Person Households | 295 (13.0%) | 4 (0.2%) |
| 4-Person Households | 278 (12.2%) | 0 (0.0%) |
| 5-Person Households | 159 (7.0%) | 2 (0.1%) |
| 6-Person Households | 92 (4.1%) | 0 (0.0%) |
| 7+ Person Households | 59 (2.6%) | 0 (0.0%) |
| Total | 1,540 (67.8%) | 731 (32.2%) |
Female Fertility in Blaine County
Fertility by Age in Blaine County
Average fertility rate in Blaine County is 60.0 births per 1,000 women. Women in the age bracket of 20 to 34 years have the highest fertility rate with 135.0 births per 1,000 women. Women in the age bracket of 20 to 34 years acount for 93.5% of all women with births.
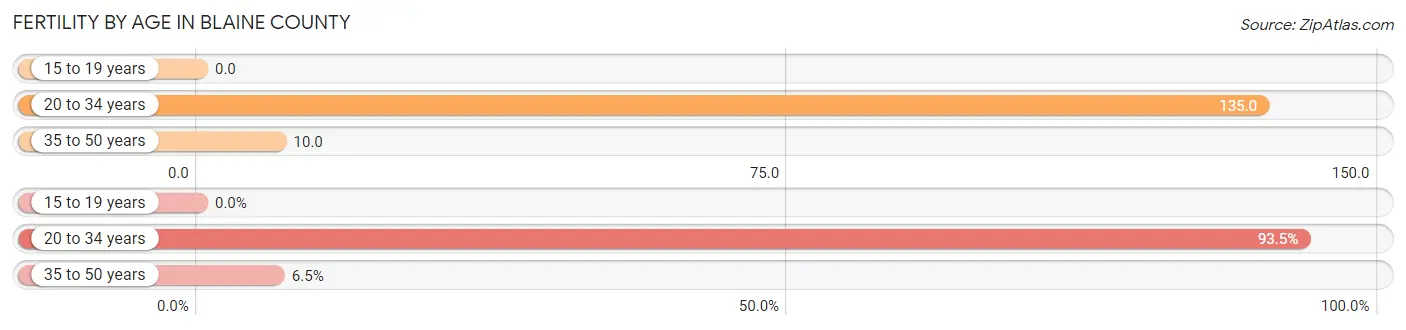
| Age Bracket | Women with Births | Births / 1,000 Women |
| 15 to 19 years | 0 (0.0%) | 0.0 |
| 20 to 34 years | 86 (93.5%) | 135.0 |
| 35 to 50 years | 6 (6.5%) | 10.0 |
| Total | 92 (100.0%) | 60.0 |
Fertility by Age by Marriage Status in Blaine County
91.3% of women with births (92) in Blaine County are married. The highest percentage of unmarried women with births falls into 20 to 34 years age bracket with 9.3% of them unmarried at the time of birth, while the lowest percentage of unmarried women with births belong to 35 to 50 years age bracket with 0.0% of them unmarried.
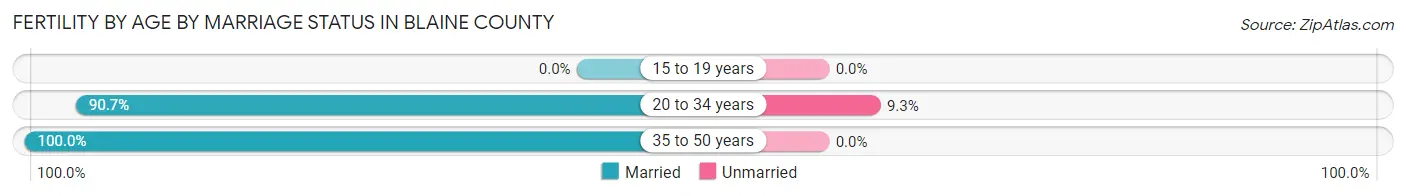
| Age Bracket | Married | Unmarried |
| 15 to 19 years | 0 (0.0%) | 0 (0.0%) |
| 20 to 34 years | 78 (90.7%) | 8 (9.3%) |
| 35 to 50 years | 6 (100.0%) | 0 (0.0%) |
| Total | 84 (91.3%) | 8 (8.7%) |
Fertility by Education in Blaine County
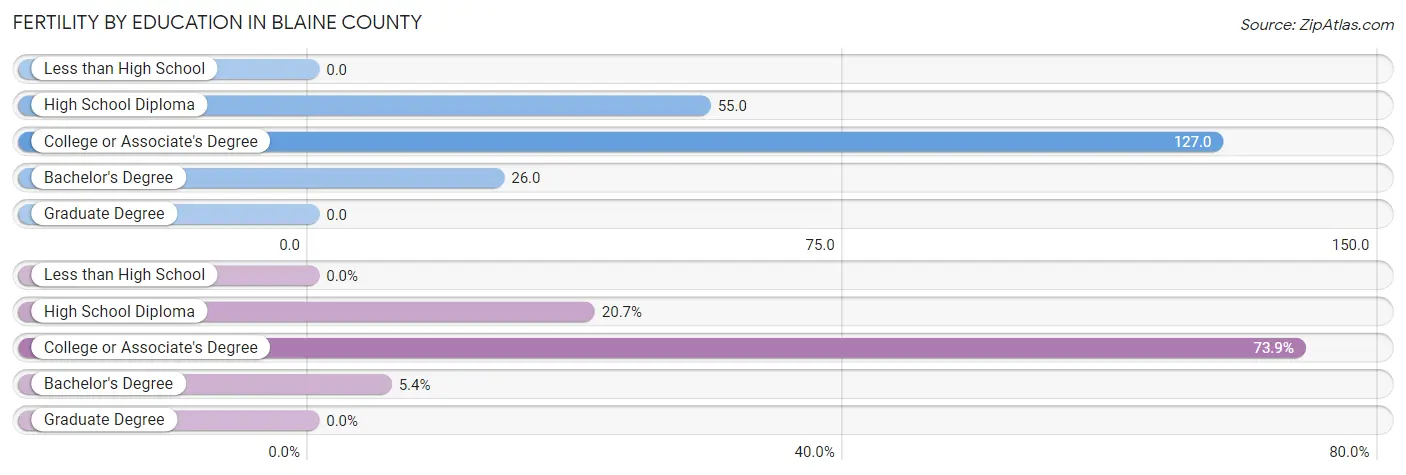
| Educational Attainment | Women with Births | Births / 1,000 Women |
| Less than High School | 0 (0.0%) | 0.0 |
| High School Diploma | 19 (20.6%) | 55.0 |
| College or Associate's Degree | 68 (73.9%) | 127.0 |
| Bachelor's Degree | 5 (5.4%) | 26.0 |
| Graduate Degree | 0 (0.0%) | 0.0 |
| Total | 92 (100.0%) | 60.0 |
Fertility by Education by Marriage Status in Blaine County
8.7% of women with births in Blaine County are unmarried. Women with the educational attainment of high school diploma are most likely to be married with 100.0% of them married at childbirth, while women with the educational attainment of college or associate's degree are least likely to be married with 11.8% of them unmarried at childbirth.
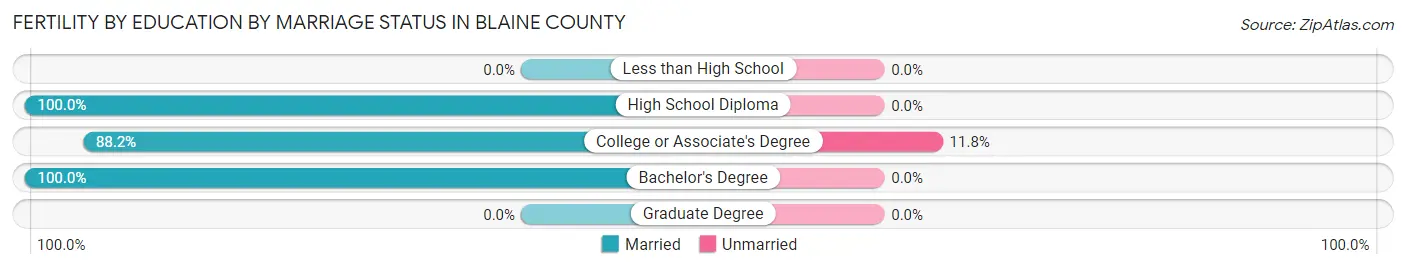
| Educational Attainment | Married | Unmarried |
| Less than High School | 0 (0.0%) | 0 (0.0%) |
| High School Diploma | 19 (100.0%) | 0 (0.0%) |
| College or Associate's Degree | 60 (88.2%) | 8 (11.8%) |
| Bachelor's Degree | 5 (100.0%) | 0 (0.0%) |
| Graduate Degree | 0 (0.0%) | 0 (0.0%) |
| Total | 84 (91.3%) | 8 (8.7%) |
Employment Characteristics in Blaine County
Employment by Class of Employer in Blaine County
Among the 2,563 employed individuals in Blaine County, private company employees (1,038 | 40.5%), local government employees (446 | 17.4%), and federal government employees (316 | 12.3%) make up the most common classes of employment.
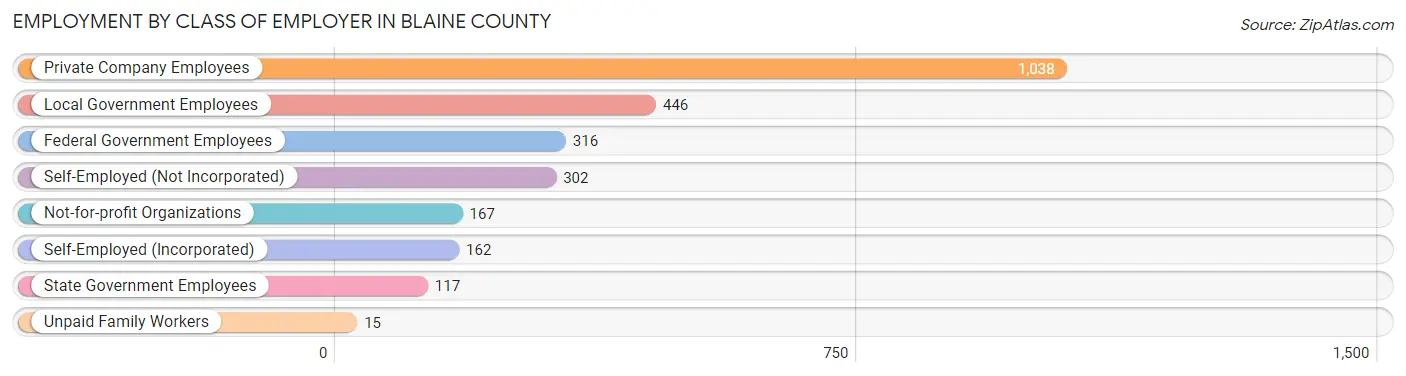
| Employer Class | # Employees | % Employees |
| Private Company Employees | 1,038 | 40.5% |
| Self-Employed (Incorporated) | 162 | 6.3% |
| Self-Employed (Not Incorporated) | 302 | 11.8% |
| Not-for-profit Organizations | 167 | 6.5% |
| Local Government Employees | 446 | 17.4% |
| State Government Employees | 117 | 4.6% |
| Federal Government Employees | 316 | 12.3% |
| Unpaid Family Workers | 15 | 0.6% |
| Total | 2,563 | 100.0% |
Employment Status by Age in Blaine County
According to the labor force statistics for Blaine County, out of the total population over 16 years of age (5,140), 60.0% or 3,084 individuals are in the labor force, with 13.2% or 407 of them unemployed. The age group with the highest labor force participation rate is 30 to 34 years, with 81.3% or 348 individuals in the labor force. Within the labor force, the 20 to 24 years age range has the highest percentage of unemployed individuals, with 44.5% or 97 of them being unemployed.
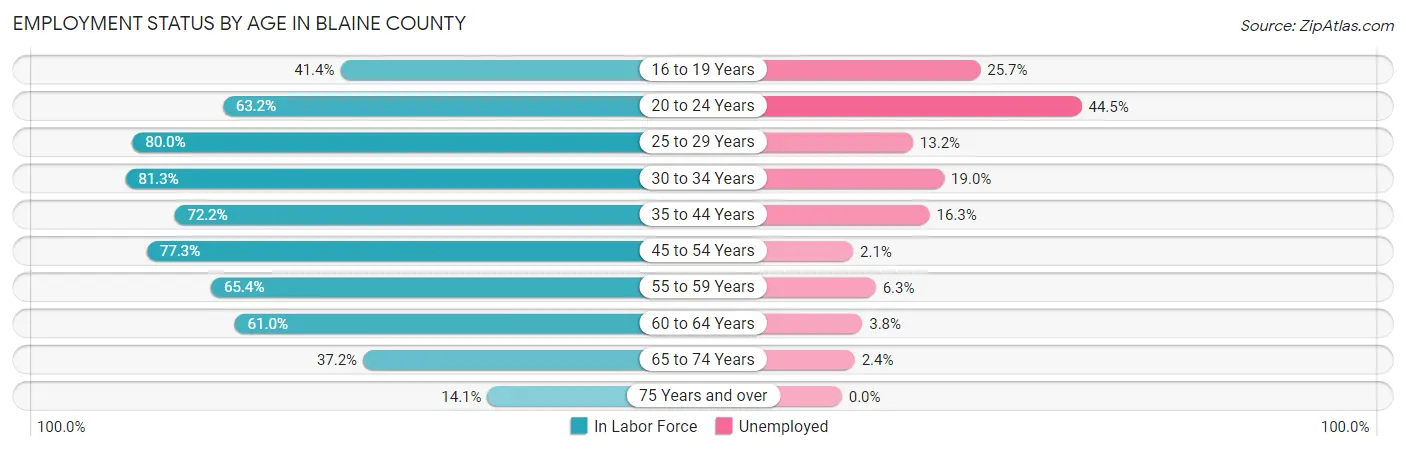
| Age Bracket | In Labor Force | Unemployed |
| 16 to 19 Years | 183 (41.4%) | 47 (25.7%) |
| 20 to 24 Years | 218 (63.2%) | 97 (44.5%) |
| 25 to 29 Years | 387 (80.0%) | 51 (13.2%) |
| 30 to 34 Years | 348 (81.3%) | 66 (19.0%) |
| 35 to 44 Years | 621 (72.2%) | 101 (16.3%) |
| 45 to 54 Years | 476 (77.3%) | 10 (2.1%) |
| 55 to 59 Years | 302 (65.4%) | 19 (6.3%) |
| 60 to 64 Years | 239 (61.0%) | 9 (3.8%) |
| 65 to 74 Years | 249 (37.2%) | 6 (2.4%) |
| 75 Years and over | 62 (14.1%) | 0 (0.0%) |
| Total | 3,084 (60.0%) | 407 (13.2%) |
Employment Status by Educational Attainment in Blaine County
According to labor force statistics for Blaine County, 73.2% of individuals (2,373) out of the total population between 25 and 64 years of age (3,242) are in the labor force, with 10.8% or 256 of them being unemployed. The group with the highest labor force participation rate are those with the educational attainment of bachelor's degree or higher, with 82.1% or 668 individuals in the labor force. Within the labor force, individuals with college / associate degree education have the highest percentage of unemployment, with 16.8% or 156 of them being unemployed.
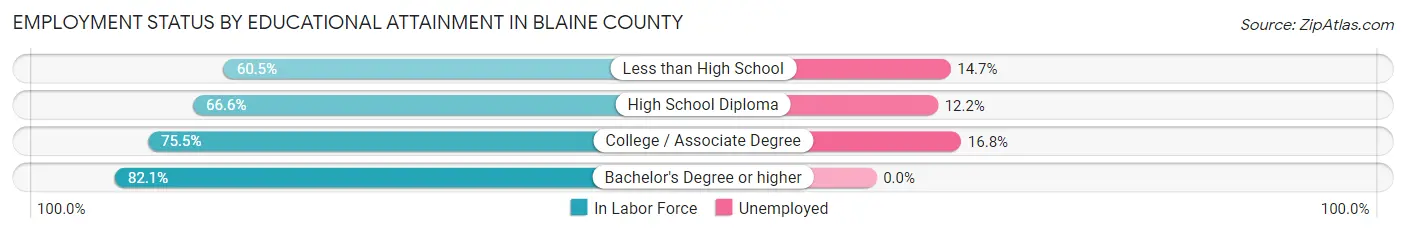
| Educational Attainment | In Labor Force | Unemployed |
| Less than High School | 204 (60.5%) | 50 (14.7%) |
| High School Diploma | 575 (66.6%) | 105 (12.2%) |
| College / Associate Degree | 926 (75.5%) | 206 (16.8%) |
| Bachelor's Degree or higher | 668 (82.1%) | 0 (0.0%) |
| Total | 2,373 (73.2%) | 350 (10.8%) |
Employment Occupations by Sex in Blaine County
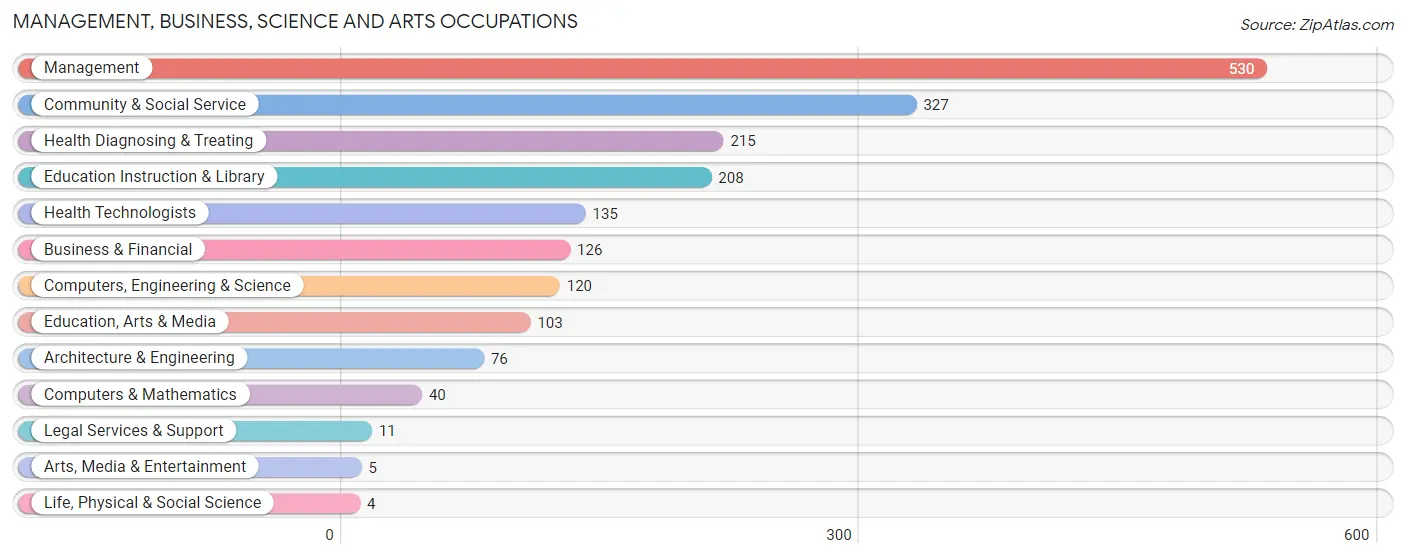
Management, Business, Science and Arts Occupations
The most common Management, Business, Science and Arts occupations in Blaine County are Management (530 | 19.8%), Community & Social Service (327 | 12.2%), Health Diagnosing & Treating (215 | 8.0%), Education Instruction & Library (208 | 7.8%), and Health Technologists (135 | 5.0%).
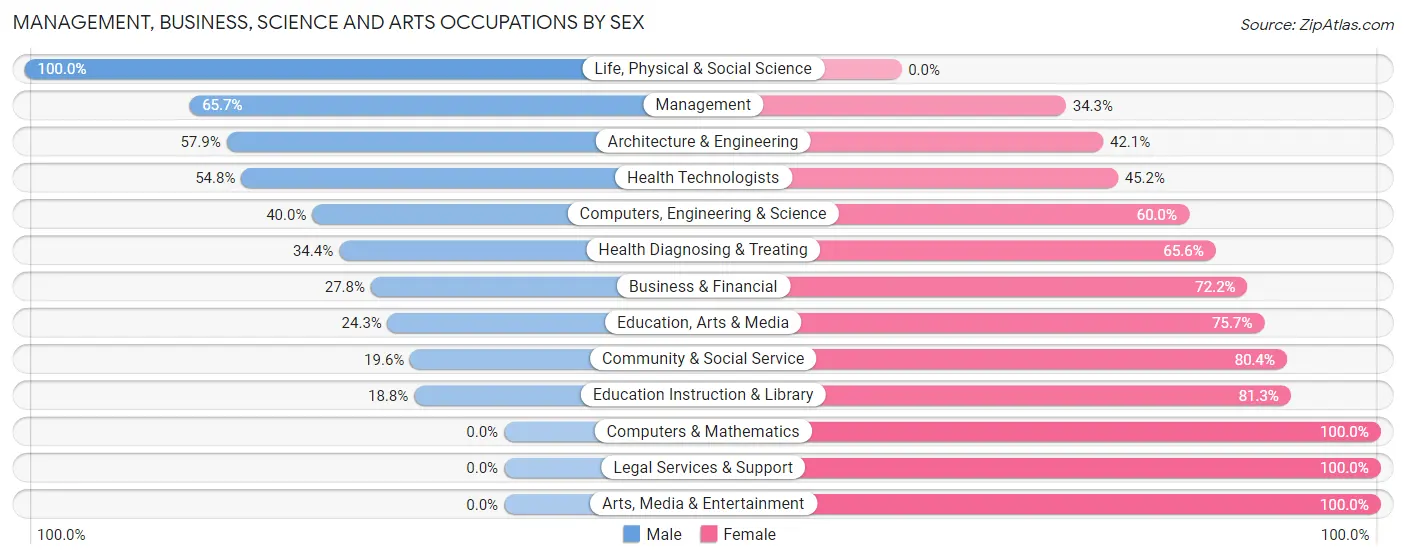
Management, Business, Science and Arts Occupations by Sex
Within the Management, Business, Science and Arts occupations in Blaine County, the most male-oriented occupations are Life, Physical & Social Science (100.0%), Management (65.7%), and Architecture & Engineering (57.9%), while the most female-oriented occupations are Computers & Mathematics (100.0%), Legal Services & Support (100.0%), and Arts, Media & Entertainment (100.0%).
| Occupation | Male | Female |
| Management | 348 (65.7%) | 182 (34.3%) |
| Business & Financial | 35 (27.8%) | 91 (72.2%) |
| Computers, Engineering & Science | 48 (40.0%) | 72 (60.0%) |
| Computers & Mathematics | 0 (0.0%) | 40 (100.0%) |
| Architecture & Engineering | 44 (57.9%) | 32 (42.1%) |
| Life, Physical & Social Science | 4 (100.0%) | 0 (0.0%) |
| Community & Social Service | 64 (19.6%) | 263 (80.4%) |
| Education, Arts & Media | 25 (24.3%) | 78 (75.7%) |
| Legal Services & Support | 0 (0.0%) | 11 (100.0%) |
| Education Instruction & Library | 39 (18.8%) | 169 (81.2%) |
| Arts, Media & Entertainment | 0 (0.0%) | 5 (100.0%) |
| Health Diagnosing & Treating | 74 (34.4%) | 141 (65.6%) |
| Health Technologists | 74 (54.8%) | 61 (45.2%) |
| Total (Category) | 569 (43.2%) | 749 (56.8%) |
| Total (Overall) | 1,371 (51.2%) | 1,308 (48.8%) |
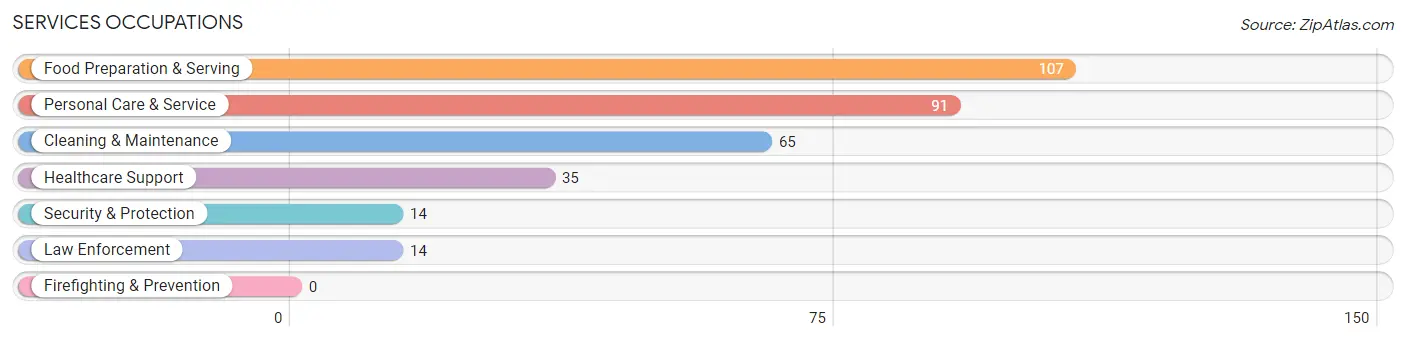
Services Occupations
The most common Services occupations in Blaine County are Food Preparation & Serving (107 | 4.0%), Personal Care & Service (91 | 3.4%), Cleaning & Maintenance (65 | 2.4%), Healthcare Support (35 | 1.3%), and Security & Protection (14 | 0.5%).
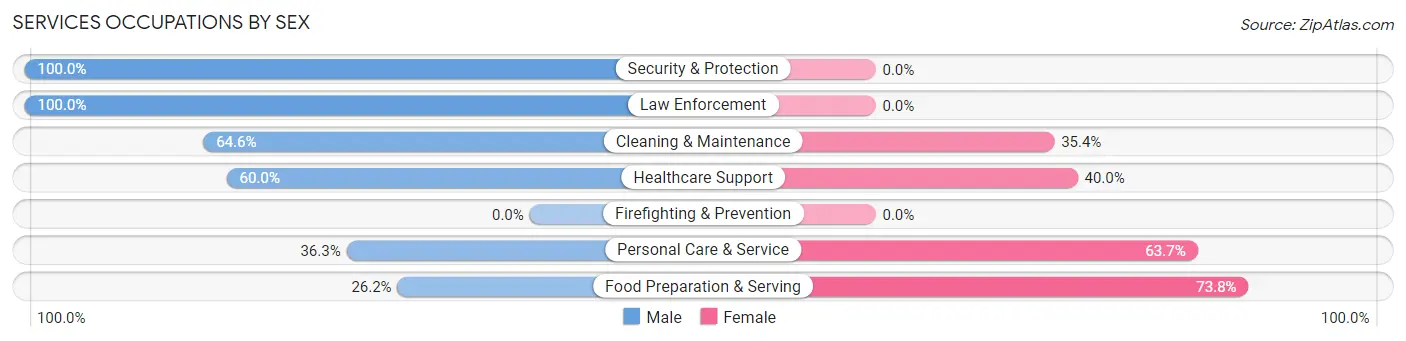
Services Occupations by Sex
Within the Services occupations in Blaine County, the most male-oriented occupations are Security & Protection (100.0%), Law Enforcement (100.0%), and Cleaning & Maintenance (64.6%), while the most female-oriented occupations are Food Preparation & Serving (73.8%), Personal Care & Service (63.7%), and Healthcare Support (40.0%).
| Occupation | Male | Female |
| Healthcare Support | 21 (60.0%) | 14 (40.0%) |
| Security & Protection | 14 (100.0%) | 0 (0.0%) |
| Firefighting & Prevention | 0 (0.0%) | 0 (0.0%) |
| Law Enforcement | 14 (100.0%) | 0 (0.0%) |
| Food Preparation & Serving | 28 (26.2%) | 79 (73.8%) |
| Cleaning & Maintenance | 42 (64.6%) | 23 (35.4%) |
| Personal Care & Service | 33 (36.3%) | 58 (63.7%) |
| Total (Category) | 138 (44.2%) | 174 (55.8%) |
| Total (Overall) | 1,371 (51.2%) | 1,308 (48.8%) |
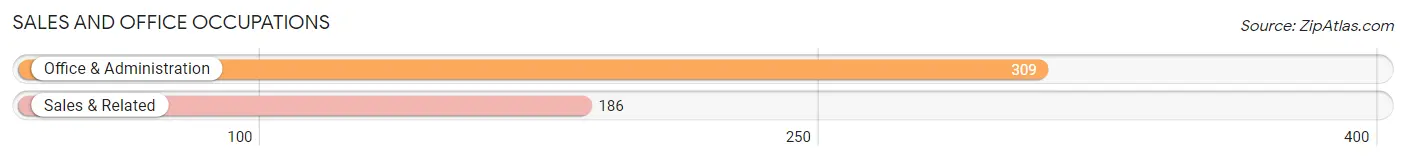
Sales and Office Occupations
The most common Sales and Office occupations in Blaine County are Office & Administration (309 | 11.5%), and Sales & Related (186 | 6.9%).
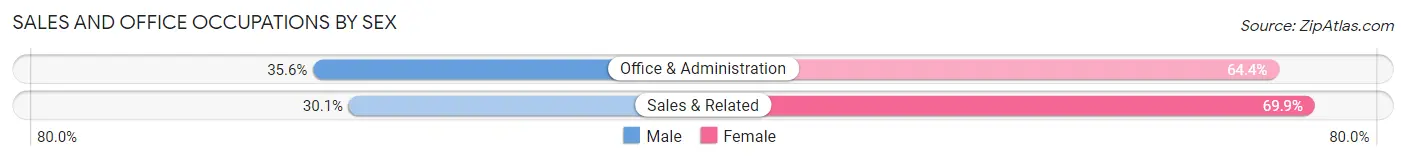
Sales and Office Occupations by Sex
| Occupation | Male | Female |
| Sales & Related | 56 (30.1%) | 130 (69.9%) |
| Office & Administration | 110 (35.6%) | 199 (64.4%) |
| Total (Category) | 166 (33.5%) | 329 (66.5%) |
| Total (Overall) | 1,371 (51.2%) | 1,308 (48.8%) |
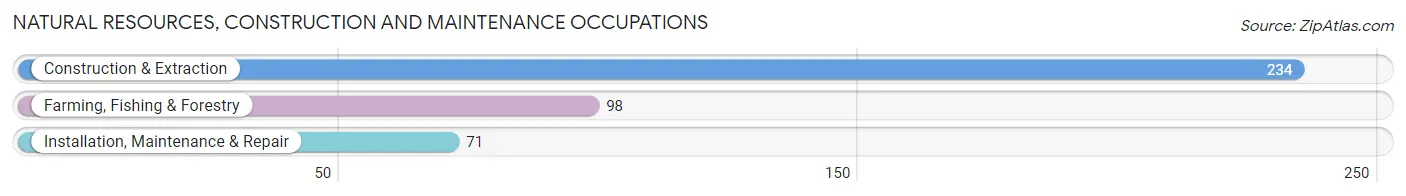
Natural Resources, Construction and Maintenance Occupations
The most common Natural Resources, Construction and Maintenance occupations in Blaine County are Construction & Extraction (234 | 8.7%), Farming, Fishing & Forestry (98 | 3.7%), and Installation, Maintenance & Repair (71 | 2.6%).
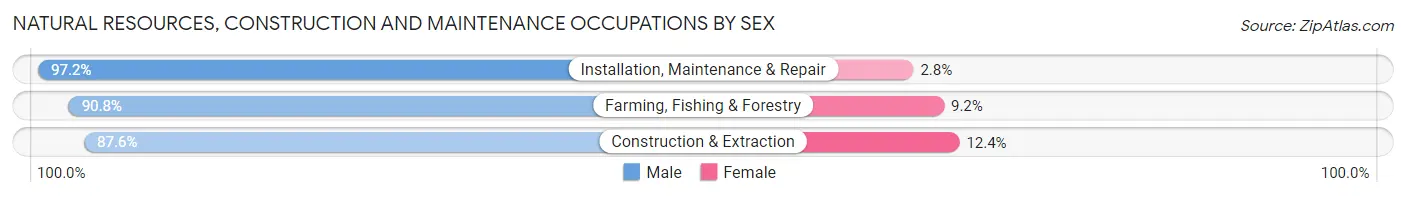
Natural Resources, Construction and Maintenance Occupations by Sex
| Occupation | Male | Female |
| Farming, Fishing & Forestry | 89 (90.8%) | 9 (9.2%) |
| Construction & Extraction | 205 (87.6%) | 29 (12.4%) |
| Installation, Maintenance & Repair | 69 (97.2%) | 2 (2.8%) |
| Total (Category) | 363 (90.1%) | 40 (9.9%) |
| Total (Overall) | 1,371 (51.2%) | 1,308 (48.8%) |
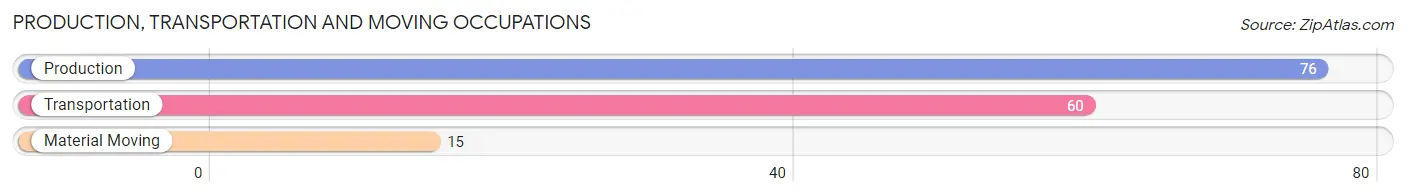
Production, Transportation and Moving Occupations
The most common Production, Transportation and Moving occupations in Blaine County are Production (76 | 2.8%), Transportation (60 | 2.2%), and Material Moving (15 | 0.6%).
Production, Transportation and Moving Occupations by Sex
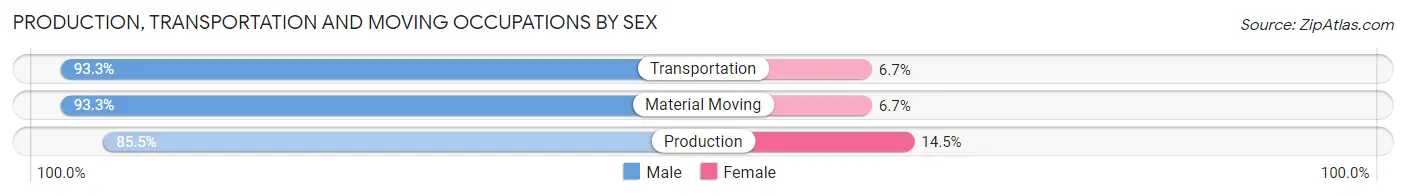
| Occupation | Male | Female |
| Production | 65 (85.5%) | 11 (14.5%) |
| Transportation | 56 (93.3%) | 4 (6.7%) |
| Material Moving | 14 (93.3%) | 1 (6.7%) |
| Total (Category) | 135 (89.4%) | 16 (10.6%) |
| Total (Overall) | 1,371 (51.2%) | 1,308 (48.8%) |
Employment Industries by Sex in Blaine County
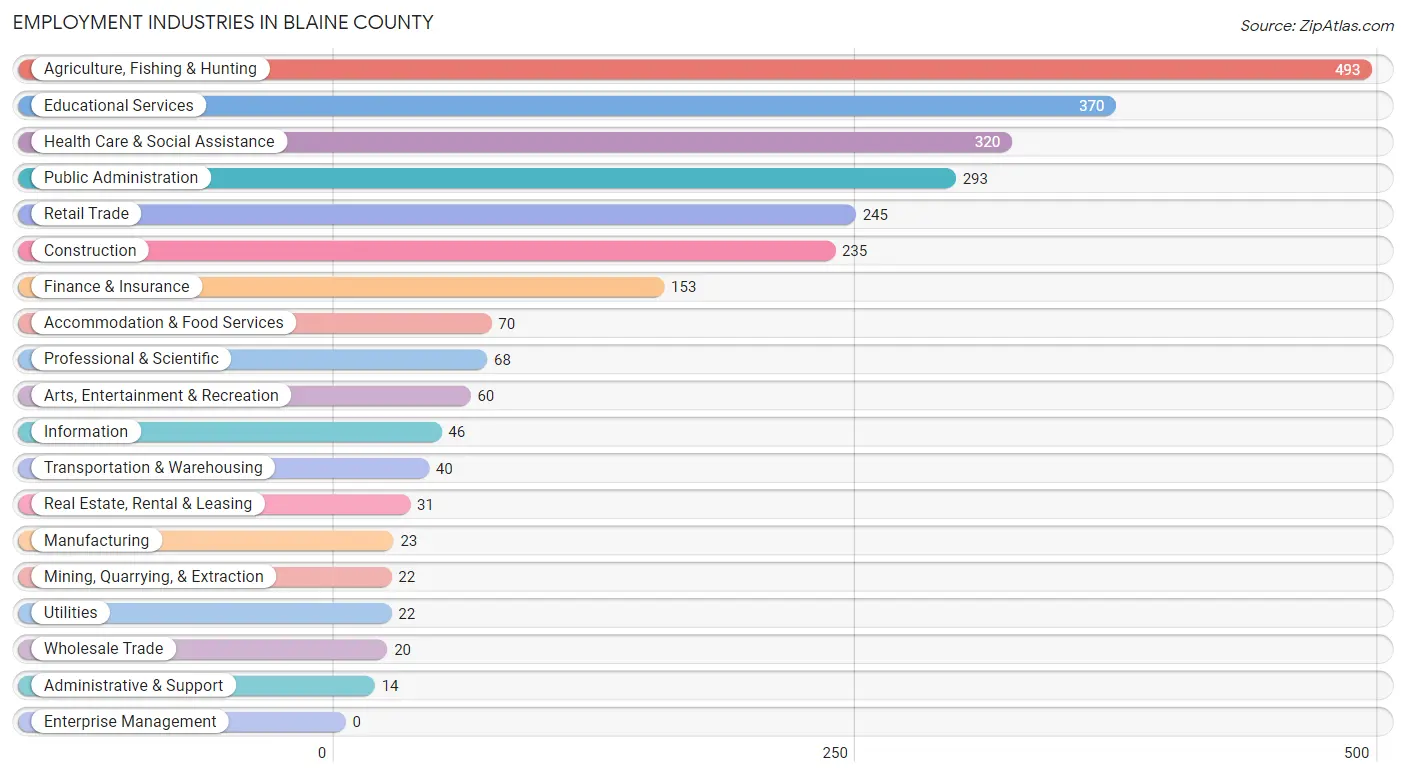
Employment Industries in Blaine County
The major employment industries in Blaine County include Agriculture, Fishing & Hunting (493 | 18.4%), Educational Services (370 | 13.8%), Health Care & Social Assistance (320 | 11.9%), Public Administration (293 | 10.9%), and Retail Trade (245 | 9.1%).
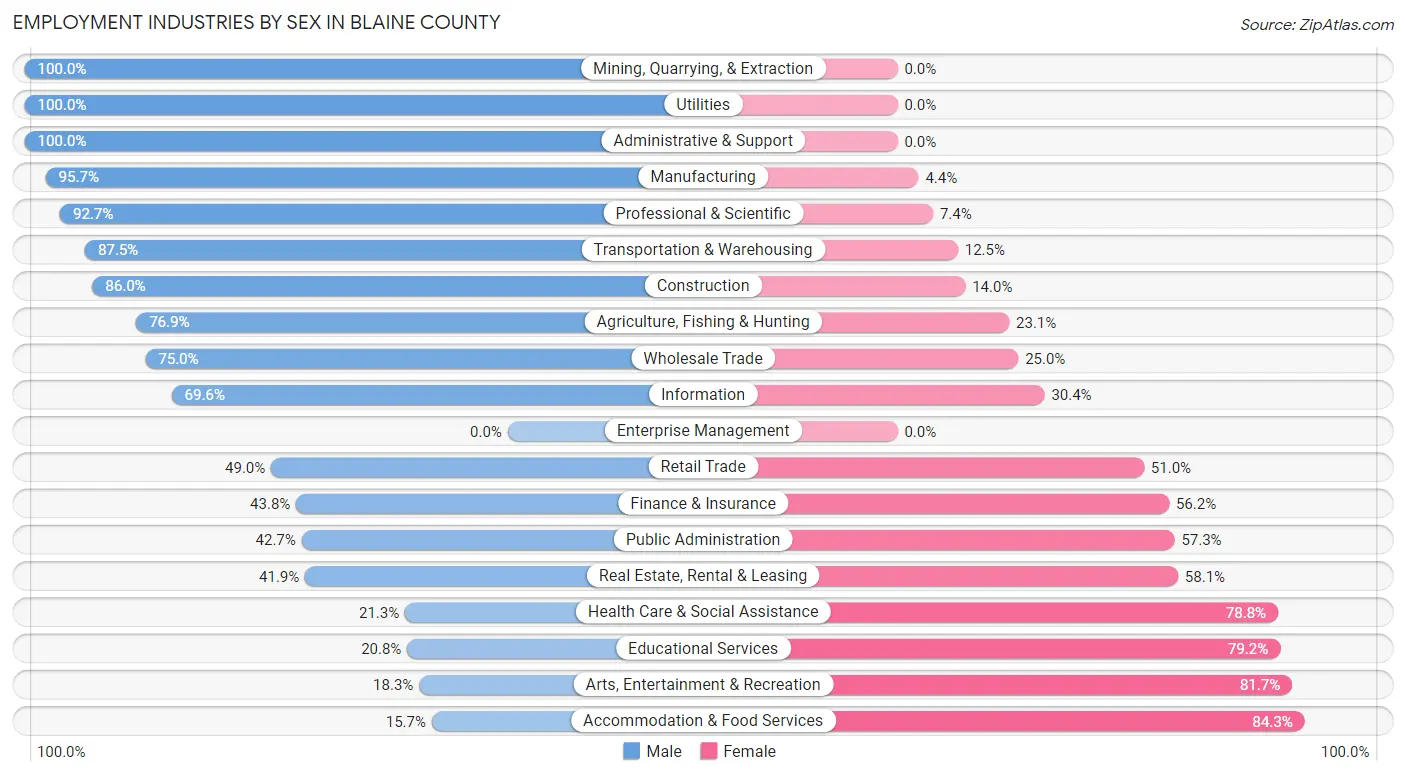
Employment Industries by Sex in Blaine County
The Blaine County industries that see more men than women are Mining, Quarrying, & Extraction (100.0%), Utilities (100.0%), and Administrative & Support (100.0%), whereas the industries that tend to have a higher number of women are Accommodation & Food Services (84.3%), Arts, Entertainment & Recreation (81.7%), and Educational Services (79.2%).
| Industry | Male | Female |
| Agriculture, Fishing & Hunting | 379 (76.9%) | 114 (23.1%) |
| Mining, Quarrying, & Extraction | 22 (100.0%) | 0 (0.0%) |
| Construction | 202 (86.0%) | 33 (14.0%) |
| Manufacturing | 22 (95.7%) | 1 (4.3%) |
| Wholesale Trade | 15 (75.0%) | 5 (25.0%) |
| Retail Trade | 120 (49.0%) | 125 (51.0%) |
| Transportation & Warehousing | 35 (87.5%) | 5 (12.5%) |
| Utilities | 22 (100.0%) | 0 (0.0%) |
| Information | 32 (69.6%) | 14 (30.4%) |
| Finance & Insurance | 67 (43.8%) | 86 (56.2%) |
| Real Estate, Rental & Leasing | 13 (41.9%) | 18 (58.1%) |
| Professional & Scientific | 63 (92.6%) | 5 (7.3%) |
| Enterprise Management | 0 (0.0%) | 0 (0.0%) |
| Administrative & Support | 14 (100.0%) | 0 (0.0%) |
| Educational Services | 77 (20.8%) | 293 (79.2%) |
| Health Care & Social Assistance | 68 (21.2%) | 252 (78.7%) |
| Arts, Entertainment & Recreation | 11 (18.3%) | 49 (81.7%) |
| Accommodation & Food Services | 11 (15.7%) | 59 (84.3%) |
| Public Administration | 125 (42.7%) | 168 (57.3%) |
| Total | 1,371 (51.2%) | 1,308 (48.8%) |
Education in Blaine County
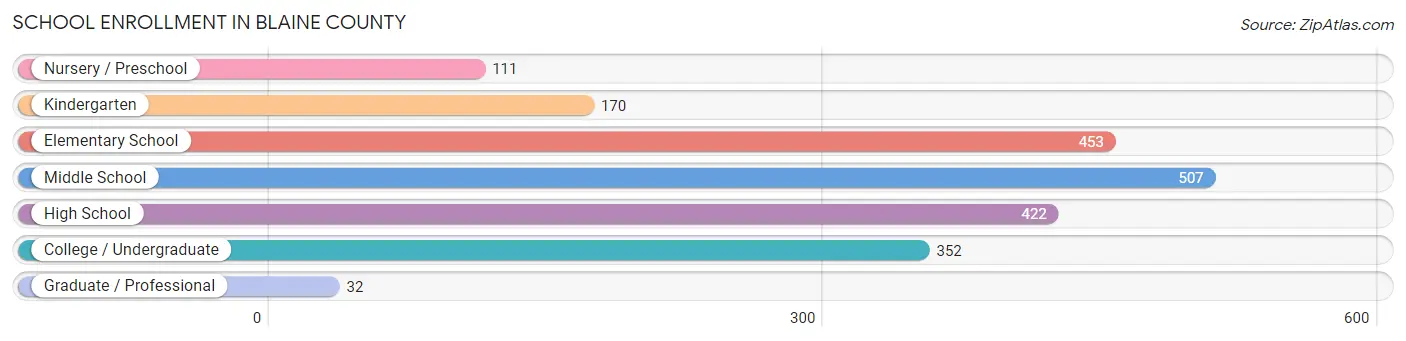
School Enrollment in Blaine County
The most common levels of schooling among the 2,047 students in Blaine County are middle school (507 | 24.8%), elementary school (453 | 22.1%), and high school (422 | 20.6%).
| School Level | # Students | % Students |
| Nursery / Preschool | 111 | 5.4% |
| Kindergarten | 170 | 8.3% |
| Elementary School | 453 | 22.1% |
| Middle School | 507 | 24.8% |
| High School | 422 | 20.6% |
| College / Undergraduate | 352 | 17.2% |
| Graduate / Professional | 32 | 1.6% |
| Total | 2,047 | 100.0% |
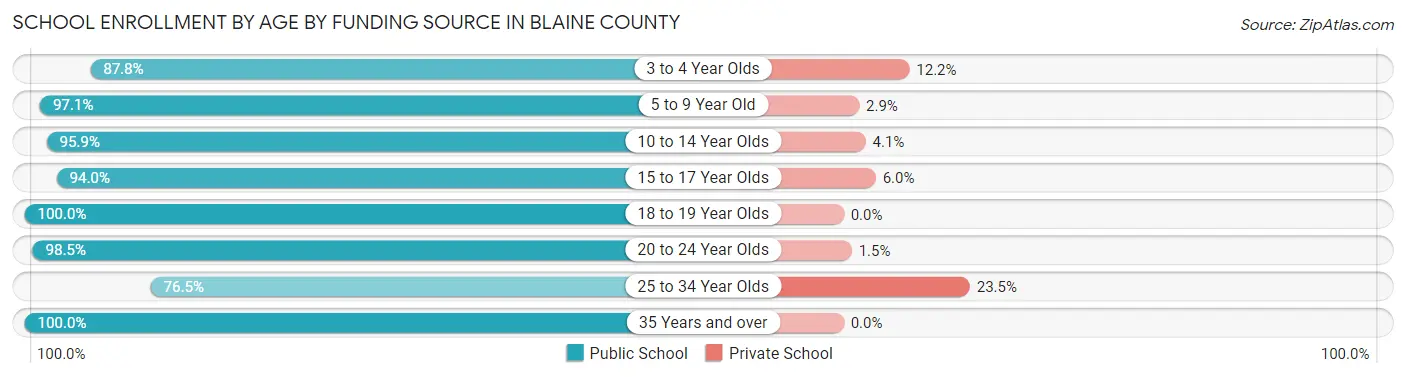
School Enrollment by Age by Funding Source in Blaine County
Out of a total of 2,047 students who are enrolled in schools in Blaine County, 108 (5.3%) attend a private institution, while the remaining 1,939 (94.7%) are enrolled in public schools. The age group of 25 to 34 year olds has the highest likelihood of being enrolled in private schools, with 35 (23.5% in the age bracket) enrolled. Conversely, the age group of 18 to 19 year olds has the lowest likelihood of being enrolled in a private school, with 132 (100.0% in the age bracket) attending a public institution.
| Age Bracket | Public School | Private School |
| 3 to 4 Year Olds | 86 (87.8%) | 12 (12.2%) |
| 5 to 9 Year Old | 542 (97.1%) | 16 (2.9%) |
| 10 to 14 Year Olds | 563 (95.9%) | 24 (4.1%) |
| 15 to 17 Year Olds | 299 (94.0%) | 19 (6.0%) |
| 18 to 19 Year Olds | 132 (100.0%) | 0 (0.0%) |
| 20 to 24 Year Olds | 131 (98.5%) | 2 (1.5%) |
| 25 to 34 Year Olds | 114 (76.5%) | 35 (23.5%) |
| 35 Years and over | 72 (100.0%) | 0 (0.0%) |
| Total | 1,939 (94.7%) | 108 (5.3%) |
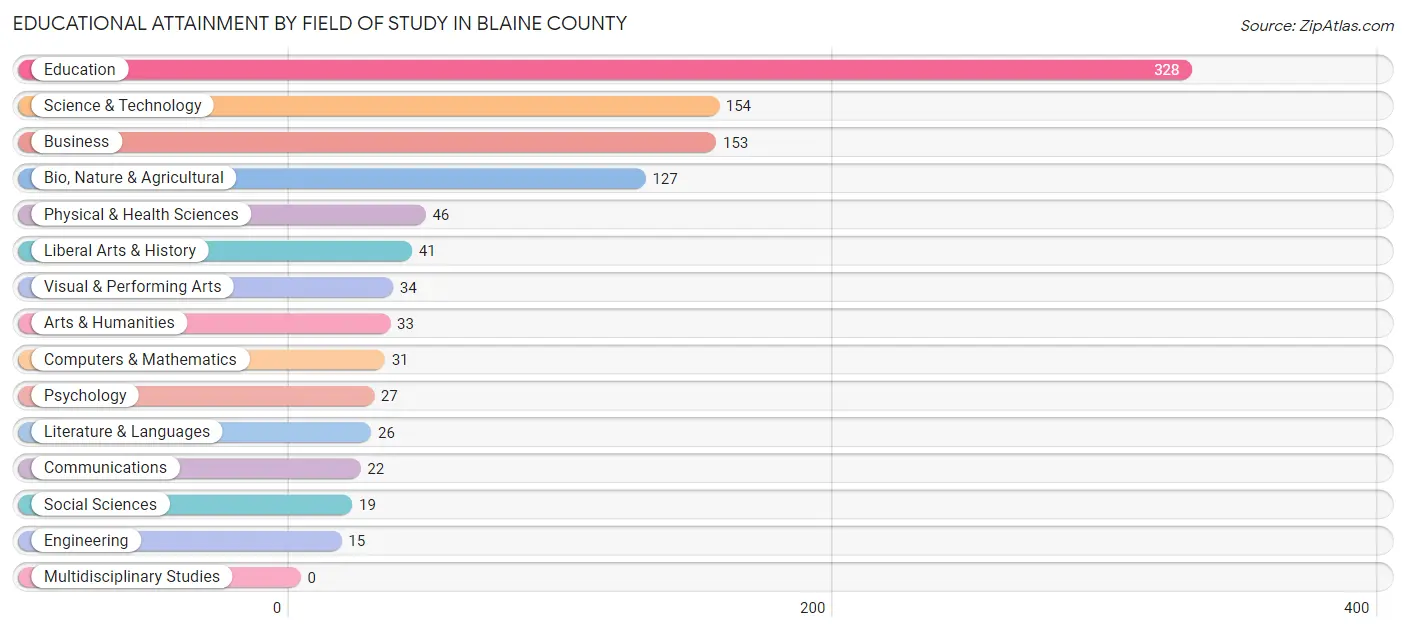
Educational Attainment by Field of Study in Blaine County
Education (328 | 31.1%), science & technology (154 | 14.6%), business (153 | 14.5%), bio, nature & agricultural (127 | 12.0%), and physical & health sciences (46 | 4.4%) are the most common fields of study among 1,056 individuals in Blaine County who have obtained a bachelor's degree or higher.
| Field of Study | # Graduates | % Graduates |
| Computers & Mathematics | 31 | 2.9% |
| Bio, Nature & Agricultural | 127 | 12.0% |
| Physical & Health Sciences | 46 | 4.4% |
| Psychology | 27 | 2.6% |
| Social Sciences | 19 | 1.8% |
| Engineering | 15 | 1.4% |
| Multidisciplinary Studies | 0 | 0.0% |
| Science & Technology | 154 | 14.6% |
| Business | 153 | 14.5% |
| Education | 328 | 31.1% |
| Literature & Languages | 26 | 2.5% |
| Liberal Arts & History | 41 | 3.9% |
| Visual & Performing Arts | 34 | 3.2% |
| Communications | 22 | 2.1% |
| Arts & Humanities | 33 | 3.1% |
| Total | 1,056 | 100.0% |
Transportation & Commute in Blaine County
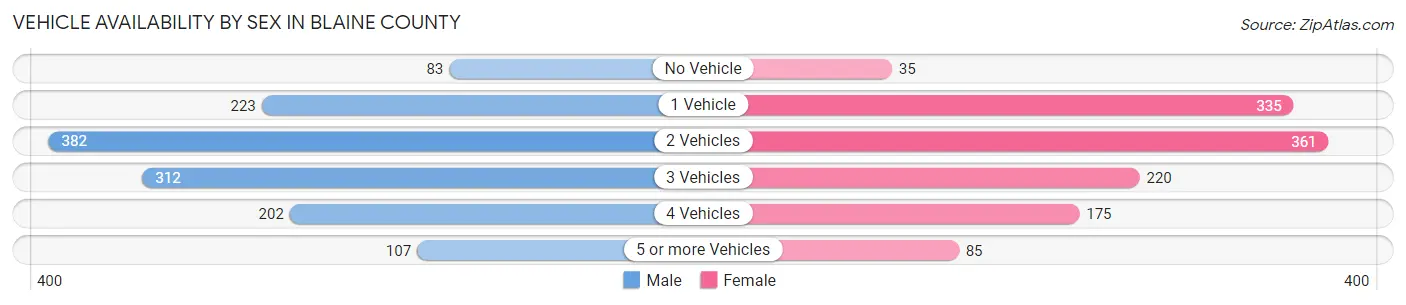
Vehicle Availability by Sex in Blaine County
The most prevalent vehicle ownership categories in Blaine County are males with 2 vehicles (382, accounting for 29.2%) and females with 2 vehicles (361, making up 31.5%).
| Vehicles Available | Male | Female |
| No Vehicle | 83 (6.3%) | 35 (2.9%) |
| 1 Vehicle | 223 (17.0%) | 335 (27.7%) |
| 2 Vehicles | 382 (29.2%) | 361 (29.8%) |
| 3 Vehicles | 312 (23.8%) | 220 (18.2%) |
| 4 Vehicles | 202 (15.4%) | 175 (14.4%) |
| 5 or more Vehicles | 107 (8.2%) | 85 (7.0%) |
| Total | 1,309 (100.0%) | 1,211 (100.0%) |
Commute Time in Blaine County
The most frequently occuring commute durations in Blaine County are less than 5 minutes (625 commuters, 28.0%), 5 to 9 minutes (594 commuters, 26.6%), and 10 to 14 minutes (226 commuters, 10.1%).
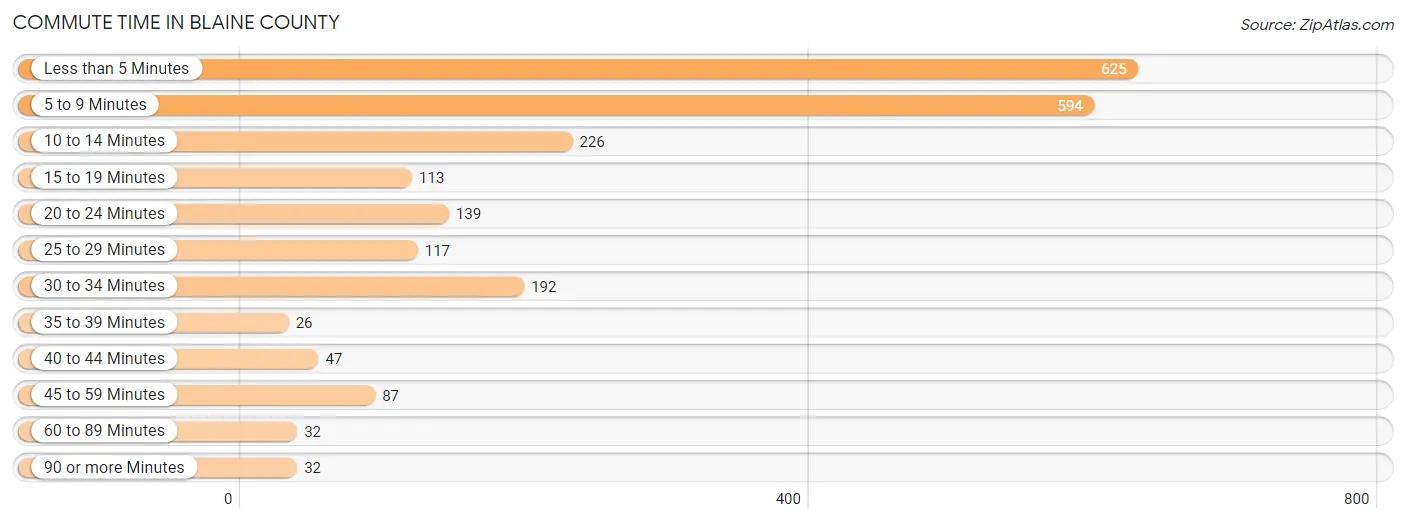
| Commute Time | # Commuters | % Commuters |
| Less than 5 Minutes | 625 | 28.0% |
| 5 to 9 Minutes | 594 | 26.6% |
| 10 to 14 Minutes | 226 | 10.1% |
| 15 to 19 Minutes | 113 | 5.1% |
| 20 to 24 Minutes | 139 | 6.2% |
| 25 to 29 Minutes | 117 | 5.2% |
| 30 to 34 Minutes | 192 | 8.6% |
| 35 to 39 Minutes | 26 | 1.2% |
| 40 to 44 Minutes | 47 | 2.1% |
| 45 to 59 Minutes | 87 | 3.9% |
| 60 to 89 Minutes | 32 | 1.4% |
| 90 or more Minutes | 32 | 1.4% |
Commute Time by Sex in Blaine County
The most common commute times in Blaine County are less than 5 minutes (286 commuters, 27.0%) for males and less than 5 minutes (339 commuters, 29.0%) for females.
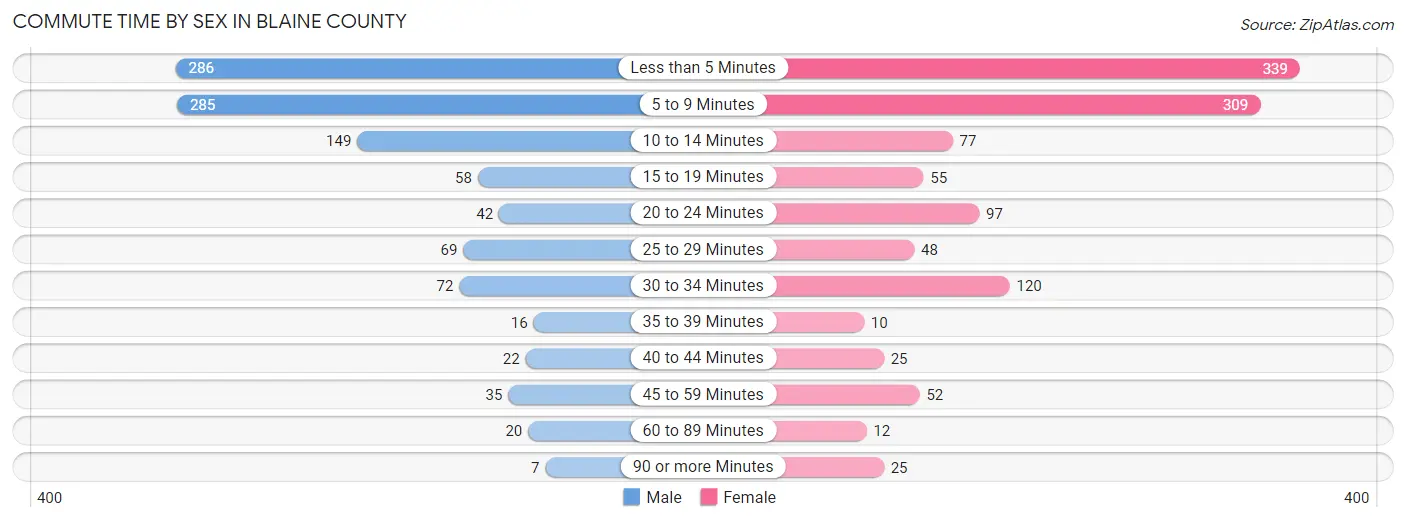
| Commute Time | Male | Female |
| Less than 5 Minutes | 286 (27.0%) | 339 (29.0%) |
| 5 to 9 Minutes | 285 (26.9%) | 309 (26.4%) |
| 10 to 14 Minutes | 149 (14.0%) | 77 (6.6%) |
| 15 to 19 Minutes | 58 (5.5%) | 55 (4.7%) |
| 20 to 24 Minutes | 42 (4.0%) | 97 (8.3%) |
| 25 to 29 Minutes | 69 (6.5%) | 48 (4.1%) |
| 30 to 34 Minutes | 72 (6.8%) | 120 (10.3%) |
| 35 to 39 Minutes | 16 (1.5%) | 10 (0.9%) |
| 40 to 44 Minutes | 22 (2.1%) | 25 (2.1%) |
| 45 to 59 Minutes | 35 (3.3%) | 52 (4.4%) |
| 60 to 89 Minutes | 20 (1.9%) | 12 (1.0%) |
| 90 or more Minutes | 7 (0.7%) | 25 (2.1%) |
Time of Departure to Work by Sex in Blaine County
The most frequent times of departure to work in Blaine County are 7:30 AM to 7:59 AM (326, 30.7%) for males and 7:30 AM to 7:59 AM (478, 40.9%) for females.
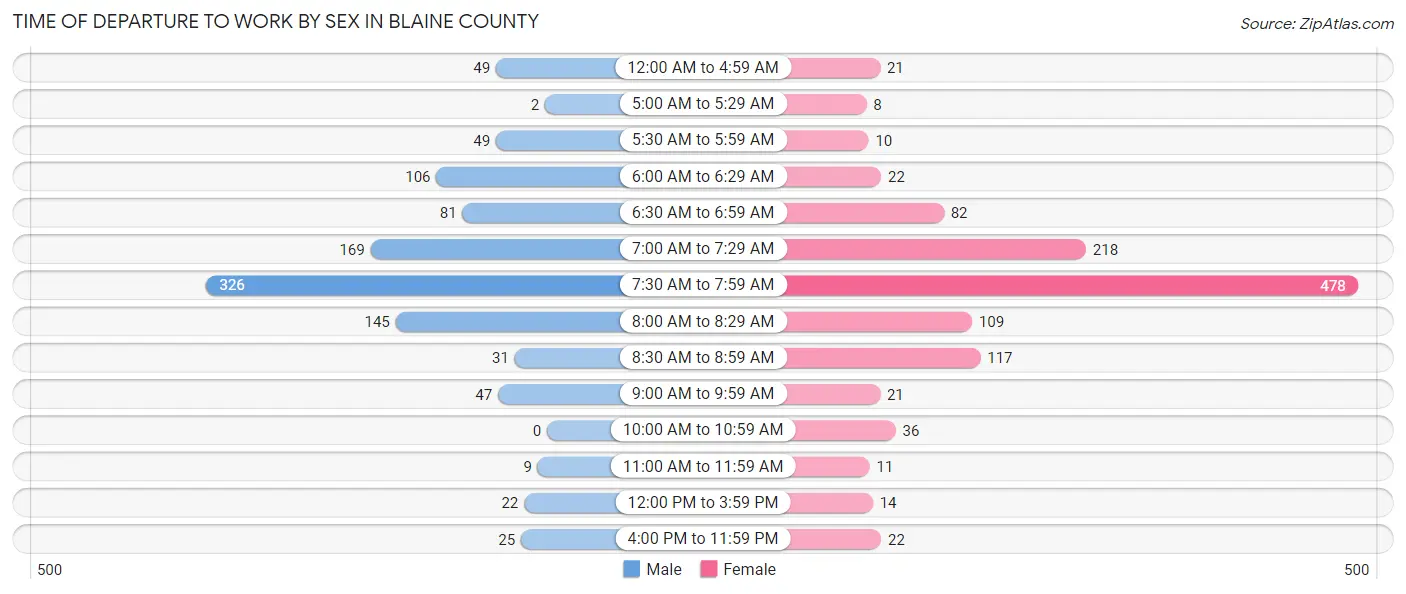
| Time of Departure | Male | Female |
| 12:00 AM to 4:59 AM | 49 (4.6%) | 21 (1.8%) |
| 5:00 AM to 5:29 AM | 2 (0.2%) | 8 (0.7%) |
| 5:30 AM to 5:59 AM | 49 (4.6%) | 10 (0.9%) |
| 6:00 AM to 6:29 AM | 106 (10.0%) | 22 (1.9%) |
| 6:30 AM to 6:59 AM | 81 (7.6%) | 82 (7.0%) |
| 7:00 AM to 7:29 AM | 169 (15.9%) | 218 (18.6%) |
| 7:30 AM to 7:59 AM | 326 (30.7%) | 478 (40.9%) |
| 8:00 AM to 8:29 AM | 145 (13.7%) | 109 (9.3%) |
| 8:30 AM to 8:59 AM | 31 (2.9%) | 117 (10.0%) |
| 9:00 AM to 9:59 AM | 47 (4.4%) | 21 (1.8%) |
| 10:00 AM to 10:59 AM | 0 (0.0%) | 36 (3.1%) |
| 11:00 AM to 11:59 AM | 9 (0.9%) | 11 (0.9%) |
| 12:00 PM to 3:59 PM | 22 (2.1%) | 14 (1.2%) |
| 4:00 PM to 11:59 PM | 25 (2.4%) | 22 (1.9%) |
| Total | 1,061 (100.0%) | 1,169 (100.0%) |
Housing Occupancy in Blaine County
Occupancy by Ownership in Blaine County
Of the total 2,271 dwellings in Blaine County, owner-occupied units account for 1,426 (62.8%), while renter-occupied units make up 845 (37.2%).
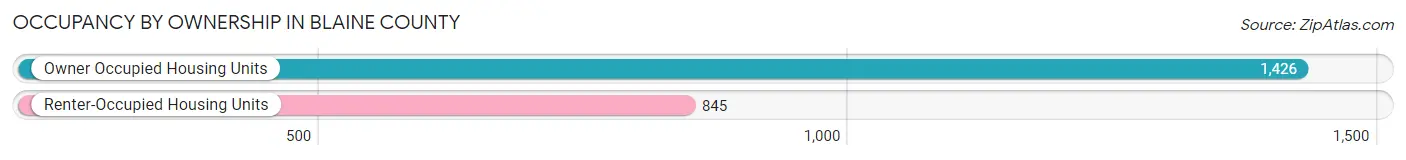
| Occupancy | # Housing Units | % Housing Units |
| Owner Occupied Housing Units | 1,426 | 62.8% |
| Renter-Occupied Housing Units | 845 | 37.2% |
| Total Occupied Housing Units | 2,271 | 100.0% |
Occupancy by Household Size in Blaine County
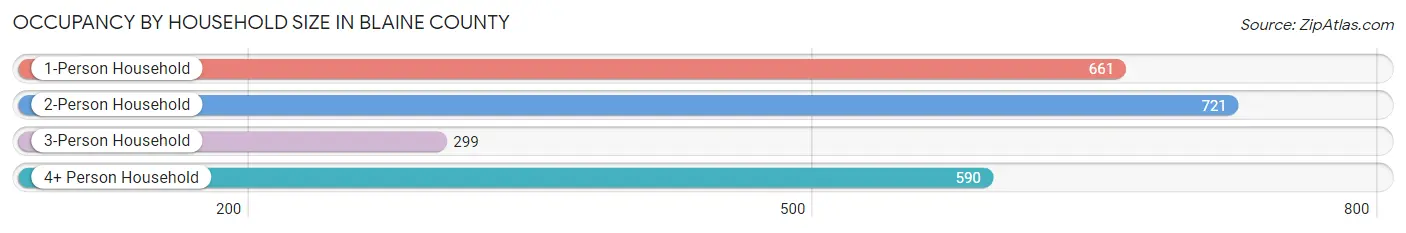
| Household Size | # Housing Units | % Housing Units |
| 1-Person Household | 661 | 29.1% |
| 2-Person Household | 721 | 31.8% |
| 3-Person Household | 299 | 13.2% |
| 4+ Person Household | 590 | 26.0% |
| Total Housing Units | 2,271 | 100.0% |
Occupancy by Ownership by Household Size in Blaine County
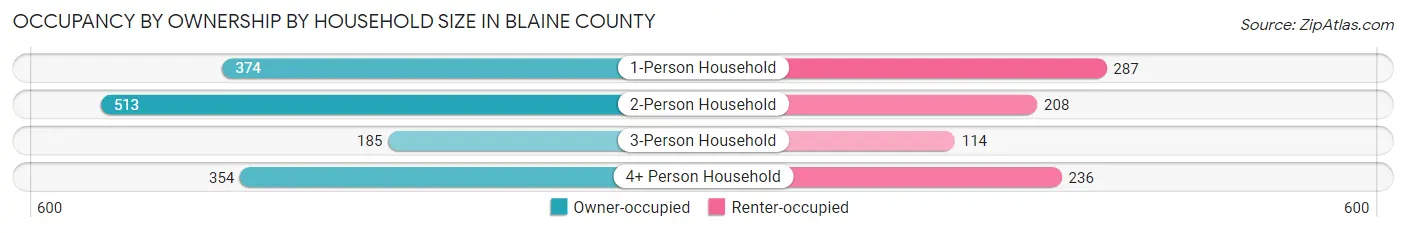
| Household Size | Owner-occupied | Renter-occupied |
| 1-Person Household | 374 (56.6%) | 287 (43.4%) |
| 2-Person Household | 513 (71.2%) | 208 (28.8%) |
| 3-Person Household | 185 (61.9%) | 114 (38.1%) |
| 4+ Person Household | 354 (60.0%) | 236 (40.0%) |
| Total Housing Units | 1,426 (62.8%) | 845 (37.2%) |
Occupancy by Educational Attainment in Blaine County
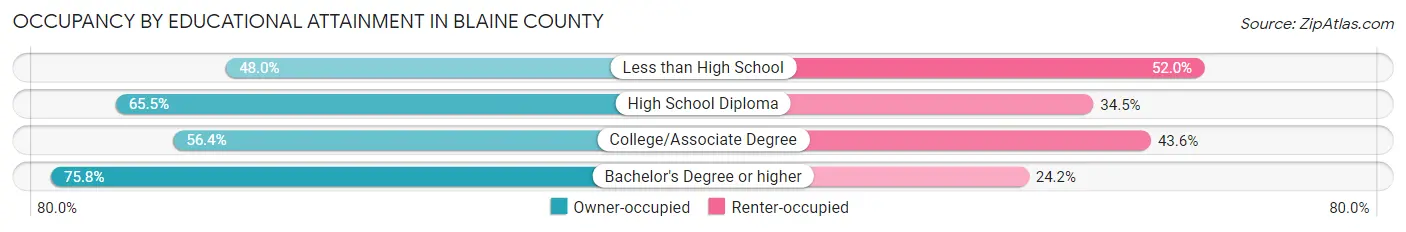
| Household Size | Owner-occupied | Renter-occupied |
| Less than High School | 97 (48.0%) | 105 (52.0%) |
| High School Diploma | 369 (65.5%) | 194 (34.5%) |
| College/Associate Degree | 528 (56.4%) | 408 (43.6%) |
| Bachelor's Degree or higher | 432 (75.8%) | 138 (24.2%) |
Occupancy by Age of Householder in Blaine County
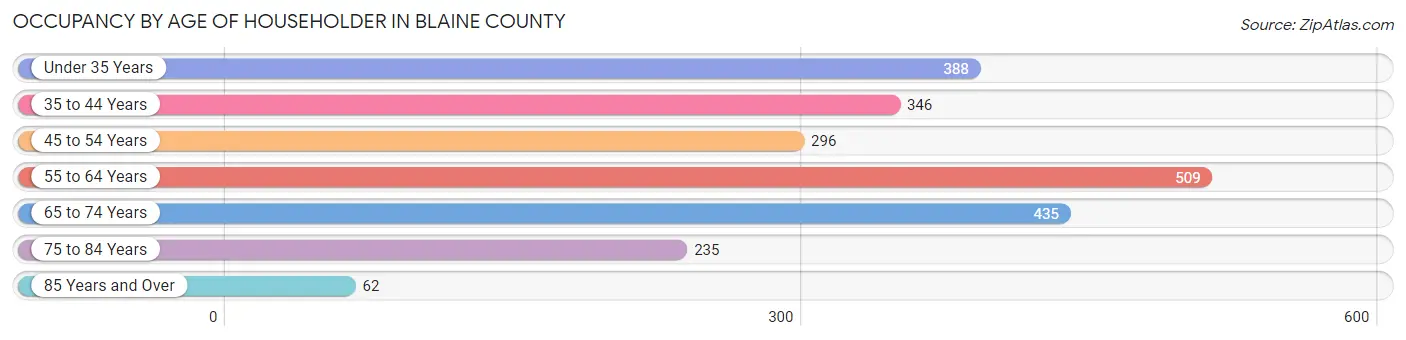
| Age Bracket | # Households | % Households |
| Under 35 Years | 388 | 17.1% |
| 35 to 44 Years | 346 | 15.2% |
| 45 to 54 Years | 296 | 13.0% |
| 55 to 64 Years | 509 | 22.4% |
| 65 to 74 Years | 435 | 19.2% |
| 75 to 84 Years | 235 | 10.3% |
| 85 Years and Over | 62 | 2.7% |
| Total | 2,271 | 100.0% |
Housing Finances in Blaine County
Median Income by Occupancy in Blaine County
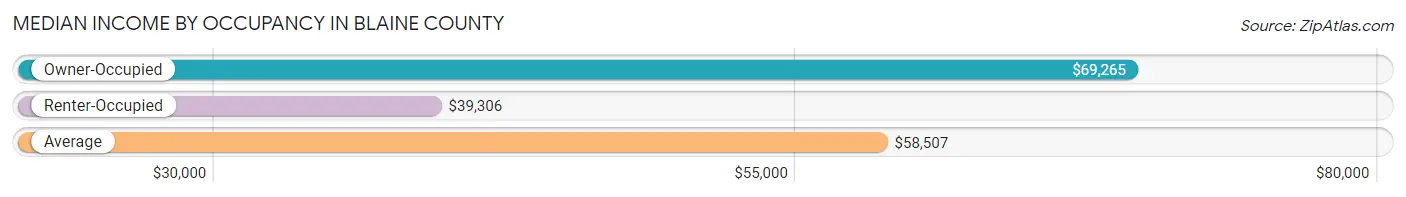
| Occupancy Type | # Households | Median Income |
| Owner-Occupied | 1,426 (62.8%) | $69,265 |
| Renter-Occupied | 845 (37.2%) | $39,306 |
| Average | 2,271 (100.0%) | $58,507 |
Occupancy by Householder Income Bracket in Blaine County
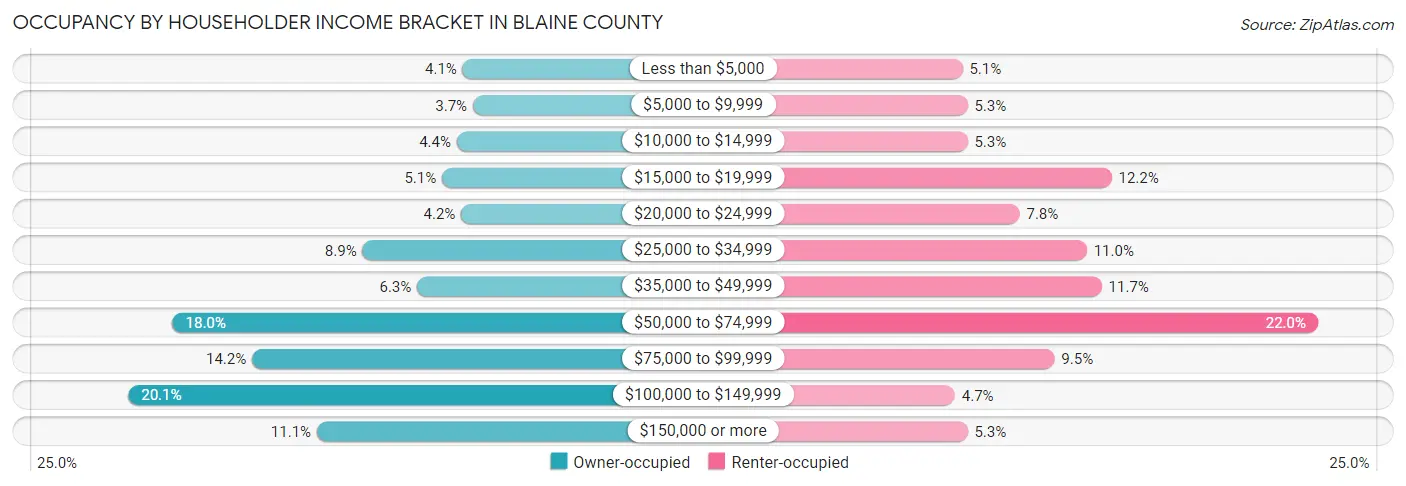
| Income Bracket | Owner-occupied | Renter-occupied |
| Less than $5,000 | 59 (4.1%) | 43 (5.1%) |
| $5,000 to $9,999 | 52 (3.6%) | 45 (5.3%) |
| $10,000 to $14,999 | 63 (4.4%) | 45 (5.3%) |
| $15,000 to $19,999 | 73 (5.1%) | 103 (12.2%) |
| $20,000 to $24,999 | 60 (4.2%) | 66 (7.8%) |
| $25,000 to $34,999 | 127 (8.9%) | 93 (11.0%) |
| $35,000 to $49,999 | 90 (6.3%) | 99 (11.7%) |
| $50,000 to $74,999 | 256 (17.9%) | 186 (22.0%) |
| $75,000 to $99,999 | 202 (14.2%) | 80 (9.5%) |
| $100,000 to $149,999 | 286 (20.1%) | 40 (4.7%) |
| $150,000 or more | 158 (11.1%) | 45 (5.3%) |
| Total | 1,426 (100.0%) | 845 (100.0%) |
Monthly Housing Cost Tiers in Blaine County
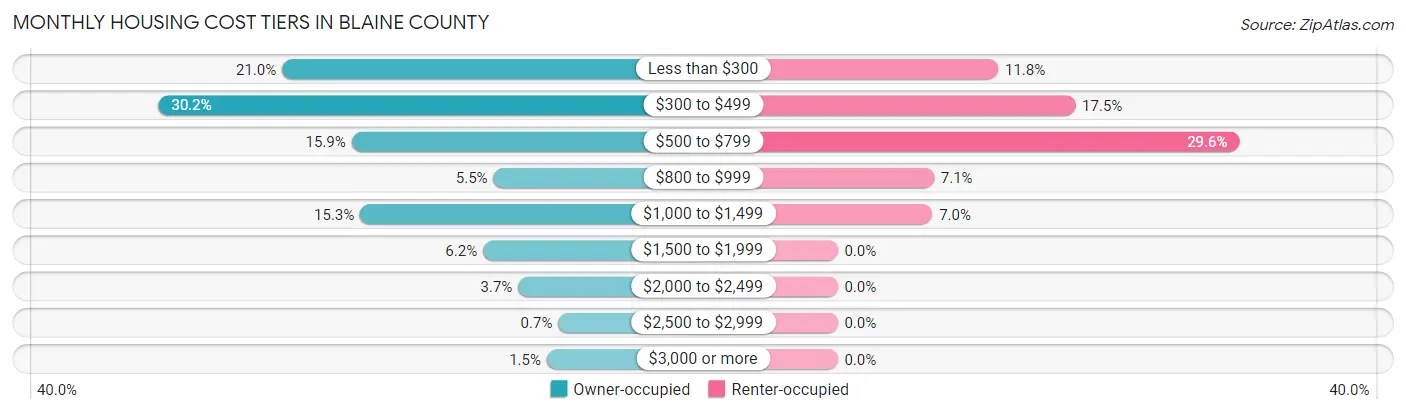
| Monthly Cost | Owner-occupied | Renter-occupied |
| Less than $300 | 300 (21.0%) | 100 (11.8%) |
| $300 to $499 | 430 (30.1%) | 148 (17.5%) |
| $500 to $799 | 227 (15.9%) | 250 (29.6%) |
| $800 to $999 | 78 (5.5%) | 60 (7.1%) |
| $1,000 to $1,499 | 218 (15.3%) | 59 (7.0%) |
| $1,500 to $1,999 | 89 (6.2%) | 0 (0.0%) |
| $2,000 to $2,499 | 52 (3.6%) | 0 (0.0%) |
| $2,500 to $2,999 | 10 (0.7%) | 0 (0.0%) |
| $3,000 or more | 22 (1.5%) | 0 (0.0%) |
| Total | 1,426 (100.0%) | 845 (100.0%) |
Physical Housing Characteristics in Blaine County
Housing Structures in Blaine County
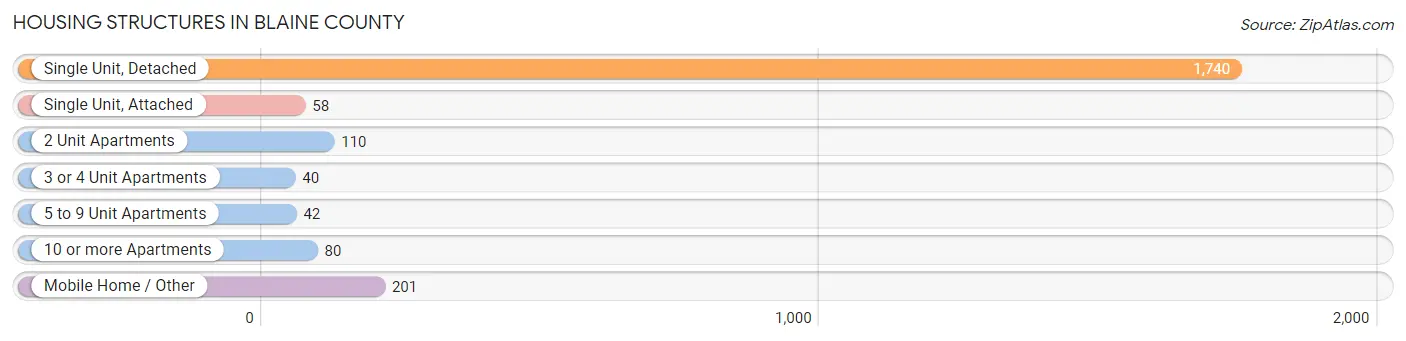
| Structure Type | # Housing Units | % Housing Units |
| Single Unit, Detached | 1,740 | 76.6% |
| Single Unit, Attached | 58 | 2.5% |
| 2 Unit Apartments | 110 | 4.8% |
| 3 or 4 Unit Apartments | 40 | 1.8% |
| 5 to 9 Unit Apartments | 42 | 1.8% |
| 10 or more Apartments | 80 | 3.5% |
| Mobile Home / Other | 201 | 8.8% |
| Total | 2,271 | 100.0% |
Housing Structures by Occupancy in Blaine County
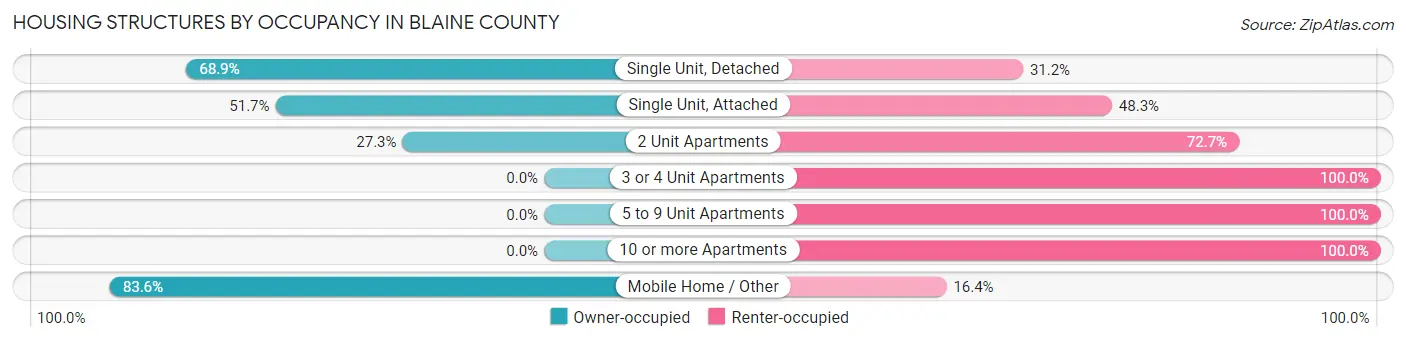
| Structure Type | Owner-occupied | Renter-occupied |
| Single Unit, Detached | 1,198 (68.9%) | 542 (31.1%) |
| Single Unit, Attached | 30 (51.7%) | 28 (48.3%) |
| 2 Unit Apartments | 30 (27.3%) | 80 (72.7%) |
| 3 or 4 Unit Apartments | 0 (0.0%) | 40 (100.0%) |
| 5 to 9 Unit Apartments | 0 (0.0%) | 42 (100.0%) |
| 10 or more Apartments | 0 (0.0%) | 80 (100.0%) |
| Mobile Home / Other | 168 (83.6%) | 33 (16.4%) |
| Total | 1,426 (62.8%) | 845 (37.2%) |
Housing Structures by Number of Rooms in Blaine County
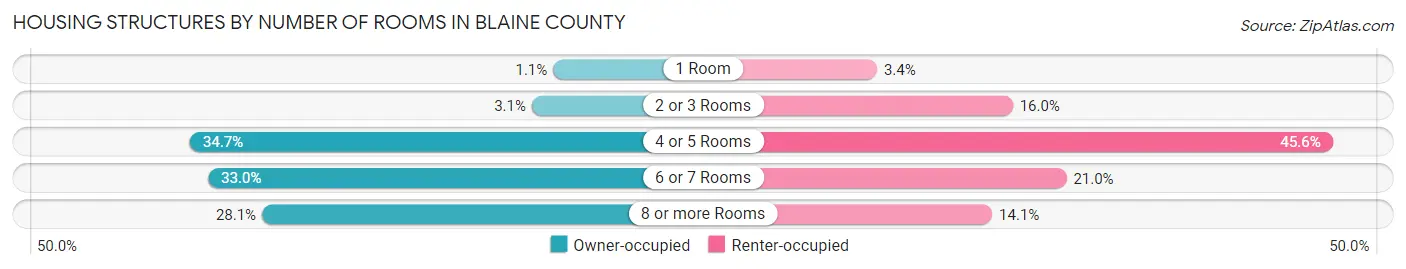
| Number of Rooms | Owner-occupied | Renter-occupied |
| 1 Room | 16 (1.1%) | 29 (3.4%) |
| 2 or 3 Rooms | 44 (3.1%) | 135 (16.0%) |
| 4 or 5 Rooms | 495 (34.7%) | 385 (45.6%) |
| 6 or 7 Rooms | 471 (33.0%) | 177 (20.9%) |
| 8 or more Rooms | 400 (28.1%) | 119 (14.1%) |
| Total | 1,426 (100.0%) | 845 (100.0%) |
Housing Structure by Heating Type in Blaine County
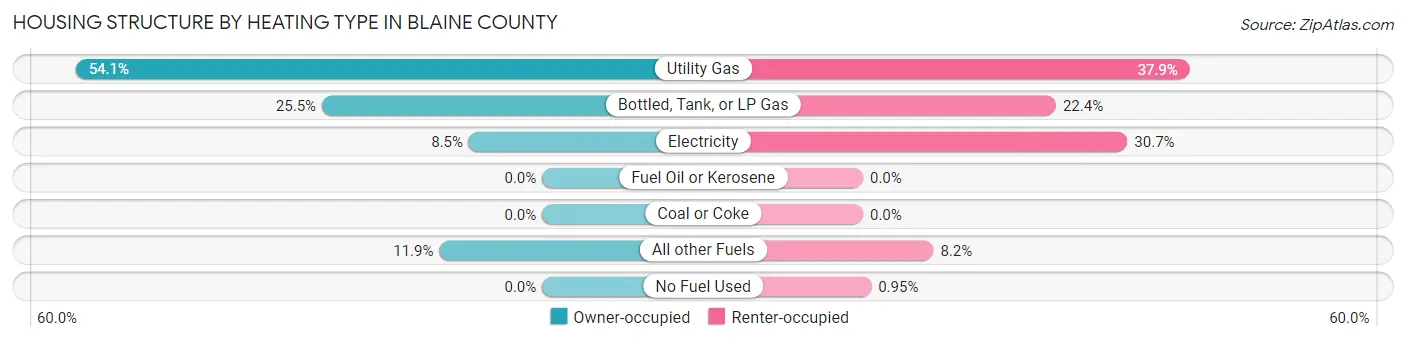
| Heating Type | Owner-occupied | Renter-occupied |
| Utility Gas | 771 (54.1%) | 320 (37.9%) |
| Bottled, Tank, or LP Gas | 364 (25.5%) | 189 (22.4%) |
| Electricity | 121 (8.5%) | 259 (30.6%) |
| Fuel Oil or Kerosene | 0 (0.0%) | 0 (0.0%) |
| Coal or Coke | 0 (0.0%) | 0 (0.0%) |
| All other Fuels | 170 (11.9%) | 69 (8.2%) |
| No Fuel Used | 0 (0.0%) | 8 (0.9%) |
| Total | 1,426 (100.0%) | 845 (100.0%) |
Household Vehicle Usage in Blaine County
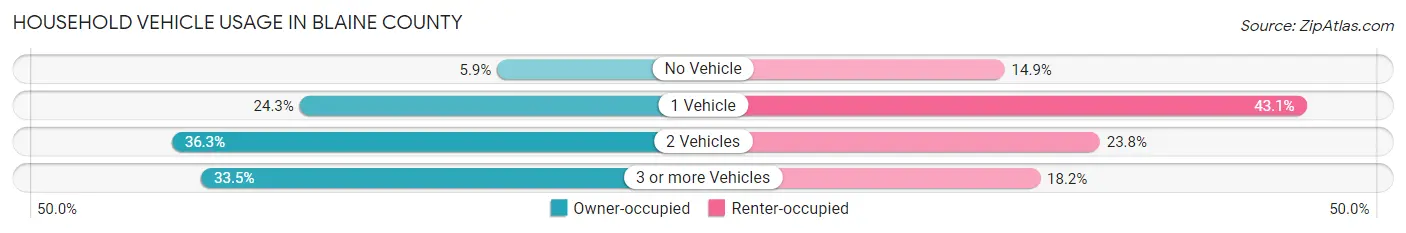
| Vehicles per Household | Owner-occupied | Renter-occupied |
| No Vehicle | 84 (5.9%) | 126 (14.9%) |
| 1 Vehicle | 347 (24.3%) | 364 (43.1%) |
| 2 Vehicles | 517 (36.3%) | 201 (23.8%) |
| 3 or more Vehicles | 478 (33.5%) | 154 (18.2%) |
| Total | 1,426 (100.0%) | 845 (100.0%) |
Real Estate & Mortgages in Blaine County
Real Estate and Mortgage Overview in Blaine County
| Characteristic | Without Mortgage | With Mortgage |
| Housing Units | 1,000 | 426 |
| Median Property Value | $103,800 | $189,100 |
| Median Household Income | $60,800 | $63 |
| Monthly Housing Costs | $378 | $22 |
| Real Estate Taxes | $1,708 | $46 |
Property Value by Mortgage Status in Blaine County
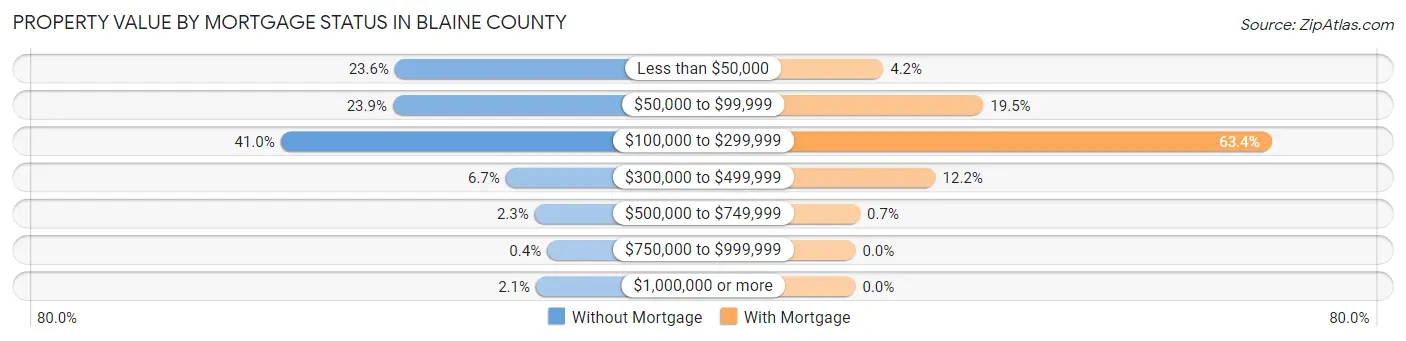
| Property Value | Without Mortgage | With Mortgage |
| Less than $50,000 | 236 (23.6%) | 18 (4.2%) |
| $50,000 to $99,999 | 239 (23.9%) | 83 (19.5%) |
| $100,000 to $299,999 | 410 (41.0%) | 270 (63.4%) |
| $300,000 to $499,999 | 67 (6.7%) | 52 (12.2%) |
| $500,000 to $749,999 | 23 (2.3%) | 3 (0.7%) |
| $750,000 to $999,999 | 4 (0.4%) | 0 (0.0%) |
| $1,000,000 or more | 21 (2.1%) | 0 (0.0%) |
| Total | 1,000 (100.0%) | 426 (100.0%) |
Household Income by Mortgage Status in Blaine County
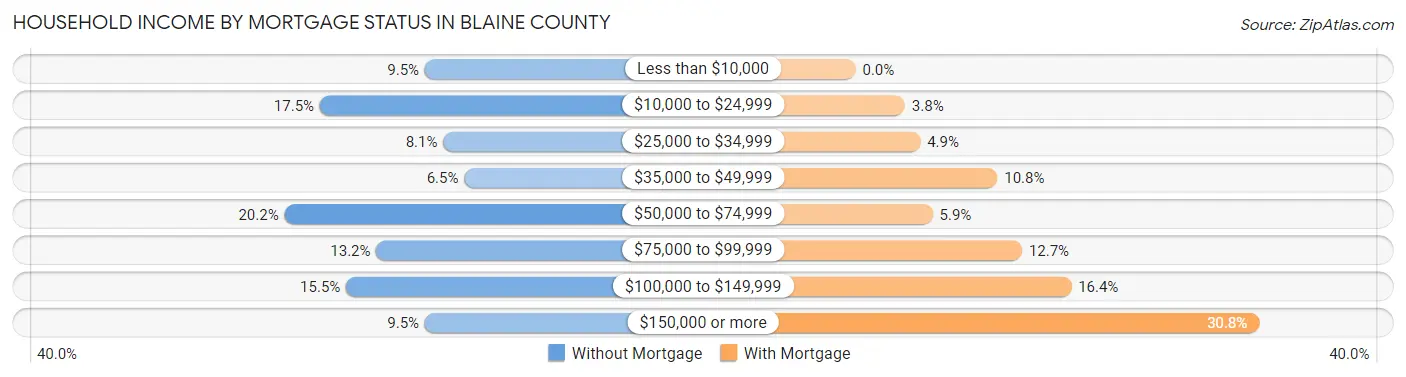
| Household Income | Without Mortgage | With Mortgage |
| Less than $10,000 | 95 (9.5%) | 0 (0.0%) |
| $10,000 to $24,999 | 175 (17.5%) | 16 (3.8%) |
| $25,000 to $34,999 | 81 (8.1%) | 21 (4.9%) |
| $35,000 to $49,999 | 65 (6.5%) | 46 (10.8%) |
| $50,000 to $74,999 | 202 (20.2%) | 25 (5.9%) |
| $75,000 to $99,999 | 132 (13.2%) | 54 (12.7%) |
| $100,000 to $149,999 | 155 (15.5%) | 70 (16.4%) |
| $150,000 or more | 95 (9.5%) | 131 (30.7%) |
| Total | 1,000 (100.0%) | 426 (100.0%) |
Property Value to Household Income Ratio in Blaine County
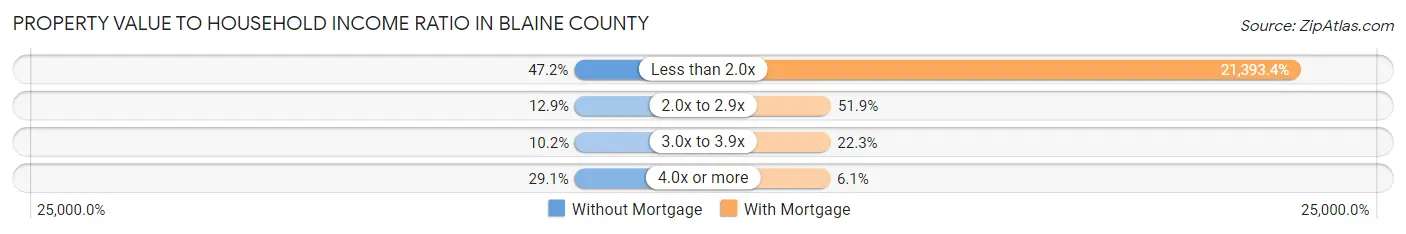
| Value-to-Income Ratio | Without Mortgage | With Mortgage |
| Less than 2.0x | 472 (47.2%) | 91,136 (21,393.4%) |
| 2.0x to 2.9x | 129 (12.9%) | 221 (51.9%) |
| 3.0x to 3.9x | 102 (10.2%) | 95 (22.3%) |
| 4.0x or more | 291 (29.1%) | 26 (6.1%) |
| Total | 1,000 (100.0%) | 426 (100.0%) |
Real Estate Taxes by Mortgage Status in Blaine County
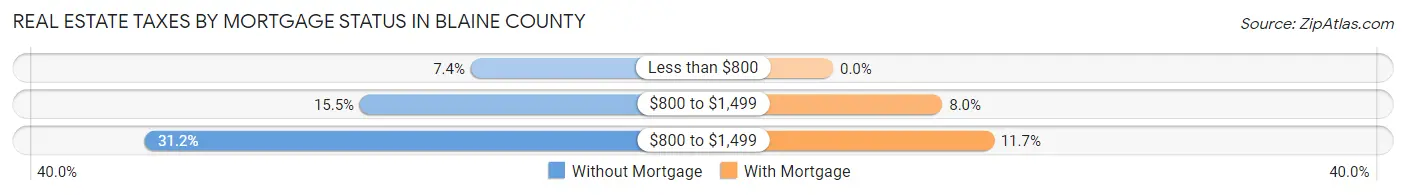
| Property Taxes | Without Mortgage | With Mortgage |
| Less than $800 | 74 (7.4%) | 0 (0.0%) |
| $800 to $1,499 | 155 (15.5%) | 34 (8.0%) |
| $800 to $1,499 | 312 (31.2%) | 50 (11.7%) |
| Total | 1,000 (100.0%) | 426 (100.0%) |
Health & Disability in Blaine County
Health Insurance Coverage by Age in Blaine County
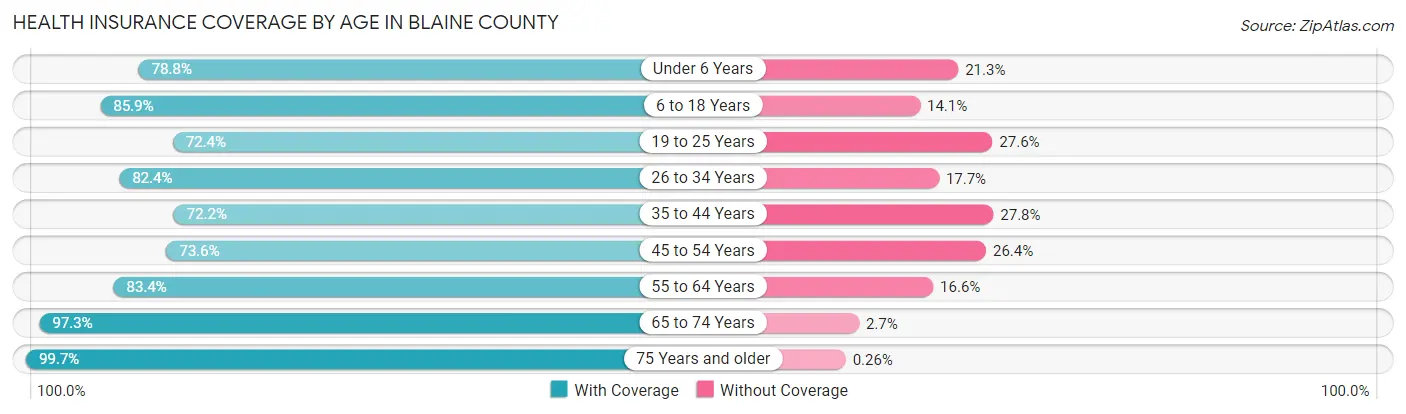
| Age Bracket | With Coverage | Without Coverage |
| Under 6 Years | 530 (78.7%) | 143 (21.2%) |
| 6 to 18 Years | 1,350 (85.9%) | 222 (14.1%) |
| 19 to 25 Years | 359 (72.4%) | 137 (27.6%) |
| 26 to 34 Years | 681 (82.4%) | 146 (17.6%) |
| 35 to 44 Years | 613 (72.2%) | 236 (27.8%) |
| 45 to 54 Years | 451 (73.6%) | 162 (26.4%) |
| 55 to 64 Years | 710 (83.4%) | 141 (16.6%) |
| 65 to 74 Years | 639 (97.3%) | 18 (2.7%) |
| 75 Years and older | 383 (99.7%) | 1 (0.3%) |
| Total | 5,716 (82.6%) | 1,206 (17.4%) |
Health Insurance Coverage by Citizenship Status in Blaine County
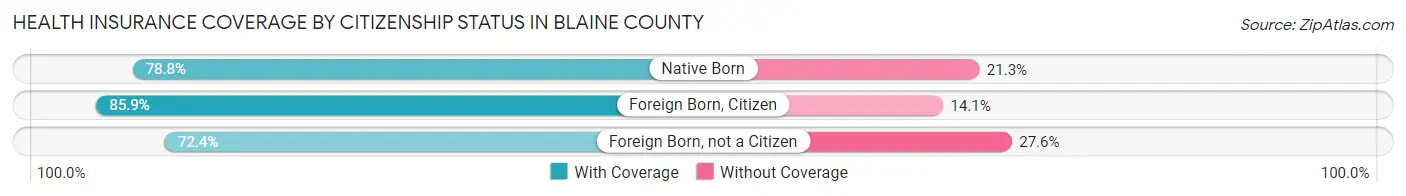
| Citizenship Status | With Coverage | Without Coverage |
| Native Born | 530 (78.7%) | 143 (21.2%) |
| Foreign Born, Citizen | 1,350 (85.9%) | 222 (14.1%) |
| Foreign Born, not a Citizen | 359 (72.4%) | 137 (27.6%) |
Health Insurance Coverage by Household Income in Blaine County
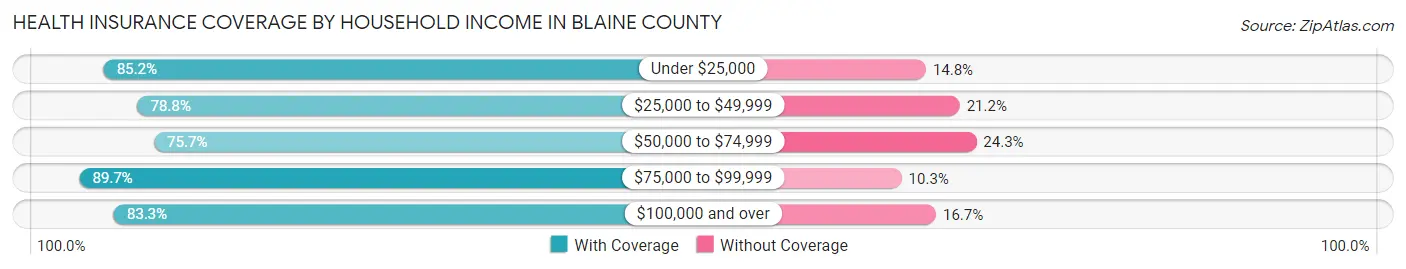
| Household Income | With Coverage | Without Coverage |
| Under $25,000 | 1,097 (85.2%) | 191 (14.8%) |
| $25,000 to $49,999 | 939 (78.8%) | 252 (21.2%) |
| $50,000 to $74,999 | 976 (75.7%) | 313 (24.3%) |
| $75,000 to $99,999 | 978 (89.7%) | 112 (10.3%) |
| $100,000 and over | 1,682 (83.3%) | 338 (16.7%) |
Public vs Private Health Insurance Coverage by Age in Blaine County
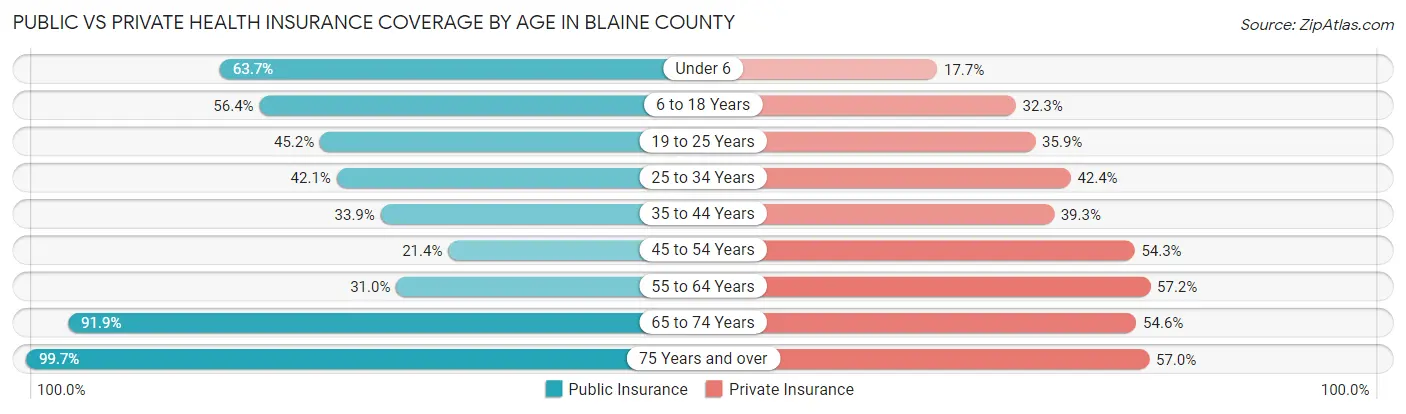
| Age Bracket | Public Insurance | Private Insurance |
| Under 6 | 429 (63.7%) | 119 (17.7%) |
| 6 to 18 Years | 887 (56.4%) | 507 (32.3%) |
| 19 to 25 Years | 224 (45.2%) | 178 (35.9%) |
| 25 to 34 Years | 348 (42.1%) | 351 (42.4%) |
| 35 to 44 Years | 288 (33.9%) | 334 (39.3%) |
| 45 to 54 Years | 131 (21.4%) | 333 (54.3%) |
| 55 to 64 Years | 264 (31.0%) | 487 (57.2%) |
| 65 to 74 Years | 604 (91.9%) | 359 (54.6%) |
| 75 Years and over | 383 (99.7%) | 219 (57.0%) |
| Total | 3,558 (51.4%) | 2,887 (41.7%) |
Disability Status by Sex by Age in Blaine County
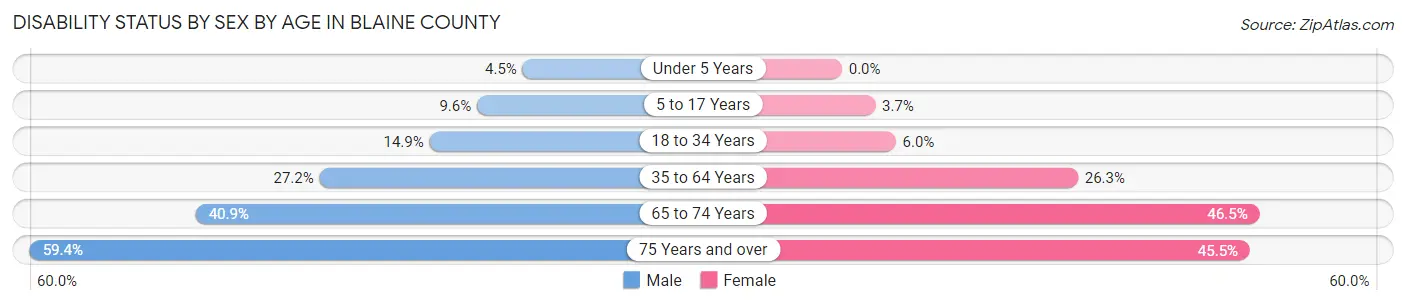
| Age Bracket | Male | Female |
| Under 5 Years | 12 (4.5%) | 0 (0.0%) |
| 5 to 17 Years | 79 (9.6%) | 27 (3.7%) |
| 18 to 34 Years | 111 (14.9%) | 44 (6.0%) |
| 35 to 64 Years | 316 (27.2%) | 302 (26.3%) |
| 65 to 74 Years | 122 (40.9%) | 167 (46.5%) |
| 75 Years and over | 104 (59.4%) | 95 (45.5%) |
Disability Class by Sex by Age in Blaine County
Disability Class: Hearing Difficulty
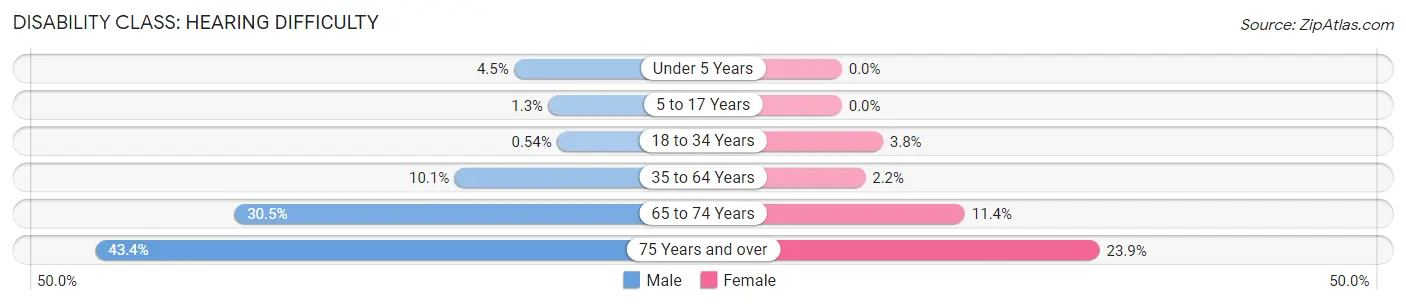
| Age Bracket | Male | Female |
| Under 5 Years | 12 (4.5%) | 0 (0.0%) |
| 5 to 17 Years | 11 (1.3%) | 0 (0.0%) |
| 18 to 34 Years | 4 (0.5%) | 28 (3.8%) |
| 35 to 64 Years | 117 (10.1%) | 25 (2.2%) |
| 65 to 74 Years | 91 (30.5%) | 41 (11.4%) |
| 75 Years and over | 76 (43.4%) | 50 (23.9%) |
Disability Class: Vision Difficulty
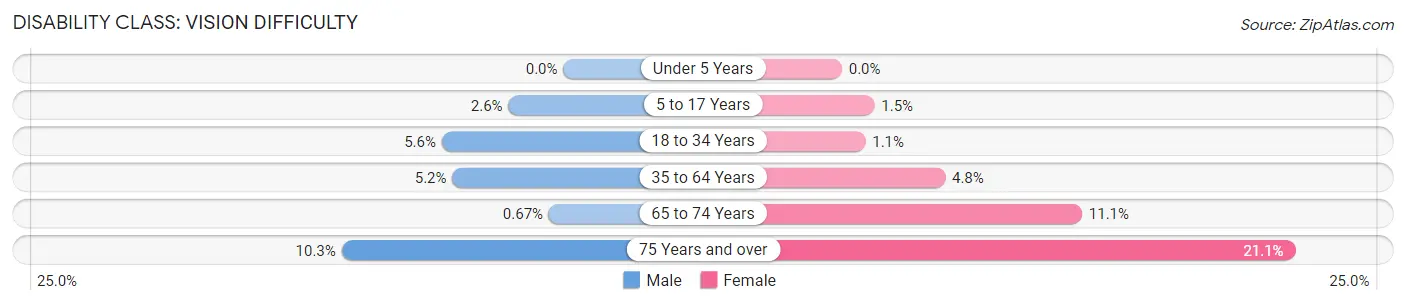
| Age Bracket | Male | Female |
| Under 5 Years | 0 (0.0%) | 0 (0.0%) |
| 5 to 17 Years | 21 (2.5%) | 11 (1.5%) |
| 18 to 34 Years | 42 (5.6%) | 8 (1.1%) |
| 35 to 64 Years | 60 (5.1%) | 55 (4.8%) |
| 65 to 74 Years | 2 (0.7%) | 40 (11.1%) |
| 75 Years and over | 18 (10.3%) | 44 (21.0%) |
Disability Class: Cognitive Difficulty
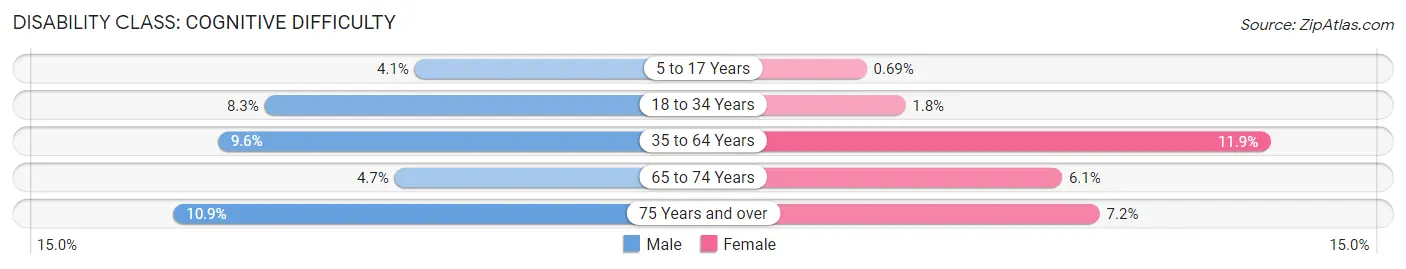
| Age Bracket | Male | Female |
| 5 to 17 Years | 34 (4.1%) | 5 (0.7%) |
| 18 to 34 Years | 62 (8.3%) | 13 (1.8%) |
| 35 to 64 Years | 112 (9.6%) | 137 (11.9%) |
| 65 to 74 Years | 14 (4.7%) | 22 (6.1%) |
| 75 Years and over | 19 (10.9%) | 15 (7.2%) |
Disability Class: Ambulatory Difficulty
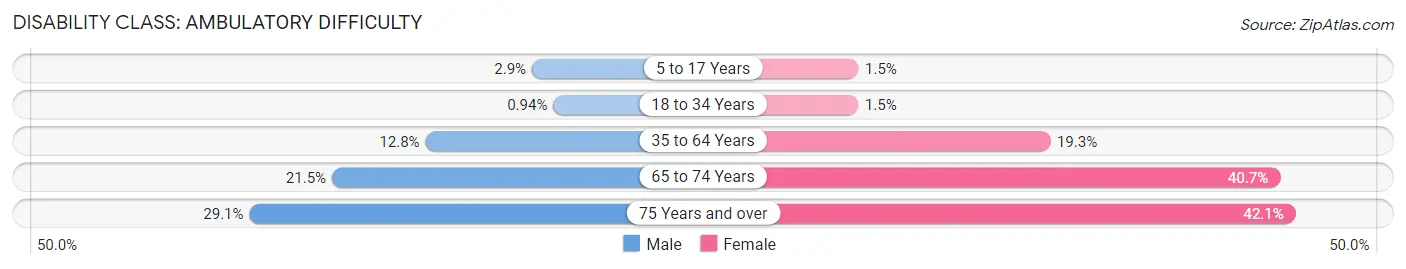
| Age Bracket | Male | Female |
| 5 to 17 Years | 24 (2.9%) | 11 (1.5%) |
| 18 to 34 Years | 7 (0.9%) | 11 (1.5%) |
| 35 to 64 Years | 149 (12.8%) | 222 (19.3%) |
| 65 to 74 Years | 64 (21.5%) | 146 (40.7%) |
| 75 Years and over | 51 (29.1%) | 88 (42.1%) |
Disability Class: Self-Care Difficulty
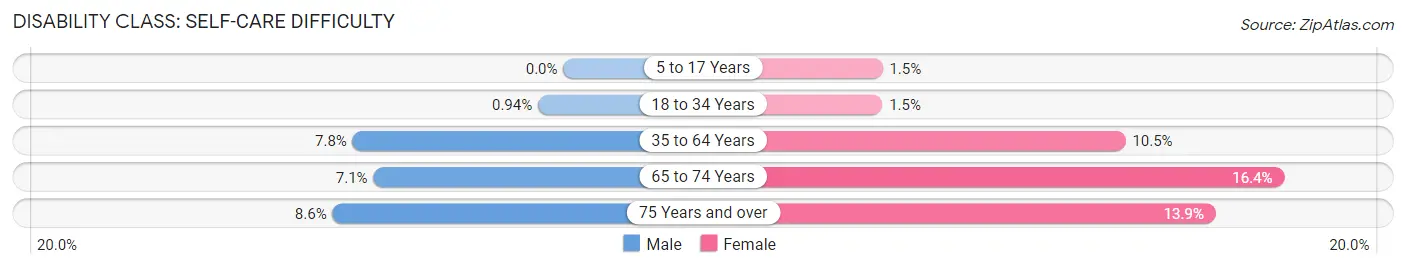
| Age Bracket | Male | Female |
| 5 to 17 Years | 0 (0.0%) | 11 (1.5%) |
| 18 to 34 Years | 7 (0.9%) | 11 (1.5%) |
| 35 to 64 Years | 91 (7.8%) | 121 (10.5%) |
| 65 to 74 Years | 21 (7.0%) | 59 (16.4%) |
| 75 Years and over | 15 (8.6%) | 29 (13.9%) |
Technology Access in Blaine County
Computing Device Access in Blaine County
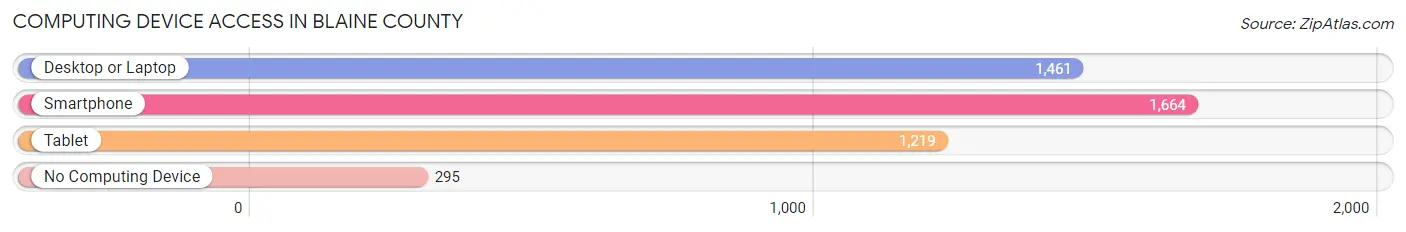
| Device Type | # Households | % Households |
| Desktop or Laptop | 1,461 | 64.3% |
| Smartphone | 1,664 | 73.3% |
| Tablet | 1,219 | 53.7% |
| No Computing Device | 295 | 13.0% |
| Total | 2,271 | 100.0% |
Internet Access in Blaine County
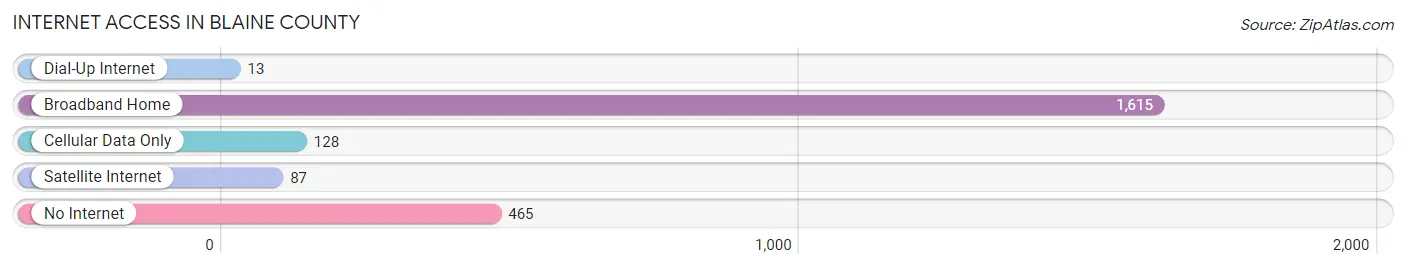
| Internet Type | # Households | % Households |
| Dial-Up Internet | 13 | 0.6% |
| Broadband Home | 1,615 | 71.1% |
| Cellular Data Only | 128 | 5.6% |
| Satellite Internet | 87 | 3.8% |
| No Internet | 465 | 20.5% |
| Total | 2,271 | 100.0% |
Blaine County Summary
Blaine County is located in the north-central part of Montana, in the United States. It is bordered by Hill County to the north, Chouteau County to the east, Liberty County to the south, and Phillips County to the west. The county seat is Chinook, and the largest city is Havre. The county was created in 1919 from parts of Hill and Chouteau counties, and was named after James G. Blaine, a former U.S. Secretary of State.
Geography
Blaine County covers an area of 2,717 square miles, making it the fourth-largest county in Montana. The county is located in the northern part of the state, and is part of the Great Plains region. The terrain is mostly flat, with some rolling hills in the western part of the county. The Milk River runs through the county, and the Bear Paw Mountains are located in the western part of the county. The county has a semi-arid climate, with cold winters and hot summers.
Demographics
As of the 2010 census, Blaine County had a population of 6,491. The racial makeup of the county was 94.2% White, 0.3% African American, 2.2% Native American, 0.4% Asian, 0.1% Pacific Islander, 0.7% from other races, and 2.1% from two or more races. Hispanic or Latino of any race were 2.7% of the population.
The median income for a household in the county was $37,917, and the median income for a family was $45,938. The per capita income for the county was $18,945. About 11.2% of families and 14.7% of the population were below the poverty line, including 19.2% of those under age 18 and 8.2% of those age 65 or over.
Economy
Agriculture is the main economic activity in Blaine County. The county is home to a large number of farms, and the main crops grown are wheat, barley, oats, and hay. Livestock production is also important, with cattle, sheep, and horses being the main animals raised.
The county is also home to several oil and gas fields, and there are several coal mines in the area. The county is also home to a large number of wind farms, which provide a significant amount of the county's electricity.
The county is home to several manufacturing companies, including a large paper mill in Chinook. The county is also home to several retail stores, restaurants, and other businesses.
History
The area that is now Blaine County was first inhabited by Native American tribes, including the Blackfeet, Gros Ventre, and Assiniboine. The first European settlers arrived in the area in the late 1800s, and the county was officially established in 1919.
The county was initially an agricultural area, with wheat, barley, oats, and hay being the main crops grown. The county also had several coal mines, and oil and gas fields were discovered in the area in the early 1900s.
The county experienced a population boom in the 1950s and 1960s, as people moved to the area for jobs in the oil and gas industry. The county's population has remained relatively stable since then, and the economy has diversified to include manufacturing, retail, and other businesses.
Common Questions
What is Per Capita Income in Blaine County?
Per Capita income in Blaine County is $24,353.
What is the Median Family Income in Blaine County?
Median Family Income in Blaine County is $69,949.
What is the Median Household income in Blaine County?
Median Household Income in Blaine County is $58,507.
What is Income or Wage Gap in Blaine County?
Income or Wage Gap in Blaine County is 6.9%.
Women in Blaine County earn 93.1 cents for every dollar earned by a man.
What is Family Income Deficit in Blaine County?
Family Income Deficit in Blaine County is $11,523.
Families that are below poverty line in Blaine County earn $11,523 less on average than the poverty threshold level.
What is Inequality or Gini Index in Blaine County?
Inequality or Gini Index in Blaine County is 0.44.
What is the Total Population of Blaine County?
Total Population of Blaine County is 7,030.
What is the Total Male Population of Blaine County?
Total Male Population of Blaine County is 3,530.
What is the Total Female Population of Blaine County?
Total Female Population of Blaine County is 3,500.
What is the Ratio of Males per 100 Females in Blaine County?
There are 100.86 Males per 100 Females in Blaine County.
What is the Ratio of Females per 100 Males in Blaine County?
There are 99.15 Females per 100 Males in Blaine County.
What is the Median Population Age in Blaine County?
Median Population Age in Blaine County is 33.6 Years.
What is the Average Family Size in Blaine County
Average Family Size in Blaine County is 3.8 People.
What is the Average Household Size in Blaine County
Average Household Size in Blaine County is 3.0 People.
How Large is the Labor Force in Blaine County?
There are 3,084 People in the Labor Forcein in Blaine County.
What is the Percentage of People in the Labor Force in Blaine County?
60.0% of People are in the Labor Force in Blaine County.
What is the Unemployment Rate in Blaine County?
Unemployment Rate in Blaine County is 13.2%.