Woodland, MN Map & Demographics
Woodland Map
Woodland Overview
$145,047
PER CAPITA INCOME
$213,750
AVG FAMILY INCOME
$203,750
AVG HOUSEHOLD INCOME
68.6%
WAGE / INCOME GAP [ % ]
31.4¢/ $1
WAGE / INCOME GAP [ $ ]
0.46
INEQUALITY / GINI INDEX
562
TOTAL POPULATION
255
MALE POPULATION
307
FEMALE POPULATION
83.06
MALES / 100 FEMALES
120.39
FEMALES / 100 MALES
55.3
MEDIAN AGE
2.7
AVG FAMILY SIZE
2.5
AVG HOUSEHOLD SIZE
257
LABOR FORCE [ PEOPLE ]
54.3%
PERCENT IN LABOR FORCE
6.2%
UNEMPLOYMENT RATE
Income in Woodland
Income Overview in Woodland
Per Capita Income in Woodland is $145,047, while median incomes of families and households are $213,750 and $203,750 respectively.
| Characteristic | Number | Measure |
| Per Capita Income | 562 | $145,047 |
| Median Family Income | 201 | $213,750 |
| Mean Family Income | 201 | $356,201 |
| Median Household Income | 223 | $203,750 |
| Mean Household Income | 223 | $345,551 |
| Income Deficit | 201 | $0 |
| Wage / Income Gap (%) | 562 | 68.65% |
| Wage / Income Gap ($) | 562 | 31.35¢ per $1 |
| Gini / Inequality Index | 562 | 0.46 |
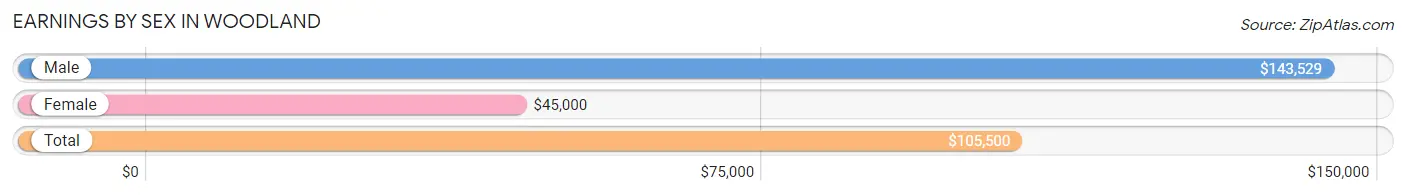
Earnings by Sex in Woodland
Average Earnings in Woodland are $105,500, $143,529 for men and $45,000 for women, a difference of 68.6%.
| Sex | Number | Average Earnings |
| Male | 160 (53.0%) | $143,529 |
| Female | 142 (47.0%) | $45,000 |
| Total | 302 (100.0%) | $105,500 |
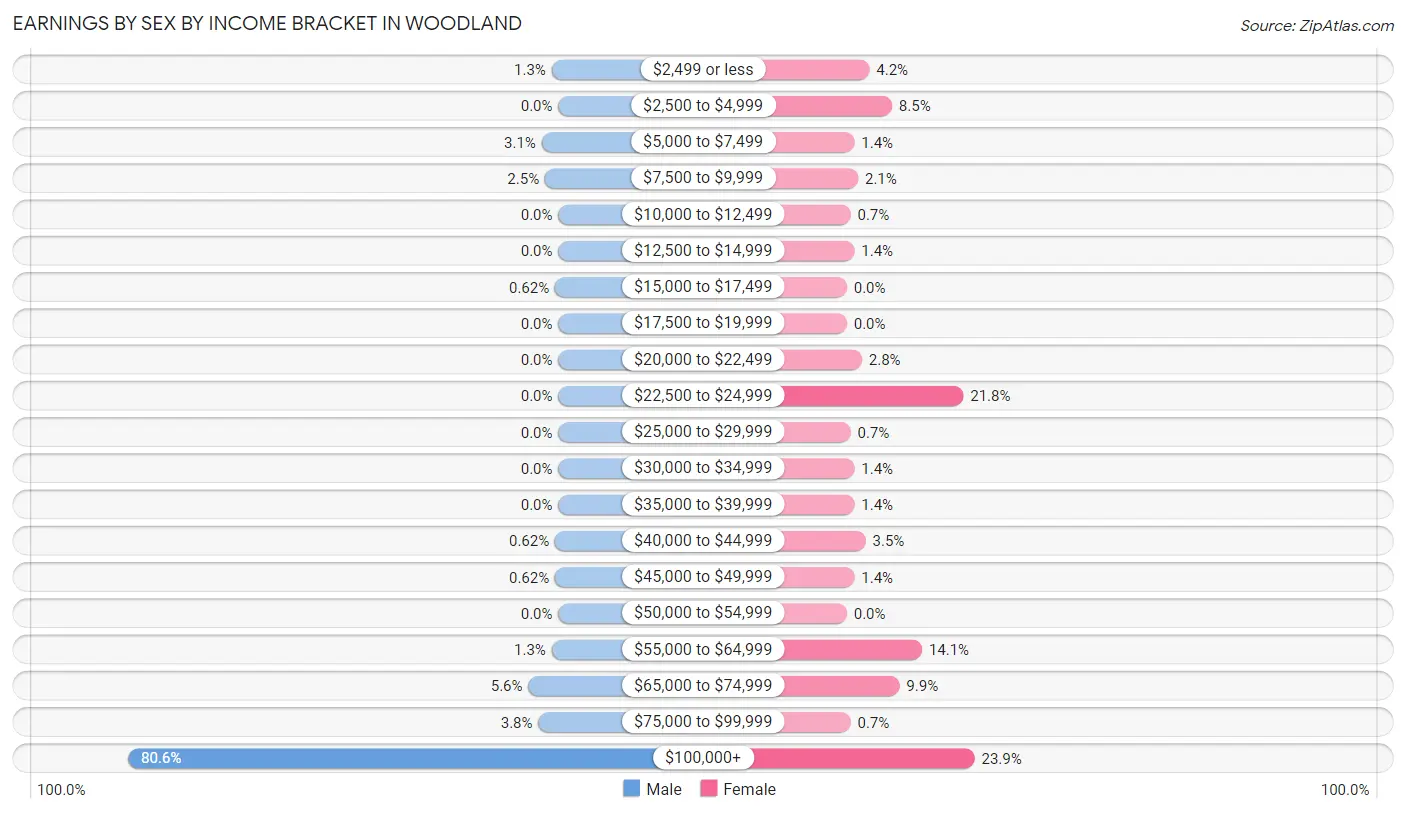
Earnings by Sex by Income Bracket in Woodland
The most common earnings brackets in Woodland are $100,000+ for men (129 | 80.6%) and $100,000+ for women (34 | 23.9%).
| Income | Male | Female |
| $2,499 or less | 2 (1.3%) | 6 (4.2%) |
| $2,500 to $4,999 | 0 (0.0%) | 12 (8.5%) |
| $5,000 to $7,499 | 5 (3.1%) | 2 (1.4%) |
| $7,500 to $9,999 | 4 (2.5%) | 3 (2.1%) |
| $10,000 to $12,499 | 0 (0.0%) | 1 (0.7%) |
| $12,500 to $14,999 | 0 (0.0%) | 2 (1.4%) |
| $15,000 to $17,499 | 1 (0.6%) | 0 (0.0%) |
| $17,500 to $19,999 | 0 (0.0%) | 0 (0.0%) |
| $20,000 to $22,499 | 0 (0.0%) | 4 (2.8%) |
| $22,500 to $24,999 | 0 (0.0%) | 31 (21.8%) |
| $25,000 to $29,999 | 0 (0.0%) | 1 (0.7%) |
| $30,000 to $34,999 | 0 (0.0%) | 2 (1.4%) |
| $35,000 to $39,999 | 0 (0.0%) | 2 (1.4%) |
| $40,000 to $44,999 | 1 (0.6%) | 5 (3.5%) |
| $45,000 to $49,999 | 1 (0.6%) | 2 (1.4%) |
| $50,000 to $54,999 | 0 (0.0%) | 0 (0.0%) |
| $55,000 to $64,999 | 2 (1.3%) | 20 (14.1%) |
| $65,000 to $74,999 | 9 (5.6%) | 14 (9.9%) |
| $75,000 to $99,999 | 6 (3.7%) | 1 (0.7%) |
| $100,000+ | 129 (80.6%) | 34 (23.9%) |
| Total | 160 (100.0%) | 142 (100.0%) |
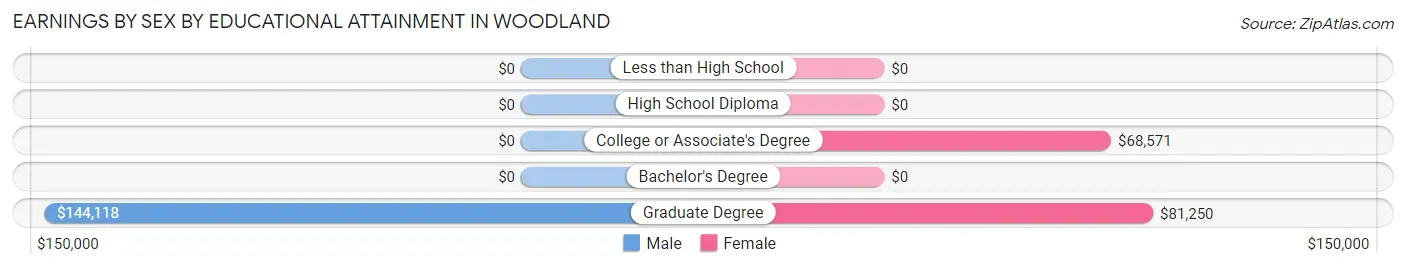
Earnings by Sex by Educational Attainment in Woodland
Average earnings in Woodland are $143,860 for men and $55,234 for women, a difference of 61.6%. Men with an educational attainment of graduate degree enjoy the highest average annual earnings of $144,118, while those with graduate degree education earn the least with $144,118. Women with an educational attainment of graduate degree earn the most with the average annual earnings of $81,250, while those with college or associate's degree education have the smallest earnings of $68,571.
| Educational Attainment | Male Income | Female Income |
| Less than High School | - | - |
| High School Diploma | - | - |
| College or Associate's Degree | - | - |
| Bachelor's Degree | - | - |
| Graduate Degree | $144,118 | $81,250 |
| Total | $143,860 | $55,234 |
Family Income in Woodland
Family Income Brackets in Woodland
According to the Woodland family income data, there are 110 families falling into the $200,000+ income range, which is the most common income bracket and makes up 54.7% of all families.
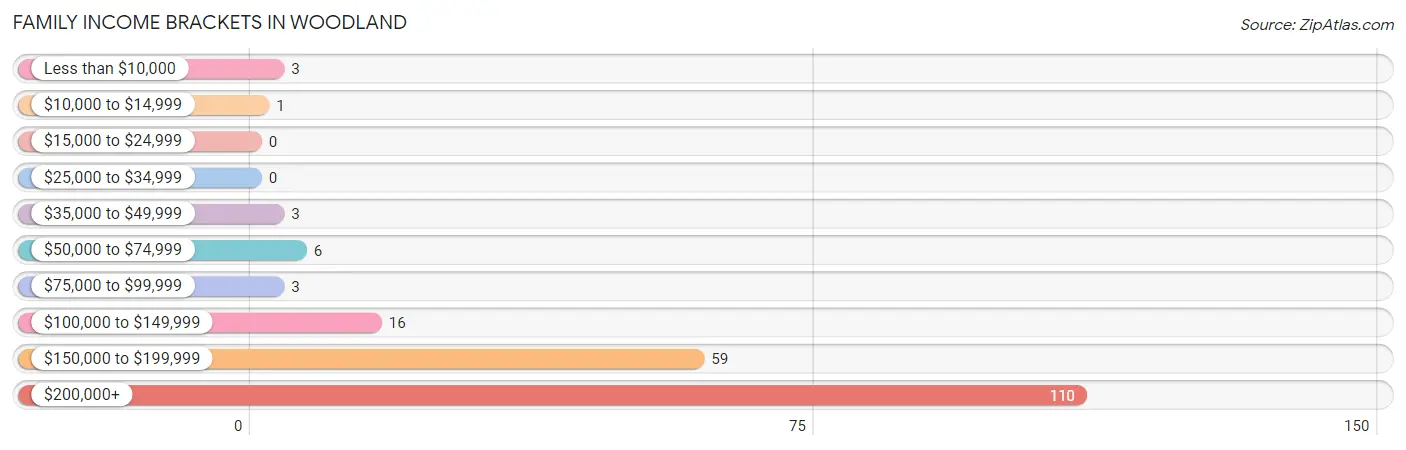
| Income Bracket | # Families | % Families |
| Less than $10,000 | 3 | 1.5% |
| $10,000 to $14,999 | 1 | 0.5% |
| $15,000 to $24,999 | 0 | 0.0% |
| $25,000 to $34,999 | 0 | 0.0% |
| $35,000 to $49,999 | 3 | 1.5% |
| $50,000 to $74,999 | 6 | 3.0% |
| $75,000 to $99,999 | 3 | 1.5% |
| $100,000 to $149,999 | 16 | 8.0% |
| $150,000 to $199,999 | 59 | 29.4% |
| $200,000+ | 110 | 54.7% |
Family Income by Famaliy Size in Woodland
3-person families (27 | 13.4%) account for the highest median family income in Woodland with $250,001 per family, while 2-person families (132 | 65.7%) have the highest median income of $91,875 per family member.
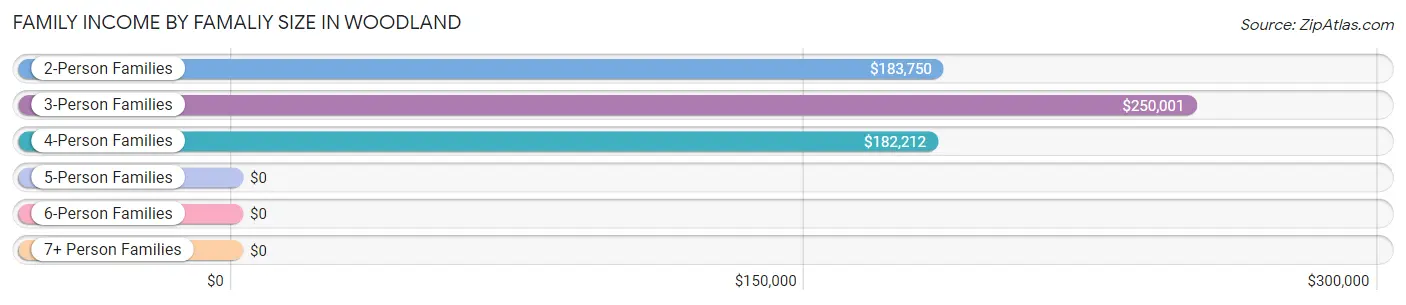
| Income Bracket | # Families | Median Income |
| 2-Person Families | 132 (65.7%) | $183,750 |
| 3-Person Families | 27 (13.4%) | $250,001 |
| 4-Person Families | 31 (15.4%) | $182,212 |
| 5-Person Families | 3 (1.5%) | $0 |
| 6-Person Families | 8 (4.0%) | $0 |
| 7+ Person Families | 0 (0.0%) | $0 |
| Total | 201 (100.0%) | $213,750 |
Family Income by Number of Earners in Woodland
The median family income in Woodland is $213,750, with families comprising no earners (43) having the highest median family income of $250,001, while families with 2 earners (96) have the lowest median family income of $181,346, accounting for 21.4% and 47.8% of families, respectively.
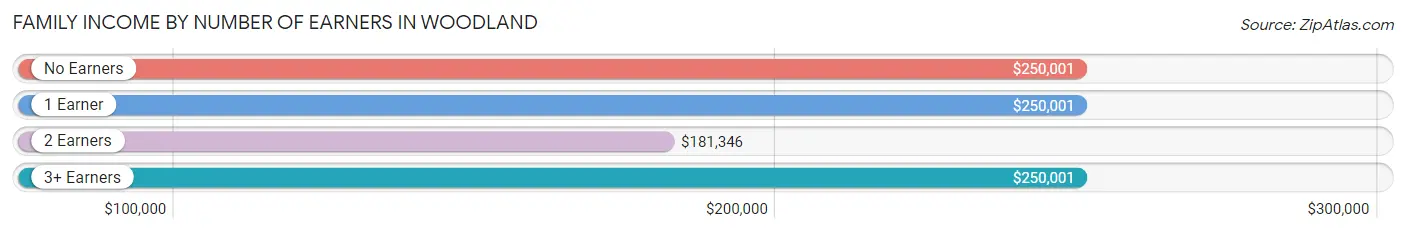
| Number of Earners | # Families | Median Income |
| No Earners | 43 (21.4%) | $250,001 |
| 1 Earner | 51 (25.4%) | $250,001 |
| 2 Earners | 96 (47.8%) | $181,346 |
| 3+ Earners | 11 (5.5%) | $250,001 |
| Total | 201 (100.0%) | $213,750 |
Household Income in Woodland
Household Income Brackets in Woodland
With 114 households falling in the category, the $200,000+ income range is the most frequent in Woodland, accounting for 51.1% of all households. In contrast, only 1 households (0.4%) fall into the $10,000 to $14,999 income bracket, making it the least populous group.
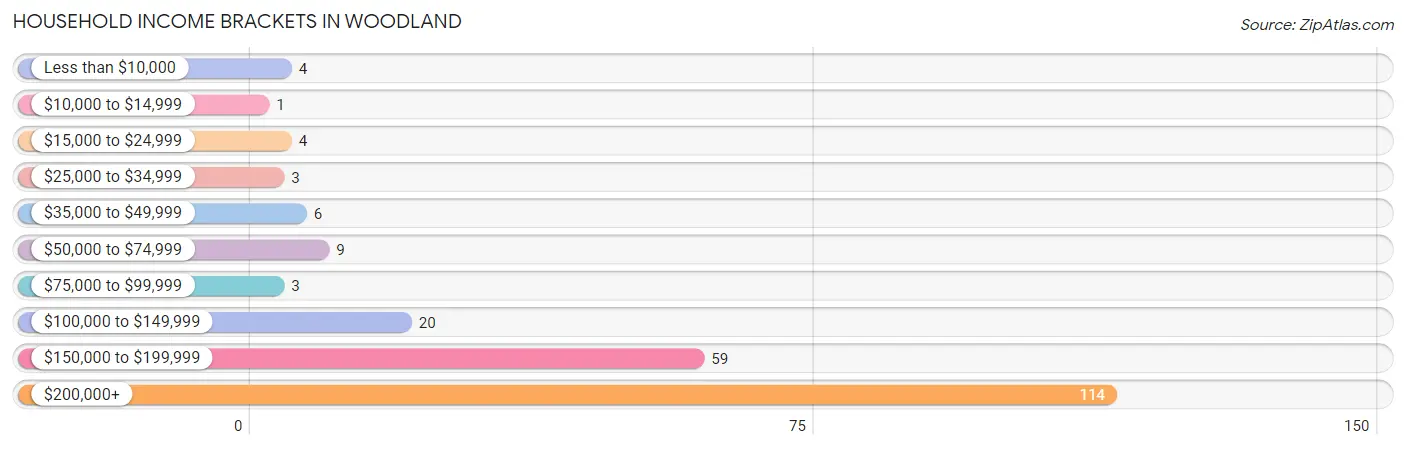
| Income Bracket | # Households | % Households |
| Less than $10,000 | 4 | 1.8% |
| $10,000 to $14,999 | 1 | 0.4% |
| $15,000 to $24,999 | 4 | 1.8% |
| $25,000 to $34,999 | 3 | 1.3% |
| $35,000 to $49,999 | 6 | 2.7% |
| $50,000 to $74,999 | 9 | 4.0% |
| $75,000 to $99,999 | 3 | 1.3% |
| $100,000 to $149,999 | 20 | 9.0% |
| $150,000 to $199,999 | 59 | 26.5% |
| $200,000+ | 114 | 51.1% |
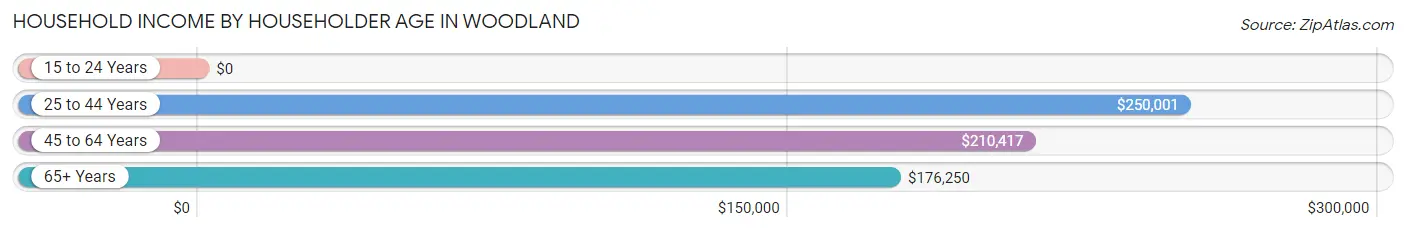
Household Income by Householder Age in Woodland
The median household income in Woodland is $203,750, with the highest median household income of $250,001 found in the 25 to 44 years age bracket for the primary householder. A total of 18 households (8.1%) fall into this category.
| Income Bracket | # Households | Median Income |
| 15 to 24 Years | 0 (0.0%) | $0 |
| 25 to 44 Years | 18 (8.1%) | $250,001 |
| 45 to 64 Years | 124 (55.6%) | $210,417 |
| 65+ Years | 81 (36.3%) | $176,250 |
| Total | 223 (100.0%) | $203,750 |
Poverty in Woodland
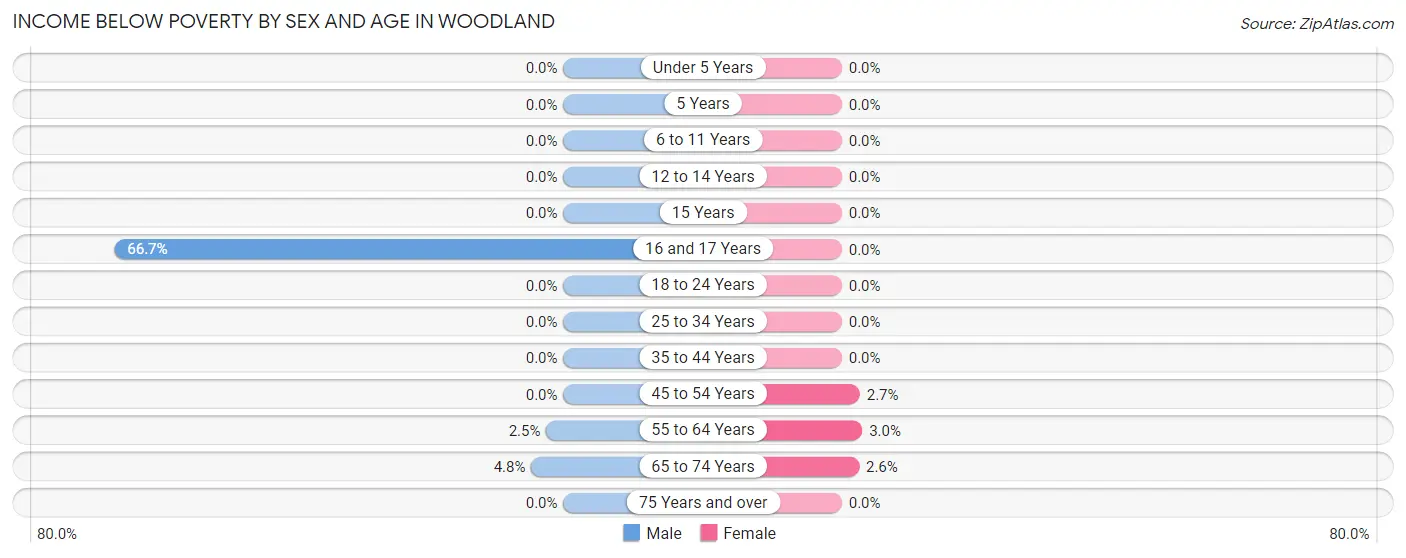
Income Below Poverty by Sex and Age in Woodland
With 2.4% poverty level for males and 1.6% for females among the residents of Woodland, 16 and 17 year old males and 55 to 64 year old females are the most vulnerable to poverty, with 2 males (66.7%) and 2 females (3.0%) in their respective age groups living below the poverty level.
| Age Bracket | Male | Female |
| Under 5 Years | 0 (0.0%) | 0 (0.0%) |
| 5 Years | 0 (0.0%) | 0 (0.0%) |
| 6 to 11 Years | 0 (0.0%) | 0 (0.0%) |
| 12 to 14 Years | 0 (0.0%) | 0 (0.0%) |
| 15 Years | 0 (0.0%) | 0 (0.0%) |
| 16 and 17 Years | 2 (66.7%) | 0 (0.0%) |
| 18 to 24 Years | 0 (0.0%) | 0 (0.0%) |
| 25 to 34 Years | 0 (0.0%) | 0 (0.0%) |
| 35 to 44 Years | 0 (0.0%) | 0 (0.0%) |
| 45 to 54 Years | 0 (0.0%) | 2 (2.7%) |
| 55 to 64 Years | 2 (2.5%) | 2 (3.0%) |
| 65 to 74 Years | 2 (4.8%) | 1 (2.6%) |
| 75 Years and over | 0 (0.0%) | 0 (0.0%) |
| Total | 6 (2.4%) | 5 (1.6%) |
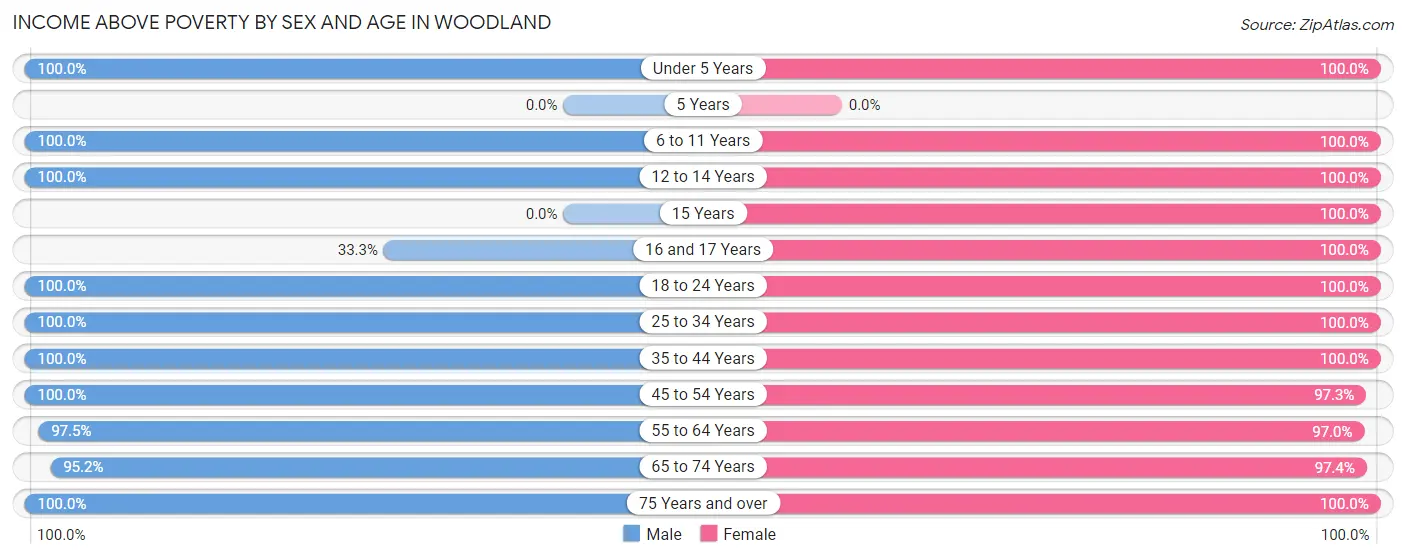
Income Above Poverty by Sex and Age in Woodland
According to the poverty statistics in Woodland, males aged under 5 years and females aged under 5 years are the age groups that are most secure financially, with 100.0% of males and 100.0% of females in these age groups living above the poverty line.
| Age Bracket | Male | Female |
| Under 5 Years | 18 (100.0%) | 13 (100.0%) |
| 5 Years | 0 (0.0%) | 0 (0.0%) |
| 6 to 11 Years | 6 (100.0%) | 22 (100.0%) |
| 12 to 14 Years | 6 (100.0%) | 22 (100.0%) |
| 15 Years | 0 (0.0%) | 2 (100.0%) |
| 16 and 17 Years | 1 (33.3%) | 8 (100.0%) |
| 18 to 24 Years | 8 (100.0%) | 5 (100.0%) |
| 25 to 34 Years | 5 (100.0%) | 7 (100.0%) |
| 35 to 44 Years | 11 (100.0%) | 13 (100.0%) |
| 45 to 54 Years | 40 (100.0%) | 73 (97.3%) |
| 55 to 64 Years | 77 (97.5%) | 64 (97.0%) |
| 65 to 74 Years | 40 (95.2%) | 38 (97.4%) |
| 75 Years and over | 37 (100.0%) | 35 (100.0%) |
| Total | 249 (97.7%) | 302 (98.4%) |
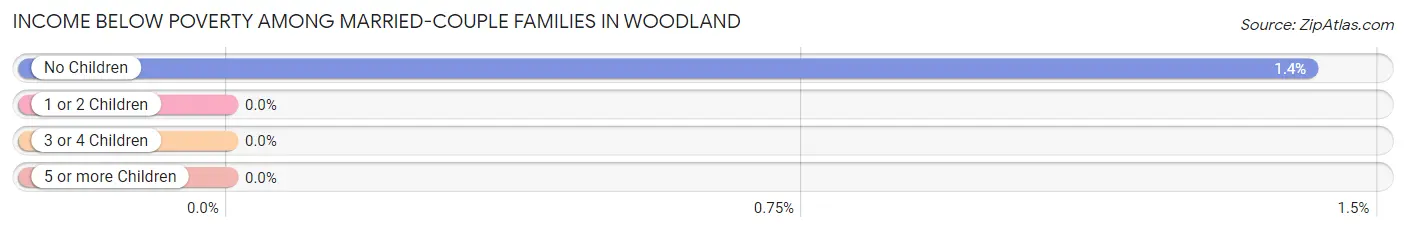
Income Below Poverty Among Married-Couple Families in Woodland
The poverty statistics for married-couple families in Woodland show that 1.0% or 2 of the total 199 families live below the poverty line. Families with no children have the highest poverty rate of 1.4%, comprising of 2 families. On the other hand, families with 1 or 2 children have the lowest poverty rate of 0.0%, which includes 0 families.
| Children | Above Poverty | Below Poverty |
| No Children | 140 (98.6%) | 2 (1.4%) |
| 1 or 2 Children | 46 (100.0%) | 0 (0.0%) |
| 3 or 4 Children | 11 (100.0%) | 0 (0.0%) |
| 5 or more Children | 0 (0.0%) | 0 (0.0%) |
| Total | 197 (99.0%) | 2 (1.0%) |
Income Below Poverty Among Single-Parent Households in Woodland
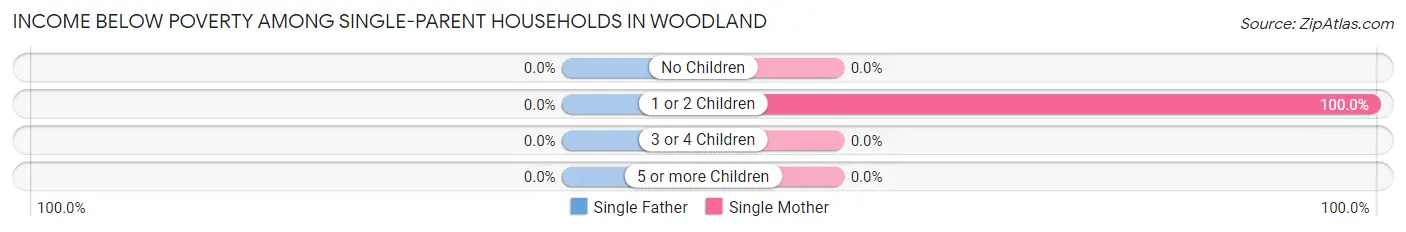
| Children | Single Father | Single Mother |
| No Children | 0 (0.0%) | 0 (0.0%) |
| 1 or 2 Children | 0 (0.0%) | 2 (100.0%) |
| 3 or 4 Children | 0 (0.0%) | 0 (0.0%) |
| 5 or more Children | 0 (0.0%) | 0 (0.0%) |
| Total | 0 (0.0%) | 2 (100.0%) |
Income Below Poverty Among Married-Couple vs Single-Parent Households in Woodland
The poverty data for Woodland shows that 2 of the married-couple family households (1.0%) and 2 of the single-parent households (100.0%) are living below the poverty level. Within the married-couple family households, those with no children have the highest poverty rate, with 2 households (1.4%) falling below the poverty line. Among the single-parent households, those with 1 or 2 children have the highest poverty rate, with 2 household (100.0%) living below poverty.
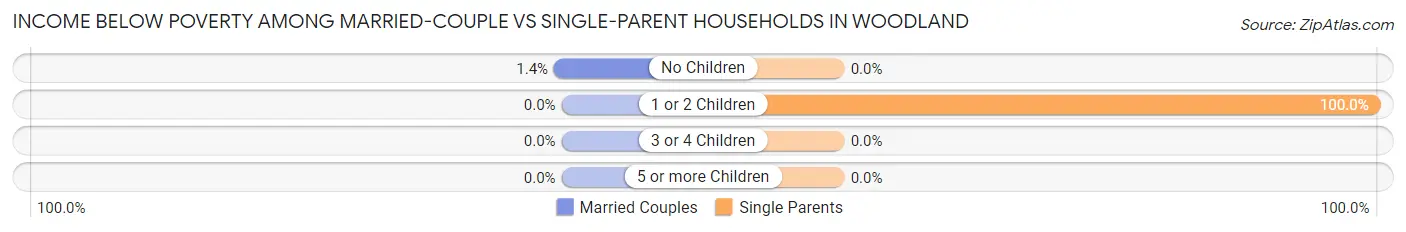
| Children | Married-Couple Families | Single-Parent Households |
| No Children | 2 (1.4%) | 0 (0.0%) |
| 1 or 2 Children | 0 (0.0%) | 2 (100.0%) |
| 3 or 4 Children | 0 (0.0%) | 0 (0.0%) |
| 5 or more Children | 0 (0.0%) | 0 (0.0%) |
| Total | 2 (1.0%) | 2 (100.0%) |
Race in Woodland
The most populous races in Woodland are White / Caucasian (560 | 99.6%), Hispanic or Latino (6 | 1.1%), and Asian (1 | 0.2%).
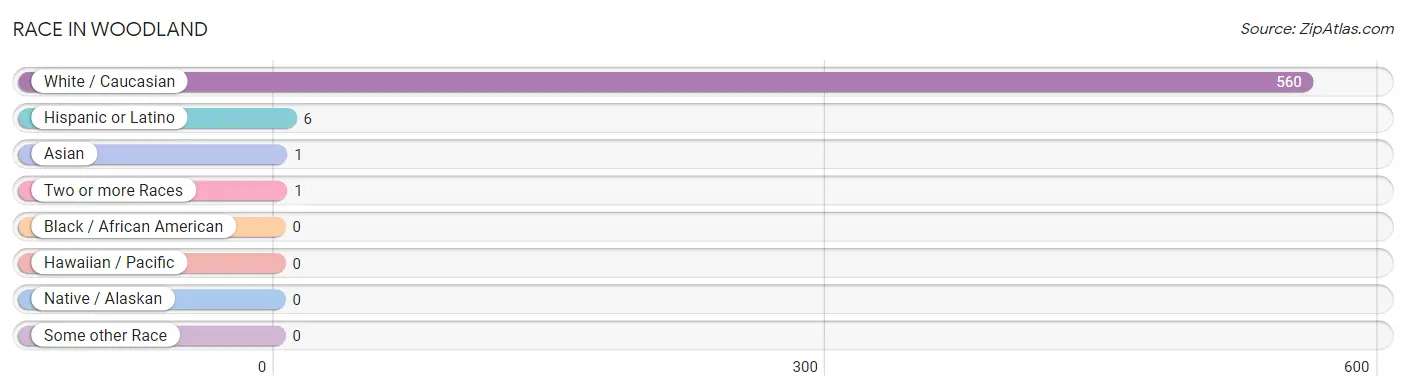
| Race | # Population | % Population |
| Asian | 1 | 0.2% |
| Black / African American | 0 | 0.0% |
| Hawaiian / Pacific | 0 | 0.0% |
| Hispanic or Latino | 6 | 1.1% |
| Native / Alaskan | 0 | 0.0% |
| White / Caucasian | 560 | 99.6% |
| Two or more Races | 1 | 0.2% |
| Some other Race | 0 | 0.0% |
| Total | 562 | 100.0% |
Ancestry in Woodland
The most populous ancestries reported in Woodland are Irish (166 | 29.5%), German (133 | 23.7%), English (109 | 19.4%), Swedish (99 | 17.6%), and Norwegian (65 | 11.6%), together accounting for 101.8% of all Woodland residents.
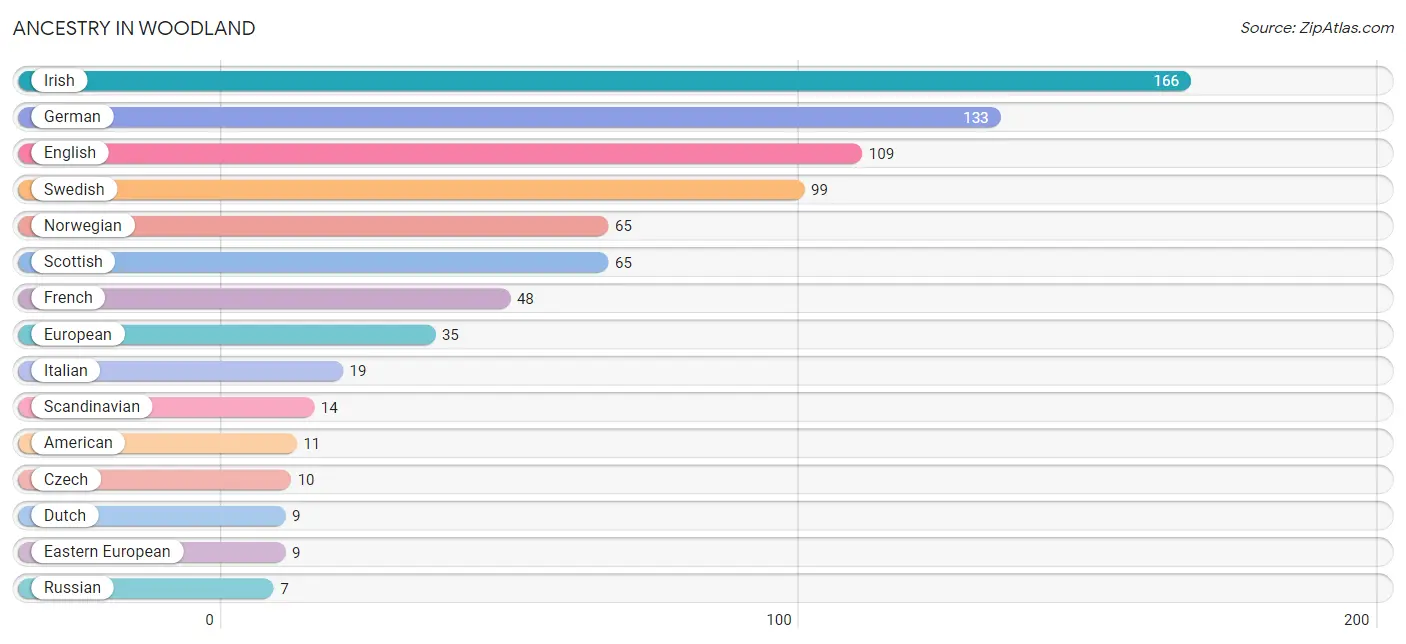
| Ancestry | # Population | % Population |
| American | 11 | 2.0% |
| Belgian | 2 | 0.4% |
| British | 4 | 0.7% |
| Burmese | 2 | 0.4% |
| Canadian | 5 | 0.9% |
| Czech | 10 | 1.8% |
| Danish | 4 | 0.7% |
| Dutch | 9 | 1.6% |
| Eastern European | 9 | 1.6% |
| English | 109 | 19.4% |
| European | 35 | 6.2% |
| Finnish | 5 | 0.9% |
| French | 48 | 8.5% |
| German | 133 | 23.7% |
| Irish | 166 | 29.5% |
| Italian | 19 | 3.4% |
| Latvian | 5 | 0.9% |
| Lithuanian | 1 | 0.2% |
| Mexican | 6 | 1.1% |
| Norwegian | 65 | 11.6% |
| Polish | 3 | 0.5% |
| Romanian | 1 | 0.2% |
| Russian | 7 | 1.3% |
| Scandinavian | 14 | 2.5% |
| Scotch-Irish | 2 | 0.4% |
| Scottish | 65 | 11.6% |
| Serbian | 2 | 0.4% |
| Swedish | 99 | 17.6% |
| Swiss | 5 | 0.9% | View All 29 Rows |
Immigrants in Woodland
The most numerous immigrant groups reported in Woodland came from Central America (5 | 0.9%), Europe (5 | 0.9%), Latin America (5 | 0.9%), Mexico (5 | 0.9%), and Eastern Europe (4 | 0.7%), together accounting for 4.3% of all Woodland residents.
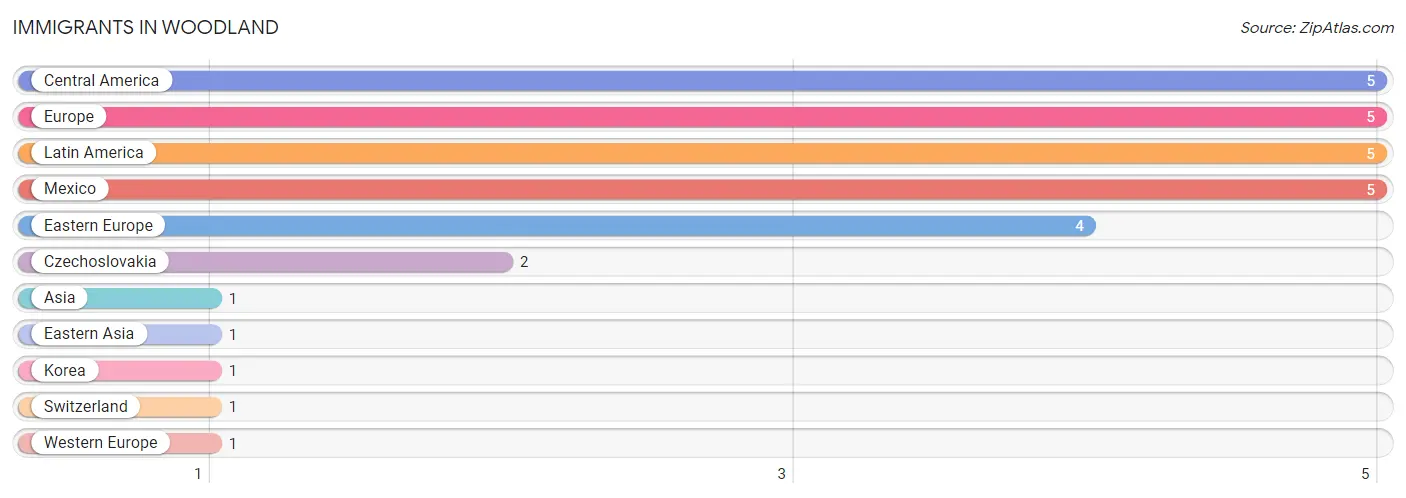
| Immigration Origin | # Population | % Population |
| Asia | 1 | 0.2% |
| Central America | 5 | 0.9% |
| Czechoslovakia | 2 | 0.4% |
| Eastern Asia | 1 | 0.2% |
| Eastern Europe | 4 | 0.7% |
| Europe | 5 | 0.9% |
| Korea | 1 | 0.2% |
| Latin America | 5 | 0.9% |
| Mexico | 5 | 0.9% |
| Switzerland | 1 | 0.2% |
| Western Europe | 1 | 0.2% | View All 11 Rows |
Sex and Age in Woodland
Sex and Age in Woodland
The most populous age groups in Woodland are 55 to 59 Years (63 | 24.7%) for men and 50 to 54 Years (45 | 14.7%) for women.
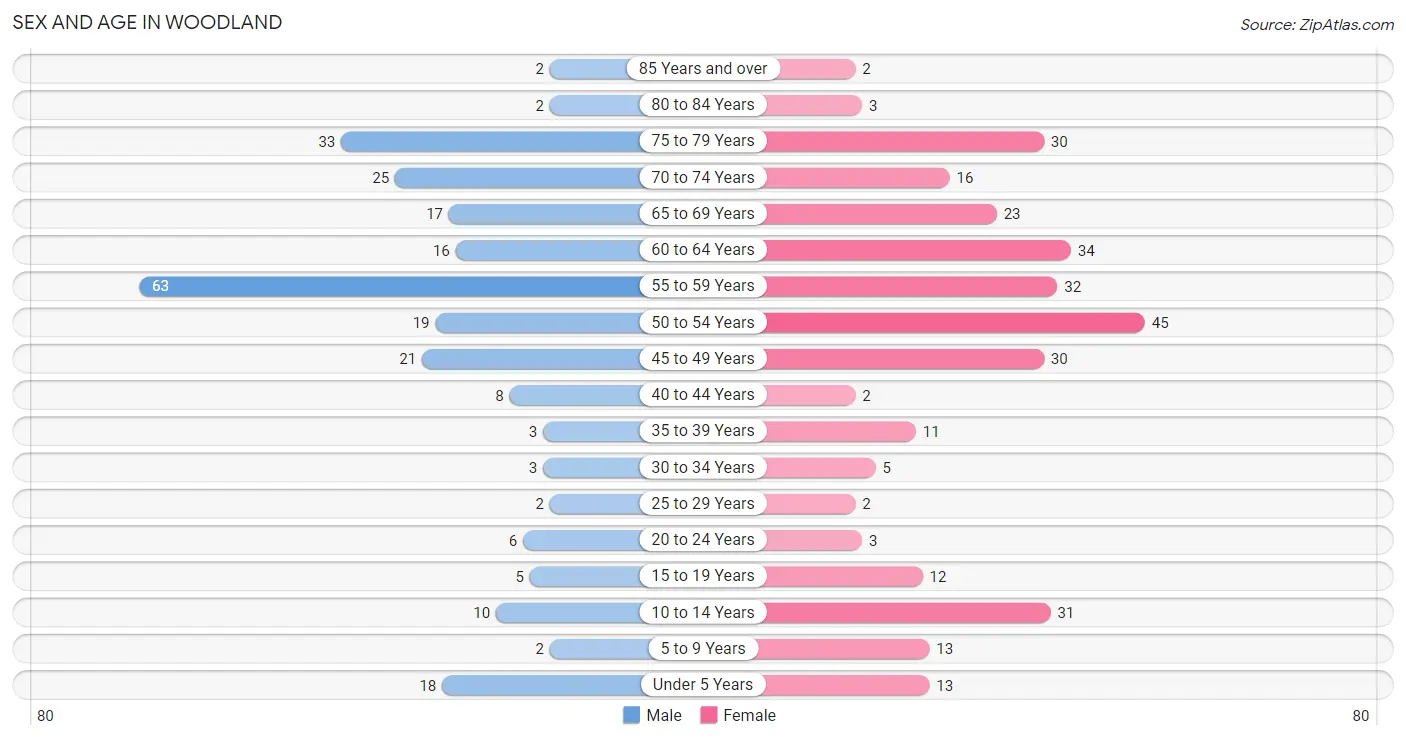
| Age Bracket | Male | Female |
| Under 5 Years | 18 (7.1%) | 13 (4.2%) |
| 5 to 9 Years | 2 (0.8%) | 13 (4.2%) |
| 10 to 14 Years | 10 (3.9%) | 31 (10.1%) |
| 15 to 19 Years | 5 (2.0%) | 12 (3.9%) |
| 20 to 24 Years | 6 (2.4%) | 3 (1.0%) |
| 25 to 29 Years | 2 (0.8%) | 2 (0.6%) |
| 30 to 34 Years | 3 (1.2%) | 5 (1.6%) |
| 35 to 39 Years | 3 (1.2%) | 11 (3.6%) |
| 40 to 44 Years | 8 (3.1%) | 2 (0.6%) |
| 45 to 49 Years | 21 (8.2%) | 30 (9.8%) |
| 50 to 54 Years | 19 (7.4%) | 45 (14.7%) |
| 55 to 59 Years | 63 (24.7%) | 32 (10.4%) |
| 60 to 64 Years | 16 (6.3%) | 34 (11.1%) |
| 65 to 69 Years | 17 (6.7%) | 23 (7.5%) |
| 70 to 74 Years | 25 (9.8%) | 16 (5.2%) |
| 75 to 79 Years | 33 (12.9%) | 30 (9.8%) |
| 80 to 84 Years | 2 (0.8%) | 3 (1.0%) |
| 85 Years and over | 2 (0.8%) | 2 (0.6%) |
| Total | 255 (100.0%) | 307 (100.0%) |
Families and Households in Woodland
Median Family Size in Woodland
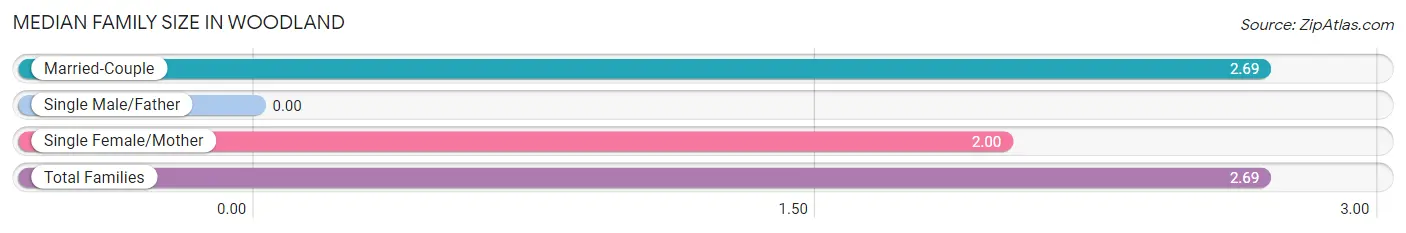
| Family Type | # Families | Family Size |
| Married-Couple | 199 (99.0%) | 2.69 |
| Single Male/Father | 0 (0.0%) | - |
| Single Female/Mother | 2 (1.0%) | 2.00 |
| Total Families | 201 (100.0%) | 2.69 |
Median Household Size in Woodland
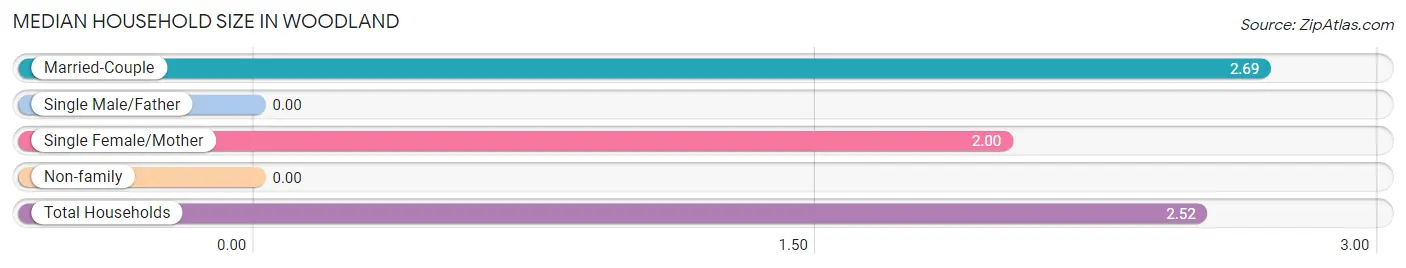
| Household Type | # Households | Household Size |
| Married-Couple | 199 (89.2%) | 2.69 |
| Single Male/Father | 0 (0.0%) | - |
| Single Female/Mother | 2 (0.9%) | 2.00 |
| Non-family | 22 (9.9%) | - |
| Total Households | 223 (100.0%) | 2.52 |
Household Size by Marriage Status in Woodland
Out of a total of 223 households in Woodland, 201 (90.1%) are family households, while 22 (9.9%) are nonfamily households. The most numerous type of family households are 2-person households, comprising 132, and the most common type of nonfamily households are 1-person households, comprising 22.
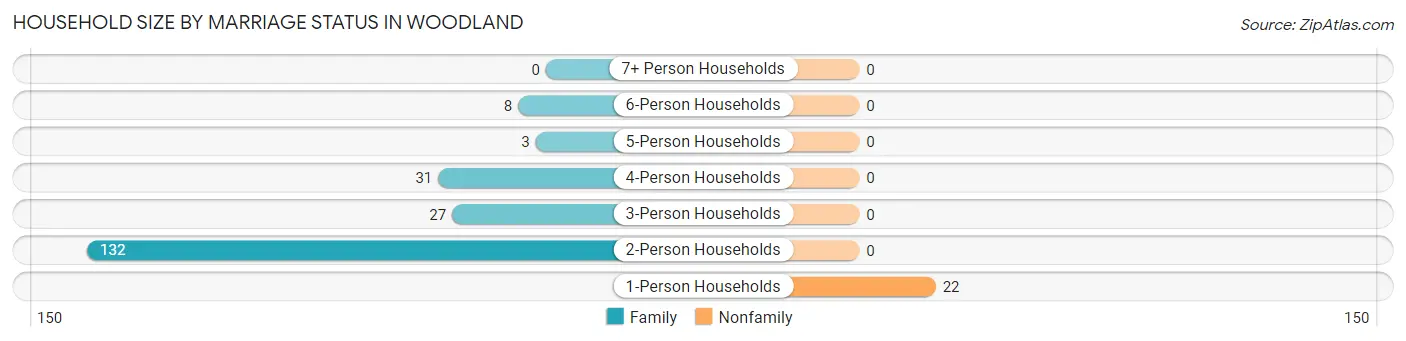
| Household Size | Family Households | Nonfamily Households |
| 1-Person Households | - | 22 (9.9%) |
| 2-Person Households | 132 (59.2%) | 0 (0.0%) |
| 3-Person Households | 27 (12.1%) | 0 (0.0%) |
| 4-Person Households | 31 (13.9%) | 0 (0.0%) |
| 5-Person Households | 3 (1.3%) | 0 (0.0%) |
| 6-Person Households | 8 (3.6%) | 0 (0.0%) |
| 7+ Person Households | 0 (0.0%) | 0 (0.0%) |
| Total | 201 (90.1%) | 22 (9.9%) |
Female Fertility in Woodland
Fertility by Age in Woodland
Average fertility rate in Woodland is 206.0 births per 1,000 women. Women in the age bracket of 35 to 50 years have the highest fertility rate with 283.0 births per 1,000 women. Women in the age bracket of 35 to 50 years acount for 92.9% of all women with births.
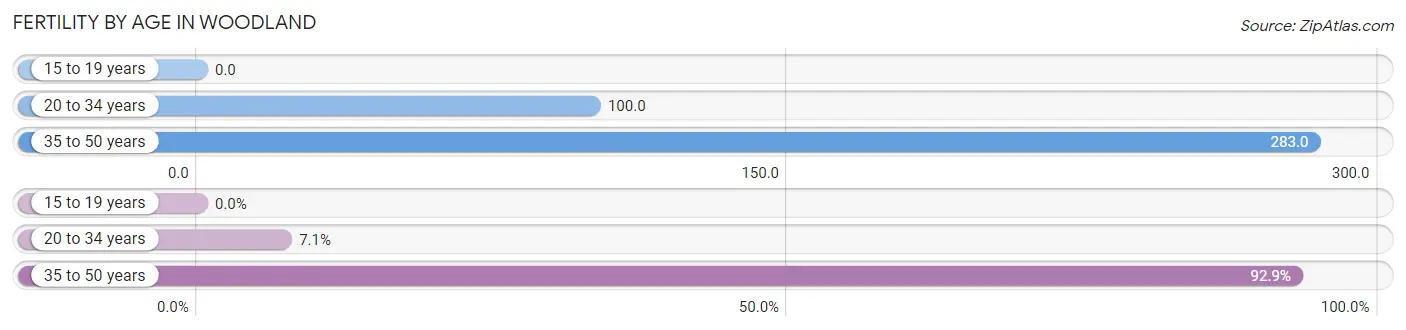
| Age Bracket | Women with Births | Births / 1,000 Women |
| 15 to 19 years | 0 (0.0%) | 0.0 |
| 20 to 34 years | 1 (7.1%) | 100.0 |
| 35 to 50 years | 13 (92.9%) | 283.0 |
| Total | 14 (100.0%) | 206.0 |
Fertility by Age by Marriage Status in Woodland
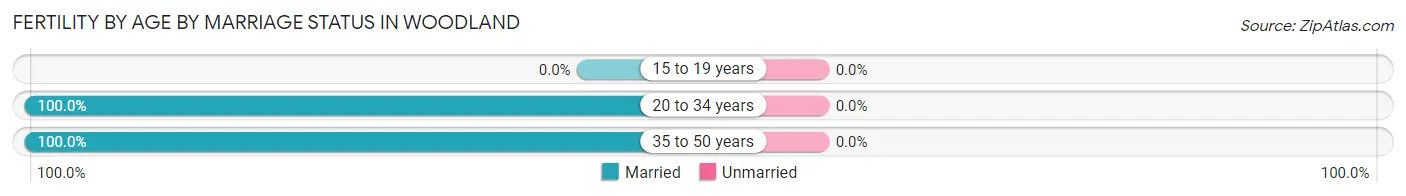
| Age Bracket | Married | Unmarried |
| 15 to 19 years | 0 (0.0%) | 0 (0.0%) |
| 20 to 34 years | 1 (100.0%) | 0 (0.0%) |
| 35 to 50 years | 13 (100.0%) | 0 (0.0%) |
| Total | 14 (100.0%) | 0 (0.0%) |
Fertility by Education in Woodland
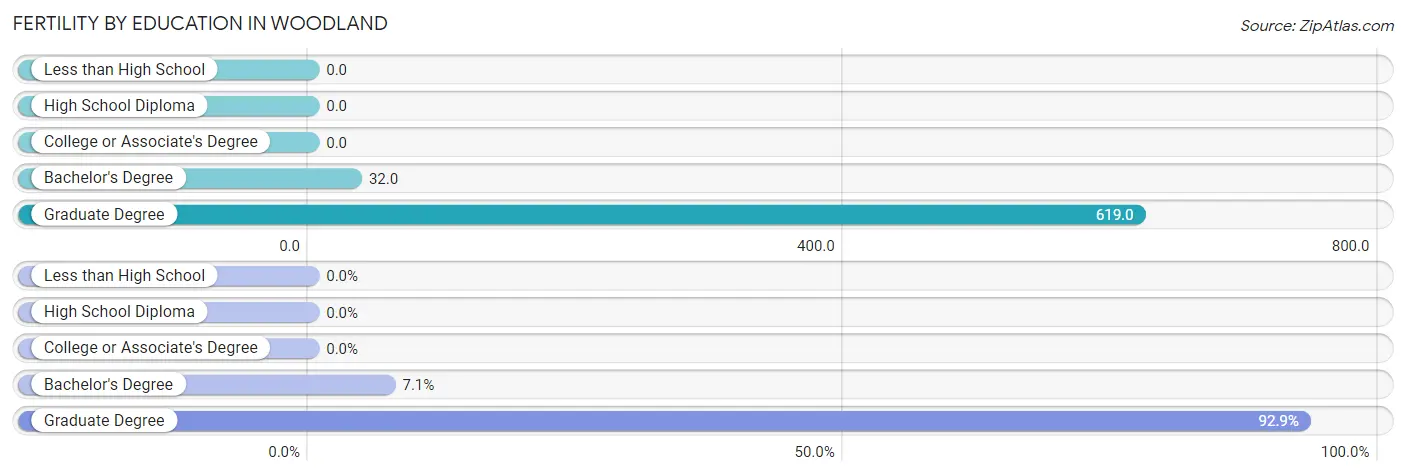
| Educational Attainment | Women with Births | Births / 1,000 Women |
| Less than High School | 0 (0.0%) | 0.0 |
| High School Diploma | 0 (0.0%) | 0.0 |
| College or Associate's Degree | 0 (0.0%) | 0.0 |
| Bachelor's Degree | 1 (7.1%) | 32.0 |
| Graduate Degree | 13 (92.9%) | 619.0 |
| Total | 14 (100.0%) | 206.0 |
Fertility by Education by Marriage Status in Woodland
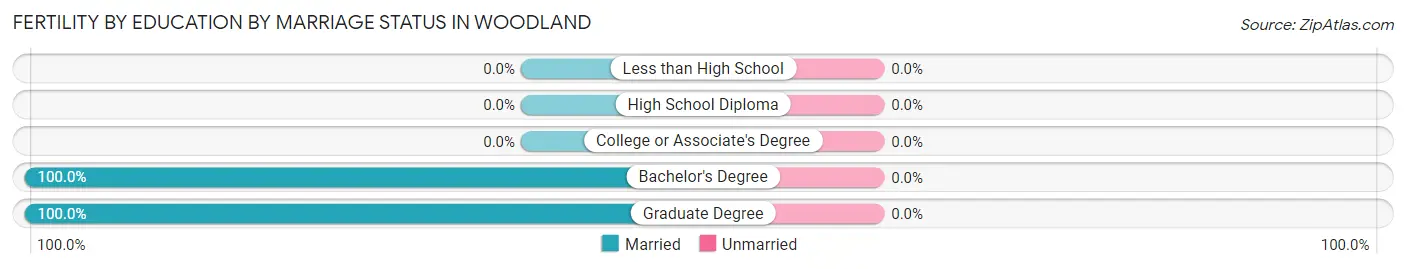
| Educational Attainment | Married | Unmarried |
| Less than High School | 0 (0.0%) | 0 (0.0%) |
| High School Diploma | 0 (0.0%) | 0 (0.0%) |
| College or Associate's Degree | 0 (0.0%) | 0 (0.0%) |
| Bachelor's Degree | 1 (100.0%) | 0 (0.0%) |
| Graduate Degree | 13 (100.0%) | 0 (0.0%) |
| Total | 14 (100.0%) | 0 (0.0%) |
Employment Characteristics in Woodland
Employment by Class of Employer in Woodland
Among the 241 employed individuals in Woodland, private company employees (165 | 68.5%), self-employed (incorporated) (35 | 14.5%), and self-employed (not incorporated) (19 | 7.9%) make up the most common classes of employment.
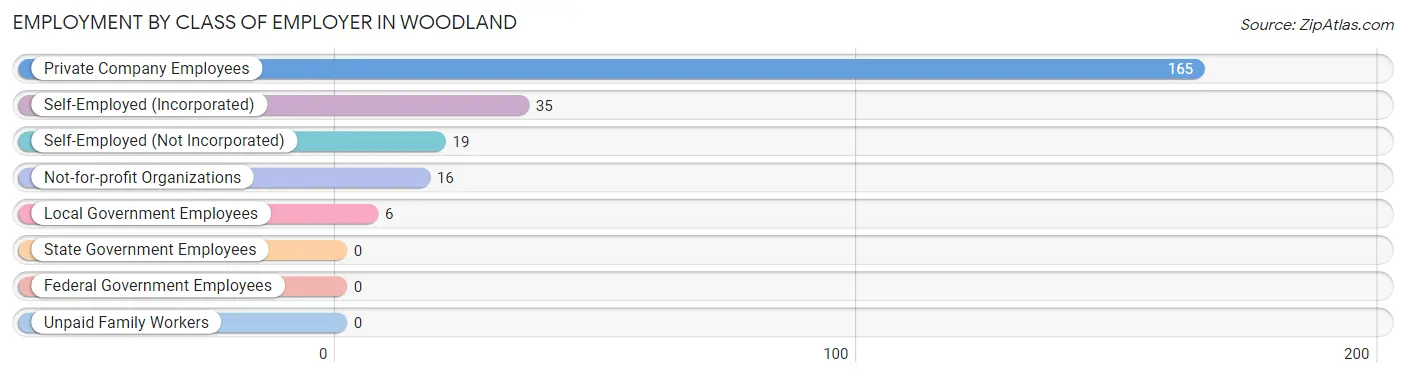
| Employer Class | # Employees | % Employees |
| Private Company Employees | 165 | 68.5% |
| Self-Employed (Incorporated) | 35 | 14.5% |
| Self-Employed (Not Incorporated) | 19 | 7.9% |
| Not-for-profit Organizations | 16 | 6.6% |
| Local Government Employees | 6 | 2.5% |
| State Government Employees | 0 | 0.0% |
| Federal Government Employees | 0 | 0.0% |
| Unpaid Family Workers | 0 | 0.0% |
| Total | 241 | 100.0% |
Employment Status by Age in Woodland
According to the labor force statistics for Woodland, out of the total population over 16 years of age (473), 54.3% or 257 individuals are in the labor force, with 6.2% or 16 of them unemployed. The age group with the highest labor force participation rate is 35 to 44 years, with 100.0% or 24 individuals in the labor force. Within the labor force, the 20 to 24 years age range has the highest percentage of unemployed individuals, with 100.0% or 2 of them being unemployed.
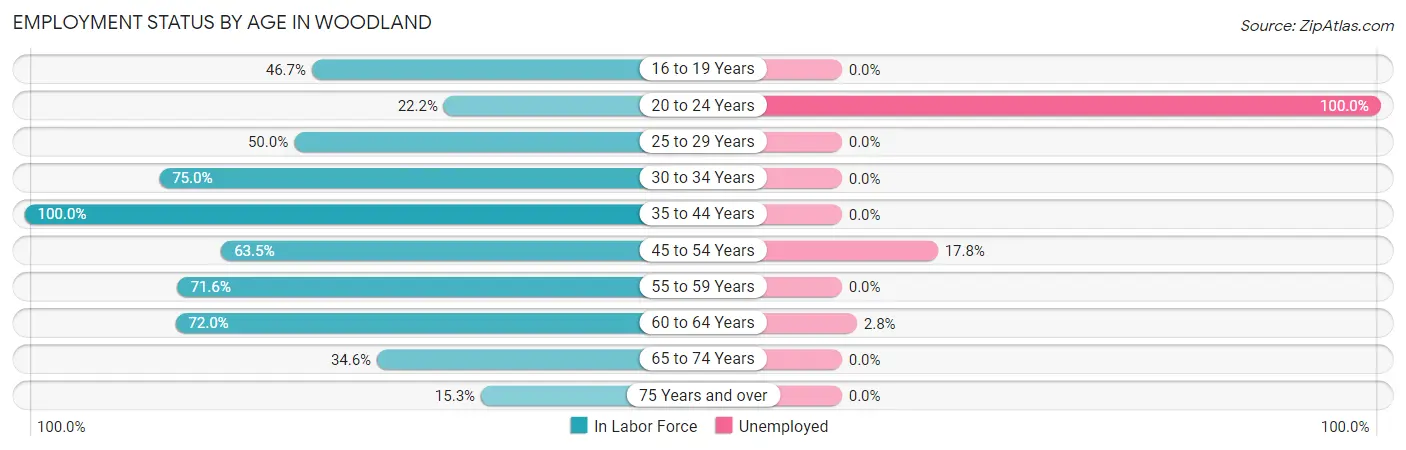
| Age Bracket | In Labor Force | Unemployed |
| 16 to 19 Years | 7 (46.7%) | 0 (0.0%) |
| 20 to 24 Years | 2 (22.2%) | 2 (100.0%) |
| 25 to 29 Years | 2 (50.0%) | 0 (0.0%) |
| 30 to 34 Years | 6 (75.0%) | 0 (0.0%) |
| 35 to 44 Years | 24 (100.0%) | 0 (0.0%) |
| 45 to 54 Years | 73 (63.5%) | 13 (17.8%) |
| 55 to 59 Years | 68 (71.6%) | 0 (0.0%) |
| 60 to 64 Years | 36 (72.0%) | 1 (2.8%) |
| 65 to 74 Years | 28 (34.6%) | 0 (0.0%) |
| 75 Years and over | 11 (15.3%) | 0 (0.0%) |
| Total | 257 (54.3%) | 16 (6.2%) |
Employment Status by Educational Attainment in Woodland
According to labor force statistics for Woodland, 70.6% of individuals (209) out of the total population between 25 and 64 years of age (296) are in the labor force, with 6.7% or 14 of them being unemployed. The group with the highest labor force participation rate are those with the educational attainment of high school diploma, with 100.0% or 1 individuals in the labor force. Within the labor force, individuals with bachelor's degree or higher education have the highest percentage of unemployment, with 7.3% or 13 of them being unemployed.
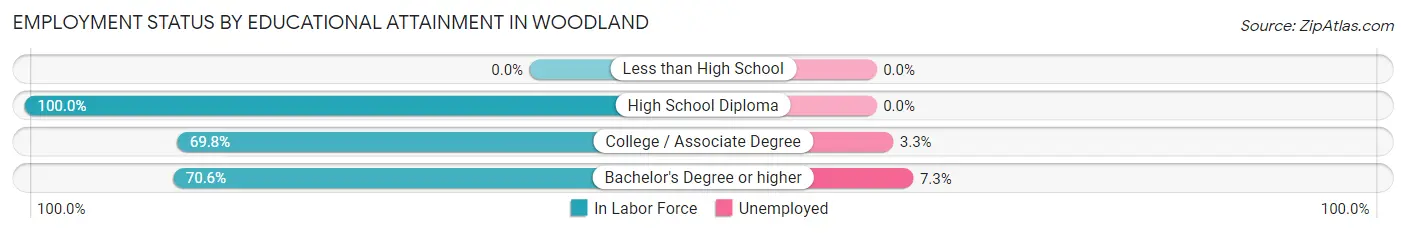
| Educational Attainment | In Labor Force | Unemployed |
| Less than High School | 0 (0.0%) | 0 (0.0%) |
| High School Diploma | 1 (100.0%) | 0 (0.0%) |
| College / Associate Degree | 30 (69.8%) | 1 (3.3%) |
| Bachelor's Degree or higher | 178 (70.6%) | 18 (7.3%) |
| Total | 209 (70.6%) | 20 (6.7%) |
Employment Occupations by Sex in Woodland
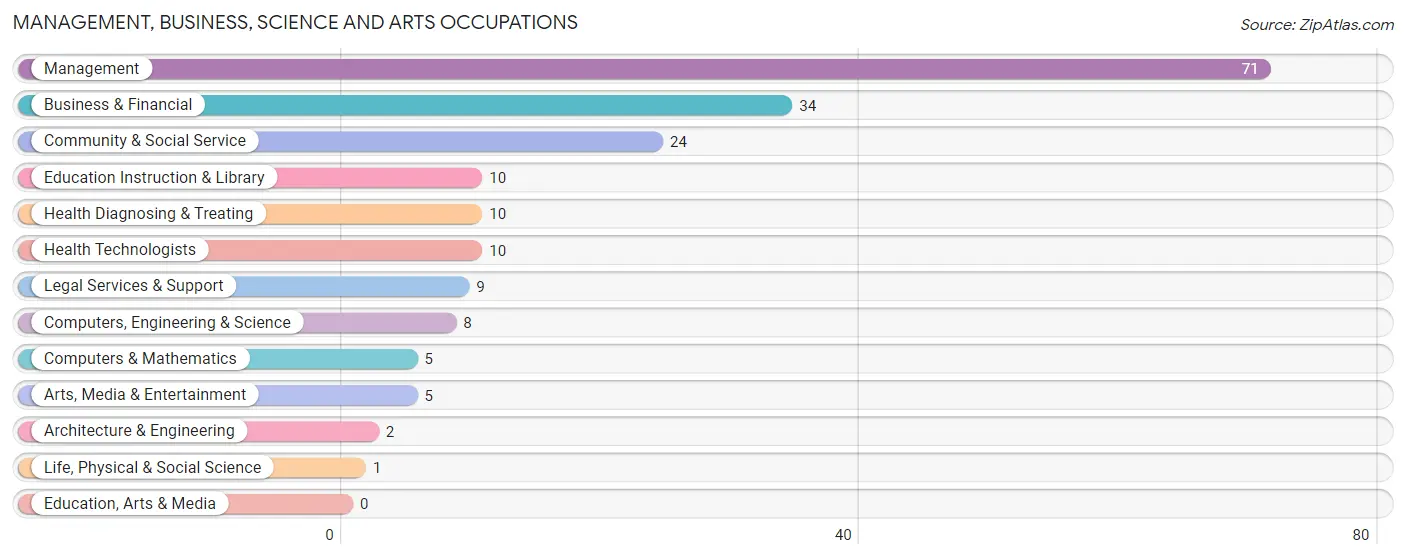
Management, Business, Science and Arts Occupations
The most common Management, Business, Science and Arts occupations in Woodland are Management (71 | 29.5%), Business & Financial (34 | 14.1%), Community & Social Service (24 | 10.0%), Education Instruction & Library (10 | 4.2%), and Health Diagnosing & Treating (10 | 4.2%).
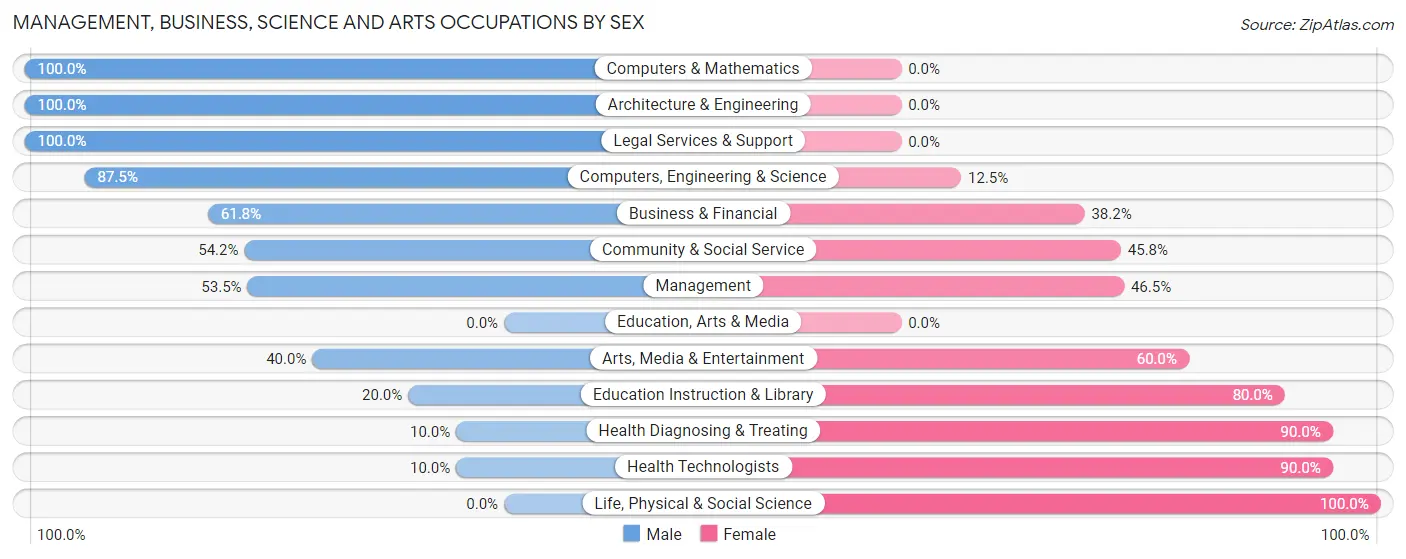
Management, Business, Science and Arts Occupations by Sex
Within the Management, Business, Science and Arts occupations in Woodland, the most male-oriented occupations are Computers & Mathematics (100.0%), Architecture & Engineering (100.0%), and Legal Services & Support (100.0%), while the most female-oriented occupations are Life, Physical & Social Science (100.0%), Health Diagnosing & Treating (90.0%), and Health Technologists (90.0%).
| Occupation | Male | Female |
| Management | 38 (53.5%) | 33 (46.5%) |
| Business & Financial | 21 (61.8%) | 13 (38.2%) |
| Computers, Engineering & Science | 7 (87.5%) | 1 (12.5%) |
| Computers & Mathematics | 5 (100.0%) | 0 (0.0%) |
| Architecture & Engineering | 2 (100.0%) | 0 (0.0%) |
| Life, Physical & Social Science | 0 (0.0%) | 1 (100.0%) |
| Community & Social Service | 13 (54.2%) | 11 (45.8%) |
| Education, Arts & Media | 0 (0.0%) | 0 (0.0%) |
| Legal Services & Support | 9 (100.0%) | 0 (0.0%) |
| Education Instruction & Library | 2 (20.0%) | 8 (80.0%) |
| Arts, Media & Entertainment | 2 (40.0%) | 3 (60.0%) |
| Health Diagnosing & Treating | 1 (10.0%) | 9 (90.0%) |
| Health Technologists | 1 (10.0%) | 9 (90.0%) |
| Total (Category) | 80 (54.4%) | 67 (45.6%) |
| Total (Overall) | 139 (57.7%) | 102 (42.3%) |
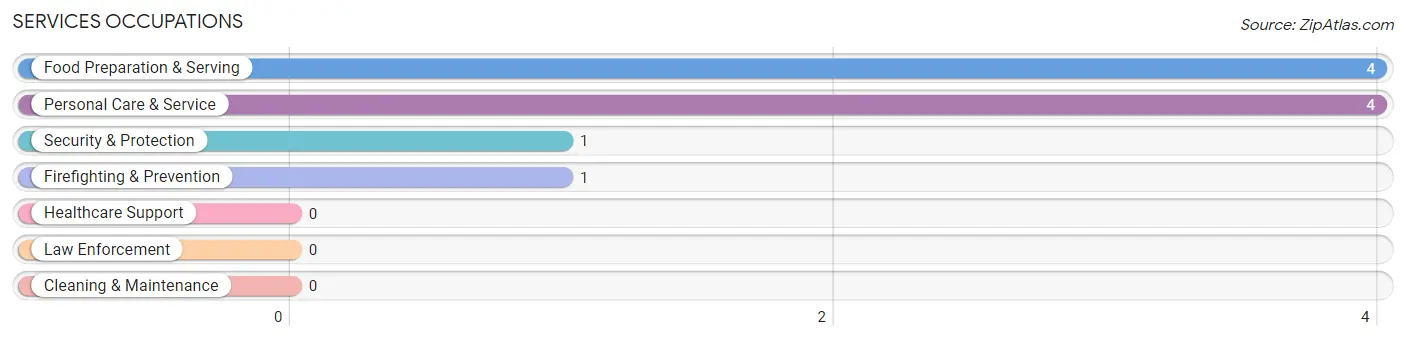
Services Occupations
The most common Services occupations in Woodland are Food Preparation & Serving (4 | 1.7%), Personal Care & Service (4 | 1.7%), Security & Protection (1 | 0.4%), and Firefighting & Prevention (1 | 0.4%).
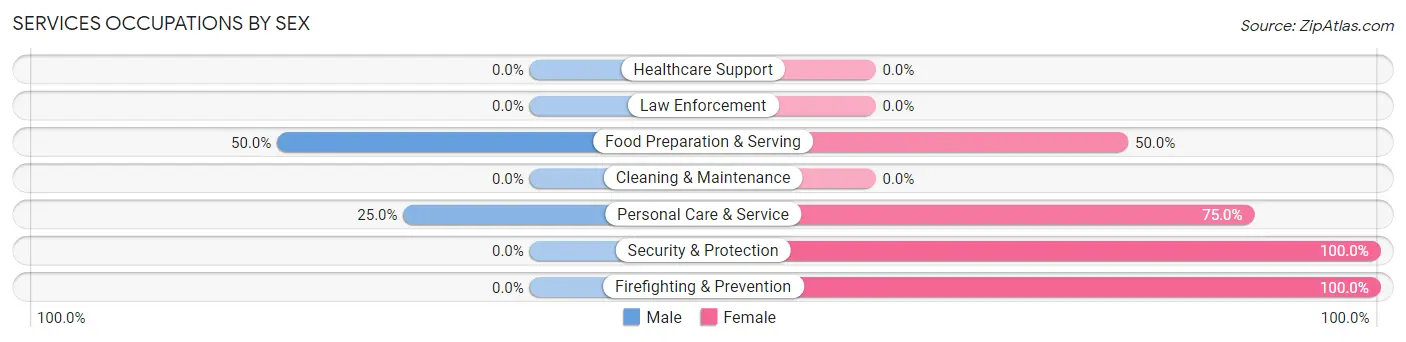
Services Occupations by Sex
Within the Services occupations in Woodland, the most male-oriented occupations are Food Preparation & Serving (50.0%), and Personal Care & Service (25.0%), while the most female-oriented occupations are Security & Protection (100.0%), Firefighting & Prevention (100.0%), and Personal Care & Service (75.0%).
| Occupation | Male | Female |
| Healthcare Support | 0 (0.0%) | 0 (0.0%) |
| Security & Protection | 0 (0.0%) | 1 (100.0%) |
| Firefighting & Prevention | 0 (0.0%) | 1 (100.0%) |
| Law Enforcement | 0 (0.0%) | 0 (0.0%) |
| Food Preparation & Serving | 2 (50.0%) | 2 (50.0%) |
| Cleaning & Maintenance | 0 (0.0%) | 0 (0.0%) |
| Personal Care & Service | 1 (25.0%) | 3 (75.0%) |
| Total (Category) | 3 (33.3%) | 6 (66.7%) |
| Total (Overall) | 139 (57.7%) | 102 (42.3%) |
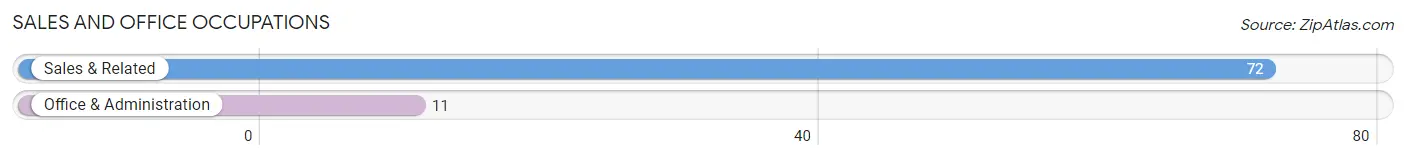
Sales and Office Occupations
The most common Sales and Office occupations in Woodland are Sales & Related (72 | 29.9%), and Office & Administration (11 | 4.6%).
Sales and Office Occupations by Sex
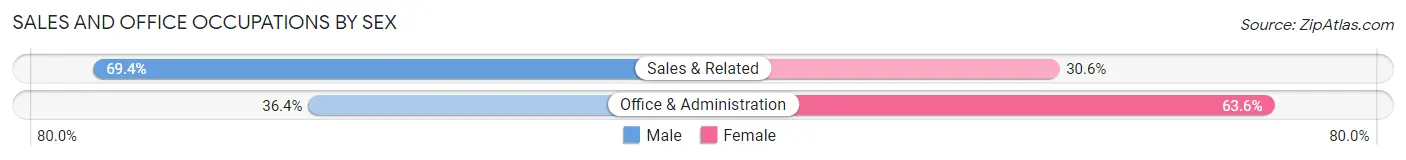
| Occupation | Male | Female |
| Sales & Related | 50 (69.4%) | 22 (30.6%) |
| Office & Administration | 4 (36.4%) | 7 (63.6%) |
| Total (Category) | 54 (65.1%) | 29 (34.9%) |
| Total (Overall) | 139 (57.7%) | 102 (42.3%) |
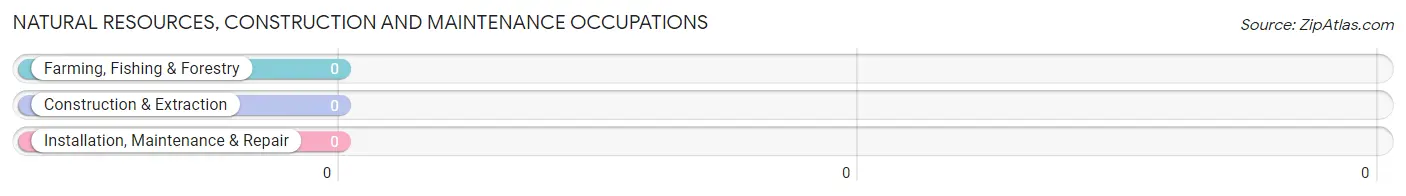
Natural Resources, Construction and Maintenance Occupations
Natural Resources, Construction and Maintenance Occupations by Sex
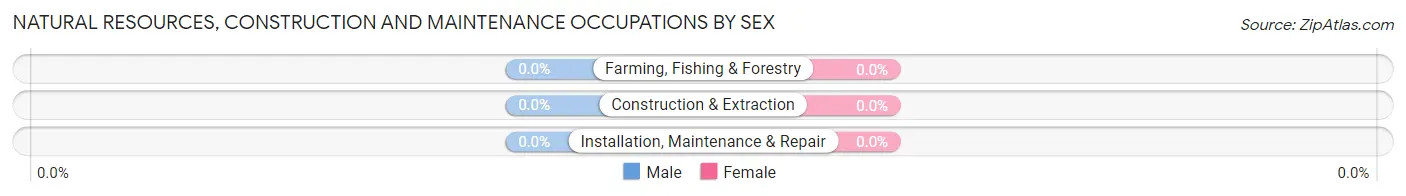
| Occupation | Male | Female |
| Farming, Fishing & Forestry | 0 (0.0%) | 0 (0.0%) |
| Construction & Extraction | 0 (0.0%) | 0 (0.0%) |
| Installation, Maintenance & Repair | 0 (0.0%) | 0 (0.0%) |
| Total (Category) | 0 (0.0%) | 0 (0.0%) |
| Total (Overall) | 139 (57.7%) | 102 (42.3%) |
Production, Transportation and Moving Occupations
The most common Production, Transportation and Moving occupations in Woodland are , and Transportation (2 | 0.8%).
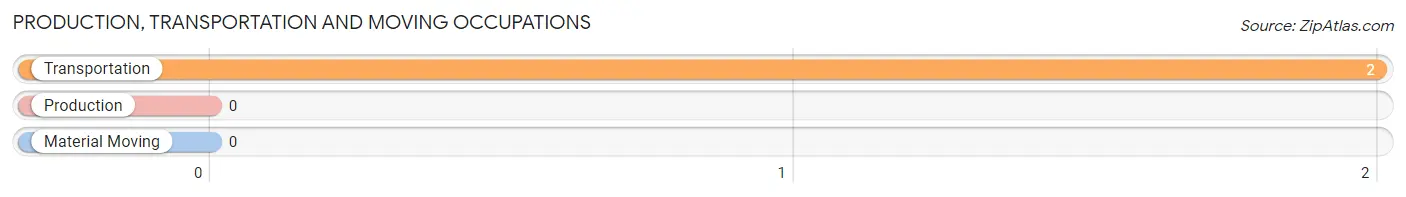
Production, Transportation and Moving Occupations by Sex
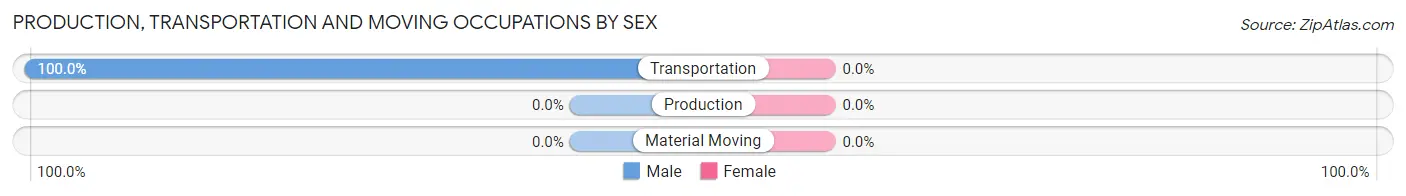
| Occupation | Male | Female |
| Production | 0 (0.0%) | 0 (0.0%) |
| Transportation | 2 (100.0%) | 0 (0.0%) |
| Material Moving | 0 (0.0%) | 0 (0.0%) |
| Total (Category) | 2 (100.0%) | 0 (0.0%) |
| Total (Overall) | 139 (57.7%) | 102 (42.3%) |
Employment Industries by Sex in Woodland
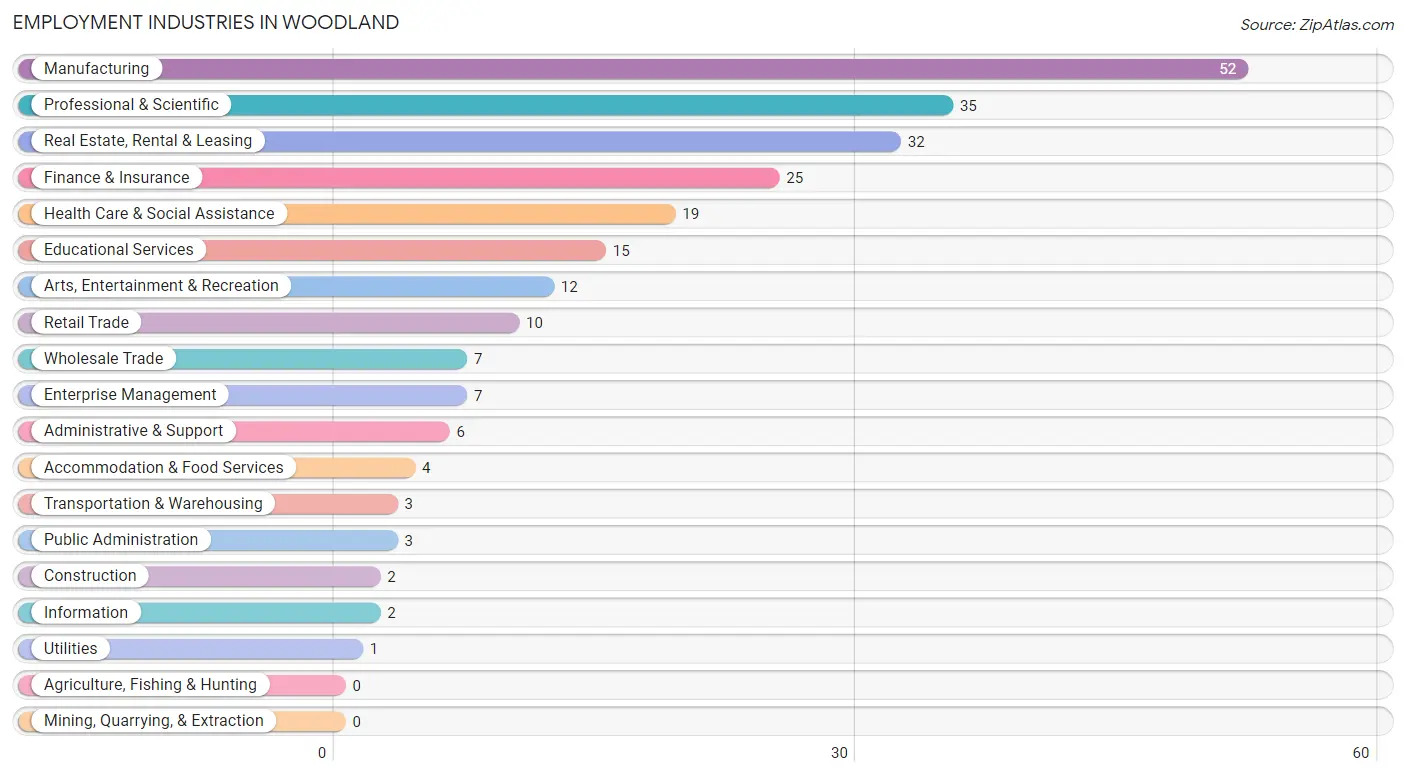
Employment Industries in Woodland
The major employment industries in Woodland include Manufacturing (52 | 21.6%), Professional & Scientific (35 | 14.5%), Real Estate, Rental & Leasing (32 | 13.3%), Finance & Insurance (25 | 10.4%), and Health Care & Social Assistance (19 | 7.9%).
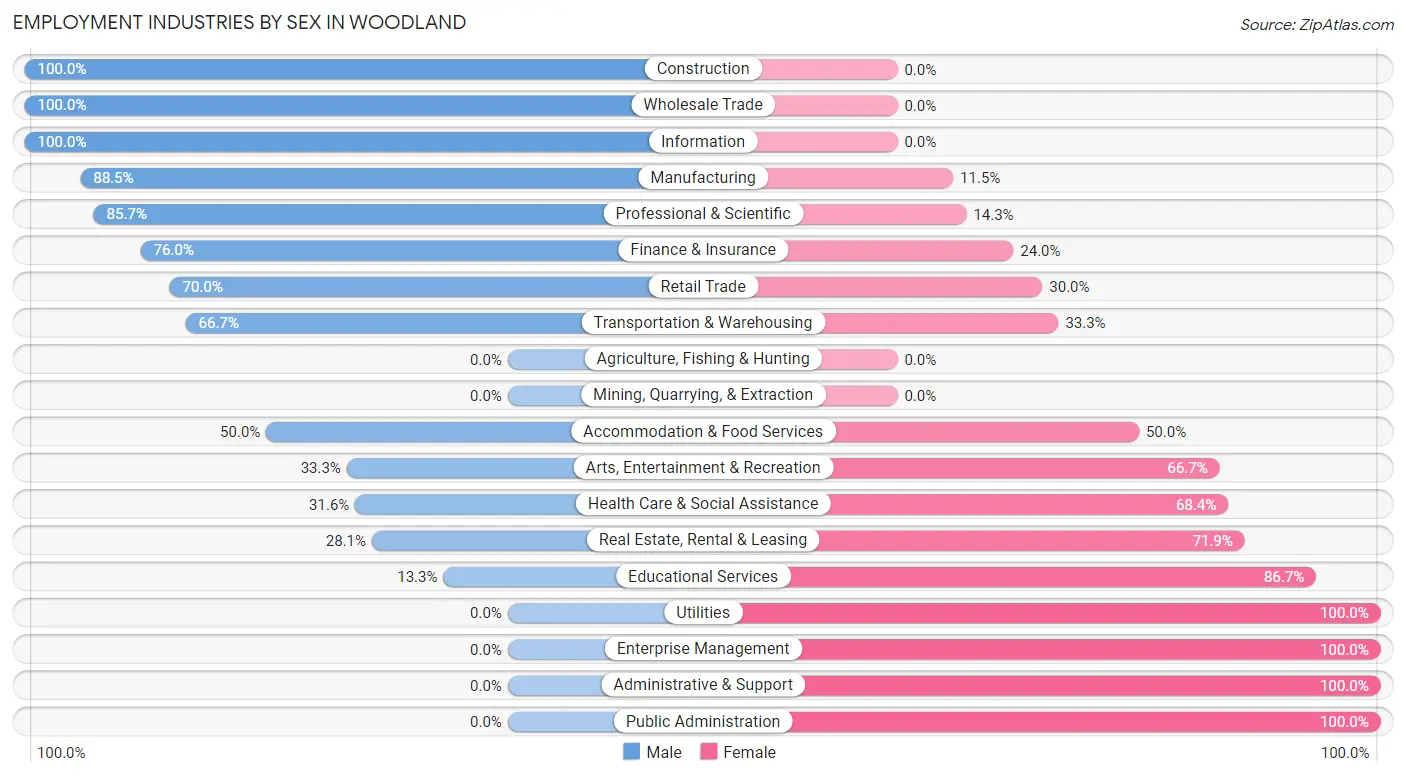
Employment Industries by Sex in Woodland
The Woodland industries that see more men than women are Construction (100.0%), Wholesale Trade (100.0%), and Information (100.0%), whereas the industries that tend to have a higher number of women are Utilities (100.0%), Enterprise Management (100.0%), and Administrative & Support (100.0%).
| Industry | Male | Female |
| Agriculture, Fishing & Hunting | 0 (0.0%) | 0 (0.0%) |
| Mining, Quarrying, & Extraction | 0 (0.0%) | 0 (0.0%) |
| Construction | 2 (100.0%) | 0 (0.0%) |
| Manufacturing | 46 (88.5%) | 6 (11.5%) |
| Wholesale Trade | 7 (100.0%) | 0 (0.0%) |
| Retail Trade | 7 (70.0%) | 3 (30.0%) |
| Transportation & Warehousing | 2 (66.7%) | 1 (33.3%) |
| Utilities | 0 (0.0%) | 1 (100.0%) |
| Information | 2 (100.0%) | 0 (0.0%) |
| Finance & Insurance | 19 (76.0%) | 6 (24.0%) |
| Real Estate, Rental & Leasing | 9 (28.1%) | 23 (71.9%) |
| Professional & Scientific | 30 (85.7%) | 5 (14.3%) |
| Enterprise Management | 0 (0.0%) | 7 (100.0%) |
| Administrative & Support | 0 (0.0%) | 6 (100.0%) |
| Educational Services | 2 (13.3%) | 13 (86.7%) |
| Health Care & Social Assistance | 6 (31.6%) | 13 (68.4%) |
| Arts, Entertainment & Recreation | 4 (33.3%) | 8 (66.7%) |
| Accommodation & Food Services | 2 (50.0%) | 2 (50.0%) |
| Public Administration | 0 (0.0%) | 3 (100.0%) |
| Total | 139 (57.7%) | 102 (42.3%) |
Education in Woodland
School Enrollment in Woodland
The most common levels of schooling among the 80 students in Woodland are middle school (31 | 38.8%), elementary school (24 | 30.0%), and high school (15 | 18.8%).
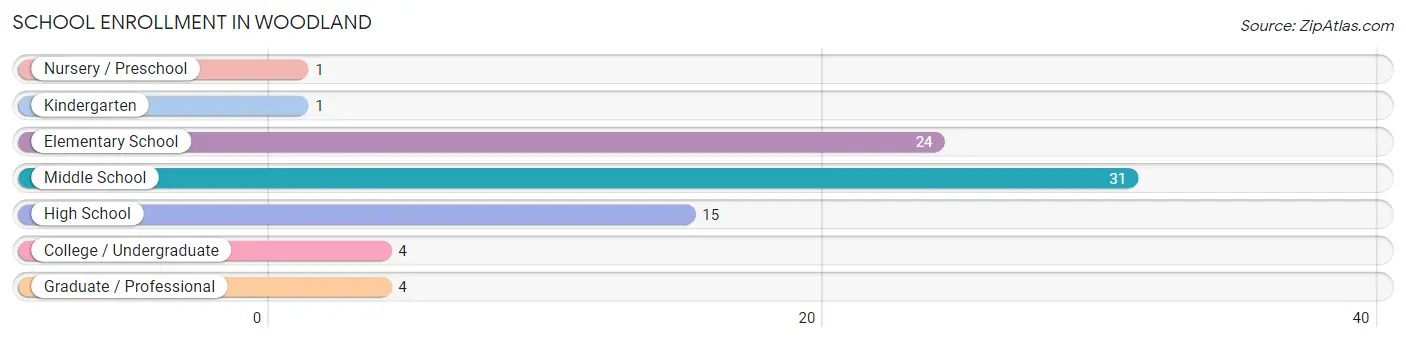
| School Level | # Students | % Students |
| Nursery / Preschool | 1 | 1.3% |
| Kindergarten | 1 | 1.3% |
| Elementary School | 24 | 30.0% |
| Middle School | 31 | 38.8% |
| High School | 15 | 18.8% |
| College / Undergraduate | 4 | 5.0% |
| Graduate / Professional | 4 | 5.0% |
| Total | 80 | 100.0% |
School Enrollment by Age by Funding Source in Woodland
Out of a total of 80 students who are enrolled in schools in Woodland, 45 (56.3%) attend a private institution, while the remaining 35 (43.7%) are enrolled in public schools. The age group of 3 to 4 year olds has the highest likelihood of being enrolled in private schools, with 1 (100.0% in the age bracket) enrolled. Conversely, the age group of 18 to 19 year olds has the lowest likelihood of being enrolled in a private school, with 2 (100.0% in the age bracket) attending a public institution.
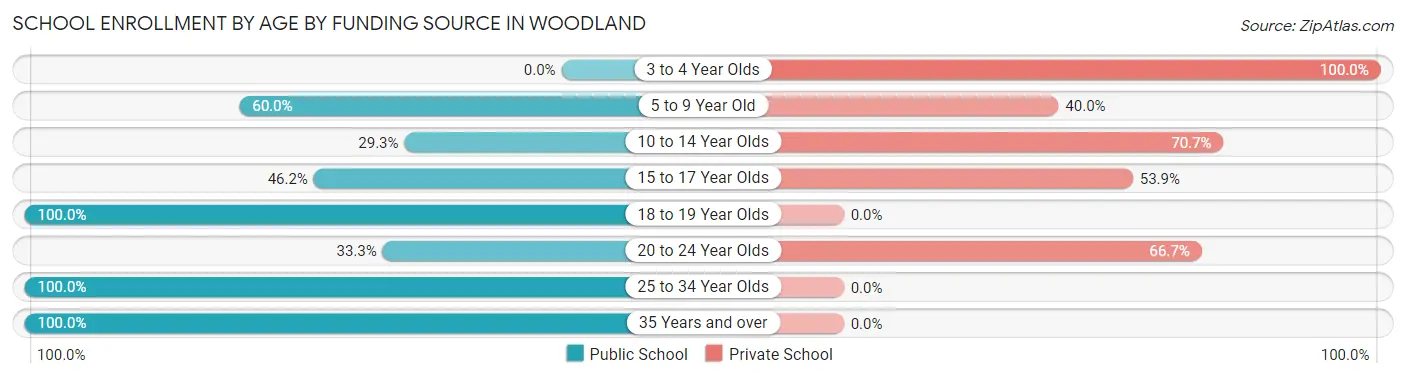
| Age Bracket | Public School | Private School |
| 3 to 4 Year Olds | 0 (0.0%) | 1 (100.0%) |
| 5 to 9 Year Old | 9 (60.0%) | 6 (40.0%) |
| 10 to 14 Year Olds | 12 (29.3%) | 29 (70.7%) |
| 15 to 17 Year Olds | 6 (46.2%) | 7 (53.8%) |
| 18 to 19 Year Olds | 2 (100.0%) | 0 (0.0%) |
| 20 to 24 Year Olds | 1 (33.3%) | 2 (66.7%) |
| 25 to 34 Year Olds | 4 (100.0%) | 0 (0.0%) |
| 35 Years and over | 1 (100.0%) | 0 (0.0%) |
| Total | 35 (43.8%) | 45 (56.3%) |
Educational Attainment by Field of Study in Woodland
Business (79 | 20.4%), social sciences (65 | 16.8%), engineering (45 | 11.6%), literature & languages (38 | 9.8%), and communications (32 | 8.3%) are the most common fields of study among 387 individuals in Woodland who have obtained a bachelor's degree or higher.
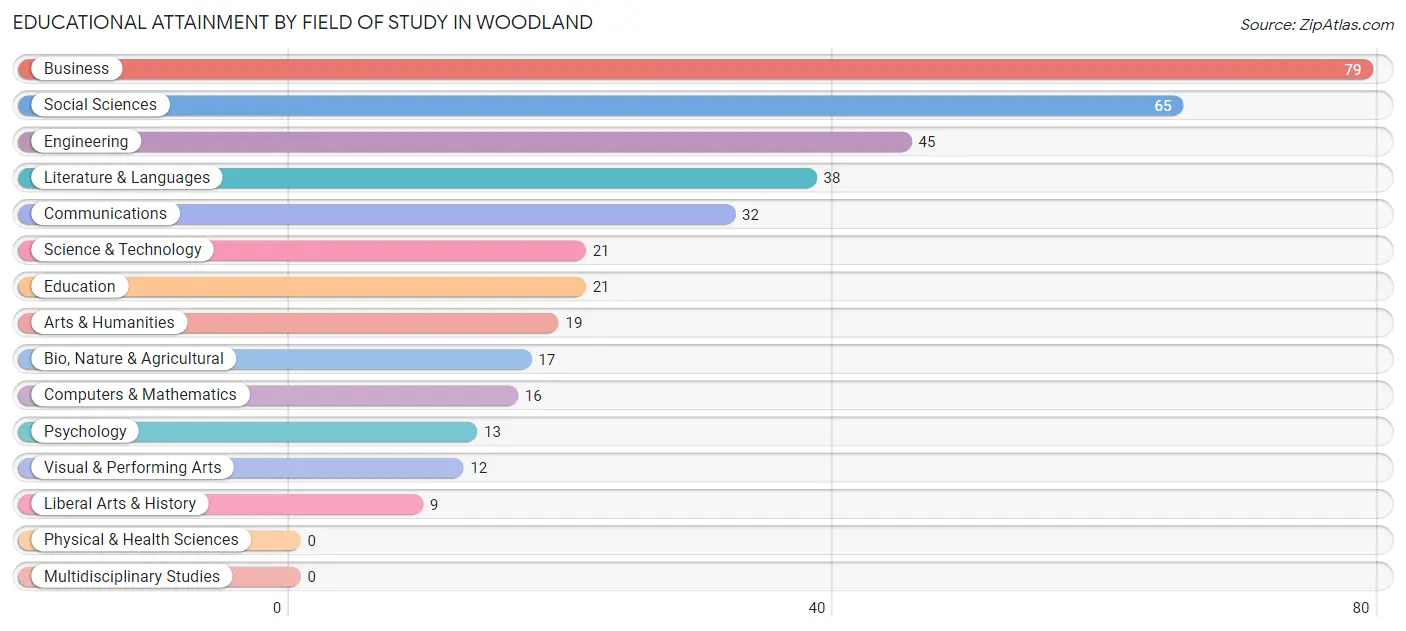
| Field of Study | # Graduates | % Graduates |
| Computers & Mathematics | 16 | 4.1% |
| Bio, Nature & Agricultural | 17 | 4.4% |
| Physical & Health Sciences | 0 | 0.0% |
| Psychology | 13 | 3.4% |
| Social Sciences | 65 | 16.8% |
| Engineering | 45 | 11.6% |
| Multidisciplinary Studies | 0 | 0.0% |
| Science & Technology | 21 | 5.4% |
| Business | 79 | 20.4% |
| Education | 21 | 5.4% |
| Literature & Languages | 38 | 9.8% |
| Liberal Arts & History | 9 | 2.3% |
| Visual & Performing Arts | 12 | 3.1% |
| Communications | 32 | 8.3% |
| Arts & Humanities | 19 | 4.9% |
| Total | 387 | 100.0% |
Transportation & Commute in Woodland
Vehicle Availability by Sex in Woodland
The most prevalent vehicle ownership categories in Woodland are males with 2 vehicles (80, accounting for 57.6%) and females with 2 vehicles (50, making up 78.4%).
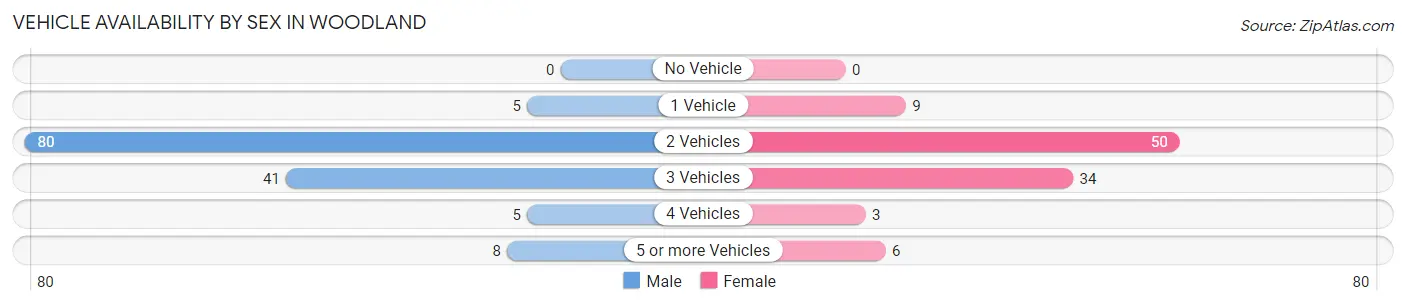
| Vehicles Available | Male | Female |
| No Vehicle | 0 (0.0%) | 0 (0.0%) |
| 1 Vehicle | 5 (3.6%) | 9 (8.8%) |
| 2 Vehicles | 80 (57.6%) | 50 (49.0%) |
| 3 Vehicles | 41 (29.5%) | 34 (33.3%) |
| 4 Vehicles | 5 (3.6%) | 3 (2.9%) |
| 5 or more Vehicles | 8 (5.8%) | 6 (5.9%) |
| Total | 139 (100.0%) | 102 (100.0%) |
Commute Time in Woodland
The most frequently occuring commute durations in Woodland are 15 to 19 minutes (37 commuters, 30.6%), 10 to 14 minutes (21 commuters, 17.4%), and 20 to 24 minutes (19 commuters, 15.7%).
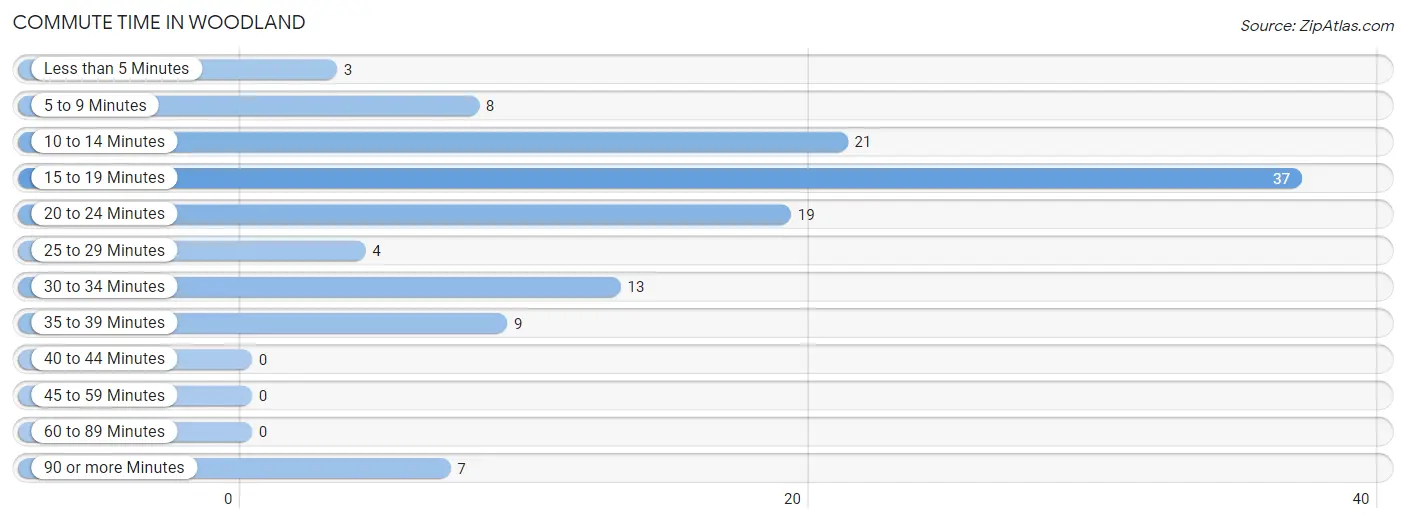
| Commute Time | # Commuters | % Commuters |
| Less than 5 Minutes | 3 | 2.5% |
| 5 to 9 Minutes | 8 | 6.6% |
| 10 to 14 Minutes | 21 | 17.4% |
| 15 to 19 Minutes | 37 | 30.6% |
| 20 to 24 Minutes | 19 | 15.7% |
| 25 to 29 Minutes | 4 | 3.3% |
| 30 to 34 Minutes | 13 | 10.7% |
| 35 to 39 Minutes | 9 | 7.4% |
| 40 to 44 Minutes | 0 | 0.0% |
| 45 to 59 Minutes | 0 | 0.0% |
| 60 to 89 Minutes | 0 | 0.0% |
| 90 or more Minutes | 7 | 5.8% |
Commute Time by Sex in Woodland
The most common commute times in Woodland are 20 to 24 minutes (14 commuters, 22.6%) for males and 15 to 19 minutes (27 commuters, 45.8%) for females.
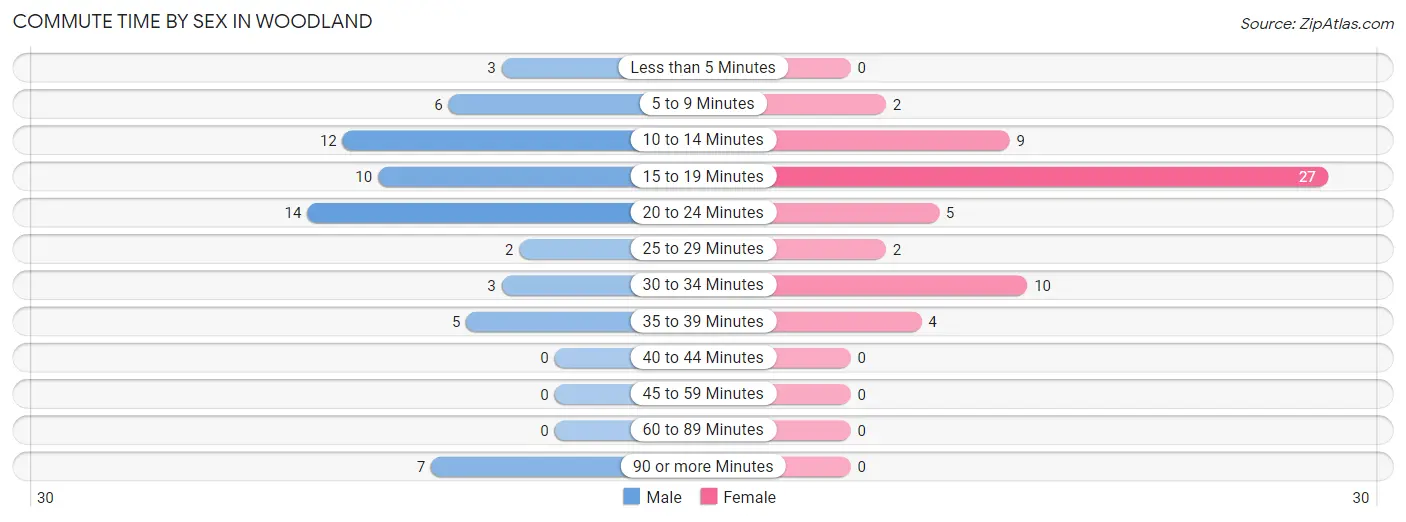
| Commute Time | Male | Female |
| Less than 5 Minutes | 3 (4.8%) | 0 (0.0%) |
| 5 to 9 Minutes | 6 (9.7%) | 2 (3.4%) |
| 10 to 14 Minutes | 12 (19.4%) | 9 (15.2%) |
| 15 to 19 Minutes | 10 (16.1%) | 27 (45.8%) |
| 20 to 24 Minutes | 14 (22.6%) | 5 (8.5%) |
| 25 to 29 Minutes | 2 (3.2%) | 2 (3.4%) |
| 30 to 34 Minutes | 3 (4.8%) | 10 (17.0%) |
| 35 to 39 Minutes | 5 (8.1%) | 4 (6.8%) |
| 40 to 44 Minutes | 0 (0.0%) | 0 (0.0%) |
| 45 to 59 Minutes | 0 (0.0%) | 0 (0.0%) |
| 60 to 89 Minutes | 0 (0.0%) | 0 (0.0%) |
| 90 or more Minutes | 7 (11.3%) | 0 (0.0%) |
Time of Departure to Work by Sex in Woodland
The most frequent times of departure to work in Woodland are 8:00 AM to 8:29 AM (22, 35.5%) for males and 7:30 AM to 7:59 AM (13, 22.0%) for females.
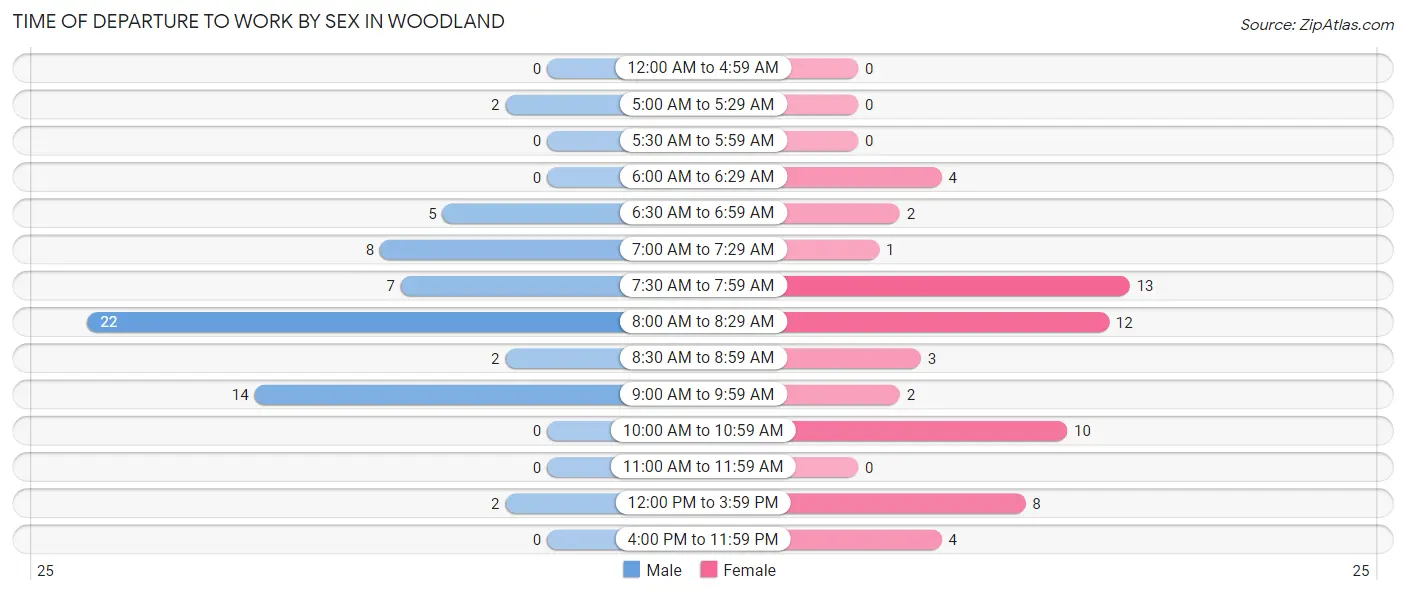
| Time of Departure | Male | Female |
| 12:00 AM to 4:59 AM | 0 (0.0%) | 0 (0.0%) |
| 5:00 AM to 5:29 AM | 2 (3.2%) | 0 (0.0%) |
| 5:30 AM to 5:59 AM | 0 (0.0%) | 0 (0.0%) |
| 6:00 AM to 6:29 AM | 0 (0.0%) | 4 (6.8%) |
| 6:30 AM to 6:59 AM | 5 (8.1%) | 2 (3.4%) |
| 7:00 AM to 7:29 AM | 8 (12.9%) | 1 (1.7%) |
| 7:30 AM to 7:59 AM | 7 (11.3%) | 13 (22.0%) |
| 8:00 AM to 8:29 AM | 22 (35.5%) | 12 (20.3%) |
| 8:30 AM to 8:59 AM | 2 (3.2%) | 3 (5.1%) |
| 9:00 AM to 9:59 AM | 14 (22.6%) | 2 (3.4%) |
| 10:00 AM to 10:59 AM | 0 (0.0%) | 10 (17.0%) |
| 11:00 AM to 11:59 AM | 0 (0.0%) | 0 (0.0%) |
| 12:00 PM to 3:59 PM | 2 (3.2%) | 8 (13.6%) |
| 4:00 PM to 11:59 PM | 0 (0.0%) | 4 (6.8%) |
| Total | 62 (100.0%) | 59 (100.0%) |
Housing Occupancy in Woodland
Occupancy by Ownership in Woodland
Of the total 223 dwellings in Woodland, owner-occupied units account for 218 (97.8%), while renter-occupied units make up 5 (2.2%).
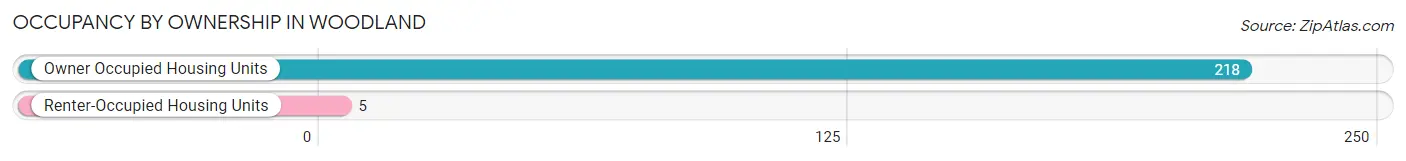
| Occupancy | # Housing Units | % Housing Units |
| Owner Occupied Housing Units | 218 | 97.8% |
| Renter-Occupied Housing Units | 5 | 2.2% |
| Total Occupied Housing Units | 223 | 100.0% |
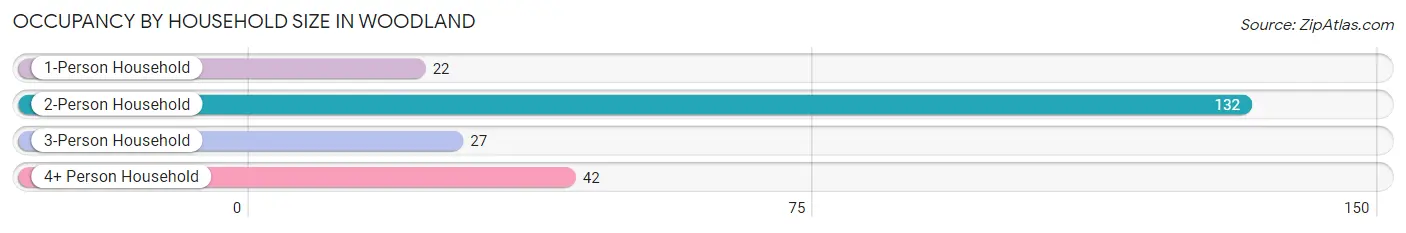
Occupancy by Household Size in Woodland
| Household Size | # Housing Units | % Housing Units |
| 1-Person Household | 22 | 9.9% |
| 2-Person Household | 132 | 59.2% |
| 3-Person Household | 27 | 12.1% |
| 4+ Person Household | 42 | 18.8% |
| Total Housing Units | 223 | 100.0% |
Occupancy by Ownership by Household Size in Woodland
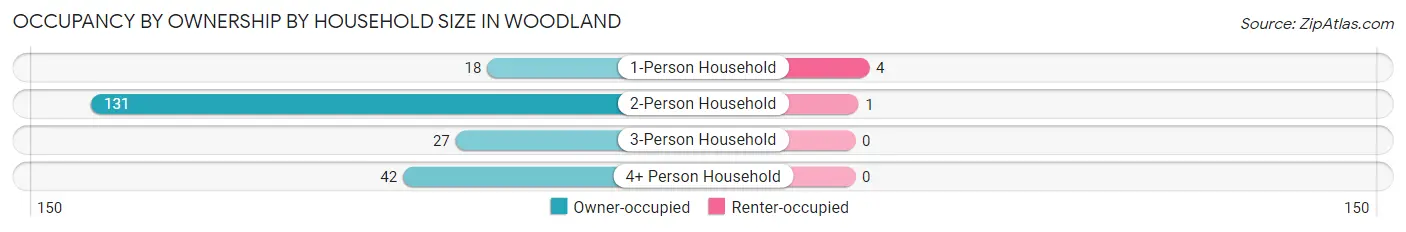
| Household Size | Owner-occupied | Renter-occupied |
| 1-Person Household | 18 (81.8%) | 4 (18.2%) |
| 2-Person Household | 131 (99.2%) | 1 (0.8%) |
| 3-Person Household | 27 (100.0%) | 0 (0.0%) |
| 4+ Person Household | 42 (100.0%) | 0 (0.0%) |
| Total Housing Units | 218 (97.8%) | 5 (2.2%) |
Occupancy by Educational Attainment in Woodland
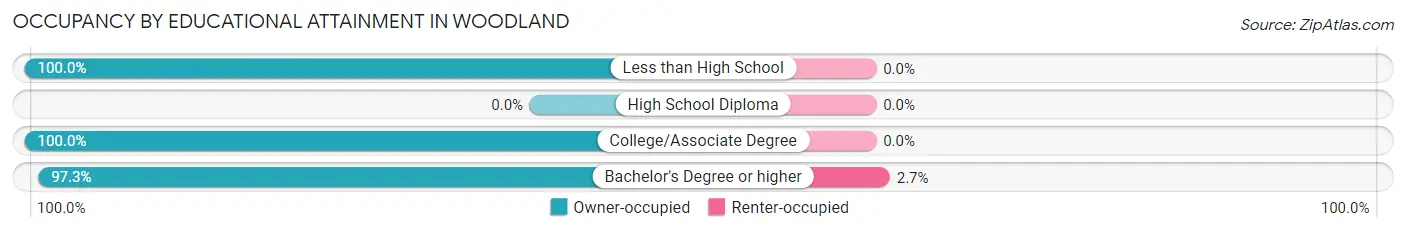
| Household Size | Owner-occupied | Renter-occupied |
| Less than High School | 2 (100.0%) | 0 (0.0%) |
| High School Diploma | 0 (0.0%) | 0 (0.0%) |
| College/Associate Degree | 36 (100.0%) | 0 (0.0%) |
| Bachelor's Degree or higher | 180 (97.3%) | 5 (2.7%) |
Occupancy by Age of Householder in Woodland
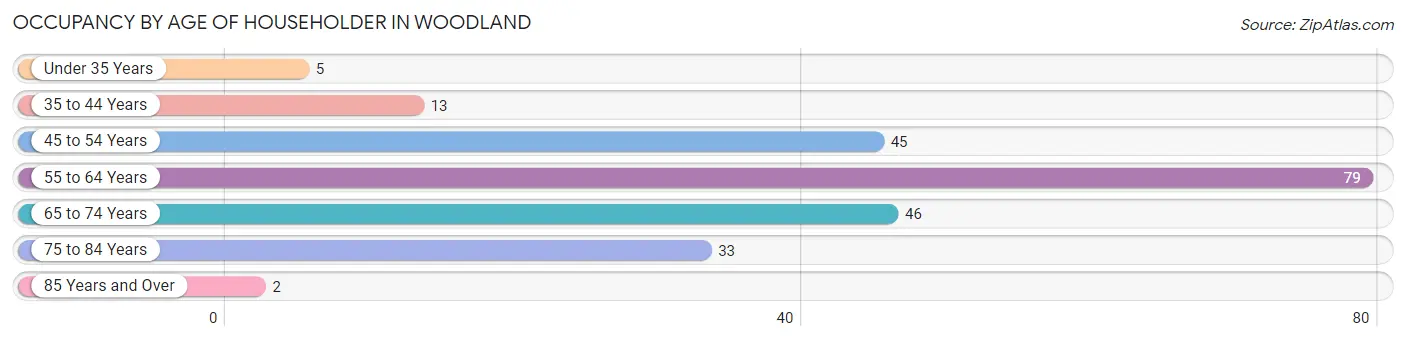
| Age Bracket | # Households | % Households |
| Under 35 Years | 5 | 2.2% |
| 35 to 44 Years | 13 | 5.8% |
| 45 to 54 Years | 45 | 20.2% |
| 55 to 64 Years | 79 | 35.4% |
| 65 to 74 Years | 46 | 20.6% |
| 75 to 84 Years | 33 | 14.8% |
| 85 Years and Over | 2 | 0.9% |
| Total | 223 | 100.0% |
Housing Finances in Woodland
Median Income by Occupancy in Woodland
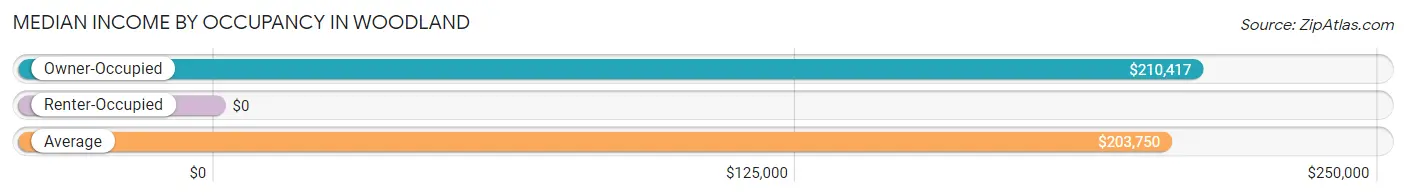
| Occupancy Type | # Households | Median Income |
| Owner-Occupied | 218 (97.8%) | $210,417 |
| Renter-Occupied | 5 (2.2%) | $0 |
| Average | 223 (100.0%) | $203,750 |
Occupancy by Householder Income Bracket in Woodland
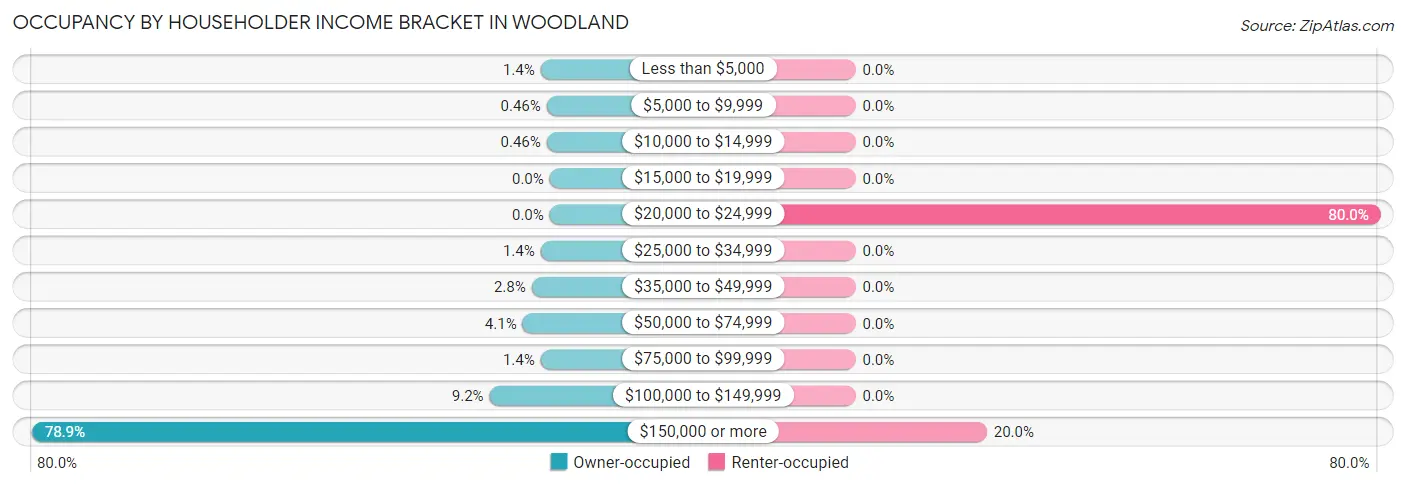
| Income Bracket | Owner-occupied | Renter-occupied |
| Less than $5,000 | 3 (1.4%) | 0 (0.0%) |
| $5,000 to $9,999 | 1 (0.5%) | 0 (0.0%) |
| $10,000 to $14,999 | 1 (0.5%) | 0 (0.0%) |
| $15,000 to $19,999 | 0 (0.0%) | 0 (0.0%) |
| $20,000 to $24,999 | 0 (0.0%) | 4 (80.0%) |
| $25,000 to $34,999 | 3 (1.4%) | 0 (0.0%) |
| $35,000 to $49,999 | 6 (2.8%) | 0 (0.0%) |
| $50,000 to $74,999 | 9 (4.1%) | 0 (0.0%) |
| $75,000 to $99,999 | 3 (1.4%) | 0 (0.0%) |
| $100,000 to $149,999 | 20 (9.2%) | 0 (0.0%) |
| $150,000 or more | 172 (78.9%) | 1 (20.0%) |
| Total | 218 (100.0%) | 5 (100.0%) |
Monthly Housing Cost Tiers in Woodland
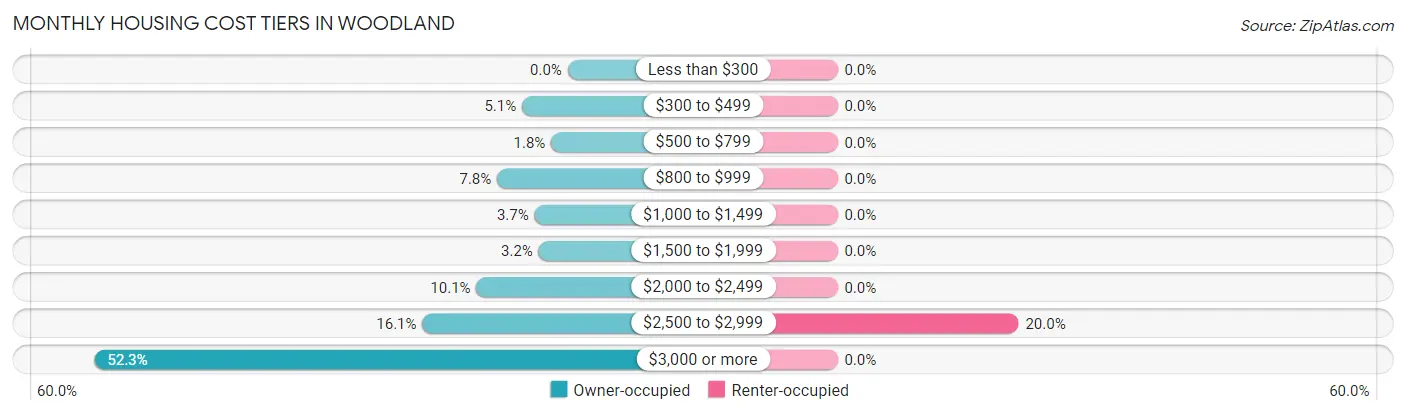
| Monthly Cost | Owner-occupied | Renter-occupied |
| Less than $300 | 0 (0.0%) | 0 (0.0%) |
| $300 to $499 | 11 (5.1%) | 0 (0.0%) |
| $500 to $799 | 4 (1.8%) | 0 (0.0%) |
| $800 to $999 | 17 (7.8%) | 0 (0.0%) |
| $1,000 to $1,499 | 8 (3.7%) | 0 (0.0%) |
| $1,500 to $1,999 | 7 (3.2%) | 0 (0.0%) |
| $2,000 to $2,499 | 22 (10.1%) | 0 (0.0%) |
| $2,500 to $2,999 | 35 (16.1%) | 1 (20.0%) |
| $3,000 or more | 114 (52.3%) | 0 (0.0%) |
| Total | 218 (100.0%) | 5 (100.0%) |
Physical Housing Characteristics in Woodland
Housing Structures in Woodland
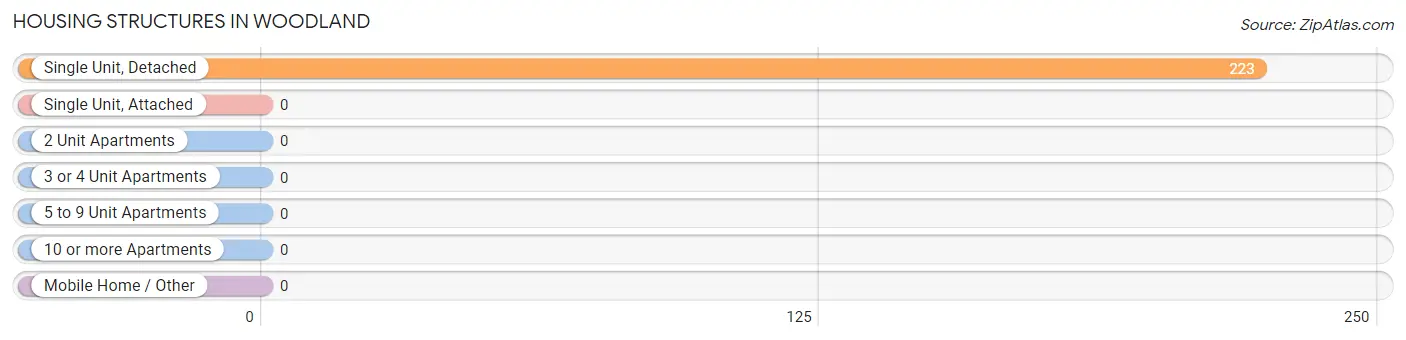
| Structure Type | # Housing Units | % Housing Units |
| Single Unit, Detached | 223 | 100.0% |
| Single Unit, Attached | 0 | 0.0% |
| 2 Unit Apartments | 0 | 0.0% |
| 3 or 4 Unit Apartments | 0 | 0.0% |
| 5 to 9 Unit Apartments | 0 | 0.0% |
| 10 or more Apartments | 0 | 0.0% |
| Mobile Home / Other | 0 | 0.0% |
| Total | 223 | 100.0% |
Housing Structures by Occupancy in Woodland
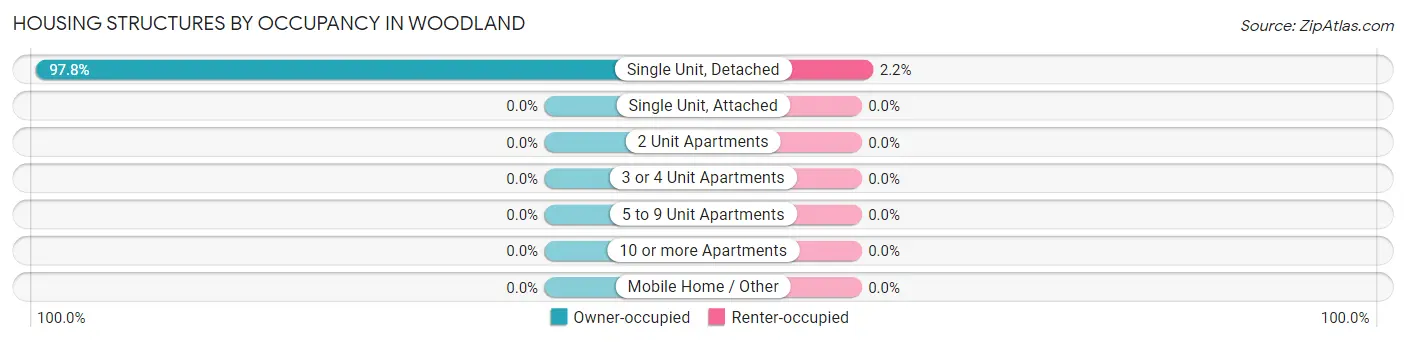
| Structure Type | Owner-occupied | Renter-occupied |
| Single Unit, Detached | 218 (97.8%) | 5 (2.2%) |
| Single Unit, Attached | 0 (0.0%) | 0 (0.0%) |
| 2 Unit Apartments | 0 (0.0%) | 0 (0.0%) |
| 3 or 4 Unit Apartments | 0 (0.0%) | 0 (0.0%) |
| 5 to 9 Unit Apartments | 0 (0.0%) | 0 (0.0%) |
| 10 or more Apartments | 0 (0.0%) | 0 (0.0%) |
| Mobile Home / Other | 0 (0.0%) | 0 (0.0%) |
| Total | 218 (97.8%) | 5 (2.2%) |
Housing Structures by Number of Rooms in Woodland
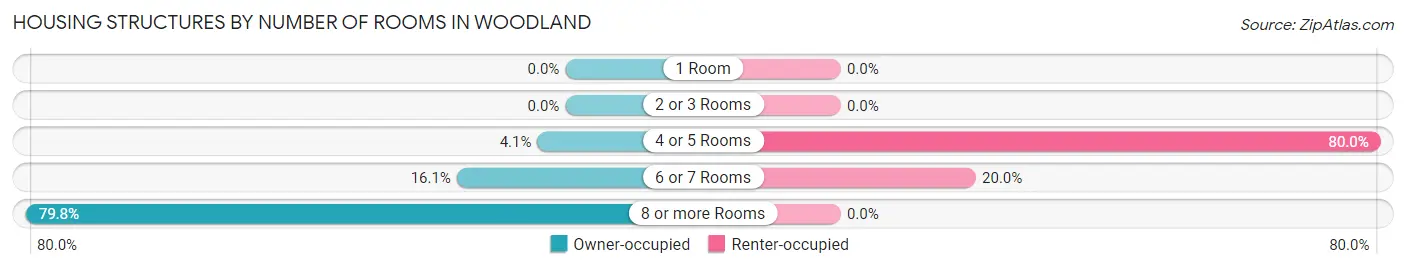
| Number of Rooms | Owner-occupied | Renter-occupied |
| 1 Room | 0 (0.0%) | 0 (0.0%) |
| 2 or 3 Rooms | 0 (0.0%) | 0 (0.0%) |
| 4 or 5 Rooms | 9 (4.1%) | 4 (80.0%) |
| 6 or 7 Rooms | 35 (16.1%) | 1 (20.0%) |
| 8 or more Rooms | 174 (79.8%) | 0 (0.0%) |
| Total | 218 (100.0%) | 5 (100.0%) |
Housing Structure by Heating Type in Woodland
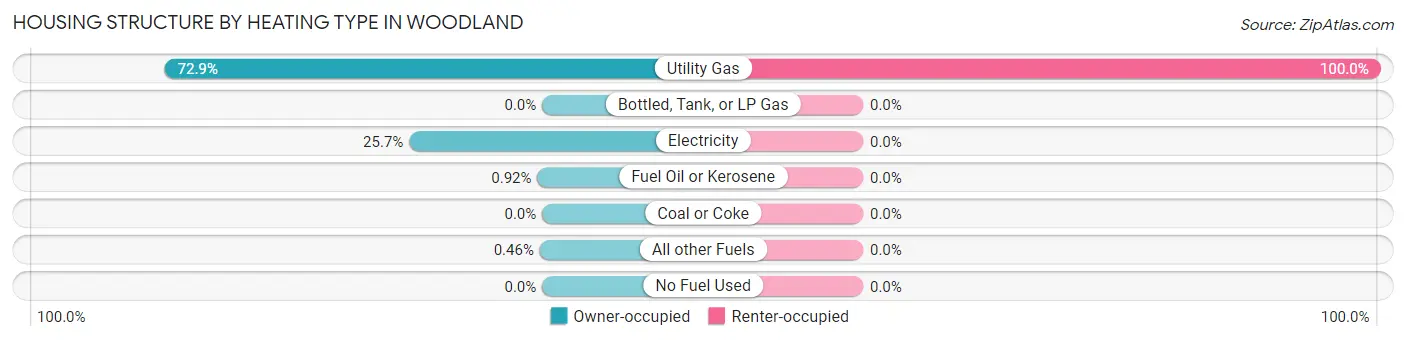
| Heating Type | Owner-occupied | Renter-occupied |
| Utility Gas | 159 (72.9%) | 5 (100.0%) |
| Bottled, Tank, or LP Gas | 0 (0.0%) | 0 (0.0%) |
| Electricity | 56 (25.7%) | 0 (0.0%) |
| Fuel Oil or Kerosene | 2 (0.9%) | 0 (0.0%) |
| Coal or Coke | 0 (0.0%) | 0 (0.0%) |
| All other Fuels | 1 (0.5%) | 0 (0.0%) |
| No Fuel Used | 0 (0.0%) | 0 (0.0%) |
| Total | 218 (100.0%) | 5 (100.0%) |
Household Vehicle Usage in Woodland
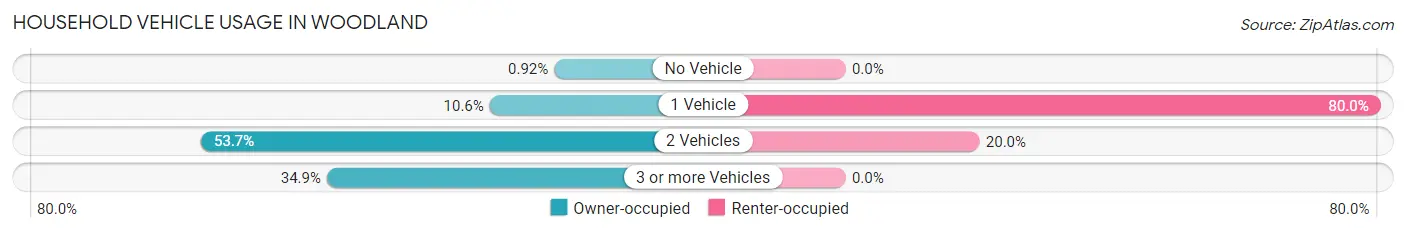
| Vehicles per Household | Owner-occupied | Renter-occupied |
| No Vehicle | 2 (0.9%) | 0 (0.0%) |
| 1 Vehicle | 23 (10.5%) | 4 (80.0%) |
| 2 Vehicles | 117 (53.7%) | 1 (20.0%) |
| 3 or more Vehicles | 76 (34.9%) | 0 (0.0%) |
| Total | 218 (100.0%) | 5 (100.0%) |
Real Estate & Mortgages in Woodland
Real Estate and Mortgage Overview in Woodland
| Characteristic | Without Mortgage | With Mortgage |
| Housing Units | 103 | 115 |
| Median Property Value | $1,421,900 | $1,147,200 |
| Median Household Income | $197,188 | $100 |
| Monthly Housing Costs | $1,501 | $94 |
| Real Estate Taxes | $10,001 | $1 |
Property Value by Mortgage Status in Woodland
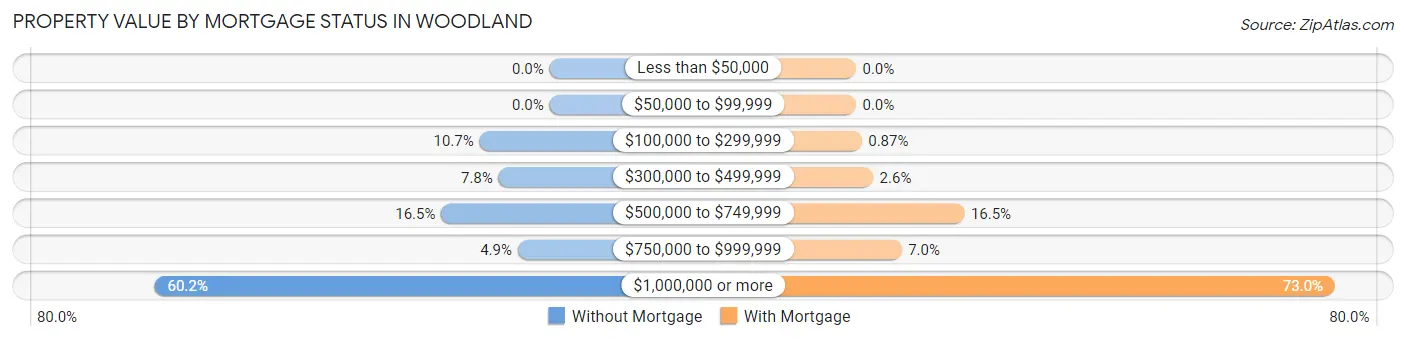
| Property Value | Without Mortgage | With Mortgage |
| Less than $50,000 | 0 (0.0%) | 0 (0.0%) |
| $50,000 to $99,999 | 0 (0.0%) | 0 (0.0%) |
| $100,000 to $299,999 | 11 (10.7%) | 1 (0.9%) |
| $300,000 to $499,999 | 8 (7.8%) | 3 (2.6%) |
| $500,000 to $749,999 | 17 (16.5%) | 19 (16.5%) |
| $750,000 to $999,999 | 5 (4.9%) | 8 (7.0%) |
| $1,000,000 or more | 62 (60.2%) | 84 (73.0%) |
| Total | 103 (100.0%) | 115 (100.0%) |
Household Income by Mortgage Status in Woodland
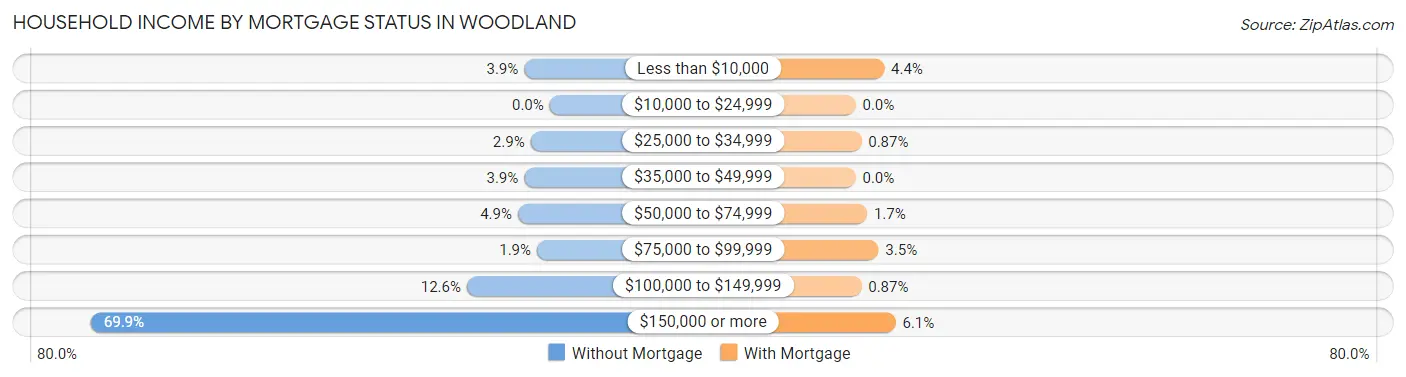
| Household Income | Without Mortgage | With Mortgage |
| Less than $10,000 | 4 (3.9%) | 5 (4.3%) |
| $10,000 to $24,999 | 0 (0.0%) | 0 (0.0%) |
| $25,000 to $34,999 | 3 (2.9%) | 1 (0.9%) |
| $35,000 to $49,999 | 4 (3.9%) | 0 (0.0%) |
| $50,000 to $74,999 | 5 (4.9%) | 2 (1.7%) |
| $75,000 to $99,999 | 2 (1.9%) | 4 (3.5%) |
| $100,000 to $149,999 | 13 (12.6%) | 1 (0.9%) |
| $150,000 or more | 72 (69.9%) | 7 (6.1%) |
| Total | 103 (100.0%) | 115 (100.0%) |
Property Value to Household Income Ratio in Woodland
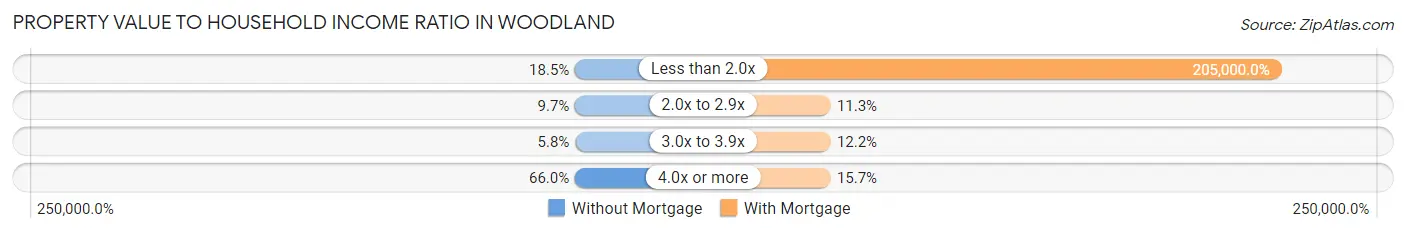
| Value-to-Income Ratio | Without Mortgage | With Mortgage |
| Less than 2.0x | 19 (18.4%) | 235,750 (205,000.0%) |
| 2.0x to 2.9x | 10 (9.7%) | 13 (11.3%) |
| 3.0x to 3.9x | 6 (5.8%) | 14 (12.2%) |
| 4.0x or more | 68 (66.0%) | 18 (15.7%) |
| Total | 103 (100.0%) | 115 (100.0%) |
Real Estate Taxes by Mortgage Status in Woodland
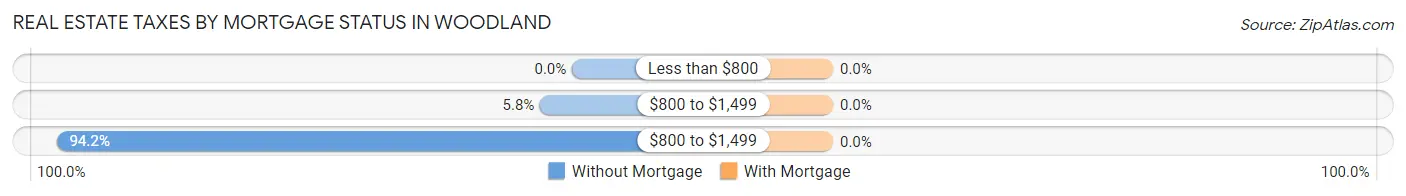
| Property Taxes | Without Mortgage | With Mortgage |
| Less than $800 | 0 (0.0%) | 0 (0.0%) |
| $800 to $1,499 | 6 (5.8%) | 0 (0.0%) |
| $800 to $1,499 | 97 (94.2%) | 0 (0.0%) |
| Total | 103 (100.0%) | 115 (100.0%) |
Health & Disability in Woodland
Health Insurance Coverage by Age in Woodland
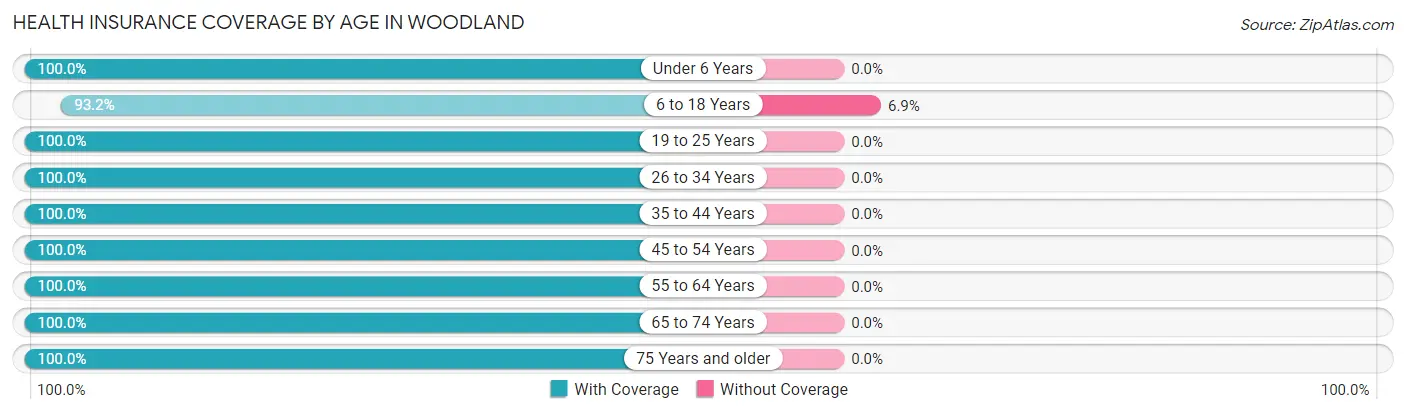
| Age Bracket | With Coverage | Without Coverage |
| Under 6 Years | 31 (100.0%) | 0 (0.0%) |
| 6 to 18 Years | 68 (93.1%) | 5 (6.9%) |
| 19 to 25 Years | 11 (100.0%) | 0 (0.0%) |
| 26 to 34 Years | 10 (100.0%) | 0 (0.0%) |
| 35 to 44 Years | 24 (100.0%) | 0 (0.0%) |
| 45 to 54 Years | 115 (100.0%) | 0 (0.0%) |
| 55 to 64 Years | 145 (100.0%) | 0 (0.0%) |
| 65 to 74 Years | 81 (100.0%) | 0 (0.0%) |
| 75 Years and older | 72 (100.0%) | 0 (0.0%) |
| Total | 557 (99.1%) | 5 (0.9%) |
Health Insurance Coverage by Citizenship Status in Woodland
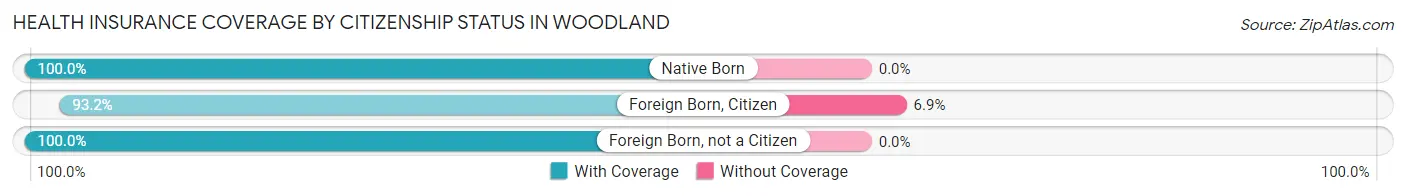
| Citizenship Status | With Coverage | Without Coverage |
| Native Born | 31 (100.0%) | 0 (0.0%) |
| Foreign Born, Citizen | 68 (93.1%) | 5 (6.9%) |
| Foreign Born, not a Citizen | 11 (100.0%) | 0 (0.0%) |
Health Insurance Coverage by Household Income in Woodland
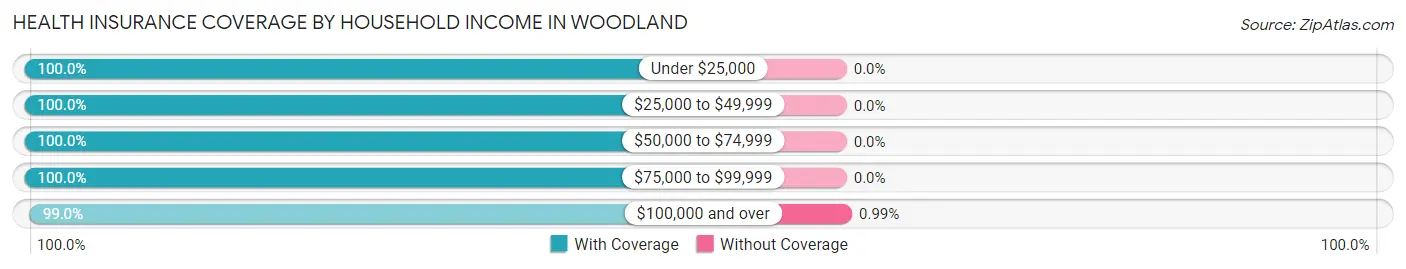
| Household Income | With Coverage | Without Coverage |
| Under $25,000 | 15 (100.0%) | 0 (0.0%) |
| $25,000 to $49,999 | 11 (100.0%) | 0 (0.0%) |
| $50,000 to $74,999 | 24 (100.0%) | 0 (0.0%) |
| $75,000 to $99,999 | 7 (100.0%) | 0 (0.0%) |
| $100,000 and over | 500 (99.0%) | 5 (1.0%) |
Public vs Private Health Insurance Coverage by Age in Woodland
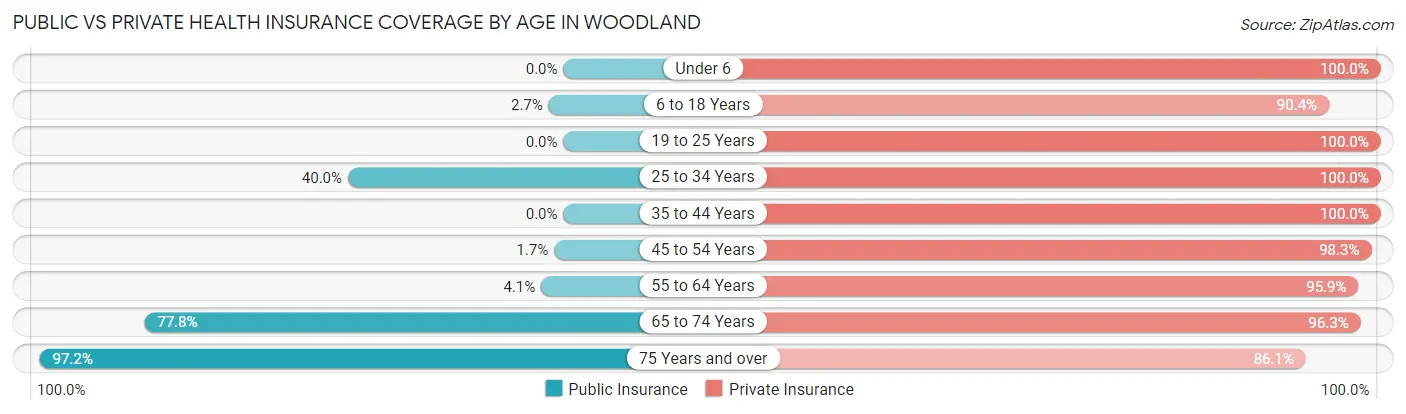
| Age Bracket | Public Insurance | Private Insurance |
| Under 6 | 0 (0.0%) | 31 (100.0%) |
| 6 to 18 Years | 2 (2.7%) | 66 (90.4%) |
| 19 to 25 Years | 0 (0.0%) | 11 (100.0%) |
| 25 to 34 Years | 4 (40.0%) | 10 (100.0%) |
| 35 to 44 Years | 0 (0.0%) | 24 (100.0%) |
| 45 to 54 Years | 2 (1.7%) | 113 (98.3%) |
| 55 to 64 Years | 6 (4.1%) | 139 (95.9%) |
| 65 to 74 Years | 63 (77.8%) | 78 (96.3%) |
| 75 Years and over | 70 (97.2%) | 62 (86.1%) |
| Total | 147 (26.2%) | 534 (95.0%) |
Disability Status by Sex by Age in Woodland
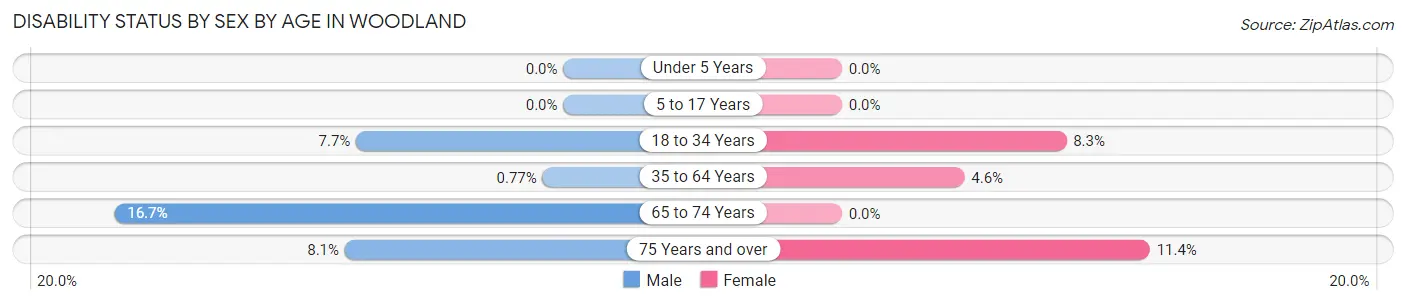
| Age Bracket | Male | Female |
| Under 5 Years | 0 (0.0%) | 0 (0.0%) |
| 5 to 17 Years | 0 (0.0%) | 0 (0.0%) |
| 18 to 34 Years | 1 (7.7%) | 1 (8.3%) |
| 35 to 64 Years | 1 (0.8%) | 7 (4.5%) |
| 65 to 74 Years | 7 (16.7%) | 0 (0.0%) |
| 75 Years and over | 3 (8.1%) | 4 (11.4%) |
Disability Class by Sex by Age in Woodland
Disability Class: Hearing Difficulty
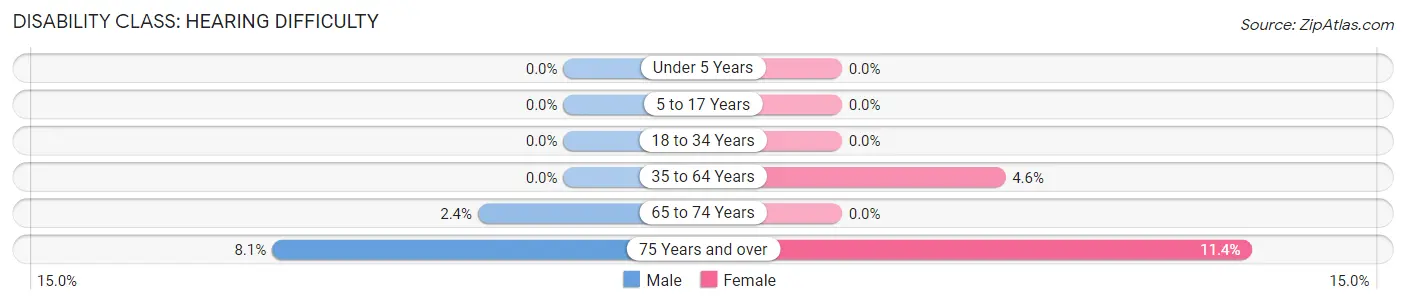
| Age Bracket | Male | Female |
| Under 5 Years | 0 (0.0%) | 0 (0.0%) |
| 5 to 17 Years | 0 (0.0%) | 0 (0.0%) |
| 18 to 34 Years | 0 (0.0%) | 0 (0.0%) |
| 35 to 64 Years | 0 (0.0%) | 7 (4.5%) |
| 65 to 74 Years | 1 (2.4%) | 0 (0.0%) |
| 75 Years and over | 3 (8.1%) | 4 (11.4%) |
Disability Class: Vision Difficulty
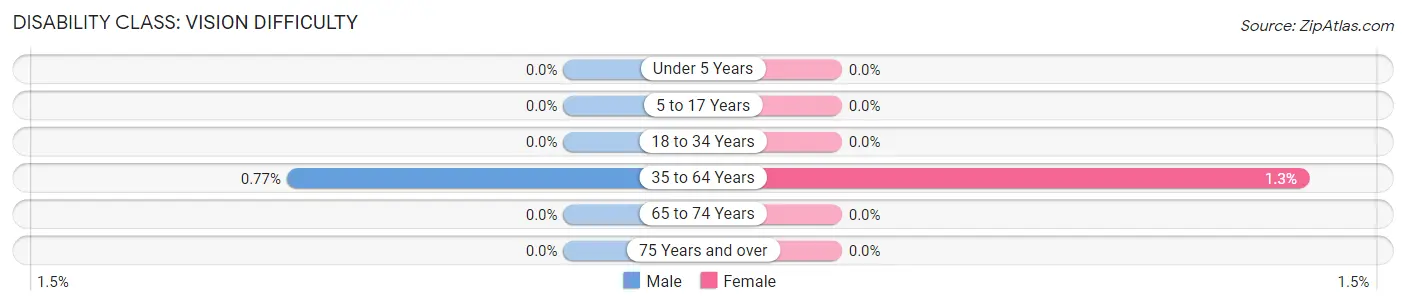
| Age Bracket | Male | Female |
| Under 5 Years | 0 (0.0%) | 0 (0.0%) |
| 5 to 17 Years | 0 (0.0%) | 0 (0.0%) |
| 18 to 34 Years | 0 (0.0%) | 0 (0.0%) |
| 35 to 64 Years | 1 (0.8%) | 2 (1.3%) |
| 65 to 74 Years | 0 (0.0%) | 0 (0.0%) |
| 75 Years and over | 0 (0.0%) | 0 (0.0%) |
Disability Class: Cognitive Difficulty
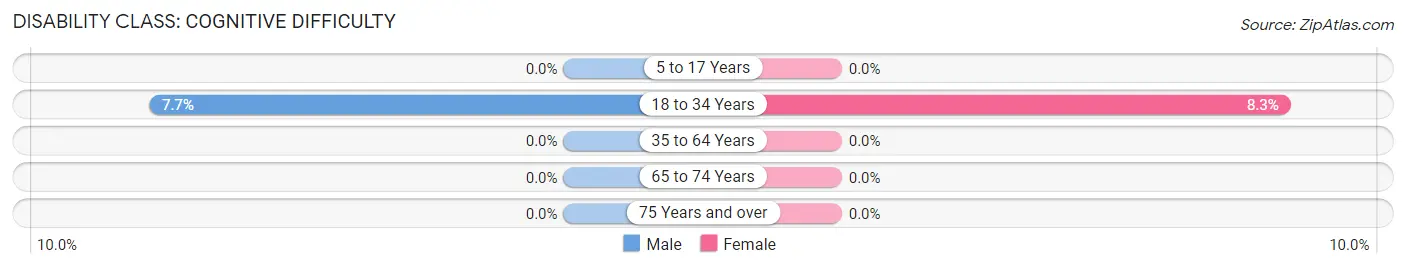
| Age Bracket | Male | Female |
| 5 to 17 Years | 0 (0.0%) | 0 (0.0%) |
| 18 to 34 Years | 1 (7.7%) | 1 (8.3%) |
| 35 to 64 Years | 0 (0.0%) | 0 (0.0%) |
| 65 to 74 Years | 0 (0.0%) | 0 (0.0%) |
| 75 Years and over | 0 (0.0%) | 0 (0.0%) |
Disability Class: Ambulatory Difficulty
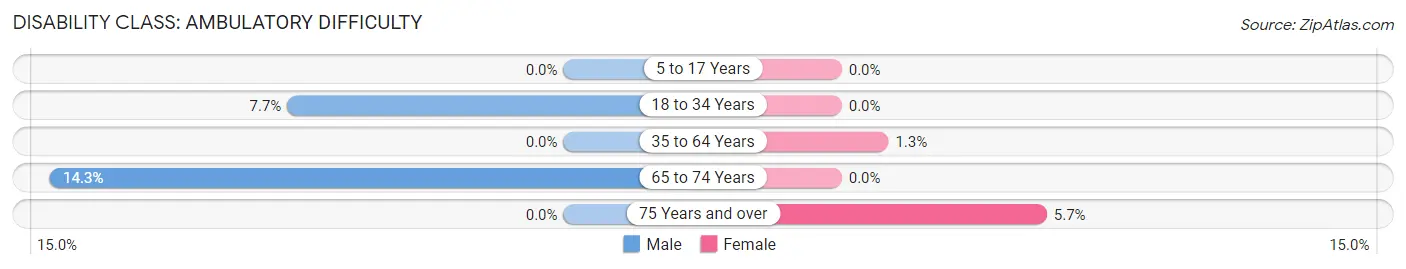
| Age Bracket | Male | Female |
| 5 to 17 Years | 0 (0.0%) | 0 (0.0%) |
| 18 to 34 Years | 1 (7.7%) | 0 (0.0%) |
| 35 to 64 Years | 0 (0.0%) | 2 (1.3%) |
| 65 to 74 Years | 6 (14.3%) | 0 (0.0%) |
| 75 Years and over | 0 (0.0%) | 2 (5.7%) |
Disability Class: Self-Care Difficulty
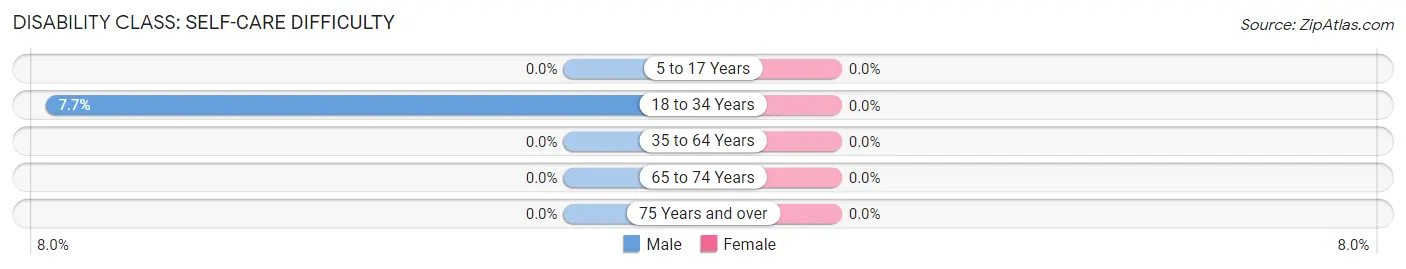
| Age Bracket | Male | Female |
| 5 to 17 Years | 0 (0.0%) | 0 (0.0%) |
| 18 to 34 Years | 1 (7.7%) | 0 (0.0%) |
| 35 to 64 Years | 0 (0.0%) | 0 (0.0%) |
| 65 to 74 Years | 0 (0.0%) | 0 (0.0%) |
| 75 Years and over | 0 (0.0%) | 0 (0.0%) |
Technology Access in Woodland
Computing Device Access in Woodland
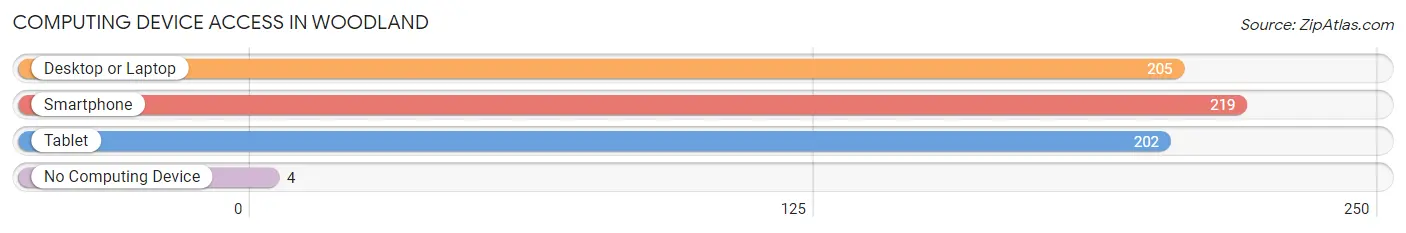
| Device Type | # Households | % Households |
| Desktop or Laptop | 205 | 91.9% |
| Smartphone | 219 | 98.2% |
| Tablet | 202 | 90.6% |
| No Computing Device | 4 | 1.8% |
| Total | 223 | 100.0% |
Internet Access in Woodland
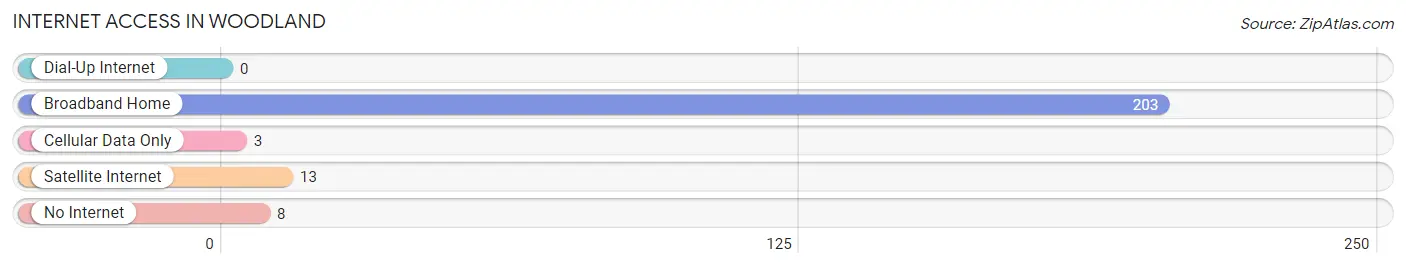
| Internet Type | # Households | % Households |
| Dial-Up Internet | 0 | 0.0% |
| Broadband Home | 203 | 91.0% |
| Cellular Data Only | 3 | 1.3% |
| Satellite Internet | 13 | 5.8% |
| No Internet | 8 | 3.6% |
| Total | 223 | 100.0% |
Woodland Summary
Woodland, Minnesota is a small town located in the southeastern corner of the state, near the border of Wisconsin. It is situated in the St. Croix River Valley, and is part of the Twin Cities metropolitan area. The town has a population of just over 1,000 people, and is known for its rural charm and small-town atmosphere.
History
Woodland was first settled in 1854 by a group of Swedish immigrants. The town was originally called “Swedish Settlement”, but was later changed to Woodland in 1856. The town was officially incorporated in 1872.
In the late 19th century, Woodland was a thriving agricultural community, with many farms and small businesses. The town was also home to a number of sawmills, which provided lumber for the growing population.
In the early 20th century, Woodland began to experience a decline in population as many of its residents moved to larger cities in search of better job opportunities. The town’s population continued to decline until the 1950s, when it began to slowly increase again.
Geography
Woodland is located in the St. Croix River Valley, which is part of the Twin Cities metropolitan area. The town is situated on the banks of the St. Croix River, and is surrounded by rolling hills and forests. The town is located approximately 25 miles northeast of Minneapolis, and is accessible by car via Interstate 94.
The town has a total area of 1.2 square miles, all of which is land. The town is located at an elevation of 890 feet above sea level.
Economy
Woodland’s economy is largely based on agriculture and tourism. The town is home to several small farms, which produce a variety of crops, including corn, soybeans, and hay. The town is also home to a number of small businesses, including restaurants, shops, and a local winery.
Tourism is an important part of the town’s economy, as it is home to a number of attractions, including the Woodland Historical Museum, the Woodland Opera House, and the Woodland Art Gallery. The town is also home to a number of outdoor recreation areas, including the St. Croix State Park and the Woodland Nature Preserve.
Demographics
As of the 2010 census, Woodland had a population of 1,072 people. The racial makeup of the town was 97.2% White, 0.7% African American, 0.3% Native American, 0.2% Asian, 0.1% Pacific Islander, 0.7% from other races, and 0.9% from two or more races. Hispanic or Latino of any race were 1.7% of the population.
The median household income in Woodland was $45,938, and the median family income was $51,250. The per capita income for the town was $20,945. About 8.2% of families and 10.2% of the population were below the poverty line, including 14.3% of those under age 18 and 6.3% of those age 65 or over.
Common Questions
What is Per Capita Income in Woodland?
Per Capita income in Woodland is $145,047.
What is the Median Family Income in Woodland?
Median Family Income in Woodland is $213,750.
What is the Median Household income in Woodland?
Median Household Income in Woodland is $203,750.
What is Income or Wage Gap in Woodland?
Income or Wage Gap in Woodland is 68.6%.
Women in Woodland earn 31.4 cents for every dollar earned by a man.
What is Inequality or Gini Index in Woodland?
Inequality or Gini Index in Woodland is 0.46.
What is the Total Population of Woodland?
Total Population of Woodland is 562.
What is the Total Male Population of Woodland?
Total Male Population of Woodland is 255.
What is the Total Female Population of Woodland?
Total Female Population of Woodland is 307.
What is the Ratio of Males per 100 Females in Woodland?
There are 83.06 Males per 100 Females in Woodland.
What is the Ratio of Females per 100 Males in Woodland?
There are 120.39 Females per 100 Males in Woodland.
What is the Median Population Age in Woodland?
Median Population Age in Woodland is 55.3 Years.
What is the Average Family Size in Woodland
Average Family Size in Woodland is 2.7 People.
What is the Average Household Size in Woodland
Average Household Size in Woodland is 2.5 People.
How Large is the Labor Force in Woodland?
There are 257 People in the Labor Forcein in Woodland.
What is the Percentage of People in the Labor Force in Woodland?
54.3% of People are in the Labor Force in Woodland.
What is the Unemployment Rate in Woodland?
Unemployment Rate in Woodland is 6.2%.