New Prague, MN Map & Demographics
New Prague Map
New Prague Overview
$43,732
PER CAPITA INCOME
$108,950
AVG FAMILY INCOME
$101,579
AVG HOUSEHOLD INCOME
27.2%
WAGE / INCOME GAP [ % ]
72.8¢/ $1
WAGE / INCOME GAP [ $ ]
0.42
INEQUALITY / GINI INDEX
8,155
TOTAL POPULATION
4,208
MALE POPULATION
3,947
FEMALE POPULATION
106.61
MALES / 100 FEMALES
93.80
FEMALES / 100 MALES
35.3
MEDIAN AGE
3.4
AVG FAMILY SIZE
2.9
AVG HOUSEHOLD SIZE
4,191
LABOR FORCE [ PEOPLE ]
70.6%
PERCENT IN LABOR FORCE
3.6%
UNEMPLOYMENT RATE
New Prague Zip Codes
New Prague Area Codes
Income in New Prague
Income Overview in New Prague
Per Capita Income in New Prague is $43,732, while median incomes of families and households are $108,950 and $101,579 respectively.
| Characteristic | Number | Measure |
| Per Capita Income | 8,155 | $43,732 |
| Median Family Income | 2,072 | $108,950 |
| Mean Family Income | 2,072 | $136,939 |
| Median Household Income | 2,822 | $101,579 |
| Mean Household Income | 2,822 | $120,229 |
| Income Deficit | 2,072 | $0 |
| Wage / Income Gap (%) | 8,155 | 27.20% |
| Wage / Income Gap ($) | 8,155 | 72.80¢ per $1 |
| Gini / Inequality Index | 8,155 | 0.42 |
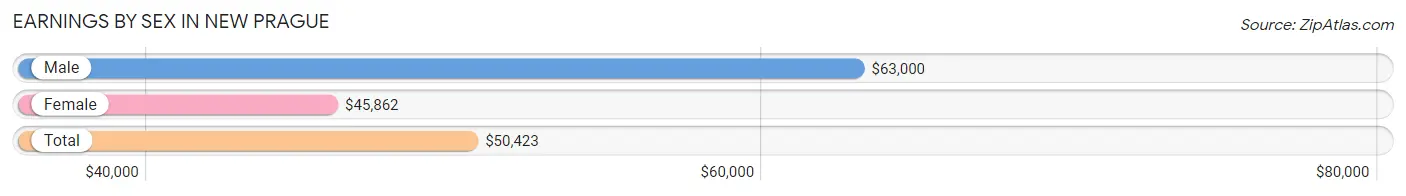
Earnings by Sex in New Prague
Average Earnings in New Prague are $50,423, $63,000 for men and $45,862 for women, a difference of 27.2%.
| Sex | Number | Average Earnings |
| Male | 2,328 (52.8%) | $63,000 |
| Female | 2,082 (47.2%) | $45,862 |
| Total | 4,410 (100.0%) | $50,423 |
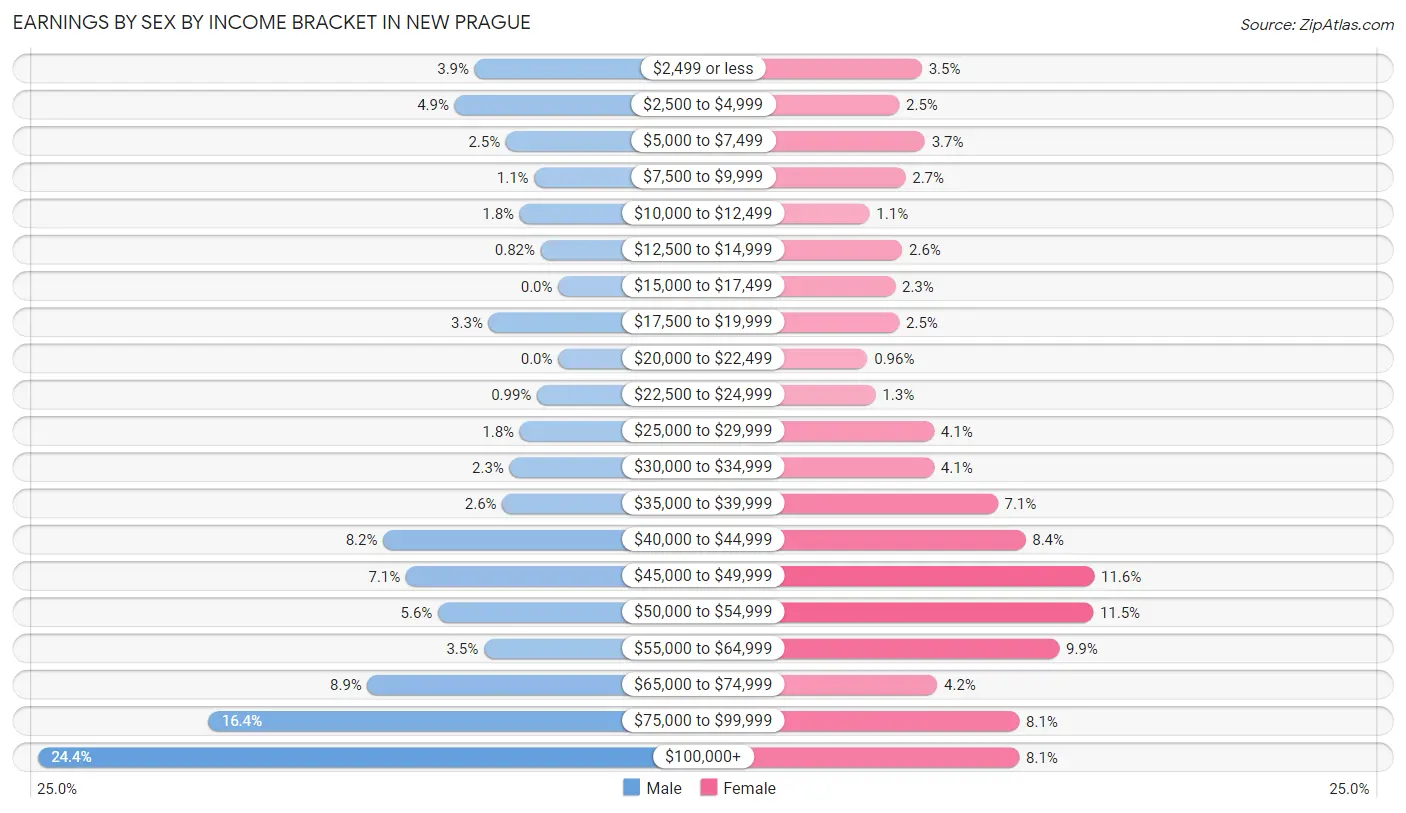
Earnings by Sex by Income Bracket in New Prague
The most common earnings brackets in New Prague are $100,000+ for men (567 | 24.4%) and $45,000 to $49,999 for women (241 | 11.6%).
| Income | Male | Female |
| $2,499 or less | 91 (3.9%) | 73 (3.5%) |
| $2,500 to $4,999 | 113 (4.9%) | 51 (2.5%) |
| $5,000 to $7,499 | 57 (2.5%) | 76 (3.6%) |
| $7,500 to $9,999 | 26 (1.1%) | 57 (2.7%) |
| $10,000 to $12,499 | 42 (1.8%) | 22 (1.1%) |
| $12,500 to $14,999 | 19 (0.8%) | 54 (2.6%) |
| $15,000 to $17,499 | 0 (0.0%) | 47 (2.3%) |
| $17,500 to $19,999 | 76 (3.3%) | 51 (2.5%) |
| $20,000 to $22,499 | 0 (0.0%) | 20 (1.0%) |
| $22,500 to $24,999 | 23 (1.0%) | 28 (1.3%) |
| $25,000 to $29,999 | 42 (1.8%) | 85 (4.1%) |
| $30,000 to $34,999 | 53 (2.3%) | 85 (4.1%) |
| $35,000 to $39,999 | 61 (2.6%) | 147 (7.1%) |
| $40,000 to $44,999 | 191 (8.2%) | 174 (8.4%) |
| $45,000 to $49,999 | 166 (7.1%) | 241 (11.6%) |
| $50,000 to $54,999 | 131 (5.6%) | 240 (11.5%) |
| $55,000 to $64,999 | 81 (3.5%) | 207 (9.9%) |
| $65,000 to $74,999 | 208 (8.9%) | 88 (4.2%) |
| $75,000 to $99,999 | 381 (16.4%) | 168 (8.1%) |
| $100,000+ | 567 (24.4%) | 168 (8.1%) |
| Total | 2,328 (100.0%) | 2,082 (100.0%) |
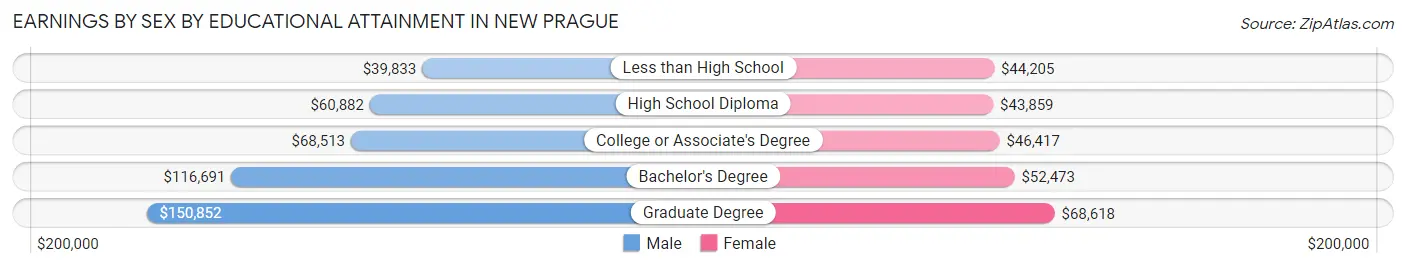
Earnings by Sex by Educational Attainment in New Prague
Average earnings in New Prague are $78,240 for men and $49,750 for women, a difference of 36.4%. Men with an educational attainment of graduate degree enjoy the highest average annual earnings of $150,852, while those with less than high school education earn the least with $39,833. Women with an educational attainment of graduate degree earn the most with the average annual earnings of $68,618, while those with high school diploma education have the smallest earnings of $43,859.
| Educational Attainment | Male Income | Female Income |
| Less than High School | $39,833 | $44,205 |
| High School Diploma | $60,882 | $43,859 |
| College or Associate's Degree | $68,513 | $46,417 |
| Bachelor's Degree | $116,691 | $52,473 |
| Graduate Degree | $150,852 | $68,618 |
| Total | $78,240 | $49,750 |
Family Income in New Prague
Family Income Brackets in New Prague
According to the New Prague family income data, there are 514 families falling into the $100,000 to $149,999 income range, which is the most common income bracket and makes up 24.8% of all families. Conversely, the $10,000 to $14,999 income bracket is the least frequent group with only 10 families (0.5%) belonging to this category.
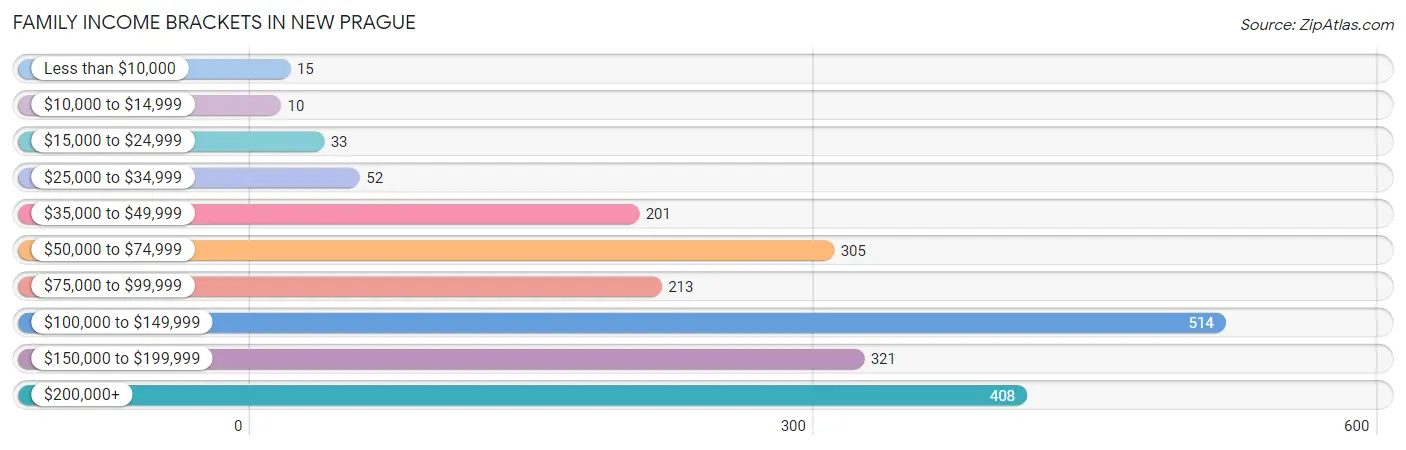
| Income Bracket | # Families | % Families |
| Less than $10,000 | 15 | 0.7% |
| $10,000 to $14,999 | 10 | 0.5% |
| $15,000 to $24,999 | 33 | 1.6% |
| $25,000 to $34,999 | 52 | 2.5% |
| $35,000 to $49,999 | 201 | 9.7% |
| $50,000 to $74,999 | 305 | 14.7% |
| $75,000 to $99,999 | 213 | 10.3% |
| $100,000 to $149,999 | 514 | 24.8% |
| $150,000 to $199,999 | 321 | 15.5% |
| $200,000+ | 408 | 19.7% |
Family Income by Famaliy Size in New Prague
5-person families (260 | 12.6%) account for the highest median family income in New Prague with $146,667 per family, while 2-person families (716 | 34.6%) have the highest median income of $39,318 per family member.
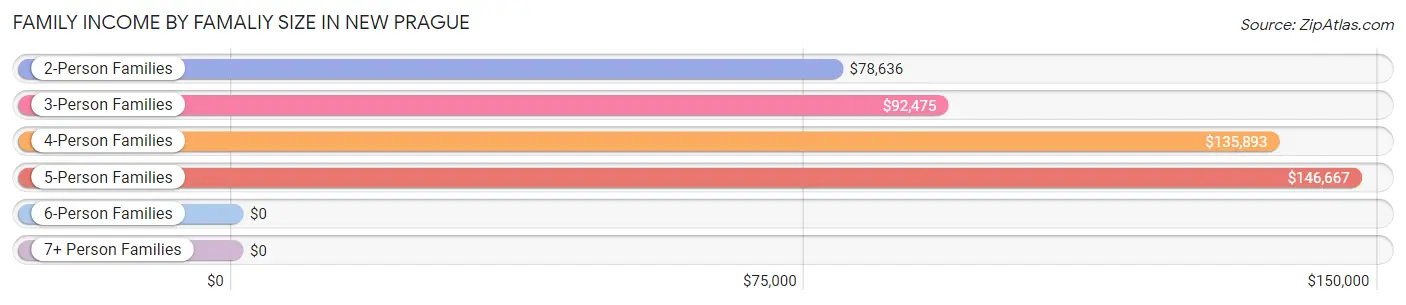
| Income Bracket | # Families | Median Income |
| 2-Person Families | 716 (34.6%) | $78,636 |
| 3-Person Families | 549 (26.5%) | $92,475 |
| 4-Person Families | 464 (22.4%) | $135,893 |
| 5-Person Families | 260 (12.6%) | $146,667 |
| 6-Person Families | 54 (2.6%) | $0 |
| 7+ Person Families | 29 (1.4%) | $0 |
| Total | 2,072 (100.0%) | $108,950 |
Family Income by Number of Earners in New Prague
The median family income in New Prague is $108,950, with families comprising 3+ earners (372) having the highest median family income of $177,794, while families with 1 earner (470) have the lowest median family income of $50,500, accounting for 17.9% and 22.7% of families, respectively.
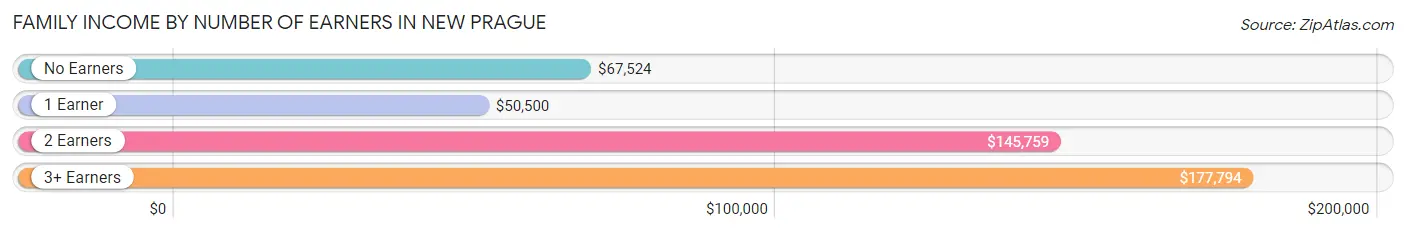
| Number of Earners | # Families | Median Income |
| No Earners | 261 (12.6%) | $67,524 |
| 1 Earner | 470 (22.7%) | $50,500 |
| 2 Earners | 969 (46.8%) | $145,759 |
| 3+ Earners | 372 (17.9%) | $177,794 |
| Total | 2,072 (100.0%) | $108,950 |
Household Income in New Prague
Household Income Brackets in New Prague
With 593 households falling in the category, the $100,000 to $149,999 income range is the most frequent in New Prague, accounting for 21.0% of all households. In contrast, only 11 households (0.4%) fall into the $10,000 to $14,999 income bracket, making it the least populous group.
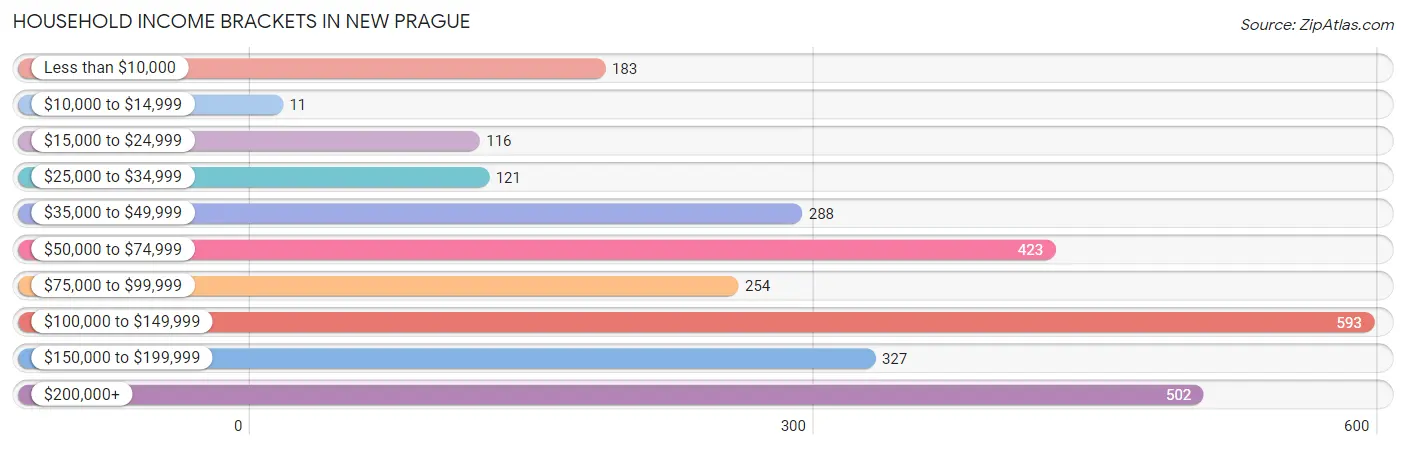
| Income Bracket | # Households | % Households |
| Less than $10,000 | 183 | 6.5% |
| $10,000 to $14,999 | 11 | 0.4% |
| $15,000 to $24,999 | 116 | 4.1% |
| $25,000 to $34,999 | 121 | 4.3% |
| $35,000 to $49,999 | 288 | 10.2% |
| $50,000 to $74,999 | 423 | 15.0% |
| $75,000 to $99,999 | 254 | 9.0% |
| $100,000 to $149,999 | 593 | 21.0% |
| $150,000 to $199,999 | 327 | 11.6% |
| $200,000+ | 502 | 17.8% |
Household Income by Householder Age in New Prague
The median household income in New Prague is $101,579, with the highest median household income of $139,097 found in the 45 to 64 years age bracket for the primary householder. A total of 849 households (30.1%) fall into this category. Meanwhile, the 65+ years age bracket for the primary householder has the lowest median household income of $52,300, with 746 households (26.4%) in this group.
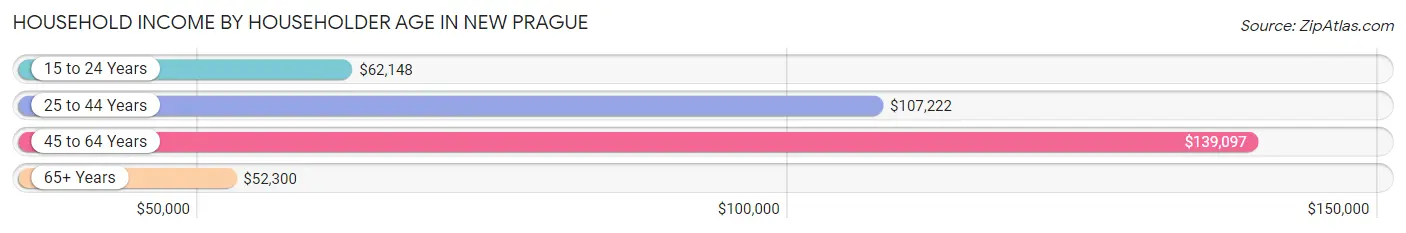
| Income Bracket | # Households | Median Income |
| 15 to 24 Years | 79 (2.8%) | $62,148 |
| 25 to 44 Years | 1,148 (40.7%) | $107,222 |
| 45 to 64 Years | 849 (30.1%) | $139,097 |
| 65+ Years | 746 (26.4%) | $52,300 |
| Total | 2,822 (100.0%) | $101,579 |
Poverty in New Prague
Income Below Poverty by Sex and Age in New Prague
With 5.6% poverty level for males and 3.5% for females among the residents of New Prague, 16 and 17 year old males and 75 year old and over females are the most vulnerable to poverty, with 20 males (19.4%) and 81 females (18.8%) in their respective age groups living below the poverty level.
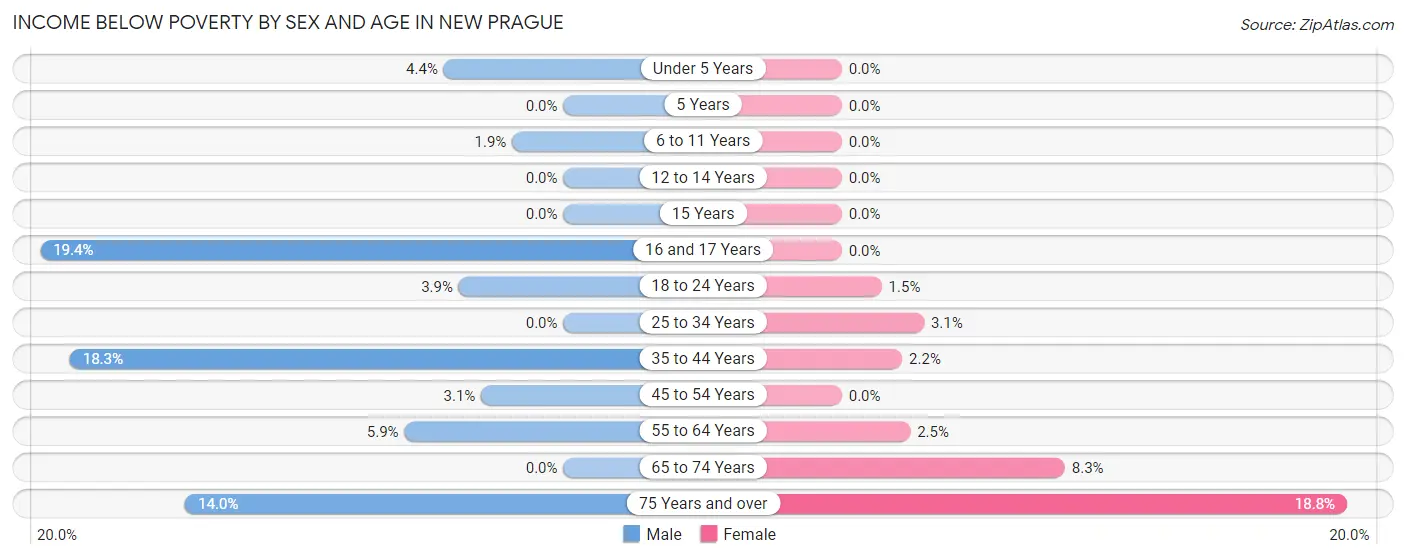
| Age Bracket | Male | Female |
| Under 5 Years | 12 (4.4%) | 0 (0.0%) |
| 5 Years | 0 (0.0%) | 0 (0.0%) |
| 6 to 11 Years | 11 (1.9%) | 0 (0.0%) |
| 12 to 14 Years | 0 (0.0%) | 0 (0.0%) |
| 15 Years | 0 (0.0%) | 0 (0.0%) |
| 16 and 17 Years | 20 (19.4%) | 0 (0.0%) |
| 18 to 24 Years | 17 (3.9%) | 4 (1.5%) |
| 25 to 34 Years | 0 (0.0%) | 13 (3.0%) |
| 35 to 44 Years | 111 (18.3%) | 15 (2.2%) |
| 45 to 54 Years | 15 (3.0%) | 0 (0.0%) |
| 55 to 64 Years | 16 (5.9%) | 10 (2.5%) |
| 65 to 74 Years | 0 (0.0%) | 12 (8.3%) |
| 75 Years and over | 32 (14.0%) | 81 (18.8%) |
| Total | 234 (5.6%) | 135 (3.5%) |
Income Above Poverty by Sex and Age in New Prague
According to the poverty statistics in New Prague, males aged 5 years and females aged under 5 years are the age groups that are most secure financially, with 100.0% of males and 100.0% of females in these age groups living above the poverty line.
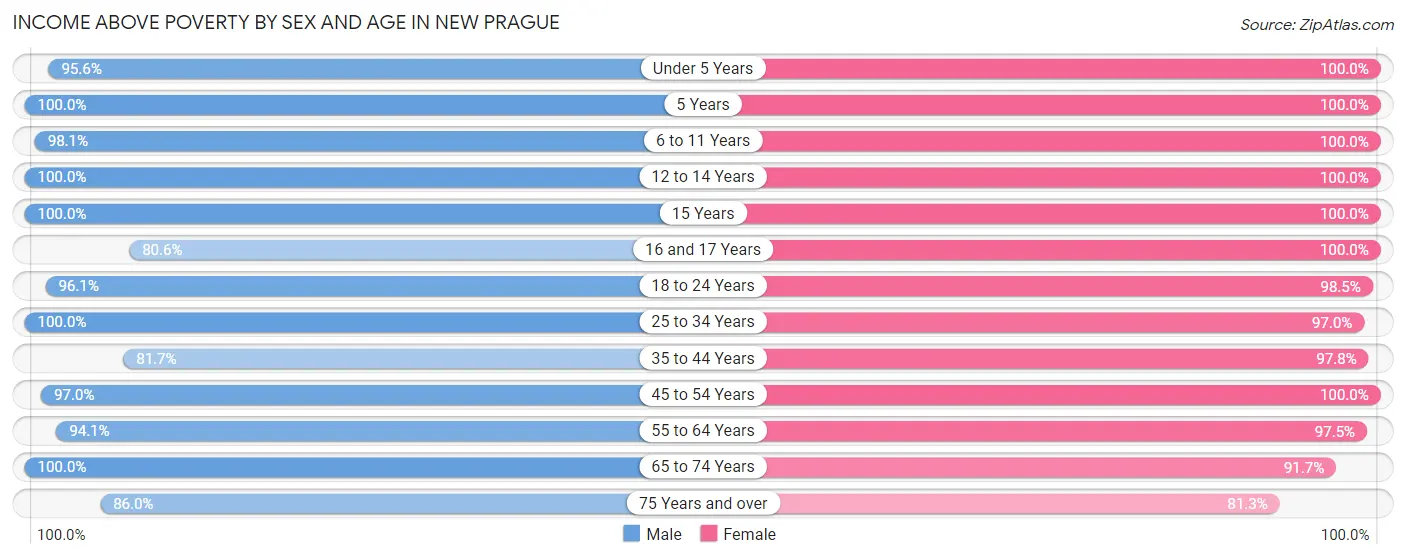
| Age Bracket | Male | Female |
| Under 5 Years | 258 (95.6%) | 383 (100.0%) |
| 5 Years | 38 (100.0%) | 81 (100.0%) |
| 6 to 11 Years | 568 (98.1%) | 241 (100.0%) |
| 12 to 14 Years | 324 (100.0%) | 231 (100.0%) |
| 15 Years | 26 (100.0%) | 33 (100.0%) |
| 16 and 17 Years | 83 (80.6%) | 119 (100.0%) |
| 18 to 24 Years | 421 (96.1%) | 267 (98.5%) |
| 25 to 34 Years | 478 (100.0%) | 413 (97.0%) |
| 35 to 44 Years | 495 (81.7%) | 655 (97.8%) |
| 45 to 54 Years | 476 (97.0%) | 436 (100.0%) |
| 55 to 64 Years | 255 (94.1%) | 383 (97.5%) |
| 65 to 74 Years | 331 (100.0%) | 133 (91.7%) |
| 75 Years and over | 196 (86.0%) | 351 (81.2%) |
| Total | 3,949 (94.4%) | 3,726 (96.5%) |
Income Below Poverty Among Married-Couple Families in New Prague
The poverty statistics for married-couple families in New Prague show that 1.8% or 30 of the total 1,635 families live below the poverty line. Families with no children have the highest poverty rate of 4.0%, comprising of 30 families. On the other hand, families with 1 or 2 children have the lowest poverty rate of 0.0%, which includes 0 families.
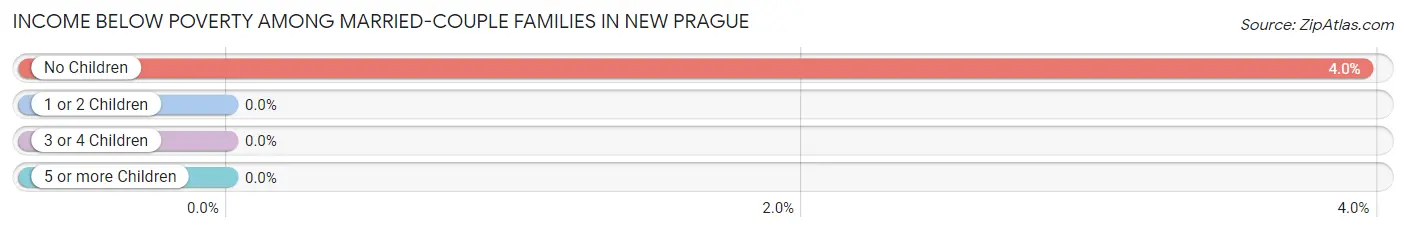
| Children | Above Poverty | Below Poverty |
| No Children | 729 (96.1%) | 30 (4.0%) |
| 1 or 2 Children | 607 (100.0%) | 0 (0.0%) |
| 3 or 4 Children | 256 (100.0%) | 0 (0.0%) |
| 5 or more Children | 13 (100.0%) | 0 (0.0%) |
| Total | 1,605 (98.2%) | 30 (1.8%) |
Income Below Poverty Among Single-Parent Households in New Prague
According to the poverty data in New Prague, 10.3% or 14 single-father households and 5.0% or 15 single-mother households are living below the poverty line. Among single-father households, those with 1 or 2 children have the highest poverty rate, with 14 households (17.9%) experiencing poverty. Likewise, among single-mother households, those with 1 or 2 children have the highest poverty rate, with 15 households (5.7%) falling below the poverty line.
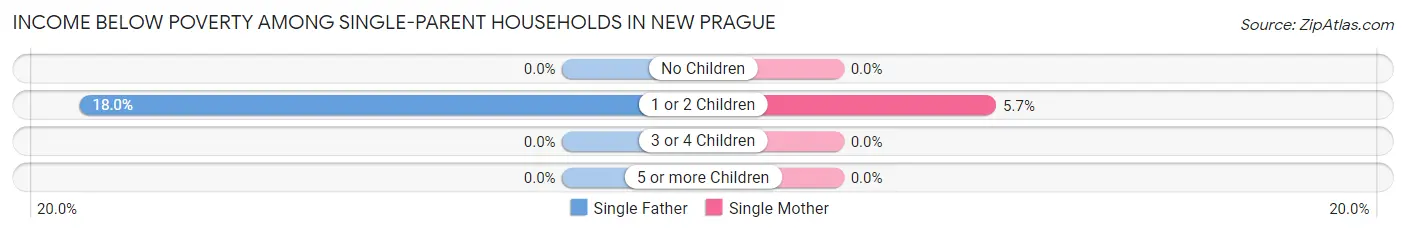
| Children | Single Father | Single Mother |
| No Children | 0 (0.0%) | 0 (0.0%) |
| 1 or 2 Children | 14 (17.9%) | 15 (5.7%) |
| 3 or 4 Children | 0 (0.0%) | 0 (0.0%) |
| 5 or more Children | 0 (0.0%) | 0 (0.0%) |
| Total | 14 (10.3%) | 15 (5.0%) |
Income Below Poverty Among Married-Couple vs Single-Parent Households in New Prague
The poverty data for New Prague shows that 30 of the married-couple family households (1.8%) and 29 of the single-parent households (6.6%) are living below the poverty level. Within the married-couple family households, those with no children have the highest poverty rate, with 30 households (4.0%) falling below the poverty line. Among the single-parent households, those with 1 or 2 children have the highest poverty rate, with 29 household (8.5%) living below poverty.

| Children | Married-Couple Families | Single-Parent Households |
| No Children | 30 (4.0%) | 0 (0.0%) |
| 1 or 2 Children | 0 (0.0%) | 29 (8.5%) |
| 3 or 4 Children | 0 (0.0%) | 0 (0.0%) |
| 5 or more Children | 0 (0.0%) | 0 (0.0%) |
| Total | 30 (1.8%) | 29 (6.6%) |
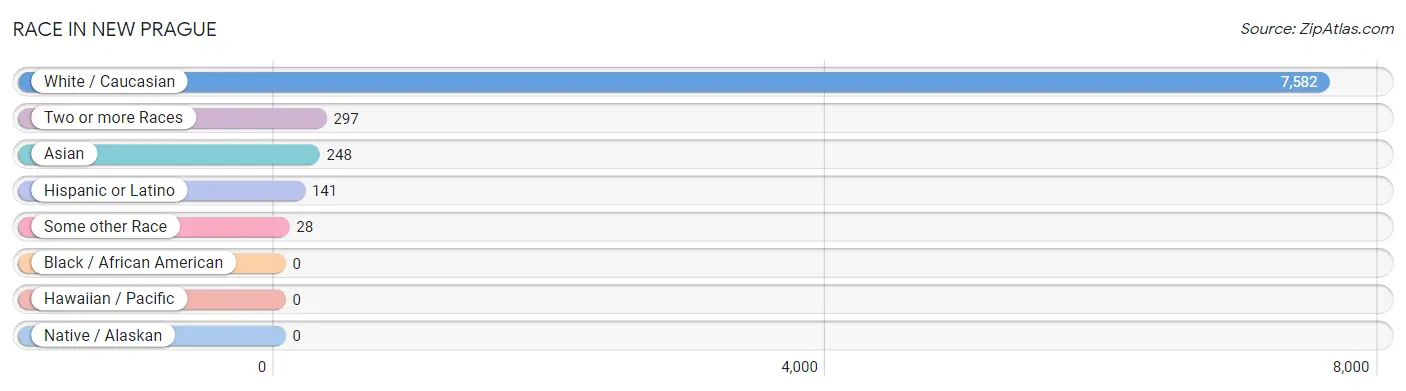
Race in New Prague
The most populous races in New Prague are White / Caucasian (7,582 | 93.0%), Two or more Races (297 | 3.6%), and Asian (248 | 3.0%).
| Race | # Population | % Population |
| Asian | 248 | 3.0% |
| Black / African American | 0 | 0.0% |
| Hawaiian / Pacific | 0 | 0.0% |
| Hispanic or Latino | 141 | 1.7% |
| Native / Alaskan | 0 | 0.0% |
| White / Caucasian | 7,582 | 93.0% |
| Two or more Races | 297 | 3.6% |
| Some other Race | 28 | 0.3% |
| Total | 8,155 | 100.0% |
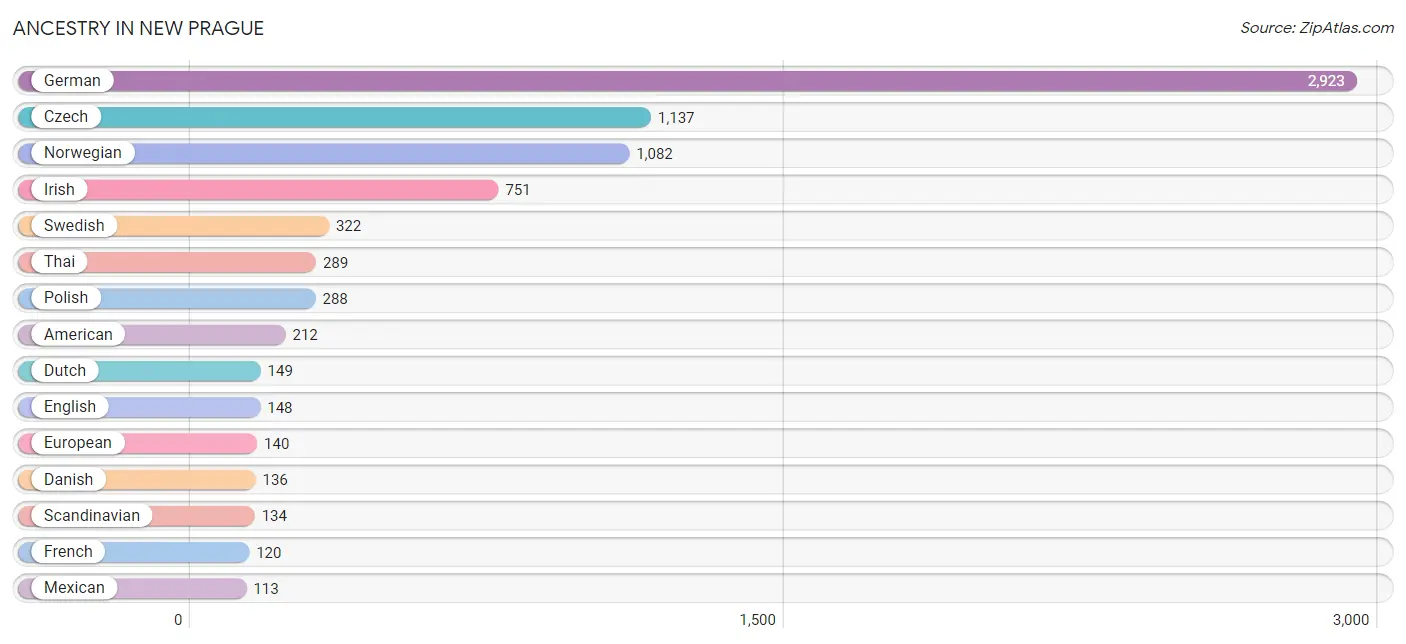
Ancestry in New Prague
The most populous ancestries reported in New Prague are German (2,923 | 35.8%), Czech (1,137 | 13.9%), Norwegian (1,082 | 13.3%), Irish (751 | 9.2%), and Swedish (322 | 4.0%), together accounting for 76.2% of all New Prague residents.
| Ancestry | # Population | % Population |
| American | 212 | 2.6% |
| Arab | 14 | 0.2% |
| Bangladeshi | 16 | 0.2% |
| Bhutanese | 23 | 0.3% |
| Burmese | 13 | 0.2% |
| Czech | 1,137 | 13.9% |
| Czechoslovakian | 71 | 0.9% |
| Danish | 136 | 1.7% |
| Dutch | 149 | 1.8% |
| Eastern European | 20 | 0.3% |
| English | 148 | 1.8% |
| European | 140 | 1.7% |
| Finnish | 36 | 0.4% |
| French | 120 | 1.5% |
| French Canadian | 72 | 0.9% |
| German | 2,923 | 35.8% |
| Guyanese | 32 | 0.4% |
| Irish | 751 | 9.2% |
| Italian | 100 | 1.2% |
| Luxembourger | 12 | 0.2% |
| Mexican | 113 | 1.4% |
| Moroccan | 14 | 0.2% |
| Norwegian | 1,082 | 13.3% |
| Peruvian | 28 | 0.3% |
| Polish | 288 | 3.5% |
| Scandinavian | 134 | 1.6% |
| South American | 28 | 0.3% |
| Swedish | 322 | 4.0% |
| Swiss | 12 | 0.2% |
| Thai | 289 | 3.5% | View All 30 Rows |
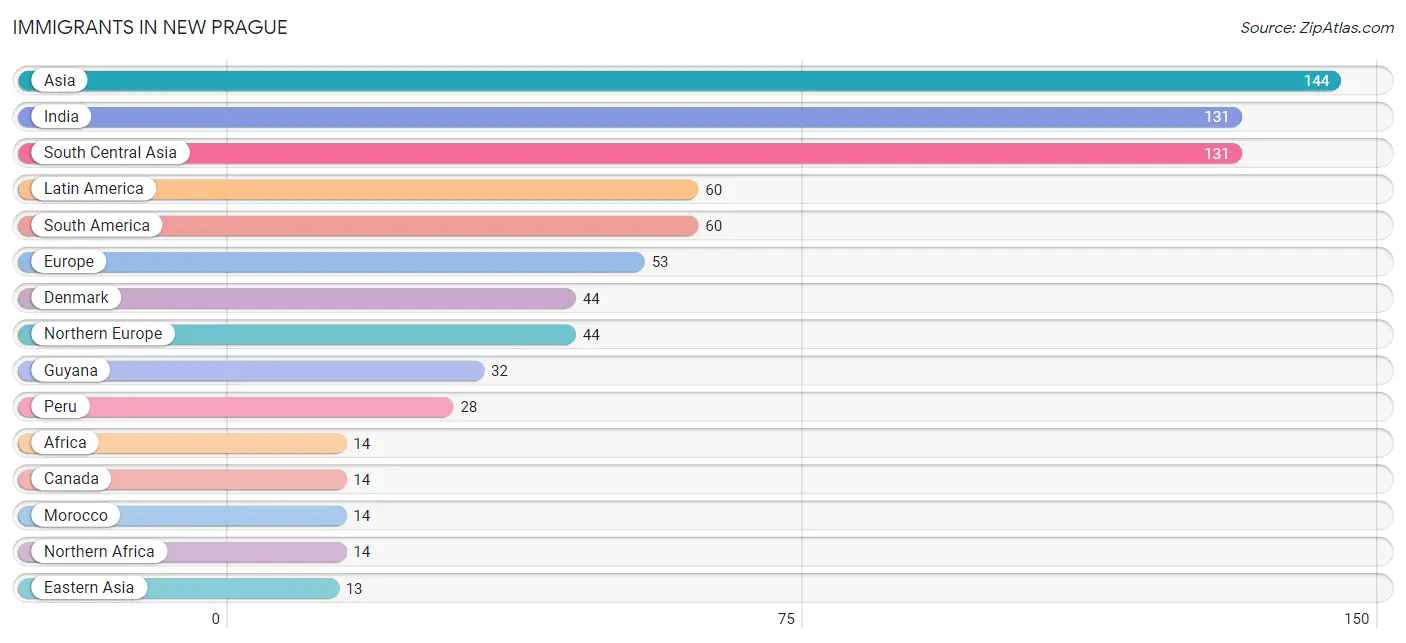
Immigrants in New Prague
The most numerous immigrant groups reported in New Prague came from Asia (144 | 1.8%), India (131 | 1.6%), South Central Asia (131 | 1.6%), Latin America (60 | 0.7%), and South America (60 | 0.7%), together accounting for 6.5% of all New Prague residents.
| Immigration Origin | # Population | % Population |
| Africa | 14 | 0.2% |
| Asia | 144 | 1.8% |
| Canada | 14 | 0.2% |
| Denmark | 44 | 0.5% |
| Eastern Asia | 13 | 0.2% |
| Europe | 53 | 0.6% |
| Germany | 9 | 0.1% |
| Guyana | 32 | 0.4% |
| India | 131 | 1.6% |
| Korea | 13 | 0.2% |
| Latin America | 60 | 0.7% |
| Morocco | 14 | 0.2% |
| Northern Africa | 14 | 0.2% |
| Northern Europe | 44 | 0.5% |
| Peru | 28 | 0.3% |
| South America | 60 | 0.7% |
| South Central Asia | 131 | 1.6% |
| Western Europe | 9 | 0.1% | View All 18 Rows |
Sex and Age in New Prague
Sex and Age in New Prague
The most populous age groups in New Prague are 10 to 14 Years (709 | 16.9%) for men and Under 5 Years (383 | 9.7%) for women.
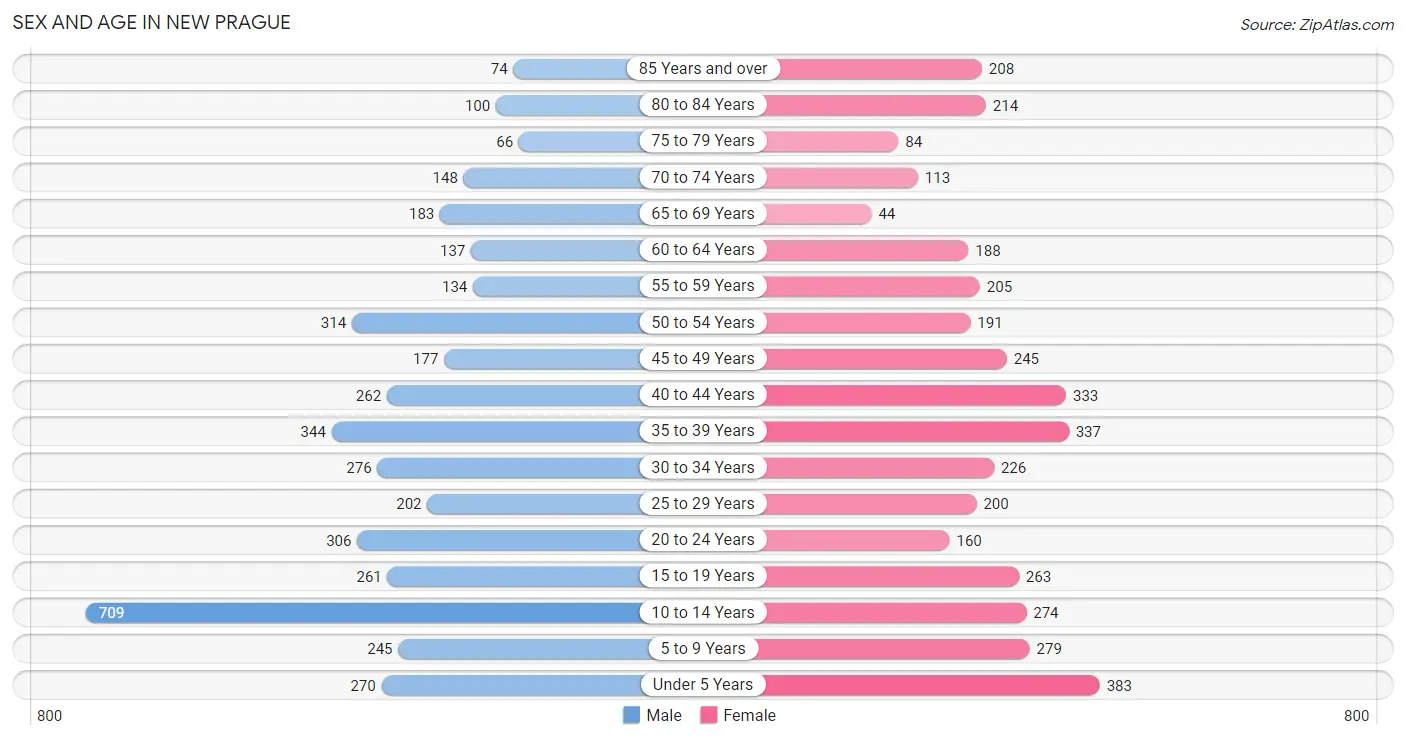
| Age Bracket | Male | Female |
| Under 5 Years | 270 (6.4%) | 383 (9.7%) |
| 5 to 9 Years | 245 (5.8%) | 279 (7.1%) |
| 10 to 14 Years | 709 (16.9%) | 274 (6.9%) |
| 15 to 19 Years | 261 (6.2%) | 263 (6.7%) |
| 20 to 24 Years | 306 (7.3%) | 160 (4.1%) |
| 25 to 29 Years | 202 (4.8%) | 200 (5.1%) |
| 30 to 34 Years | 276 (6.6%) | 226 (5.7%) |
| 35 to 39 Years | 344 (8.2%) | 337 (8.5%) |
| 40 to 44 Years | 262 (6.2%) | 333 (8.4%) |
| 45 to 49 Years | 177 (4.2%) | 245 (6.2%) |
| 50 to 54 Years | 314 (7.5%) | 191 (4.8%) |
| 55 to 59 Years | 134 (3.2%) | 205 (5.2%) |
| 60 to 64 Years | 137 (3.3%) | 188 (4.8%) |
| 65 to 69 Years | 183 (4.3%) | 44 (1.1%) |
| 70 to 74 Years | 148 (3.5%) | 113 (2.9%) |
| 75 to 79 Years | 66 (1.6%) | 84 (2.1%) |
| 80 to 84 Years | 100 (2.4%) | 214 (5.4%) |
| 85 Years and over | 74 (1.8%) | 208 (5.3%) |
| Total | 4,208 (100.0%) | 3,947 (100.0%) |
Families and Households in New Prague
Median Family Size in New Prague
The median family size in New Prague is 3.38 persons per family, with married-couple families (1,635 | 78.9%) accounting for the largest median family size of 3.5 persons per family. On the other hand, single male/father families (136 | 6.6%) represent the smallest median family size with 2.53 persons per family.
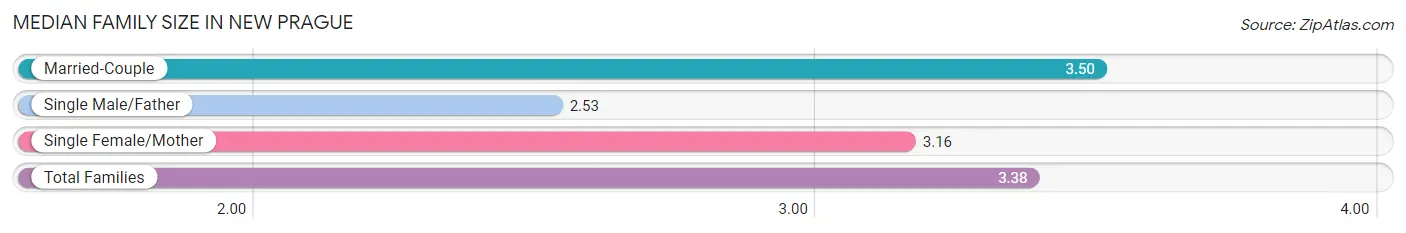
| Family Type | # Families | Family Size |
| Married-Couple | 1,635 (78.9%) | 3.50 |
| Single Male/Father | 136 (6.6%) | 2.53 |
| Single Female/Mother | 301 (14.5%) | 3.16 |
| Total Families | 2,072 (100.0%) | 3.38 |
Median Household Size in New Prague
The median household size in New Prague is 2.85 persons per household, with single female/mother households (301 | 10.7%) accounting for the largest median household size of 3.54 persons per household. non-family households (750 | 26.6%) represent the smallest median household size with 1.13 persons per household.
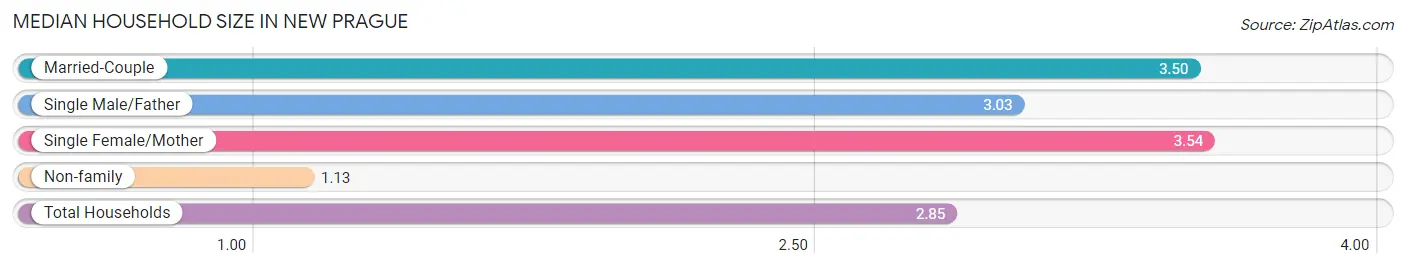
| Household Type | # Households | Household Size |
| Married-Couple | 1,635 (57.9%) | 3.50 |
| Single Male/Father | 136 (4.8%) | 3.03 |
| Single Female/Mother | 301 (10.7%) | 3.54 |
| Non-family | 750 (26.6%) | 1.13 |
| Total Households | 2,822 (100.0%) | 2.85 |
Household Size by Marriage Status in New Prague
Out of a total of 2,822 households in New Prague, 2,072 (73.4%) are family households, while 750 (26.6%) are nonfamily households. The most numerous type of family households are 2-person households, comprising 662, and the most common type of nonfamily households are 1-person households, comprising 626.
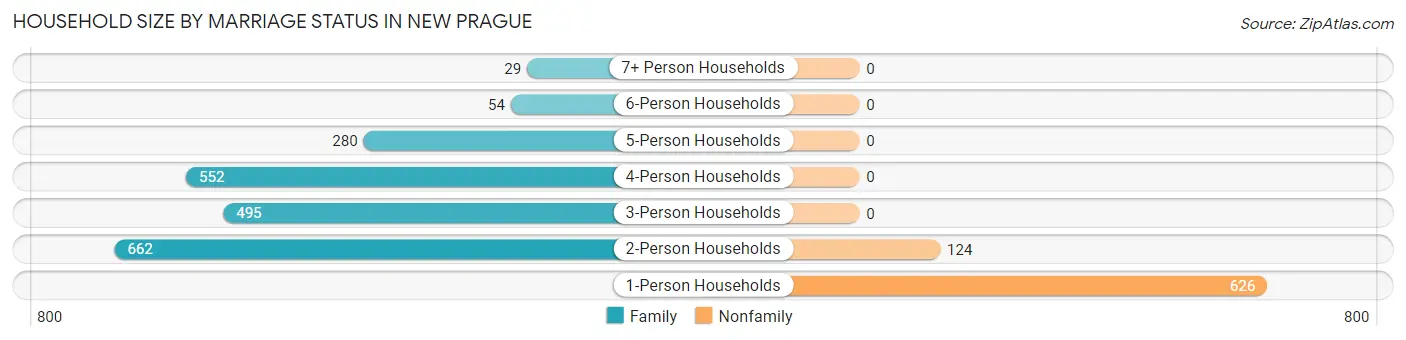
| Household Size | Family Households | Nonfamily Households |
| 1-Person Households | - | 626 (22.2%) |
| 2-Person Households | 662 (23.5%) | 124 (4.4%) |
| 3-Person Households | 495 (17.5%) | 0 (0.0%) |
| 4-Person Households | 552 (19.6%) | 0 (0.0%) |
| 5-Person Households | 280 (9.9%) | 0 (0.0%) |
| 6-Person Households | 54 (1.9%) | 0 (0.0%) |
| 7+ Person Households | 29 (1.0%) | 0 (0.0%) |
| Total | 2,072 (73.4%) | 750 (26.6%) |
Female Fertility in New Prague
Fertility by Age in New Prague
Average fertility rate in New Prague is 48.0 births per 1,000 women. Women in the age bracket of 20 to 34 years have the highest fertility rate with 119.0 births per 1,000 women. Women in the age bracket of 20 to 34 years acount for 79.5% of all women with births.
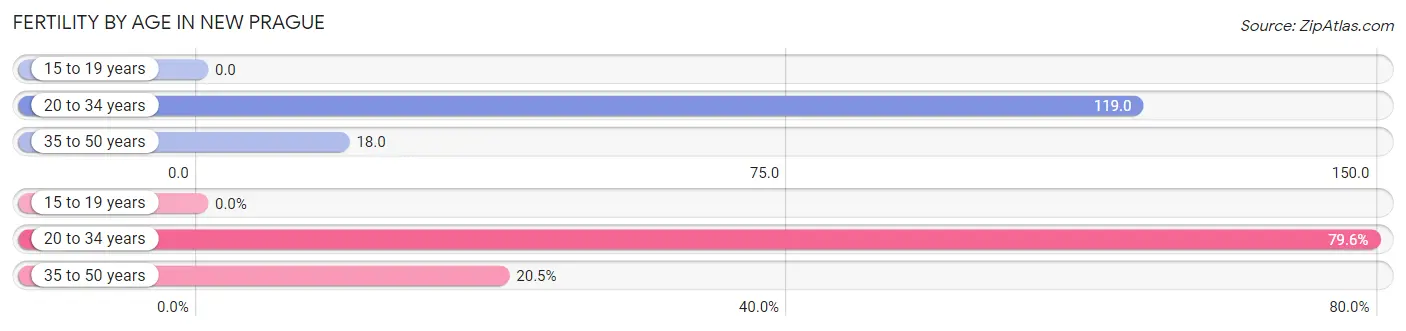
| Age Bracket | Women with Births | Births / 1,000 Women |
| 15 to 19 years | 0 (0.0%) | 0.0 |
| 20 to 34 years | 70 (79.5%) | 119.0 |
| 35 to 50 years | 18 (20.4%) | 18.0 |
| Total | 88 (100.0%) | 48.0 |
Fertility by Age by Marriage Status in New Prague
88.6% of women with births (88) in New Prague are married. The highest percentage of unmarried women with births falls into 20 to 34 years age bracket with 14.3% of them unmarried at the time of birth, while the lowest percentage of unmarried women with births belong to 35 to 50 years age bracket with 0.0% of them unmarried.
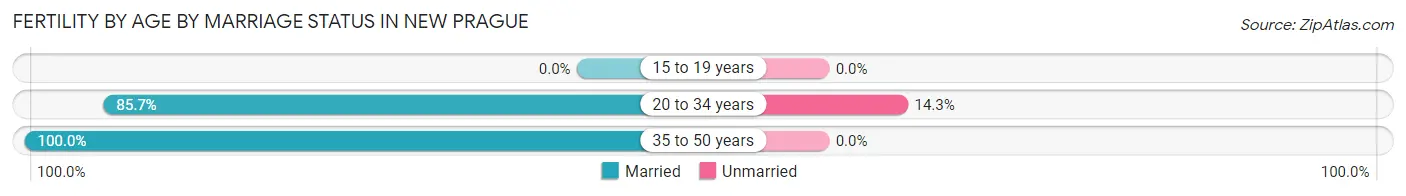
| Age Bracket | Married | Unmarried |
| 15 to 19 years | 0 (0.0%) | 0 (0.0%) |
| 20 to 34 years | 60 (85.7%) | 10 (14.3%) |
| 35 to 50 years | 18 (100.0%) | 0 (0.0%) |
| Total | 78 (88.6%) | 10 (11.4%) |
Fertility by Education in New Prague
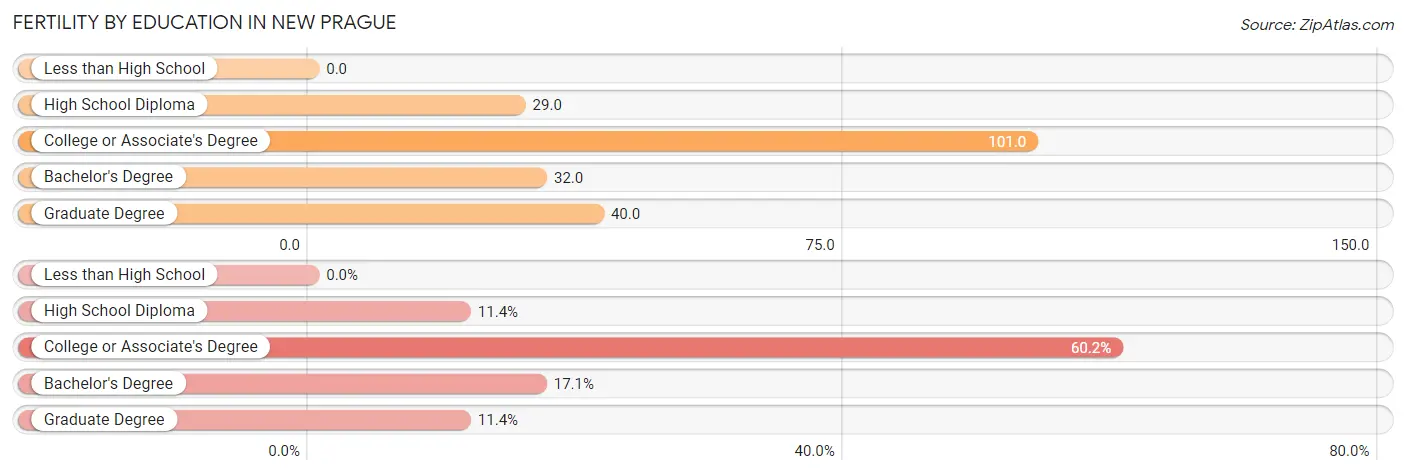
| Educational Attainment | Women with Births | Births / 1,000 Women |
| Less than High School | 0 (0.0%) | 0.0 |
| High School Diploma | 10 (11.4%) | 29.0 |
| College or Associate's Degree | 53 (60.2%) | 101.0 |
| Bachelor's Degree | 15 (17.1%) | 32.0 |
| Graduate Degree | 10 (11.4%) | 40.0 |
| Total | 88 (100.0%) | 48.0 |
Fertility by Education by Marriage Status in New Prague
11.4% of women with births in New Prague are unmarried. Women with the educational attainment of college or associate's degree are most likely to be married with 100.0% of them married at childbirth, while women with the educational attainment of high school diploma are least likely to be married with 100.0% of them unmarried at childbirth.
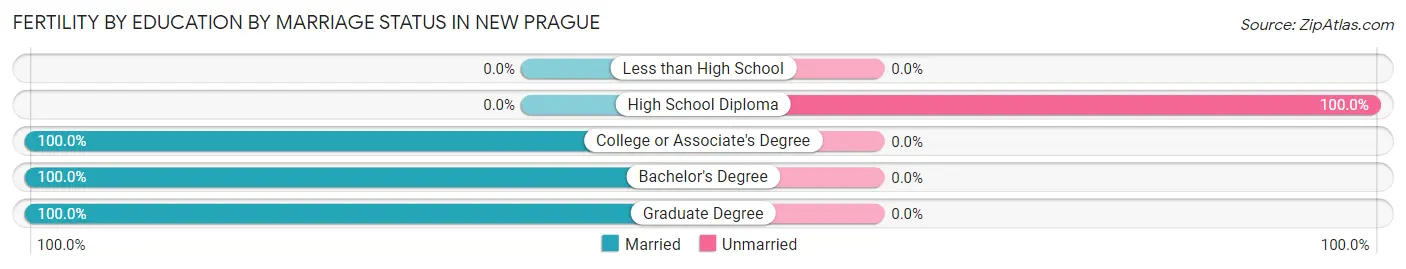
| Educational Attainment | Married | Unmarried |
| Less than High School | 0 (0.0%) | 0 (0.0%) |
| High School Diploma | 0 (0.0%) | 10 (100.0%) |
| College or Associate's Degree | 53 (100.0%) | 0 (0.0%) |
| Bachelor's Degree | 15 (100.0%) | 0 (0.0%) |
| Graduate Degree | 10 (100.0%) | 0 (0.0%) |
| Total | 78 (88.6%) | 10 (11.4%) |
Employment Characteristics in New Prague
Employment by Class of Employer in New Prague
Among the 3,992 employed individuals in New Prague, private company employees (2,935 | 73.5%), local government employees (452 | 11.3%), and not-for-profit organizations (307 | 7.7%) make up the most common classes of employment.
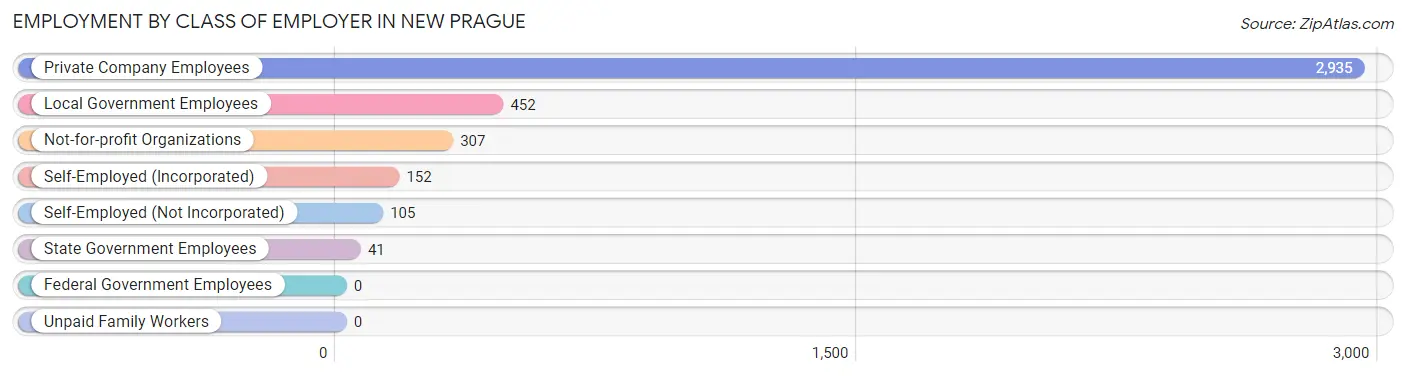
| Employer Class | # Employees | % Employees |
| Private Company Employees | 2,935 | 73.5% |
| Self-Employed (Incorporated) | 152 | 3.8% |
| Self-Employed (Not Incorporated) | 105 | 2.6% |
| Not-for-profit Organizations | 307 | 7.7% |
| Local Government Employees | 452 | 11.3% |
| State Government Employees | 41 | 1.0% |
| Federal Government Employees | 0 | 0.0% |
| Unpaid Family Workers | 0 | 0.0% |
| Total | 3,992 | 100.0% |
Employment Status by Age in New Prague
According to the labor force statistics for New Prague, out of the total population over 16 years of age (5,936), 70.6% or 4,191 individuals are in the labor force, with 3.6% or 151 of them unemployed. The age group with the highest labor force participation rate is 30 to 34 years, with 95.4% or 479 individuals in the labor force. Within the labor force, the 16 to 19 years age range has the highest percentage of unemployed individuals, with 19.1% or 48 of them being unemployed.
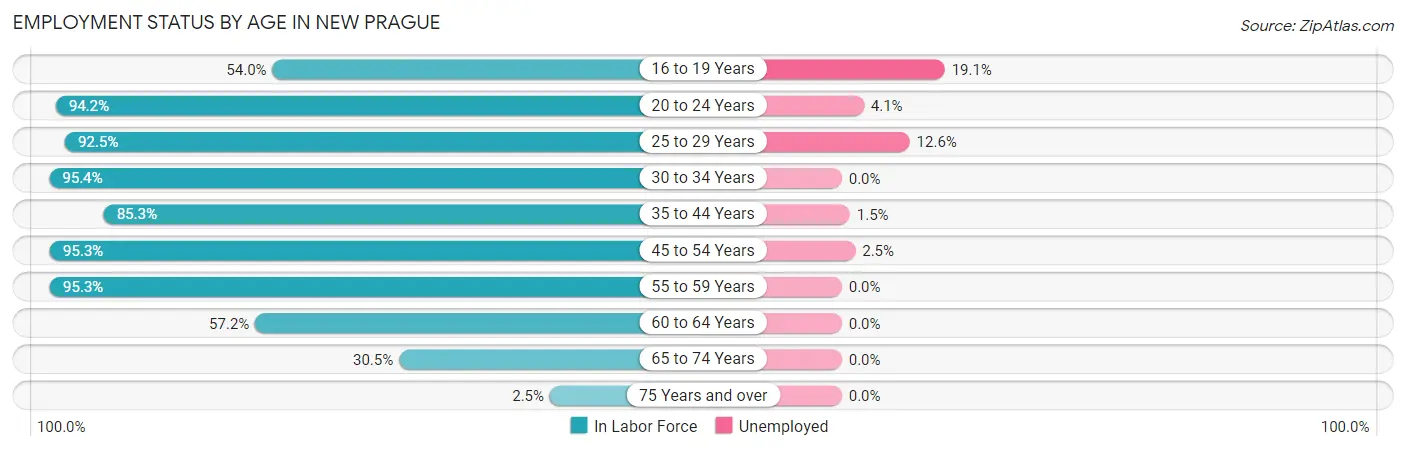
| Age Bracket | In Labor Force | Unemployed |
| 16 to 19 Years | 251 (54.0%) | 48 (19.1%) |
| 20 to 24 Years | 439 (94.2%) | 18 (4.1%) |
| 25 to 29 Years | 372 (92.5%) | 47 (12.6%) |
| 30 to 34 Years | 479 (95.4%) | 0 (0.0%) |
| 35 to 44 Years | 1,088 (85.3%) | 16 (1.5%) |
| 45 to 54 Years | 883 (95.3%) | 22 (2.5%) |
| 55 to 59 Years | 323 (95.3%) | 0 (0.0%) |
| 60 to 64 Years | 186 (57.2%) | 0 (0.0%) |
| 65 to 74 Years | 149 (30.5%) | 0 (0.0%) |
| 75 Years and over | 19 (2.5%) | 0 (0.0%) |
| Total | 4,191 (70.6%) | 151 (3.6%) |
Employment Status by Educational Attainment in New Prague
According to labor force statistics for New Prague, 88.4% of individuals (3,334) out of the total population between 25 and 64 years of age (3,771) are in the labor force, with 2.6% or 87 of them being unemployed. The group with the highest labor force participation rate are those with the educational attainment of bachelor's degree or higher, with 96.6% or 1,328 individuals in the labor force. Within the labor force, individuals with bachelor's degree or higher education have the highest percentage of unemployment, with 2.9% or 39 of them being unemployed.
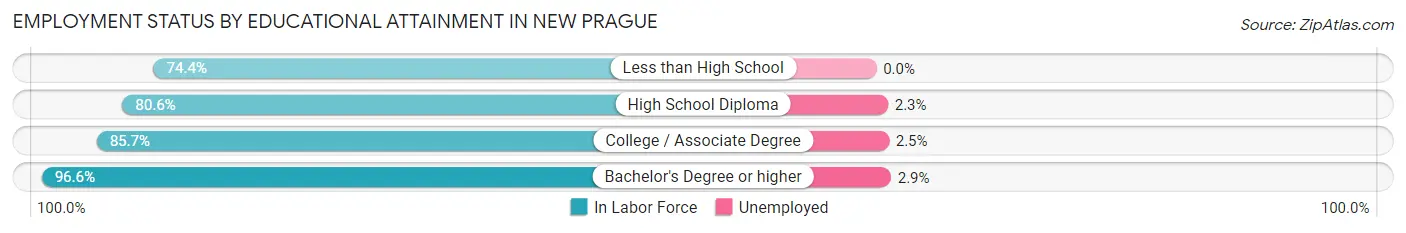
| Educational Attainment | In Labor Force | Unemployed |
| Less than High School | 93 (74.4%) | 0 (0.0%) |
| High School Diploma | 566 (80.6%) | 16 (2.3%) |
| College / Associate Degree | 1,345 (85.7%) | 39 (2.5%) |
| Bachelor's Degree or higher | 1,328 (96.6%) | 40 (2.9%) |
| Total | 3,334 (88.4%) | 98 (2.6%) |
Employment Occupations by Sex in New Prague
Management, Business, Science and Arts Occupations
The most common Management, Business, Science and Arts occupations in New Prague are Management (653 | 16.2%), Community & Social Service (407 | 10.1%), Education Instruction & Library (315 | 7.8%), Health Diagnosing & Treating (299 | 7.4%), and Business & Financial (224 | 5.6%).
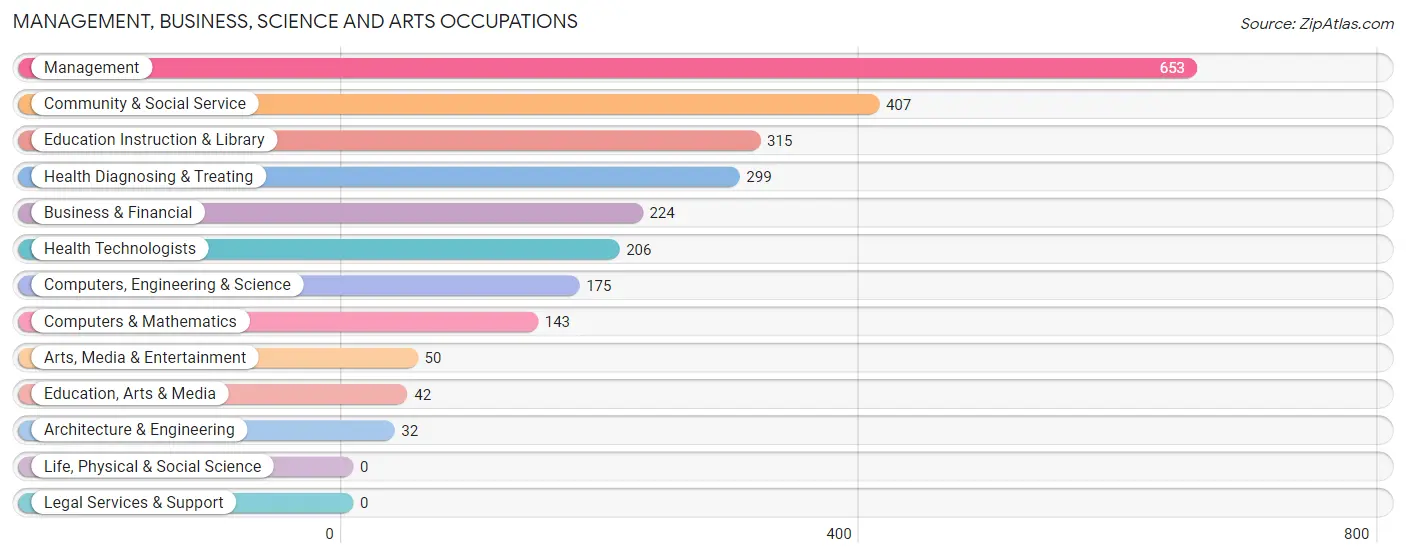
Management, Business, Science and Arts Occupations by Sex
Within the Management, Business, Science and Arts occupations in New Prague, the most male-oriented occupations are Architecture & Engineering (100.0%), Computers, Engineering & Science (90.9%), and Computers & Mathematics (88.8%), while the most female-oriented occupations are Education, Arts & Media (100.0%), Education Instruction & Library (85.4%), and Community & Social Service (82.1%).
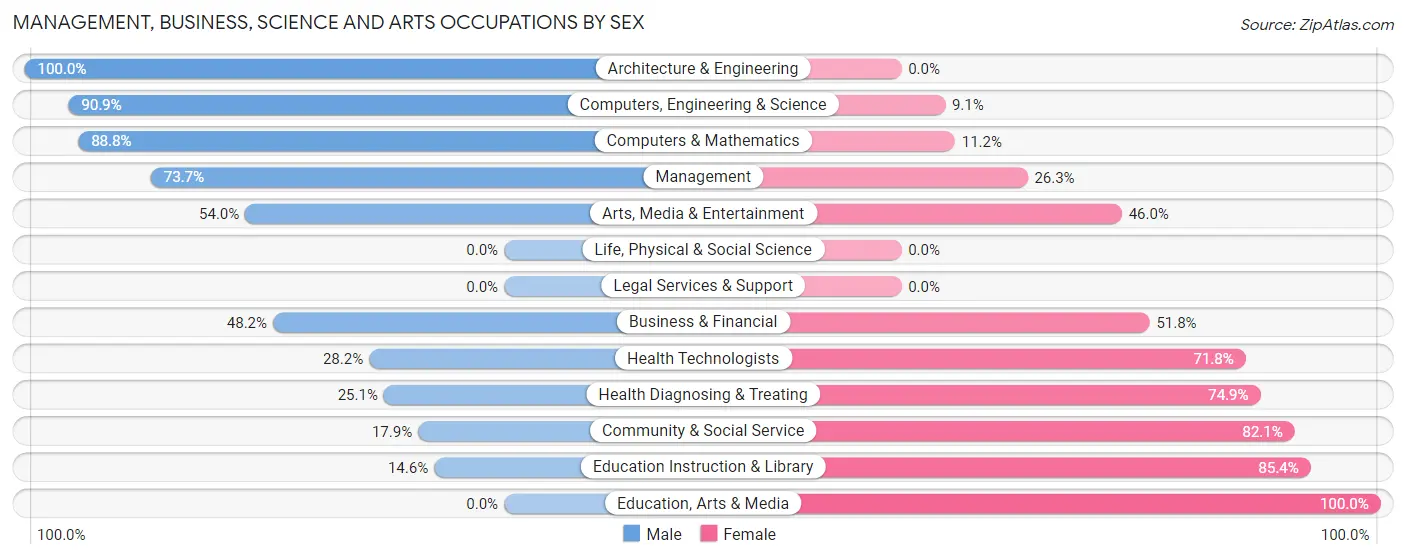
| Occupation | Male | Female |
| Management | 481 (73.7%) | 172 (26.3%) |
| Business & Financial | 108 (48.2%) | 116 (51.8%) |
| Computers, Engineering & Science | 159 (90.9%) | 16 (9.1%) |
| Computers & Mathematics | 127 (88.8%) | 16 (11.2%) |
| Architecture & Engineering | 32 (100.0%) | 0 (0.0%) |
| Life, Physical & Social Science | 0 (0.0%) | 0 (0.0%) |
| Community & Social Service | 73 (17.9%) | 334 (82.1%) |
| Education, Arts & Media | 0 (0.0%) | 42 (100.0%) |
| Legal Services & Support | 0 (0.0%) | 0 (0.0%) |
| Education Instruction & Library | 46 (14.6%) | 269 (85.4%) |
| Arts, Media & Entertainment | 27 (54.0%) | 23 (46.0%) |
| Health Diagnosing & Treating | 75 (25.1%) | 224 (74.9%) |
| Health Technologists | 58 (28.2%) | 148 (71.8%) |
| Total (Category) | 896 (51.0%) | 862 (49.0%) |
| Total (Overall) | 2,163 (53.5%) | 1,876 (46.5%) |
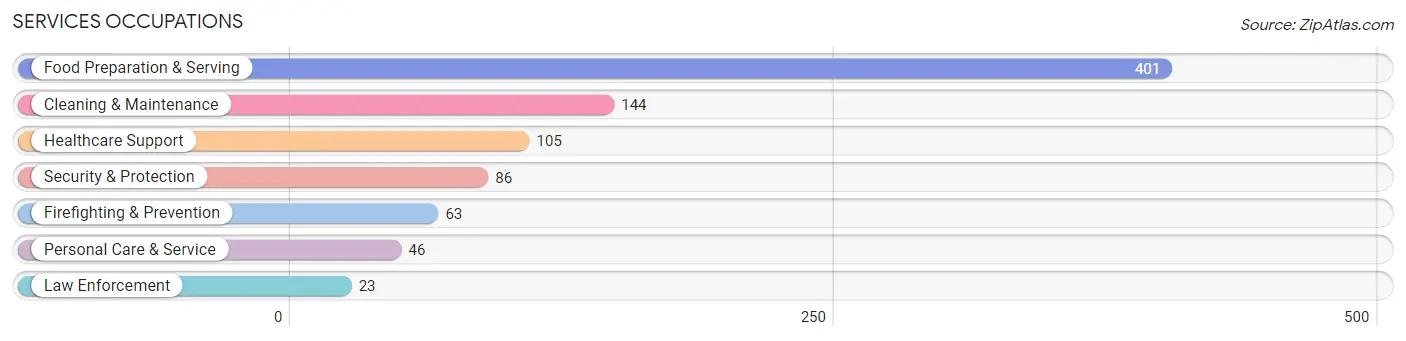
Services Occupations
The most common Services occupations in New Prague are Food Preparation & Serving (401 | 9.9%), Cleaning & Maintenance (144 | 3.6%), Healthcare Support (105 | 2.6%), Security & Protection (86 | 2.1%), and Firefighting & Prevention (63 | 1.6%).
Services Occupations by Sex
Within the Services occupations in New Prague, the most male-oriented occupations are Security & Protection (100.0%), Firefighting & Prevention (100.0%), and Law Enforcement (100.0%), while the most female-oriented occupations are Healthcare Support (100.0%), Food Preparation & Serving (69.3%), and Personal Care & Service (67.4%).
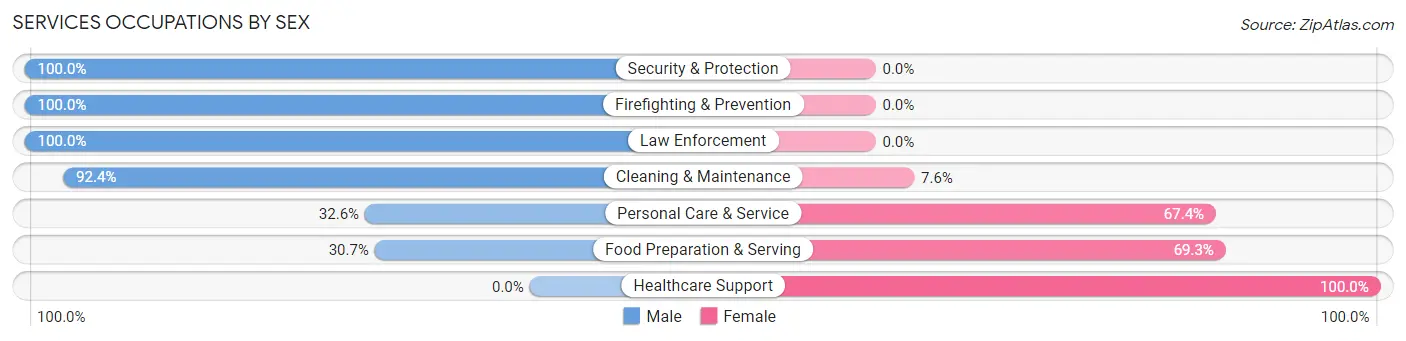
| Occupation | Male | Female |
| Healthcare Support | 0 (0.0%) | 105 (100.0%) |
| Security & Protection | 86 (100.0%) | 0 (0.0%) |
| Firefighting & Prevention | 63 (100.0%) | 0 (0.0%) |
| Law Enforcement | 23 (100.0%) | 0 (0.0%) |
| Food Preparation & Serving | 123 (30.7%) | 278 (69.3%) |
| Cleaning & Maintenance | 133 (92.4%) | 11 (7.6%) |
| Personal Care & Service | 15 (32.6%) | 31 (67.4%) |
| Total (Category) | 357 (45.7%) | 425 (54.3%) |
| Total (Overall) | 2,163 (53.5%) | 1,876 (46.5%) |
Sales and Office Occupations
The most common Sales and Office occupations in New Prague are Office & Administration (395 | 9.8%), and Sales & Related (359 | 8.9%).

Sales and Office Occupations by Sex

| Occupation | Male | Female |
| Sales & Related | 277 (77.2%) | 82 (22.8%) |
| Office & Administration | 42 (10.6%) | 353 (89.4%) |
| Total (Category) | 319 (42.3%) | 435 (57.7%) |
| Total (Overall) | 2,163 (53.5%) | 1,876 (46.5%) |
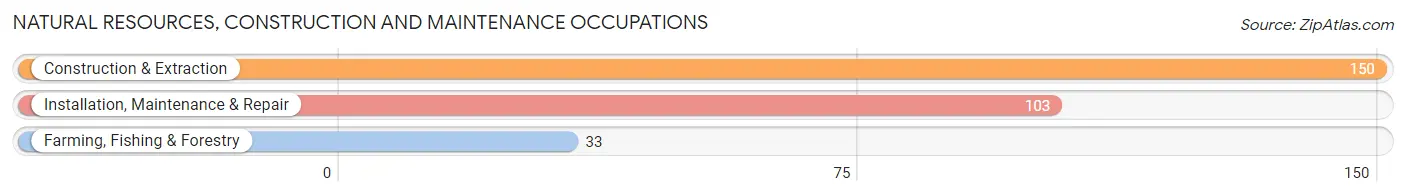
Natural Resources, Construction and Maintenance Occupations
The most common Natural Resources, Construction and Maintenance occupations in New Prague are Construction & Extraction (150 | 3.7%), Installation, Maintenance & Repair (103 | 2.5%), and Farming, Fishing & Forestry (33 | 0.8%).
Natural Resources, Construction and Maintenance Occupations by Sex
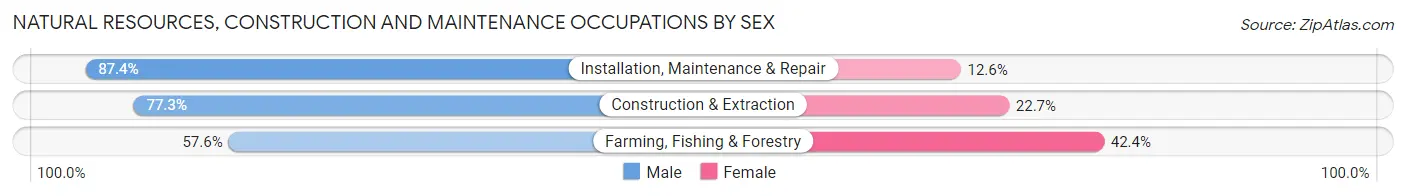
| Occupation | Male | Female |
| Farming, Fishing & Forestry | 19 (57.6%) | 14 (42.4%) |
| Construction & Extraction | 116 (77.3%) | 34 (22.7%) |
| Installation, Maintenance & Repair | 90 (87.4%) | 13 (12.6%) |
| Total (Category) | 225 (78.7%) | 61 (21.3%) |
| Total (Overall) | 2,163 (53.5%) | 1,876 (46.5%) |
Production, Transportation and Moving Occupations
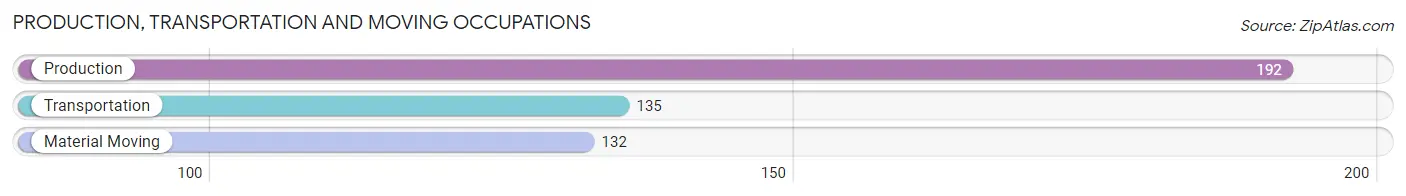
The most common Production, Transportation and Moving occupations in New Prague are Production (192 | 4.8%), Transportation (135 | 3.3%), and Material Moving (132 | 3.3%).
Production, Transportation and Moving Occupations by Sex
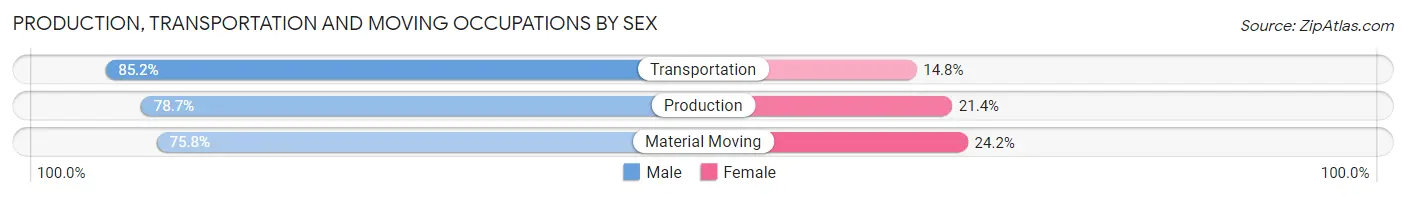
| Occupation | Male | Female |
| Production | 151 (78.6%) | 41 (21.3%) |
| Transportation | 115 (85.2%) | 20 (14.8%) |
| Material Moving | 100 (75.8%) | 32 (24.2%) |
| Total (Category) | 366 (79.7%) | 93 (20.3%) |
| Total (Overall) | 2,163 (53.5%) | 1,876 (46.5%) |
Employment Industries by Sex in New Prague
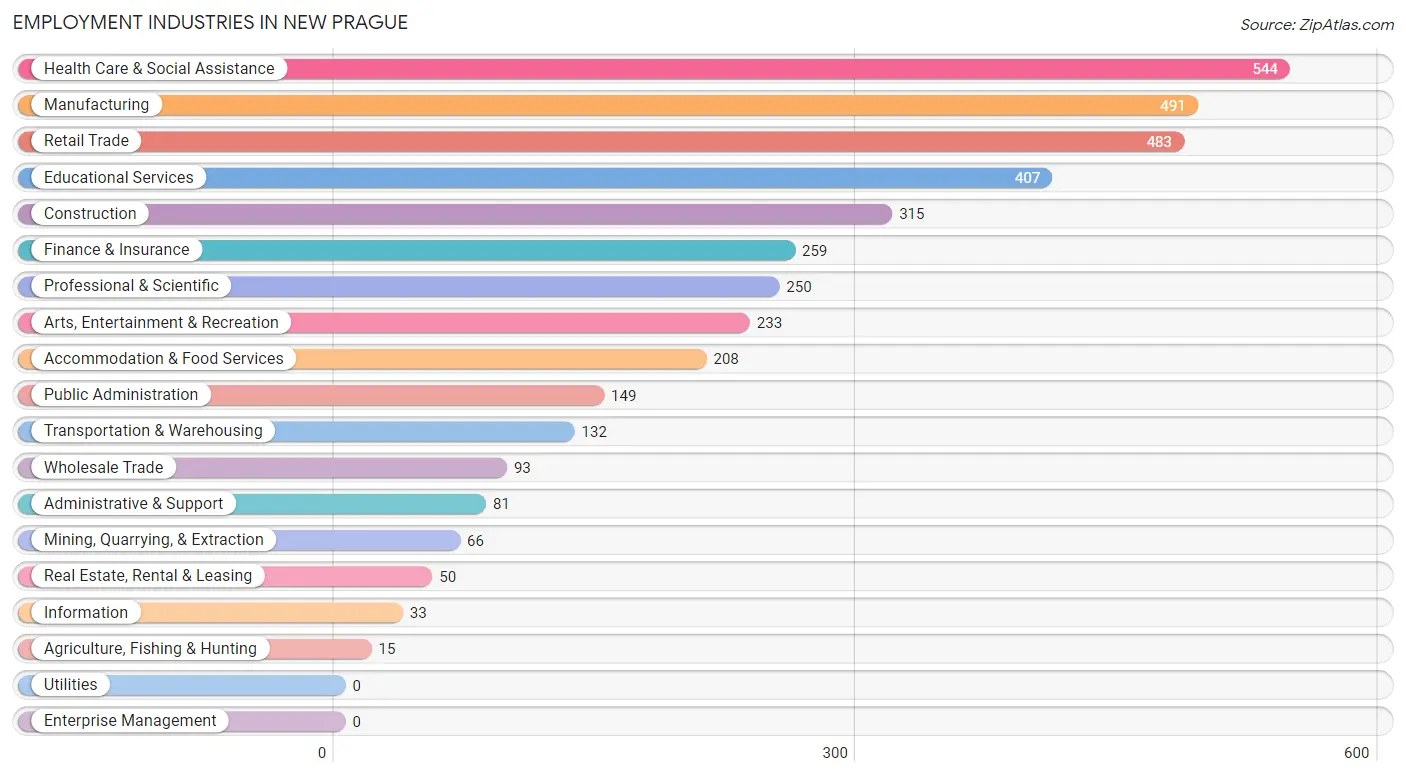
Employment Industries in New Prague
The major employment industries in New Prague include Health Care & Social Assistance (544 | 13.5%), Manufacturing (491 | 12.2%), Retail Trade (483 | 12.0%), Educational Services (407 | 10.1%), and Construction (315 | 7.8%).
Employment Industries by Sex in New Prague
The New Prague industries that see more men than women are Agriculture, Fishing & Hunting (100.0%), Mining, Quarrying, & Extraction (100.0%), and Transportation & Warehousing (96.2%), whereas the industries that tend to have a higher number of women are Educational Services (84.5%), Health Care & Social Assistance (80.3%), and Arts, Entertainment & Recreation (74.3%).
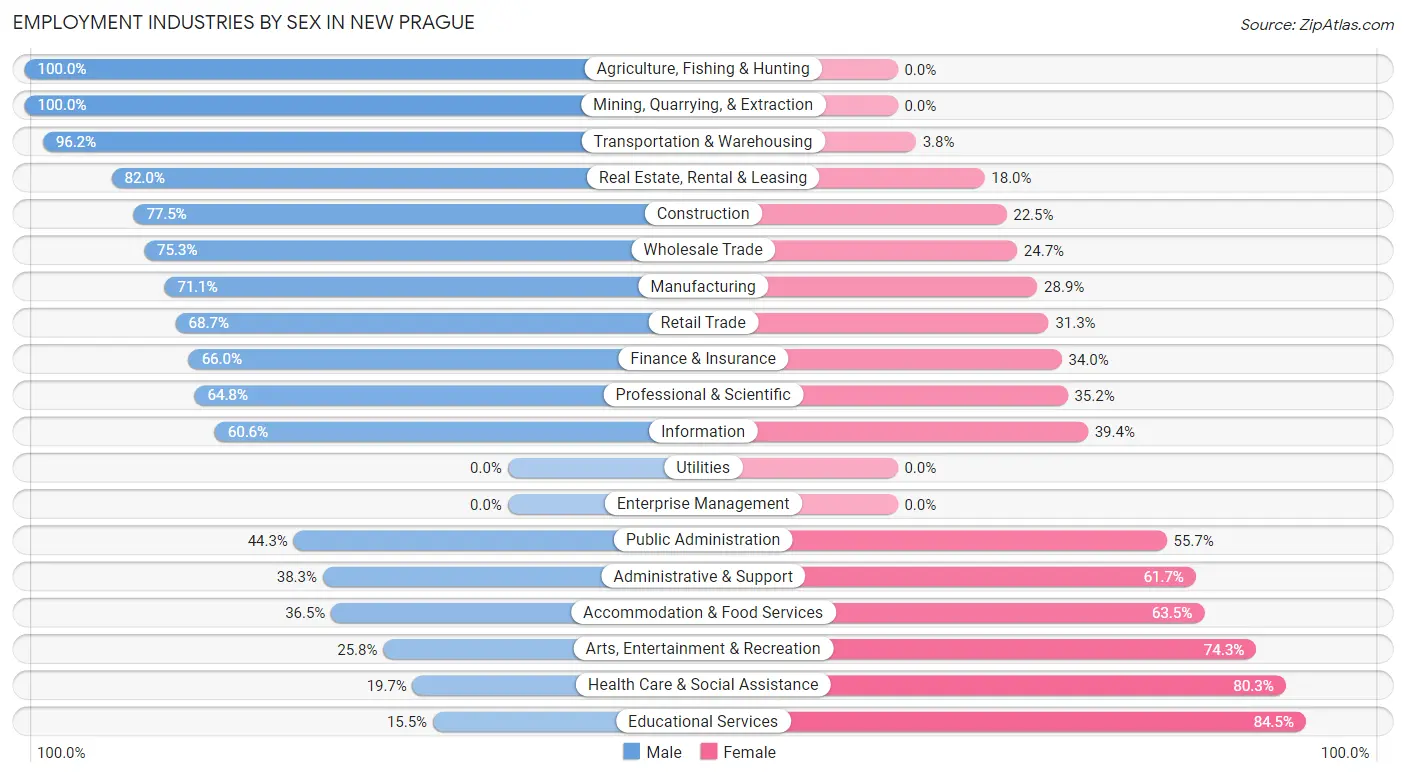
| Industry | Male | Female |
| Agriculture, Fishing & Hunting | 15 (100.0%) | 0 (0.0%) |
| Mining, Quarrying, & Extraction | 66 (100.0%) | 0 (0.0%) |
| Construction | 244 (77.5%) | 71 (22.5%) |
| Manufacturing | 349 (71.1%) | 142 (28.9%) |
| Wholesale Trade | 70 (75.3%) | 23 (24.7%) |
| Retail Trade | 332 (68.7%) | 151 (31.3%) |
| Transportation & Warehousing | 127 (96.2%) | 5 (3.8%) |
| Utilities | 0 (0.0%) | 0 (0.0%) |
| Information | 20 (60.6%) | 13 (39.4%) |
| Finance & Insurance | 171 (66.0%) | 88 (34.0%) |
| Real Estate, Rental & Leasing | 41 (82.0%) | 9 (18.0%) |
| Professional & Scientific | 162 (64.8%) | 88 (35.2%) |
| Enterprise Management | 0 (0.0%) | 0 (0.0%) |
| Administrative & Support | 31 (38.3%) | 50 (61.7%) |
| Educational Services | 63 (15.5%) | 344 (84.5%) |
| Health Care & Social Assistance | 107 (19.7%) | 437 (80.3%) |
| Arts, Entertainment & Recreation | 60 (25.8%) | 173 (74.3%) |
| Accommodation & Food Services | 76 (36.5%) | 132 (63.5%) |
| Public Administration | 66 (44.3%) | 83 (55.7%) |
| Total | 2,163 (53.5%) | 1,876 (46.5%) |
Education in New Prague
School Enrollment in New Prague
The most common levels of schooling among the 2,339 students in New Prague are elementary school (620 | 26.5%), middle school (600 | 25.7%), and high school (522 | 22.3%).
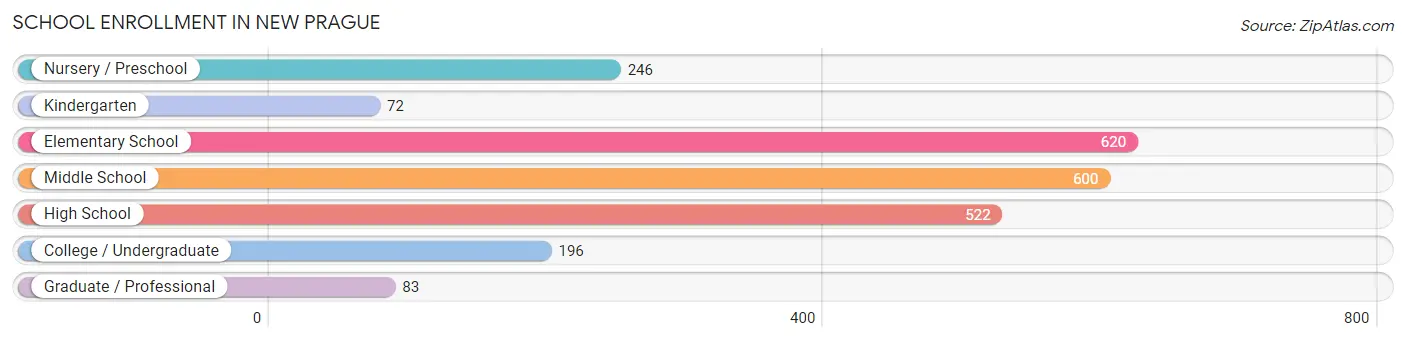
| School Level | # Students | % Students |
| Nursery / Preschool | 246 | 10.5% |
| Kindergarten | 72 | 3.1% |
| Elementary School | 620 | 26.5% |
| Middle School | 600 | 25.7% |
| High School | 522 | 22.3% |
| College / Undergraduate | 196 | 8.4% |
| Graduate / Professional | 83 | 3.5% |
| Total | 2,339 | 100.0% |
School Enrollment by Age by Funding Source in New Prague
Out of a total of 2,339 students who are enrolled in schools in New Prague, 105 (4.5%) attend a private institution, while the remaining 2,234 (95.5%) are enrolled in public schools. The age group of 25 to 34 year olds has the highest likelihood of being enrolled in private schools, with 10 (100.0% in the age bracket) enrolled. Conversely, the age group of 3 to 4 year olds has the lowest likelihood of being enrolled in a private school, with 166 (100.0% in the age bracket) attending a public institution.
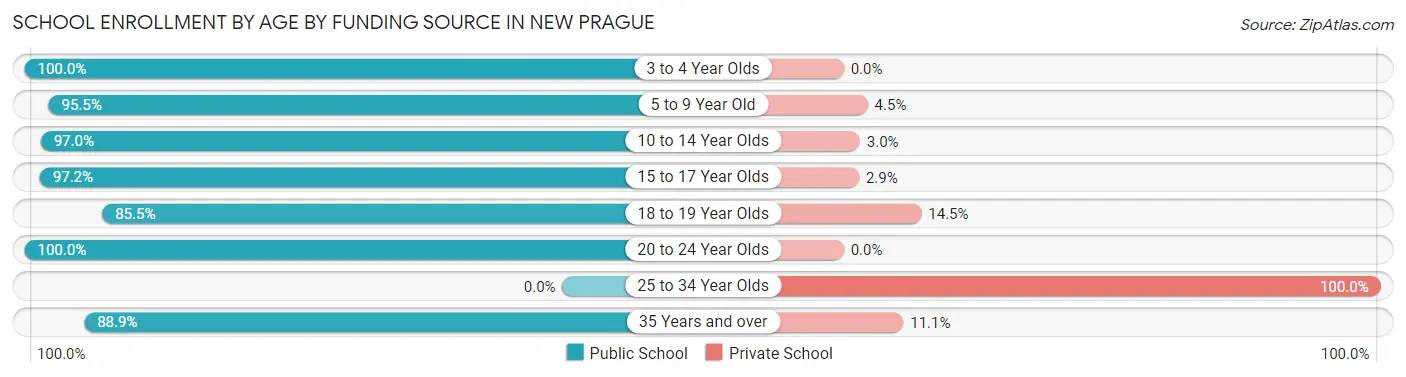
| Age Bracket | Public School | Private School |
| 3 to 4 Year Olds | 166 (100.0%) | 0 (0.0%) |
| 5 to 9 Year Old | 491 (95.5%) | 23 (4.5%) |
| 10 to 14 Year Olds | 933 (97.0%) | 29 (3.0%) |
| 15 to 17 Year Olds | 273 (97.2%) | 8 (2.9%) |
| 18 to 19 Year Olds | 136 (85.5%) | 23 (14.5%) |
| 20 to 24 Year Olds | 139 (100.0%) | 0 (0.0%) |
| 25 to 34 Year Olds | 0 (0.0%) | 10 (100.0%) |
| 35 Years and over | 96 (88.9%) | 12 (11.1%) |
| Total | 2,234 (95.5%) | 105 (4.5%) |
Educational Attainment by Field of Study in New Prague
Education (359 | 21.8%), business (356 | 21.7%), science & technology (213 | 13.0%), arts & humanities (145 | 8.8%), and computers & mathematics (125 | 7.6%) are the most common fields of study among 1,643 individuals in New Prague who have obtained a bachelor's degree or higher.
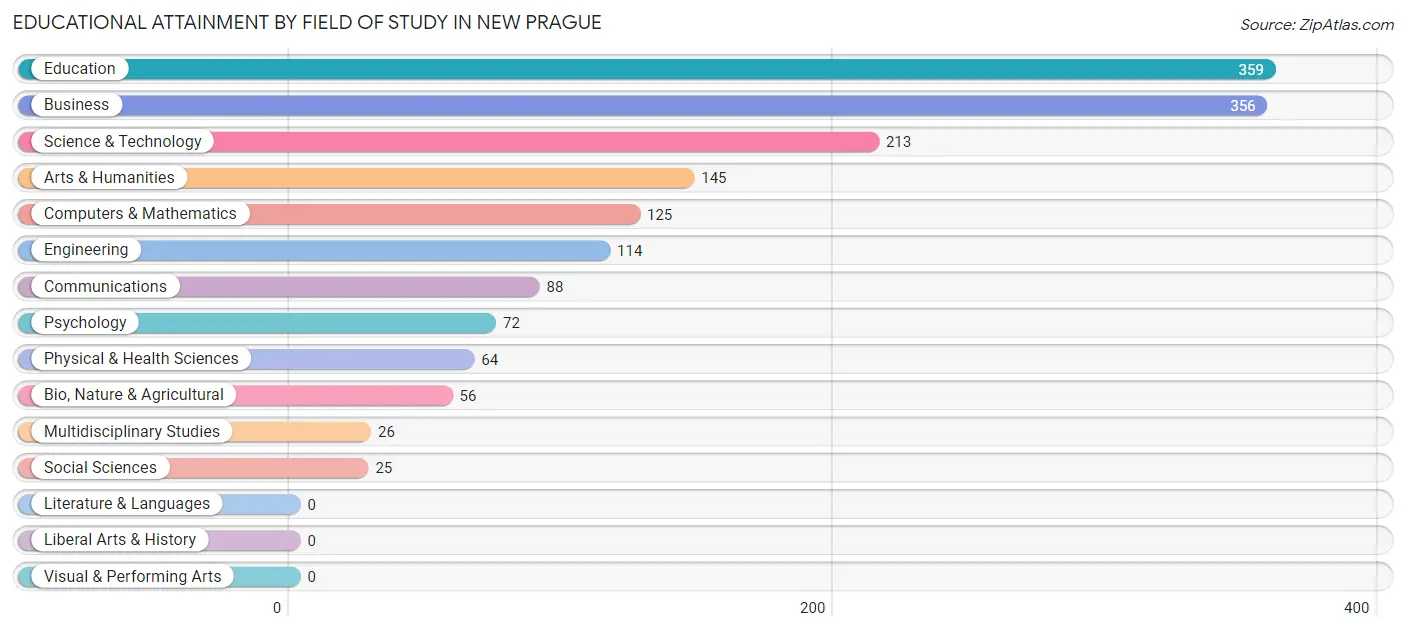
| Field of Study | # Graduates | % Graduates |
| Computers & Mathematics | 125 | 7.6% |
| Bio, Nature & Agricultural | 56 | 3.4% |
| Physical & Health Sciences | 64 | 3.9% |
| Psychology | 72 | 4.4% |
| Social Sciences | 25 | 1.5% |
| Engineering | 114 | 6.9% |
| Multidisciplinary Studies | 26 | 1.6% |
| Science & Technology | 213 | 13.0% |
| Business | 356 | 21.7% |
| Education | 359 | 21.8% |
| Literature & Languages | 0 | 0.0% |
| Liberal Arts & History | 0 | 0.0% |
| Visual & Performing Arts | 0 | 0.0% |
| Communications | 88 | 5.4% |
| Arts & Humanities | 145 | 8.8% |
| Total | 1,643 | 100.0% |
Transportation & Commute in New Prague
Vehicle Availability by Sex in New Prague
The most prevalent vehicle ownership categories in New Prague are males with 2 vehicles (990, accounting for 46.4%) and females with 2 vehicles (775, making up 53.3%).
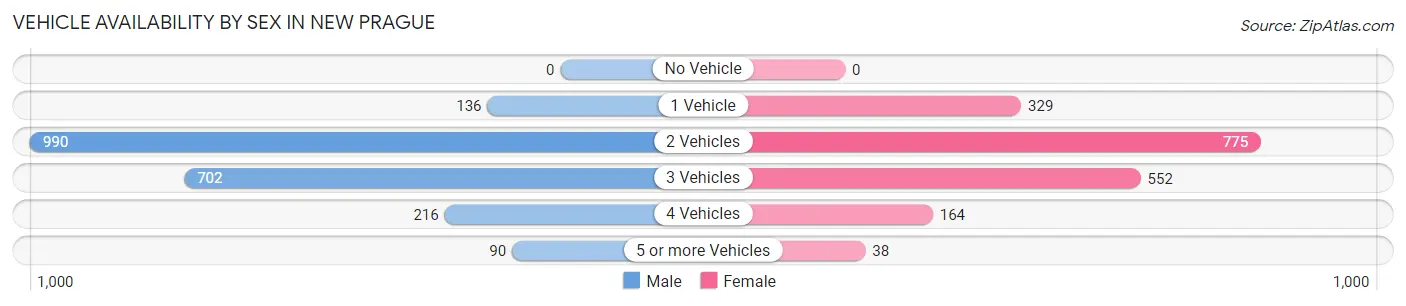
| Vehicles Available | Male | Female |
| No Vehicle | 0 (0.0%) | 0 (0.0%) |
| 1 Vehicle | 136 (6.4%) | 329 (17.7%) |
| 2 Vehicles | 990 (46.4%) | 775 (41.7%) |
| 3 Vehicles | 702 (32.9%) | 552 (29.7%) |
| 4 Vehicles | 216 (10.1%) | 164 (8.8%) |
| 5 or more Vehicles | 90 (4.2%) | 38 (2.1%) |
| Total | 2,134 (100.0%) | 1,858 (100.0%) |
Commute Time in New Prague
The most frequently occuring commute durations in New Prague are 5 to 9 minutes (766 commuters, 21.1%), 45 to 59 minutes (523 commuters, 14.4%), and 30 to 34 minutes (497 commuters, 13.7%).
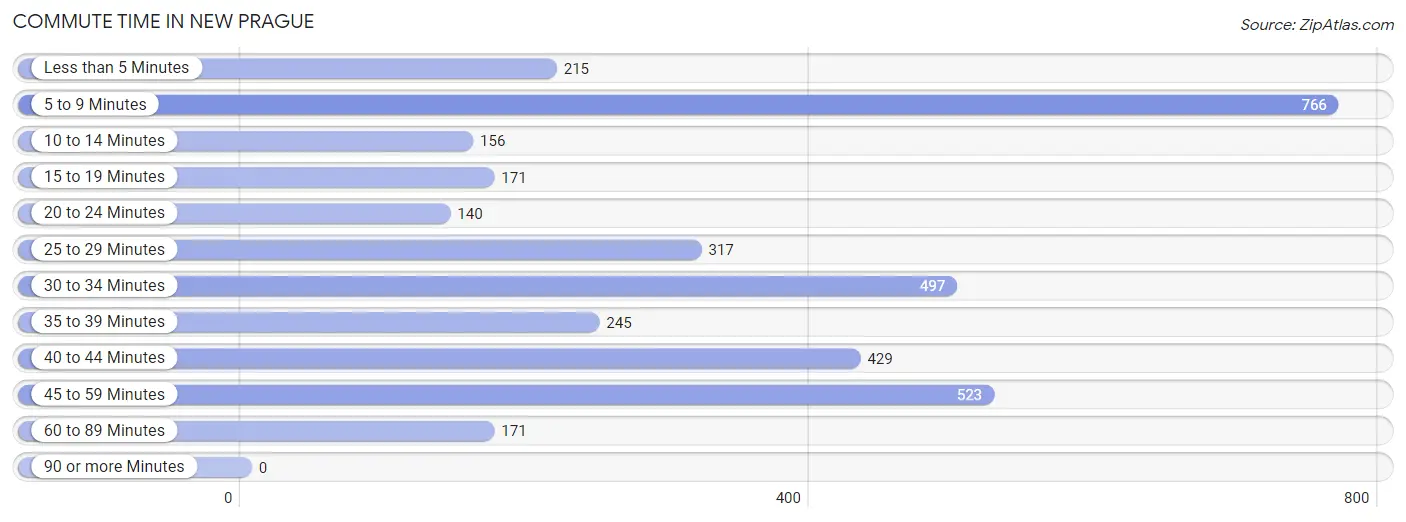
| Commute Time | # Commuters | % Commuters |
| Less than 5 Minutes | 215 | 5.9% |
| 5 to 9 Minutes | 766 | 21.1% |
| 10 to 14 Minutes | 156 | 4.3% |
| 15 to 19 Minutes | 171 | 4.7% |
| 20 to 24 Minutes | 140 | 3.9% |
| 25 to 29 Minutes | 317 | 8.7% |
| 30 to 34 Minutes | 497 | 13.7% |
| 35 to 39 Minutes | 245 | 6.8% |
| 40 to 44 Minutes | 429 | 11.8% |
| 45 to 59 Minutes | 523 | 14.4% |
| 60 to 89 Minutes | 171 | 4.7% |
| 90 or more Minutes | 0 | 0.0% |
Commute Time by Sex in New Prague
The most common commute times in New Prague are 30 to 34 minutes (343 commuters, 17.8%) for males and 5 to 9 minutes (531 commuters, 31.2%) for females.
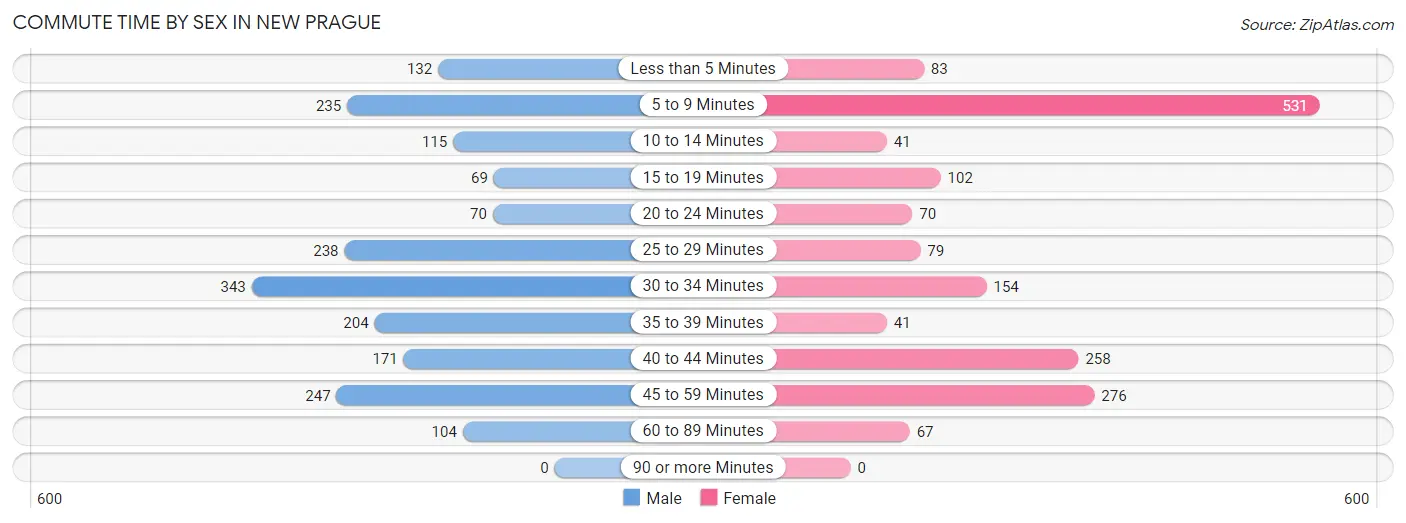
| Commute Time | Male | Female |
| Less than 5 Minutes | 132 (6.9%) | 83 (4.9%) |
| 5 to 9 Minutes | 235 (12.2%) | 531 (31.2%) |
| 10 to 14 Minutes | 115 (6.0%) | 41 (2.4%) |
| 15 to 19 Minutes | 69 (3.6%) | 102 (6.0%) |
| 20 to 24 Minutes | 70 (3.6%) | 70 (4.1%) |
| 25 to 29 Minutes | 238 (12.3%) | 79 (4.6%) |
| 30 to 34 Minutes | 343 (17.8%) | 154 (9.0%) |
| 35 to 39 Minutes | 204 (10.6%) | 41 (2.4%) |
| 40 to 44 Minutes | 171 (8.9%) | 258 (15.2%) |
| 45 to 59 Minutes | 247 (12.8%) | 276 (16.2%) |
| 60 to 89 Minutes | 104 (5.4%) | 67 (3.9%) |
| 90 or more Minutes | 0 (0.0%) | 0 (0.0%) |
Time of Departure to Work by Sex in New Prague
The most frequent times of departure to work in New Prague are 6:30 AM to 6:59 AM (329, 17.1%) for males and 7:30 AM to 7:59 AM (379, 22.3%) for females.
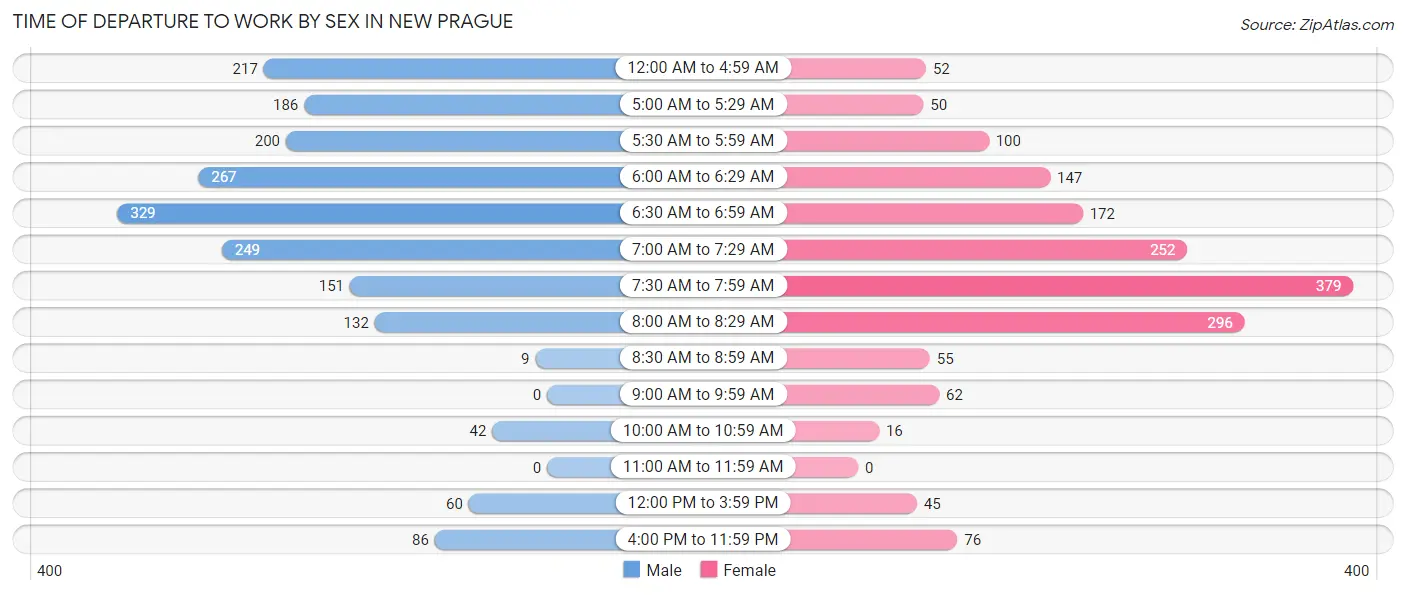
| Time of Departure | Male | Female |
| 12:00 AM to 4:59 AM | 217 (11.3%) | 52 (3.1%) |
| 5:00 AM to 5:29 AM | 186 (9.7%) | 50 (2.9%) |
| 5:30 AM to 5:59 AM | 200 (10.4%) | 100 (5.9%) |
| 6:00 AM to 6:29 AM | 267 (13.9%) | 147 (8.6%) |
| 6:30 AM to 6:59 AM | 329 (17.1%) | 172 (10.1%) |
| 7:00 AM to 7:29 AM | 249 (12.9%) | 252 (14.8%) |
| 7:30 AM to 7:59 AM | 151 (7.8%) | 379 (22.3%) |
| 8:00 AM to 8:29 AM | 132 (6.9%) | 296 (17.4%) |
| 8:30 AM to 8:59 AM | 9 (0.5%) | 55 (3.2%) |
| 9:00 AM to 9:59 AM | 0 (0.0%) | 62 (3.6%) |
| 10:00 AM to 10:59 AM | 42 (2.2%) | 16 (0.9%) |
| 11:00 AM to 11:59 AM | 0 (0.0%) | 0 (0.0%) |
| 12:00 PM to 3:59 PM | 60 (3.1%) | 45 (2.6%) |
| 4:00 PM to 11:59 PM | 86 (4.5%) | 76 (4.5%) |
| Total | 1,928 (100.0%) | 1,702 (100.0%) |
Housing Occupancy in New Prague
Occupancy by Ownership in New Prague
Of the total 2,822 dwellings in New Prague, owner-occupied units account for 2,328 (82.5%), while renter-occupied units make up 494 (17.5%).
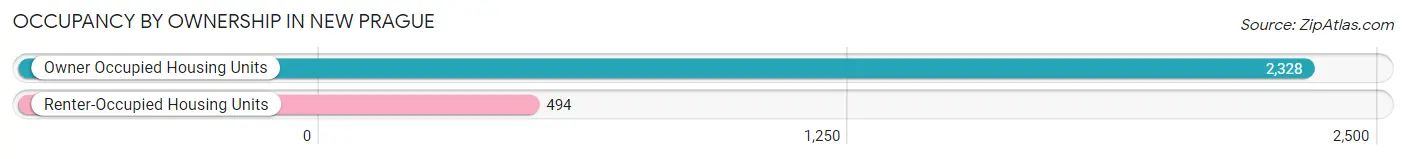
| Occupancy | # Housing Units | % Housing Units |
| Owner Occupied Housing Units | 2,328 | 82.5% |
| Renter-Occupied Housing Units | 494 | 17.5% |
| Total Occupied Housing Units | 2,822 | 100.0% |
Occupancy by Household Size in New Prague
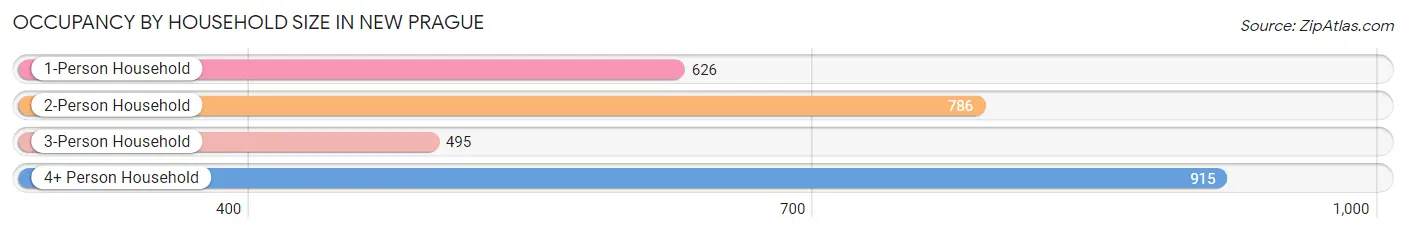
| Household Size | # Housing Units | % Housing Units |
| 1-Person Household | 626 | 22.2% |
| 2-Person Household | 786 | 27.9% |
| 3-Person Household | 495 | 17.5% |
| 4+ Person Household | 915 | 32.4% |
| Total Housing Units | 2,822 | 100.0% |
Occupancy by Ownership by Household Size in New Prague
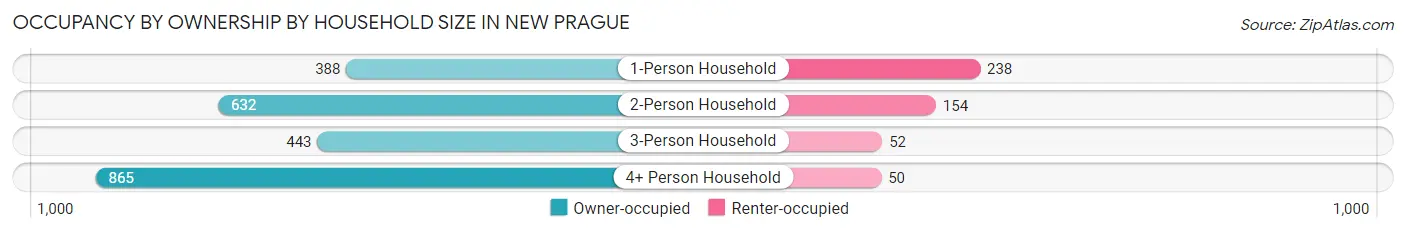
| Household Size | Owner-occupied | Renter-occupied |
| 1-Person Household | 388 (62.0%) | 238 (38.0%) |
| 2-Person Household | 632 (80.4%) | 154 (19.6%) |
| 3-Person Household | 443 (89.5%) | 52 (10.5%) |
| 4+ Person Household | 865 (94.5%) | 50 (5.5%) |
| Total Housing Units | 2,328 (82.5%) | 494 (17.5%) |
Occupancy by Educational Attainment in New Prague
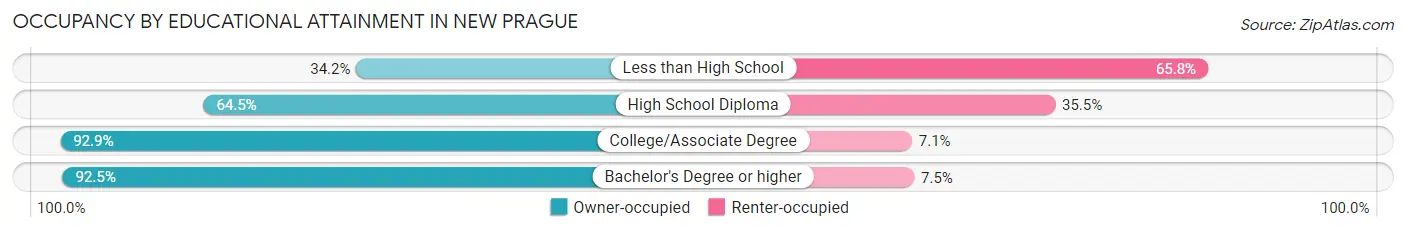
| Household Size | Owner-occupied | Renter-occupied |
| Less than High School | 38 (34.2%) | 73 (65.8%) |
| High School Diploma | 513 (64.5%) | 282 (35.5%) |
| College/Associate Degree | 1,039 (92.9%) | 79 (7.1%) |
| Bachelor's Degree or higher | 738 (92.5%) | 60 (7.5%) |
Occupancy by Age of Householder in New Prague
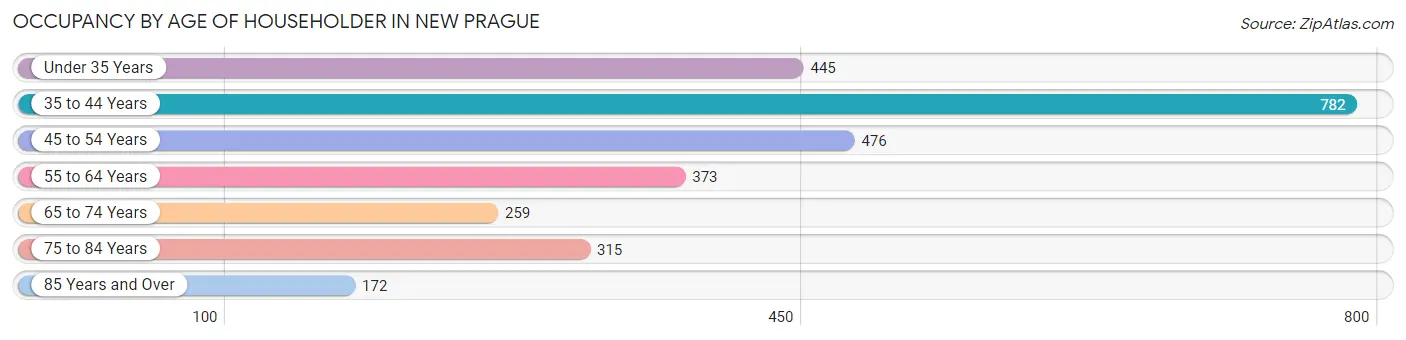
| Age Bracket | # Households | % Households |
| Under 35 Years | 445 | 15.8% |
| 35 to 44 Years | 782 | 27.7% |
| 45 to 54 Years | 476 | 16.9% |
| 55 to 64 Years | 373 | 13.2% |
| 65 to 74 Years | 259 | 9.2% |
| 75 to 84 Years | 315 | 11.2% |
| 85 Years and Over | 172 | 6.1% |
| Total | 2,822 | 100.0% |
Housing Finances in New Prague
Median Income by Occupancy in New Prague
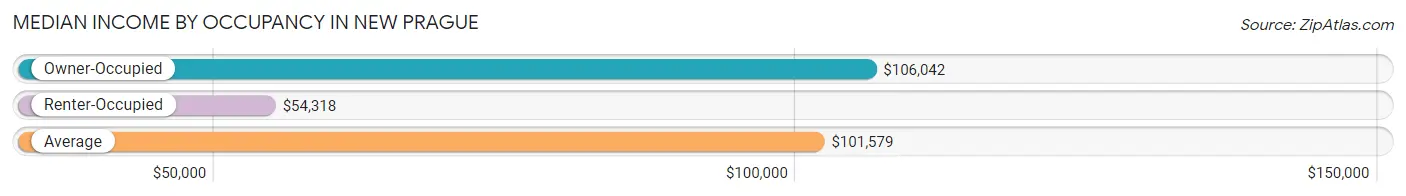
| Occupancy Type | # Households | Median Income |
| Owner-Occupied | 2,328 (82.5%) | $106,042 |
| Renter-Occupied | 494 (17.5%) | $54,318 |
| Average | 2,822 (100.0%) | $101,579 |
Occupancy by Householder Income Bracket in New Prague
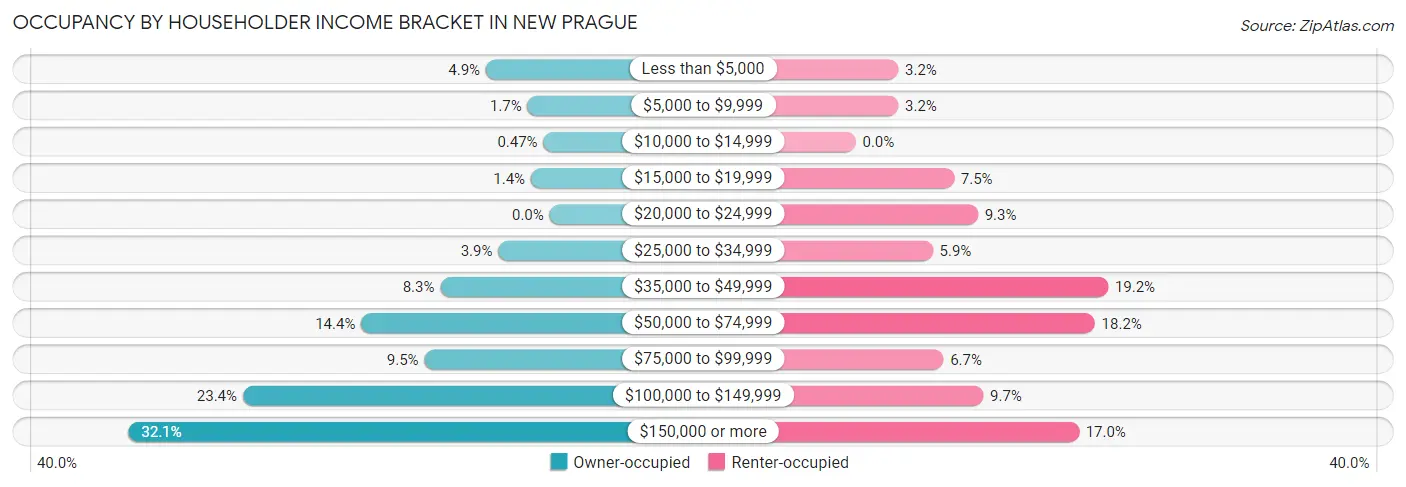
| Income Bracket | Owner-occupied | Renter-occupied |
| Less than $5,000 | 113 (4.9%) | 16 (3.2%) |
| $5,000 to $9,999 | 39 (1.7%) | 16 (3.2%) |
| $10,000 to $14,999 | 11 (0.5%) | 0 (0.0%) |
| $15,000 to $19,999 | 33 (1.4%) | 37 (7.5%) |
| $20,000 to $24,999 | 0 (0.0%) | 46 (9.3%) |
| $25,000 to $34,999 | 91 (3.9%) | 29 (5.9%) |
| $35,000 to $49,999 | 194 (8.3%) | 95 (19.2%) |
| $50,000 to $74,999 | 334 (14.3%) | 90 (18.2%) |
| $75,000 to $99,999 | 222 (9.5%) | 33 (6.7%) |
| $100,000 to $149,999 | 544 (23.4%) | 48 (9.7%) |
| $150,000 or more | 747 (32.1%) | 84 (17.0%) |
| Total | 2,328 (100.0%) | 494 (100.0%) |
Monthly Housing Cost Tiers in New Prague
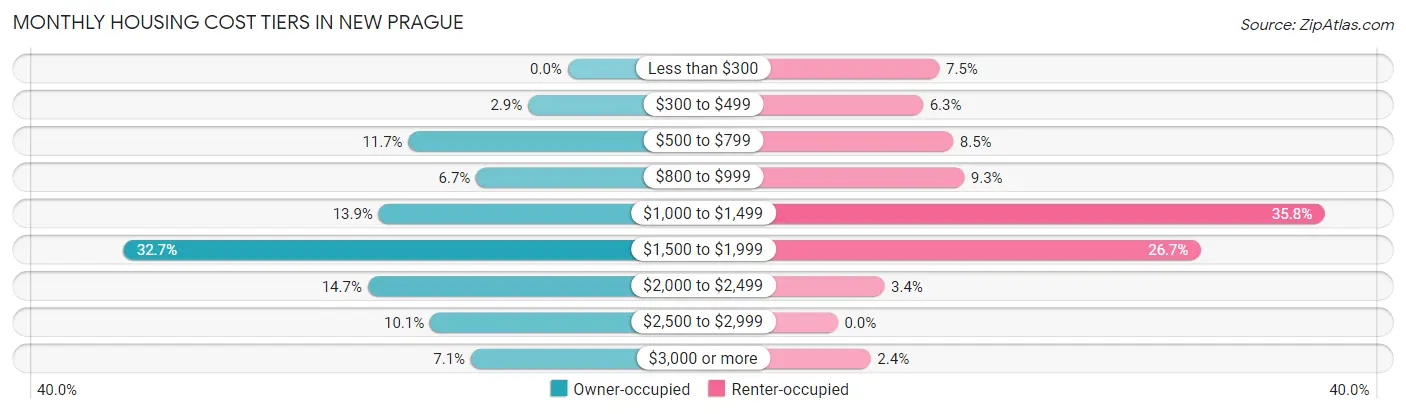
| Monthly Cost | Owner-occupied | Renter-occupied |
| Less than $300 | 0 (0.0%) | 37 (7.5%) |
| $300 to $499 | 68 (2.9%) | 31 (6.3%) |
| $500 to $799 | 273 (11.7%) | 42 (8.5%) |
| $800 to $999 | 157 (6.7%) | 46 (9.3%) |
| $1,000 to $1,499 | 324 (13.9%) | 177 (35.8%) |
| $1,500 to $1,999 | 761 (32.7%) | 132 (26.7%) |
| $2,000 to $2,499 | 343 (14.7%) | 17 (3.4%) |
| $2,500 to $2,999 | 236 (10.1%) | 0 (0.0%) |
| $3,000 or more | 166 (7.1%) | 12 (2.4%) |
| Total | 2,328 (100.0%) | 494 (100.0%) |
Physical Housing Characteristics in New Prague
Housing Structures in New Prague
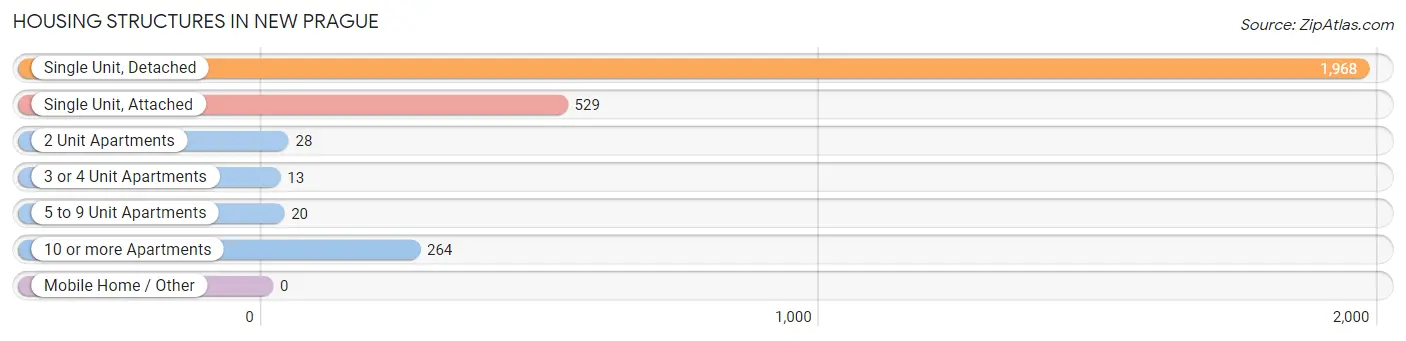
| Structure Type | # Housing Units | % Housing Units |
| Single Unit, Detached | 1,968 | 69.7% |
| Single Unit, Attached | 529 | 18.8% |
| 2 Unit Apartments | 28 | 1.0% |
| 3 or 4 Unit Apartments | 13 | 0.5% |
| 5 to 9 Unit Apartments | 20 | 0.7% |
| 10 or more Apartments | 264 | 9.4% |
| Mobile Home / Other | 0 | 0.0% |
| Total | 2,822 | 100.0% |
Housing Structures by Occupancy in New Prague
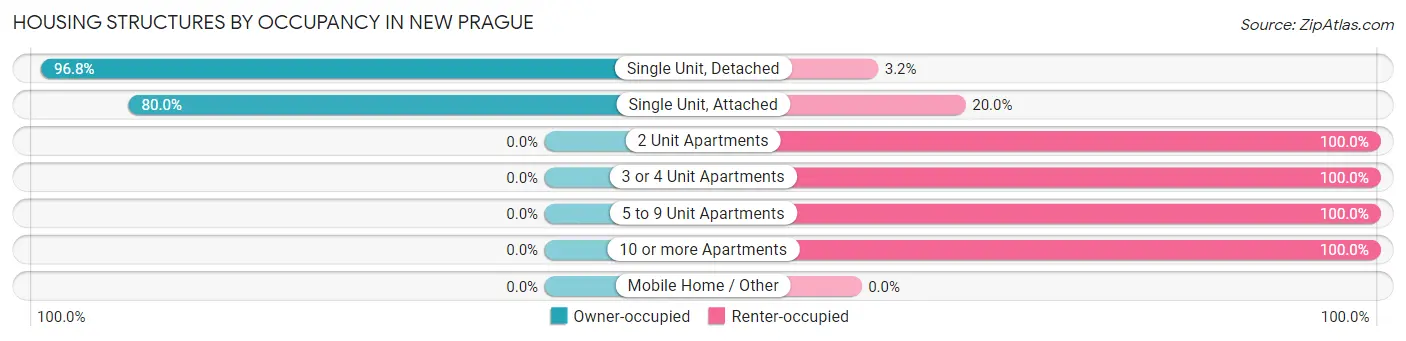
| Structure Type | Owner-occupied | Renter-occupied |
| Single Unit, Detached | 1,905 (96.8%) | 63 (3.2%) |
| Single Unit, Attached | 423 (80.0%) | 106 (20.0%) |
| 2 Unit Apartments | 0 (0.0%) | 28 (100.0%) |
| 3 or 4 Unit Apartments | 0 (0.0%) | 13 (100.0%) |
| 5 to 9 Unit Apartments | 0 (0.0%) | 20 (100.0%) |
| 10 or more Apartments | 0 (0.0%) | 264 (100.0%) |
| Mobile Home / Other | 0 (0.0%) | 0 (0.0%) |
| Total | 2,328 (82.5%) | 494 (17.5%) |
Housing Structures by Number of Rooms in New Prague
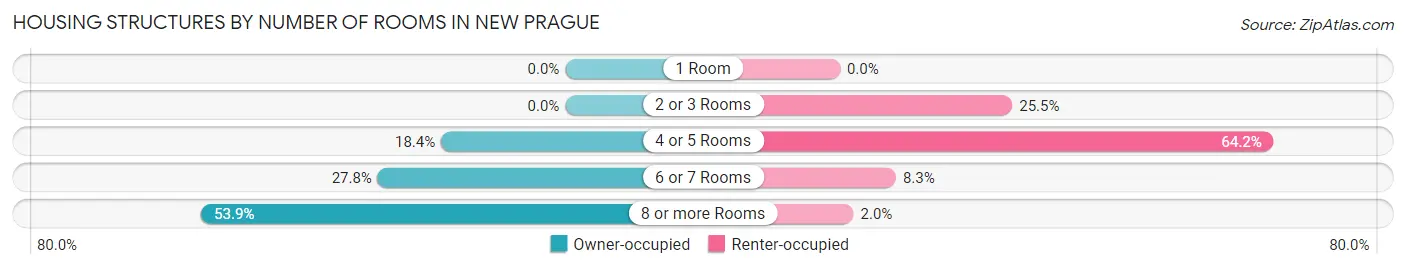
| Number of Rooms | Owner-occupied | Renter-occupied |
| 1 Room | 0 (0.0%) | 0 (0.0%) |
| 2 or 3 Rooms | 0 (0.0%) | 126 (25.5%) |
| 4 or 5 Rooms | 428 (18.4%) | 317 (64.2%) |
| 6 or 7 Rooms | 646 (27.8%) | 41 (8.3%) |
| 8 or more Rooms | 1,254 (53.9%) | 10 (2.0%) |
| Total | 2,328 (100.0%) | 494 (100.0%) |
Housing Structure by Heating Type in New Prague
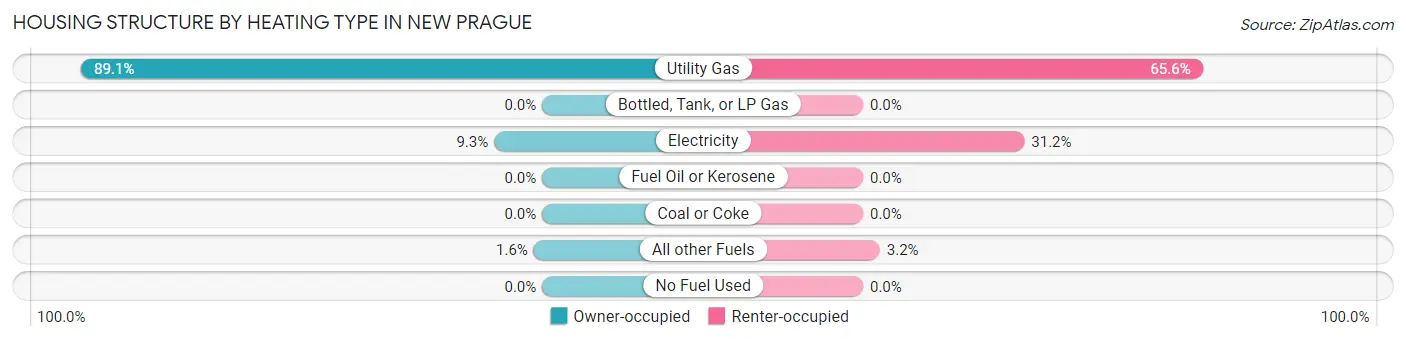
| Heating Type | Owner-occupied | Renter-occupied |
| Utility Gas | 2,074 (89.1%) | 324 (65.6%) |
| Bottled, Tank, or LP Gas | 0 (0.0%) | 0 (0.0%) |
| Electricity | 216 (9.3%) | 154 (31.2%) |
| Fuel Oil or Kerosene | 0 (0.0%) | 0 (0.0%) |
| Coal or Coke | 0 (0.0%) | 0 (0.0%) |
| All other Fuels | 38 (1.6%) | 16 (3.2%) |
| No Fuel Used | 0 (0.0%) | 0 (0.0%) |
| Total | 2,328 (100.0%) | 494 (100.0%) |
Household Vehicle Usage in New Prague
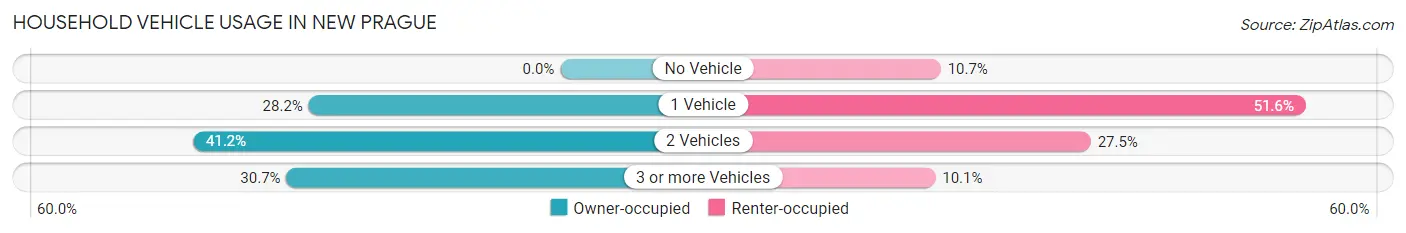
| Vehicles per Household | Owner-occupied | Renter-occupied |
| No Vehicle | 0 (0.0%) | 53 (10.7%) |
| 1 Vehicle | 656 (28.2%) | 255 (51.6%) |
| 2 Vehicles | 958 (41.1%) | 136 (27.5%) |
| 3 or more Vehicles | 714 (30.7%) | 50 (10.1%) |
| Total | 2,328 (100.0%) | 494 (100.0%) |
Real Estate & Mortgages in New Prague
Real Estate and Mortgage Overview in New Prague
| Characteristic | Without Mortgage | With Mortgage |
| Housing Units | 566 | 1,762 |
| Median Property Value | $296,600 | $309,300 |
| Median Household Income | $71,029 | $665 |
| Monthly Housing Costs | $704 | $166 |
| Real Estate Taxes | $3,274 | $14 |
Property Value by Mortgage Status in New Prague
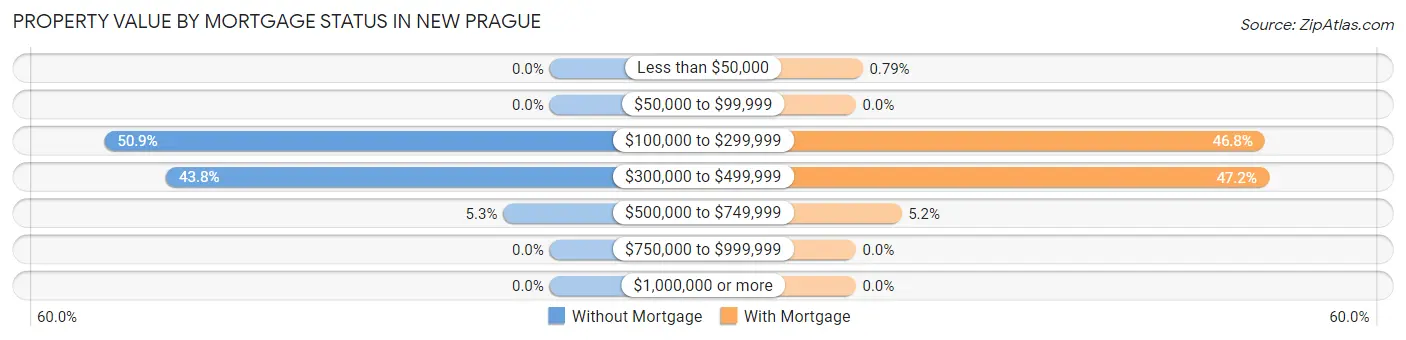
| Property Value | Without Mortgage | With Mortgage |
| Less than $50,000 | 0 (0.0%) | 14 (0.8%) |
| $50,000 to $99,999 | 0 (0.0%) | 0 (0.0%) |
| $100,000 to $299,999 | 288 (50.9%) | 824 (46.8%) |
| $300,000 to $499,999 | 248 (43.8%) | 832 (47.2%) |
| $500,000 to $749,999 | 30 (5.3%) | 92 (5.2%) |
| $750,000 to $999,999 | 0 (0.0%) | 0 (0.0%) |
| $1,000,000 or more | 0 (0.0%) | 0 (0.0%) |
| Total | 566 (100.0%) | 1,762 (100.0%) |
Household Income by Mortgage Status in New Prague
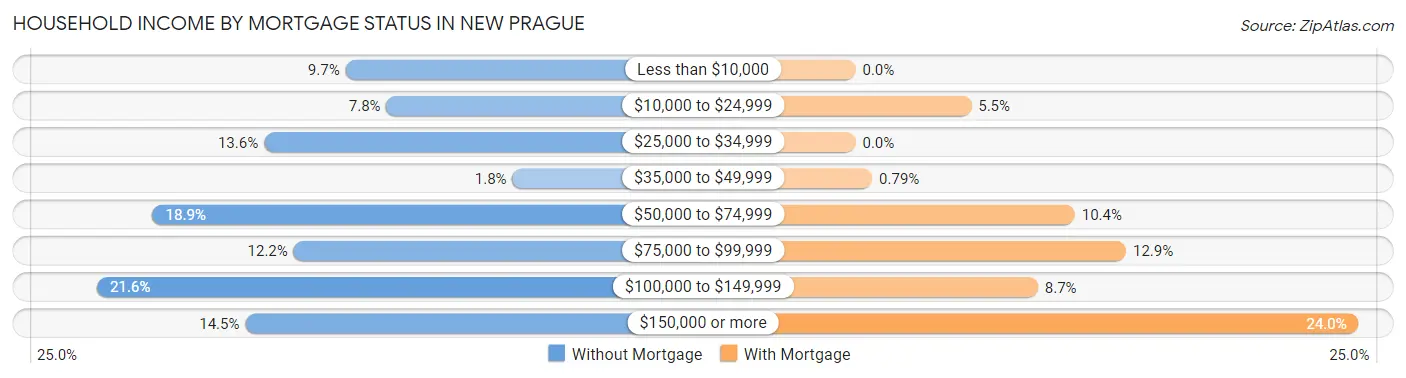
| Household Income | Without Mortgage | With Mortgage |
| Less than $10,000 | 55 (9.7%) | 0 (0.0%) |
| $10,000 to $24,999 | 44 (7.8%) | 97 (5.5%) |
| $25,000 to $34,999 | 77 (13.6%) | 0 (0.0%) |
| $35,000 to $49,999 | 10 (1.8%) | 14 (0.8%) |
| $50,000 to $74,999 | 107 (18.9%) | 184 (10.4%) |
| $75,000 to $99,999 | 69 (12.2%) | 227 (12.9%) |
| $100,000 to $149,999 | 122 (21.5%) | 153 (8.7%) |
| $150,000 or more | 82 (14.5%) | 422 (23.9%) |
| Total | 566 (100.0%) | 1,762 (100.0%) |
Property Value to Household Income Ratio in New Prague
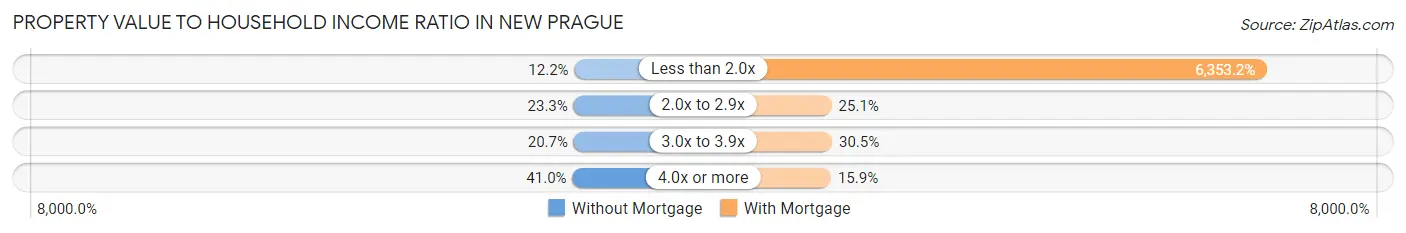
| Value-to-Income Ratio | Without Mortgage | With Mortgage |
| Less than 2.0x | 69 (12.2%) | 111,944 (6,353.2%) |
| 2.0x to 2.9x | 132 (23.3%) | 443 (25.1%) |
| 3.0x to 3.9x | 117 (20.7%) | 538 (30.5%) |
| 4.0x or more | 232 (41.0%) | 280 (15.9%) |
| Total | 566 (100.0%) | 1,762 (100.0%) |
Real Estate Taxes by Mortgage Status in New Prague

| Property Taxes | Without Mortgage | With Mortgage |
| Less than $800 | 0 (0.0%) | 97 (5.5%) |
| $800 to $1,499 | 0 (0.0%) | 0 (0.0%) |
| $800 to $1,499 | 566 (100.0%) | 95 (5.4%) |
| Total | 566 (100.0%) | 1,762 (100.0%) |
Health & Disability in New Prague
Health Insurance Coverage by Age in New Prague
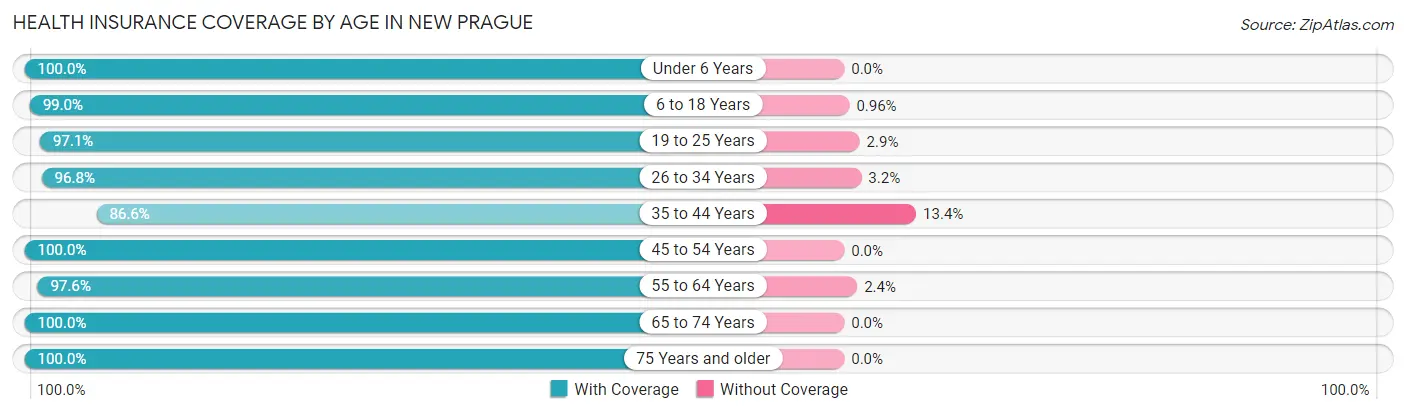
| Age Bracket | With Coverage | Without Coverage |
| Under 6 Years | 772 (100.0%) | 0 (0.0%) |
| 6 to 18 Years | 1,758 (99.0%) | 17 (1.0%) |
| 19 to 25 Years | 612 (97.1%) | 18 (2.9%) |
| 26 to 34 Years | 849 (96.8%) | 28 (3.2%) |
| 35 to 44 Years | 1,105 (86.6%) | 171 (13.4%) |
| 45 to 54 Years | 927 (100.0%) | 0 (0.0%) |
| 55 to 64 Years | 648 (97.6%) | 16 (2.4%) |
| 65 to 74 Years | 476 (100.0%) | 0 (0.0%) |
| 75 Years and older | 660 (100.0%) | 0 (0.0%) |
| Total | 7,807 (96.9%) | 250 (3.1%) |
Health Insurance Coverage by Citizenship Status in New Prague

| Citizenship Status | With Coverage | Without Coverage |
| Native Born | 772 (100.0%) | 0 (0.0%) |
| Foreign Born, Citizen | 1,758 (99.0%) | 17 (1.0%) |
| Foreign Born, not a Citizen | 612 (97.1%) | 18 (2.9%) |
Health Insurance Coverage by Household Income in New Prague
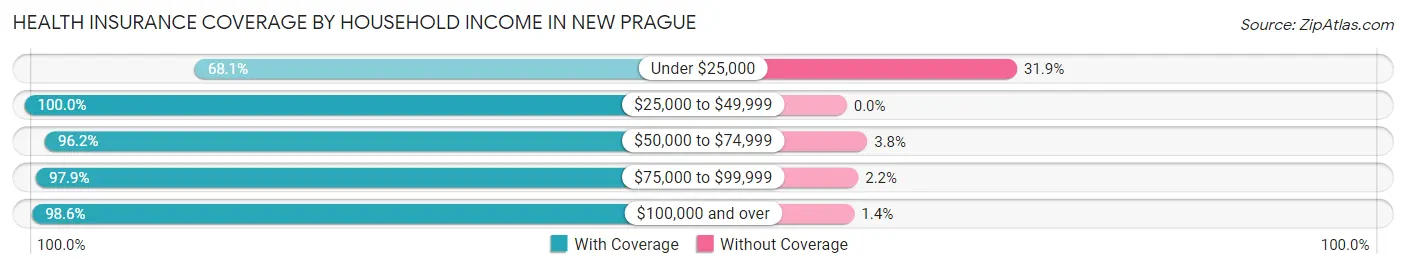
| Household Income | With Coverage | Without Coverage |
| Under $25,000 | 269 (68.1%) | 126 (31.9%) |
| $25,000 to $49,999 | 835 (100.0%) | 0 (0.0%) |
| $50,000 to $74,999 | 827 (96.2%) | 33 (3.8%) |
| $75,000 to $99,999 | 773 (97.9%) | 17 (2.1%) |
| $100,000 and over | 5,097 (98.6%) | 74 (1.4%) |
Public vs Private Health Insurance Coverage by Age in New Prague
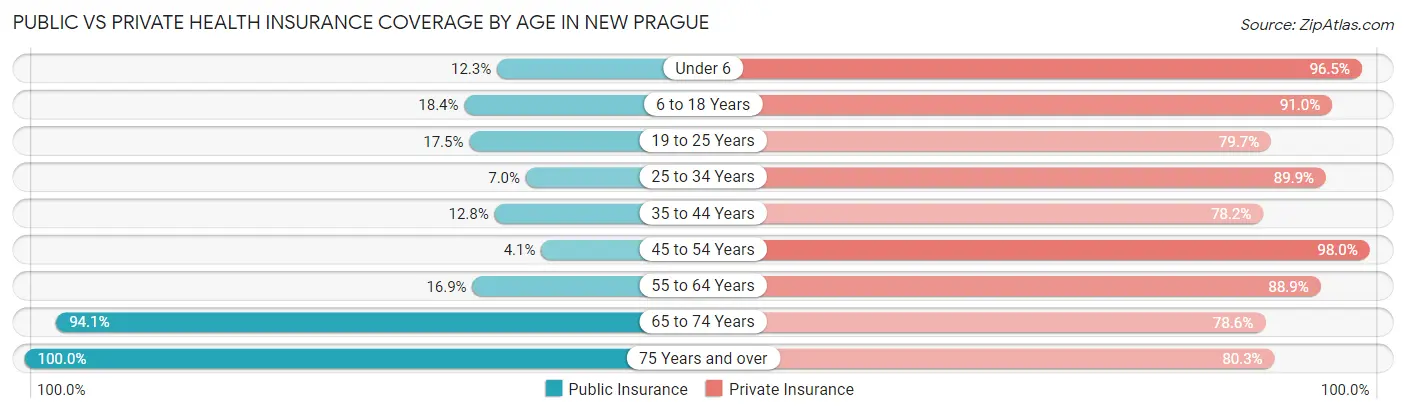
| Age Bracket | Public Insurance | Private Insurance |
| Under 6 | 95 (12.3%) | 745 (96.5%) |
| 6 to 18 Years | 326 (18.4%) | 1,615 (91.0%) |
| 19 to 25 Years | 110 (17.5%) | 502 (79.7%) |
| 25 to 34 Years | 61 (7.0%) | 788 (89.8%) |
| 35 to 44 Years | 163 (12.8%) | 998 (78.2%) |
| 45 to 54 Years | 38 (4.1%) | 908 (98.0%) |
| 55 to 64 Years | 112 (16.9%) | 590 (88.9%) |
| 65 to 74 Years | 448 (94.1%) | 374 (78.6%) |
| 75 Years and over | 660 (100.0%) | 530 (80.3%) |
| Total | 2,013 (25.0%) | 7,050 (87.5%) |
Disability Status by Sex by Age in New Prague
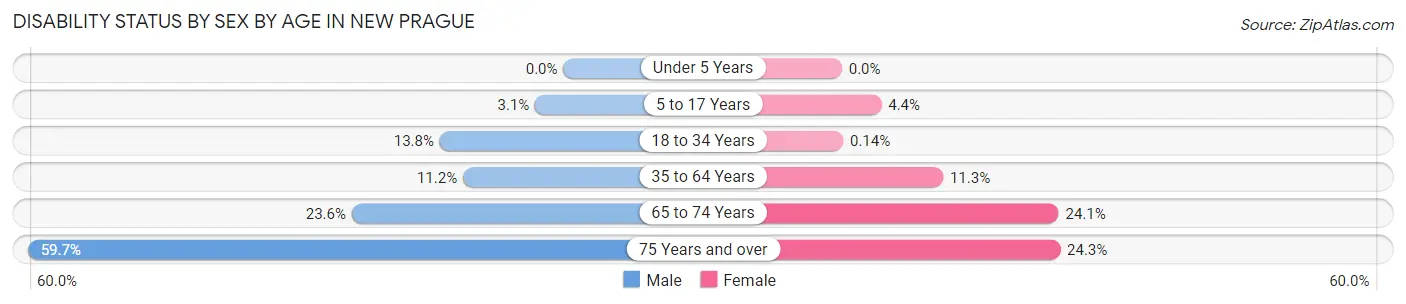
| Age Bracket | Male | Female |
| Under 5 Years | 0 (0.0%) | 0 (0.0%) |
| 5 to 17 Years | 34 (3.1%) | 31 (4.4%) |
| 18 to 34 Years | 126 (13.8%) | 1 (0.1%) |
| 35 to 64 Years | 153 (11.2%) | 169 (11.3%) |
| 65 to 74 Years | 78 (23.6%) | 35 (24.1%) |
| 75 Years and over | 136 (59.7%) | 105 (24.3%) |
Disability Class by Sex by Age in New Prague
Disability Class: Hearing Difficulty
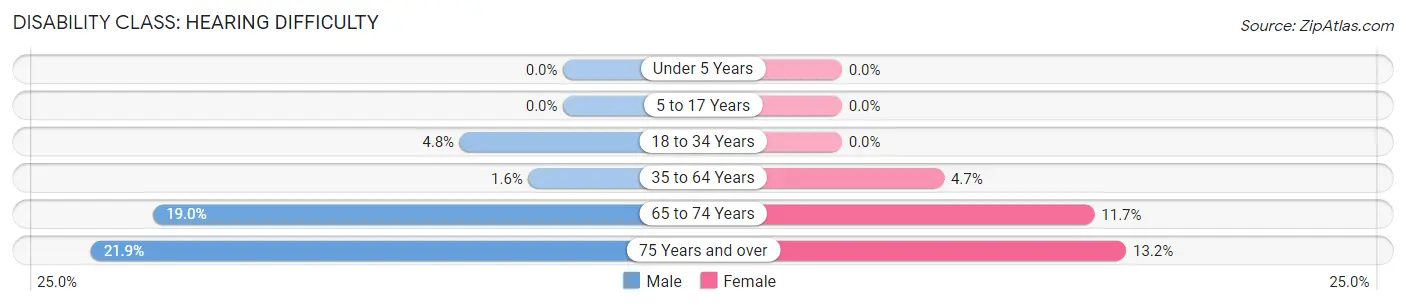
| Age Bracket | Male | Female |
| Under 5 Years | 0 (0.0%) | 0 (0.0%) |
| 5 to 17 Years | 0 (0.0%) | 0 (0.0%) |
| 18 to 34 Years | 44 (4.8%) | 0 (0.0%) |
| 35 to 64 Years | 22 (1.6%) | 71 (4.7%) |
| 65 to 74 Years | 63 (19.0%) | 17 (11.7%) |
| 75 Years and over | 50 (21.9%) | 57 (13.2%) |
Disability Class: Vision Difficulty
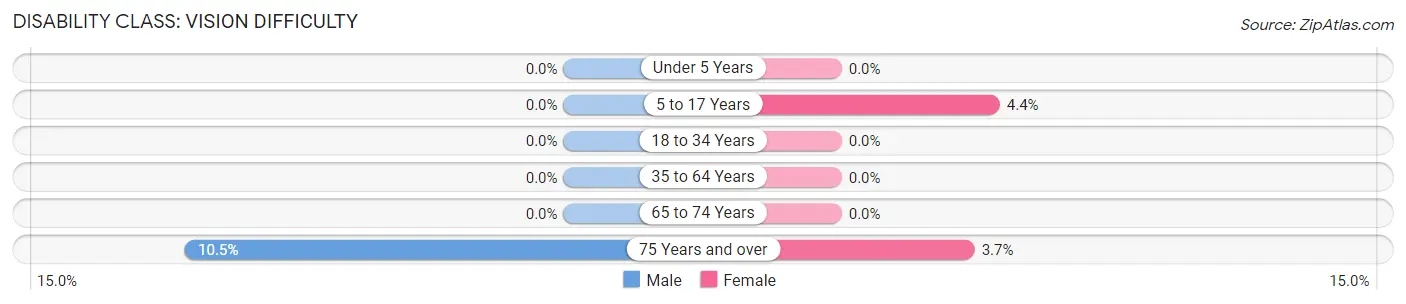
| Age Bracket | Male | Female |
| Under 5 Years | 0 (0.0%) | 0 (0.0%) |
| 5 to 17 Years | 0 (0.0%) | 31 (4.4%) |
| 18 to 34 Years | 0 (0.0%) | 0 (0.0%) |
| 35 to 64 Years | 0 (0.0%) | 0 (0.0%) |
| 65 to 74 Years | 0 (0.0%) | 0 (0.0%) |
| 75 Years and over | 24 (10.5%) | 16 (3.7%) |
Disability Class: Cognitive Difficulty
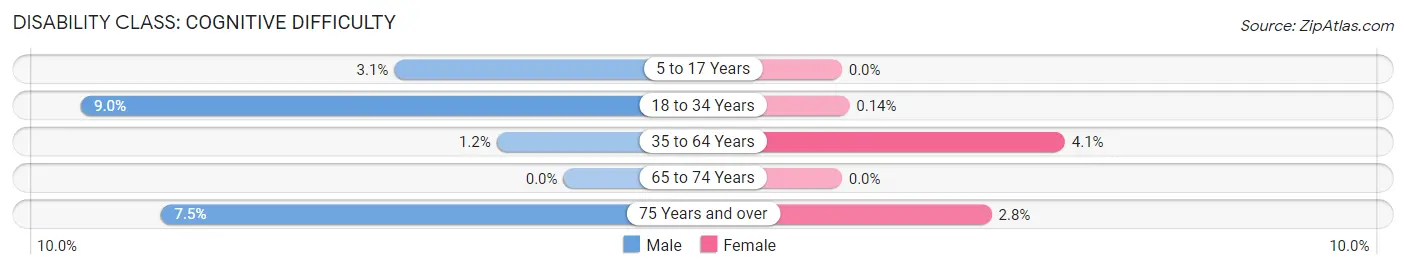
| Age Bracket | Male | Female |
| 5 to 17 Years | 34 (3.1%) | 0 (0.0%) |
| 18 to 34 Years | 82 (8.9%) | 1 (0.1%) |
| 35 to 64 Years | 17 (1.2%) | 62 (4.1%) |
| 65 to 74 Years | 0 (0.0%) | 0 (0.0%) |
| 75 Years and over | 17 (7.5%) | 12 (2.8%) |
Disability Class: Ambulatory Difficulty
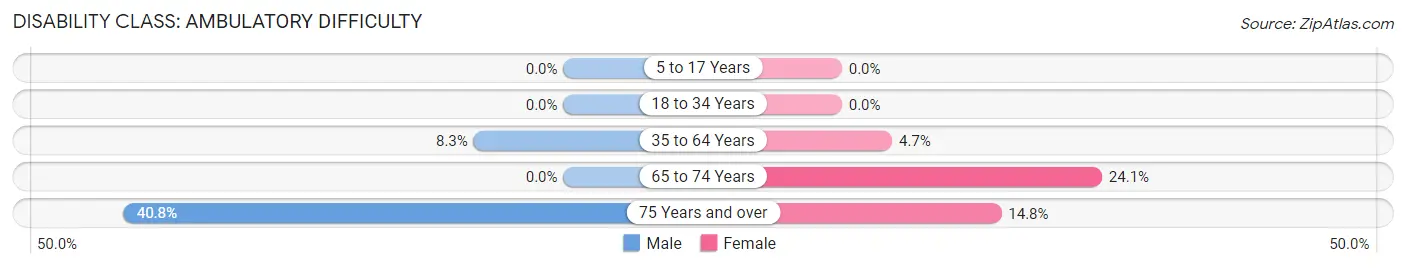
| Age Bracket | Male | Female |
| 5 to 17 Years | 0 (0.0%) | 0 (0.0%) |
| 18 to 34 Years | 0 (0.0%) | 0 (0.0%) |
| 35 to 64 Years | 114 (8.3%) | 70 (4.7%) |
| 65 to 74 Years | 0 (0.0%) | 35 (24.1%) |
| 75 Years and over | 93 (40.8%) | 64 (14.8%) |
Disability Class: Self-Care Difficulty
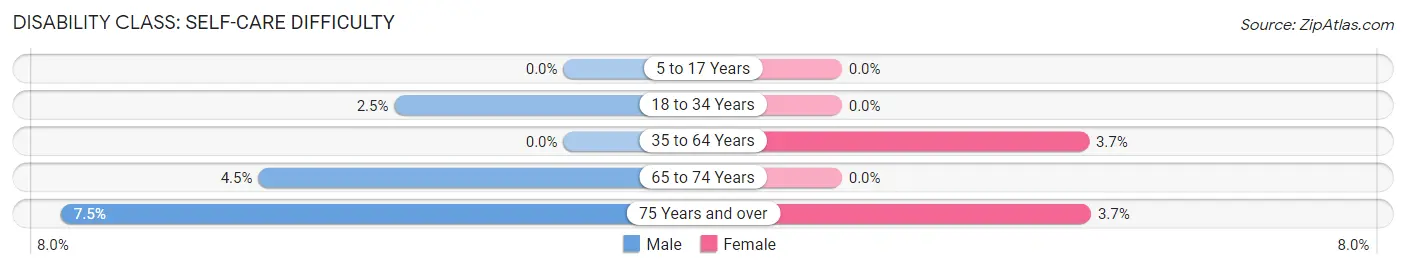
| Age Bracket | Male | Female |
| 5 to 17 Years | 0 (0.0%) | 0 (0.0%) |
| 18 to 34 Years | 23 (2.5%) | 0 (0.0%) |
| 35 to 64 Years | 0 (0.0%) | 55 (3.7%) |
| 65 to 74 Years | 15 (4.5%) | 0 (0.0%) |
| 75 Years and over | 17 (7.5%) | 16 (3.7%) |
Technology Access in New Prague
Computing Device Access in New Prague
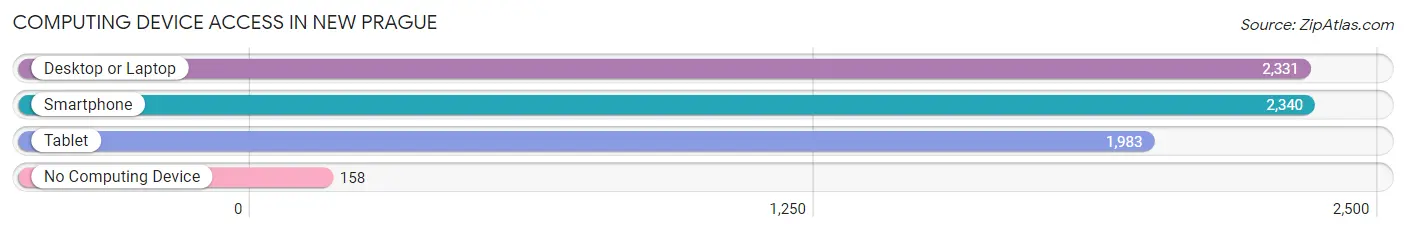
| Device Type | # Households | % Households |
| Desktop or Laptop | 2,331 | 82.6% |
| Smartphone | 2,340 | 82.9% |
| Tablet | 1,983 | 70.3% |
| No Computing Device | 158 | 5.6% |
| Total | 2,822 | 100.0% |
Internet Access in New Prague
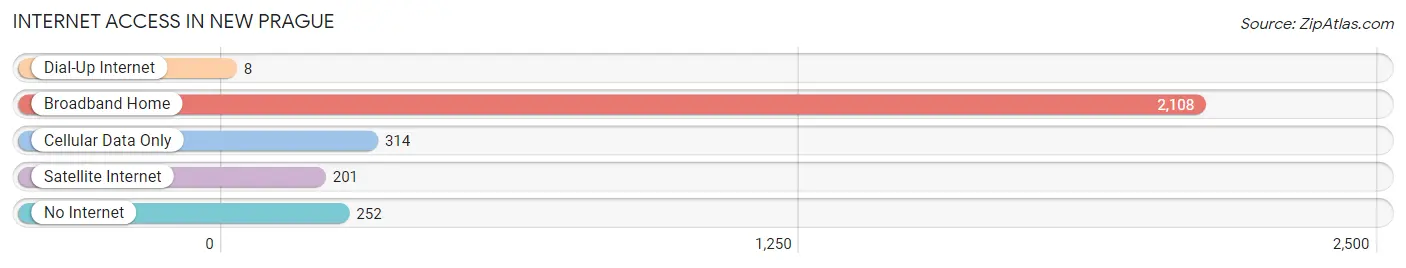
| Internet Type | # Households | % Households |
| Dial-Up Internet | 8 | 0.3% |
| Broadband Home | 2,108 | 74.7% |
| Cellular Data Only | 314 | 11.1% |
| Satellite Internet | 201 | 7.1% |
| No Internet | 252 | 8.9% |
| Total | 2,822 | 100.0% |
New Prague Summary
History
New Prague, Minnesota is a small city located in Scott County, about 40 miles southwest of Minneapolis. It was founded in 1856 by Czech immigrants who were seeking a better life in the United States. The city was named after the Czech city of Prague, and the original settlers were mostly farmers and tradesmen.
The city was officially incorporated in 1877, and the first mayor was John Novak. The city quickly grew and by the early 1900s, it had become a thriving community with a population of over 1,000 people. The city was known for its strong Czech heritage, and many of the original settlers’ descendants still live in the area today.
The city experienced a period of growth in the 1950s and 1960s, when many new businesses and industries were established. This included a large meatpacking plant, which employed many of the city’s residents. The city also experienced a population boom during this time, as many people moved to the area to take advantage of the new job opportunities.
In the late 1970s, the city began to experience a decline in population and economic activity. This was due to the closure of the meatpacking plant and other industries, as well as the out-migration of many of the city’s residents. The city has since experienced a resurgence in population and economic activity, and is now home to a variety of businesses and industries.
Geography
New Prague is located in the south-central part of Minnesota, in Scott County. It is situated on the banks of the Minnesota River, and is surrounded by rolling hills and farmland. The city is located about 40 miles southwest of Minneapolis, and is easily accessible by car or public transportation.
The city covers an area of about 8.5 square miles, and has a population of around 7,000 people. The city is divided into several neighborhoods, including the historic downtown area, the industrial area, and the residential neighborhoods.
Economy
New Prague’s economy is largely based on agriculture and manufacturing. The city is home to several large agricultural businesses, including a large dairy farm and a large hog farm. The city also has several manufacturing businesses, including a large meatpacking plant and a variety of other industrial businesses.
The city also has a thriving retail sector, with several large shopping centers and a variety of small businesses. The city is also home to several medical facilities, including a hospital and several clinics.
Demographics
As of the 2010 census, the population of New Prague was 7,321. The city has a diverse population, with a large percentage of people of Czech descent. The city also has a large Hispanic population, as well as a small African American population. The median household income in the city is $50,000, and the median home value is $150,000.
New Prague is a small city with a rich history and a diverse population. It is a great place to live, work, and raise a family, and is a great example of the American Dream.
Common Questions
What is Per Capita Income in New Prague?
Per Capita income in New Prague is $43,732.
What is the Median Family Income in New Prague?
Median Family Income in New Prague is $108,950.
What is the Median Household income in New Prague?
Median Household Income in New Prague is $101,579.
What is Income or Wage Gap in New Prague?
Income or Wage Gap in New Prague is 27.2%.
Women in New Prague earn 72.8 cents for every dollar earned by a man.
What is Inequality or Gini Index in New Prague?
Inequality or Gini Index in New Prague is 0.42.
What is the Total Population of New Prague?
Total Population of New Prague is 8,155.
What is the Total Male Population of New Prague?
Total Male Population of New Prague is 4,208.
What is the Total Female Population of New Prague?
Total Female Population of New Prague is 3,947.
What is the Ratio of Males per 100 Females in New Prague?
There are 106.61 Males per 100 Females in New Prague.
What is the Ratio of Females per 100 Males in New Prague?
There are 93.80 Females per 100 Males in New Prague.
What is the Median Population Age in New Prague?
Median Population Age in New Prague is 35.3 Years.
What is the Average Family Size in New Prague
Average Family Size in New Prague is 3.4 People.
What is the Average Household Size in New Prague
Average Household Size in New Prague is 2.9 People.
How Large is the Labor Force in New Prague?
There are 4,191 People in the Labor Forcein in New Prague.
What is the Percentage of People in the Labor Force in New Prague?
70.6% of People are in the Labor Force in New Prague.
What is the Unemployment Rate in New Prague?
Unemployment Rate in New Prague is 3.6%.