Orono, MN Map & Demographics
Orono Map
Orono Overview
$135,383
PER CAPITA INCOME
$203,884
AVG FAMILY INCOME
$173,209
AVG HOUSEHOLD INCOME
38.6%
WAGE / INCOME GAP [ % ]
61.4¢/ $1
WAGE / INCOME GAP [ $ ]
0.59
INEQUALITY / GINI INDEX
8,223
TOTAL POPULATION
4,632
MALE POPULATION
3,591
FEMALE POPULATION
128.99
MALES / 100 FEMALES
77.53
FEMALES / 100 MALES
46.0
MEDIAN AGE
3.2
AVG FAMILY SIZE
2.7
AVG HOUSEHOLD SIZE
4,258
LABOR FORCE [ PEOPLE ]
68.2%
PERCENT IN LABOR FORCE
3.2%
UNEMPLOYMENT RATE
Income in Orono
Income Overview in Orono
Per Capita Income in Orono is $135,383, while median incomes of families and households are $203,884 and $173,209 respectively.
| Characteristic | Number | Measure |
| Per Capita Income | 8,223 | $135,383 |
| Median Family Income | 2,214 | $203,884 |
| Mean Family Income | 2,214 | $381,704 |
| Median Household Income | 3,048 | $173,209 |
| Mean Household Income | 3,048 | $325,789 |
| Income Deficit | 2,214 | $0 |
| Wage / Income Gap (%) | 8,223 | 38.57% |
| Wage / Income Gap ($) | 8,223 | 61.43¢ per $1 |
| Gini / Inequality Index | 8,223 | 0.59 |
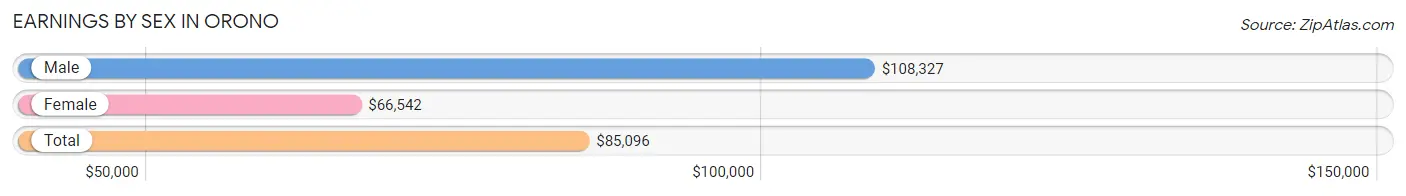
Earnings by Sex in Orono
Average Earnings in Orono are $85,096, $108,327 for men and $66,542 for women, a difference of 38.6%.
| Sex | Number | Average Earnings |
| Male | 2,673 (60.0%) | $108,327 |
| Female | 1,781 (40.0%) | $66,542 |
| Total | 4,454 (100.0%) | $85,096 |
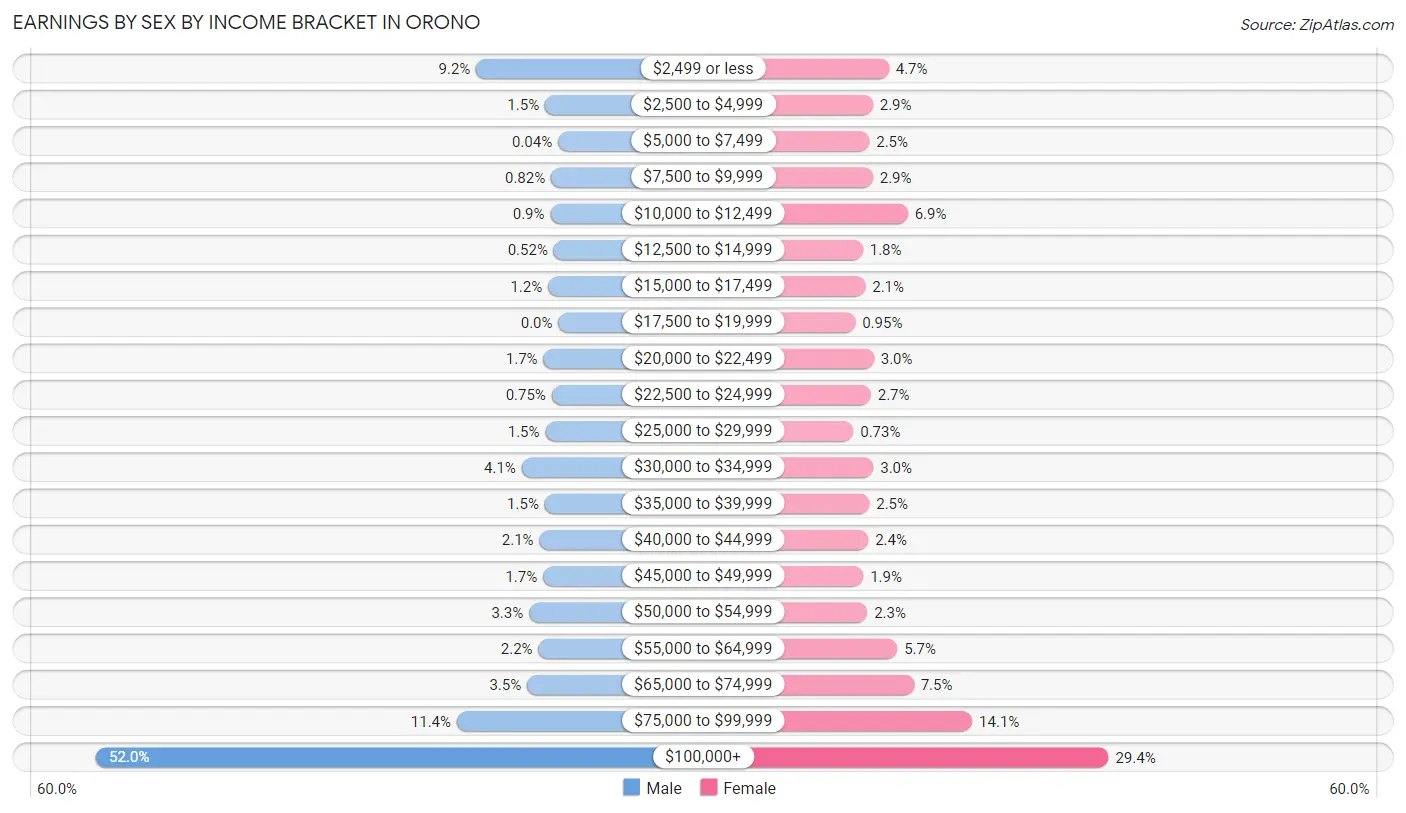
Earnings by Sex by Income Bracket in Orono
The most common earnings brackets in Orono are $100,000+ for men (1,389 | 52.0%) and $100,000+ for women (524 | 29.4%).
| Income | Male | Female |
| $2,499 or less | 247 (9.2%) | 84 (4.7%) |
| $2,500 to $4,999 | 40 (1.5%) | 52 (2.9%) |
| $5,000 to $7,499 | 1 (0.0%) | 45 (2.5%) |
| $7,500 to $9,999 | 22 (0.8%) | 52 (2.9%) |
| $10,000 to $12,499 | 24 (0.9%) | 122 (6.9%) |
| $12,500 to $14,999 | 14 (0.5%) | 32 (1.8%) |
| $15,000 to $17,499 | 31 (1.2%) | 37 (2.1%) |
| $17,500 to $19,999 | 0 (0.0%) | 17 (0.9%) |
| $20,000 to $22,499 | 45 (1.7%) | 54 (3.0%) |
| $22,500 to $24,999 | 20 (0.7%) | 48 (2.7%) |
| $25,000 to $29,999 | 39 (1.5%) | 13 (0.7%) |
| $30,000 to $34,999 | 110 (4.1%) | 53 (3.0%) |
| $35,000 to $39,999 | 41 (1.5%) | 45 (2.5%) |
| $40,000 to $44,999 | 57 (2.1%) | 43 (2.4%) |
| $45,000 to $49,999 | 46 (1.7%) | 33 (1.8%) |
| $50,000 to $54,999 | 88 (3.3%) | 41 (2.3%) |
| $55,000 to $64,999 | 60 (2.2%) | 101 (5.7%) |
| $65,000 to $74,999 | 94 (3.5%) | 134 (7.5%) |
| $75,000 to $99,999 | 305 (11.4%) | 251 (14.1%) |
| $100,000+ | 1,389 (52.0%) | 524 (29.4%) |
| Total | 2,673 (100.0%) | 1,781 (100.0%) |
Earnings by Sex by Educational Attainment in Orono
Average earnings in Orono are $113,261 for men and $70,756 for women, a difference of 37.5%. Men with an educational attainment of graduate degree enjoy the highest average annual earnings of $209,922, while those with high school diploma education earn the least with $65,313. Women with an educational attainment of graduate degree earn the most with the average annual earnings of $124,706, while those with bachelor's degree education have the smallest earnings of $52,321.

| Educational Attainment | Male Income | Female Income |
| Less than High School | - | - |
| High School Diploma | $65,313 | $0 |
| College or Associate's Degree | $92,895 | $70,577 |
| Bachelor's Degree | $135,917 | $52,321 |
| Graduate Degree | $209,922 | $124,706 |
| Total | $113,261 | $70,756 |
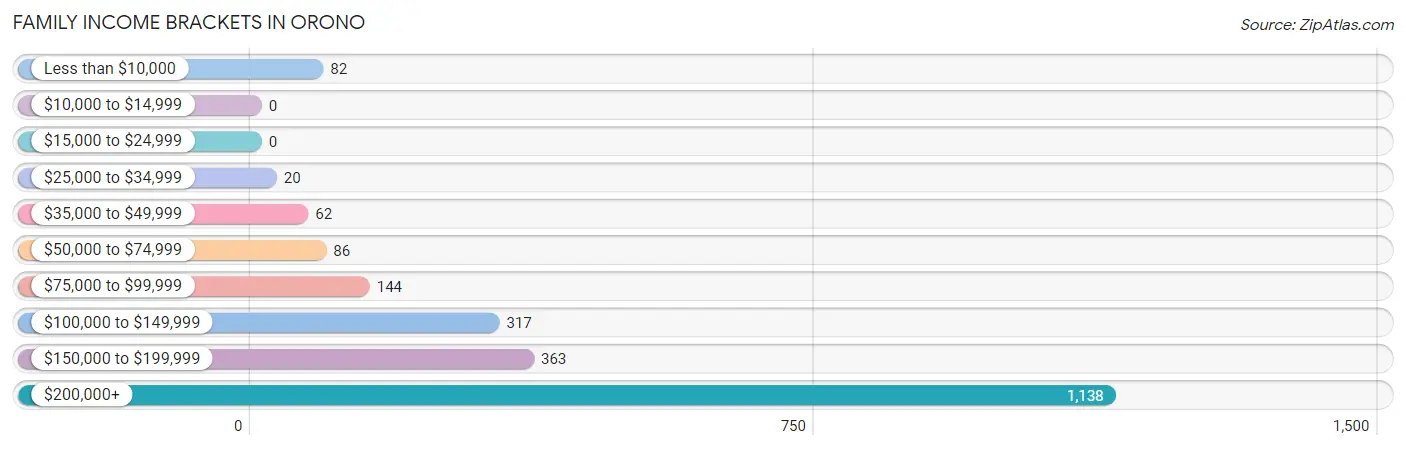
Family Income in Orono
Family Income Brackets in Orono
According to the Orono family income data, there are 1,138 families falling into the $200,000+ income range, which is the most common income bracket and makes up 51.4% of all families.
| Income Bracket | # Families | % Families |
| Less than $10,000 | 82 | 3.7% |
| $10,000 to $14,999 | 0 | 0.0% |
| $15,000 to $24,999 | 0 | 0.0% |
| $25,000 to $34,999 | 20 | 0.9% |
| $35,000 to $49,999 | 62 | 2.8% |
| $50,000 to $74,999 | 86 | 3.9% |
| $75,000 to $99,999 | 144 | 6.5% |
| $100,000 to $149,999 | 317 | 14.3% |
| $150,000 to $199,999 | 363 | 16.4% |
| $200,000+ | 1,138 | 51.4% |
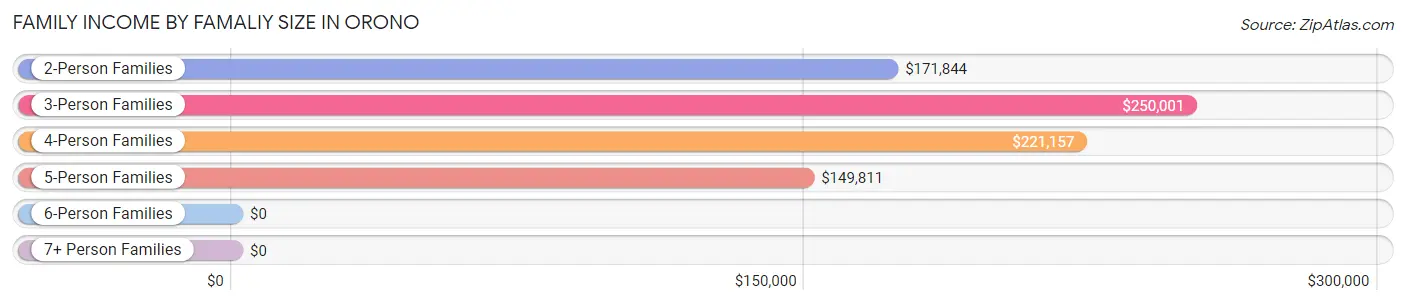
Family Income by Famaliy Size in Orono
3-person families (419 | 18.9%) account for the highest median family income in Orono with $250,001 per family, while 2-person families (955 | 43.1%) have the highest median income of $85,922 per family member.
| Income Bracket | # Families | Median Income |
| 2-Person Families | 955 (43.1%) | $171,844 |
| 3-Person Families | 419 (18.9%) | $250,001 |
| 4-Person Families | 561 (25.3%) | $221,157 |
| 5-Person Families | 227 (10.2%) | $149,811 |
| 6-Person Families | 8 (0.4%) | $0 |
| 7+ Person Families | 44 (2.0%) | $0 |
| Total | 2,214 (100.0%) | $203,884 |
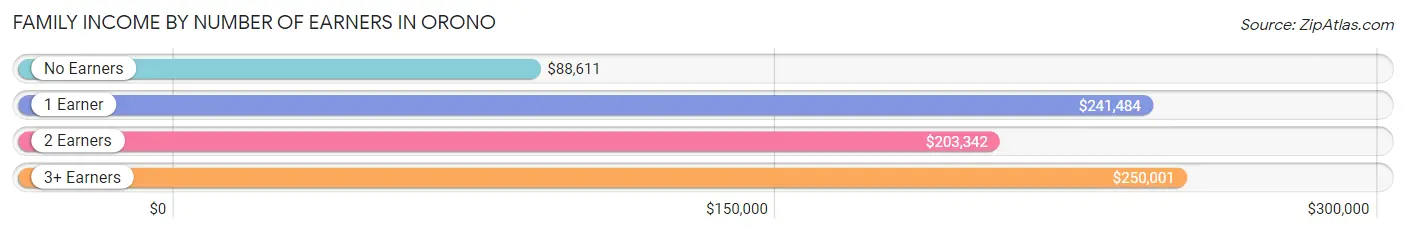
Family Income by Number of Earners in Orono
The median family income in Orono is $203,884, with families comprising 3+ earners (182) having the highest median family income of $250,001, while families with no earners (264) have the lowest median family income of $88,611, accounting for 8.2% and 11.9% of families, respectively.
| Number of Earners | # Families | Median Income |
| No Earners | 264 (11.9%) | $88,611 |
| 1 Earner | 437 (19.7%) | $241,484 |
| 2 Earners | 1,331 (60.1%) | $203,342 |
| 3+ Earners | 182 (8.2%) | $250,001 |
| Total | 2,214 (100.0%) | $203,884 |
Household Income in Orono
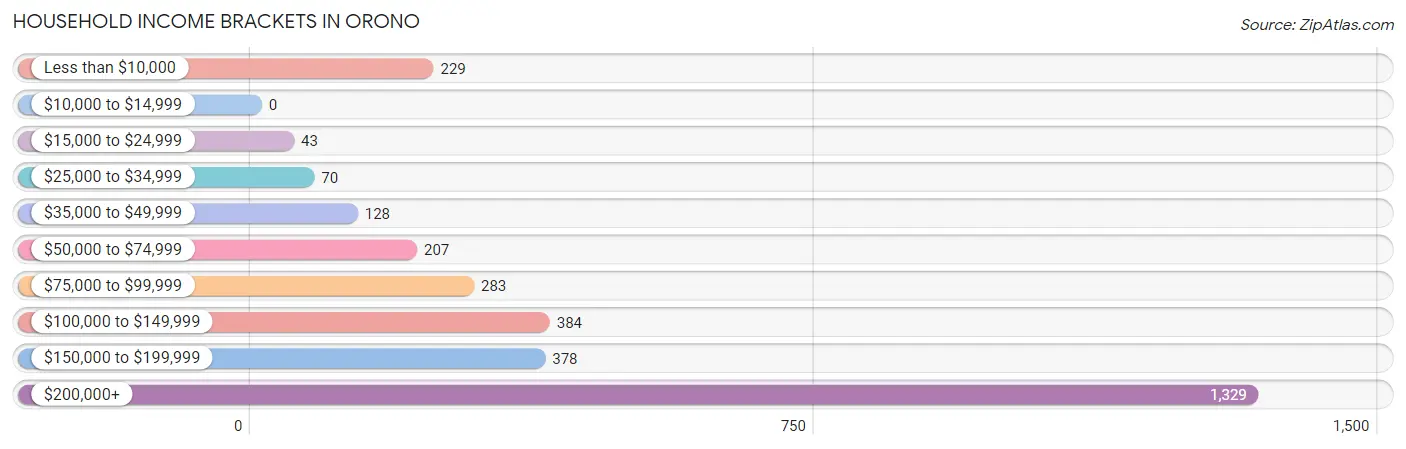
Household Income Brackets in Orono
With 1,329 households falling in the category, the $200,000+ income range is the most frequent in Orono, accounting for 43.6% of all households.
| Income Bracket | # Households | % Households |
| Less than $10,000 | 229 | 7.5% |
| $10,000 to $14,999 | 0 | 0.0% |
| $15,000 to $24,999 | 43 | 1.4% |
| $25,000 to $34,999 | 70 | 2.3% |
| $35,000 to $49,999 | 128 | 4.2% |
| $50,000 to $74,999 | 207 | 6.8% |
| $75,000 to $99,999 | 283 | 9.3% |
| $100,000 to $149,999 | 384 | 12.6% |
| $150,000 to $199,999 | 378 | 12.4% |
| $200,000+ | 1,329 | 43.6% |
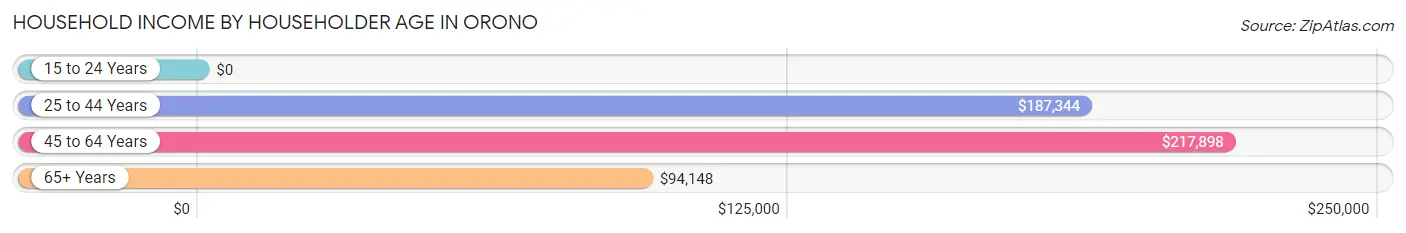
Household Income by Householder Age in Orono
The median household income in Orono is $173,209, with the highest median household income of $217,898 found in the 45 to 64 years age bracket for the primary householder. A total of 1,625 households (53.3%) fall into this category. Meanwhile, the 15 to 24 years age bracket for the primary householder has the lowest median household income of $0, with 17 households (0.6%) in this group.
| Income Bracket | # Households | Median Income |
| 15 to 24 Years | 17 (0.6%) | $0 |
| 25 to 44 Years | 724 (23.7%) | $187,344 |
| 45 to 64 Years | 1,625 (53.3%) | $217,898 |
| 65+ Years | 682 (22.4%) | $94,148 |
| Total | 3,048 (100.0%) | $173,209 |
Poverty in Orono
Income Below Poverty by Sex and Age in Orono
With 5.3% poverty level for males and 7.9% for females among the residents of Orono, 6 to 11 year old males and 75 year old and over females are the most vulnerable to poverty, with 54 males (14.9%) and 53 females (26.5%) in their respective age groups living below the poverty level.
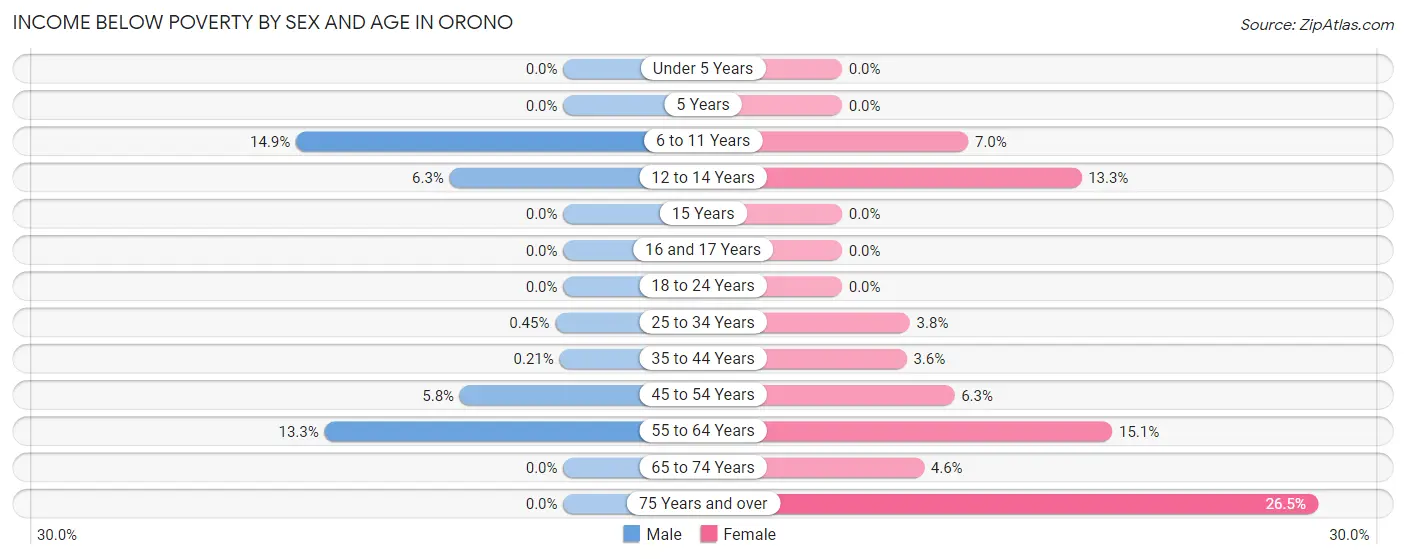
| Age Bracket | Male | Female |
| Under 5 Years | 0 (0.0%) | 0 (0.0%) |
| 5 Years | 0 (0.0%) | 0 (0.0%) |
| 6 to 11 Years | 54 (14.9%) | 18 (7.0%) |
| 12 to 14 Years | 19 (6.3%) | 34 (13.3%) |
| 15 Years | 0 (0.0%) | 0 (0.0%) |
| 16 and 17 Years | 0 (0.0%) | 0 (0.0%) |
| 18 to 24 Years | 0 (0.0%) | 0 (0.0%) |
| 25 to 34 Years | 1 (0.4%) | 7 (3.8%) |
| 35 to 44 Years | 1 (0.2%) | 20 (3.6%) |
| 45 to 54 Years | 41 (5.8%) | 36 (6.3%) |
| 55 to 64 Years | 131 (13.3%) | 96 (15.0%) |
| 65 to 74 Years | 0 (0.0%) | 21 (4.6%) |
| 75 Years and over | 0 (0.0%) | 53 (26.5%) |
| Total | 247 (5.3%) | 285 (7.9%) |
Income Above Poverty by Sex and Age in Orono
According to the poverty statistics in Orono, males aged under 5 years and females aged under 5 years are the age groups that are most secure financially, with 100.0% of males and 100.0% of females in these age groups living above the poverty line.
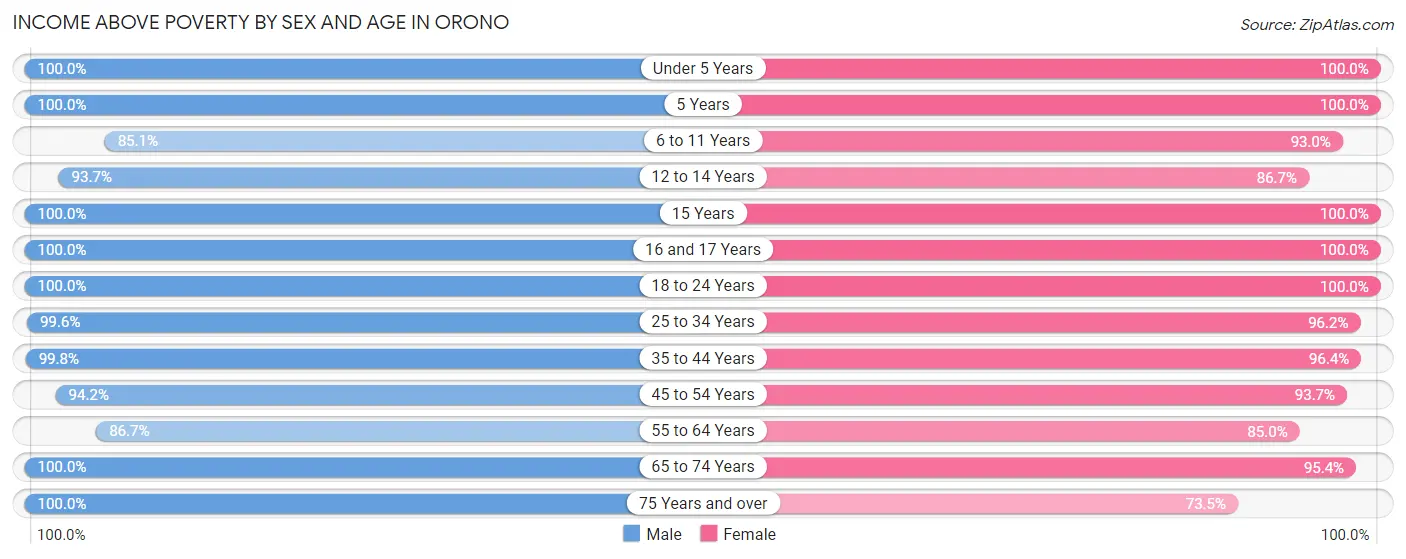
| Age Bracket | Male | Female |
| Under 5 Years | 346 (100.0%) | 147 (100.0%) |
| 5 Years | 175 (100.0%) | 23 (100.0%) |
| 6 to 11 Years | 309 (85.1%) | 238 (93.0%) |
| 12 to 14 Years | 281 (93.7%) | 221 (86.7%) |
| 15 Years | 94 (100.0%) | 21 (100.0%) |
| 16 and 17 Years | 174 (100.0%) | 43 (100.0%) |
| 18 to 24 Years | 144 (100.0%) | 232 (100.0%) |
| 25 to 34 Years | 221 (99.6%) | 178 (96.2%) |
| 35 to 44 Years | 483 (99.8%) | 536 (96.4%) |
| 45 to 54 Years | 671 (94.2%) | 539 (93.7%) |
| 55 to 64 Years | 854 (86.7%) | 542 (85.0%) |
| 65 to 74 Years | 502 (100.0%) | 439 (95.4%) |
| 75 Years and over | 131 (100.0%) | 147 (73.5%) |
| Total | 4,385 (94.7%) | 3,306 (92.1%) |
Income Below Poverty Among Married-Couple Families in Orono
The poverty statistics for married-couple families in Orono show that 3.2% or 66 of the total 2,057 families live below the poverty line. Families with 3 or 4 children have the highest poverty rate of 8.9%, comprising of 21 families. On the other hand, families with 1 or 2 children have the lowest poverty rate of 0.0%, which includes 0 families.
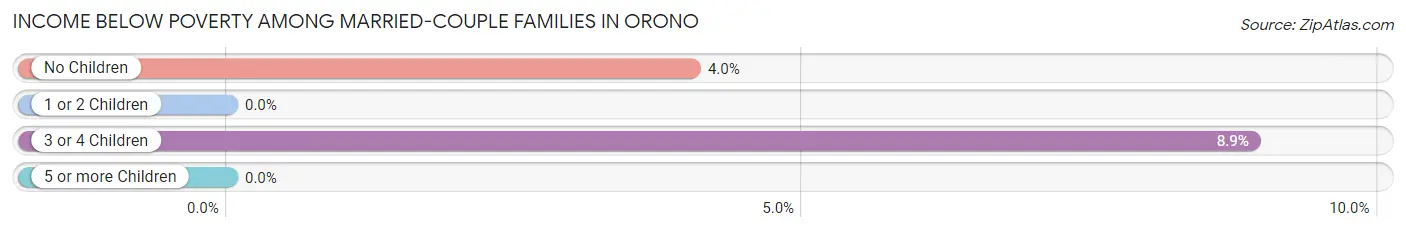
| Children | Above Poverty | Below Poverty |
| No Children | 1,072 (96.0%) | 45 (4.0%) |
| 1 or 2 Children | 680 (100.0%) | 0 (0.0%) |
| 3 or 4 Children | 215 (91.1%) | 21 (8.9%) |
| 5 or more Children | 24 (100.0%) | 0 (0.0%) |
| Total | 1,991 (96.8%) | 66 (3.2%) |
Income Below Poverty Among Single-Parent Households in Orono
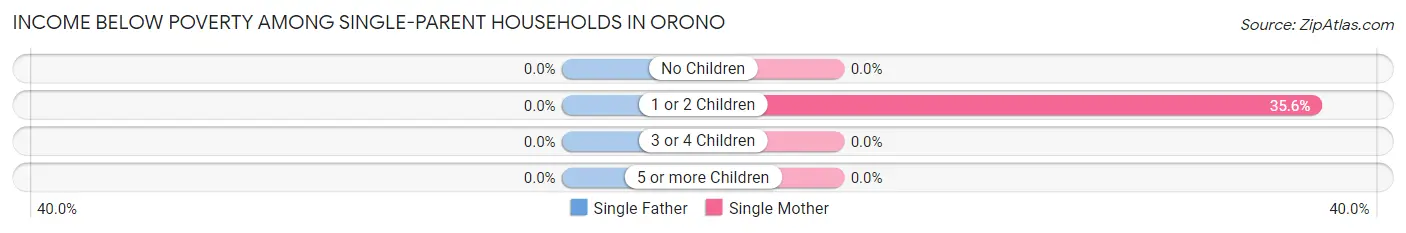
| Children | Single Father | Single Mother |
| No Children | 0 (0.0%) | 0 (0.0%) |
| 1 or 2 Children | 0 (0.0%) | 36 (35.6%) |
| 3 or 4 Children | 0 (0.0%) | 0 (0.0%) |
| 5 or more Children | 0 (0.0%) | 0 (0.0%) |
| Total | 0 (0.0%) | 36 (29.7%) |
Income Below Poverty Among Married-Couple vs Single-Parent Households in Orono
The poverty data for Orono shows that 66 of the married-couple family households (3.2%) and 36 of the single-parent households (22.9%) are living below the poverty level. Within the married-couple family households, those with 3 or 4 children have the highest poverty rate, with 21 households (8.9%) falling below the poverty line. Among the single-parent households, those with 1 or 2 children have the highest poverty rate, with 36 household (35.6%) living below poverty.
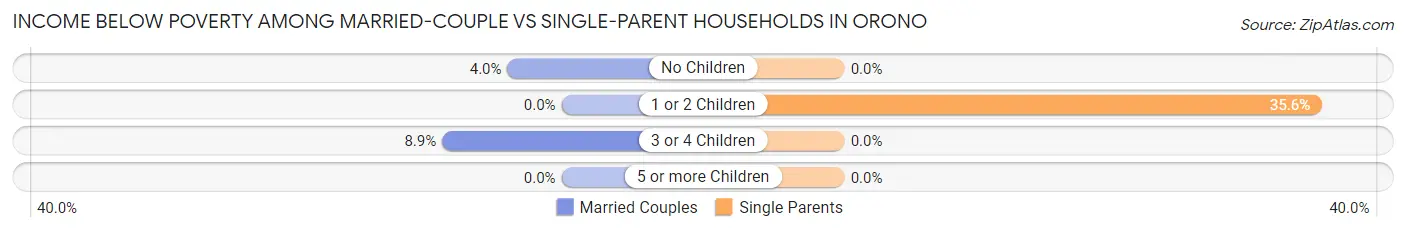
| Children | Married-Couple Families | Single-Parent Households |
| No Children | 45 (4.0%) | 0 (0.0%) |
| 1 or 2 Children | 0 (0.0%) | 36 (35.6%) |
| 3 or 4 Children | 21 (8.9%) | 0 (0.0%) |
| 5 or more Children | 0 (0.0%) | 0 (0.0%) |
| Total | 66 (3.2%) | 36 (22.9%) |
Race in Orono
The most populous races in Orono are White / Caucasian (7,247 | 88.1%), Asian (506 | 6.1%), and Two or more Races (231 | 2.8%).
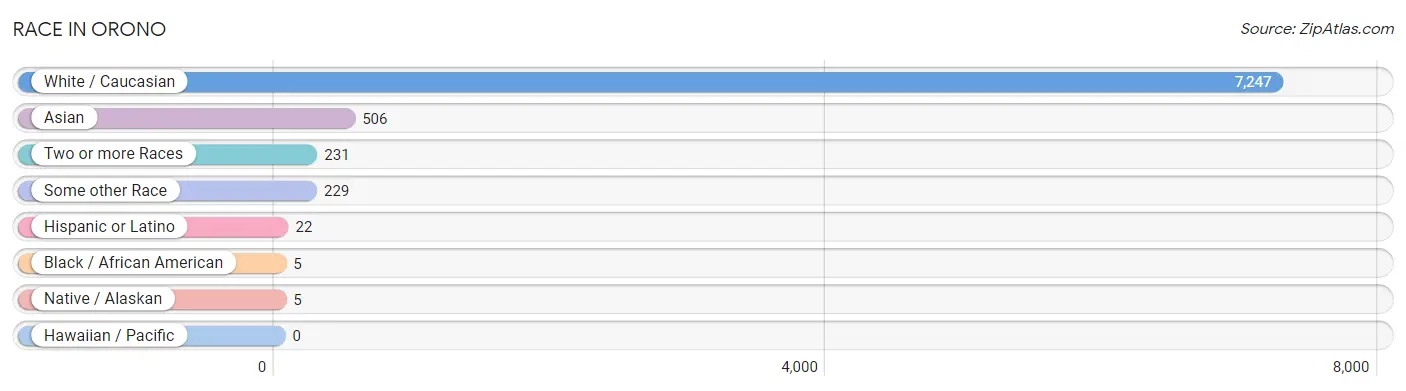
| Race | # Population | % Population |
| Asian | 506 | 6.1% |
| Black / African American | 5 | 0.1% |
| Hawaiian / Pacific | 0 | 0.0% |
| Hispanic or Latino | 22 | 0.3% |
| Native / Alaskan | 5 | 0.1% |
| White / Caucasian | 7,247 | 88.1% |
| Two or more Races | 231 | 2.8% |
| Some other Race | 229 | 2.8% |
| Total | 8,223 | 100.0% |
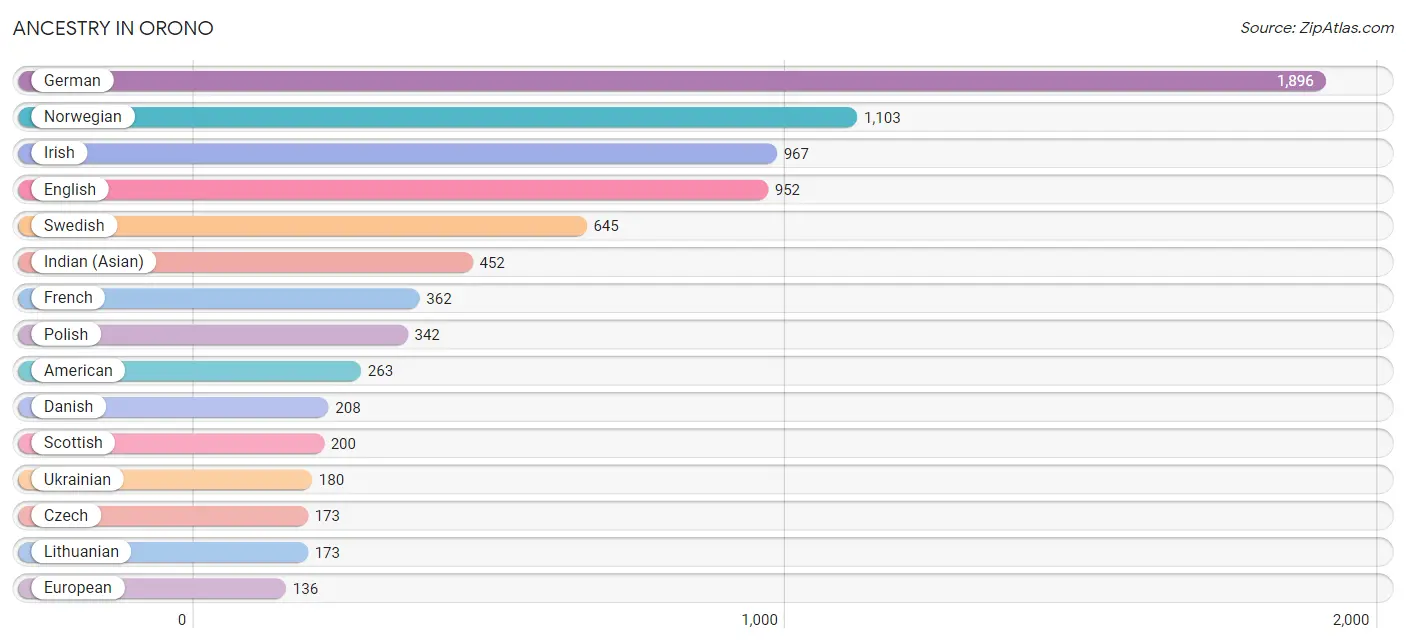
Ancestry in Orono
The most populous ancestries reported in Orono are German (1,896 | 23.1%), Norwegian (1,103 | 13.4%), Irish (967 | 11.8%), English (952 | 11.6%), and Swedish (645 | 7.8%), together accounting for 67.6% of all Orono residents.
| Ancestry | # Population | % Population |
| American | 263 | 3.2% |
| Australian | 80 | 1.0% |
| British | 70 | 0.9% |
| Canadian | 11 | 0.1% |
| Chippewa | 41 | 0.5% |
| Croatian | 85 | 1.0% |
| Czech | 173 | 2.1% |
| Czechoslovakian | 16 | 0.2% |
| Danish | 208 | 2.5% |
| Dutch | 81 | 1.0% |
| Eastern European | 50 | 0.6% |
| English | 952 | 11.6% |
| European | 136 | 1.7% |
| Finnish | 107 | 1.3% |
| French | 362 | 4.4% |
| French American Indian | 9 | 0.1% |
| French Canadian | 69 | 0.8% |
| German | 1,896 | 23.1% |
| Hungarian | 33 | 0.4% |
| Indian (Asian) | 452 | 5.5% |
| Irish | 967 | 11.8% |
| Italian | 121 | 1.5% |
| Korean | 81 | 1.0% |
| Laotian | 37 | 0.4% |
| Lithuanian | 173 | 2.1% |
| Luxembourger | 7 | 0.1% |
| Mexican | 22 | 0.3% |
| Northern European | 14 | 0.2% |
| Norwegian | 1,103 | 13.4% |
| Polish | 342 | 4.2% |
| Portuguese | 105 | 1.3% |
| Romanian | 8 | 0.1% |
| Russian | 15 | 0.2% |
| Scandinavian | 131 | 1.6% |
| Scotch-Irish | 57 | 0.7% |
| Scottish | 200 | 2.4% |
| Serbian | 9 | 0.1% |
| Slovene | 79 | 1.0% |
| Swedish | 645 | 7.8% |
| Swiss | 114 | 1.4% |
| Thai | 34 | 0.4% |
| Ukrainian | 180 | 2.2% |
| Welsh | 56 | 0.7% |
| Yugoslavian | 22 | 0.3% | View All 44 Rows |
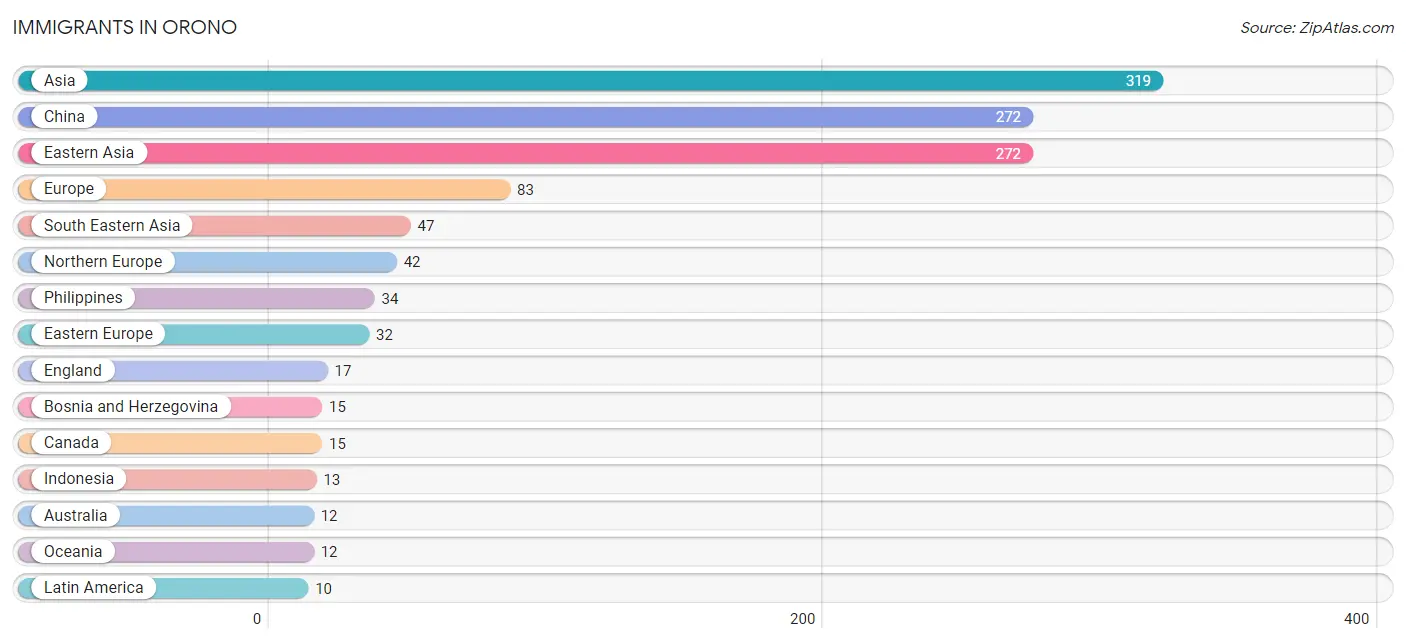
Immigrants in Orono
The most numerous immigrant groups reported in Orono came from Asia (319 | 3.9%), China (272 | 3.3%), Eastern Asia (272 | 3.3%), Europe (83 | 1.0%), and South Eastern Asia (47 | 0.6%), together accounting for 12.1% of all Orono residents.
| Immigration Origin | # Population | % Population |
| Asia | 319 | 3.9% |
| Australia | 12 | 0.2% |
| Bosnia and Herzegovina | 15 | 0.2% |
| Canada | 15 | 0.2% |
| China | 272 | 3.3% |
| Eastern Asia | 272 | 3.3% |
| Eastern Europe | 32 | 0.4% |
| England | 17 | 0.2% |
| Europe | 83 | 1.0% |
| France | 9 | 0.1% |
| Indonesia | 13 | 0.2% |
| Latin America | 10 | 0.1% |
| Northern Europe | 42 | 0.5% |
| Oceania | 12 | 0.2% |
| Philippines | 34 | 0.4% |
| Poland | 9 | 0.1% |
| Russia | 8 | 0.1% |
| South America | 10 | 0.1% |
| South Eastern Asia | 47 | 0.6% |
| Venezuela | 10 | 0.1% |
| Western Europe | 9 | 0.1% | View All 21 Rows |
Sex and Age in Orono
Sex and Age in Orono
The most populous age groups in Orono are 55 to 59 Years (582 | 12.6%) for men and 55 to 59 Years (391 | 10.9%) for women.
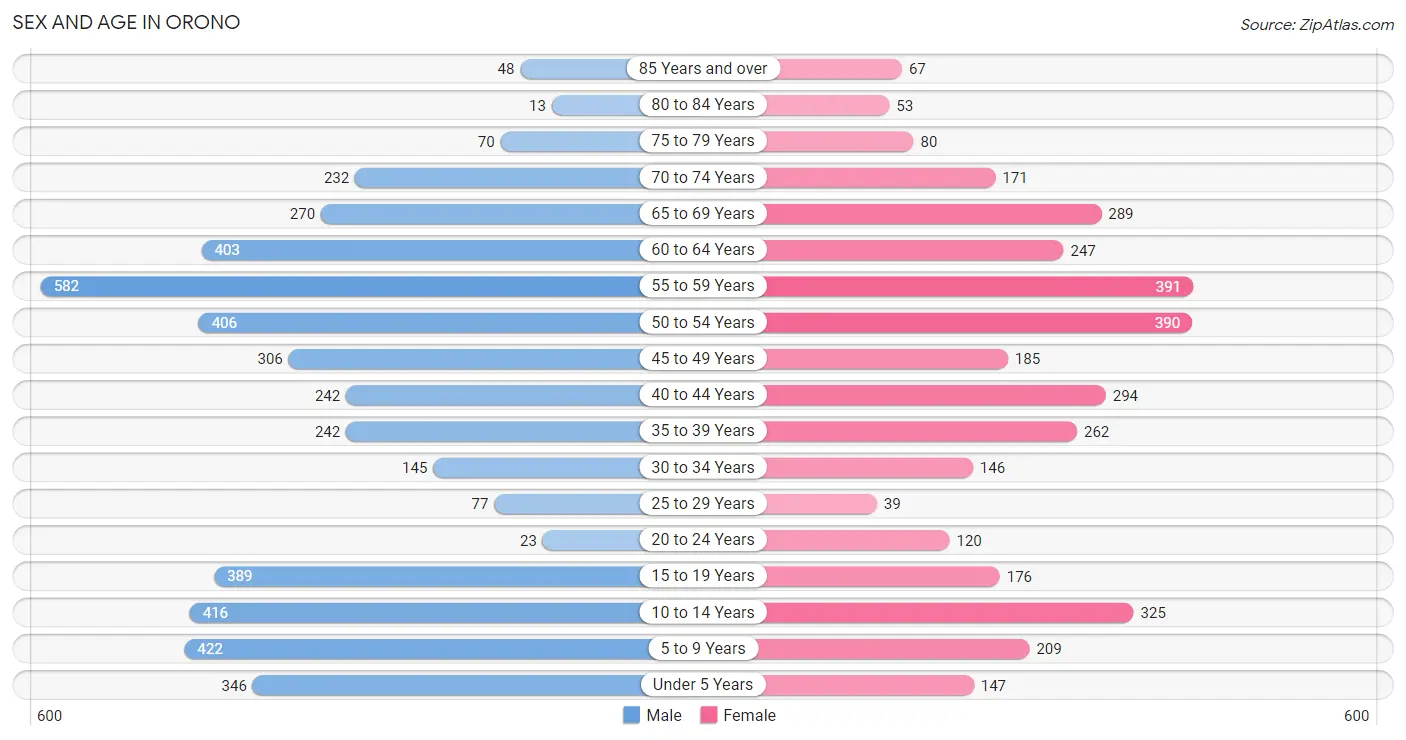
| Age Bracket | Male | Female |
| Under 5 Years | 346 (7.5%) | 147 (4.1%) |
| 5 to 9 Years | 422 (9.1%) | 209 (5.8%) |
| 10 to 14 Years | 416 (9.0%) | 325 (9.0%) |
| 15 to 19 Years | 389 (8.4%) | 176 (4.9%) |
| 20 to 24 Years | 23 (0.5%) | 120 (3.3%) |
| 25 to 29 Years | 77 (1.7%) | 39 (1.1%) |
| 30 to 34 Years | 145 (3.1%) | 146 (4.1%) |
| 35 to 39 Years | 242 (5.2%) | 262 (7.3%) |
| 40 to 44 Years | 242 (5.2%) | 294 (8.2%) |
| 45 to 49 Years | 306 (6.6%) | 185 (5.1%) |
| 50 to 54 Years | 406 (8.8%) | 390 (10.9%) |
| 55 to 59 Years | 582 (12.6%) | 391 (10.9%) |
| 60 to 64 Years | 403 (8.7%) | 247 (6.9%) |
| 65 to 69 Years | 270 (5.8%) | 289 (8.1%) |
| 70 to 74 Years | 232 (5.0%) | 171 (4.8%) |
| 75 to 79 Years | 70 (1.5%) | 80 (2.2%) |
| 80 to 84 Years | 13 (0.3%) | 53 (1.5%) |
| 85 Years and over | 48 (1.0%) | 67 (1.9%) |
| Total | 4,632 (100.0%) | 3,591 (100.0%) |
Families and Households in Orono
Median Family Size in Orono
The median family size in Orono is 3.19 persons per family, with married-couple families (2,057 | 92.9%) accounting for the largest median family size of 3.21 persons per family. On the other hand, single female/mother families (121 | 5.5%) represent the smallest median family size with 2.86 persons per family.
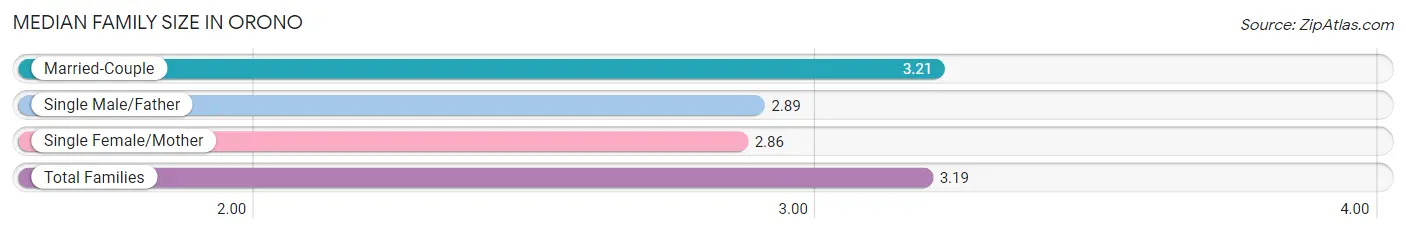
| Family Type | # Families | Family Size |
| Married-Couple | 2,057 (92.9%) | 3.21 |
| Single Male/Father | 36 (1.6%) | 2.89 |
| Single Female/Mother | 121 (5.5%) | 2.86 |
| Total Families | 2,214 (100.0%) | 3.19 |
Median Household Size in Orono
The median household size in Orono is 2.69 persons per household, with married-couple households (2,057 | 67.5%) accounting for the largest median household size of 3.21 persons per household. non-family households (834 | 27.4%) represent the smallest median household size with 1.34 persons per household.
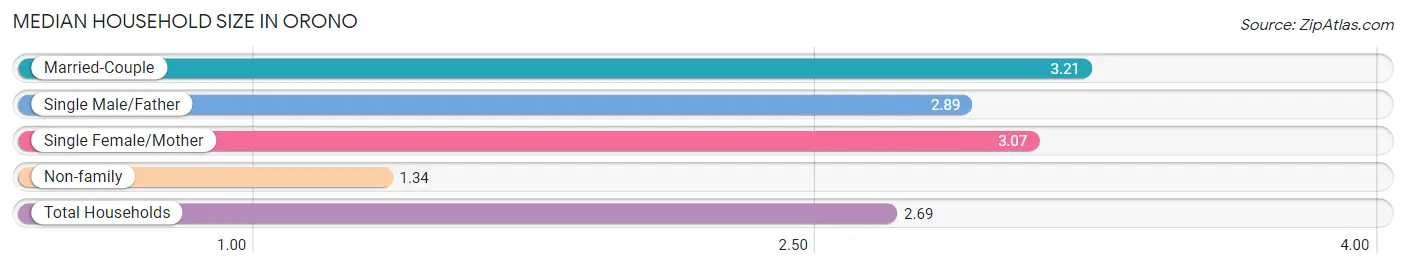
| Household Type | # Households | Household Size |
| Married-Couple | 2,057 (67.5%) | 3.21 |
| Single Male/Father | 36 (1.2%) | 2.89 |
| Single Female/Mother | 121 (4.0%) | 3.07 |
| Non-family | 834 (27.4%) | 1.34 |
| Total Households | 3,048 (100.0%) | 2.69 |
Household Size by Marriage Status in Orono
Out of a total of 3,048 households in Orono, 2,214 (72.6%) are family households, while 834 (27.4%) are nonfamily households. The most numerous type of family households are 2-person households, comprising 955, and the most common type of nonfamily households are 1-person households, comprising 582.
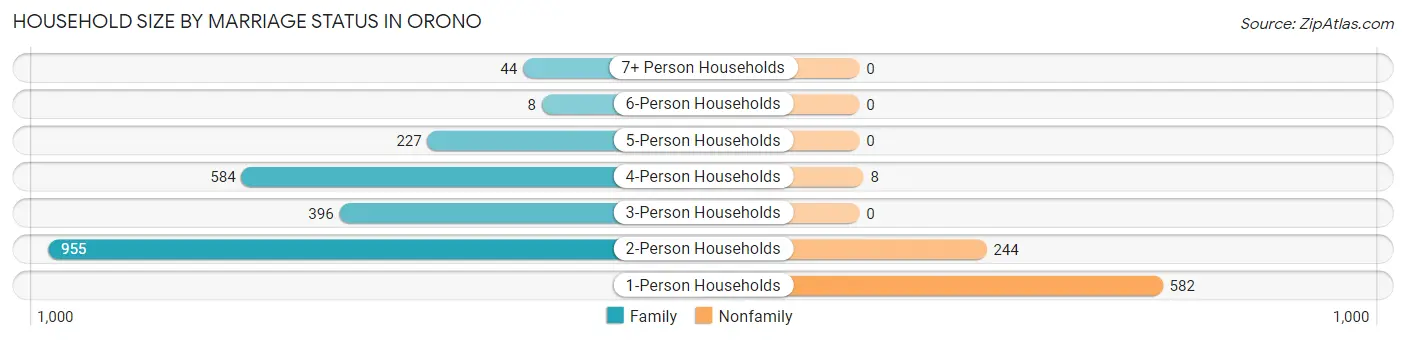
| Household Size | Family Households | Nonfamily Households |
| 1-Person Households | - | 582 (19.1%) |
| 2-Person Households | 955 (31.3%) | 244 (8.0%) |
| 3-Person Households | 396 (13.0%) | 0 (0.0%) |
| 4-Person Households | 584 (19.2%) | 8 (0.3%) |
| 5-Person Households | 227 (7.4%) | 0 (0.0%) |
| 6-Person Households | 8 (0.3%) | 0 (0.0%) |
| 7+ Person Households | 44 (1.4%) | 0 (0.0%) |
| Total | 2,214 (72.6%) | 834 (27.4%) |
Female Fertility in Orono
Fertility by Age in Orono
Average fertility rate in Orono is 36.0 births per 1,000 women. Women in the age bracket of 20 to 34 years have the highest fertility rate with 56.0 births per 1,000 women. Women in the age bracket of 35 to 50 years acount for 65.3% of all women with births.
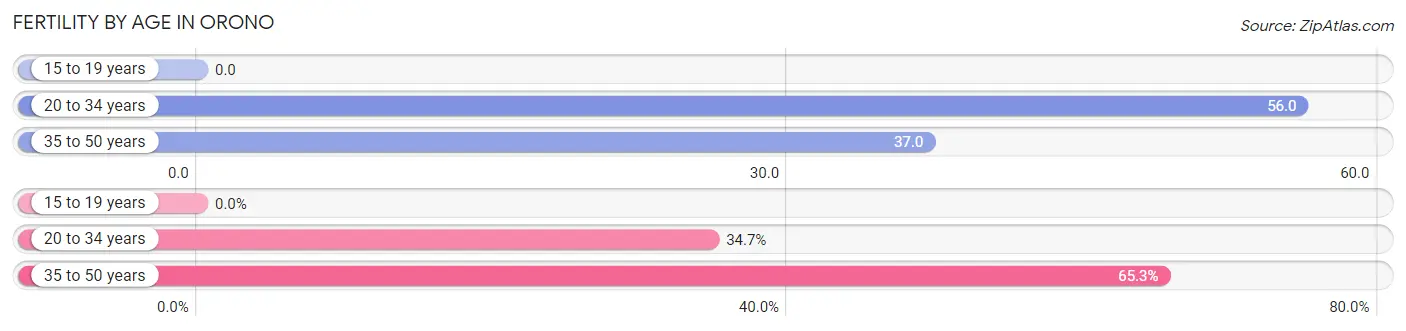
| Age Bracket | Women with Births | Births / 1,000 Women |
| 15 to 19 years | 0 (0.0%) | 0.0 |
| 20 to 34 years | 17 (34.7%) | 56.0 |
| 35 to 50 years | 32 (65.3%) | 37.0 |
| Total | 49 (100.0%) | 36.0 |
Fertility by Age by Marriage Status in Orono
83.7% of women with births (49) in Orono are married. The highest percentage of unmarried women with births falls into 20 to 34 years age bracket with 47.1% of them unmarried at the time of birth, while the lowest percentage of unmarried women with births belong to 35 to 50 years age bracket with 0.0% of them unmarried.
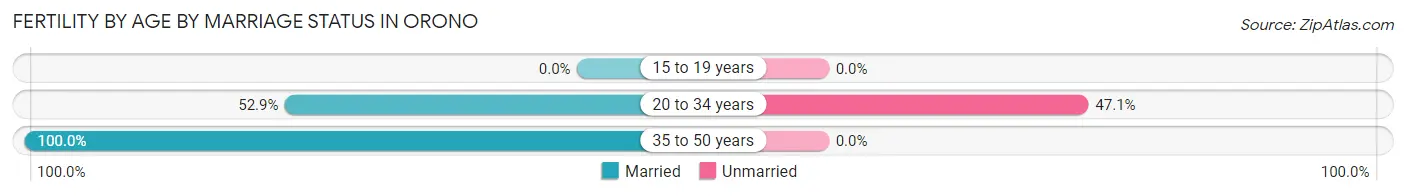
| Age Bracket | Married | Unmarried |
| 15 to 19 years | 0 (0.0%) | 0 (0.0%) |
| 20 to 34 years | 9 (52.9%) | 8 (47.1%) |
| 35 to 50 years | 32 (100.0%) | 0 (0.0%) |
| Total | 41 (83.7%) | 8 (16.3%) |
Fertility by Education in Orono
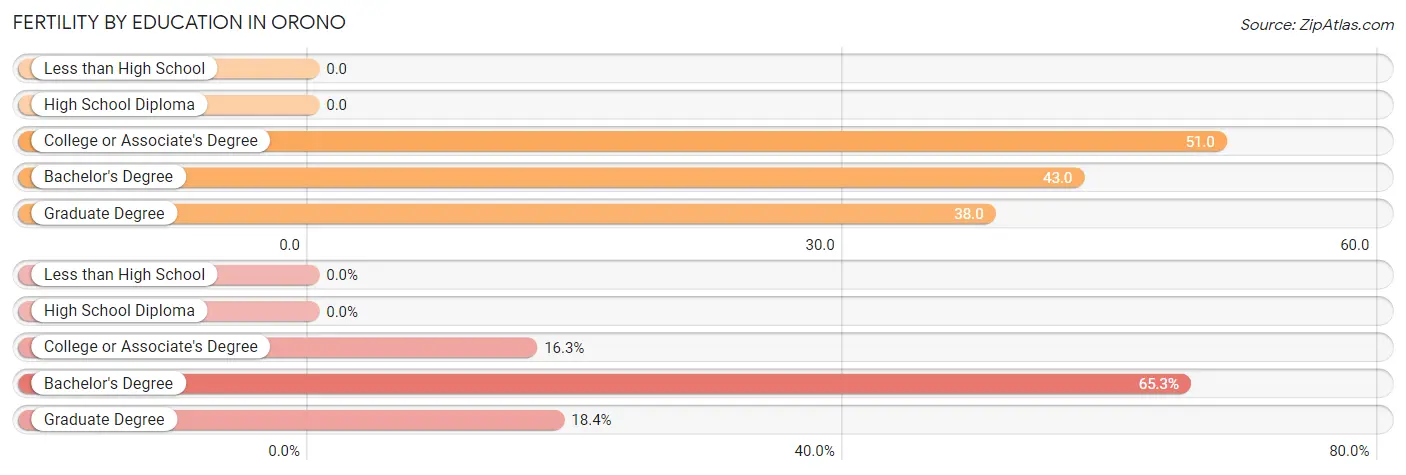
| Educational Attainment | Women with Births | Births / 1,000 Women |
| Less than High School | 0 (0.0%) | 0.0 |
| High School Diploma | 0 (0.0%) | 0.0 |
| College or Associate's Degree | 8 (16.3%) | 51.0 |
| Bachelor's Degree | 32 (65.3%) | 43.0 |
| Graduate Degree | 9 (18.4%) | 38.0 |
| Total | 49 (100.0%) | 36.0 |
Fertility by Education by Marriage Status in Orono
16.3% of women with births in Orono are unmarried. Women with the educational attainment of bachelor's degree are most likely to be married with 100.0% of them married at childbirth, while women with the educational attainment of college or associate's degree are least likely to be married with 100.0% of them unmarried at childbirth.
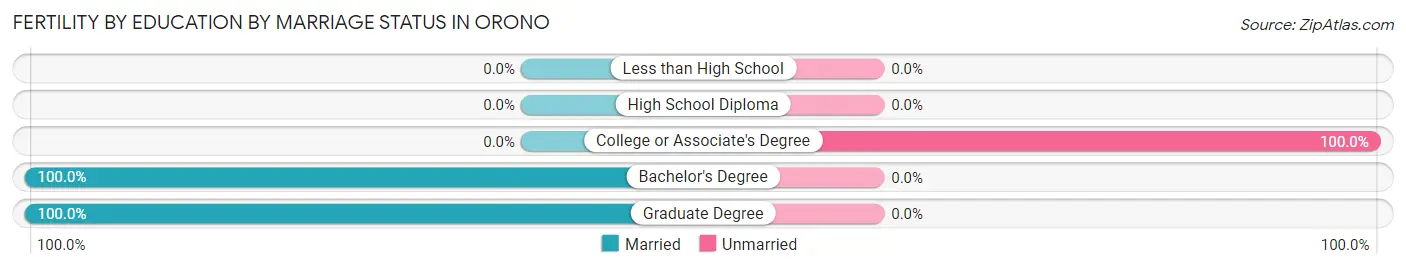
| Educational Attainment | Married | Unmarried |
| Less than High School | 0 (0.0%) | 0 (0.0%) |
| High School Diploma | 0 (0.0%) | 0 (0.0%) |
| College or Associate's Degree | 0 (0.0%) | 8 (100.0%) |
| Bachelor's Degree | 32 (100.0%) | 0 (0.0%) |
| Graduate Degree | 9 (100.0%) | 0 (0.0%) |
| Total | 41 (83.7%) | 8 (16.3%) |
Employment Characteristics in Orono
Employment by Class of Employer in Orono
Among the 3,989 employed individuals in Orono, private company employees (2,318 | 58.1%), self-employed (incorporated) (797 | 20.0%), and self-employed (not incorporated) (340 | 8.5%) make up the most common classes of employment.
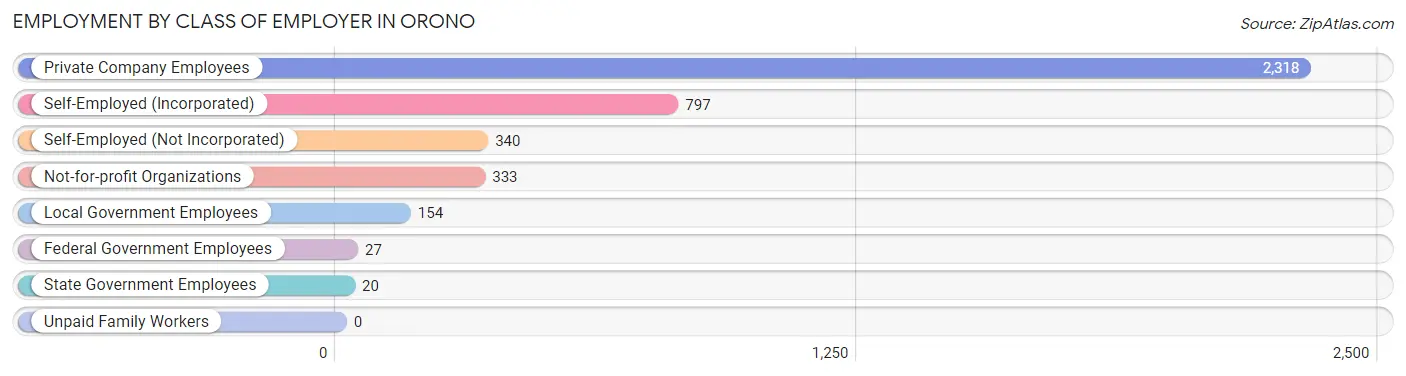
| Employer Class | # Employees | % Employees |
| Private Company Employees | 2,318 | 58.1% |
| Self-Employed (Incorporated) | 797 | 20.0% |
| Self-Employed (Not Incorporated) | 340 | 8.5% |
| Not-for-profit Organizations | 333 | 8.4% |
| Local Government Employees | 154 | 3.9% |
| State Government Employees | 20 | 0.5% |
| Federal Government Employees | 27 | 0.7% |
| Unpaid Family Workers | 0 | 0.0% |
| Total | 3,989 | 100.0% |
Employment Status by Age in Orono
According to the labor force statistics for Orono, out of the total population over 16 years of age (6,243), 68.2% or 4,258 individuals are in the labor force, with 3.2% or 136 of them unemployed. The age group with the highest labor force participation rate is 25 to 29 years, with 100.0% or 116 individuals in the labor force. Within the labor force, the 20 to 24 years age range has the highest percentage of unemployed individuals, with 31.5% or 34 of them being unemployed.
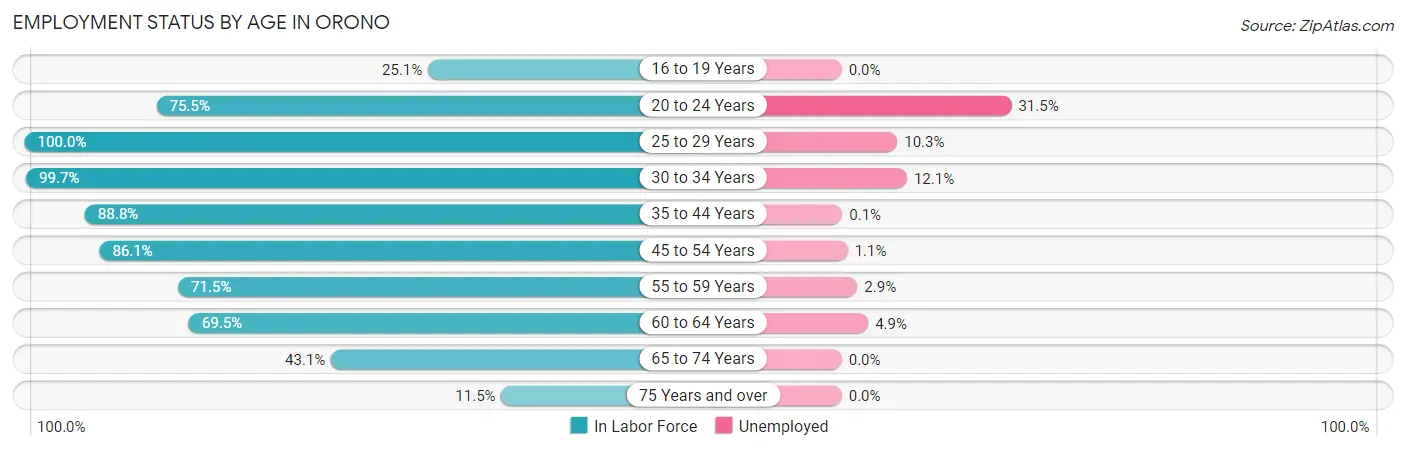
| Age Bracket | In Labor Force | Unemployed |
| 16 to 19 Years | 113 (25.1%) | 0 (0.0%) |
| 20 to 24 Years | 108 (75.5%) | 34 (31.5%) |
| 25 to 29 Years | 116 (100.0%) | 12 (10.3%) |
| 30 to 34 Years | 290 (99.7%) | 35 (12.1%) |
| 35 to 44 Years | 924 (88.8%) | 1 (0.1%) |
| 45 to 54 Years | 1,108 (86.1%) | 12 (1.1%) |
| 55 to 59 Years | 696 (71.5%) | 20 (2.9%) |
| 60 to 64 Years | 452 (69.5%) | 22 (4.9%) |
| 65 to 74 Years | 415 (43.1%) | 0 (0.0%) |
| 75 Years and over | 38 (11.5%) | 0 (0.0%) |
| Total | 4,258 (68.2%) | 136 (3.2%) |
Employment Status by Educational Attainment in Orono
According to labor force statistics for Orono, 82.3% of individuals (3,586) out of the total population between 25 and 64 years of age (4,357) are in the labor force, with 2.8% or 100 of them being unemployed. The group with the highest labor force participation rate are those with the educational attainment of bachelor's degree or higher, with 86.2% or 2,768 individuals in the labor force. Within the labor force, individuals with high school diploma education have the highest percentage of unemployment, with 4.4% or 11 of them being unemployed.
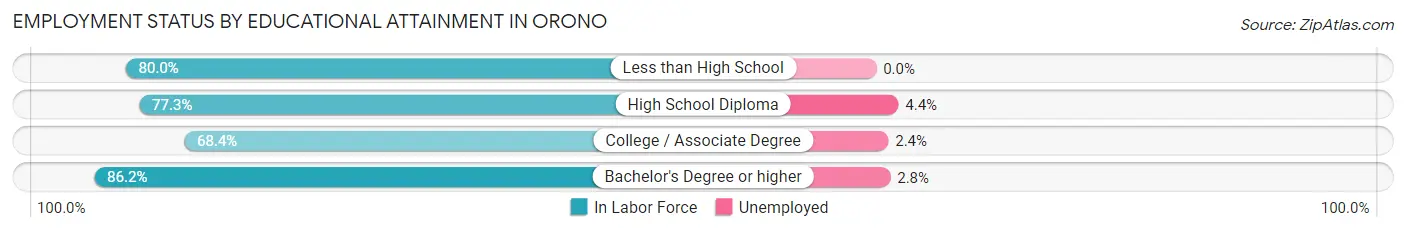
| Educational Attainment | In Labor Force | Unemployed |
| Less than High School | 24 (80.0%) | 0 (0.0%) |
| High School Diploma | 252 (77.3%) | 14 (4.4%) |
| College / Associate Degree | 540 (68.4%) | 19 (2.4%) |
| Bachelor's Degree or higher | 2,768 (86.2%) | 90 (2.8%) |
| Total | 3,586 (82.3%) | 122 (2.8%) |
Employment Occupations by Sex in Orono
Management, Business, Science and Arts Occupations
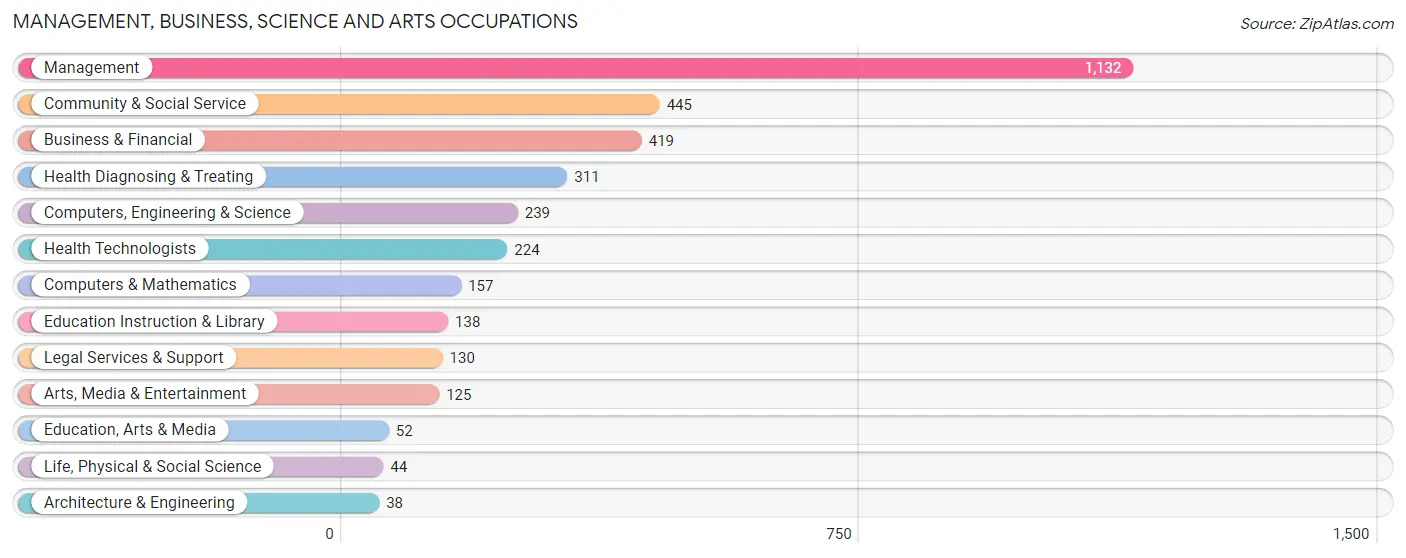
The most common Management, Business, Science and Arts occupations in Orono are Management (1,132 | 27.5%), Community & Social Service (445 | 10.8%), Business & Financial (419 | 10.2%), Health Diagnosing & Treating (311 | 7.5%), and Computers, Engineering & Science (239 | 5.8%).
Management, Business, Science and Arts Occupations by Sex
Within the Management, Business, Science and Arts occupations in Orono, the most male-oriented occupations are Architecture & Engineering (100.0%), Computers & Mathematics (86.0%), and Legal Services & Support (83.1%), while the most female-oriented occupations are Education Instruction & Library (92.7%), Education, Arts & Media (80.8%), and Life, Physical & Social Science (72.7%).
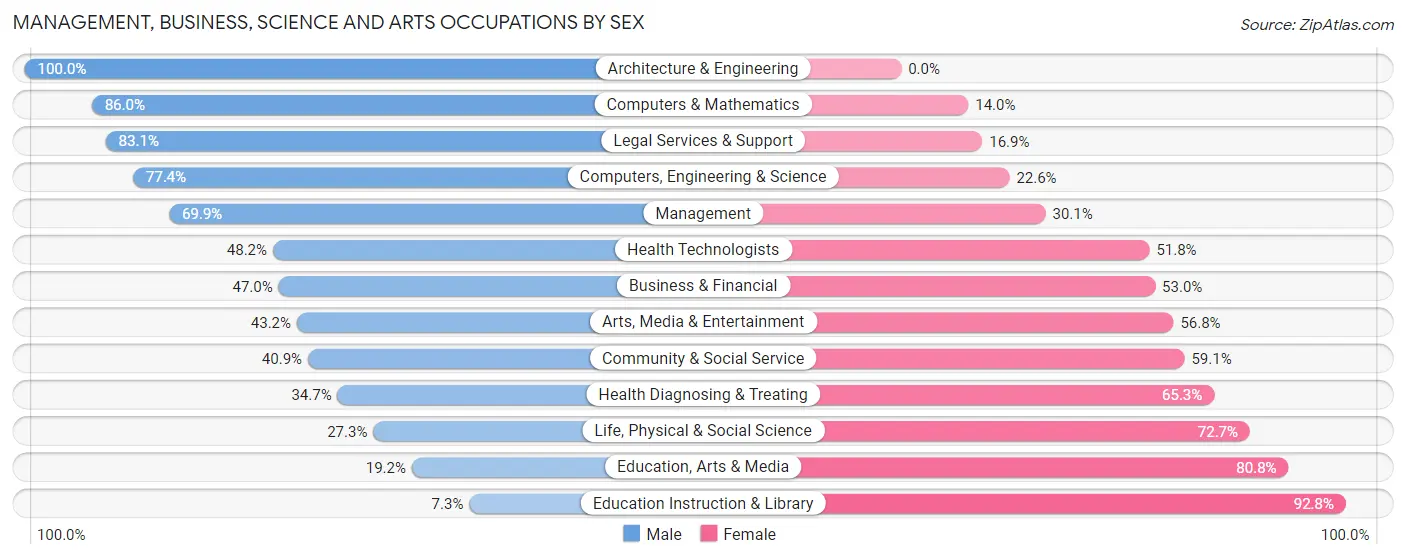
| Occupation | Male | Female |
| Management | 791 (69.9%) | 341 (30.1%) |
| Business & Financial | 197 (47.0%) | 222 (53.0%) |
| Computers, Engineering & Science | 185 (77.4%) | 54 (22.6%) |
| Computers & Mathematics | 135 (86.0%) | 22 (14.0%) |
| Architecture & Engineering | 38 (100.0%) | 0 (0.0%) |
| Life, Physical & Social Science | 12 (27.3%) | 32 (72.7%) |
| Community & Social Service | 182 (40.9%) | 263 (59.1%) |
| Education, Arts & Media | 10 (19.2%) | 42 (80.8%) |
| Legal Services & Support | 108 (83.1%) | 22 (16.9%) |
| Education Instruction & Library | 10 (7.2%) | 128 (92.7%) |
| Arts, Media & Entertainment | 54 (43.2%) | 71 (56.8%) |
| Health Diagnosing & Treating | 108 (34.7%) | 203 (65.3%) |
| Health Technologists | 108 (48.2%) | 116 (51.8%) |
| Total (Category) | 1,463 (57.5%) | 1,083 (42.5%) |
| Total (Overall) | 2,430 (58.9%) | 1,693 (41.1%) |
Services Occupations
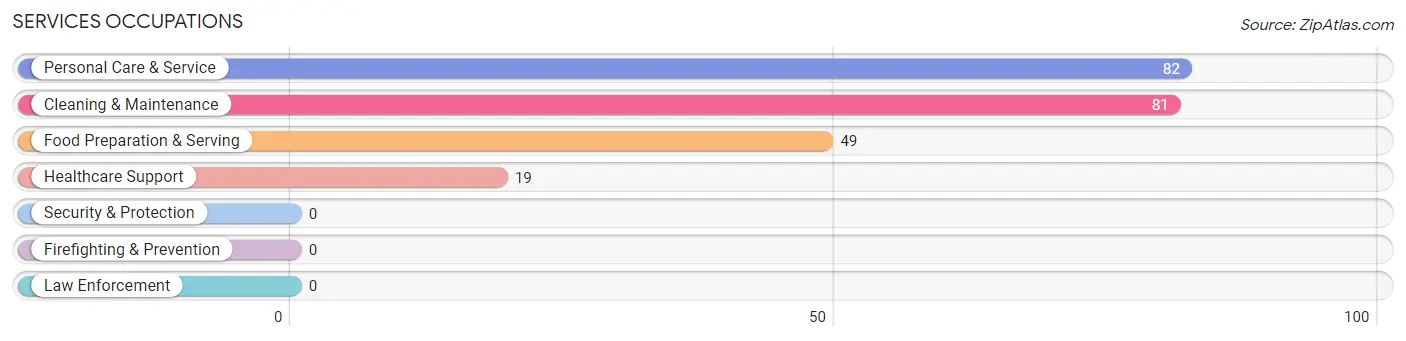
The most common Services occupations in Orono are Personal Care & Service (82 | 2.0%), Cleaning & Maintenance (81 | 2.0%), Food Preparation & Serving (49 | 1.2%), and Healthcare Support (19 | 0.5%).
Services Occupations by Sex
Within the Services occupations in Orono, the most male-oriented occupations are Cleaning & Maintenance (100.0%), Food Preparation & Serving (55.1%), and Personal Care & Service (26.8%), while the most female-oriented occupations are Healthcare Support (100.0%), Personal Care & Service (73.2%), and Food Preparation & Serving (44.9%).
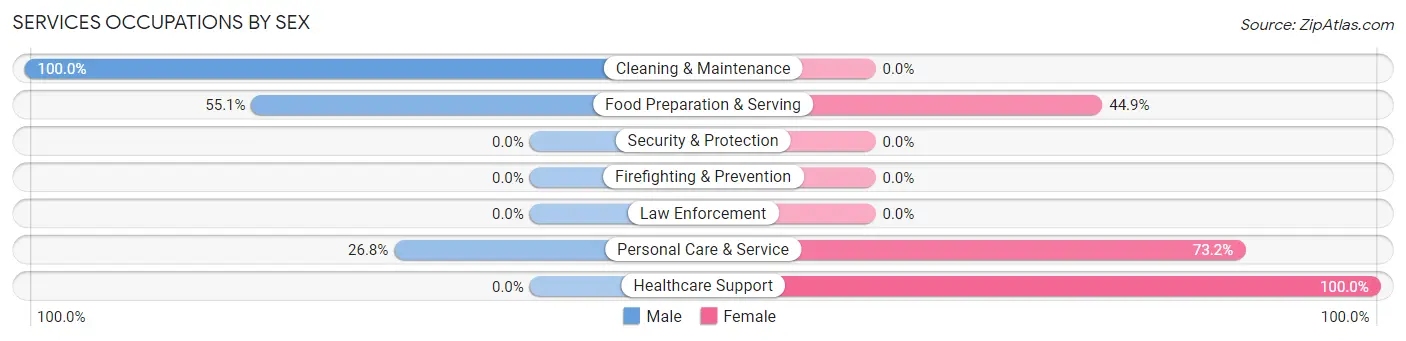
| Occupation | Male | Female |
| Healthcare Support | 0 (0.0%) | 19 (100.0%) |
| Security & Protection | 0 (0.0%) | 0 (0.0%) |
| Firefighting & Prevention | 0 (0.0%) | 0 (0.0%) |
| Law Enforcement | 0 (0.0%) | 0 (0.0%) |
| Food Preparation & Serving | 27 (55.1%) | 22 (44.9%) |
| Cleaning & Maintenance | 81 (100.0%) | 0 (0.0%) |
| Personal Care & Service | 22 (26.8%) | 60 (73.2%) |
| Total (Category) | 130 (56.3%) | 101 (43.7%) |
| Total (Overall) | 2,430 (58.9%) | 1,693 (41.1%) |
Sales and Office Occupations
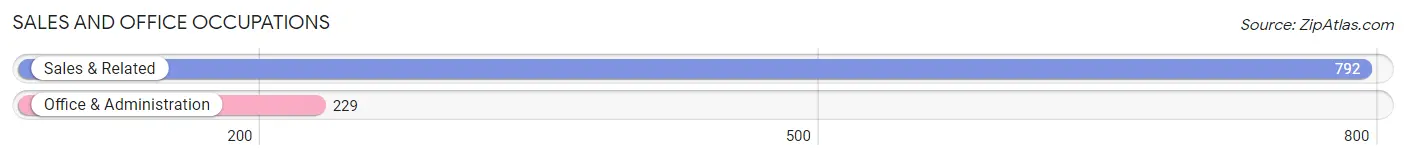
The most common Sales and Office occupations in Orono are Sales & Related (792 | 19.2%), and Office & Administration (229 | 5.6%).
Sales and Office Occupations by Sex
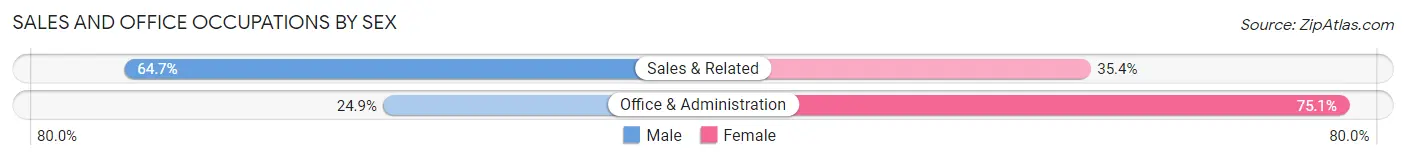
| Occupation | Male | Female |
| Sales & Related | 512 (64.6%) | 280 (35.3%) |
| Office & Administration | 57 (24.9%) | 172 (75.1%) |
| Total (Category) | 569 (55.7%) | 452 (44.3%) |
| Total (Overall) | 2,430 (58.9%) | 1,693 (41.1%) |
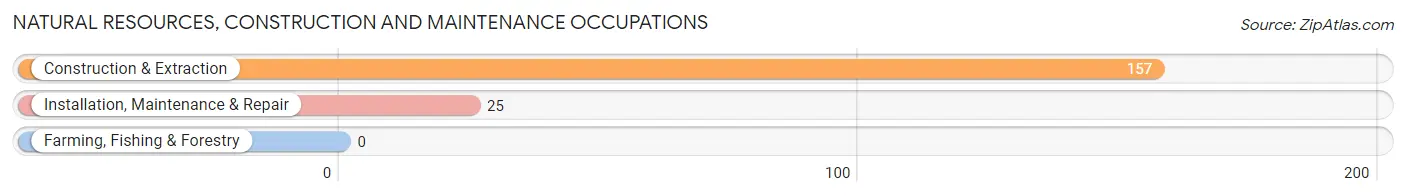
Natural Resources, Construction and Maintenance Occupations
The most common Natural Resources, Construction and Maintenance occupations in Orono are Construction & Extraction (157 | 3.8%), and Installation, Maintenance & Repair (25 | 0.6%).
Natural Resources, Construction and Maintenance Occupations by Sex
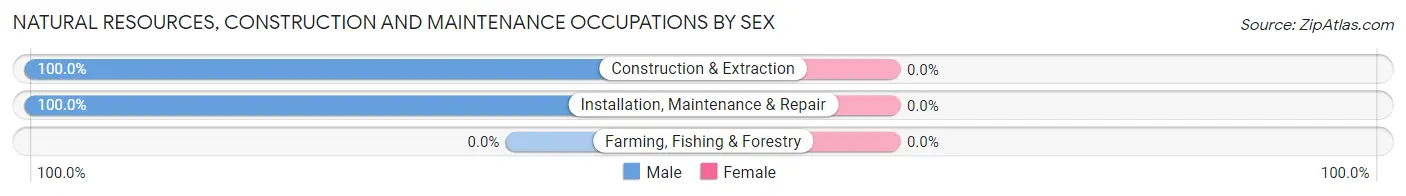
| Occupation | Male | Female |
| Farming, Fishing & Forestry | 0 (0.0%) | 0 (0.0%) |
| Construction & Extraction | 157 (100.0%) | 0 (0.0%) |
| Installation, Maintenance & Repair | 25 (100.0%) | 0 (0.0%) |
| Total (Category) | 182 (100.0%) | 0 (0.0%) |
| Total (Overall) | 2,430 (58.9%) | 1,693 (41.1%) |
Production, Transportation and Moving Occupations
The most common Production, Transportation and Moving occupations in Orono are Transportation (97 | 2.4%), Material Moving (27 | 0.6%), and Production (19 | 0.5%).
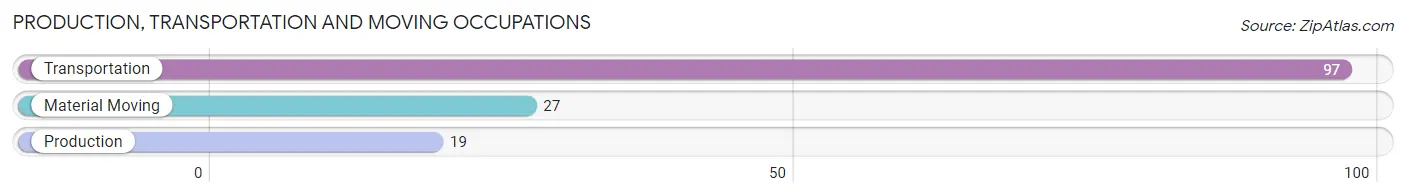
Production, Transportation and Moving Occupations by Sex
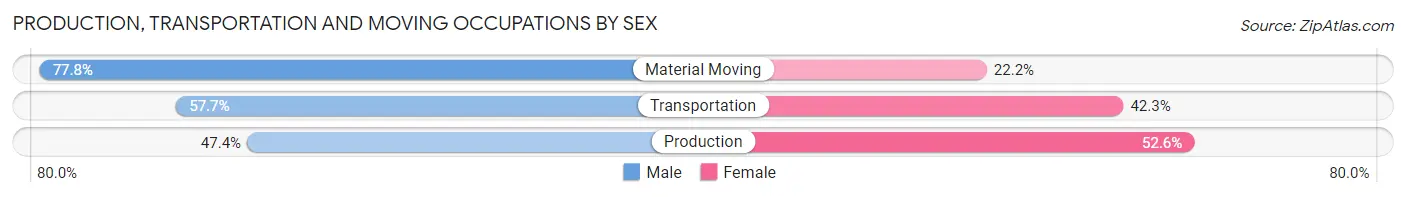
| Occupation | Male | Female |
| Production | 9 (47.4%) | 10 (52.6%) |
| Transportation | 56 (57.7%) | 41 (42.3%) |
| Material Moving | 21 (77.8%) | 6 (22.2%) |
| Total (Category) | 86 (60.1%) | 57 (39.9%) |
| Total (Overall) | 2,430 (58.9%) | 1,693 (41.1%) |
Employment Industries by Sex in Orono
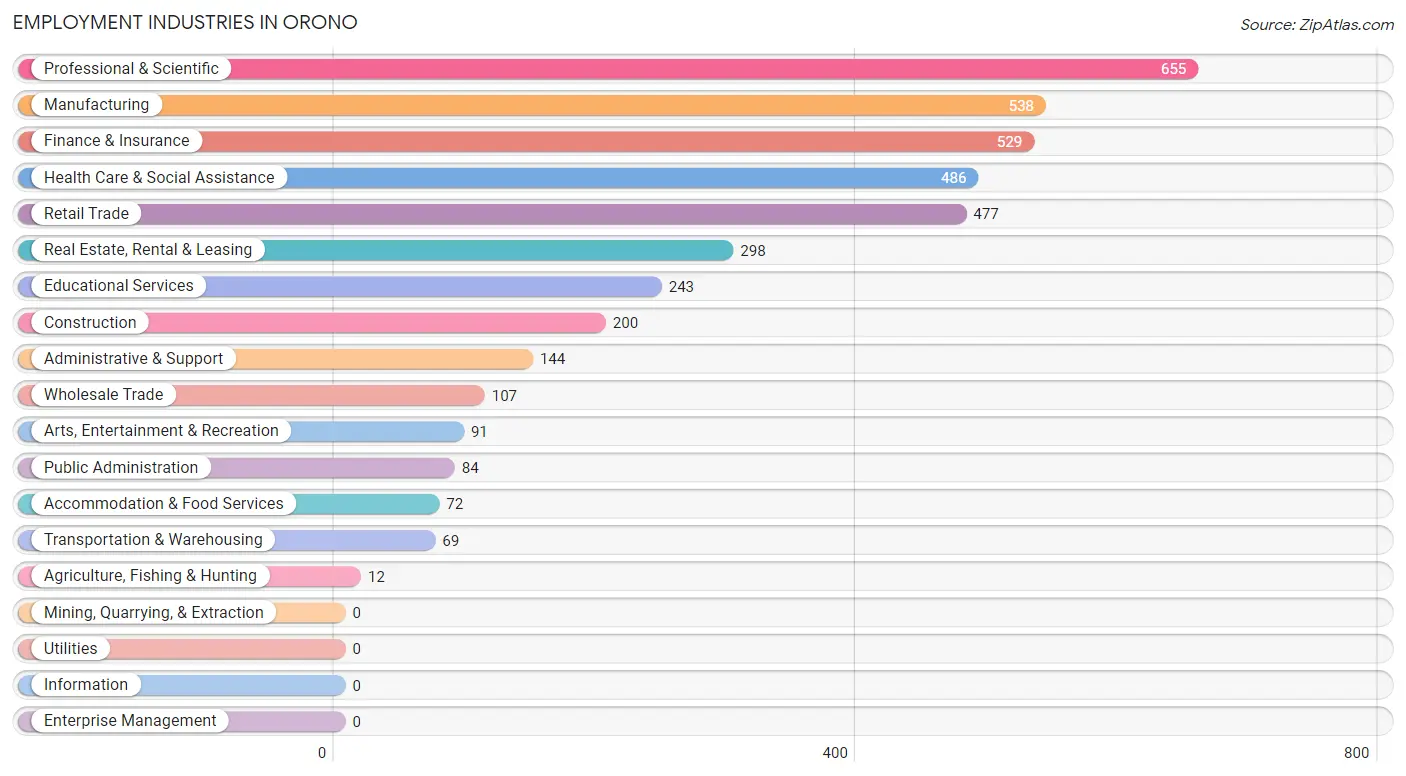
Employment Industries in Orono
The major employment industries in Orono include Professional & Scientific (655 | 15.9%), Manufacturing (538 | 13.1%), Finance & Insurance (529 | 12.8%), Health Care & Social Assistance (486 | 11.8%), and Retail Trade (477 | 11.6%).
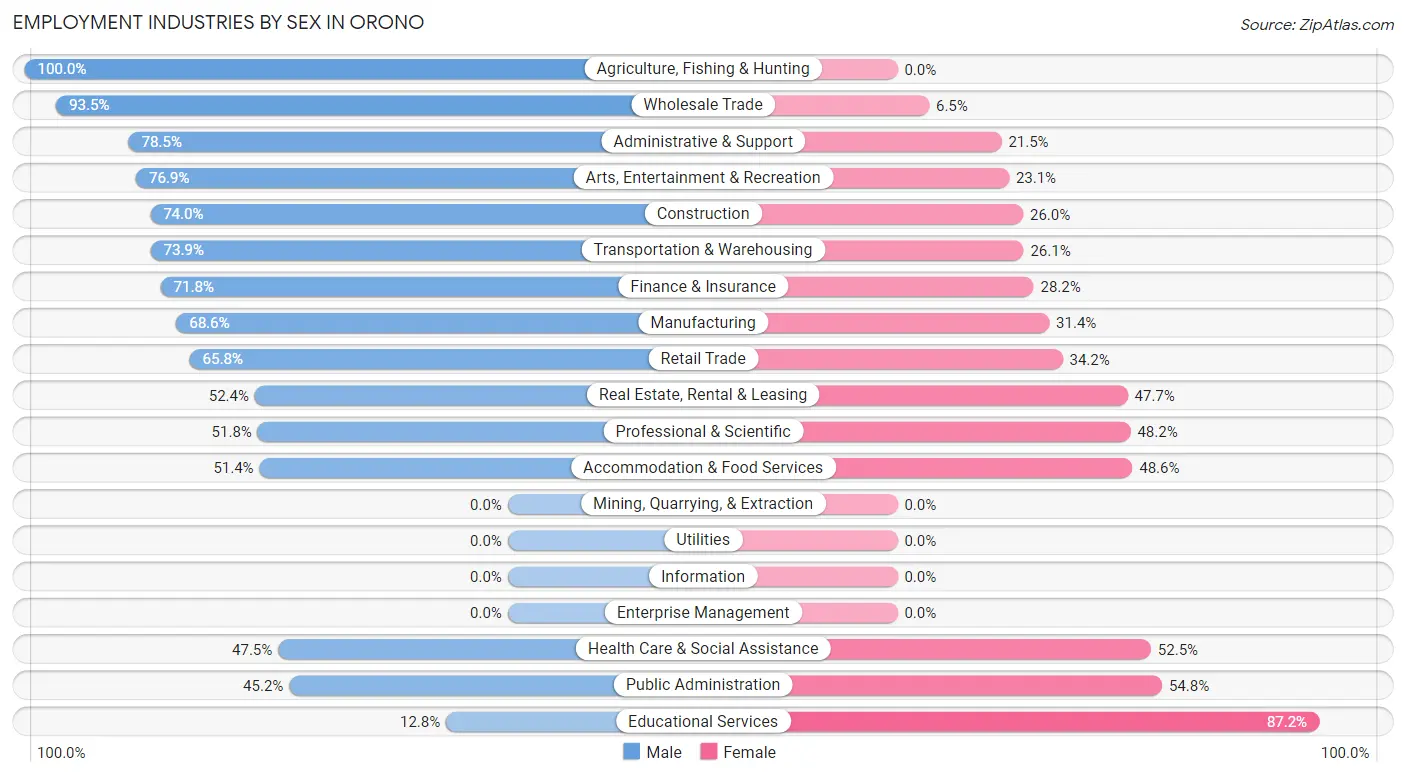
Employment Industries by Sex in Orono
The Orono industries that see more men than women are Agriculture, Fishing & Hunting (100.0%), Wholesale Trade (93.5%), and Administrative & Support (78.5%), whereas the industries that tend to have a higher number of women are Educational Services (87.2%), Public Administration (54.8%), and Health Care & Social Assistance (52.5%).
| Industry | Male | Female |
| Agriculture, Fishing & Hunting | 12 (100.0%) | 0 (0.0%) |
| Mining, Quarrying, & Extraction | 0 (0.0%) | 0 (0.0%) |
| Construction | 148 (74.0%) | 52 (26.0%) |
| Manufacturing | 369 (68.6%) | 169 (31.4%) |
| Wholesale Trade | 100 (93.5%) | 7 (6.5%) |
| Retail Trade | 314 (65.8%) | 163 (34.2%) |
| Transportation & Warehousing | 51 (73.9%) | 18 (26.1%) |
| Utilities | 0 (0.0%) | 0 (0.0%) |
| Information | 0 (0.0%) | 0 (0.0%) |
| Finance & Insurance | 380 (71.8%) | 149 (28.2%) |
| Real Estate, Rental & Leasing | 156 (52.3%) | 142 (47.6%) |
| Professional & Scientific | 339 (51.8%) | 316 (48.2%) |
| Enterprise Management | 0 (0.0%) | 0 (0.0%) |
| Administrative & Support | 113 (78.5%) | 31 (21.5%) |
| Educational Services | 31 (12.8%) | 212 (87.2%) |
| Health Care & Social Assistance | 231 (47.5%) | 255 (52.5%) |
| Arts, Entertainment & Recreation | 70 (76.9%) | 21 (23.1%) |
| Accommodation & Food Services | 37 (51.4%) | 35 (48.6%) |
| Public Administration | 38 (45.2%) | 46 (54.8%) |
| Total | 2,430 (58.9%) | 1,693 (41.1%) |
Education in Orono
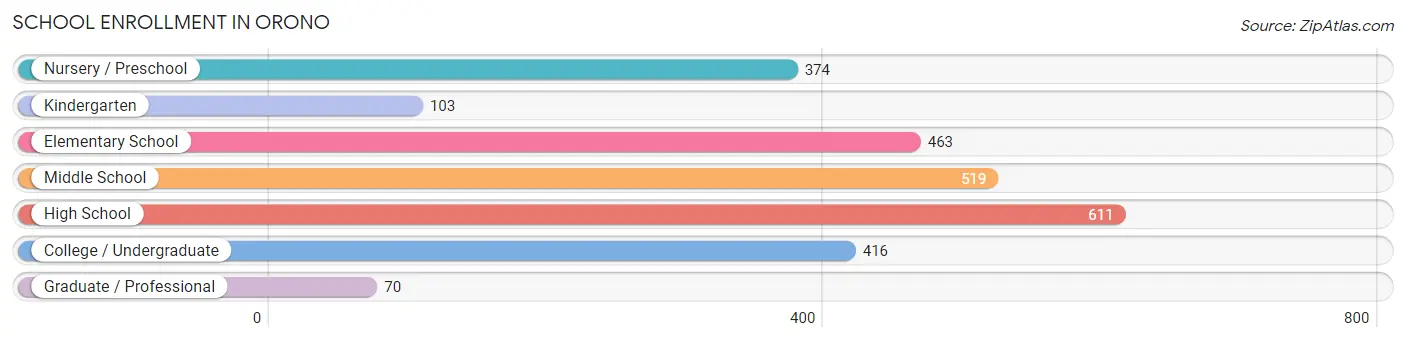
School Enrollment in Orono
The most common levels of schooling among the 2,556 students in Orono are high school (611 | 23.9%), middle school (519 | 20.3%), and elementary school (463 | 18.1%).
| School Level | # Students | % Students |
| Nursery / Preschool | 374 | 14.6% |
| Kindergarten | 103 | 4.0% |
| Elementary School | 463 | 18.1% |
| Middle School | 519 | 20.3% |
| High School | 611 | 23.9% |
| College / Undergraduate | 416 | 16.3% |
| Graduate / Professional | 70 | 2.7% |
| Total | 2,556 | 100.0% |
School Enrollment by Age by Funding Source in Orono
Out of a total of 2,556 students who are enrolled in schools in Orono, 575 (22.5%) attend a private institution, while the remaining 1,981 (77.5%) are enrolled in public schools. The age group of 25 to 34 year olds has the highest likelihood of being enrolled in private schools, with 16 (45.7% in the age bracket) enrolled. Conversely, the age group of 15 to 17 year olds has the lowest likelihood of being enrolled in a private school, with 310 (93.4% in the age bracket) attending a public institution.
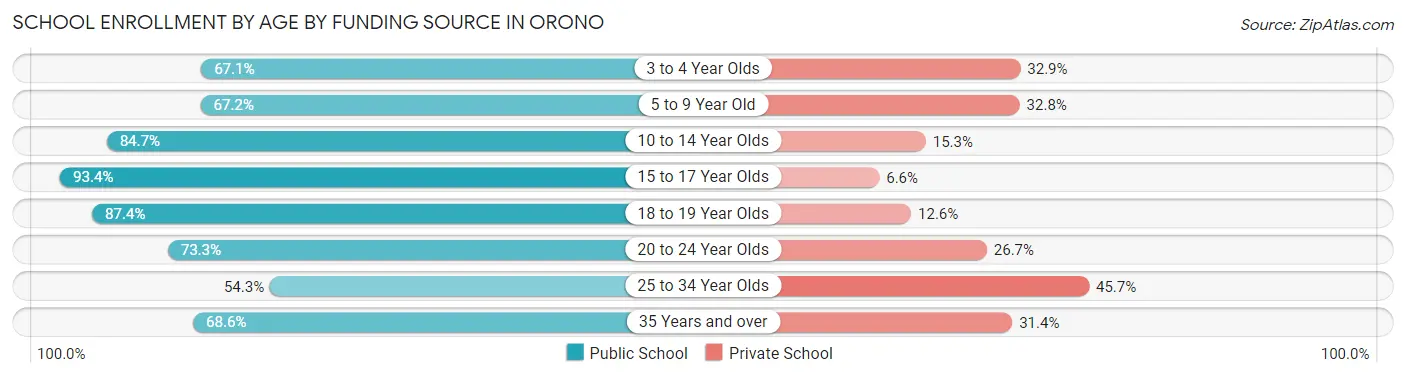
| Age Bracket | Public School | Private School |
| 3 to 4 Year Olds | 159 (67.1%) | 78 (32.9%) |
| 5 to 9 Year Old | 408 (67.2%) | 199 (32.8%) |
| 10 to 14 Year Olds | 609 (84.7%) | 110 (15.3%) |
| 15 to 17 Year Olds | 310 (93.4%) | 22 (6.6%) |
| 18 to 19 Year Olds | 195 (87.4%) | 28 (12.6%) |
| 20 to 24 Year Olds | 55 (73.3%) | 20 (26.7%) |
| 25 to 34 Year Olds | 19 (54.3%) | 16 (45.7%) |
| 35 Years and over | 225 (68.6%) | 103 (31.4%) |
| Total | 1,981 (77.5%) | 575 (22.5%) |
Educational Attainment by Field of Study in Orono
Business (1,199 | 28.4%), social sciences (463 | 11.0%), visual & performing arts (339 | 8.0%), education (323 | 7.6%), and science & technology (301 | 7.1%) are the most common fields of study among 4,227 individuals in Orono who have obtained a bachelor's degree or higher.
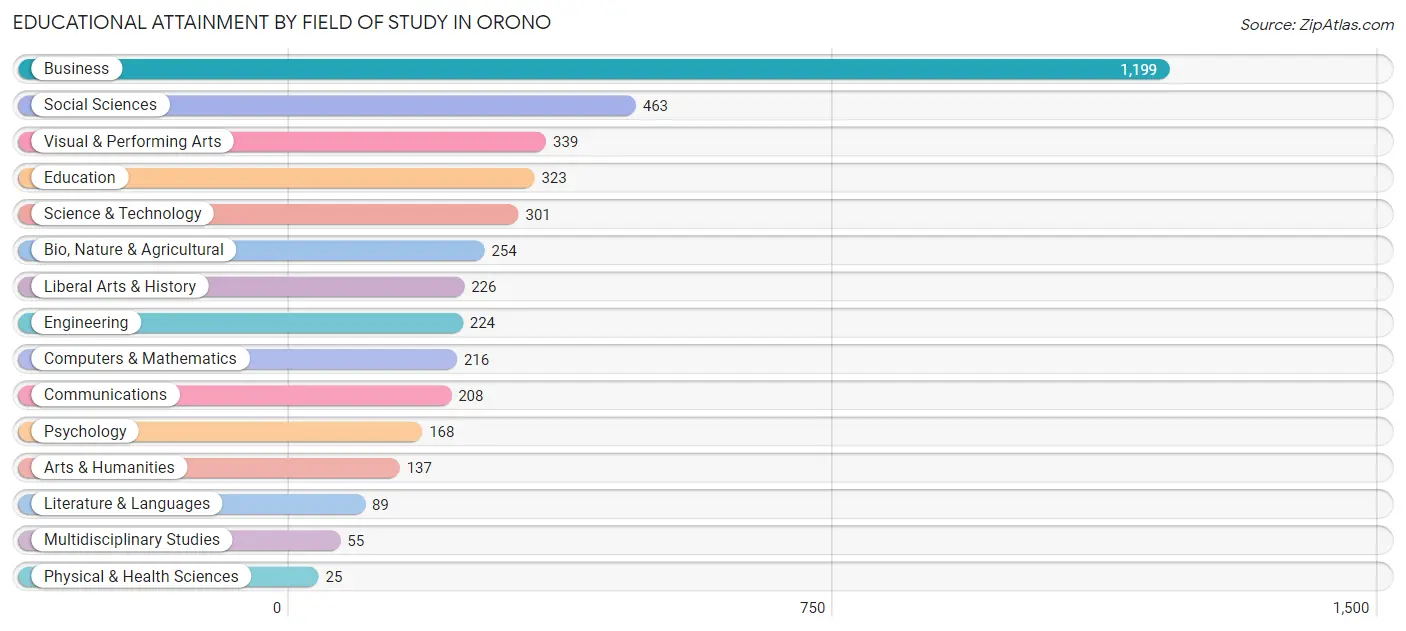
| Field of Study | # Graduates | % Graduates |
| Computers & Mathematics | 216 | 5.1% |
| Bio, Nature & Agricultural | 254 | 6.0% |
| Physical & Health Sciences | 25 | 0.6% |
| Psychology | 168 | 4.0% |
| Social Sciences | 463 | 11.0% |
| Engineering | 224 | 5.3% |
| Multidisciplinary Studies | 55 | 1.3% |
| Science & Technology | 301 | 7.1% |
| Business | 1,199 | 28.4% |
| Education | 323 | 7.6% |
| Literature & Languages | 89 | 2.1% |
| Liberal Arts & History | 226 | 5.3% |
| Visual & Performing Arts | 339 | 8.0% |
| Communications | 208 | 4.9% |
| Arts & Humanities | 137 | 3.2% |
| Total | 4,227 | 100.0% |
Transportation & Commute in Orono
Vehicle Availability by Sex in Orono
The most prevalent vehicle ownership categories in Orono are males with 2 vehicles (927, accounting for 40.0%) and females with 2 vehicles (870, making up 55.6%).
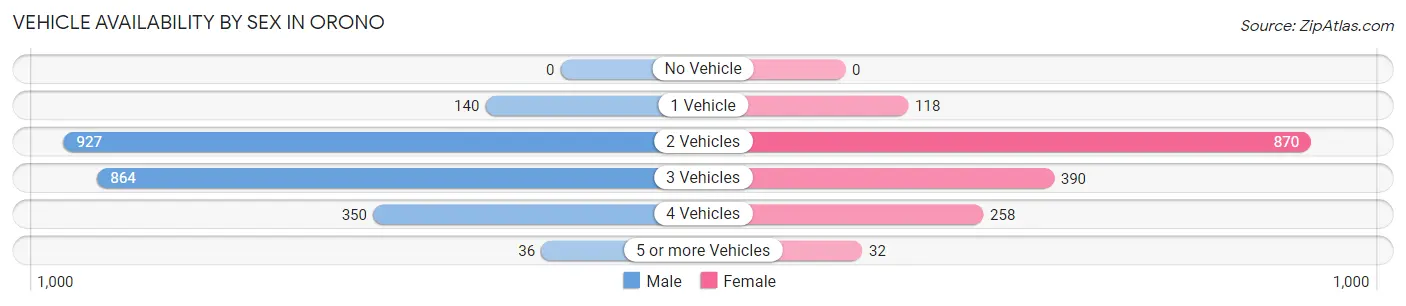
| Vehicles Available | Male | Female |
| No Vehicle | 0 (0.0%) | 0 (0.0%) |
| 1 Vehicle | 140 (6.0%) | 118 (7.1%) |
| 2 Vehicles | 927 (40.0%) | 870 (52.2%) |
| 3 Vehicles | 864 (37.3%) | 390 (23.4%) |
| 4 Vehicles | 350 (15.1%) | 258 (15.5%) |
| 5 or more Vehicles | 36 (1.5%) | 32 (1.9%) |
| Total | 2,317 (100.0%) | 1,668 (100.0%) |
Commute Time in Orono
The most frequently occuring commute durations in Orono are 20 to 24 minutes (584 commuters, 21.0%), 30 to 34 minutes (431 commuters, 15.5%), and 25 to 29 minutes (324 commuters, 11.7%).
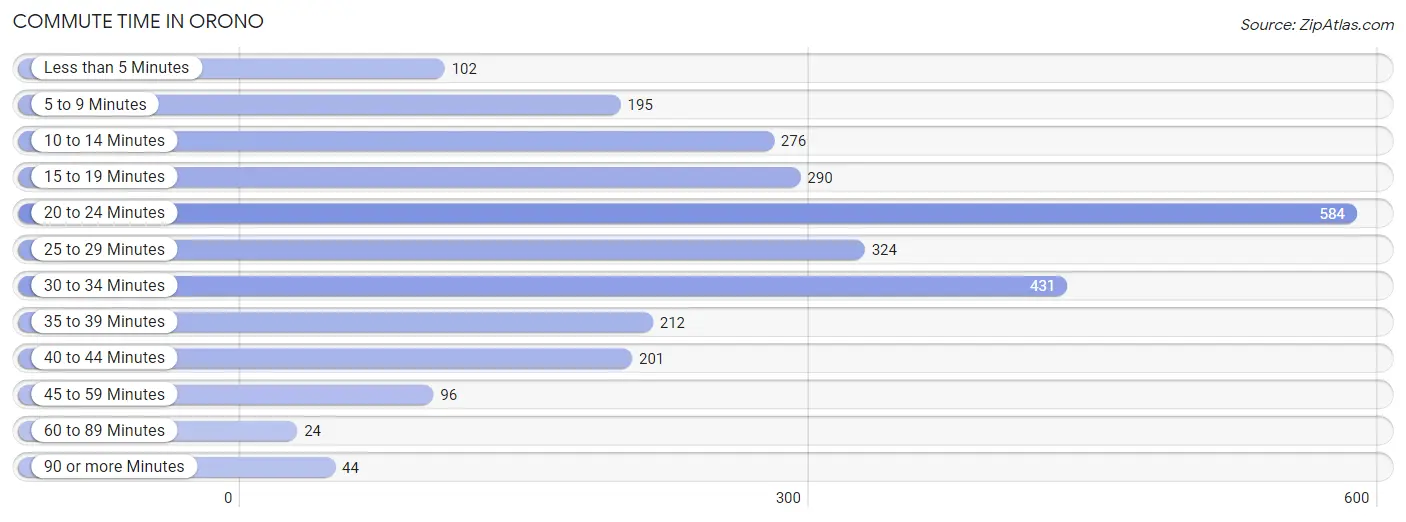
| Commute Time | # Commuters | % Commuters |
| Less than 5 Minutes | 102 | 3.7% |
| 5 to 9 Minutes | 195 | 7.0% |
| 10 to 14 Minutes | 276 | 9.9% |
| 15 to 19 Minutes | 290 | 10.4% |
| 20 to 24 Minutes | 584 | 21.0% |
| 25 to 29 Minutes | 324 | 11.7% |
| 30 to 34 Minutes | 431 | 15.5% |
| 35 to 39 Minutes | 212 | 7.6% |
| 40 to 44 Minutes | 201 | 7.2% |
| 45 to 59 Minutes | 96 | 3.5% |
| 60 to 89 Minutes | 24 | 0.9% |
| 90 or more Minutes | 44 | 1.6% |
Commute Time by Sex in Orono
The most common commute times in Orono are 20 to 24 minutes (368 commuters, 22.9%) for males and 30 to 34 minutes (232 commuters, 19.8%) for females.
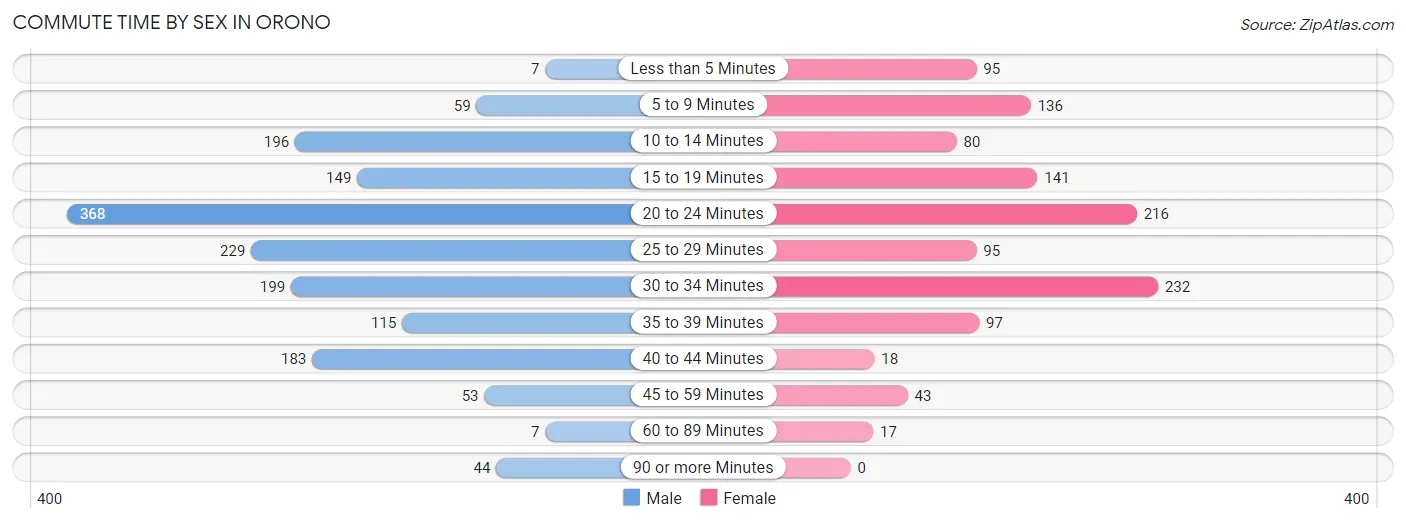
| Commute Time | Male | Female |
| Less than 5 Minutes | 7 (0.4%) | 95 (8.1%) |
| 5 to 9 Minutes | 59 (3.7%) | 136 (11.6%) |
| 10 to 14 Minutes | 196 (12.2%) | 80 (6.8%) |
| 15 to 19 Minutes | 149 (9.3%) | 141 (12.0%) |
| 20 to 24 Minutes | 368 (22.9%) | 216 (18.5%) |
| 25 to 29 Minutes | 229 (14.2%) | 95 (8.1%) |
| 30 to 34 Minutes | 199 (12.4%) | 232 (19.8%) |
| 35 to 39 Minutes | 115 (7.1%) | 97 (8.3%) |
| 40 to 44 Minutes | 183 (11.4%) | 18 (1.5%) |
| 45 to 59 Minutes | 53 (3.3%) | 43 (3.7%) |
| 60 to 89 Minutes | 7 (0.4%) | 17 (1.5%) |
| 90 or more Minutes | 44 (2.7%) | 0 (0.0%) |
Time of Departure to Work by Sex in Orono
The most frequent times of departure to work in Orono are 7:00 AM to 7:29 AM (337, 20.9%) for males and 7:00 AM to 7:29 AM (307, 26.2%) for females.
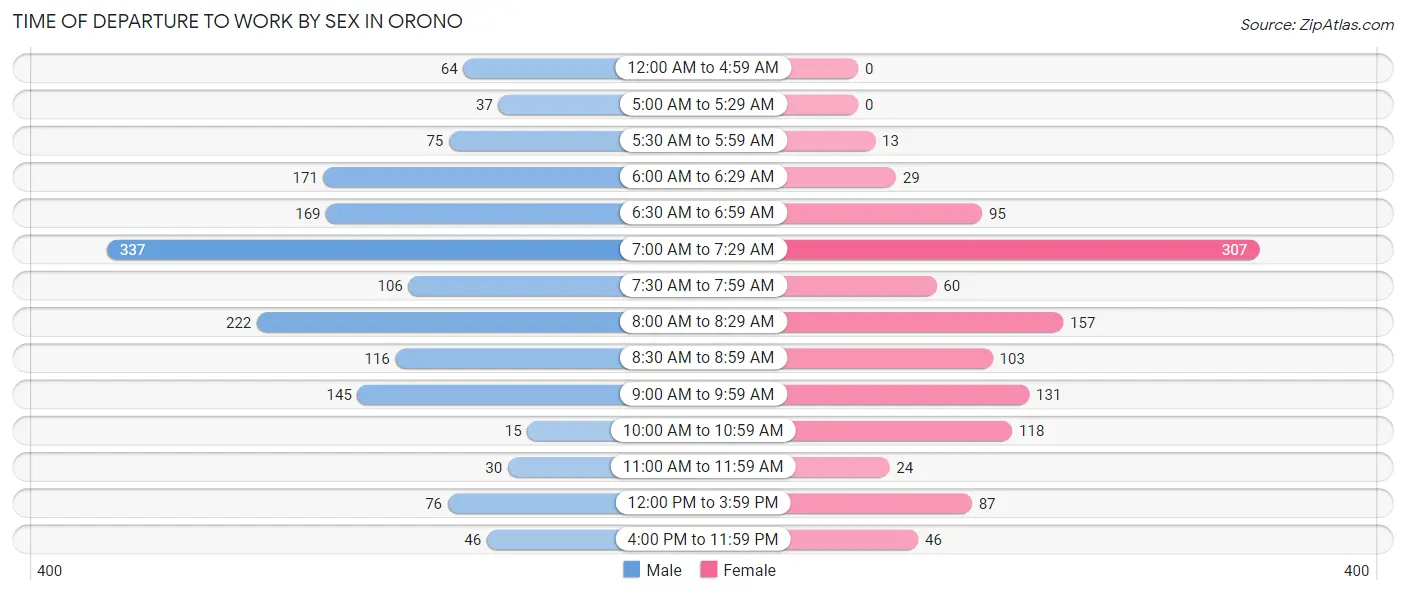
| Time of Departure | Male | Female |
| 12:00 AM to 4:59 AM | 64 (4.0%) | 0 (0.0%) |
| 5:00 AM to 5:29 AM | 37 (2.3%) | 0 (0.0%) |
| 5:30 AM to 5:59 AM | 75 (4.7%) | 13 (1.1%) |
| 6:00 AM to 6:29 AM | 171 (10.6%) | 29 (2.5%) |
| 6:30 AM to 6:59 AM | 169 (10.5%) | 95 (8.1%) |
| 7:00 AM to 7:29 AM | 337 (20.9%) | 307 (26.2%) |
| 7:30 AM to 7:59 AM | 106 (6.6%) | 60 (5.1%) |
| 8:00 AM to 8:29 AM | 222 (13.8%) | 157 (13.4%) |
| 8:30 AM to 8:59 AM | 116 (7.2%) | 103 (8.8%) |
| 9:00 AM to 9:59 AM | 145 (9.0%) | 131 (11.2%) |
| 10:00 AM to 10:59 AM | 15 (0.9%) | 118 (10.1%) |
| 11:00 AM to 11:59 AM | 30 (1.9%) | 24 (2.1%) |
| 12:00 PM to 3:59 PM | 76 (4.7%) | 87 (7.4%) |
| 4:00 PM to 11:59 PM | 46 (2.9%) | 46 (3.9%) |
| Total | 1,609 (100.0%) | 1,170 (100.0%) |
Housing Occupancy in Orono
Occupancy by Ownership in Orono
Of the total 3,048 dwellings in Orono, owner-occupied units account for 2,811 (92.2%), while renter-occupied units make up 237 (7.8%).
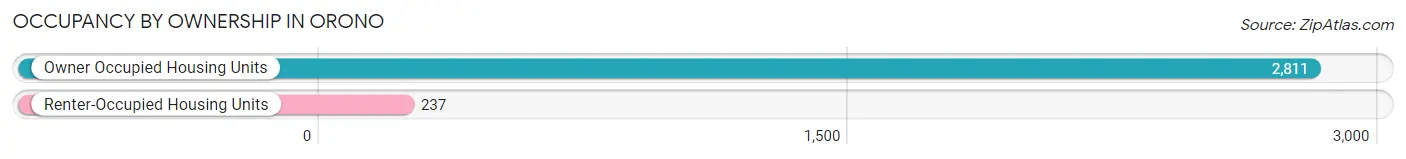
| Occupancy | # Housing Units | % Housing Units |
| Owner Occupied Housing Units | 2,811 | 92.2% |
| Renter-Occupied Housing Units | 237 | 7.8% |
| Total Occupied Housing Units | 3,048 | 100.0% |
Occupancy by Household Size in Orono
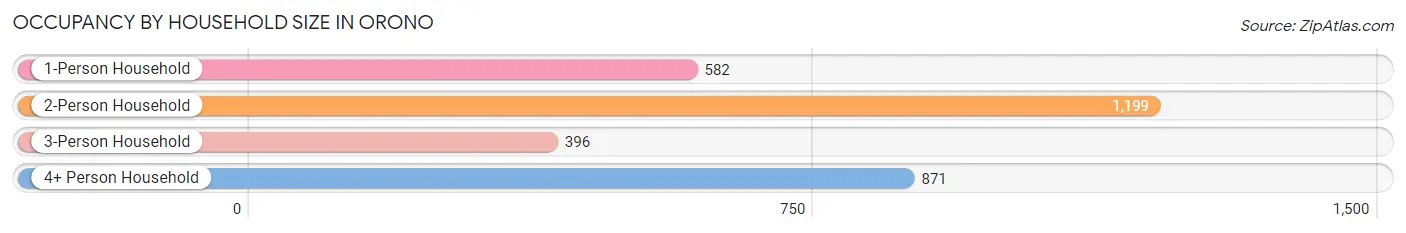
| Household Size | # Housing Units | % Housing Units |
| 1-Person Household | 582 | 19.1% |
| 2-Person Household | 1,199 | 39.3% |
| 3-Person Household | 396 | 13.0% |
| 4+ Person Household | 871 | 28.6% |
| Total Housing Units | 3,048 | 100.0% |
Occupancy by Ownership by Household Size in Orono
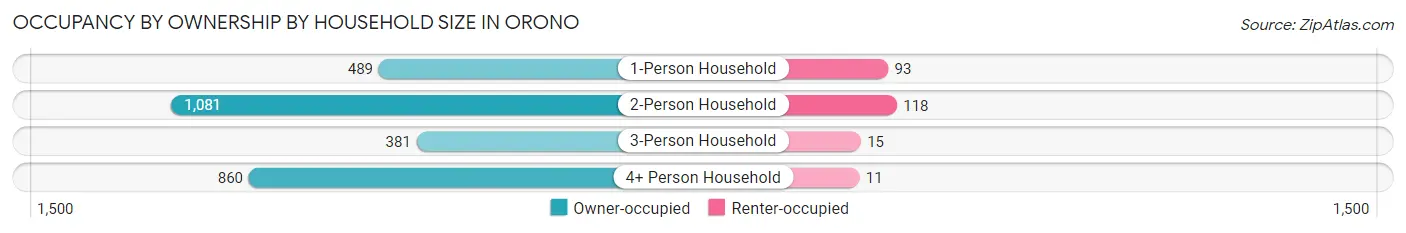
| Household Size | Owner-occupied | Renter-occupied |
| 1-Person Household | 489 (84.0%) | 93 (16.0%) |
| 2-Person Household | 1,081 (90.2%) | 118 (9.8%) |
| 3-Person Household | 381 (96.2%) | 15 (3.8%) |
| 4+ Person Household | 860 (98.7%) | 11 (1.3%) |
| Total Housing Units | 2,811 (92.2%) | 237 (7.8%) |
Occupancy by Educational Attainment in Orono
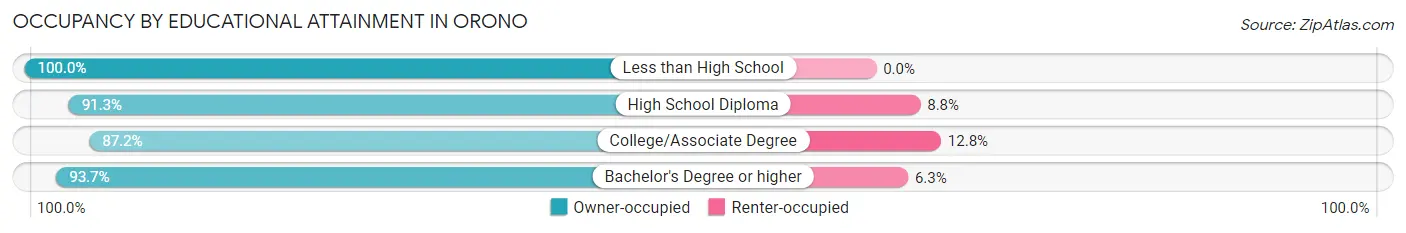
| Household Size | Owner-occupied | Renter-occupied |
| Less than High School | 10 (100.0%) | 0 (0.0%) |
| High School Diploma | 219 (91.2%) | 21 (8.7%) |
| College/Associate Degree | 530 (87.2%) | 78 (12.8%) |
| Bachelor's Degree or higher | 2,052 (93.7%) | 138 (6.3%) |
Occupancy by Age of Householder in Orono
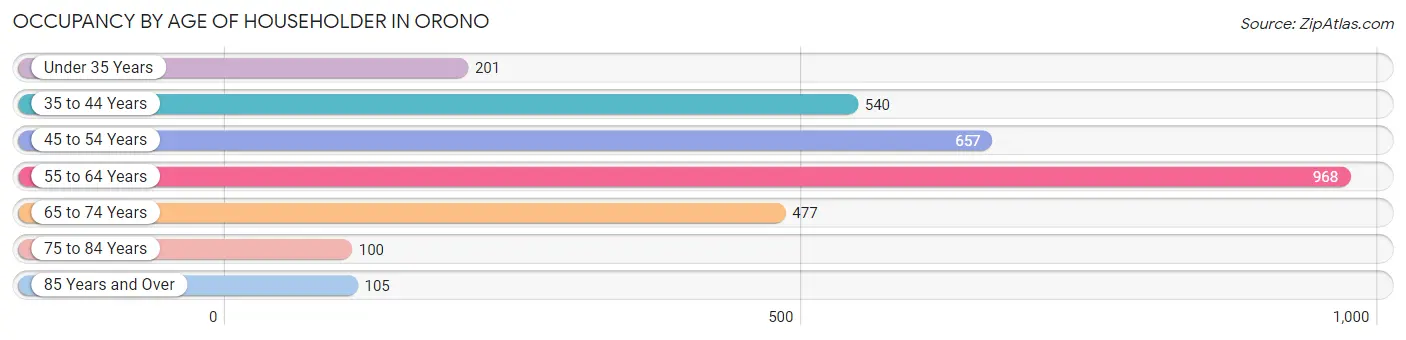
| Age Bracket | # Households | % Households |
| Under 35 Years | 201 | 6.6% |
| 35 to 44 Years | 540 | 17.7% |
| 45 to 54 Years | 657 | 21.6% |
| 55 to 64 Years | 968 | 31.8% |
| 65 to 74 Years | 477 | 15.7% |
| 75 to 84 Years | 100 | 3.3% |
| 85 Years and Over | 105 | 3.4% |
| Total | 3,048 | 100.0% |
Housing Finances in Orono
Median Income by Occupancy in Orono
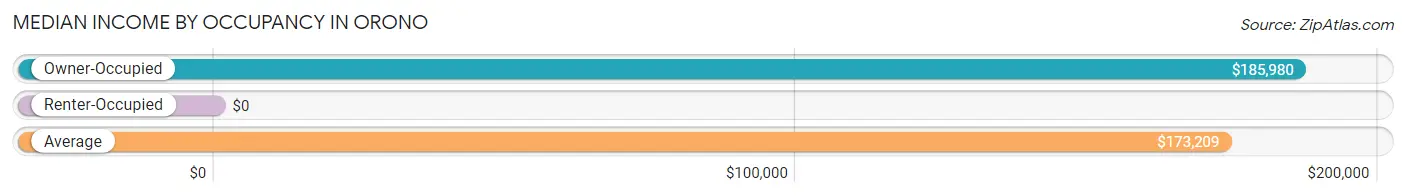
| Occupancy Type | # Households | Median Income |
| Owner-Occupied | 2,811 (92.2%) | $185,980 |
| Renter-Occupied | 237 (7.8%) | $0 |
| Average | 3,048 (100.0%) | $173,209 |
Occupancy by Householder Income Bracket in Orono
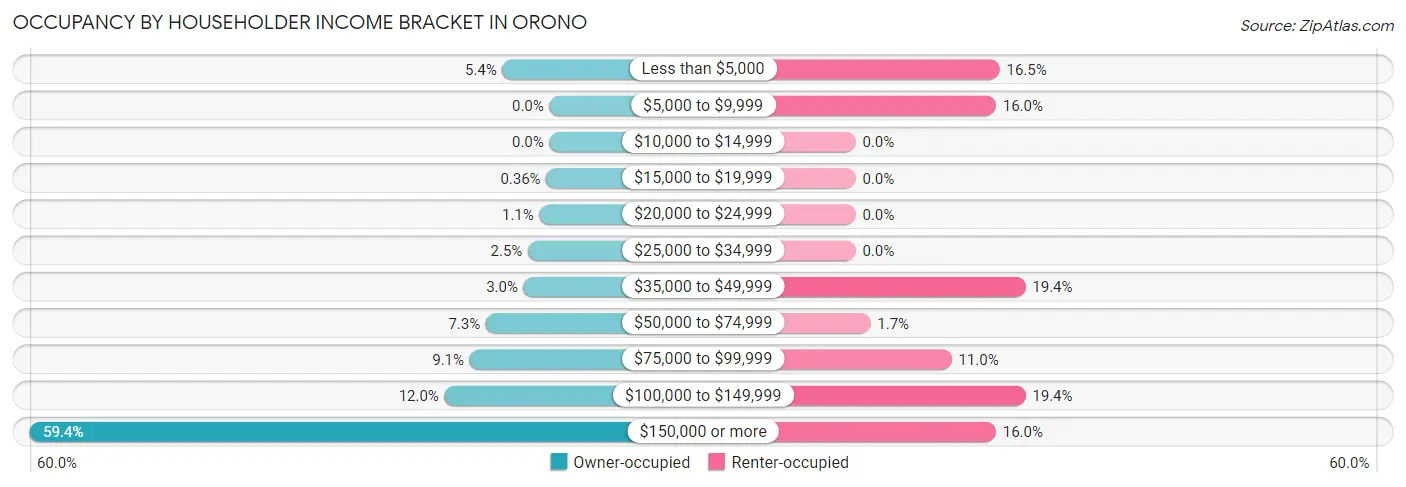
| Income Bracket | Owner-occupied | Renter-occupied |
| Less than $5,000 | 151 (5.4%) | 39 (16.5%) |
| $5,000 to $9,999 | 0 (0.0%) | 38 (16.0%) |
| $10,000 to $14,999 | 0 (0.0%) | 0 (0.0%) |
| $15,000 to $19,999 | 10 (0.4%) | 0 (0.0%) |
| $20,000 to $24,999 | 32 (1.1%) | 0 (0.0%) |
| $25,000 to $34,999 | 69 (2.5%) | 0 (0.0%) |
| $35,000 to $49,999 | 83 (2.9%) | 46 (19.4%) |
| $50,000 to $74,999 | 204 (7.3%) | 4 (1.7%) |
| $75,000 to $99,999 | 256 (9.1%) | 26 (11.0%) |
| $100,000 to $149,999 | 337 (12.0%) | 46 (19.4%) |
| $150,000 or more | 1,669 (59.4%) | 38 (16.0%) |
| Total | 2,811 (100.0%) | 237 (100.0%) |
Monthly Housing Cost Tiers in Orono
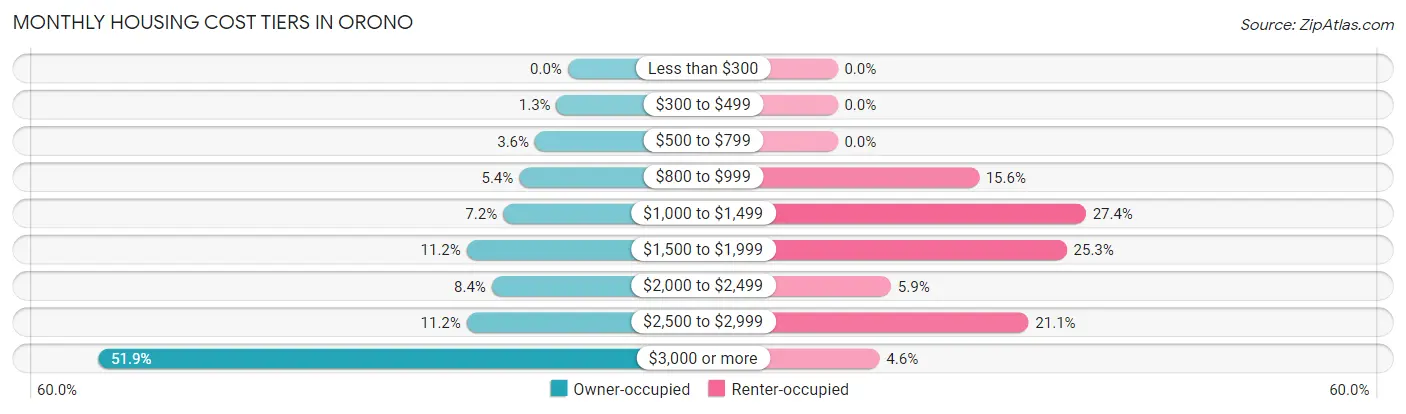
| Monthly Cost | Owner-occupied | Renter-occupied |
| Less than $300 | 0 (0.0%) | 0 (0.0%) |
| $300 to $499 | 35 (1.3%) | 0 (0.0%) |
| $500 to $799 | 102 (3.6%) | 0 (0.0%) |
| $800 to $999 | 151 (5.4%) | 37 (15.6%) |
| $1,000 to $1,499 | 201 (7.1%) | 65 (27.4%) |
| $1,500 to $1,999 | 314 (11.2%) | 60 (25.3%) |
| $2,000 to $2,499 | 236 (8.4%) | 14 (5.9%) |
| $2,500 to $2,999 | 314 (11.2%) | 50 (21.1%) |
| $3,000 or more | 1,458 (51.9%) | 11 (4.6%) |
| Total | 2,811 (100.0%) | 237 (100.0%) |
Physical Housing Characteristics in Orono
Housing Structures in Orono
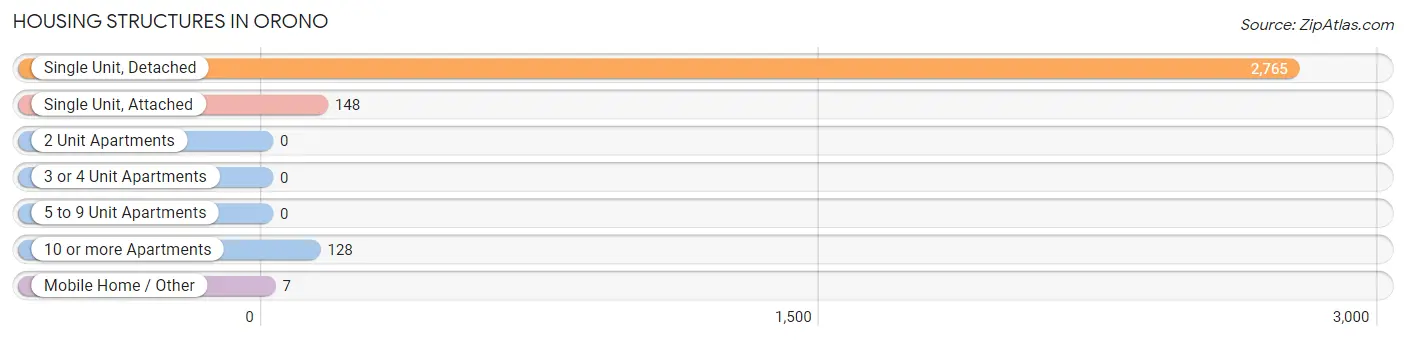
| Structure Type | # Housing Units | % Housing Units |
| Single Unit, Detached | 2,765 | 90.7% |
| Single Unit, Attached | 148 | 4.9% |
| 2 Unit Apartments | 0 | 0.0% |
| 3 or 4 Unit Apartments | 0 | 0.0% |
| 5 to 9 Unit Apartments | 0 | 0.0% |
| 10 or more Apartments | 128 | 4.2% |
| Mobile Home / Other | 7 | 0.2% |
| Total | 3,048 | 100.0% |
Housing Structures by Occupancy in Orono
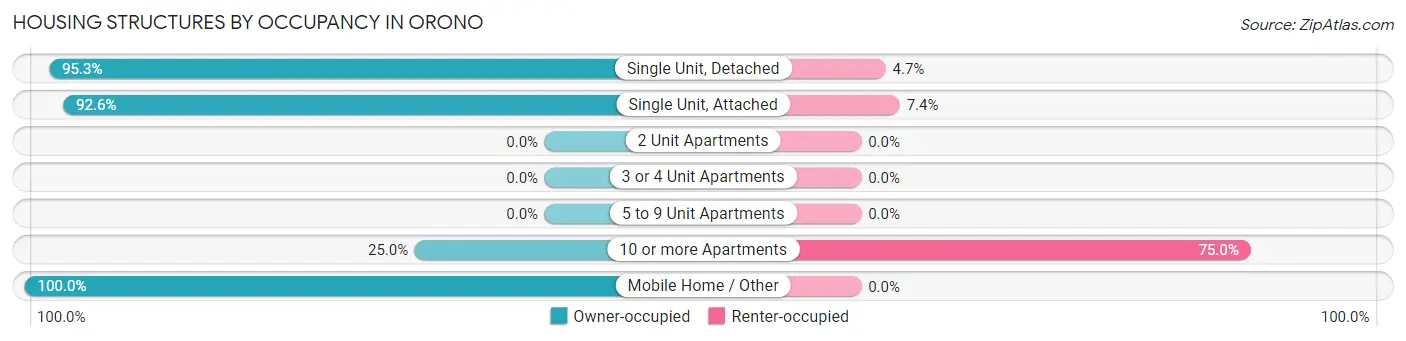
| Structure Type | Owner-occupied | Renter-occupied |
| Single Unit, Detached | 2,635 (95.3%) | 130 (4.7%) |
| Single Unit, Attached | 137 (92.6%) | 11 (7.4%) |
| 2 Unit Apartments | 0 (0.0%) | 0 (0.0%) |
| 3 or 4 Unit Apartments | 0 (0.0%) | 0 (0.0%) |
| 5 to 9 Unit Apartments | 0 (0.0%) | 0 (0.0%) |
| 10 or more Apartments | 32 (25.0%) | 96 (75.0%) |
| Mobile Home / Other | 7 (100.0%) | 0 (0.0%) |
| Total | 2,811 (92.2%) | 237 (7.8%) |
Housing Structures by Number of Rooms in Orono
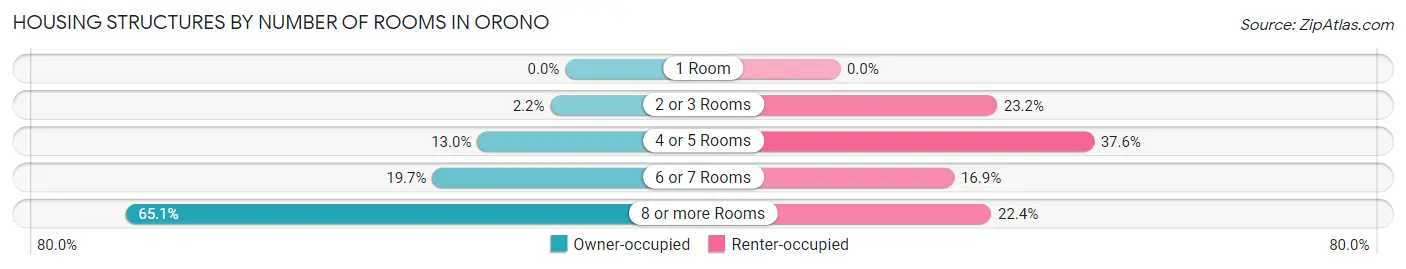
| Number of Rooms | Owner-occupied | Renter-occupied |
| 1 Room | 0 (0.0%) | 0 (0.0%) |
| 2 or 3 Rooms | 62 (2.2%) | 55 (23.2%) |
| 4 or 5 Rooms | 366 (13.0%) | 89 (37.6%) |
| 6 or 7 Rooms | 553 (19.7%) | 40 (16.9%) |
| 8 or more Rooms | 1,830 (65.1%) | 53 (22.4%) |
| Total | 2,811 (100.0%) | 237 (100.0%) |
Housing Structure by Heating Type in Orono
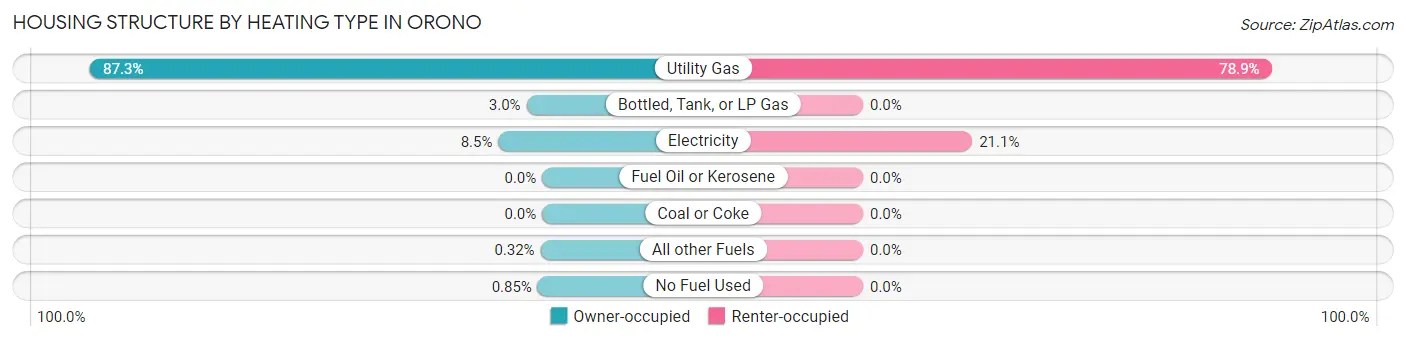
| Heating Type | Owner-occupied | Renter-occupied |
| Utility Gas | 2,455 (87.3%) | 187 (78.9%) |
| Bottled, Tank, or LP Gas | 85 (3.0%) | 0 (0.0%) |
| Electricity | 238 (8.5%) | 50 (21.1%) |
| Fuel Oil or Kerosene | 0 (0.0%) | 0 (0.0%) |
| Coal or Coke | 0 (0.0%) | 0 (0.0%) |
| All other Fuels | 9 (0.3%) | 0 (0.0%) |
| No Fuel Used | 24 (0.9%) | 0 (0.0%) |
| Total | 2,811 (100.0%) | 237 (100.0%) |
Household Vehicle Usage in Orono
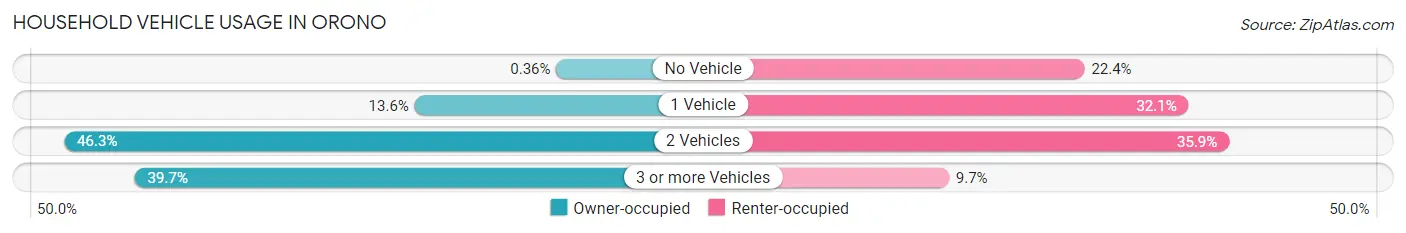
| Vehicles per Household | Owner-occupied | Renter-occupied |
| No Vehicle | 10 (0.4%) | 53 (22.4%) |
| 1 Vehicle | 382 (13.6%) | 76 (32.1%) |
| 2 Vehicles | 1,302 (46.3%) | 85 (35.9%) |
| 3 or more Vehicles | 1,117 (39.7%) | 23 (9.7%) |
| Total | 2,811 (100.0%) | 237 (100.0%) |
Real Estate & Mortgages in Orono
Real Estate and Mortgage Overview in Orono
| Characteristic | Without Mortgage | With Mortgage |
| Housing Units | 646 | 2,165 |
| Median Property Value | $837,200 | $881,400 |
| Median Household Income | $138,864 | $1,385 |
| Monthly Housing Costs | $1,333 | $1,423 |
| Real Estate Taxes | $7,667 | $20 |
Property Value by Mortgage Status in Orono
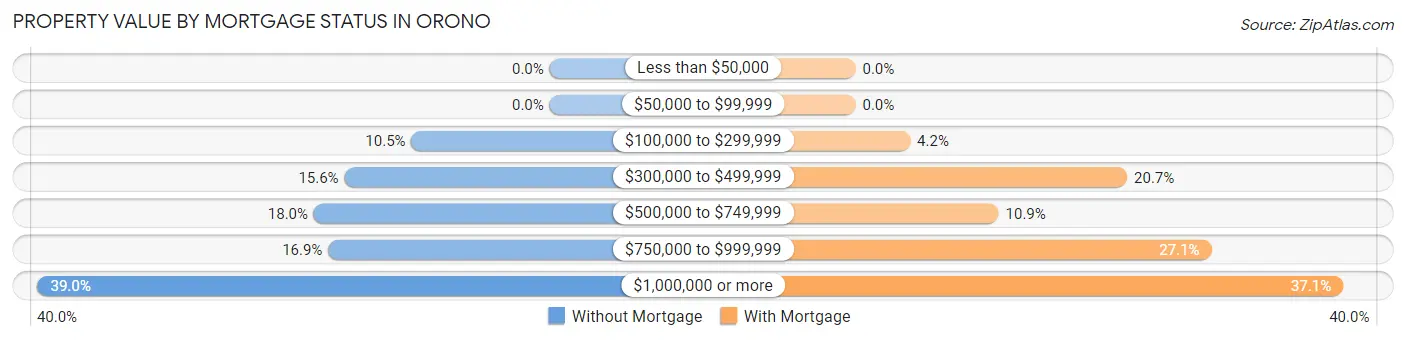
| Property Value | Without Mortgage | With Mortgage |
| Less than $50,000 | 0 (0.0%) | 0 (0.0%) |
| $50,000 to $99,999 | 0 (0.0%) | 0 (0.0%) |
| $100,000 to $299,999 | 68 (10.5%) | 90 (4.2%) |
| $300,000 to $499,999 | 101 (15.6%) | 448 (20.7%) |
| $500,000 to $749,999 | 116 (18.0%) | 236 (10.9%) |
| $750,000 to $999,999 | 109 (16.9%) | 587 (27.1%) |
| $1,000,000 or more | 252 (39.0%) | 804 (37.1%) |
| Total | 646 (100.0%) | 2,165 (100.0%) |
Household Income by Mortgage Status in Orono
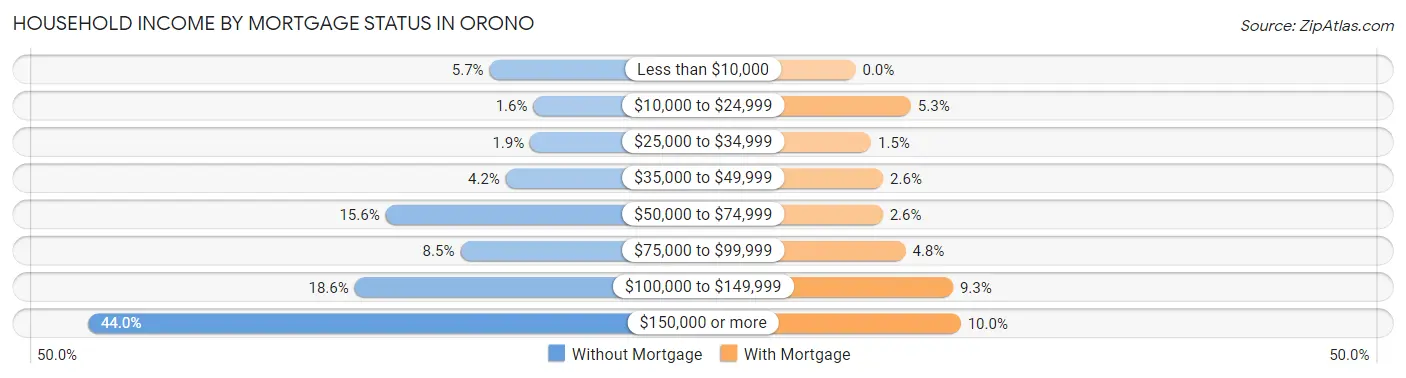
| Household Income | Without Mortgage | With Mortgage |
| Less than $10,000 | 37 (5.7%) | 0 (0.0%) |
| $10,000 to $24,999 | 10 (1.5%) | 114 (5.3%) |
| $25,000 to $34,999 | 12 (1.9%) | 32 (1.5%) |
| $35,000 to $49,999 | 27 (4.2%) | 57 (2.6%) |
| $50,000 to $74,999 | 101 (15.6%) | 56 (2.6%) |
| $75,000 to $99,999 | 55 (8.5%) | 103 (4.8%) |
| $100,000 to $149,999 | 120 (18.6%) | 201 (9.3%) |
| $150,000 or more | 284 (44.0%) | 217 (10.0%) |
| Total | 646 (100.0%) | 2,165 (100.0%) |
Property Value to Household Income Ratio in Orono
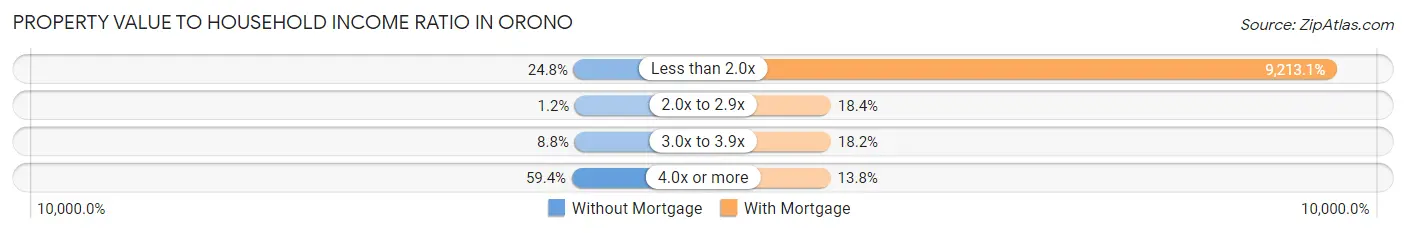
| Value-to-Income Ratio | Without Mortgage | With Mortgage |
| Less than 2.0x | 160 (24.8%) | 199,464 (9,213.1%) |
| 2.0x to 2.9x | 8 (1.2%) | 399 (18.4%) |
| 3.0x to 3.9x | 57 (8.8%) | 395 (18.2%) |
| 4.0x or more | 384 (59.4%) | 298 (13.8%) |
| Total | 646 (100.0%) | 2,165 (100.0%) |
Real Estate Taxes by Mortgage Status in Orono
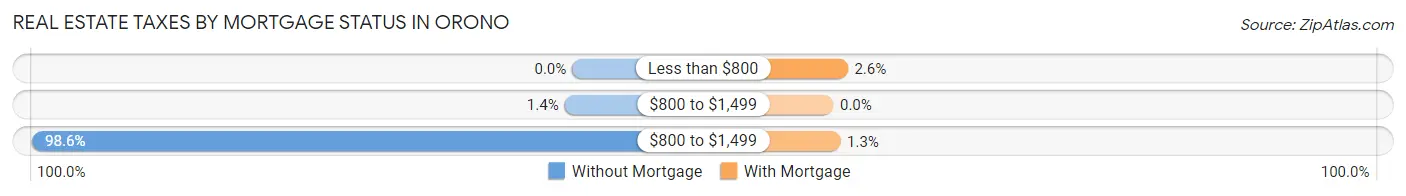
| Property Taxes | Without Mortgage | With Mortgage |
| Less than $800 | 0 (0.0%) | 57 (2.6%) |
| $800 to $1,499 | 9 (1.4%) | 0 (0.0%) |
| $800 to $1,499 | 637 (98.6%) | 28 (1.3%) |
| Total | 646 (100.0%) | 2,165 (100.0%) |
Health & Disability in Orono
Health Insurance Coverage by Age in Orono
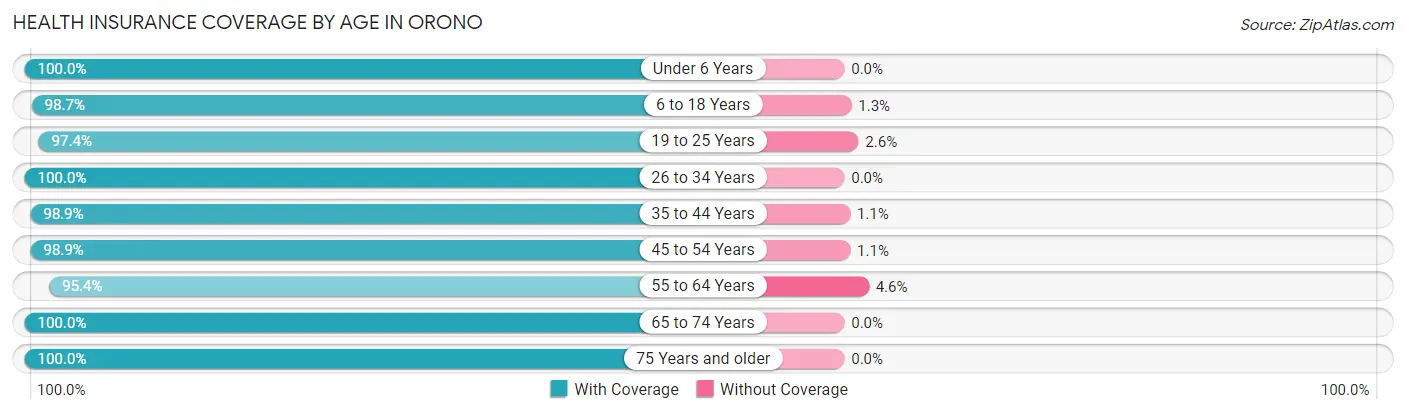
| Age Bracket | With Coverage | Without Coverage |
| Under 6 Years | 691 (100.0%) | 0 (0.0%) |
| 6 to 18 Years | 1,647 (98.7%) | 22 (1.3%) |
| 19 to 25 Years | 259 (97.4%) | 7 (2.6%) |
| 26 to 34 Years | 354 (100.0%) | 0 (0.0%) |
| 35 to 44 Years | 1,029 (98.9%) | 11 (1.1%) |
| 45 to 54 Years | 1,273 (98.9%) | 14 (1.1%) |
| 55 to 64 Years | 1,549 (95.4%) | 74 (4.6%) |
| 65 to 74 Years | 962 (100.0%) | 0 (0.0%) |
| 75 Years and older | 331 (100.0%) | 0 (0.0%) |
| Total | 8,095 (98.4%) | 128 (1.6%) |
Health Insurance Coverage by Citizenship Status in Orono
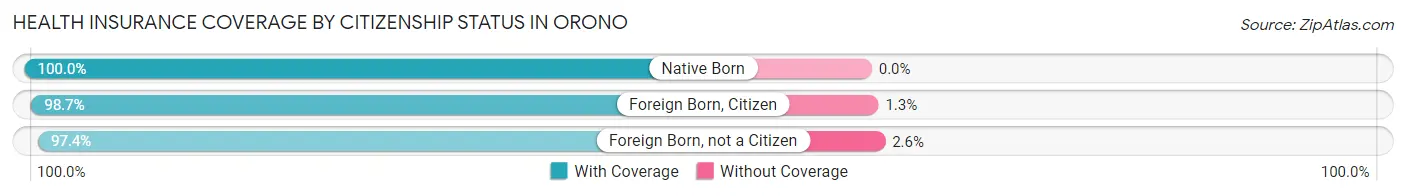
| Citizenship Status | With Coverage | Without Coverage |
| Native Born | 691 (100.0%) | 0 (0.0%) |
| Foreign Born, Citizen | 1,647 (98.7%) | 22 (1.3%) |
| Foreign Born, not a Citizen | 259 (97.4%) | 7 (2.6%) |
Health Insurance Coverage by Household Income in Orono
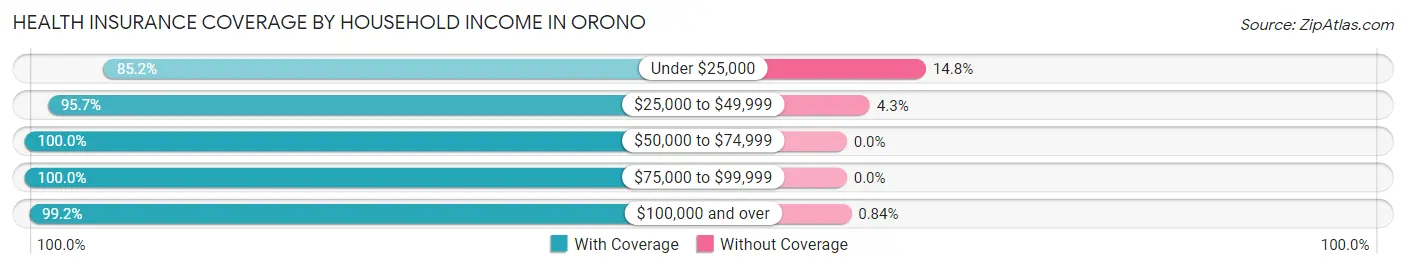
| Household Income | With Coverage | Without Coverage |
| Under $25,000 | 327 (85.2%) | 57 (14.8%) |
| $25,000 to $49,999 | 376 (95.7%) | 17 (4.3%) |
| $50,000 to $74,999 | 374 (100.0%) | 0 (0.0%) |
| $75,000 to $99,999 | 647 (100.0%) | 0 (0.0%) |
| $100,000 and over | 6,355 (99.2%) | 54 (0.8%) |
Public vs Private Health Insurance Coverage by Age in Orono
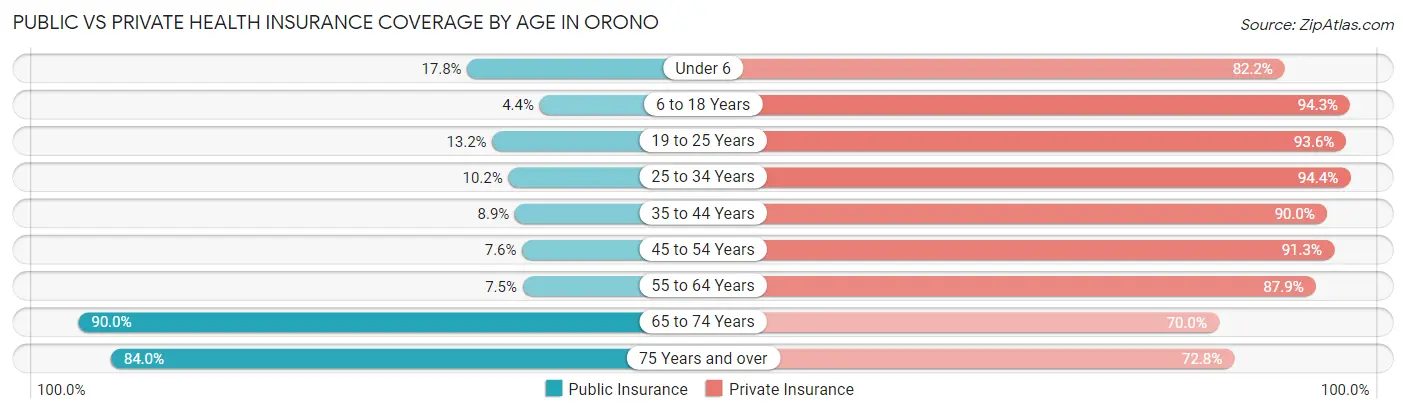
| Age Bracket | Public Insurance | Private Insurance |
| Under 6 | 123 (17.8%) | 568 (82.2%) |
| 6 to 18 Years | 73 (4.4%) | 1,574 (94.3%) |
| 19 to 25 Years | 35 (13.2%) | 249 (93.6%) |
| 25 to 34 Years | 36 (10.2%) | 334 (94.4%) |
| 35 to 44 Years | 93 (8.9%) | 936 (90.0%) |
| 45 to 54 Years | 98 (7.6%) | 1,175 (91.3%) |
| 55 to 64 Years | 122 (7.5%) | 1,427 (87.9%) |
| 65 to 74 Years | 866 (90.0%) | 673 (70.0%) |
| 75 Years and over | 278 (84.0%) | 241 (72.8%) |
| Total | 1,724 (21.0%) | 7,177 (87.3%) |
Disability Status by Sex by Age in Orono
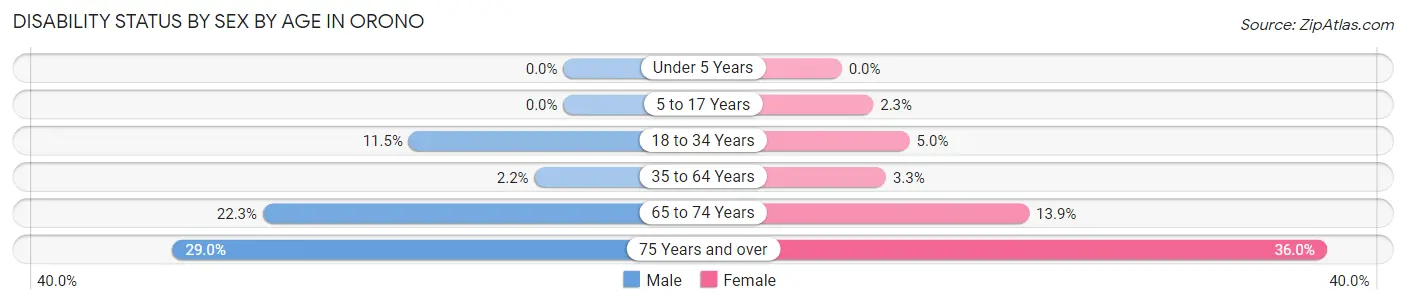
| Age Bracket | Male | Female |
| Under 5 Years | 0 (0.0%) | 0 (0.0%) |
| 5 to 17 Years | 0 (0.0%) | 14 (2.3%) |
| 18 to 34 Years | 42 (11.5%) | 21 (5.0%) |
| 35 to 64 Years | 47 (2.1%) | 58 (3.3%) |
| 65 to 74 Years | 112 (22.3%) | 64 (13.9%) |
| 75 Years and over | 38 (29.0%) | 72 (36.0%) |
Disability Class by Sex by Age in Orono
Disability Class: Hearing Difficulty
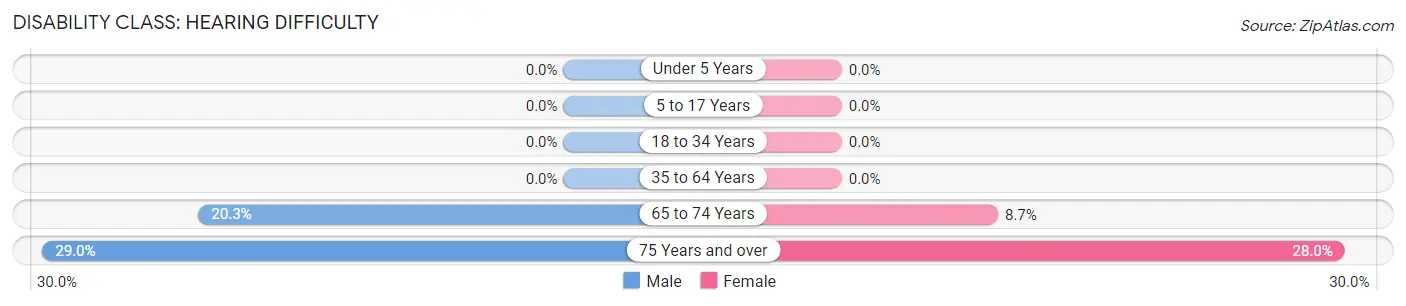
| Age Bracket | Male | Female |
| Under 5 Years | 0 (0.0%) | 0 (0.0%) |
| 5 to 17 Years | 0 (0.0%) | 0 (0.0%) |
| 18 to 34 Years | 0 (0.0%) | 0 (0.0%) |
| 35 to 64 Years | 0 (0.0%) | 0 (0.0%) |
| 65 to 74 Years | 102 (20.3%) | 40 (8.7%) |
| 75 Years and over | 38 (29.0%) | 56 (28.0%) |
Disability Class: Vision Difficulty
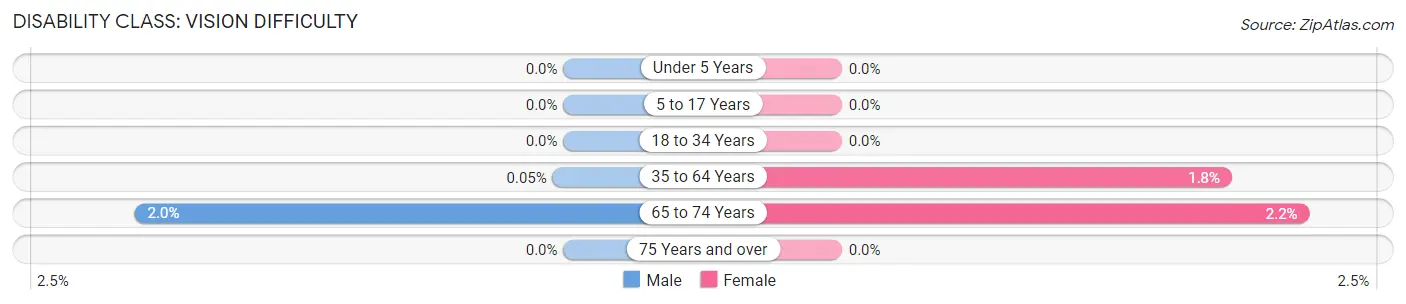
| Age Bracket | Male | Female |
| Under 5 Years | 0 (0.0%) | 0 (0.0%) |
| 5 to 17 Years | 0 (0.0%) | 0 (0.0%) |
| 18 to 34 Years | 0 (0.0%) | 0 (0.0%) |
| 35 to 64 Years | 1 (0.1%) | 32 (1.8%) |
| 65 to 74 Years | 10 (2.0%) | 10 (2.2%) |
| 75 Years and over | 0 (0.0%) | 0 (0.0%) |
Disability Class: Cognitive Difficulty
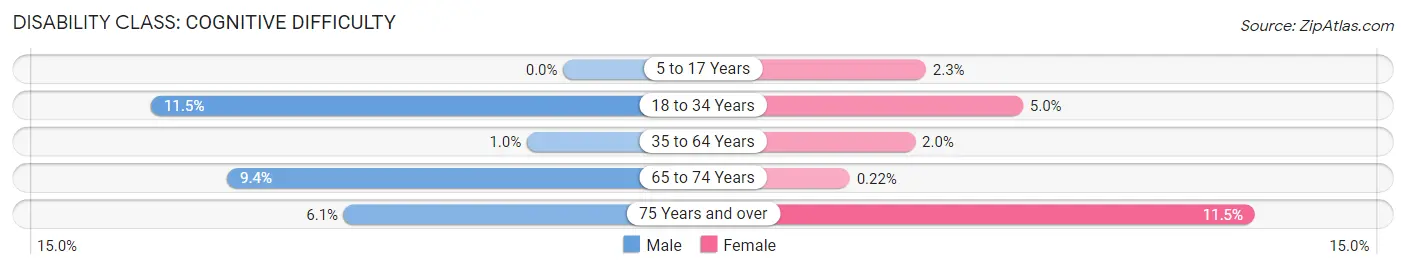
| Age Bracket | Male | Female |
| 5 to 17 Years | 0 (0.0%) | 14 (2.3%) |
| 18 to 34 Years | 42 (11.5%) | 21 (5.0%) |
| 35 to 64 Years | 22 (1.0%) | 36 (2.0%) |
| 65 to 74 Years | 47 (9.4%) | 1 (0.2%) |
| 75 Years and over | 8 (6.1%) | 23 (11.5%) |
Disability Class: Ambulatory Difficulty
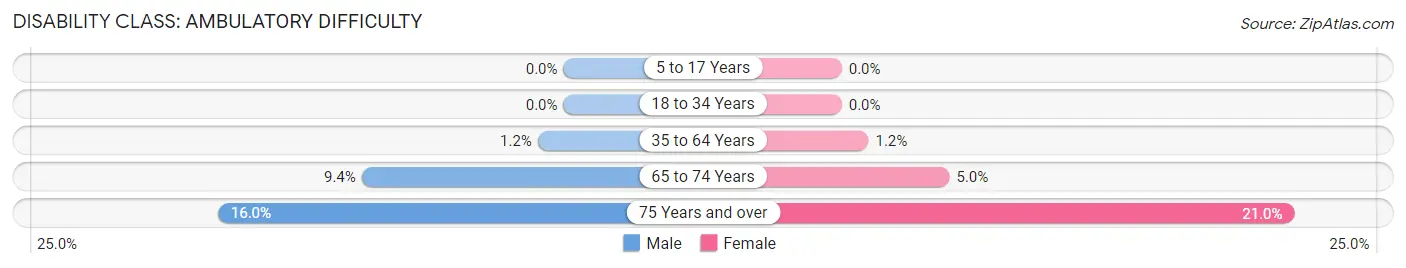
| Age Bracket | Male | Female |
| 5 to 17 Years | 0 (0.0%) | 0 (0.0%) |
| 18 to 34 Years | 0 (0.0%) | 0 (0.0%) |
| 35 to 64 Years | 26 (1.2%) | 22 (1.2%) |
| 65 to 74 Years | 47 (9.4%) | 23 (5.0%) |
| 75 Years and over | 21 (16.0%) | 42 (21.0%) |
Disability Class: Self-Care Difficulty
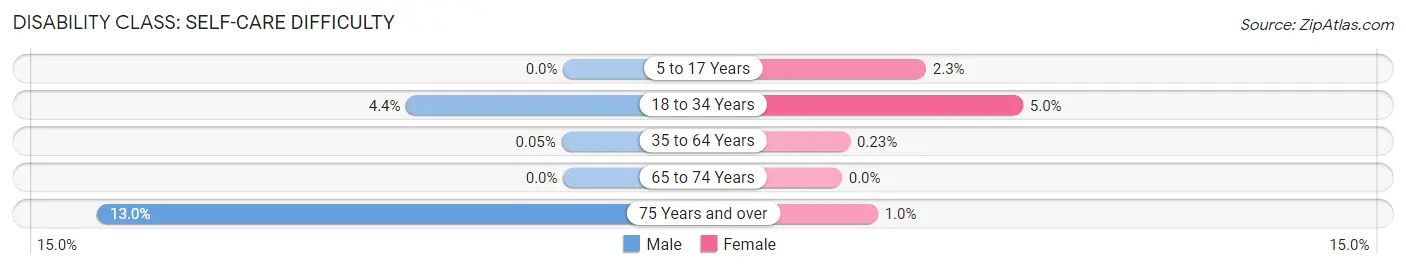
| Age Bracket | Male | Female |
| 5 to 17 Years | 0 (0.0%) | 14 (2.3%) |
| 18 to 34 Years | 16 (4.4%) | 21 (5.0%) |
| 35 to 64 Years | 1 (0.1%) | 4 (0.2%) |
| 65 to 74 Years | 0 (0.0%) | 0 (0.0%) |
| 75 Years and over | 17 (13.0%) | 2 (1.0%) |
Technology Access in Orono
Computing Device Access in Orono
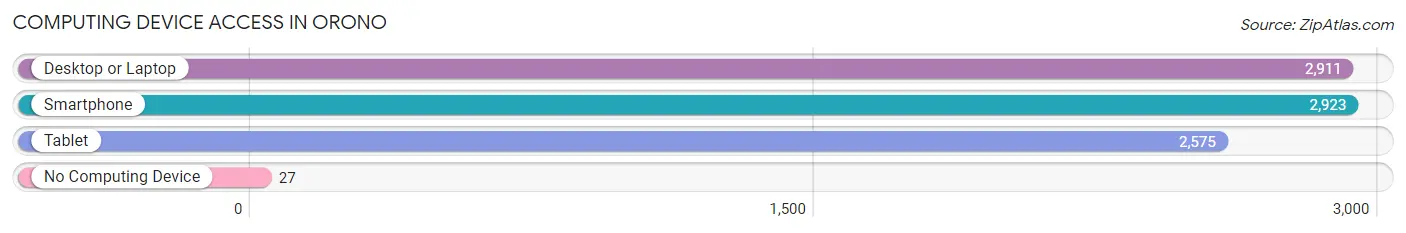
| Device Type | # Households | % Households |
| Desktop or Laptop | 2,911 | 95.5% |
| Smartphone | 2,923 | 95.9% |
| Tablet | 2,575 | 84.5% |
| No Computing Device | 27 | 0.9% |
| Total | 3,048 | 100.0% |
Internet Access in Orono
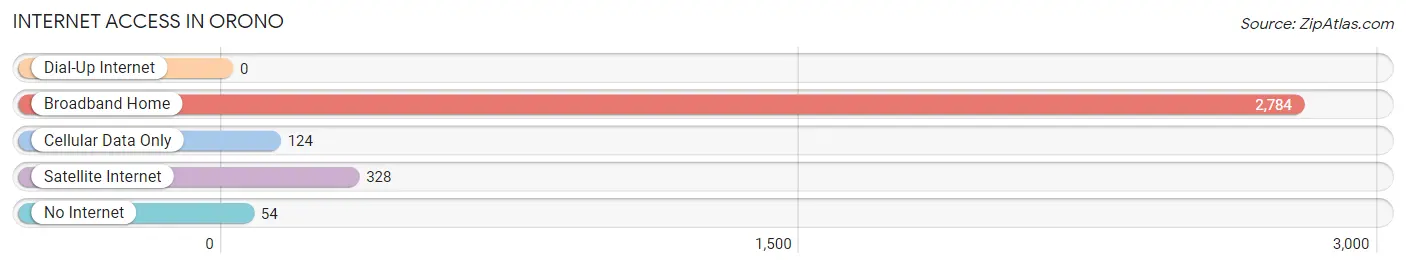
| Internet Type | # Households | % Households |
| Dial-Up Internet | 0 | 0.0% |
| Broadband Home | 2,784 | 91.3% |
| Cellular Data Only | 124 | 4.1% |
| Satellite Internet | 328 | 10.8% |
| No Internet | 54 | 1.8% |
| Total | 3,048 | 100.0% |
Orono Summary
Orono, Minnesota is a small city located in Hennepin County, Minnesota, United States. It is situated on the west bank of the Mississippi River, about 10 miles northwest of Minneapolis. The city is part of the Twin Cities metropolitan area and is home to approximately 7,000 people.
History
Orono was first settled in 1852 by a group of settlers from Maine. The town was named after the city of Orono, Maine, which was the hometown of many of the settlers. The settlers were attracted to the area due to its proximity to the Mississippi River and the abundance of natural resources.
The city was officially incorporated in 1858 and quickly grew in population. By the late 19th century, Orono had become a thriving community with a variety of businesses, including a sawmill, a flour mill, a brickyard, and a creamery.
In the early 20th century, Orono experienced a period of growth and development. The city was home to a number of factories, including a paper mill, a canning factory, and a furniture factory. The city also had a number of churches, schools, and other civic organizations.
Geography
Orono is located in Hennepin County, Minnesota, United States. It is situated on the west bank of the Mississippi River, about 10 miles northwest of Minneapolis. The city is part of the Twin Cities metropolitan area and is home to approximately 7,000 people.
The city has a total area of 4.2 square miles, of which 4.1 square miles is land and 0.1 square miles is water. The city is located in a hilly area and is surrounded by lakes and rivers. The city is also home to a number of parks and recreational areas, including Lake Orono, which is a popular spot for fishing and boating.
Economy
Orono’s economy is largely based on the service industry. The city is home to a number of restaurants, retail stores, and other businesses. The city is also home to a number of manufacturing companies, including a paper mill, a canning factory, and a furniture factory.
The city is also home to a number of educational institutions, including the University of Minnesota, which is located in nearby Minneapolis. The university is a major employer in the city and provides a number of jobs for local residents.
Demographics
As of the 2010 census, the population of Orono was 7,092. The racial makeup of the city was 94.3% White, 1.2% African American, 0.3% Native American, 1.7% Asian, 0.1% Pacific Islander, 0.7% from other races, and 1.9% from two or more races. Hispanic or Latino of any race were 2.3% of the population.
The median income for a household in the city was $68,958, and the median income for a family was $77,958. The per capita income for the city was $31,958. About 4.3% of families and 5.7% of the population were below the poverty line, including 6.3% of those under age 18 and 4.2% of those age 65 or over.
Orono is a small city with a rich history and a diverse population. The city is home to a number of businesses, educational institutions, and recreational areas, making it an attractive place to live and work. The city’s economy is largely based on the service industry, and the city is home to a number of manufacturing companies as well. The city is also home to a number of educational institutions, including the University of Minnesota, which is located in nearby Minneapolis.
Common Questions
What is Per Capita Income in Orono?
Per Capita income in Orono is $135,383.
What is the Median Family Income in Orono?
Median Family Income in Orono is $203,884.
What is the Median Household income in Orono?
Median Household Income in Orono is $173,209.
What is Income or Wage Gap in Orono?
Income or Wage Gap in Orono is 38.6%.
Women in Orono earn 61.4 cents for every dollar earned by a man.
What is Inequality or Gini Index in Orono?
Inequality or Gini Index in Orono is 0.59.
What is the Total Population of Orono?
Total Population of Orono is 8,223.
What is the Total Male Population of Orono?
Total Male Population of Orono is 4,632.
What is the Total Female Population of Orono?
Total Female Population of Orono is 3,591.
What is the Ratio of Males per 100 Females in Orono?
There are 128.99 Males per 100 Females in Orono.
What is the Ratio of Females per 100 Males in Orono?
There are 77.53 Females per 100 Males in Orono.
What is the Median Population Age in Orono?
Median Population Age in Orono is 46.0 Years.
What is the Average Family Size in Orono
Average Family Size in Orono is 3.2 People.
What is the Average Household Size in Orono
Average Household Size in Orono is 2.7 People.
How Large is the Labor Force in Orono?
There are 4,258 People in the Labor Forcein in Orono.
What is the Percentage of People in the Labor Force in Orono?
68.2% of People are in the Labor Force in Orono.
What is the Unemployment Rate in Orono?
Unemployment Rate in Orono is 3.2%.