Shorewood, MN Map & Demographics
Shorewood Map
Shorewood Overview
$83,841
PER CAPITA INCOME
$201,250
AVG FAMILY INCOME
$163,525
AVG HOUSEHOLD INCOME
47.1%
WAGE / INCOME GAP [ % ]
52.9¢/ $1
WAGE / INCOME GAP [ $ ]
$11,306
FAMILY INCOME DEFICIT
0.45
INEQUALITY / GINI INDEX
7,722
TOTAL POPULATION
3,962
MALE POPULATION
3,760
FEMALE POPULATION
105.37
MALES / 100 FEMALES
94.90
FEMALES / 100 MALES
48.0
MEDIAN AGE
3.0
AVG FAMILY SIZE
2.6
AVG HOUSEHOLD SIZE
3,987
LABOR FORCE [ PEOPLE ]
65.8%
PERCENT IN LABOR FORCE
5.1%
UNEMPLOYMENT RATE
Income in Shorewood
Income Overview in Shorewood
Per Capita Income in Shorewood is $83,841, while median incomes of families and households are $201,250 and $163,525 respectively.
| Characteristic | Number | Measure |
| Per Capita Income | 7,722 | $83,841 |
| Median Family Income | 2,308 | $201,250 |
| Mean Family Income | 2,308 | $258,339 |
| Median Household Income | 2,926 | $163,525 |
| Mean Household Income | 2,926 | $227,022 |
| Income Deficit | 2,308 | $11,306 |
| Wage / Income Gap (%) | 7,722 | 47.10% |
| Wage / Income Gap ($) | 7,722 | 52.90¢ per $1 |
| Gini / Inequality Index | 7,722 | 0.45 |
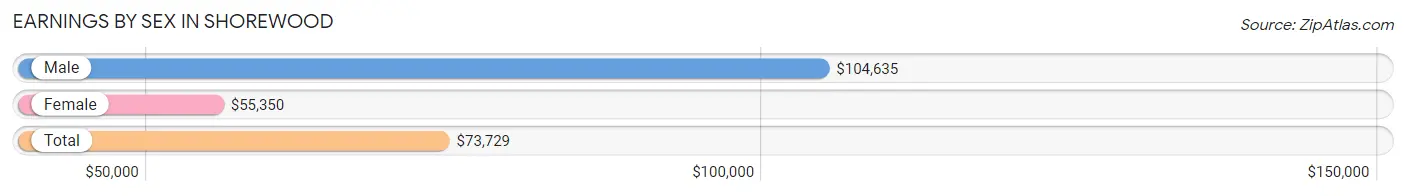
Earnings by Sex in Shorewood
Average Earnings in Shorewood are $73,729, $104,635 for men and $55,350 for women, a difference of 47.1%.
| Sex | Number | Average Earnings |
| Male | 2,299 (54.5%) | $104,635 |
| Female | 1,916 (45.5%) | $55,350 |
| Total | 4,215 (100.0%) | $73,729 |
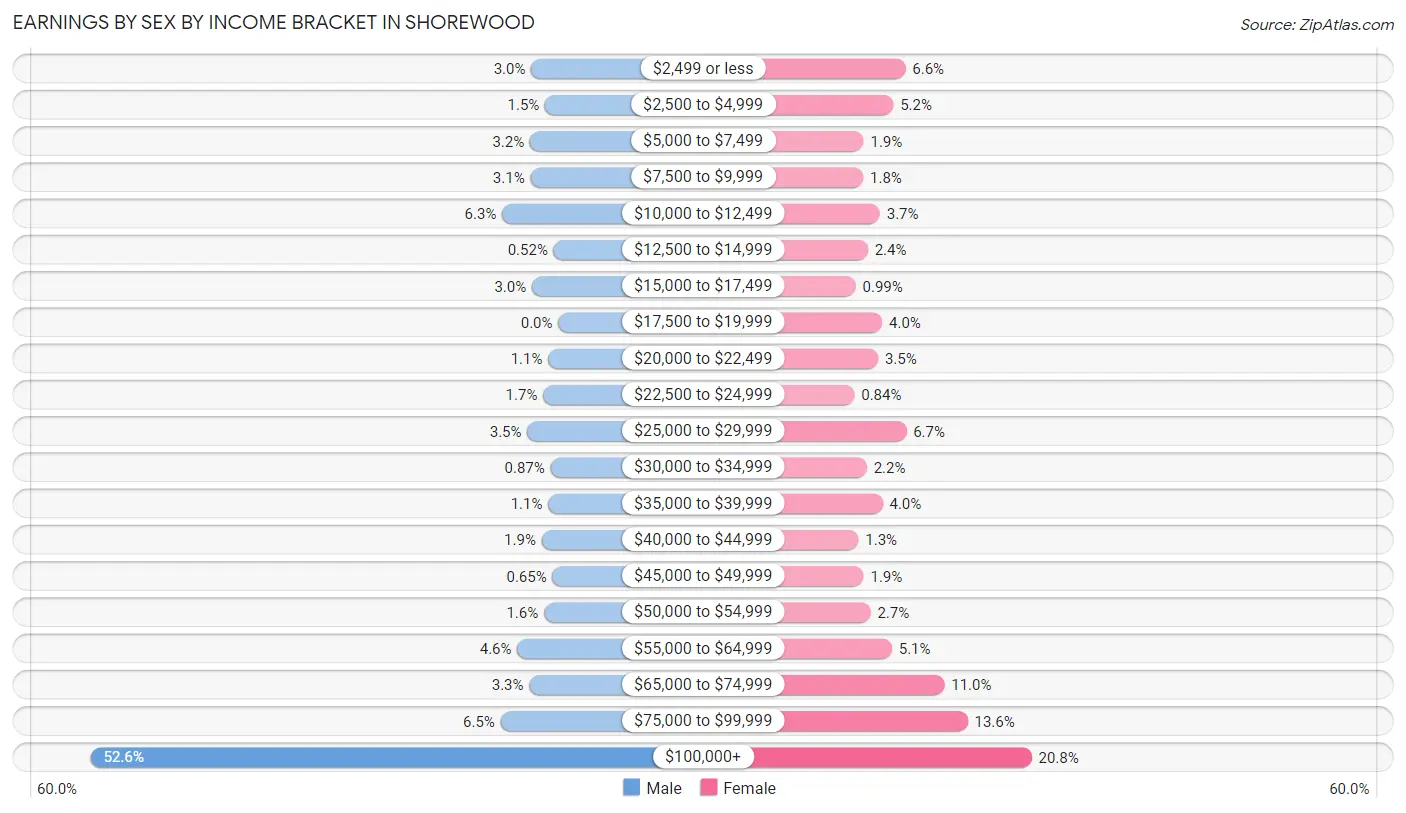
Earnings by Sex by Income Bracket in Shorewood
The most common earnings brackets in Shorewood are $100,000+ for men (1,209 | 52.6%) and $100,000+ for women (398 | 20.8%).
| Income | Male | Female |
| $2,499 or less | 70 (3.0%) | 126 (6.6%) |
| $2,500 to $4,999 | 34 (1.5%) | 100 (5.2%) |
| $5,000 to $7,499 | 73 (3.2%) | 36 (1.9%) |
| $7,500 to $9,999 | 72 (3.1%) | 35 (1.8%) |
| $10,000 to $12,499 | 145 (6.3%) | 71 (3.7%) |
| $12,500 to $14,999 | 12 (0.5%) | 45 (2.4%) |
| $15,000 to $17,499 | 68 (3.0%) | 19 (1.0%) |
| $17,500 to $19,999 | 0 (0.0%) | 76 (4.0%) |
| $20,000 to $22,499 | 26 (1.1%) | 67 (3.5%) |
| $22,500 to $24,999 | 39 (1.7%) | 16 (0.8%) |
| $25,000 to $29,999 | 80 (3.5%) | 128 (6.7%) |
| $30,000 to $34,999 | 20 (0.9%) | 43 (2.2%) |
| $35,000 to $39,999 | 26 (1.1%) | 77 (4.0%) |
| $40,000 to $44,999 | 43 (1.9%) | 25 (1.3%) |
| $45,000 to $49,999 | 15 (0.6%) | 36 (1.9%) |
| $50,000 to $54,999 | 37 (1.6%) | 51 (2.7%) |
| $55,000 to $64,999 | 106 (4.6%) | 97 (5.1%) |
| $65,000 to $74,999 | 75 (3.3%) | 210 (11.0%) |
| $75,000 to $99,999 | 149 (6.5%) | 260 (13.6%) |
| $100,000+ | 1,209 (52.6%) | 398 (20.8%) |
| Total | 2,299 (100.0%) | 1,916 (100.0%) |
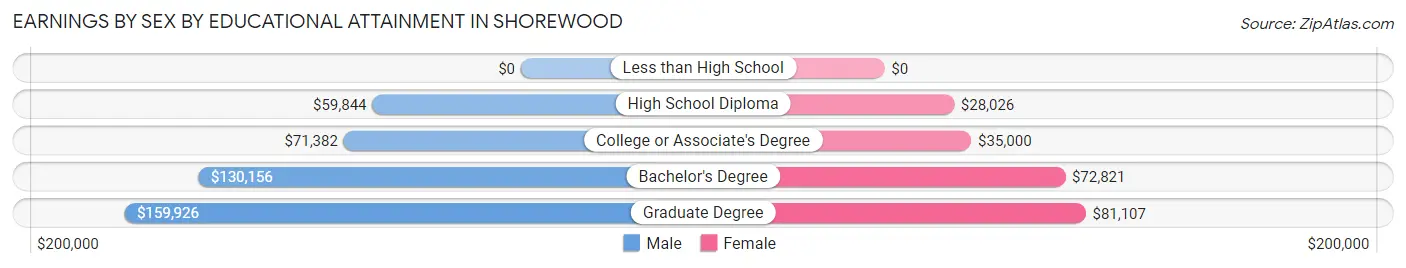
Earnings by Sex by Educational Attainment in Shorewood
Average earnings in Shorewood are $114,722 for men and $72,528 for women, a difference of 36.8%. Men with an educational attainment of graduate degree enjoy the highest average annual earnings of $159,926, while those with high school diploma education earn the least with $59,844. Women with an educational attainment of graduate degree earn the most with the average annual earnings of $81,107, while those with high school diploma education have the smallest earnings of $28,026.
| Educational Attainment | Male Income | Female Income |
| Less than High School | - | - |
| High School Diploma | $59,844 | $28,026 |
| College or Associate's Degree | $71,382 | $35,000 |
| Bachelor's Degree | $130,156 | $72,821 |
| Graduate Degree | $159,926 | $81,107 |
| Total | $114,722 | $72,528 |
Family Income in Shorewood
Family Income Brackets in Shorewood
According to the Shorewood family income data, there are 1,159 families falling into the $200,000+ income range, which is the most common income bracket and makes up 50.2% of all families. Conversely, the $10,000 to $14,999 income bracket is the least frequent group with only 7 families (0.3%) belonging to this category.
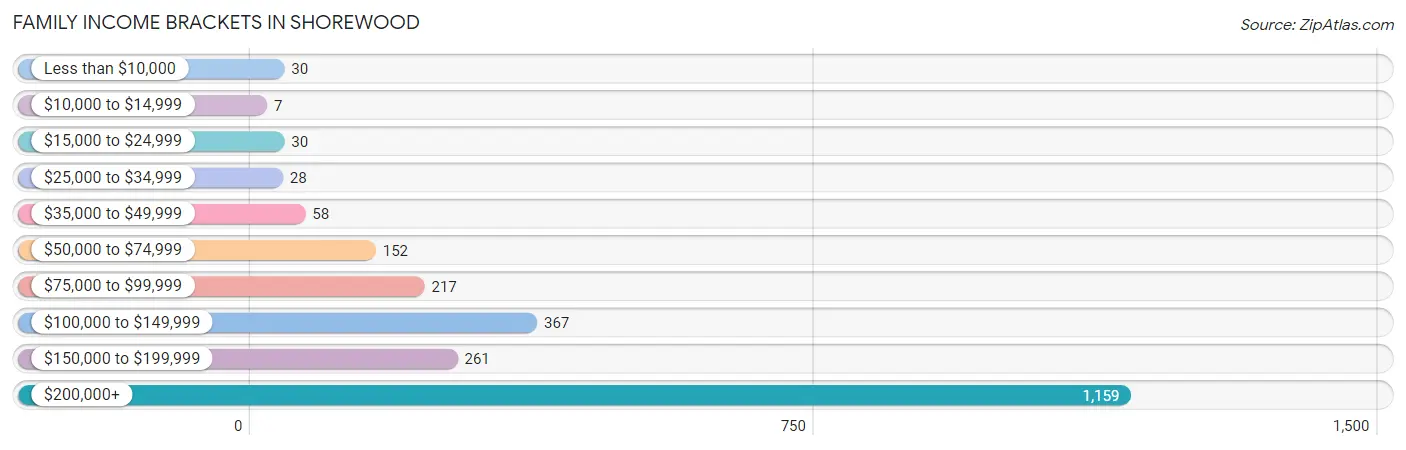
| Income Bracket | # Families | % Families |
| Less than $10,000 | 30 | 1.3% |
| $10,000 to $14,999 | 7 | 0.3% |
| $15,000 to $24,999 | 30 | 1.3% |
| $25,000 to $34,999 | 28 | 1.2% |
| $35,000 to $49,999 | 58 | 2.5% |
| $50,000 to $74,999 | 152 | 6.6% |
| $75,000 to $99,999 | 217 | 9.4% |
| $100,000 to $149,999 | 367 | 15.9% |
| $150,000 to $199,999 | 261 | 11.3% |
| $200,000+ | 1,159 | 50.2% |
Family Income by Famaliy Size in Shorewood
4-person families (546 | 23.7%) account for the highest median family income in Shorewood with $238,846 per family, while 3-person families (408 | 17.7%) have the highest median income of $73,710 per family member.
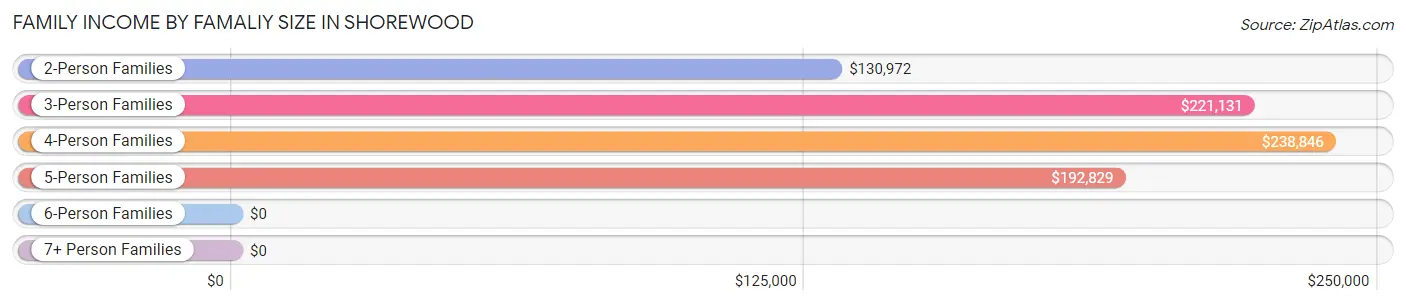
| Income Bracket | # Families | Median Income |
| 2-Person Families | 1,077 (46.7%) | $130,972 |
| 3-Person Families | 408 (17.7%) | $221,131 |
| 4-Person Families | 546 (23.7%) | $238,846 |
| 5-Person Families | 227 (9.8%) | $192,829 |
| 6-Person Families | 24 (1.0%) | $0 |
| 7+ Person Families | 26 (1.1%) | $0 |
| Total | 2,308 (100.0%) | $201,250 |
Family Income by Number of Earners in Shorewood
The median family income in Shorewood is $201,250, with families comprising 3+ earners (250) having the highest median family income of $250,001, while families with no earners (336) have the lowest median family income of $121,818, accounting for 10.8% and 14.6% of families, respectively.
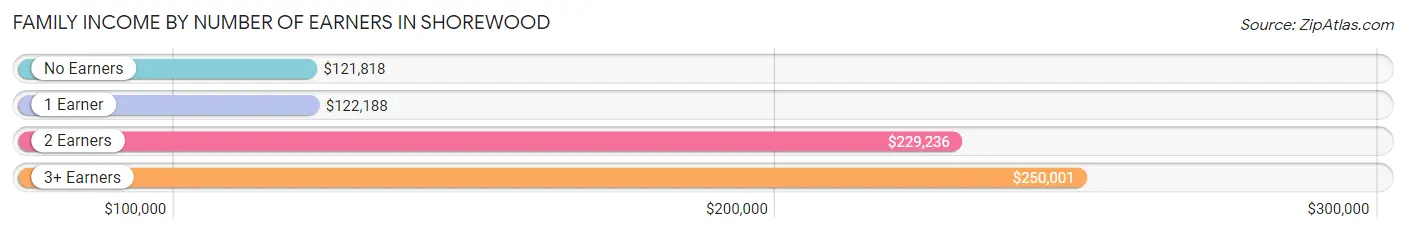
| Number of Earners | # Families | Median Income |
| No Earners | 336 (14.6%) | $121,818 |
| 1 Earner | 493 (21.4%) | $122,188 |
| 2 Earners | 1,229 (53.2%) | $229,236 |
| 3+ Earners | 250 (10.8%) | $250,001 |
| Total | 2,308 (100.0%) | $201,250 |
Household Income in Shorewood
Household Income Brackets in Shorewood
With 1,238 households falling in the category, the $200,000+ income range is the most frequent in Shorewood, accounting for 42.3% of all households. In contrast, only 35 households (1.2%) fall into the $10,000 to $14,999 income bracket, making it the least populous group.
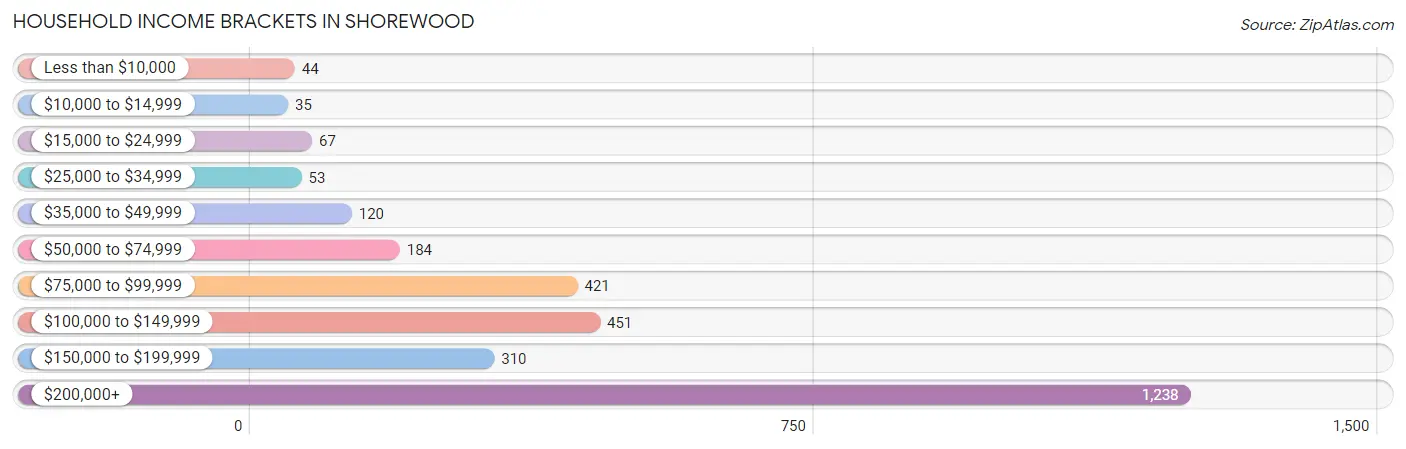
| Income Bracket | # Households | % Households |
| Less than $10,000 | 44 | 1.5% |
| $10,000 to $14,999 | 35 | 1.2% |
| $15,000 to $24,999 | 67 | 2.3% |
| $25,000 to $34,999 | 53 | 1.8% |
| $35,000 to $49,999 | 120 | 4.1% |
| $50,000 to $74,999 | 184 | 6.3% |
| $75,000 to $99,999 | 421 | 14.4% |
| $100,000 to $149,999 | 451 | 15.4% |
| $150,000 to $199,999 | 310 | 10.6% |
| $200,000+ | 1,238 | 42.3% |
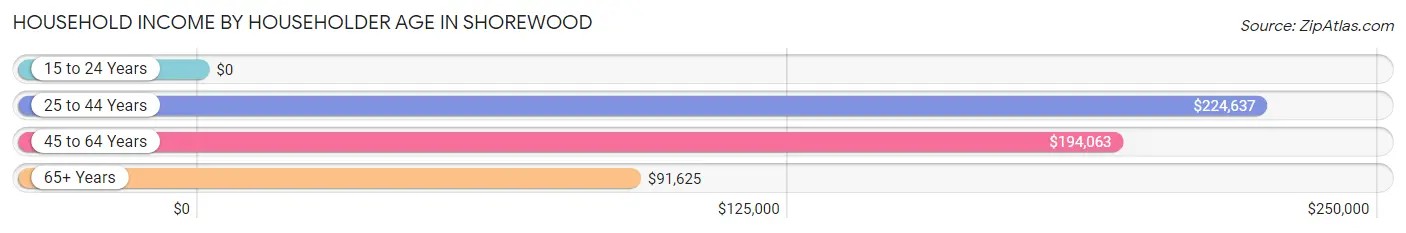
Household Income by Householder Age in Shorewood
The median household income in Shorewood is $163,525, with the highest median household income of $224,637 found in the 25 to 44 years age bracket for the primary householder. A total of 545 households (18.6%) fall into this category.
| Income Bracket | # Households | Median Income |
| 15 to 24 Years | 0 (0.0%) | $0 |
| 25 to 44 Years | 545 (18.6%) | $224,637 |
| 45 to 64 Years | 1,558 (53.2%) | $194,063 |
| 65+ Years | 823 (28.1%) | $91,625 |
| Total | 2,926 (100.0%) | $163,525 |
Poverty in Shorewood
Income Below Poverty by Sex and Age in Shorewood
With 4.9% poverty level for males and 3.6% for females among the residents of Shorewood, 25 to 34 year old males and 35 to 44 year old females are the most vulnerable to poverty, with 59 males (26.1%) and 31 females (7.2%) in their respective age groups living below the poverty level.
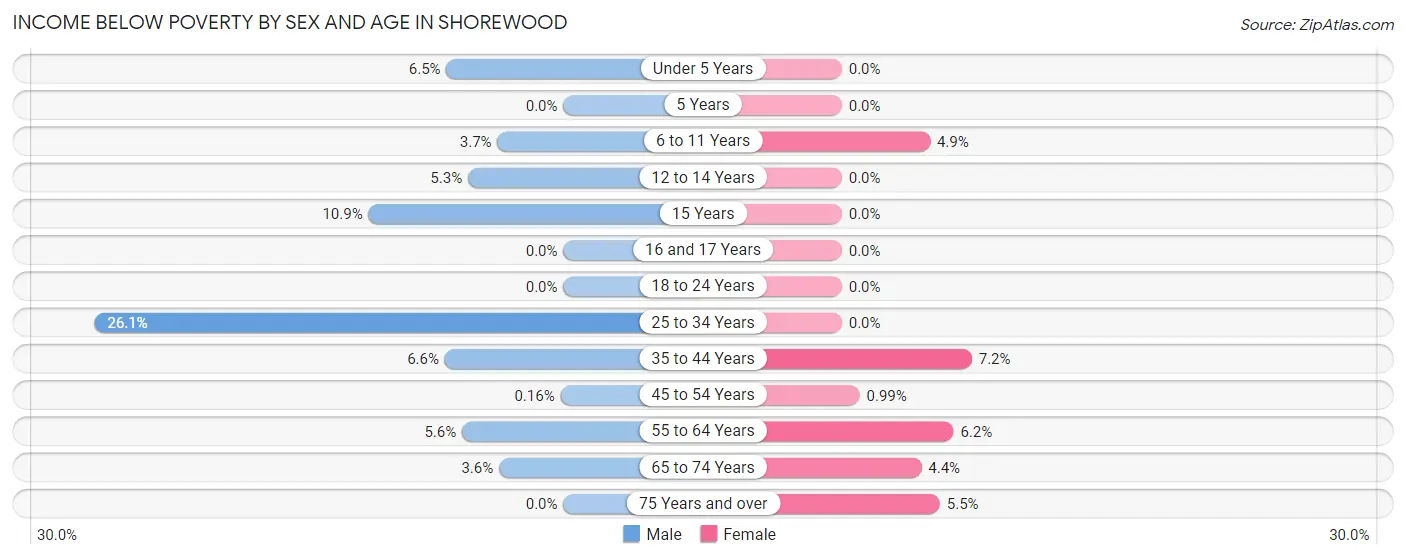
| Age Bracket | Male | Female |
| Under 5 Years | 11 (6.5%) | 0 (0.0%) |
| 5 Years | 0 (0.0%) | 0 (0.0%) |
| 6 to 11 Years | 11 (3.7%) | 11 (4.9%) |
| 12 to 14 Years | 11 (5.3%) | 0 (0.0%) |
| 15 Years | 14 (10.8%) | 0 (0.0%) |
| 16 and 17 Years | 0 (0.0%) | 0 (0.0%) |
| 18 to 24 Years | 0 (0.0%) | 0 (0.0%) |
| 25 to 34 Years | 59 (26.1%) | 0 (0.0%) |
| 35 to 44 Years | 27 (6.6%) | 31 (7.2%) |
| 45 to 54 Years | 1 (0.2%) | 5 (1.0%) |
| 55 to 64 Years | 45 (5.6%) | 51 (6.2%) |
| 65 to 74 Years | 15 (3.6%) | 21 (4.4%) |
| 75 Years and over | 0 (0.0%) | 16 (5.5%) |
| Total | 194 (4.9%) | 135 (3.6%) |
Income Above Poverty by Sex and Age in Shorewood
According to the poverty statistics in Shorewood, males aged 5 years and females aged under 5 years are the age groups that are most secure financially, with 100.0% of males and 100.0% of females in these age groups living above the poverty line.
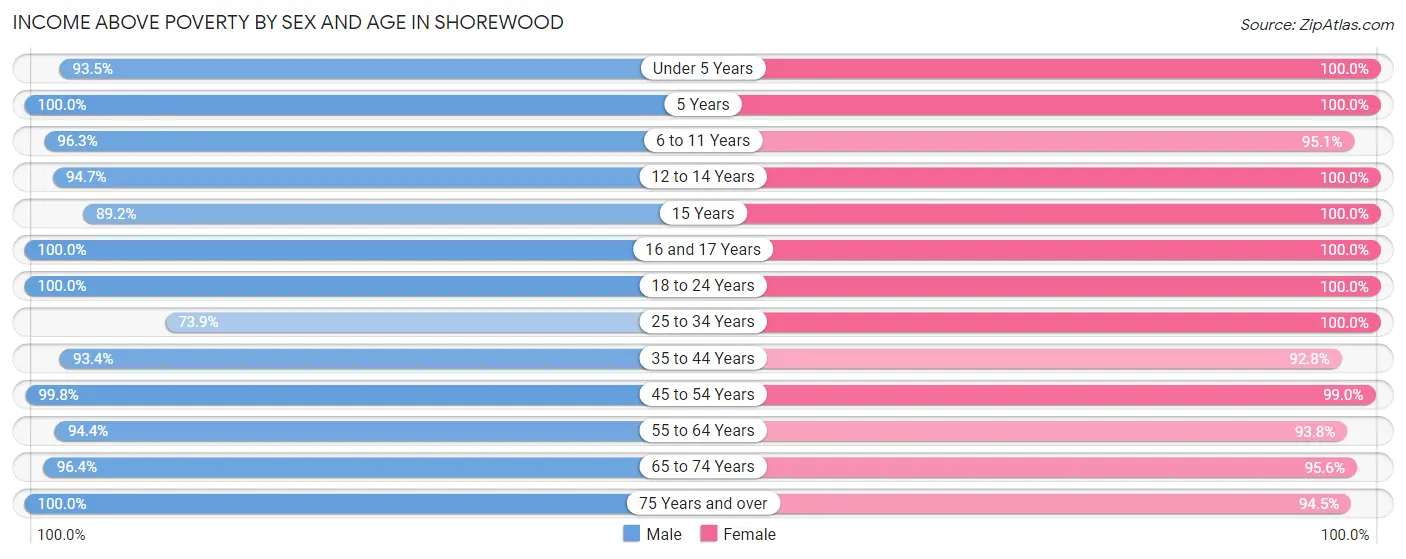
| Age Bracket | Male | Female |
| Under 5 Years | 158 (93.5%) | 217 (100.0%) |
| 5 Years | 55 (100.0%) | 53 (100.0%) |
| 6 to 11 Years | 289 (96.3%) | 213 (95.1%) |
| 12 to 14 Years | 196 (94.7%) | 221 (100.0%) |
| 15 Years | 115 (89.1%) | 63 (100.0%) |
| 16 and 17 Years | 211 (100.0%) | 78 (100.0%) |
| 18 to 24 Years | 109 (100.0%) | 179 (100.0%) |
| 25 to 34 Years | 167 (73.9%) | 195 (100.0%) |
| 35 to 44 Years | 382 (93.4%) | 397 (92.8%) |
| 45 to 54 Years | 642 (99.8%) | 498 (99.0%) |
| 55 to 64 Years | 753 (94.4%) | 769 (93.8%) |
| 65 to 74 Years | 404 (96.4%) | 453 (95.6%) |
| 75 Years and over | 274 (100.0%) | 277 (94.5%) |
| Total | 3,755 (95.1%) | 3,613 (96.4%) |
Income Below Poverty Among Married-Couple Families in Shorewood
The poverty statistics for married-couple families in Shorewood show that 4.0% or 83 of the total 2,081 families live below the poverty line. Families with no children have the highest poverty rate of 5.3%, comprising of 61 families. On the other hand, families with 3 or 4 children have the lowest poverty rate of 0.0%, which includes 0 families.
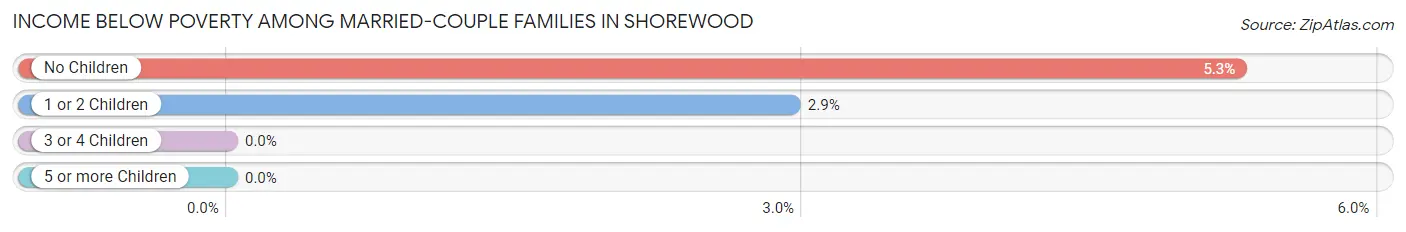
| Children | Above Poverty | Below Poverty |
| No Children | 1,097 (94.7%) | 61 (5.3%) |
| 1 or 2 Children | 727 (97.1%) | 22 (2.9%) |
| 3 or 4 Children | 174 (100.0%) | 0 (0.0%) |
| 5 or more Children | 0 (0.0%) | 0 (0.0%) |
| Total | 1,998 (96.0%) | 83 (4.0%) |
Income Below Poverty Among Single-Parent Households in Shorewood
| Children | Single Father | Single Mother |
| No Children | 0 (0.0%) | 0 (0.0%) |
| 1 or 2 Children | 0 (0.0%) | 0 (0.0%) |
| 3 or 4 Children | 0 (0.0%) | 0 (0.0%) |
| 5 or more Children | 0 (0.0%) | 0 (0.0%) |
| Total | 0 (0.0%) | 0 (0.0%) |
Income Below Poverty Among Married-Couple vs Single-Parent Households in Shorewood
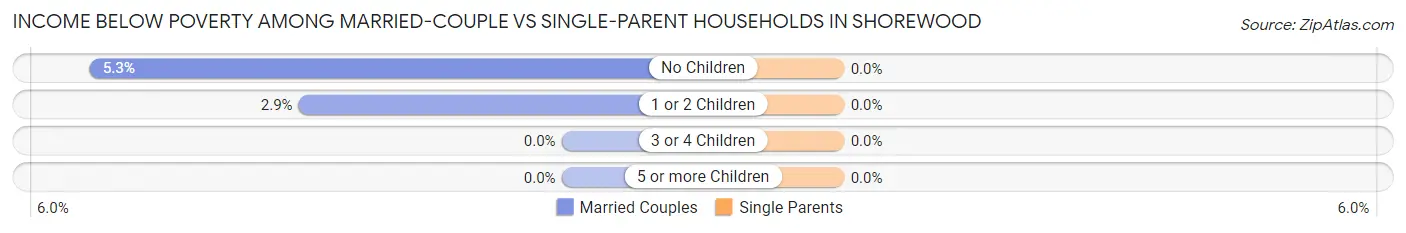
| Children | Married-Couple Families | Single-Parent Households |
| No Children | 61 (5.3%) | 0 (0.0%) |
| 1 or 2 Children | 22 (2.9%) | 0 (0.0%) |
| 3 or 4 Children | 0 (0.0%) | 0 (0.0%) |
| 5 or more Children | 0 (0.0%) | 0 (0.0%) |
| Total | 83 (4.0%) | 0 (0.0%) |
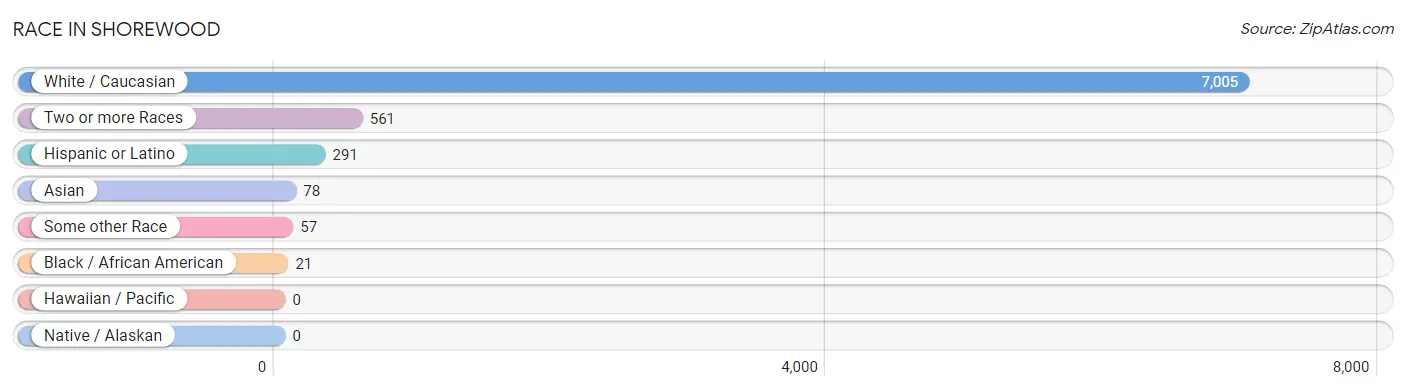
Race in Shorewood
The most populous races in Shorewood are White / Caucasian (7,005 | 90.7%), Two or more Races (561 | 7.3%), and Hispanic or Latino (291 | 3.8%).
| Race | # Population | % Population |
| Asian | 78 | 1.0% |
| Black / African American | 21 | 0.3% |
| Hawaiian / Pacific | 0 | 0.0% |
| Hispanic or Latino | 291 | 3.8% |
| Native / Alaskan | 0 | 0.0% |
| White / Caucasian | 7,005 | 90.7% |
| Two or more Races | 561 | 7.3% |
| Some other Race | 57 | 0.7% |
| Total | 7,722 | 100.0% |
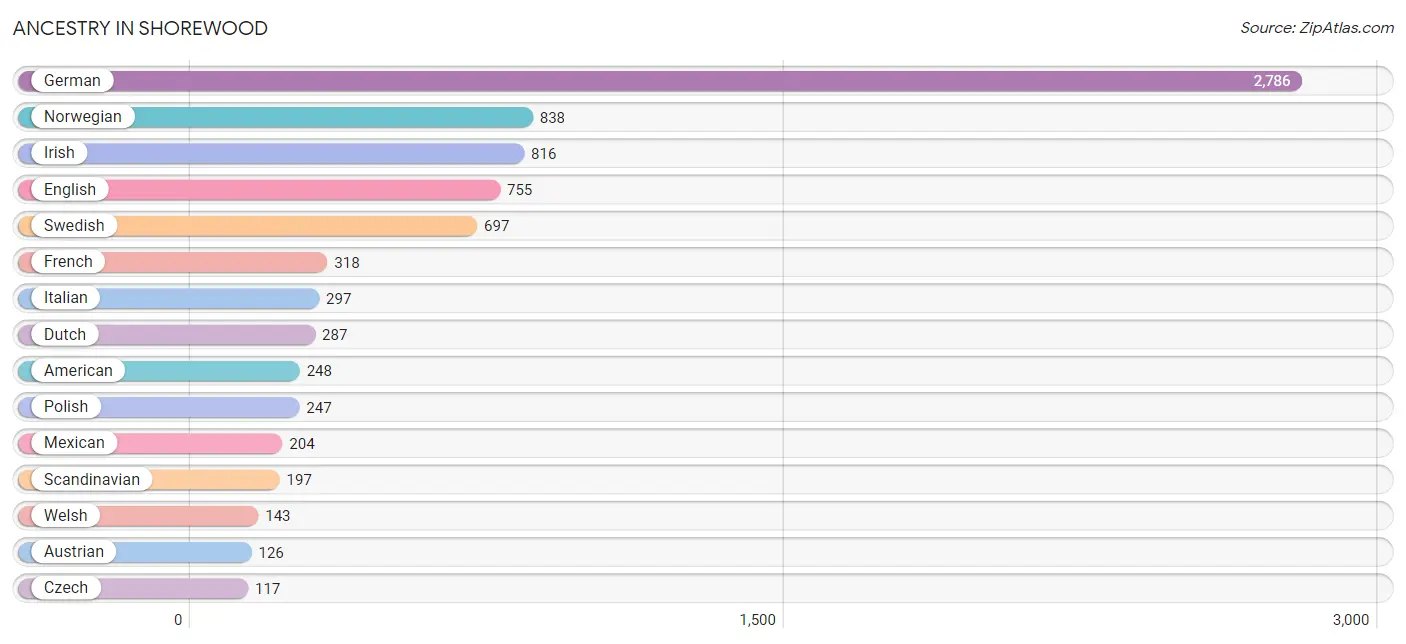
Ancestry in Shorewood
The most populous ancestries reported in Shorewood are German (2,786 | 36.1%), Norwegian (838 | 10.8%), Irish (816 | 10.6%), English (755 | 9.8%), and Swedish (697 | 9.0%), together accounting for 76.3% of all Shorewood residents.
| Ancestry | # Population | % Population |
| American | 248 | 3.2% |
| Arab | 69 | 0.9% |
| Austrian | 126 | 1.6% |
| Belgian | 11 | 0.1% |
| Bhutanese | 24 | 0.3% |
| British | 30 | 0.4% |
| Burmese | 69 | 0.9% |
| Canadian | 10 | 0.1% |
| Central American | 4 | 0.1% |
| Croatian | 7 | 0.1% |
| Czech | 117 | 1.5% |
| Czechoslovakian | 8 | 0.1% |
| Danish | 70 | 0.9% |
| Dutch | 287 | 3.7% |
| Eastern European | 36 | 0.5% |
| Egyptian | 6 | 0.1% |
| English | 755 | 9.8% |
| European | 113 | 1.5% |
| Finnish | 80 | 1.0% |
| French | 318 | 4.1% |
| French Canadian | 45 | 0.6% |
| German | 2,786 | 36.1% |
| Hungarian | 17 | 0.2% |
| Indian (Asian) | 59 | 0.8% |
| Irish | 816 | 10.6% |
| Italian | 297 | 3.8% |
| Kiowa | 90 | 1.2% |
| Korean | 29 | 0.4% |
| Lebanese | 28 | 0.4% |
| Liberian | 1 | 0.0% |
| Lithuanian | 17 | 0.2% |
| Macedonian | 6 | 0.1% |
| Mexican | 204 | 2.6% |
| Native Hawaiian | 8 | 0.1% |
| Nigerian | 13 | 0.2% |
| Northern European | 24 | 0.3% |
| Norwegian | 838 | 10.8% |
| Palestinian | 26 | 0.3% |
| Panamanian | 4 | 0.1% |
| Polish | 247 | 3.2% |
| Portuguese | 16 | 0.2% |
| Puerto Rican | 11 | 0.1% |
| Romanian | 11 | 0.1% |
| Russian | 113 | 1.5% |
| Scandinavian | 197 | 2.5% |
| Scotch-Irish | 58 | 0.7% |
| Scottish | 95 | 1.2% |
| Slovak | 19 | 0.3% |
| Slovene | 15 | 0.2% |
| Spaniard | 11 | 0.1% |
| Spanish | 61 | 0.8% |
| Sri Lankan | 12 | 0.2% |
| Subsaharan African | 33 | 0.4% |
| Swedish | 697 | 9.0% |
| Swiss | 34 | 0.4% |
| Ukrainian | 56 | 0.7% |
| Welsh | 143 | 1.8% | View All 57 Rows |
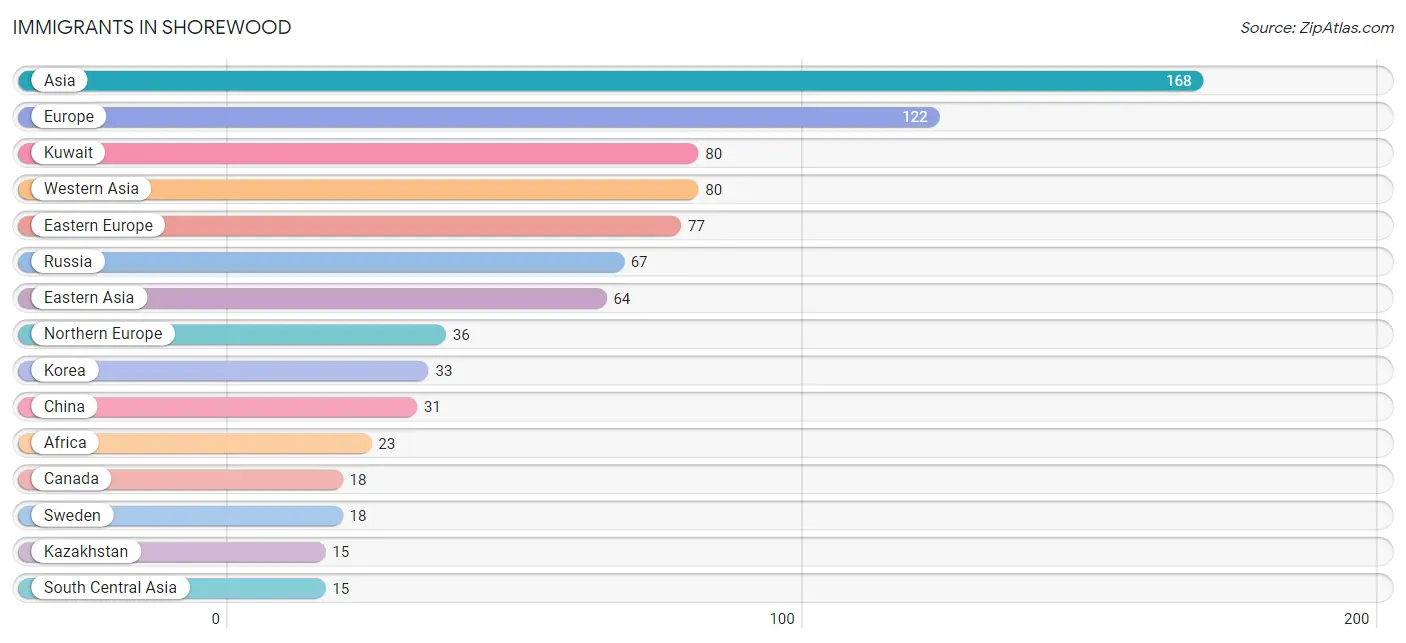
Immigrants in Shorewood
The most numerous immigrant groups reported in Shorewood came from Asia (168 | 2.2%), Europe (122 | 1.6%), Kuwait (80 | 1.0%), Western Asia (80 | 1.0%), and Eastern Europe (77 | 1.0%), together accounting for 6.8% of all Shorewood residents.
| Immigration Origin | # Population | % Population |
| Africa | 23 | 0.3% |
| Asia | 168 | 2.2% |
| Canada | 18 | 0.2% |
| China | 31 | 0.4% |
| Eastern Asia | 64 | 0.8% |
| Eastern Europe | 77 | 1.0% |
| Egypt | 6 | 0.1% |
| England | 7 | 0.1% |
| Europe | 122 | 1.6% |
| Germany | 9 | 0.1% |
| Ireland | 11 | 0.1% |
| Kazakhstan | 15 | 0.2% |
| Korea | 33 | 0.4% |
| Kuwait | 80 | 1.0% |
| Liberia | 1 | 0.0% |
| Middle Africa | 6 | 0.1% |
| Northern Africa | 6 | 0.1% |
| Northern Europe | 36 | 0.5% |
| Philippines | 9 | 0.1% |
| Russia | 67 | 0.9% |
| South Africa | 10 | 0.1% |
| South Central Asia | 15 | 0.2% |
| South Eastern Asia | 9 | 0.1% |
| Sweden | 18 | 0.2% |
| Ukraine | 10 | 0.1% |
| Western Africa | 1 | 0.0% |
| Western Asia | 80 | 1.0% |
| Western Europe | 9 | 0.1% | View All 28 Rows |
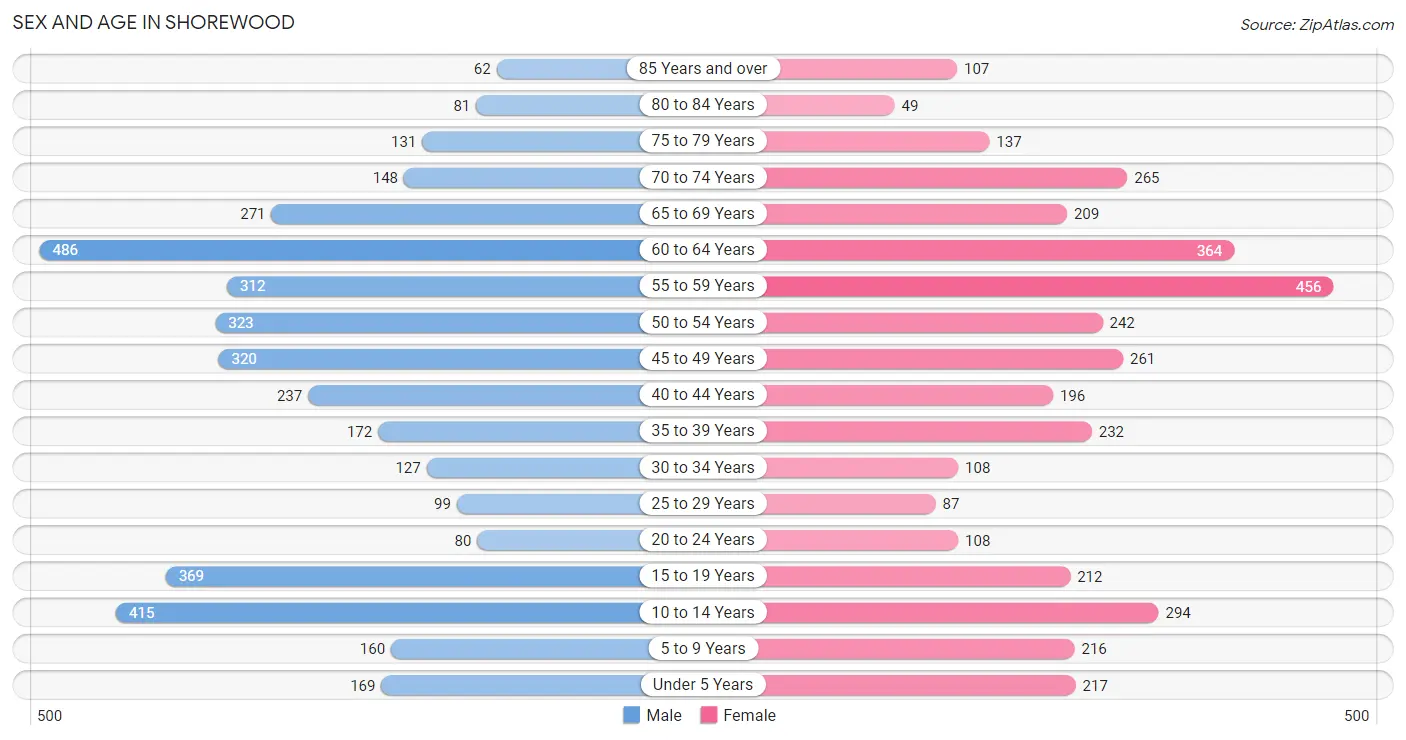
Sex and Age in Shorewood
Sex and Age in Shorewood
The most populous age groups in Shorewood are 60 to 64 Years (486 | 12.3%) for men and 55 to 59 Years (456 | 12.1%) for women.
| Age Bracket | Male | Female |
| Under 5 Years | 169 (4.3%) | 217 (5.8%) |
| 5 to 9 Years | 160 (4.0%) | 216 (5.7%) |
| 10 to 14 Years | 415 (10.5%) | 294 (7.8%) |
| 15 to 19 Years | 369 (9.3%) | 212 (5.6%) |
| 20 to 24 Years | 80 (2.0%) | 108 (2.9%) |
| 25 to 29 Years | 99 (2.5%) | 87 (2.3%) |
| 30 to 34 Years | 127 (3.2%) | 108 (2.9%) |
| 35 to 39 Years | 172 (4.3%) | 232 (6.2%) |
| 40 to 44 Years | 237 (6.0%) | 196 (5.2%) |
| 45 to 49 Years | 320 (8.1%) | 261 (6.9%) |
| 50 to 54 Years | 323 (8.2%) | 242 (6.4%) |
| 55 to 59 Years | 312 (7.9%) | 456 (12.1%) |
| 60 to 64 Years | 486 (12.3%) | 364 (9.7%) |
| 65 to 69 Years | 271 (6.8%) | 209 (5.6%) |
| 70 to 74 Years | 148 (3.7%) | 265 (7.0%) |
| 75 to 79 Years | 131 (3.3%) | 137 (3.6%) |
| 80 to 84 Years | 81 (2.0%) | 49 (1.3%) |
| 85 Years and over | 62 (1.6%) | 107 (2.9%) |
| Total | 3,962 (100.0%) | 3,760 (100.0%) |
Families and Households in Shorewood
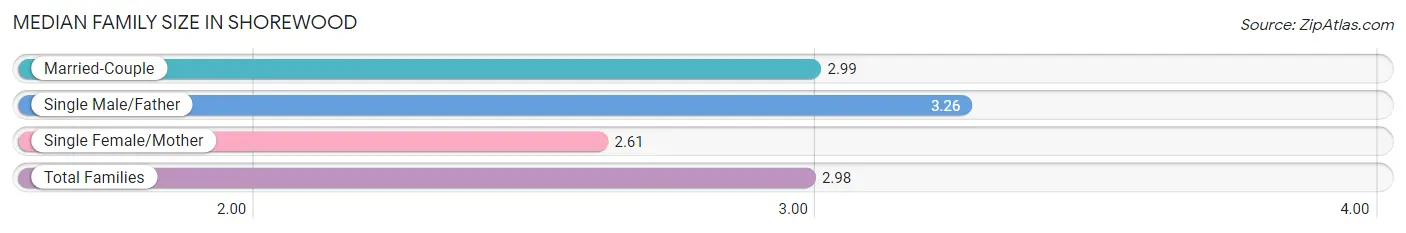
Median Family Size in Shorewood
The median family size in Shorewood is 2.98 persons per family, with single male/father families (92 | 4.0%) accounting for the largest median family size of 3.26 persons per family. On the other hand, single female/mother families (135 | 5.9%) represent the smallest median family size with 2.61 persons per family.
| Family Type | # Families | Family Size |
| Married-Couple | 2,081 (90.2%) | 2.99 |
| Single Male/Father | 92 (4.0%) | 3.26 |
| Single Female/Mother | 135 (5.9%) | 2.61 |
| Total Families | 2,308 (100.0%) | 2.98 |
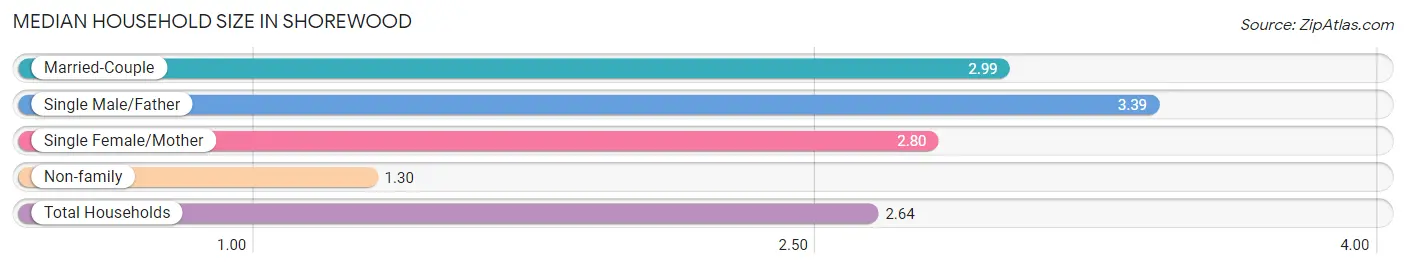
Median Household Size in Shorewood
The median household size in Shorewood is 2.64 persons per household, with single male/father households (92 | 3.1%) accounting for the largest median household size of 3.39 persons per household. non-family households (618 | 21.1%) represent the smallest median household size with 1.30 persons per household.
| Household Type | # Households | Household Size |
| Married-Couple | 2,081 (71.1%) | 2.99 |
| Single Male/Father | 92 (3.1%) | 3.39 |
| Single Female/Mother | 135 (4.6%) | 2.80 |
| Non-family | 618 (21.1%) | 1.30 |
| Total Households | 2,926 (100.0%) | 2.64 |
Household Size by Marriage Status in Shorewood
Out of a total of 2,926 households in Shorewood, 2,308 (78.9%) are family households, while 618 (21.1%) are nonfamily households. The most numerous type of family households are 2-person households, comprising 1,054, and the most common type of nonfamily households are 1-person households, comprising 487.
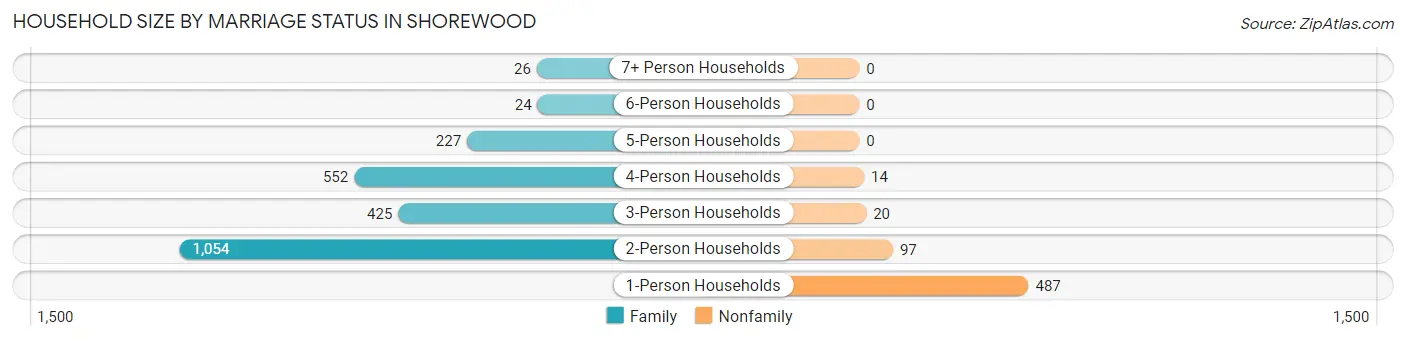
| Household Size | Family Households | Nonfamily Households |
| 1-Person Households | - | 487 (16.6%) |
| 2-Person Households | 1,054 (36.0%) | 97 (3.3%) |
| 3-Person Households | 425 (14.5%) | 20 (0.7%) |
| 4-Person Households | 552 (18.9%) | 14 (0.5%) |
| 5-Person Households | 227 (7.8%) | 0 (0.0%) |
| 6-Person Households | 24 (0.8%) | 0 (0.0%) |
| 7+ Person Households | 26 (0.9%) | 0 (0.0%) |
| Total | 2,308 (78.9%) | 618 (21.1%) |
Female Fertility in Shorewood
Fertility by Age in Shorewood
Average fertility rate in Shorewood is 36.0 births per 1,000 women. Women in the age bracket of 20 to 34 years have the highest fertility rate with 73.0 births per 1,000 women. Women in the age bracket of 20 to 34 years acount for 50.0% of all women with births.
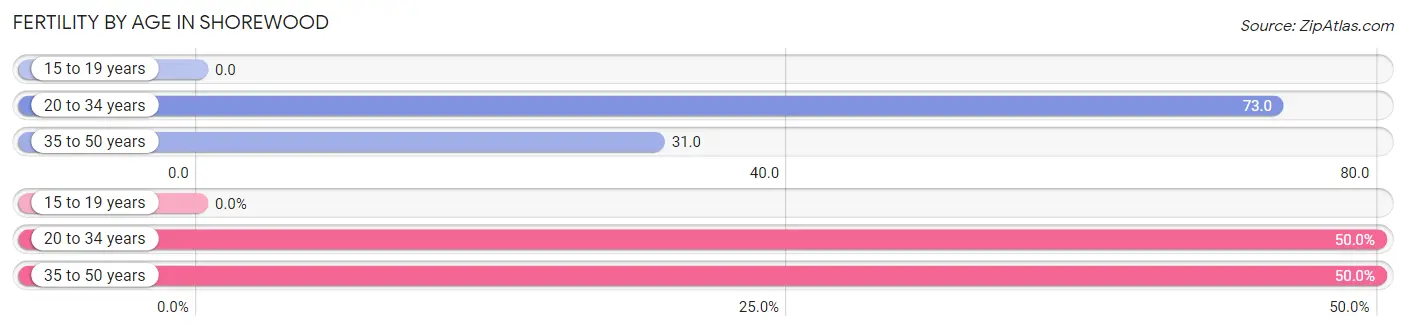
| Age Bracket | Women with Births | Births / 1,000 Women |
| 15 to 19 years | 0 (0.0%) | 0.0 |
| 20 to 34 years | 22 (50.0%) | 73.0 |
| 35 to 50 years | 22 (50.0%) | 31.0 |
| Total | 44 (100.0%) | 36.0 |
Fertility by Age by Marriage Status in Shorewood
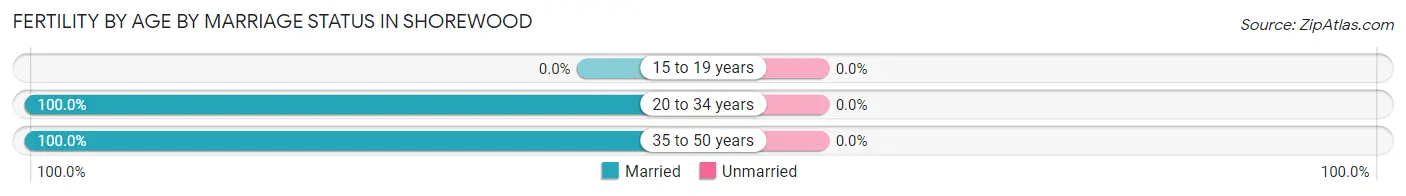
| Age Bracket | Married | Unmarried |
| 15 to 19 years | 0 (0.0%) | 0 (0.0%) |
| 20 to 34 years | 22 (100.0%) | 0 (0.0%) |
| 35 to 50 years | 22 (100.0%) | 0 (0.0%) |
| Total | 44 (100.0%) | 0 (0.0%) |
Fertility by Education in Shorewood
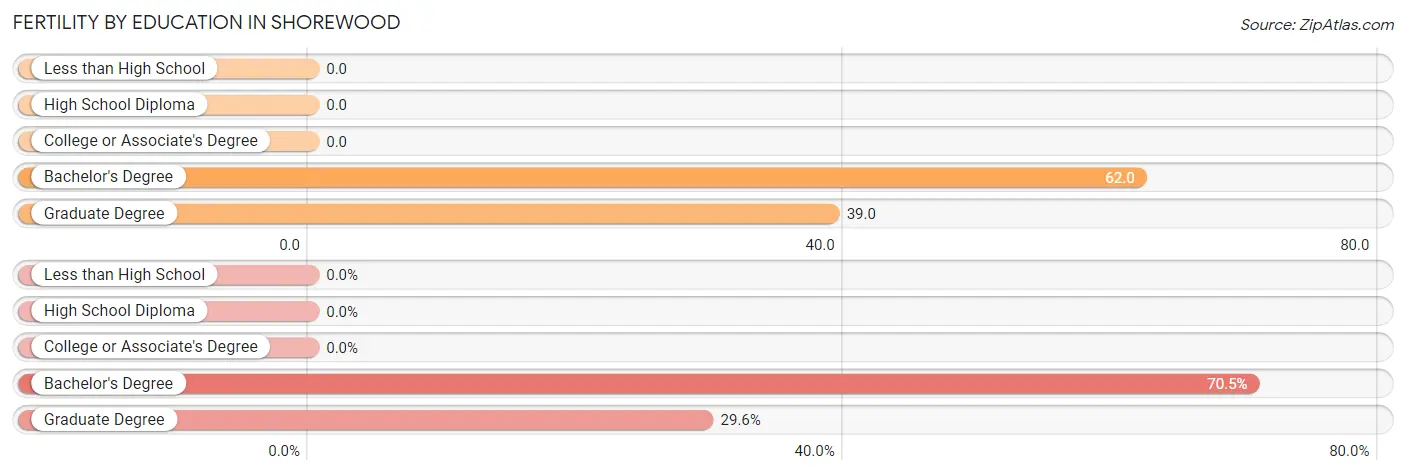
| Educational Attainment | Women with Births | Births / 1,000 Women |
| Less than High School | 0 (0.0%) | 0.0 |
| High School Diploma | 0 (0.0%) | 0.0 |
| College or Associate's Degree | 0 (0.0%) | 0.0 |
| Bachelor's Degree | 31 (70.5%) | 62.0 |
| Graduate Degree | 13 (29.5%) | 39.0 |
| Total | 44 (100.0%) | 36.0 |
Fertility by Education by Marriage Status in Shorewood
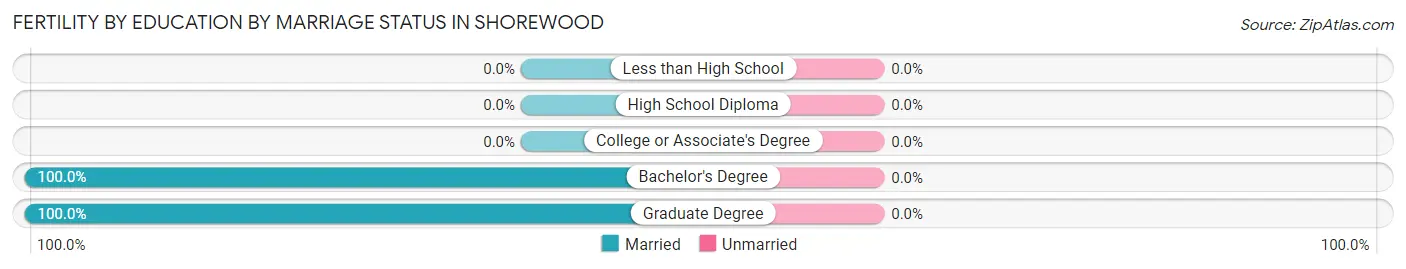
| Educational Attainment | Married | Unmarried |
| Less than High School | 0 (0.0%) | 0 (0.0%) |
| High School Diploma | 0 (0.0%) | 0 (0.0%) |
| College or Associate's Degree | 0 (0.0%) | 0 (0.0%) |
| Bachelor's Degree | 31 (100.0%) | 0 (0.0%) |
| Graduate Degree | 13 (100.0%) | 0 (0.0%) |
| Total | 44 (100.0%) | 0 (0.0%) |
Employment Characteristics in Shorewood
Employment by Class of Employer in Shorewood
Among the 3,727 employed individuals in Shorewood, private company employees (2,491 | 66.8%), local government employees (429 | 11.5%), and not-for-profit organizations (288 | 7.7%) make up the most common classes of employment.
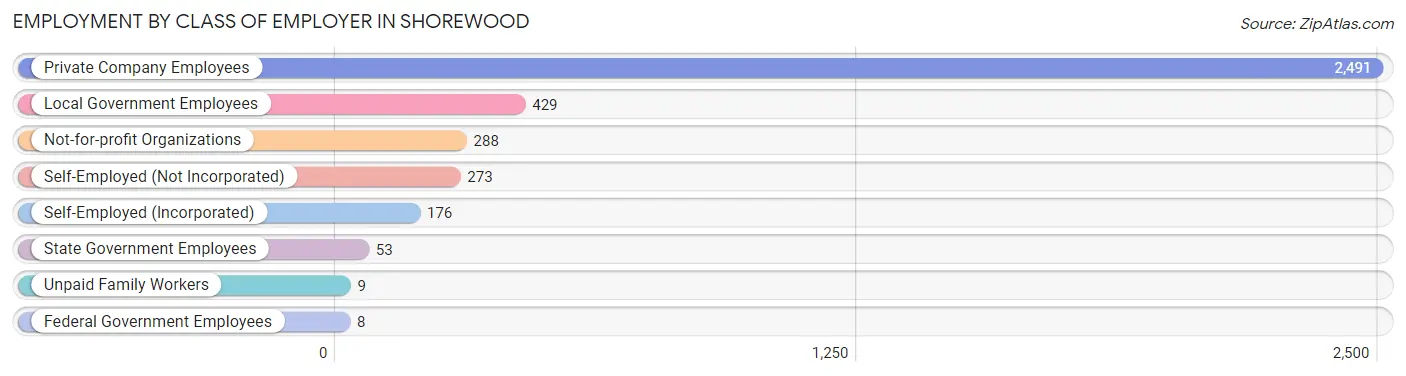
| Employer Class | # Employees | % Employees |
| Private Company Employees | 2,491 | 66.8% |
| Self-Employed (Incorporated) | 176 | 4.7% |
| Self-Employed (Not Incorporated) | 273 | 7.3% |
| Not-for-profit Organizations | 288 | 7.7% |
| Local Government Employees | 429 | 11.5% |
| State Government Employees | 53 | 1.4% |
| Federal Government Employees | 8 | 0.2% |
| Unpaid Family Workers | 9 | 0.2% |
| Total | 3,727 | 100.0% |
Employment Status by Age in Shorewood
According to the labor force statistics for Shorewood, out of the total population over 16 years of age (6,059), 65.8% or 3,987 individuals are in the labor force, with 5.1% or 203 of them unemployed. The age group with the highest labor force participation rate is 20 to 24 years, with 95.2% or 179 individuals in the labor force. Within the labor force, the 20 to 24 years age range has the highest percentage of unemployed individuals, with 38.5% or 69 of them being unemployed.
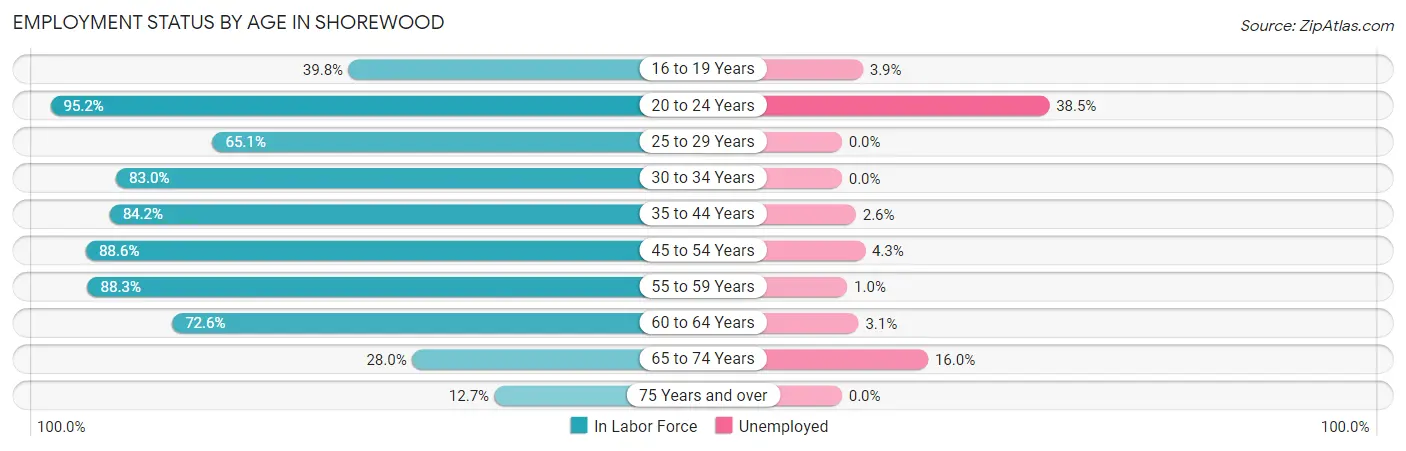
| Age Bracket | In Labor Force | Unemployed |
| 16 to 19 Years | 155 (39.8%) | 6 (3.9%) |
| 20 to 24 Years | 179 (95.2%) | 69 (38.5%) |
| 25 to 29 Years | 121 (65.1%) | 0 (0.0%) |
| 30 to 34 Years | 195 (83.0%) | 0 (0.0%) |
| 35 to 44 Years | 705 (84.2%) | 18 (2.6%) |
| 45 to 54 Years | 1,015 (88.6%) | 44 (4.3%) |
| 55 to 59 Years | 678 (88.3%) | 7 (1.0%) |
| 60 to 64 Years | 617 (72.6%) | 19 (3.1%) |
| 65 to 74 Years | 250 (28.0%) | 40 (16.0%) |
| 75 Years and over | 72 (12.7%) | 0 (0.0%) |
| Total | 3,987 (65.8%) | 203 (5.1%) |
Employment Status by Educational Attainment in Shorewood
According to labor force statistics for Shorewood, 82.8% of individuals (3,330) out of the total population between 25 and 64 years of age (4,022) are in the labor force, with 2.6% or 87 of them being unemployed. The group with the highest labor force participation rate are those with the educational attainment of bachelor's degree or higher, with 85.6% or 2,616 individuals in the labor force. Within the labor force, individuals with high school diploma education have the highest percentage of unemployment, with 8.1% or 16 of them being unemployed.
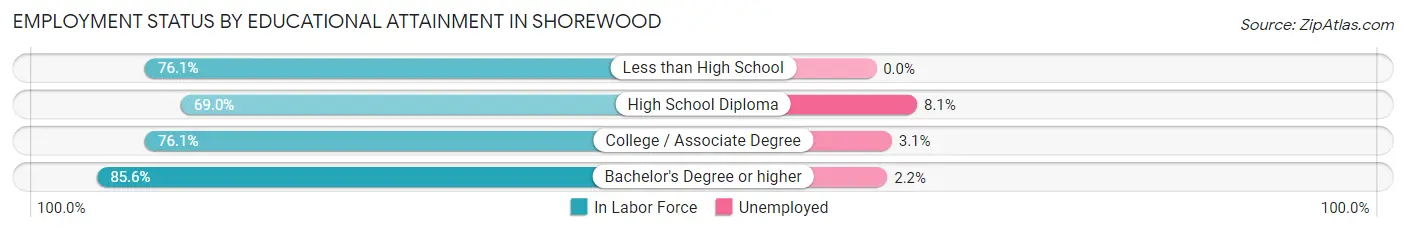
| Educational Attainment | In Labor Force | Unemployed |
| Less than High School | 35 (76.1%) | 0 (0.0%) |
| High School Diploma | 198 (69.0%) | 23 (8.1%) |
| College / Associate Degree | 482 (76.1%) | 20 (3.1%) |
| Bachelor's Degree or higher | 2,616 (85.6%) | 67 (2.2%) |
| Total | 3,330 (82.8%) | 105 (2.6%) |
Employment Occupations by Sex in Shorewood
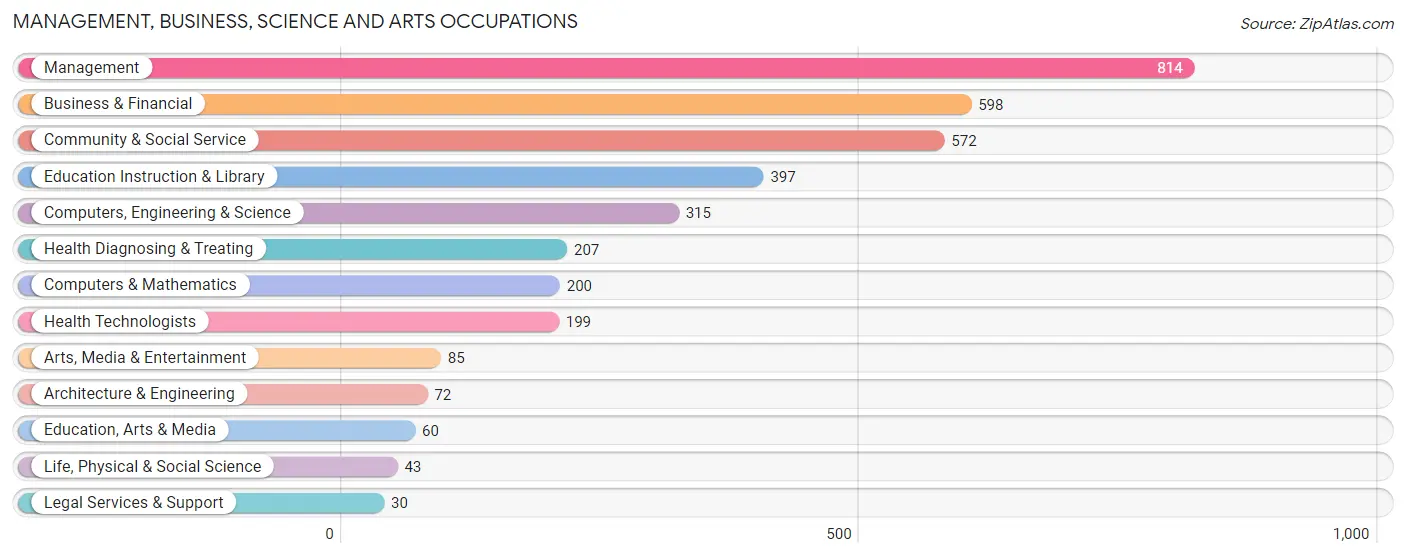
Management, Business, Science and Arts Occupations
The most common Management, Business, Science and Arts occupations in Shorewood are Management (814 | 21.5%), Business & Financial (598 | 15.8%), Community & Social Service (572 | 15.1%), Education Instruction & Library (397 | 10.5%), and Computers, Engineering & Science (315 | 8.3%).
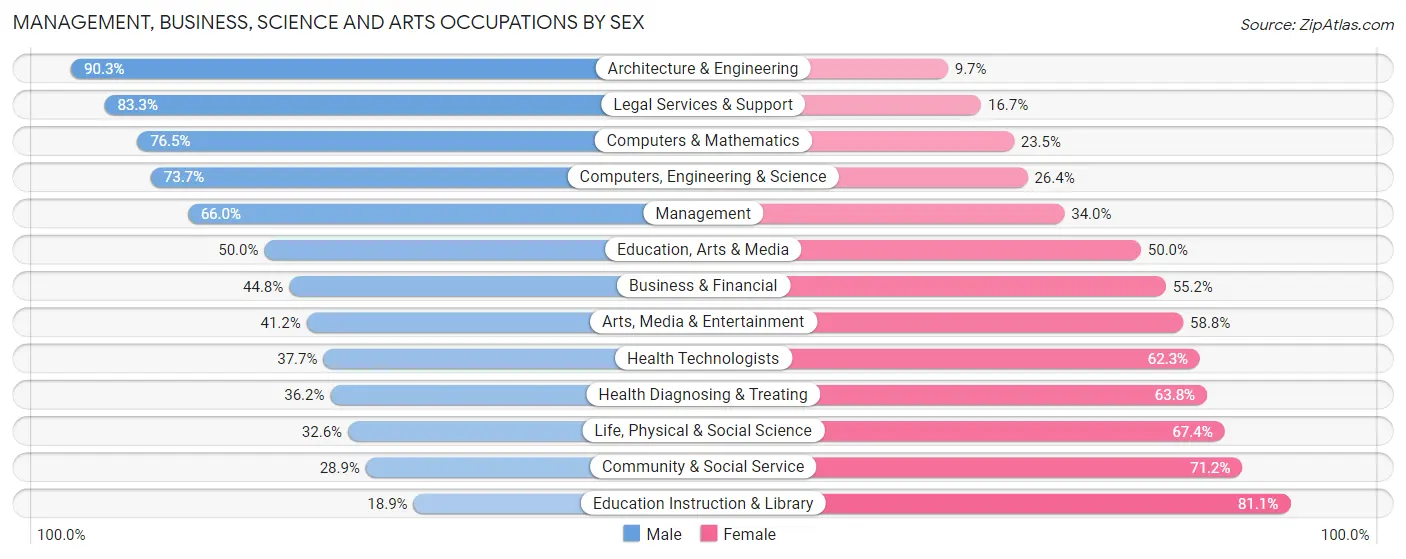
Management, Business, Science and Arts Occupations by Sex
Within the Management, Business, Science and Arts occupations in Shorewood, the most male-oriented occupations are Architecture & Engineering (90.3%), Legal Services & Support (83.3%), and Computers & Mathematics (76.5%), while the most female-oriented occupations are Education Instruction & Library (81.1%), Community & Social Service (71.2%), and Life, Physical & Social Science (67.4%).
| Occupation | Male | Female |
| Management | 537 (66.0%) | 277 (34.0%) |
| Business & Financial | 268 (44.8%) | 330 (55.2%) |
| Computers, Engineering & Science | 232 (73.7%) | 83 (26.4%) |
| Computers & Mathematics | 153 (76.5%) | 47 (23.5%) |
| Architecture & Engineering | 65 (90.3%) | 7 (9.7%) |
| Life, Physical & Social Science | 14 (32.6%) | 29 (67.4%) |
| Community & Social Service | 165 (28.8%) | 407 (71.2%) |
| Education, Arts & Media | 30 (50.0%) | 30 (50.0%) |
| Legal Services & Support | 25 (83.3%) | 5 (16.7%) |
| Education Instruction & Library | 75 (18.9%) | 322 (81.1%) |
| Arts, Media & Entertainment | 35 (41.2%) | 50 (58.8%) |
| Health Diagnosing & Treating | 75 (36.2%) | 132 (63.8%) |
| Health Technologists | 75 (37.7%) | 124 (62.3%) |
| Total (Category) | 1,277 (51.0%) | 1,229 (49.0%) |
| Total (Overall) | 2,048 (54.1%) | 1,736 (45.9%) |
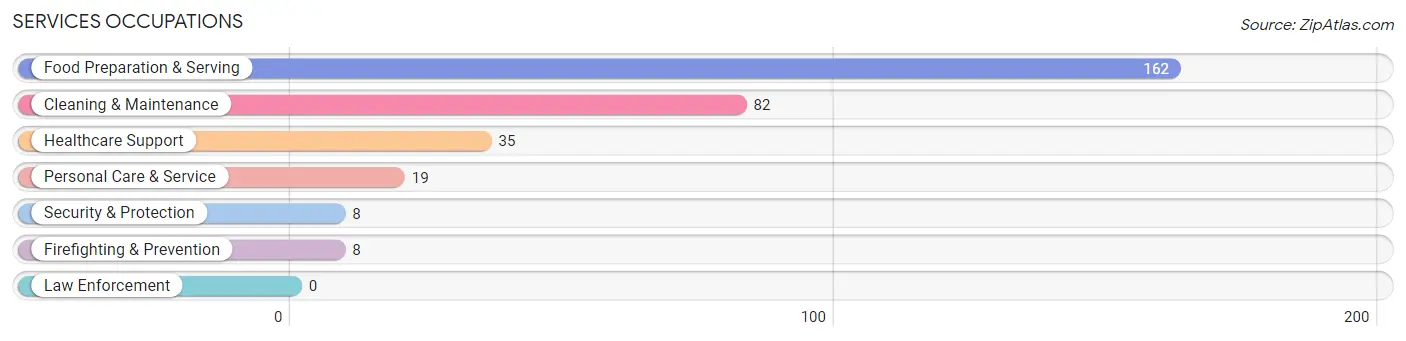
Services Occupations
The most common Services occupations in Shorewood are Food Preparation & Serving (162 | 4.3%), Cleaning & Maintenance (82 | 2.2%), Healthcare Support (35 | 0.9%), Personal Care & Service (19 | 0.5%), and Security & Protection (8 | 0.2%).
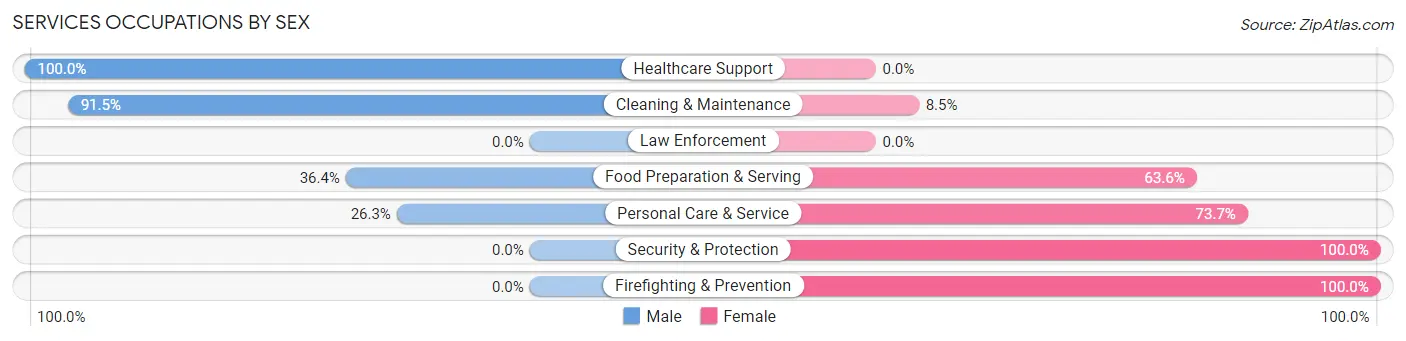
Services Occupations by Sex
Within the Services occupations in Shorewood, the most male-oriented occupations are Healthcare Support (100.0%), Cleaning & Maintenance (91.5%), and Food Preparation & Serving (36.4%), while the most female-oriented occupations are Security & Protection (100.0%), Firefighting & Prevention (100.0%), and Personal Care & Service (73.7%).
| Occupation | Male | Female |
| Healthcare Support | 35 (100.0%) | 0 (0.0%) |
| Security & Protection | 0 (0.0%) | 8 (100.0%) |
| Firefighting & Prevention | 0 (0.0%) | 8 (100.0%) |
| Law Enforcement | 0 (0.0%) | 0 (0.0%) |
| Food Preparation & Serving | 59 (36.4%) | 103 (63.6%) |
| Cleaning & Maintenance | 75 (91.5%) | 7 (8.5%) |
| Personal Care & Service | 5 (26.3%) | 14 (73.7%) |
| Total (Category) | 174 (56.9%) | 132 (43.1%) |
| Total (Overall) | 2,048 (54.1%) | 1,736 (45.9%) |
Sales and Office Occupations
The most common Sales and Office occupations in Shorewood are Sales & Related (396 | 10.5%), and Office & Administration (250 | 6.6%).
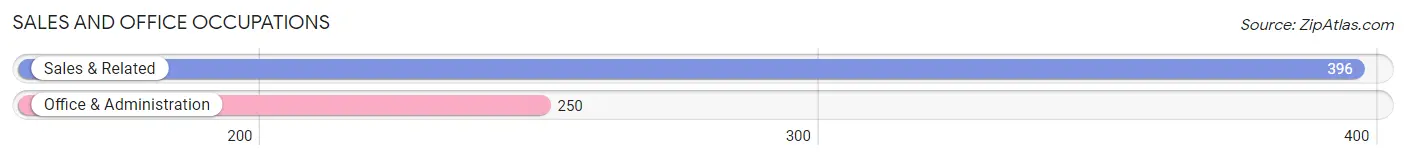
Sales and Office Occupations by Sex
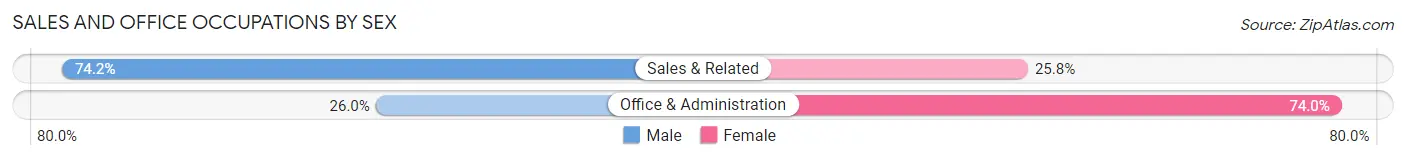
| Occupation | Male | Female |
| Sales & Related | 294 (74.2%) | 102 (25.8%) |
| Office & Administration | 65 (26.0%) | 185 (74.0%) |
| Total (Category) | 359 (55.6%) | 287 (44.4%) |
| Total (Overall) | 2,048 (54.1%) | 1,736 (45.9%) |
Natural Resources, Construction and Maintenance Occupations
The most common Natural Resources, Construction and Maintenance occupations in Shorewood are Construction & Extraction (109 | 2.9%), Installation, Maintenance & Repair (54 | 1.4%), and Farming, Fishing & Forestry (9 | 0.2%).
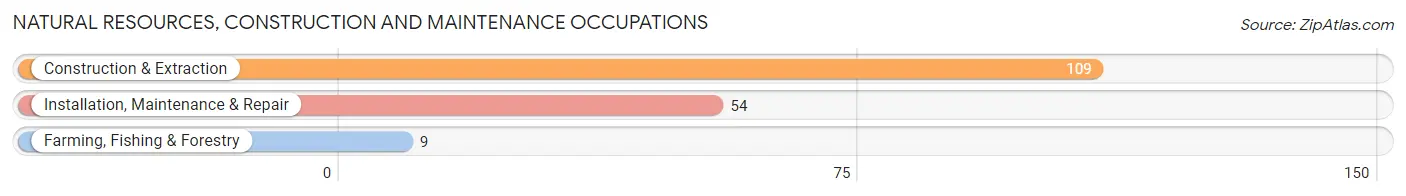
Natural Resources, Construction and Maintenance Occupations by Sex
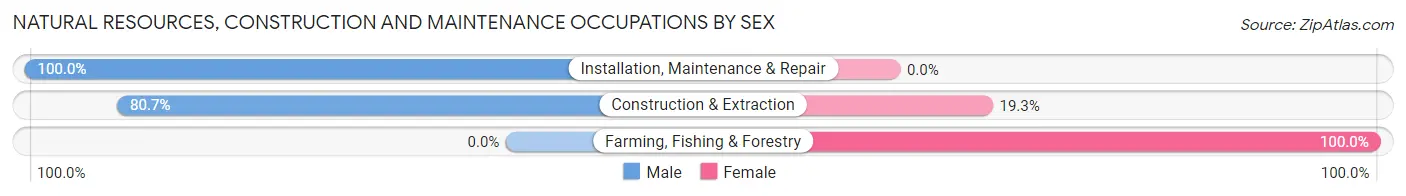
| Occupation | Male | Female |
| Farming, Fishing & Forestry | 0 (0.0%) | 9 (100.0%) |
| Construction & Extraction | 88 (80.7%) | 21 (19.3%) |
| Installation, Maintenance & Repair | 54 (100.0%) | 0 (0.0%) |
| Total (Category) | 142 (82.6%) | 30 (17.4%) |
| Total (Overall) | 2,048 (54.1%) | 1,736 (45.9%) |
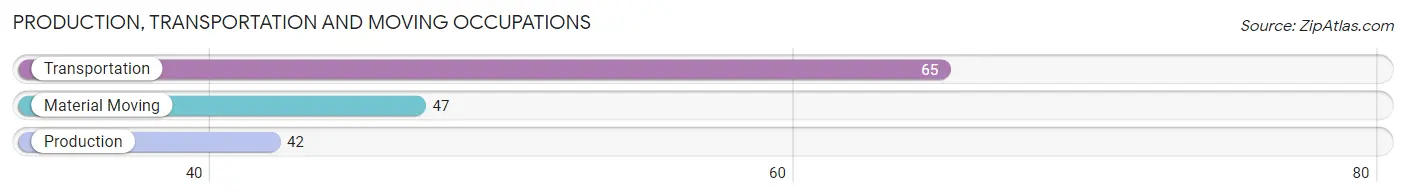
Production, Transportation and Moving Occupations
The most common Production, Transportation and Moving occupations in Shorewood are Transportation (65 | 1.7%), Material Moving (47 | 1.2%), and Production (42 | 1.1%).
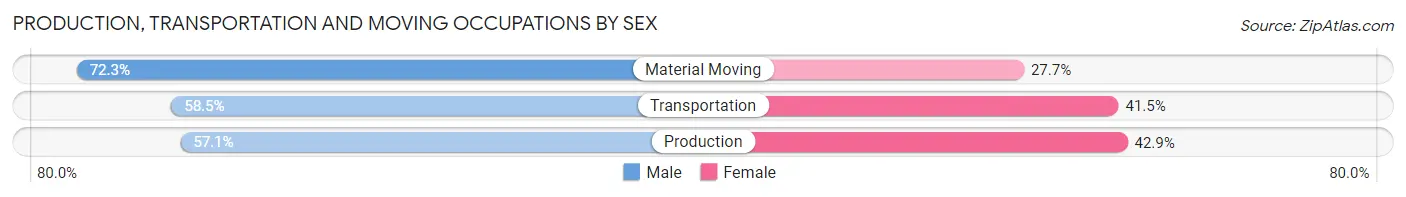
Production, Transportation and Moving Occupations by Sex
| Occupation | Male | Female |
| Production | 24 (57.1%) | 18 (42.9%) |
| Transportation | 38 (58.5%) | 27 (41.5%) |
| Material Moving | 34 (72.3%) | 13 (27.7%) |
| Total (Category) | 96 (62.3%) | 58 (37.7%) |
| Total (Overall) | 2,048 (54.1%) | 1,736 (45.9%) |
Employment Industries by Sex in Shorewood
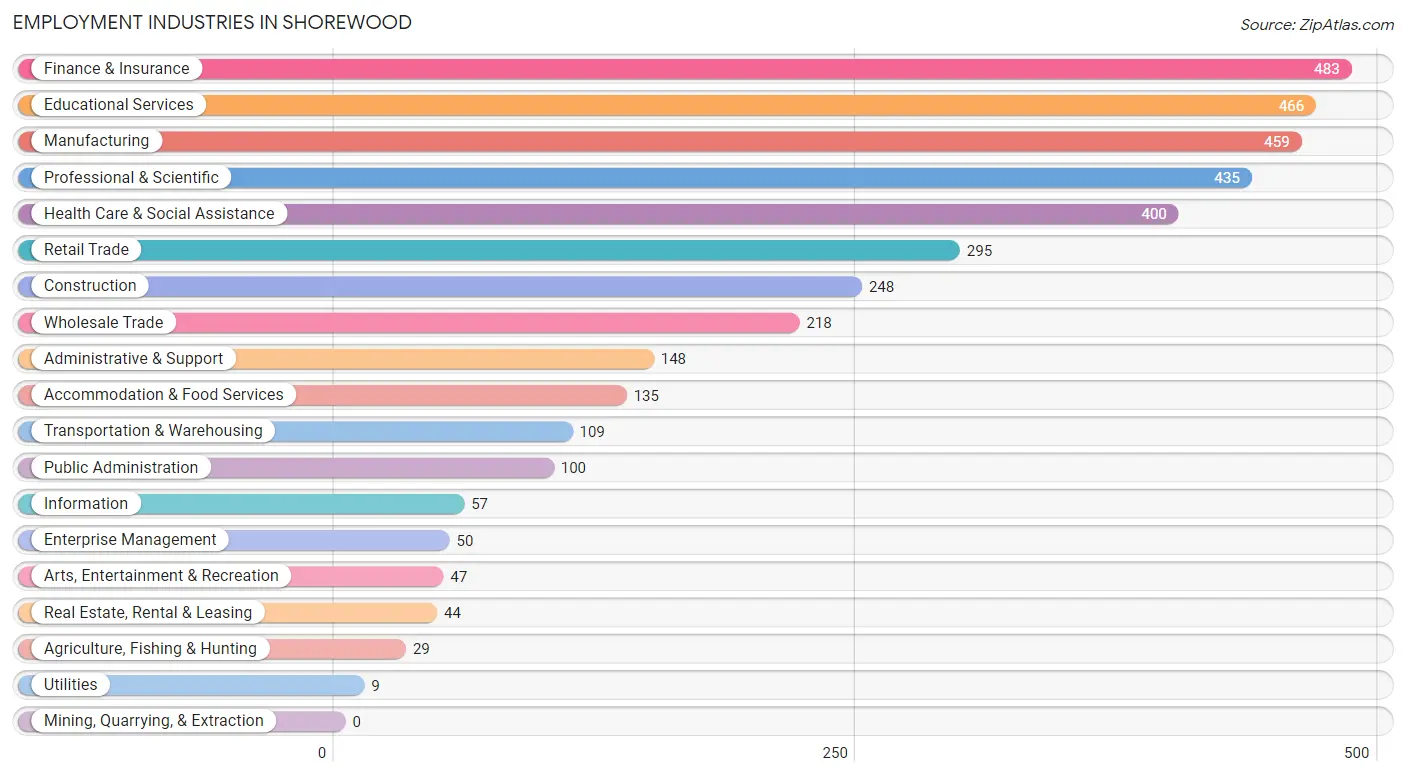
Employment Industries in Shorewood
The major employment industries in Shorewood include Finance & Insurance (483 | 12.8%), Educational Services (466 | 12.3%), Manufacturing (459 | 12.1%), Professional & Scientific (435 | 11.5%), and Health Care & Social Assistance (400 | 10.6%).
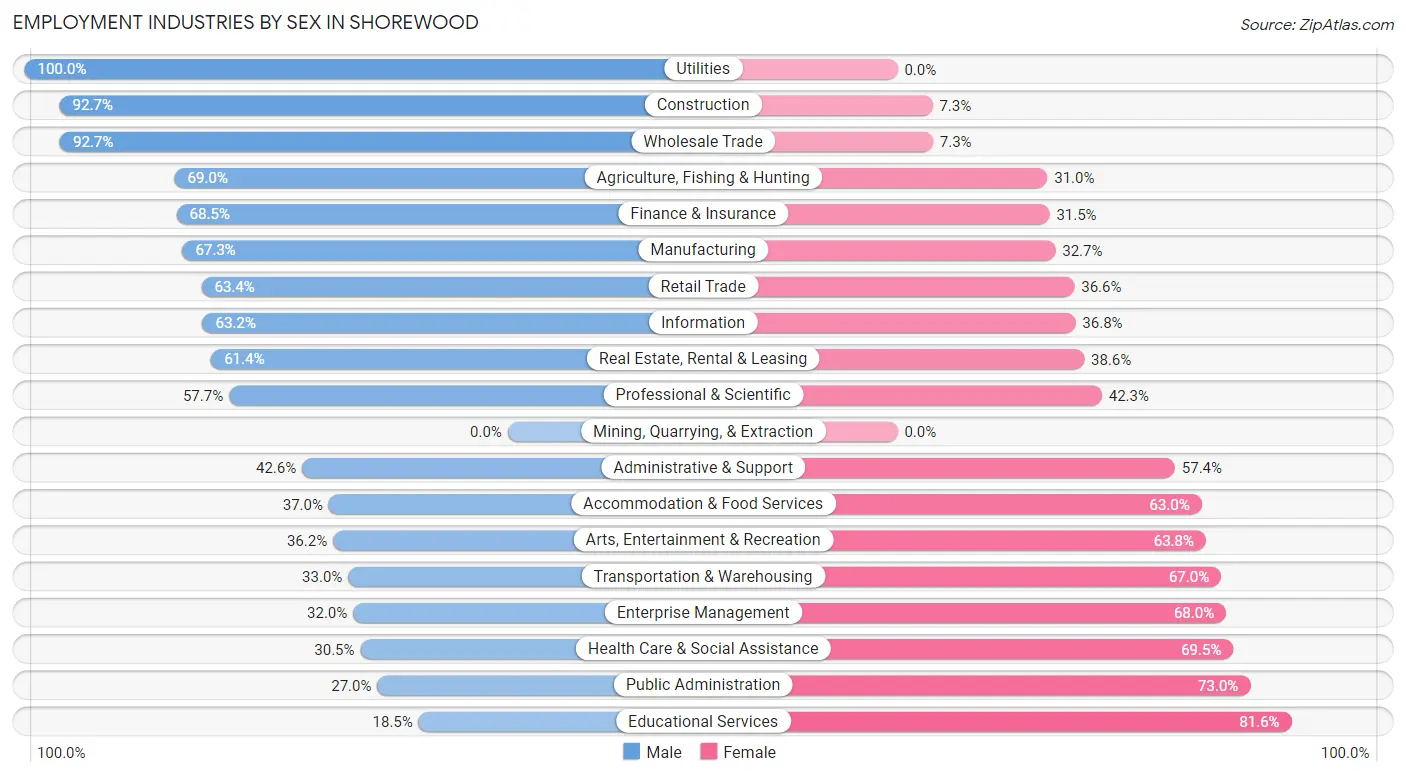
Employment Industries by Sex in Shorewood
The Shorewood industries that see more men than women are Utilities (100.0%), Construction (92.7%), and Wholesale Trade (92.7%), whereas the industries that tend to have a higher number of women are Educational Services (81.6%), Public Administration (73.0%), and Health Care & Social Assistance (69.5%).
| Industry | Male | Female |
| Agriculture, Fishing & Hunting | 20 (69.0%) | 9 (31.0%) |
| Mining, Quarrying, & Extraction | 0 (0.0%) | 0 (0.0%) |
| Construction | 230 (92.7%) | 18 (7.3%) |
| Manufacturing | 309 (67.3%) | 150 (32.7%) |
| Wholesale Trade | 202 (92.7%) | 16 (7.3%) |
| Retail Trade | 187 (63.4%) | 108 (36.6%) |
| Transportation & Warehousing | 36 (33.0%) | 73 (67.0%) |
| Utilities | 9 (100.0%) | 0 (0.0%) |
| Information | 36 (63.2%) | 21 (36.8%) |
| Finance & Insurance | 331 (68.5%) | 152 (31.5%) |
| Real Estate, Rental & Leasing | 27 (61.4%) | 17 (38.6%) |
| Professional & Scientific | 251 (57.7%) | 184 (42.3%) |
| Enterprise Management | 16 (32.0%) | 34 (68.0%) |
| Administrative & Support | 63 (42.6%) | 85 (57.4%) |
| Educational Services | 86 (18.4%) | 380 (81.6%) |
| Health Care & Social Assistance | 122 (30.5%) | 278 (69.5%) |
| Arts, Entertainment & Recreation | 17 (36.2%) | 30 (63.8%) |
| Accommodation & Food Services | 50 (37.0%) | 85 (63.0%) |
| Public Administration | 27 (27.0%) | 73 (73.0%) |
| Total | 2,048 (54.1%) | 1,736 (45.9%) |
Education in Shorewood
School Enrollment in Shorewood
The most common levels of schooling among the 1,986 students in Shorewood are middle school (579 | 29.1%), high school (520 | 26.2%), and elementary school (308 | 15.5%).
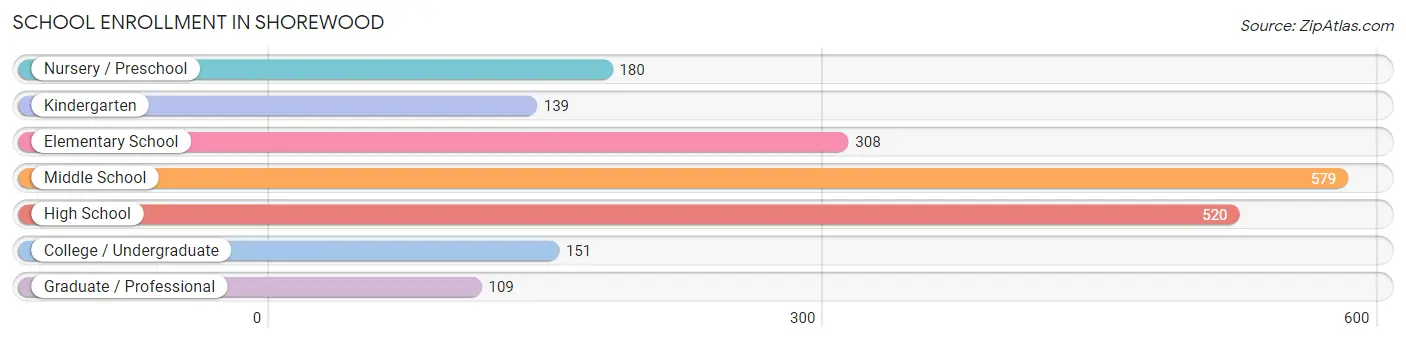
| School Level | # Students | % Students |
| Nursery / Preschool | 180 | 9.1% |
| Kindergarten | 139 | 7.0% |
| Elementary School | 308 | 15.5% |
| Middle School | 579 | 29.1% |
| High School | 520 | 26.2% |
| College / Undergraduate | 151 | 7.6% |
| Graduate / Professional | 109 | 5.5% |
| Total | 1,986 | 100.0% |
School Enrollment by Age by Funding Source in Shorewood
Out of a total of 1,986 students who are enrolled in schools in Shorewood, 248 (12.5%) attend a private institution, while the remaining 1,738 (87.5%) are enrolled in public schools. The age group of 3 to 4 year olds has the highest likelihood of being enrolled in private schools, with 64 (40.8% in the age bracket) enrolled. Conversely, the age group of 18 to 19 year olds has the lowest likelihood of being enrolled in a private school, with 94 (100.0% in the age bracket) attending a public institution.
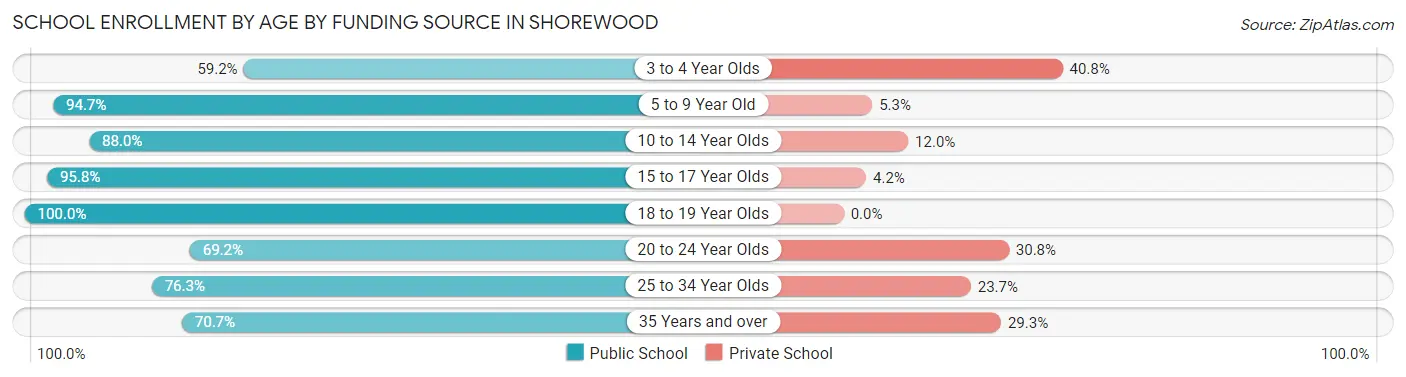
| Age Bracket | Public School | Private School |
| 3 to 4 Year Olds | 93 (59.2%) | 64 (40.8%) |
| 5 to 9 Year Old | 356 (94.7%) | 20 (5.3%) |
| 10 to 14 Year Olds | 601 (88.0%) | 82 (12.0%) |
| 15 to 17 Year Olds | 436 (95.8%) | 19 (4.2%) |
| 18 to 19 Year Olds | 94 (100.0%) | 0 (0.0%) |
| 20 to 24 Year Olds | 18 (69.2%) | 8 (30.8%) |
| 25 to 34 Year Olds | 29 (76.3%) | 9 (23.7%) |
| 35 Years and over | 111 (70.7%) | 46 (29.3%) |
| Total | 1,738 (87.5%) | 248 (12.5%) |
Educational Attainment by Field of Study in Shorewood
Business (1,153 | 25.9%), education (587 | 13.2%), science & technology (402 | 9.0%), social sciences (345 | 7.7%), and engineering (336 | 7.5%) are the most common fields of study among 4,453 individuals in Shorewood who have obtained a bachelor's degree or higher.
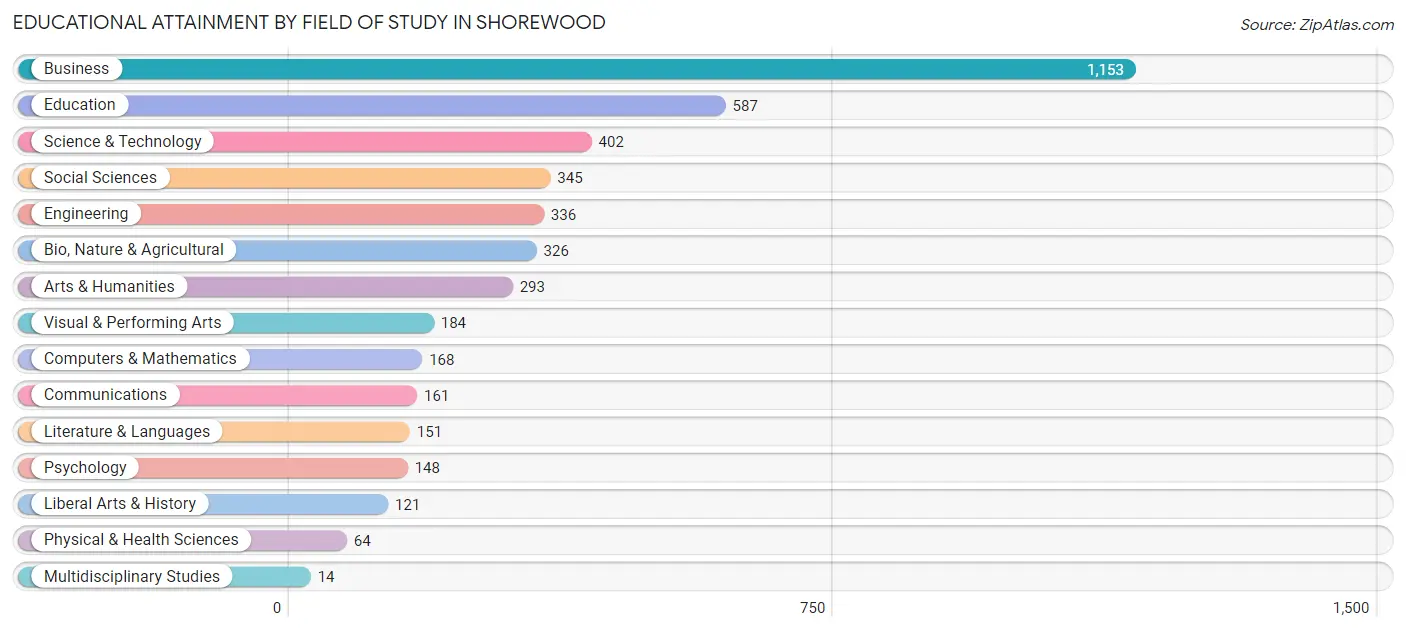
| Field of Study | # Graduates | % Graduates |
| Computers & Mathematics | 168 | 3.8% |
| Bio, Nature & Agricultural | 326 | 7.3% |
| Physical & Health Sciences | 64 | 1.4% |
| Psychology | 148 | 3.3% |
| Social Sciences | 345 | 7.7% |
| Engineering | 336 | 7.5% |
| Multidisciplinary Studies | 14 | 0.3% |
| Science & Technology | 402 | 9.0% |
| Business | 1,153 | 25.9% |
| Education | 587 | 13.2% |
| Literature & Languages | 151 | 3.4% |
| Liberal Arts & History | 121 | 2.7% |
| Visual & Performing Arts | 184 | 4.1% |
| Communications | 161 | 3.6% |
| Arts & Humanities | 293 | 6.6% |
| Total | 4,453 | 100.0% |
Transportation & Commute in Shorewood
Vehicle Availability by Sex in Shorewood
The most prevalent vehicle ownership categories in Shorewood are males with 2 vehicles (1,056, accounting for 52.8%) and females with 2 vehicles (936, making up 61.2%).
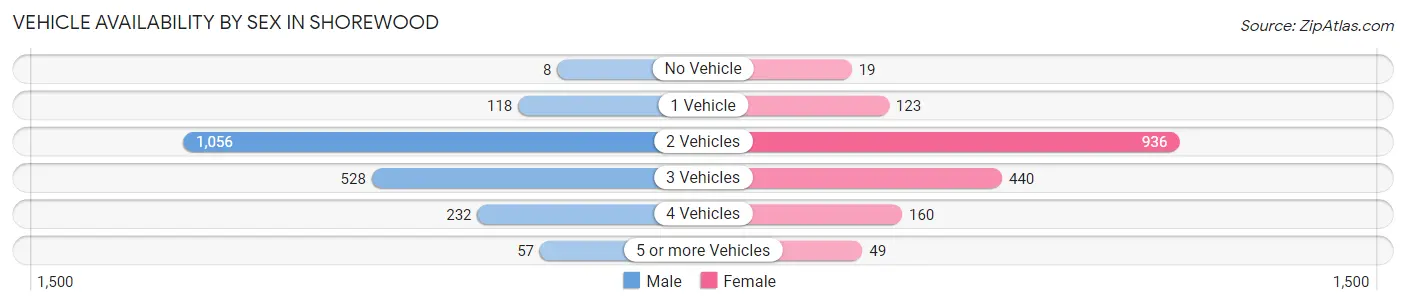
| Vehicles Available | Male | Female |
| No Vehicle | 8 (0.4%) | 19 (1.1%) |
| 1 Vehicle | 118 (5.9%) | 123 (7.1%) |
| 2 Vehicles | 1,056 (52.8%) | 936 (54.2%) |
| 3 Vehicles | 528 (26.4%) | 440 (25.5%) |
| 4 Vehicles | 232 (11.6%) | 160 (9.3%) |
| 5 or more Vehicles | 57 (2.9%) | 49 (2.8%) |
| Total | 1,999 (100.0%) | 1,727 (100.0%) |
Commute Time in Shorewood
The most frequently occuring commute durations in Shorewood are 20 to 24 minutes (452 commuters, 16.5%), 30 to 34 minutes (425 commuters, 15.5%), and 10 to 14 minutes (407 commuters, 14.8%).
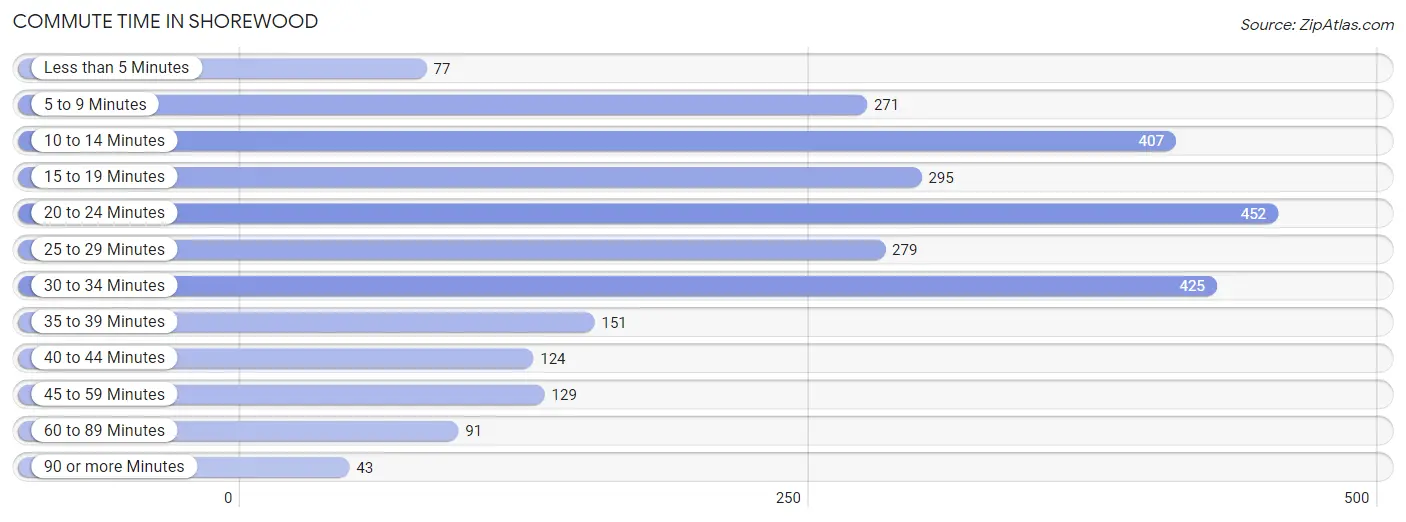
| Commute Time | # Commuters | % Commuters |
| Less than 5 Minutes | 77 | 2.8% |
| 5 to 9 Minutes | 271 | 9.9% |
| 10 to 14 Minutes | 407 | 14.8% |
| 15 to 19 Minutes | 295 | 10.7% |
| 20 to 24 Minutes | 452 | 16.5% |
| 25 to 29 Minutes | 279 | 10.2% |
| 30 to 34 Minutes | 425 | 15.5% |
| 35 to 39 Minutes | 151 | 5.5% |
| 40 to 44 Minutes | 124 | 4.5% |
| 45 to 59 Minutes | 129 | 4.7% |
| 60 to 89 Minutes | 91 | 3.3% |
| 90 or more Minutes | 43 | 1.6% |
Commute Time by Sex in Shorewood
The most common commute times in Shorewood are 20 to 24 minutes (263 commuters, 18.2%) for males and 10 to 14 minutes (231 commuters, 17.8%) for females.

| Commute Time | Male | Female |
| Less than 5 Minutes | 43 (3.0%) | 34 (2.6%) |
| 5 to 9 Minutes | 71 (4.9%) | 200 (15.4%) |
| 10 to 14 Minutes | 176 (12.1%) | 231 (17.8%) |
| 15 to 19 Minutes | 150 (10.4%) | 145 (11.2%) |
| 20 to 24 Minutes | 263 (18.2%) | 189 (14.6%) |
| 25 to 29 Minutes | 159 (11.0%) | 120 (9.3%) |
| 30 to 34 Minutes | 246 (17.0%) | 179 (13.8%) |
| 35 to 39 Minutes | 132 (9.1%) | 19 (1.5%) |
| 40 to 44 Minutes | 66 (4.6%) | 58 (4.5%) |
| 45 to 59 Minutes | 64 (4.4%) | 65 (5.0%) |
| 60 to 89 Minutes | 68 (4.7%) | 23 (1.8%) |
| 90 or more Minutes | 10 (0.7%) | 33 (2.5%) |
Time of Departure to Work by Sex in Shorewood
The most frequent times of departure to work in Shorewood are 7:00 AM to 7:29 AM (338, 23.3%) for males and 7:00 AM to 7:29 AM (327, 25.2%) for females.
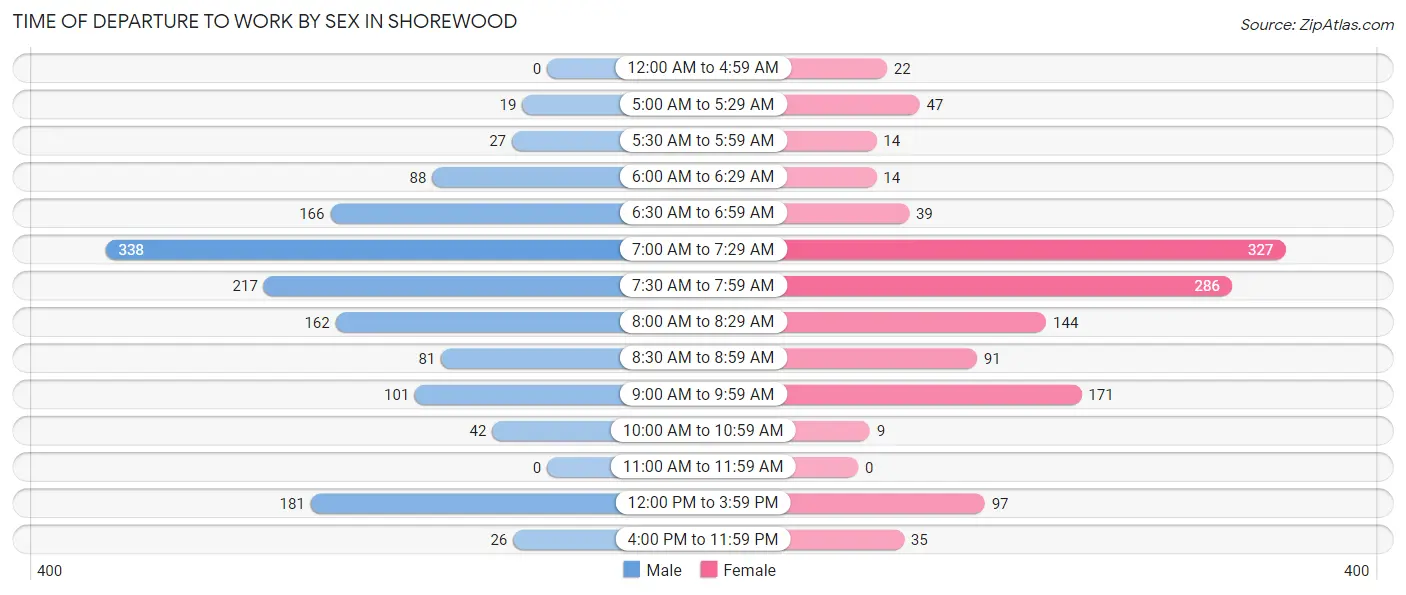
| Time of Departure | Male | Female |
| 12:00 AM to 4:59 AM | 0 (0.0%) | 22 (1.7%) |
| 5:00 AM to 5:29 AM | 19 (1.3%) | 47 (3.6%) |
| 5:30 AM to 5:59 AM | 27 (1.9%) | 14 (1.1%) |
| 6:00 AM to 6:29 AM | 88 (6.1%) | 14 (1.1%) |
| 6:30 AM to 6:59 AM | 166 (11.5%) | 39 (3.0%) |
| 7:00 AM to 7:29 AM | 338 (23.3%) | 327 (25.2%) |
| 7:30 AM to 7:59 AM | 217 (15.0%) | 286 (22.1%) |
| 8:00 AM to 8:29 AM | 162 (11.2%) | 144 (11.1%) |
| 8:30 AM to 8:59 AM | 81 (5.6%) | 91 (7.0%) |
| 9:00 AM to 9:59 AM | 101 (7.0%) | 171 (13.2%) |
| 10:00 AM to 10:59 AM | 42 (2.9%) | 9 (0.7%) |
| 11:00 AM to 11:59 AM | 0 (0.0%) | 0 (0.0%) |
| 12:00 PM to 3:59 PM | 181 (12.5%) | 97 (7.5%) |
| 4:00 PM to 11:59 PM | 26 (1.8%) | 35 (2.7%) |
| Total | 1,448 (100.0%) | 1,296 (100.0%) |
Housing Occupancy in Shorewood
Occupancy by Ownership in Shorewood
Of the total 2,926 dwellings in Shorewood, owner-occupied units account for 2,747 (93.9%), while renter-occupied units make up 179 (6.1%).
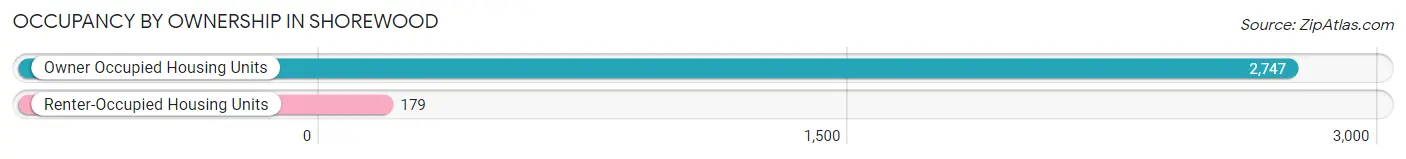
| Occupancy | # Housing Units | % Housing Units |
| Owner Occupied Housing Units | 2,747 | 93.9% |
| Renter-Occupied Housing Units | 179 | 6.1% |
| Total Occupied Housing Units | 2,926 | 100.0% |
Occupancy by Household Size in Shorewood
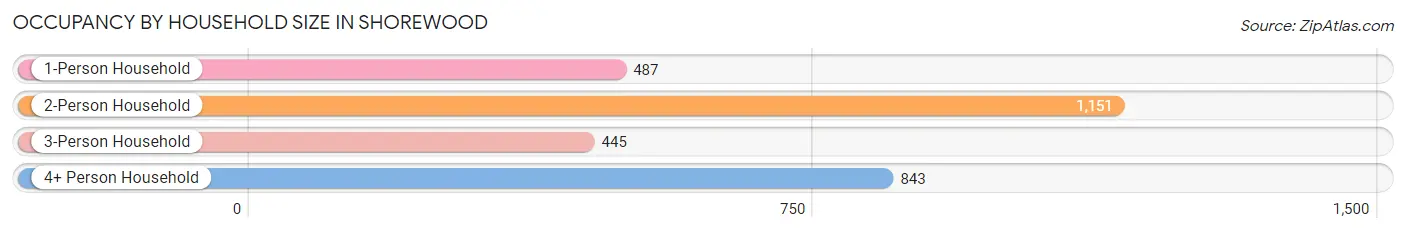
| Household Size | # Housing Units | % Housing Units |
| 1-Person Household | 487 | 16.6% |
| 2-Person Household | 1,151 | 39.3% |
| 3-Person Household | 445 | 15.2% |
| 4+ Person Household | 843 | 28.8% |
| Total Housing Units | 2,926 | 100.0% |
Occupancy by Ownership by Household Size in Shorewood
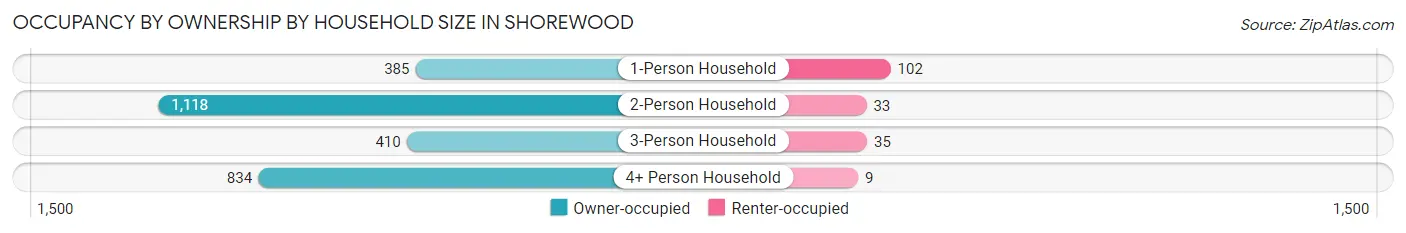
| Household Size | Owner-occupied | Renter-occupied |
| 1-Person Household | 385 (79.1%) | 102 (20.9%) |
| 2-Person Household | 1,118 (97.1%) | 33 (2.9%) |
| 3-Person Household | 410 (92.1%) | 35 (7.9%) |
| 4+ Person Household | 834 (98.9%) | 9 (1.1%) |
| Total Housing Units | 2,747 (93.9%) | 179 (6.1%) |
Occupancy by Educational Attainment in Shorewood
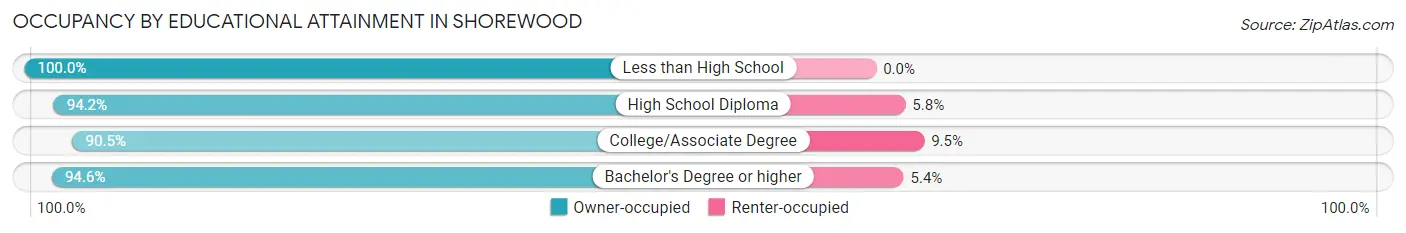
| Household Size | Owner-occupied | Renter-occupied |
| Less than High School | 23 (100.0%) | 0 (0.0%) |
| High School Diploma | 211 (94.2%) | 13 (5.8%) |
| College/Associate Degree | 446 (90.5%) | 47 (9.5%) |
| Bachelor's Degree or higher | 2,067 (94.6%) | 119 (5.4%) |
Occupancy by Age of Householder in Shorewood
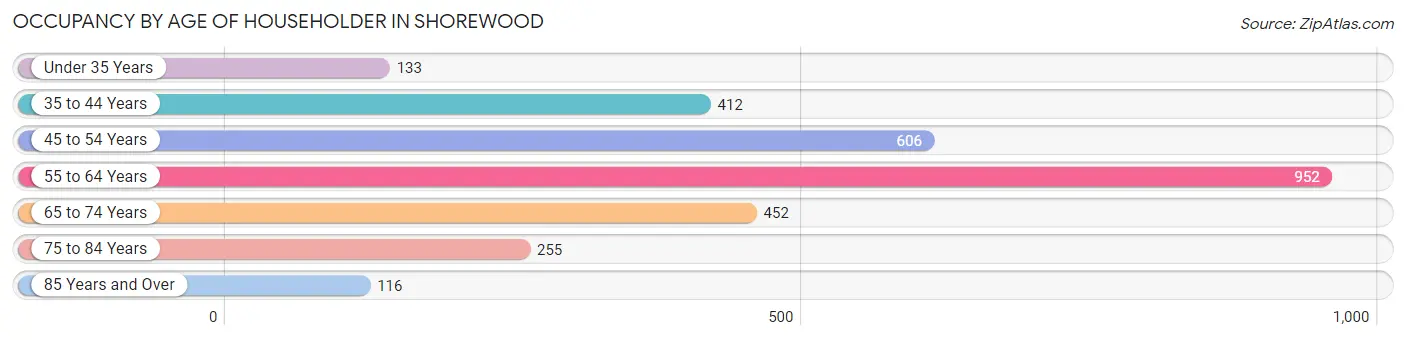
| Age Bracket | # Households | % Households |
| Under 35 Years | 133 | 4.5% |
| 35 to 44 Years | 412 | 14.1% |
| 45 to 54 Years | 606 | 20.7% |
| 55 to 64 Years | 952 | 32.5% |
| 65 to 74 Years | 452 | 15.4% |
| 75 to 84 Years | 255 | 8.7% |
| 85 Years and Over | 116 | 4.0% |
| Total | 2,926 | 100.0% |
Housing Finances in Shorewood
Median Income by Occupancy in Shorewood
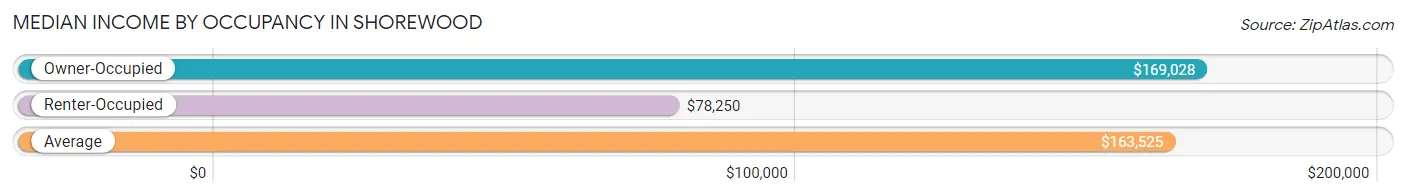
| Occupancy Type | # Households | Median Income |
| Owner-Occupied | 2,747 (93.9%) | $169,028 |
| Renter-Occupied | 179 (6.1%) | $78,250 |
| Average | 2,926 (100.0%) | $163,525 |
Occupancy by Householder Income Bracket in Shorewood
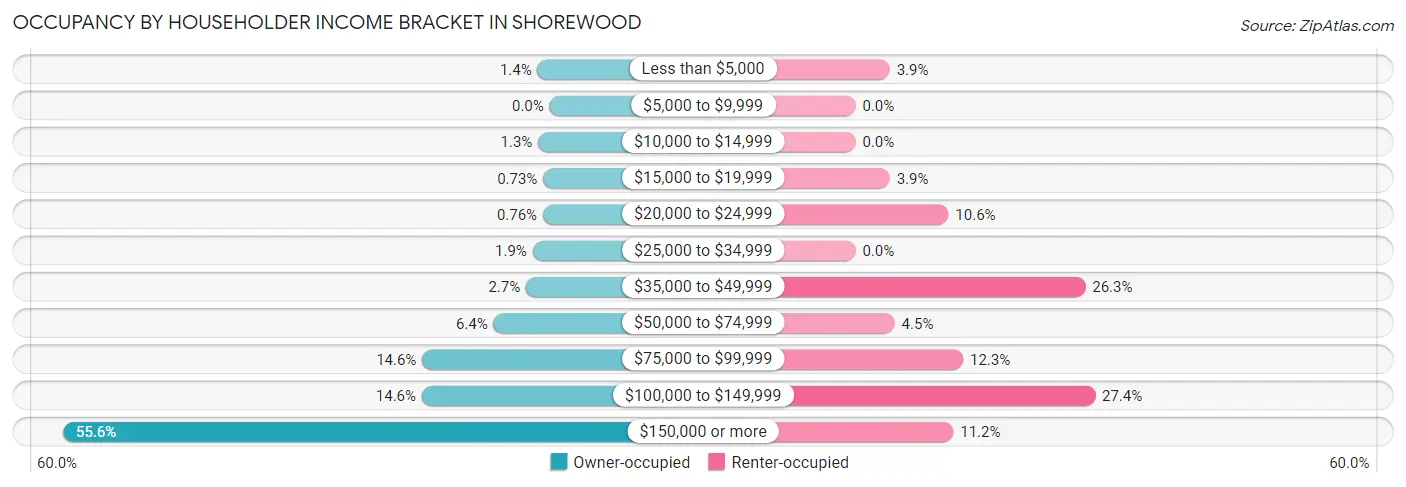
| Income Bracket | Owner-occupied | Renter-occupied |
| Less than $5,000 | 38 (1.4%) | 7 (3.9%) |
| $5,000 to $9,999 | 0 (0.0%) | 0 (0.0%) |
| $10,000 to $14,999 | 36 (1.3%) | 0 (0.0%) |
| $15,000 to $19,999 | 20 (0.7%) | 7 (3.9%) |
| $20,000 to $24,999 | 21 (0.8%) | 19 (10.6%) |
| $25,000 to $34,999 | 53 (1.9%) | 0 (0.0%) |
| $35,000 to $49,999 | 74 (2.7%) | 47 (26.3%) |
| $50,000 to $74,999 | 176 (6.4%) | 8 (4.5%) |
| $75,000 to $99,999 | 400 (14.6%) | 22 (12.3%) |
| $100,000 to $149,999 | 401 (14.6%) | 49 (27.4%) |
| $150,000 or more | 1,528 (55.6%) | 20 (11.2%) |
| Total | 2,747 (100.0%) | 179 (100.0%) |
Monthly Housing Cost Tiers in Shorewood
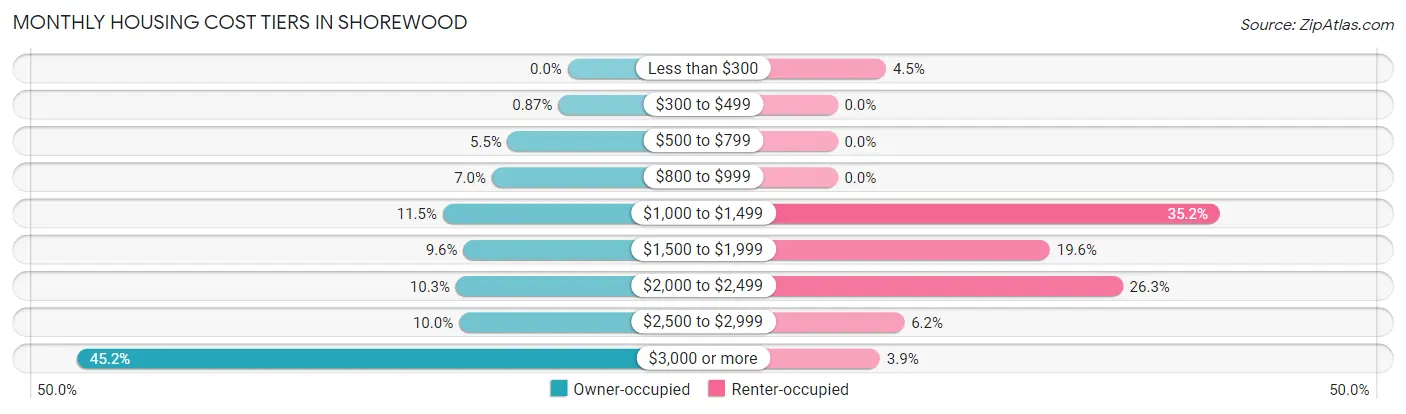
| Monthly Cost | Owner-occupied | Renter-occupied |
| Less than $300 | 0 (0.0%) | 8 (4.5%) |
| $300 to $499 | 24 (0.9%) | 0 (0.0%) |
| $500 to $799 | 152 (5.5%) | 0 (0.0%) |
| $800 to $999 | 192 (7.0%) | 0 (0.0%) |
| $1,000 to $1,499 | 316 (11.5%) | 63 (35.2%) |
| $1,500 to $1,999 | 264 (9.6%) | 35 (19.6%) |
| $2,000 to $2,499 | 283 (10.3%) | 47 (26.3%) |
| $2,500 to $2,999 | 275 (10.0%) | 11 (6.1%) |
| $3,000 or more | 1,241 (45.2%) | 7 (3.9%) |
| Total | 2,747 (100.0%) | 179 (100.0%) |
Physical Housing Characteristics in Shorewood
Housing Structures in Shorewood
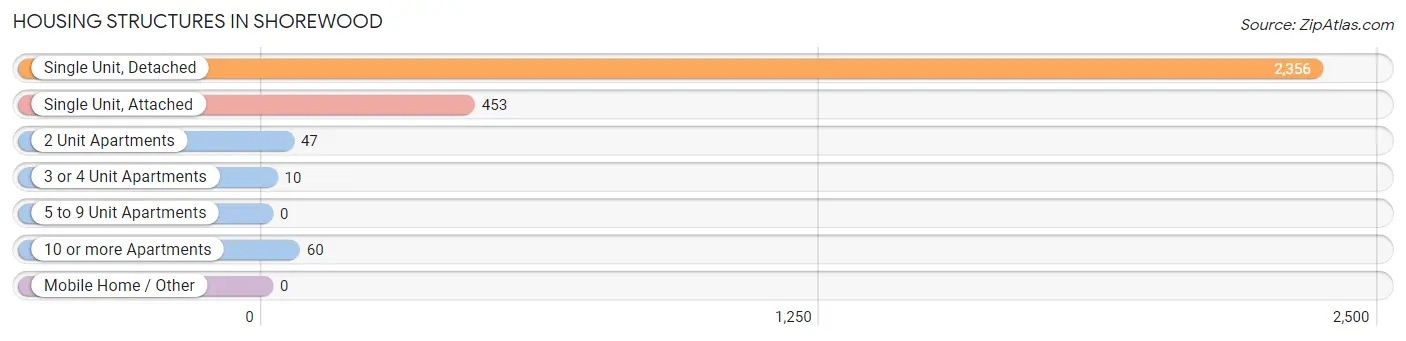
| Structure Type | # Housing Units | % Housing Units |
| Single Unit, Detached | 2,356 | 80.5% |
| Single Unit, Attached | 453 | 15.5% |
| 2 Unit Apartments | 47 | 1.6% |
| 3 or 4 Unit Apartments | 10 | 0.3% |
| 5 to 9 Unit Apartments | 0 | 0.0% |
| 10 or more Apartments | 60 | 2.1% |
| Mobile Home / Other | 0 | 0.0% |
| Total | 2,926 | 100.0% |
Housing Structures by Occupancy in Shorewood
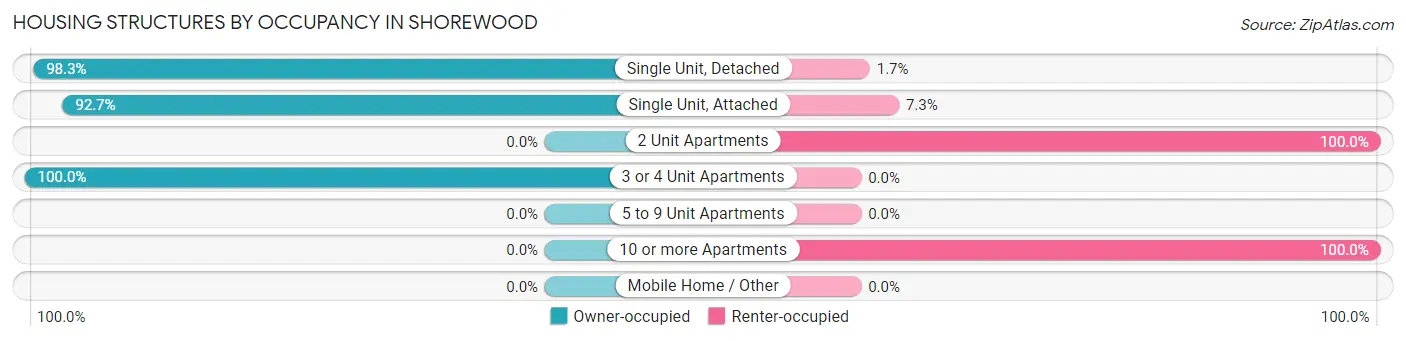
| Structure Type | Owner-occupied | Renter-occupied |
| Single Unit, Detached | 2,317 (98.3%) | 39 (1.7%) |
| Single Unit, Attached | 420 (92.7%) | 33 (7.3%) |
| 2 Unit Apartments | 0 (0.0%) | 47 (100.0%) |
| 3 or 4 Unit Apartments | 10 (100.0%) | 0 (0.0%) |
| 5 to 9 Unit Apartments | 0 (0.0%) | 0 (0.0%) |
| 10 or more Apartments | 0 (0.0%) | 60 (100.0%) |
| Mobile Home / Other | 0 (0.0%) | 0 (0.0%) |
| Total | 2,747 (93.9%) | 179 (6.1%) |
Housing Structures by Number of Rooms in Shorewood
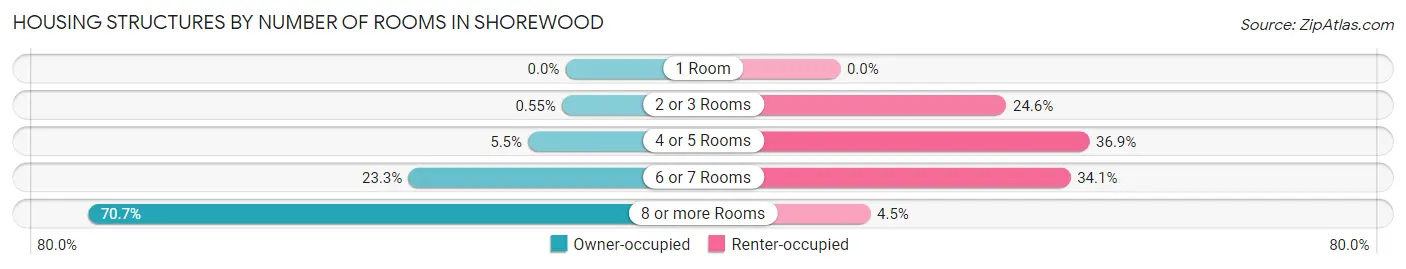
| Number of Rooms | Owner-occupied | Renter-occupied |
| 1 Room | 0 (0.0%) | 0 (0.0%) |
| 2 or 3 Rooms | 15 (0.5%) | 44 (24.6%) |
| 4 or 5 Rooms | 152 (5.5%) | 66 (36.9%) |
| 6 or 7 Rooms | 639 (23.3%) | 61 (34.1%) |
| 8 or more Rooms | 1,941 (70.7%) | 8 (4.5%) |
| Total | 2,747 (100.0%) | 179 (100.0%) |
Housing Structure by Heating Type in Shorewood
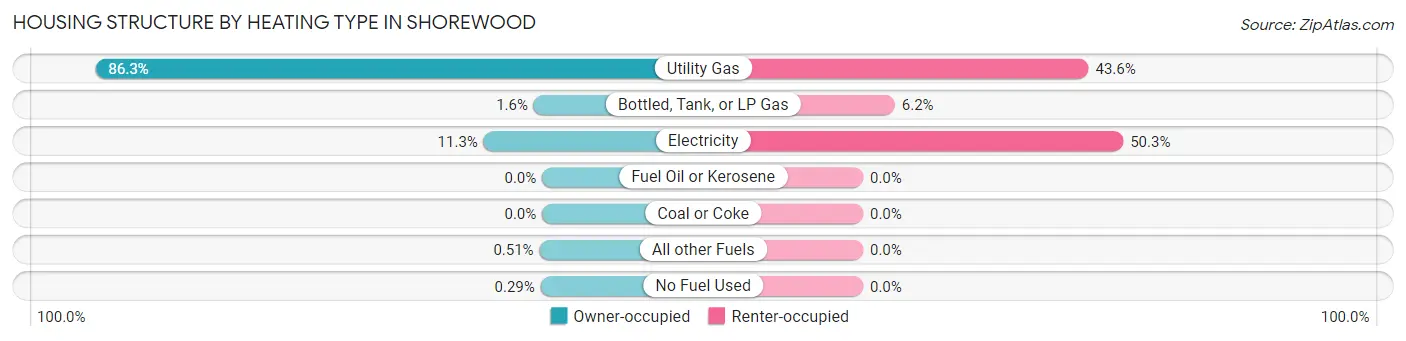
| Heating Type | Owner-occupied | Renter-occupied |
| Utility Gas | 2,371 (86.3%) | 78 (43.6%) |
| Bottled, Tank, or LP Gas | 44 (1.6%) | 11 (6.1%) |
| Electricity | 310 (11.3%) | 90 (50.3%) |
| Fuel Oil or Kerosene | 0 (0.0%) | 0 (0.0%) |
| Coal or Coke | 0 (0.0%) | 0 (0.0%) |
| All other Fuels | 14 (0.5%) | 0 (0.0%) |
| No Fuel Used | 8 (0.3%) | 0 (0.0%) |
| Total | 2,747 (100.0%) | 179 (100.0%) |
Household Vehicle Usage in Shorewood
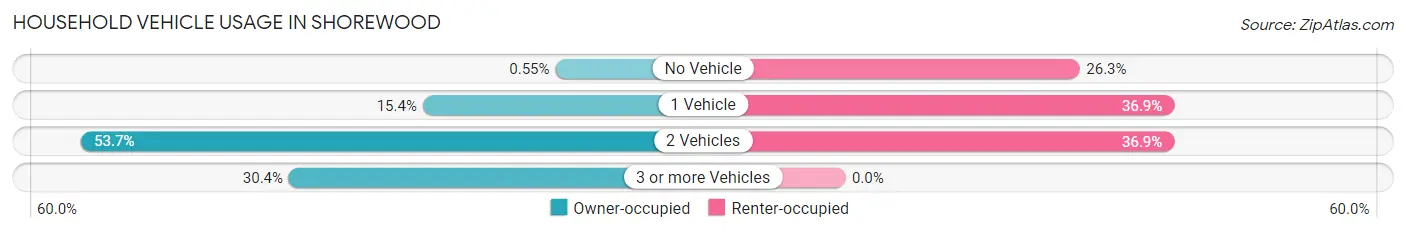
| Vehicles per Household | Owner-occupied | Renter-occupied |
| No Vehicle | 15 (0.5%) | 47 (26.3%) |
| 1 Vehicle | 423 (15.4%) | 66 (36.9%) |
| 2 Vehicles | 1,474 (53.7%) | 66 (36.9%) |
| 3 or more Vehicles | 835 (30.4%) | 0 (0.0%) |
| Total | 2,747 (100.0%) | 179 (100.0%) |
Real Estate & Mortgages in Shorewood
Real Estate and Mortgage Overview in Shorewood
| Characteristic | Without Mortgage | With Mortgage |
| Housing Units | 762 | 1,985 |
| Median Property Value | $623,300 | $649,600 |
| Median Household Income | $123,375 | $1,221 |
| Monthly Housing Costs | $1,090 | $1,194 |
| Real Estate Taxes | $7,079 | $13 |
Property Value by Mortgage Status in Shorewood
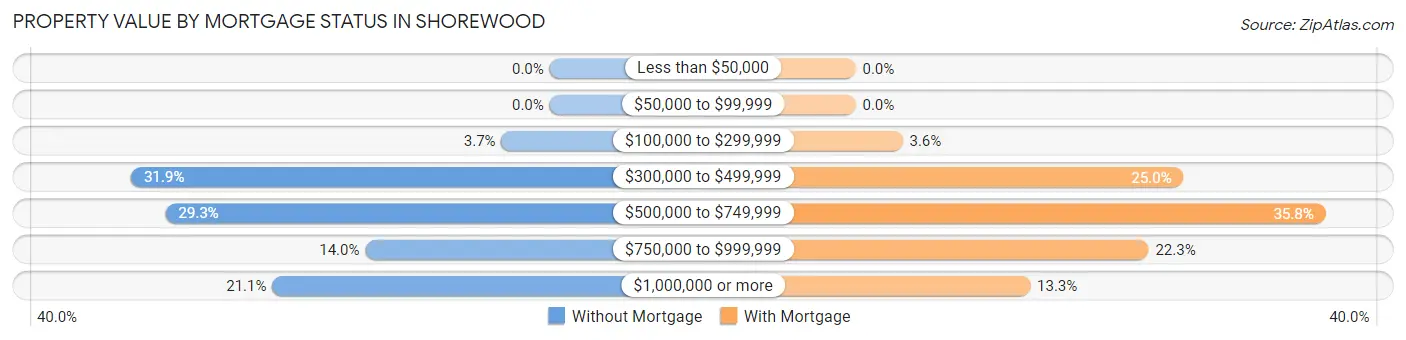
| Property Value | Without Mortgage | With Mortgage |
| Less than $50,000 | 0 (0.0%) | 0 (0.0%) |
| $50,000 to $99,999 | 0 (0.0%) | 0 (0.0%) |
| $100,000 to $299,999 | 28 (3.7%) | 71 (3.6%) |
| $300,000 to $499,999 | 243 (31.9%) | 496 (25.0%) |
| $500,000 to $749,999 | 223 (29.3%) | 711 (35.8%) |
| $750,000 to $999,999 | 107 (14.0%) | 443 (22.3%) |
| $1,000,000 or more | 161 (21.1%) | 264 (13.3%) |
| Total | 762 (100.0%) | 1,985 (100.0%) |
Household Income by Mortgage Status in Shorewood
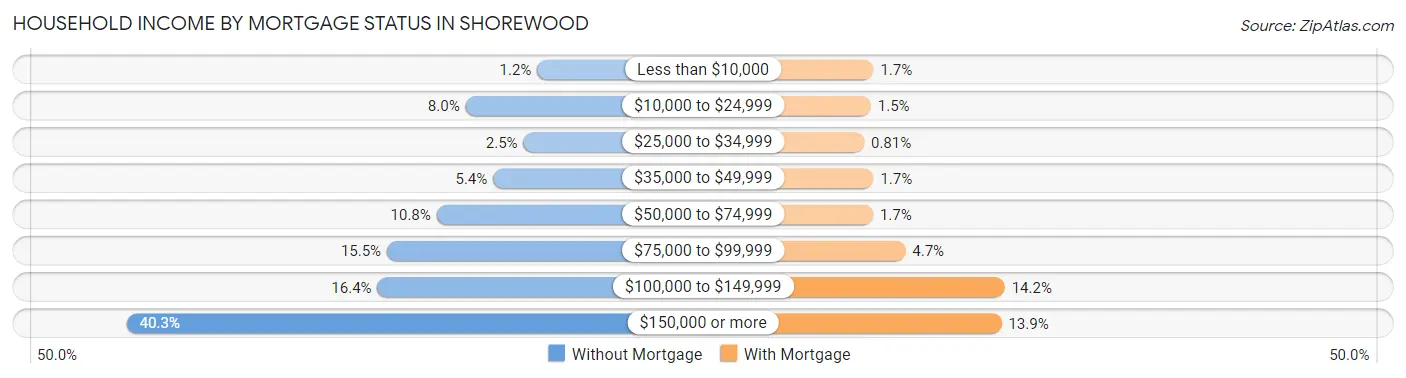
| Household Income | Without Mortgage | With Mortgage |
| Less than $10,000 | 9 (1.2%) | 34 (1.7%) |
| $10,000 to $24,999 | 61 (8.0%) | 29 (1.5%) |
| $25,000 to $34,999 | 19 (2.5%) | 16 (0.8%) |
| $35,000 to $49,999 | 41 (5.4%) | 34 (1.7%) |
| $50,000 to $74,999 | 82 (10.8%) | 33 (1.7%) |
| $75,000 to $99,999 | 118 (15.5%) | 94 (4.7%) |
| $100,000 to $149,999 | 125 (16.4%) | 282 (14.2%) |
| $150,000 or more | 307 (40.3%) | 276 (13.9%) |
| Total | 762 (100.0%) | 1,985 (100.0%) |
Property Value to Household Income Ratio in Shorewood
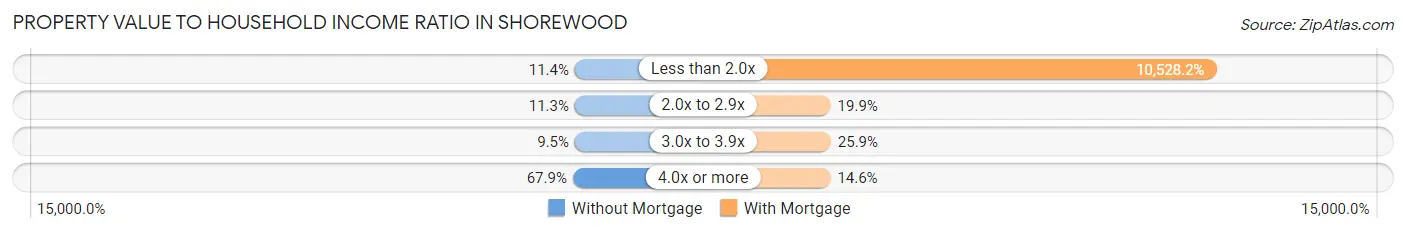
| Value-to-Income Ratio | Without Mortgage | With Mortgage |
| Less than 2.0x | 87 (11.4%) | 208,984 (10,528.2%) |
| 2.0x to 2.9x | 86 (11.3%) | 395 (19.9%) |
| 3.0x to 3.9x | 72 (9.5%) | 514 (25.9%) |
| 4.0x or more | 517 (67.8%) | 290 (14.6%) |
| Total | 762 (100.0%) | 1,985 (100.0%) |
Real Estate Taxes by Mortgage Status in Shorewood
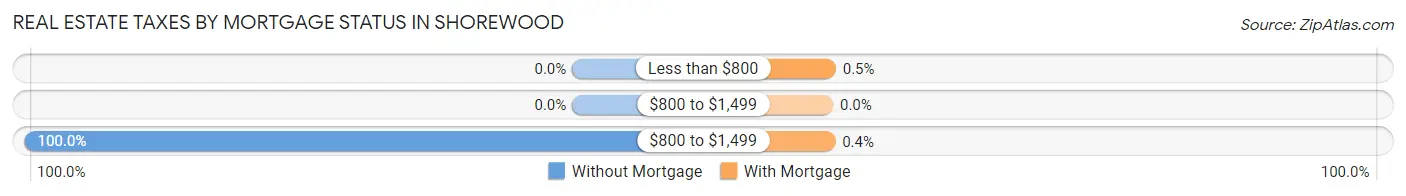
| Property Taxes | Without Mortgage | With Mortgage |
| Less than $800 | 0 (0.0%) | 10 (0.5%) |
| $800 to $1,499 | 0 (0.0%) | 0 (0.0%) |
| $800 to $1,499 | 762 (100.0%) | 8 (0.4%) |
| Total | 762 (100.0%) | 1,985 (100.0%) |
Health & Disability in Shorewood
Health Insurance Coverage by Age in Shorewood
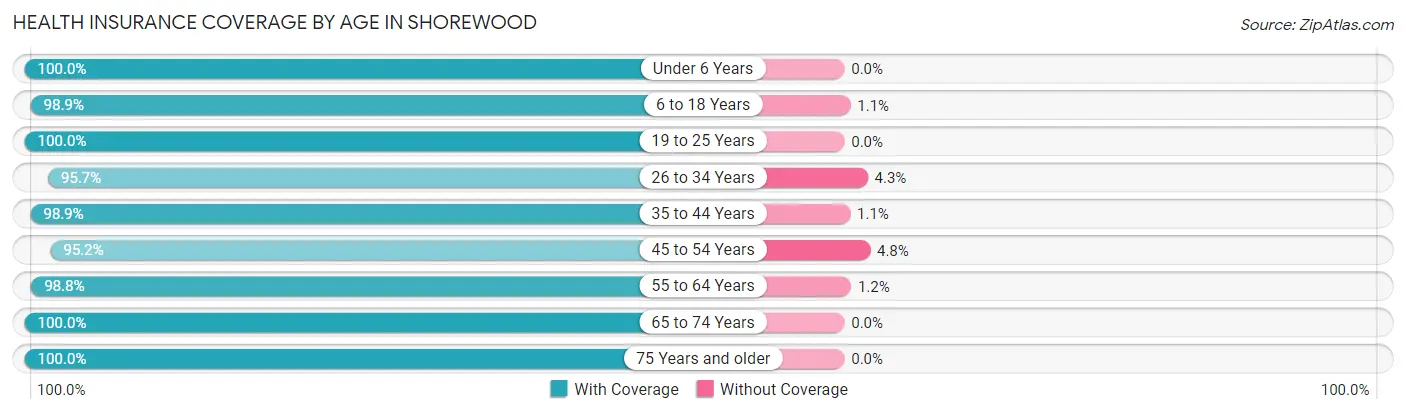
| Age Bracket | With Coverage | Without Coverage |
| Under 6 Years | 494 (100.0%) | 0 (0.0%) |
| 6 to 18 Years | 1,494 (98.9%) | 17 (1.1%) |
| 19 to 25 Years | 287 (100.0%) | 0 (0.0%) |
| 26 to 34 Years | 353 (95.7%) | 16 (4.3%) |
| 35 to 44 Years | 828 (98.9%) | 9 (1.1%) |
| 45 to 54 Years | 1,091 (95.2%) | 55 (4.8%) |
| 55 to 64 Years | 1,598 (98.8%) | 20 (1.2%) |
| 65 to 74 Years | 893 (100.0%) | 0 (0.0%) |
| 75 Years and older | 567 (100.0%) | 0 (0.0%) |
| Total | 7,605 (98.5%) | 117 (1.5%) |
Health Insurance Coverage by Citizenship Status in Shorewood
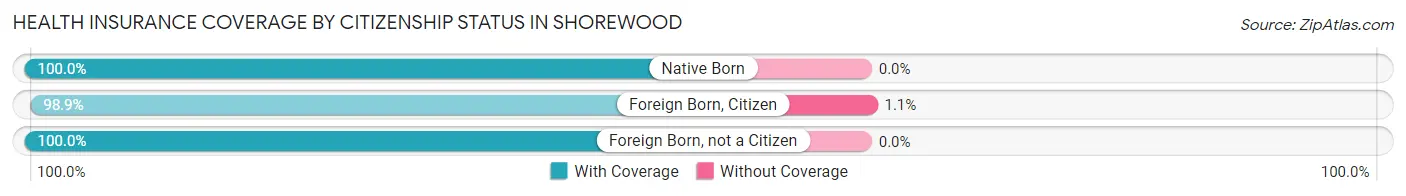
| Citizenship Status | With Coverage | Without Coverage |
| Native Born | 494 (100.0%) | 0 (0.0%) |
| Foreign Born, Citizen | 1,494 (98.9%) | 17 (1.1%) |
| Foreign Born, not a Citizen | 287 (100.0%) | 0 (0.0%) |
Health Insurance Coverage by Household Income in Shorewood
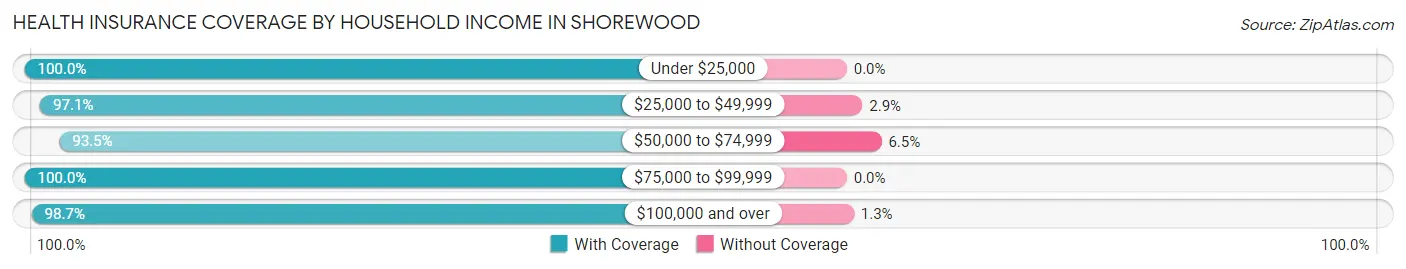
| Household Income | With Coverage | Without Coverage |
| Under $25,000 | 258 (100.0%) | 0 (0.0%) |
| $25,000 to $49,999 | 332 (97.1%) | 10 (2.9%) |
| $50,000 to $74,999 | 374 (93.5%) | 26 (6.5%) |
| $75,000 to $99,999 | 669 (100.0%) | 0 (0.0%) |
| $100,000 and over | 5,963 (98.7%) | 80 (1.3%) |
Public vs Private Health Insurance Coverage by Age in Shorewood
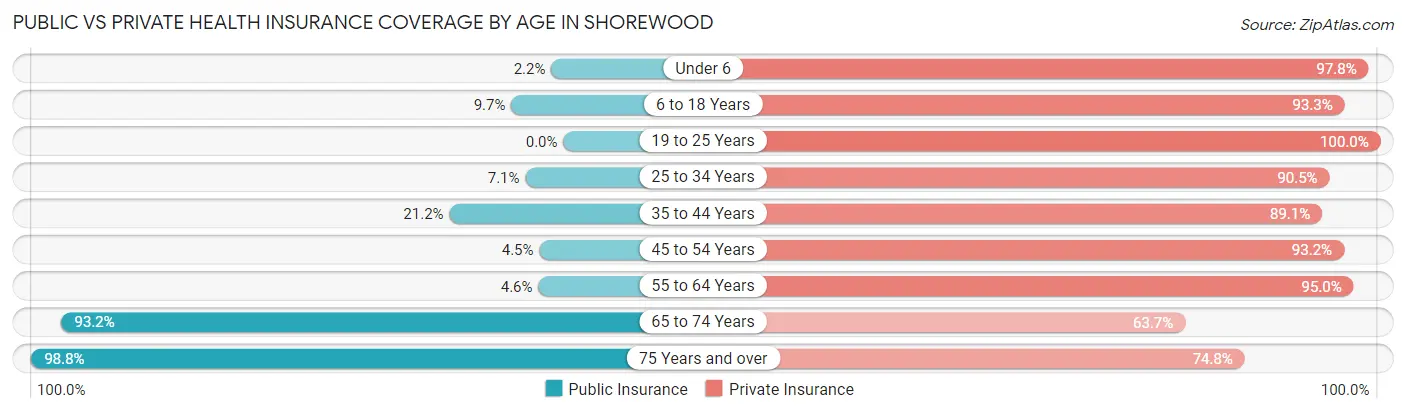
| Age Bracket | Public Insurance | Private Insurance |
| Under 6 | 11 (2.2%) | 483 (97.8%) |
| 6 to 18 Years | 146 (9.7%) | 1,410 (93.3%) |
| 19 to 25 Years | 0 (0.0%) | 287 (100.0%) |
| 25 to 34 Years | 26 (7.0%) | 334 (90.5%) |
| 35 to 44 Years | 177 (21.1%) | 746 (89.1%) |
| 45 to 54 Years | 51 (4.4%) | 1,068 (93.2%) |
| 55 to 64 Years | 75 (4.6%) | 1,537 (95.0%) |
| 65 to 74 Years | 832 (93.2%) | 569 (63.7%) |
| 75 Years and over | 560 (98.8%) | 424 (74.8%) |
| Total | 1,878 (24.3%) | 6,858 (88.8%) |
Disability Status by Sex by Age in Shorewood
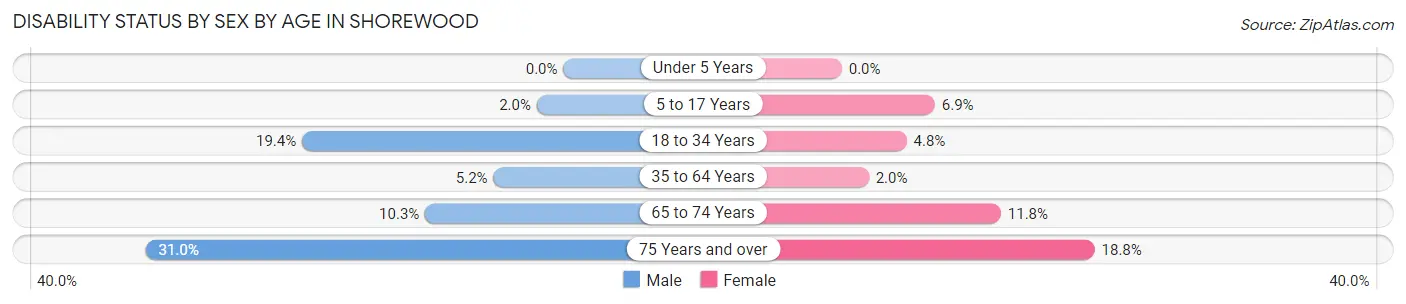
| Age Bracket | Male | Female |
| Under 5 Years | 0 (0.0%) | 0 (0.0%) |
| 5 to 17 Years | 18 (2.0%) | 45 (6.9%) |
| 18 to 34 Years | 65 (19.4%) | 18 (4.8%) |
| 35 to 64 Years | 96 (5.2%) | 35 (2.0%) |
| 65 to 74 Years | 43 (10.3%) | 56 (11.8%) |
| 75 Years and over | 85 (31.0%) | 55 (18.8%) |
Disability Class by Sex by Age in Shorewood
Disability Class: Hearing Difficulty
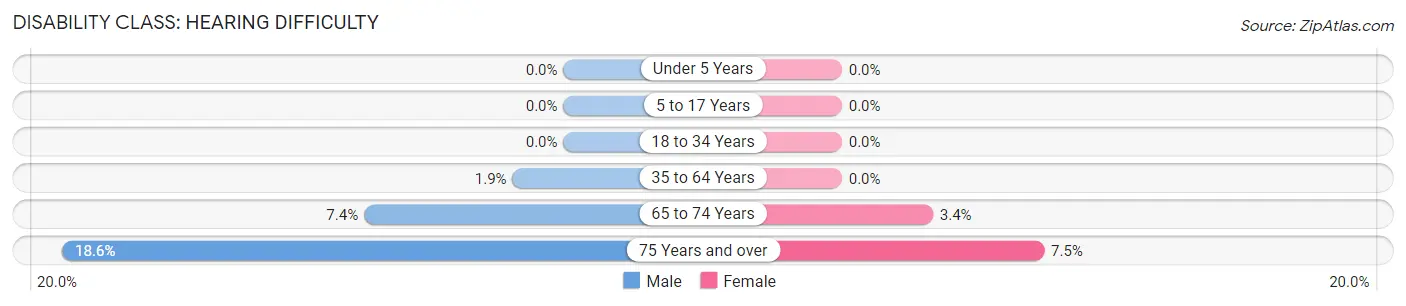
| Age Bracket | Male | Female |
| Under 5 Years | 0 (0.0%) | 0 (0.0%) |
| 5 to 17 Years | 0 (0.0%) | 0 (0.0%) |
| 18 to 34 Years | 0 (0.0%) | 0 (0.0%) |
| 35 to 64 Years | 35 (1.9%) | 0 (0.0%) |
| 65 to 74 Years | 31 (7.4%) | 16 (3.4%) |
| 75 Years and over | 51 (18.6%) | 22 (7.5%) |
Disability Class: Vision Difficulty
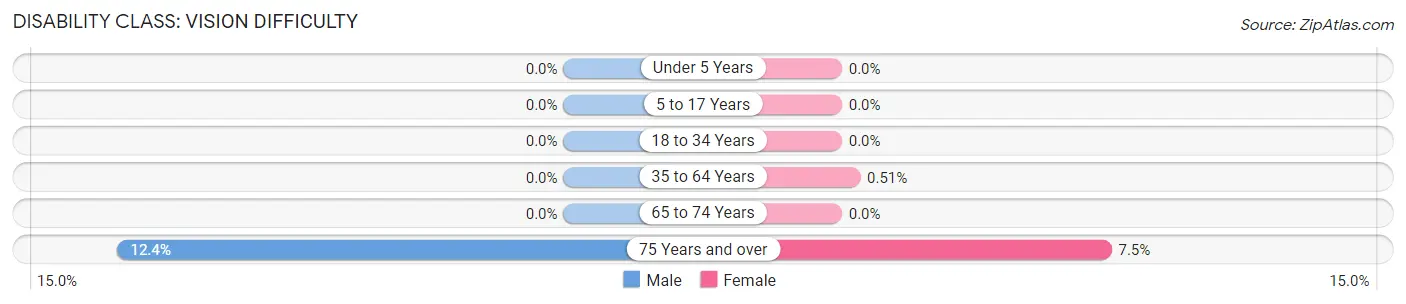
| Age Bracket | Male | Female |
| Under 5 Years | 0 (0.0%) | 0 (0.0%) |
| 5 to 17 Years | 0 (0.0%) | 0 (0.0%) |
| 18 to 34 Years | 0 (0.0%) | 0 (0.0%) |
| 35 to 64 Years | 0 (0.0%) | 9 (0.5%) |
| 65 to 74 Years | 0 (0.0%) | 0 (0.0%) |
| 75 Years and over | 34 (12.4%) | 22 (7.5%) |
Disability Class: Cognitive Difficulty
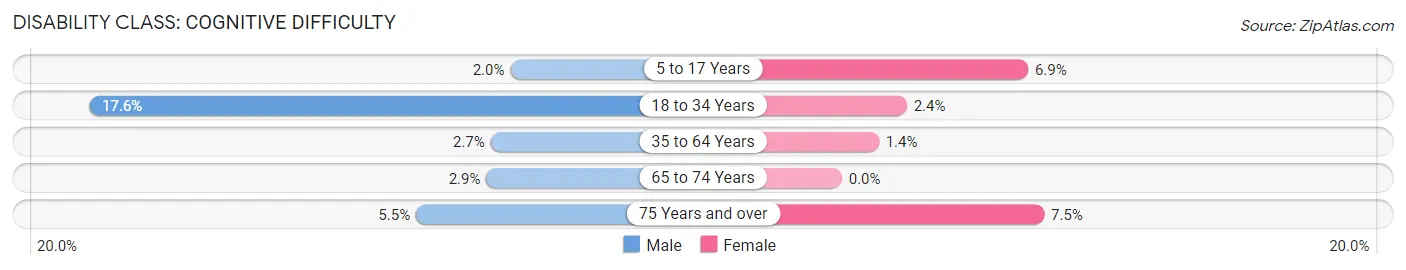
| Age Bracket | Male | Female |
| 5 to 17 Years | 18 (2.0%) | 45 (6.9%) |
| 18 to 34 Years | 59 (17.6%) | 9 (2.4%) |
| 35 to 64 Years | 50 (2.7%) | 24 (1.4%) |
| 65 to 74 Years | 12 (2.9%) | 0 (0.0%) |
| 75 Years and over | 15 (5.5%) | 22 (7.5%) |
Disability Class: Ambulatory Difficulty
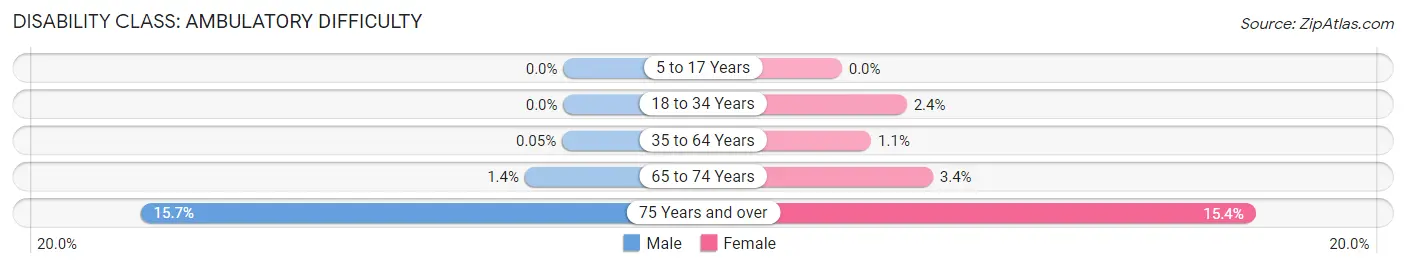
| Age Bracket | Male | Female |
| 5 to 17 Years | 0 (0.0%) | 0 (0.0%) |
| 18 to 34 Years | 0 (0.0%) | 9 (2.4%) |
| 35 to 64 Years | 1 (0.1%) | 19 (1.1%) |
| 65 to 74 Years | 6 (1.4%) | 16 (3.4%) |
| 75 Years and over | 43 (15.7%) | 45 (15.4%) |
Disability Class: Self-Care Difficulty
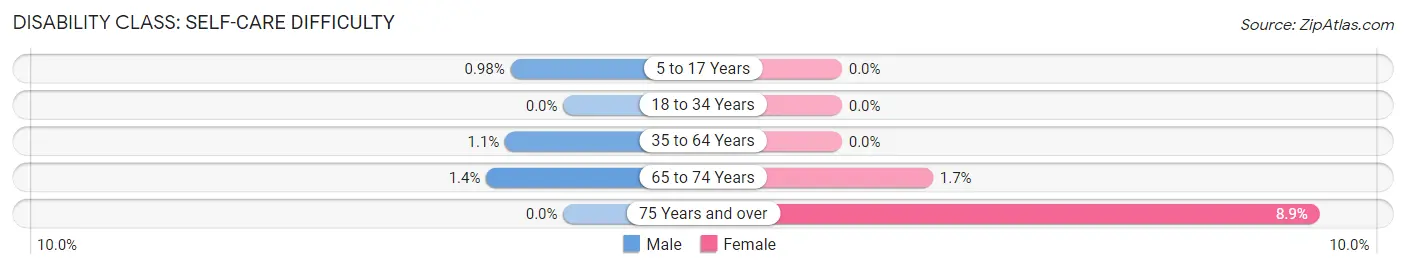
| Age Bracket | Male | Female |
| 5 to 17 Years | 9 (1.0%) | 0 (0.0%) |
| 18 to 34 Years | 0 (0.0%) | 0 (0.0%) |
| 35 to 64 Years | 20 (1.1%) | 0 (0.0%) |
| 65 to 74 Years | 6 (1.4%) | 8 (1.7%) |
| 75 Years and over | 0 (0.0%) | 26 (8.9%) |
Technology Access in Shorewood
Computing Device Access in Shorewood
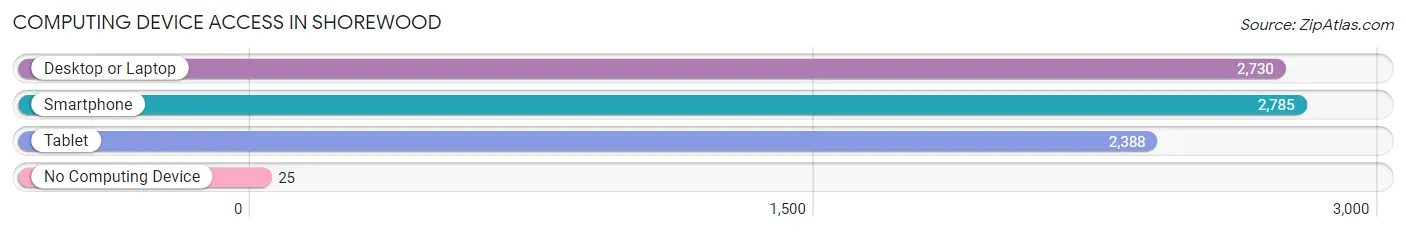
| Device Type | # Households | % Households |
| Desktop or Laptop | 2,730 | 93.3% |
| Smartphone | 2,785 | 95.2% |
| Tablet | 2,388 | 81.6% |
| No Computing Device | 25 | 0.9% |
| Total | 2,926 | 100.0% |
Internet Access in Shorewood
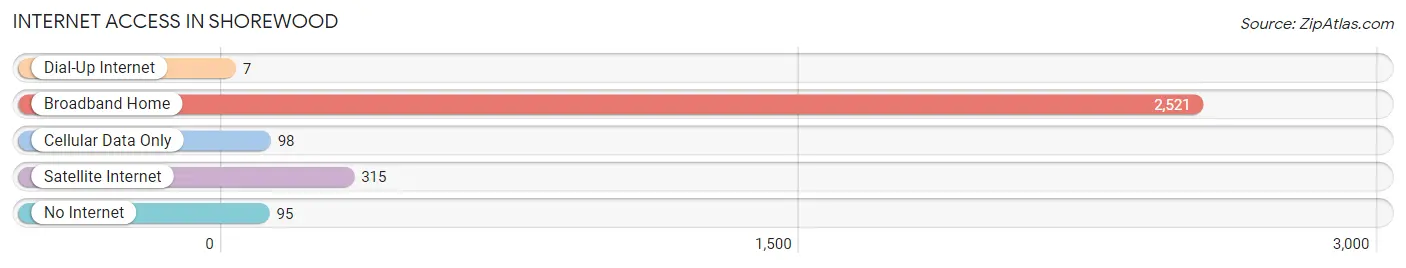
| Internet Type | # Households | % Households |
| Dial-Up Internet | 7 | 0.2% |
| Broadband Home | 2,521 | 86.2% |
| Cellular Data Only | 98 | 3.4% |
| Satellite Internet | 315 | 10.8% |
| No Internet | 95 | 3.3% |
| Total | 2,926 | 100.0% |
Shorewood Summary
Shorewood is a small city located in Hennepin County, Minnesota. It is situated on the western shore of Lake Minnetonka, about 20 miles west of Minneapolis. The city has a population of about 5,000 people and covers an area of 2.2 square miles.
History
Shorewood was first settled in the late 1800s by a group of German immigrants. The city was originally known as “Germania” and was later renamed “Shorewood” in 1887. The city was incorporated in 1906 and has since grown to become a popular suburb of Minneapolis.
Geography
Shorewood is located in the western part of Hennepin County, Minnesota. It is situated on the western shore of Lake Minnetonka, about 20 miles west of Minneapolis. The city has a total area of 2.2 square miles, all of which is land. The terrain is mostly flat with some rolling hills. The city is bordered by the cities of Deephaven, Excelsior, Greenwood, and Tonka Bay.
Economy
Shorewood’s economy is largely based on tourism and retail. The city is home to several popular restaurants, shops, and attractions, including the Shorewood Beach Club, the Shorewood Golf Course, and the Shorewood Yacht Club. The city also has a number of corporate offices, including those of Target Corporation, Cargill, and General Mills.
Demographics
As of the 2010 census, Shorewood had a population of 5,037 people. The racial makeup of the city was 94.2% White, 1.2% African American, 0.3% Native American, 1.7% Asian, 0.1% Pacific Islander, 1.2% from other races, and 1.4% from two or more races. Hispanic or Latino of any race were 3.2% of the population.
The median income for a household in Shorewood was $76,944, and the median income for a family was $90,917. The per capita income for the city was $41,945. About 3.2% of families and 4.7% of the population were below the poverty line, including 5.2% of those under age 18 and 4.2% of those age 65 or over.
Shorewood is a small city with a rich history and a vibrant economy. It is home to a diverse population and offers a variety of attractions and amenities. The city is a popular destination for tourists and residents alike, and is a great place to live, work, and play.
Common Questions
What is Per Capita Income in Shorewood?
Per Capita income in Shorewood is $83,841.
What is the Median Family Income in Shorewood?
Median Family Income in Shorewood is $201,250.
What is the Median Household income in Shorewood?
Median Household Income in Shorewood is $163,525.
What is Income or Wage Gap in Shorewood?
Income or Wage Gap in Shorewood is 47.1%.
Women in Shorewood earn 52.9 cents for every dollar earned by a man.
What is Family Income Deficit in Shorewood?
Family Income Deficit in Shorewood is $11,306.
Families that are below poverty line in Shorewood earn $11,306 less on average than the poverty threshold level.
What is Inequality or Gini Index in Shorewood?
Inequality or Gini Index in Shorewood is 0.45.
What is the Total Population of Shorewood?
Total Population of Shorewood is 7,722.
What is the Total Male Population of Shorewood?
Total Male Population of Shorewood is 3,962.
What is the Total Female Population of Shorewood?
Total Female Population of Shorewood is 3,760.
What is the Ratio of Males per 100 Females in Shorewood?
There are 105.37 Males per 100 Females in Shorewood.
What is the Ratio of Females per 100 Males in Shorewood?
There are 94.90 Females per 100 Males in Shorewood.
What is the Median Population Age in Shorewood?
Median Population Age in Shorewood is 48.0 Years.
What is the Average Family Size in Shorewood
Average Family Size in Shorewood is 3.0 People.
What is the Average Household Size in Shorewood
Average Household Size in Shorewood is 2.6 People.
How Large is the Labor Force in Shorewood?
There are 3,987 People in the Labor Forcein in Shorewood.
What is the Percentage of People in the Labor Force in Shorewood?
65.8% of People are in the Labor Force in Shorewood.
What is the Unemployment Rate in Shorewood?
Unemployment Rate in Shorewood is 5.1%.