St Augusta, MN Map & Demographics
St Augusta Map
St Augusta Overview
$51,604
PER CAPITA INCOME
$131,000
AVG FAMILY INCOME
$120,526
AVG HOUSEHOLD INCOME
22.1%
WAGE / INCOME GAP [ % ]
77.9¢/ $1
WAGE / INCOME GAP [ $ ]
0.39
INEQUALITY / GINI INDEX
3,520
TOTAL POPULATION
1,916
MALE POPULATION
1,604
FEMALE POPULATION
119.45
MALES / 100 FEMALES
83.72
FEMALES / 100 MALES
35.8
MEDIAN AGE
3.4
AVG FAMILY SIZE
3.1
AVG HOUSEHOLD SIZE
1,987
LABOR FORCE [ PEOPLE ]
75.5%
PERCENT IN LABOR FORCE
3.6%
UNEMPLOYMENT RATE
Income in St Augusta
Income Overview in St Augusta
Per Capita Income in St Augusta is $51,604, while median incomes of families and households are $131,000 and $120,526 respectively.
| Characteristic | Number | Measure |
| Per Capita Income | 3,520 | $51,604 |
| Median Family Income | 920 | $131,000 |
| Mean Family Income | 920 | $171,626 |
| Median Household Income | 1,116 | $120,526 |
| Mean Household Income | 1,116 | $160,705 |
| Income Deficit | 920 | $0 |
| Wage / Income Gap (%) | 3,520 | 22.15% |
| Wage / Income Gap ($) | 3,520 | 77.85¢ per $1 |
| Gini / Inequality Index | 3,520 | 0.39 |
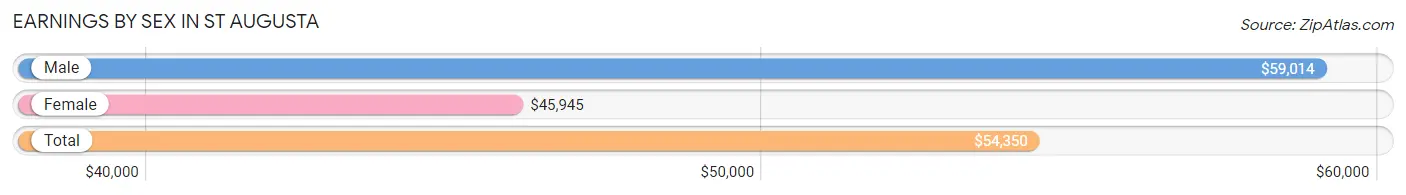
Earnings by Sex in St Augusta
Average Earnings in St Augusta are $54,350, $59,014 for men and $45,945 for women, a difference of 22.2%.
| Sex | Number | Average Earnings |
| Male | 1,197 (58.2%) | $59,014 |
| Female | 859 (41.8%) | $45,945 |
| Total | 2,056 (100.0%) | $54,350 |
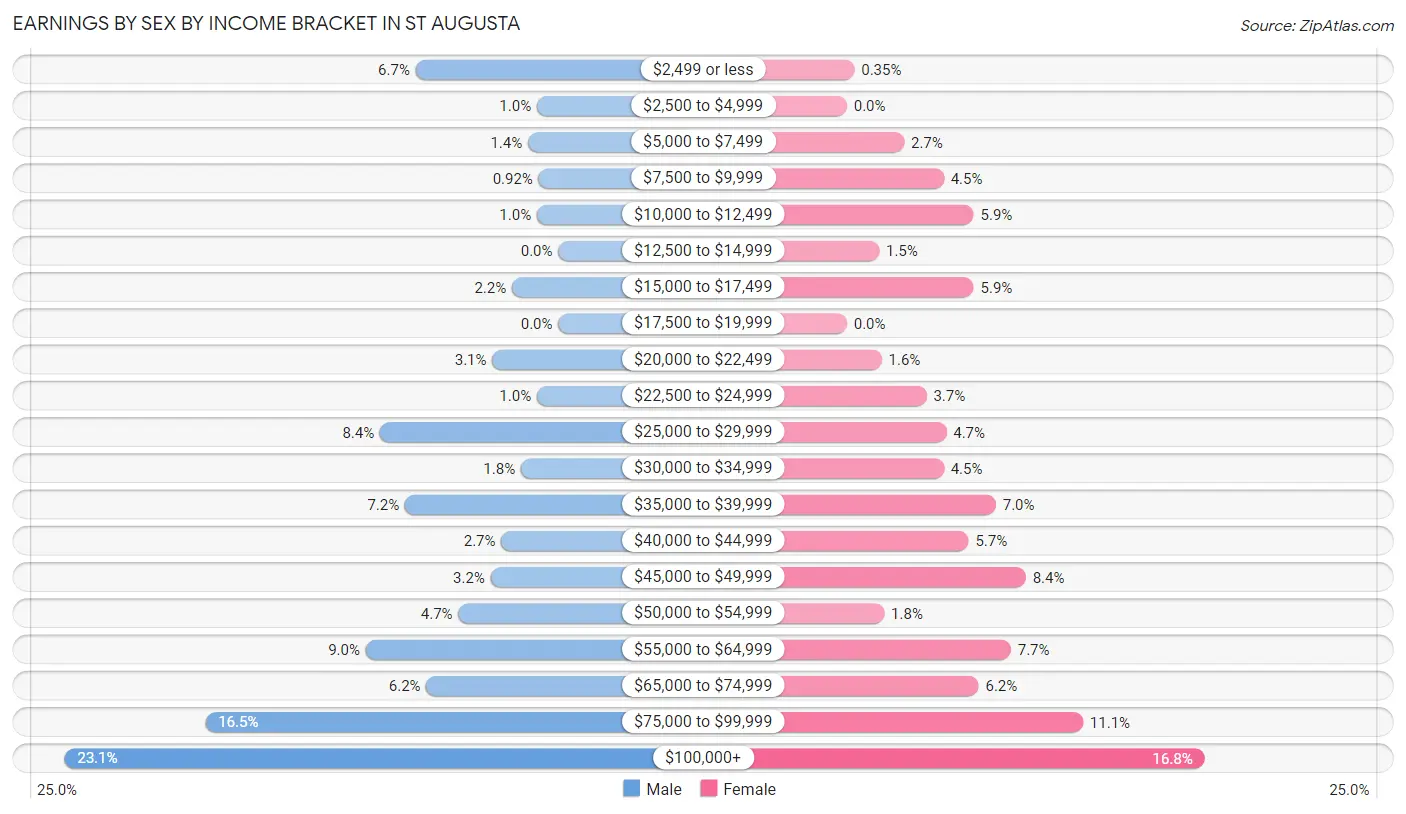
Earnings by Sex by Income Bracket in St Augusta
The most common earnings brackets in St Augusta are $100,000+ for men (277 | 23.1%) and $100,000+ for women (144 | 16.8%).
| Income | Male | Female |
| $2,499 or less | 80 (6.7%) | 3 (0.4%) |
| $2,500 to $4,999 | 12 (1.0%) | 0 (0.0%) |
| $5,000 to $7,499 | 17 (1.4%) | 23 (2.7%) |
| $7,500 to $9,999 | 11 (0.9%) | 39 (4.5%) |
| $10,000 to $12,499 | 12 (1.0%) | 51 (5.9%) |
| $12,500 to $14,999 | 0 (0.0%) | 13 (1.5%) |
| $15,000 to $17,499 | 26 (2.2%) | 51 (5.9%) |
| $17,500 to $19,999 | 0 (0.0%) | 0 (0.0%) |
| $20,000 to $22,499 | 37 (3.1%) | 14 (1.6%) |
| $22,500 to $24,999 | 12 (1.0%) | 32 (3.7%) |
| $25,000 to $29,999 | 100 (8.4%) | 40 (4.7%) |
| $30,000 to $34,999 | 21 (1.8%) | 39 (4.5%) |
| $35,000 to $39,999 | 86 (7.2%) | 60 (7.0%) |
| $40,000 to $44,999 | 32 (2.7%) | 49 (5.7%) |
| $45,000 to $49,999 | 38 (3.2%) | 72 (8.4%) |
| $50,000 to $54,999 | 56 (4.7%) | 15 (1.8%) |
| $55,000 to $64,999 | 108 (9.0%) | 66 (7.7%) |
| $65,000 to $74,999 | 74 (6.2%) | 53 (6.2%) |
| $75,000 to $99,999 | 198 (16.5%) | 95 (11.1%) |
| $100,000+ | 277 (23.1%) | 144 (16.8%) |
| Total | 1,197 (100.0%) | 859 (100.0%) |
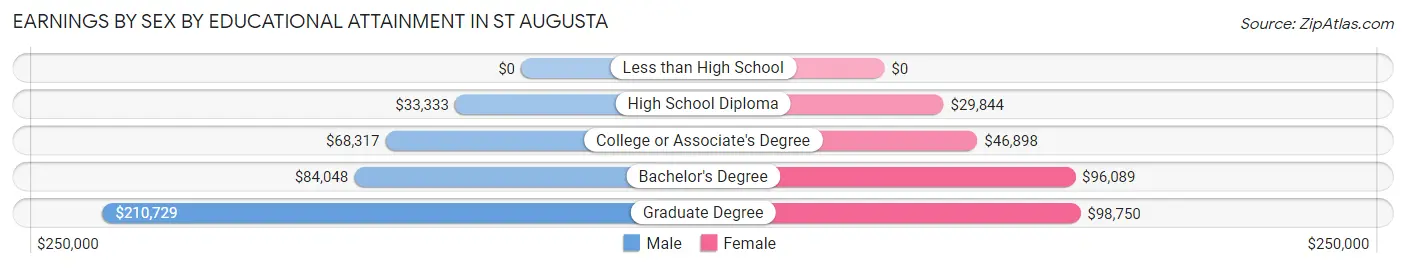
Earnings by Sex by Educational Attainment in St Augusta
Average earnings in St Augusta are $69,132 for men and $49,032 for women, a difference of 29.1%. Men with an educational attainment of graduate degree enjoy the highest average annual earnings of $210,729, while those with high school diploma education earn the least with $33,333. Women with an educational attainment of graduate degree earn the most with the average annual earnings of $98,750, while those with high school diploma education have the smallest earnings of $29,844.
| Educational Attainment | Male Income | Female Income |
| Less than High School | - | - |
| High School Diploma | $33,333 | $29,844 |
| College or Associate's Degree | $68,317 | $46,898 |
| Bachelor's Degree | $84,048 | $96,089 |
| Graduate Degree | $210,729 | $98,750 |
| Total | $69,132 | $49,032 |
Family Income in St Augusta
Family Income Brackets in St Augusta
According to the St Augusta family income data, there are 271 families falling into the $200,000+ income range, which is the most common income bracket and makes up 29.5% of all families.
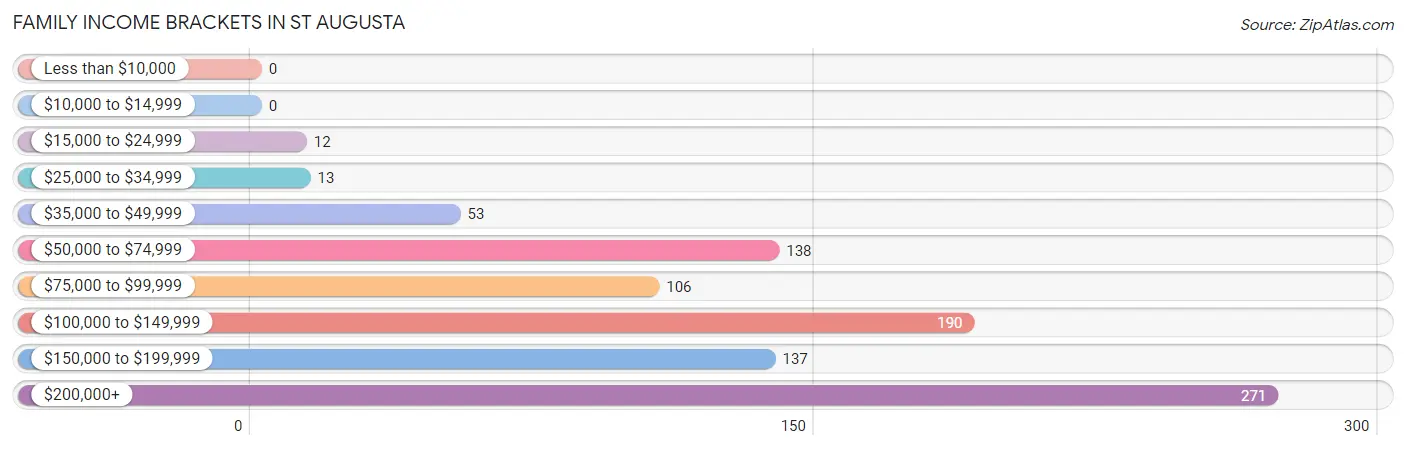
| Income Bracket | # Families | % Families |
| Less than $10,000 | 0 | 0.0% |
| $10,000 to $14,999 | 0 | 0.0% |
| $15,000 to $24,999 | 12 | 1.3% |
| $25,000 to $34,999 | 13 | 1.4% |
| $35,000 to $49,999 | 53 | 5.8% |
| $50,000 to $74,999 | 138 | 15.0% |
| $75,000 to $99,999 | 106 | 11.5% |
| $100,000 to $149,999 | 190 | 20.7% |
| $150,000 to $199,999 | 137 | 14.9% |
| $200,000+ | 271 | 29.5% |
Family Income by Famaliy Size in St Augusta
5-person families (103 | 11.2%) account for the highest median family income in St Augusta with $206,917 per family, while 2-person families (376 | 40.9%) have the highest median income of $46,719 per family member.
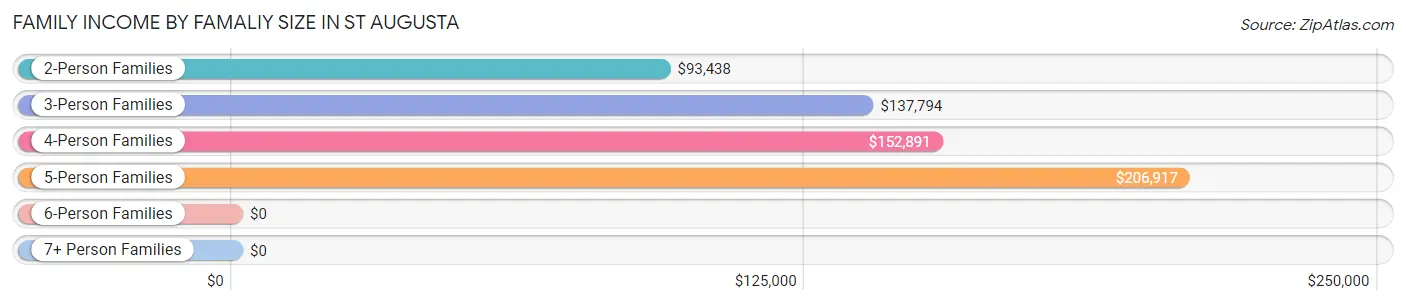
| Income Bracket | # Families | Median Income |
| 2-Person Families | 376 (40.9%) | $93,438 |
| 3-Person Families | 116 (12.6%) | $137,794 |
| 4-Person Families | 281 (30.5%) | $152,891 |
| 5-Person Families | 103 (11.2%) | $206,917 |
| 6-Person Families | 44 (4.8%) | $0 |
| 7+ Person Families | 0 (0.0%) | $0 |
| Total | 920 (100.0%) | $131,000 |
Family Income by Number of Earners in St Augusta
The median family income in St Augusta is $131,000, with families comprising 2 earners (582) having the highest median family income of $157,115, while families with no earners (61) have the lowest median family income of $49,464, accounting for 63.3% and 6.6% of families, respectively.
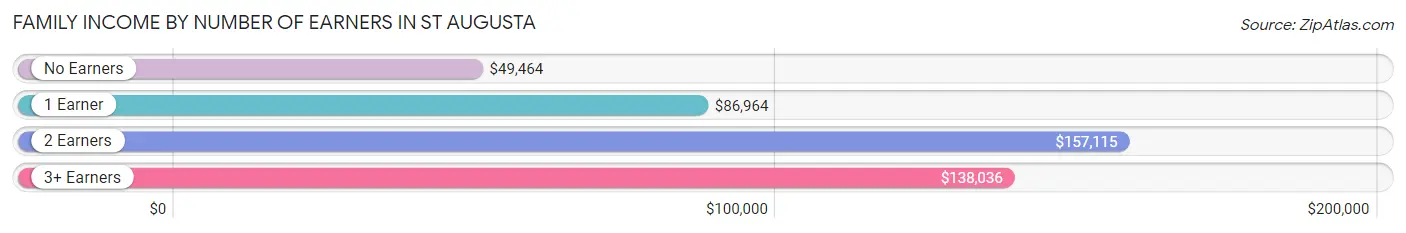
| Number of Earners | # Families | Median Income |
| No Earners | 61 (6.6%) | $49,464 |
| 1 Earner | 187 (20.3%) | $86,964 |
| 2 Earners | 582 (63.3%) | $157,115 |
| 3+ Earners | 90 (9.8%) | $138,036 |
| Total | 920 (100.0%) | $131,000 |
Household Income in St Augusta
Household Income Brackets in St Augusta
With 290 households falling in the category, the $200,000+ income range is the most frequent in St Augusta, accounting for 26.0% of all households.
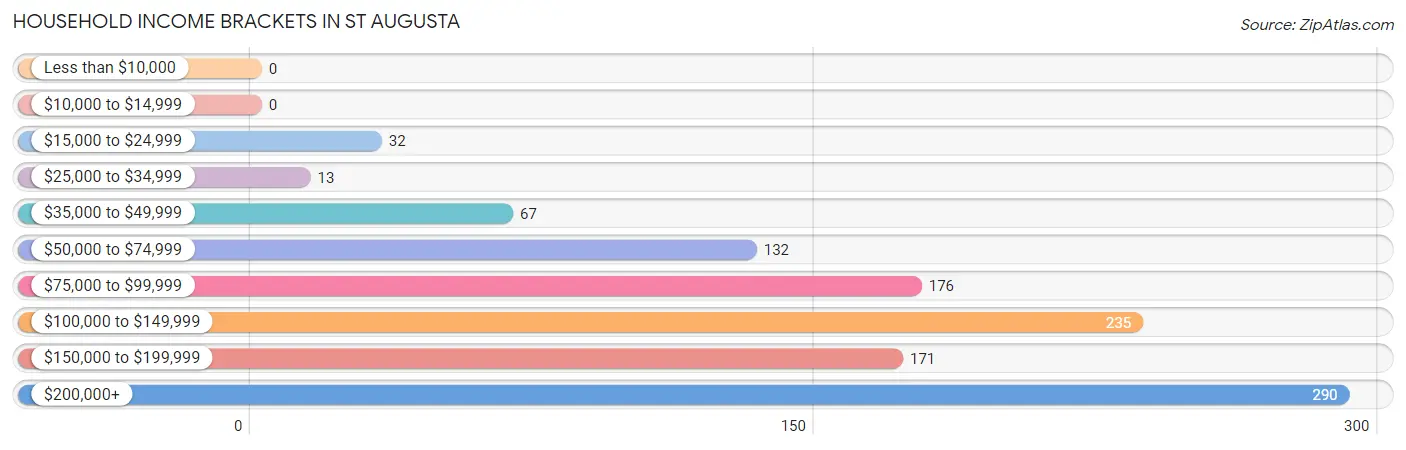
| Income Bracket | # Households | % Households |
| Less than $10,000 | 0 | 0.0% |
| $10,000 to $14,999 | 0 | 0.0% |
| $15,000 to $24,999 | 32 | 2.9% |
| $25,000 to $34,999 | 13 | 1.2% |
| $35,000 to $49,999 | 67 | 6.0% |
| $50,000 to $74,999 | 132 | 11.8% |
| $75,000 to $99,999 | 176 | 15.8% |
| $100,000 to $149,999 | 235 | 21.1% |
| $150,000 to $199,999 | 171 | 15.3% |
| $200,000+ | 290 | 26.0% |
Household Income by Householder Age in St Augusta
The median household income in St Augusta is $120,526, with the highest median household income of $175,769 found in the 25 to 44 years age bracket for the primary householder. A total of 438 households (39.3%) fall into this category. Meanwhile, the 15 to 24 years age bracket for the primary householder has the lowest median household income of $73,417, with 45 households (4.0%) in this group.
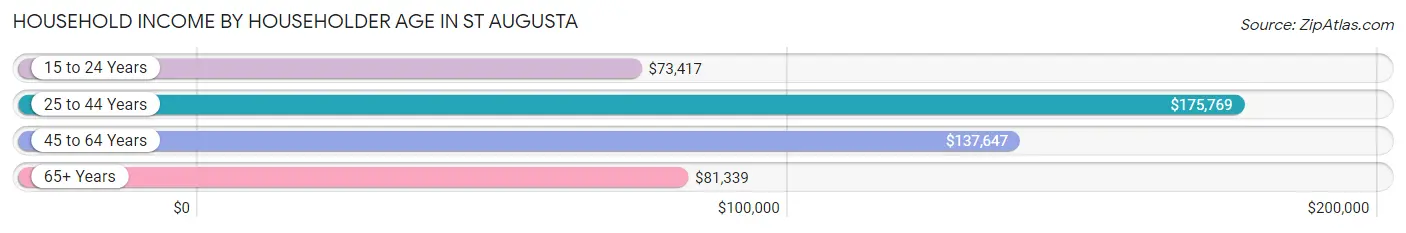
| Income Bracket | # Households | Median Income |
| 15 to 24 Years | 45 (4.0%) | $73,417 |
| 25 to 44 Years | 438 (39.3%) | $175,769 |
| 45 to 64 Years | 430 (38.5%) | $137,647 |
| 65+ Years | 203 (18.2%) | $81,339 |
| Total | 1,116 (100.0%) | $120,526 |
Poverty in St Augusta
Income Below Poverty by Sex and Age in St Augusta
With 3.5% poverty level for males and 3.9% for females among the residents of St Augusta, 6 to 11 year old males and 15 year old females are the most vulnerable to poverty, with 19 males (18.6%) and 7 females (25.9%) in their respective age groups living below the poverty level.
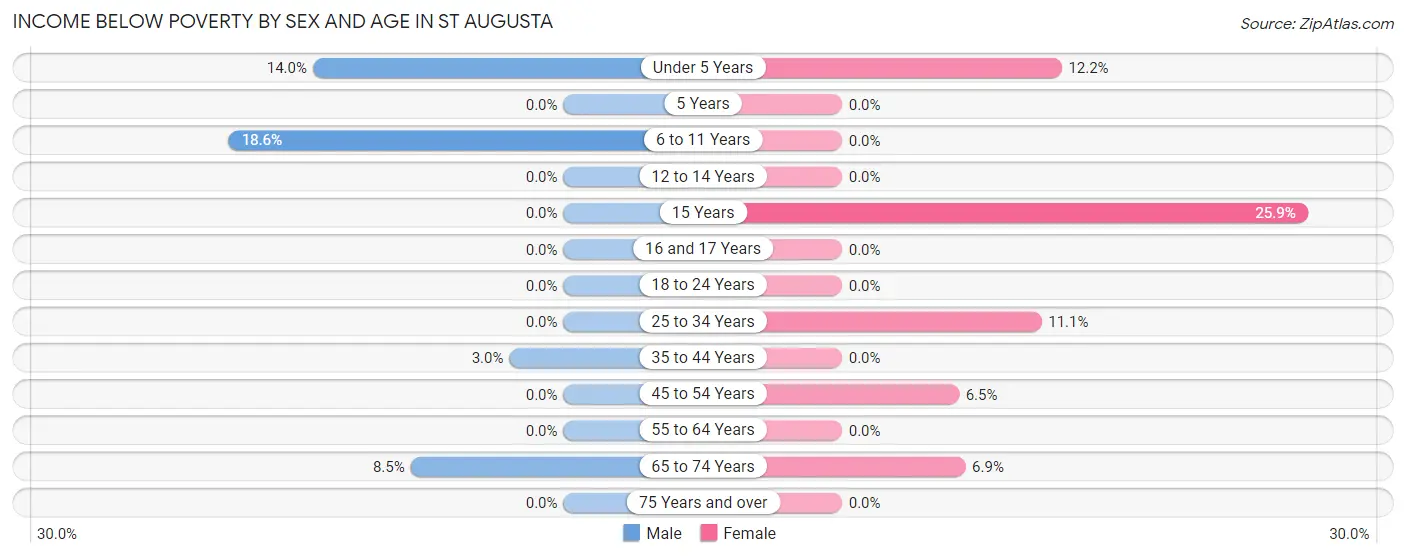
| Age Bracket | Male | Female |
| Under 5 Years | 24 (14.0%) | 17 (12.2%) |
| 5 Years | 0 (0.0%) | 0 (0.0%) |
| 6 to 11 Years | 19 (18.6%) | 0 (0.0%) |
| 12 to 14 Years | 0 (0.0%) | 0 (0.0%) |
| 15 Years | 0 (0.0%) | 7 (25.9%) |
| 16 and 17 Years | 0 (0.0%) | 0 (0.0%) |
| 18 to 24 Years | 0 (0.0%) | 0 (0.0%) |
| 25 to 34 Years | 0 (0.0%) | 16 (11.1%) |
| 35 to 44 Years | 12 (3.0%) | 0 (0.0%) |
| 45 to 54 Years | 0 (0.0%) | 14 (6.5%) |
| 55 to 64 Years | 0 (0.0%) | 0 (0.0%) |
| 65 to 74 Years | 12 (8.5%) | 9 (6.9%) |
| 75 Years and over | 0 (0.0%) | 0 (0.0%) |
| Total | 67 (3.5%) | 63 (3.9%) |
Income Above Poverty by Sex and Age in St Augusta
According to the poverty statistics in St Augusta, males aged 5 years and females aged 5 years are the age groups that are most secure financially, with 100.0% of males and 100.0% of females in these age groups living above the poverty line.
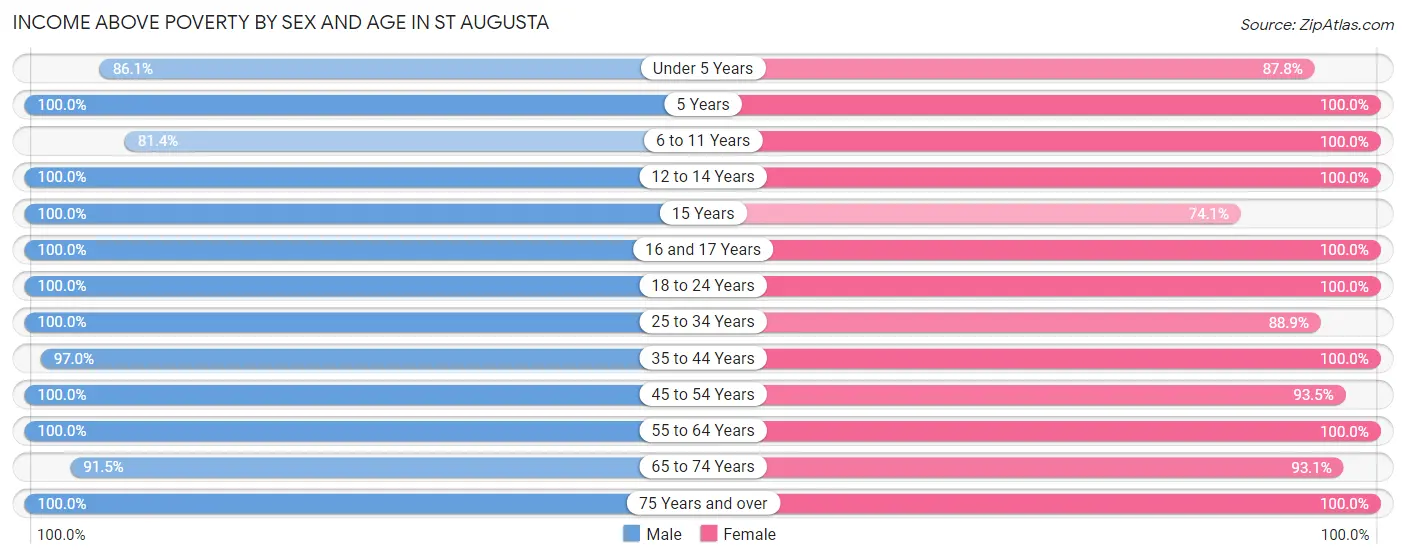
| Age Bracket | Male | Female |
| Under 5 Years | 148 (86.1%) | 122 (87.8%) |
| 5 Years | 24 (100.0%) | 13 (100.0%) |
| 6 to 11 Years | 83 (81.4%) | 167 (100.0%) |
| 12 to 14 Years | 135 (100.0%) | 81 (100.0%) |
| 15 Years | 21 (100.0%) | 20 (74.1%) |
| 16 and 17 Years | 76 (100.0%) | 49 (100.0%) |
| 18 to 24 Years | 200 (100.0%) | 130 (100.0%) |
| 25 to 34 Years | 198 (100.0%) | 128 (88.9%) |
| 35 to 44 Years | 387 (97.0%) | 279 (100.0%) |
| 45 to 54 Years | 153 (100.0%) | 201 (93.5%) |
| 55 to 64 Years | 228 (100.0%) | 199 (100.0%) |
| 65 to 74 Years | 129 (91.5%) | 122 (93.1%) |
| 75 Years and over | 62 (100.0%) | 24 (100.0%) |
| Total | 1,844 (96.5%) | 1,535 (96.1%) |
Income Below Poverty Among Married-Couple Families in St Augusta
The poverty statistics for married-couple families in St Augusta show that 3.0% or 25 of the total 827 families live below the poverty line. Families with 3 or 4 children have the highest poverty rate of 11.2%, comprising of 13 families. On the other hand, families with 1 or 2 children have the lowest poverty rate of 0.0%, which includes 0 families.
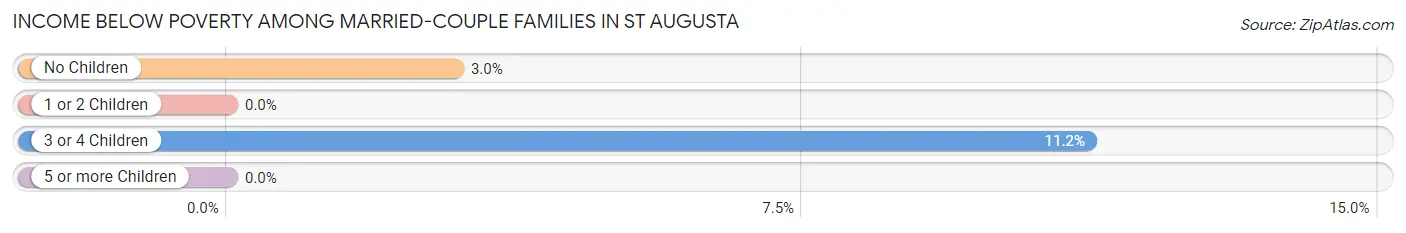
| Children | Above Poverty | Below Poverty |
| No Children | 395 (97.1%) | 12 (2.9%) |
| 1 or 2 Children | 304 (100.0%) | 0 (0.0%) |
| 3 or 4 Children | 103 (88.8%) | 13 (11.2%) |
| 5 or more Children | 0 (0.0%) | 0 (0.0%) |
| Total | 802 (97.0%) | 25 (3.0%) |
Income Below Poverty Among Single-Parent Households in St Augusta
| Children | Single Father | Single Mother |
| No Children | 0 (0.0%) | 0 (0.0%) |
| 1 or 2 Children | 0 (0.0%) | 0 (0.0%) |
| 3 or 4 Children | 0 (0.0%) | 0 (0.0%) |
| 5 or more Children | 0 (0.0%) | 0 (0.0%) |
| Total | 0 (0.0%) | 0 (0.0%) |
Income Below Poverty Among Married-Couple vs Single-Parent Households in St Augusta
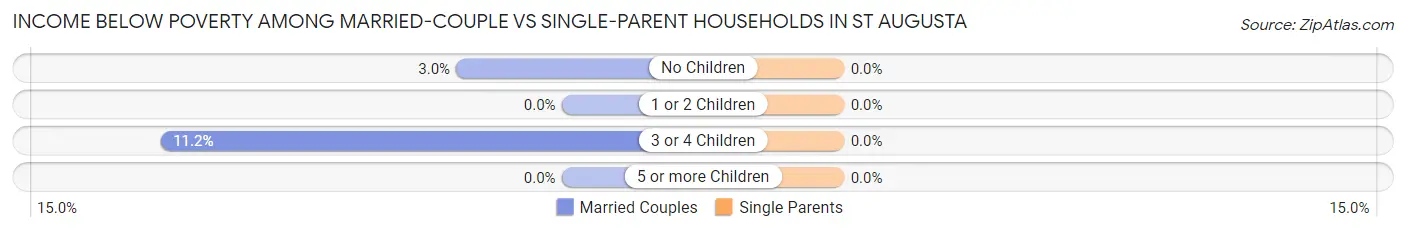
| Children | Married-Couple Families | Single-Parent Households |
| No Children | 12 (2.9%) | 0 (0.0%) |
| 1 or 2 Children | 0 (0.0%) | 0 (0.0%) |
| 3 or 4 Children | 13 (11.2%) | 0 (0.0%) |
| 5 or more Children | 0 (0.0%) | 0 (0.0%) |
| Total | 25 (3.0%) | 0 (0.0%) |
Race in St Augusta
The most populous races in St Augusta are White / Caucasian (3,412 | 96.9%), Hispanic or Latino (239 | 6.8%), and Asian (62 | 1.8%).
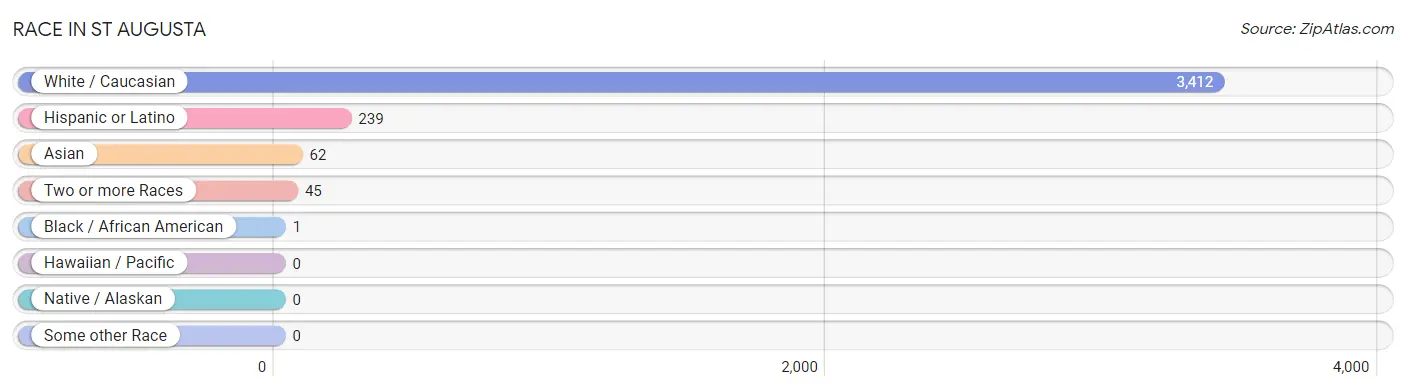
| Race | # Population | % Population |
| Asian | 62 | 1.8% |
| Black / African American | 1 | 0.0% |
| Hawaiian / Pacific | 0 | 0.0% |
| Hispanic or Latino | 239 | 6.8% |
| Native / Alaskan | 0 | 0.0% |
| White / Caucasian | 3,412 | 96.9% |
| Two or more Races | 45 | 1.3% |
| Some other Race | 0 | 0.0% |
| Total | 3,520 | 100.0% |
Ancestry in St Augusta
The most populous ancestries reported in St Augusta are German (1,554 | 44.2%), Irish (361 | 10.3%), Polish (346 | 9.8%), Norwegian (280 | 8.0%), and American (212 | 6.0%), together accounting for 78.2% of all St Augusta residents.
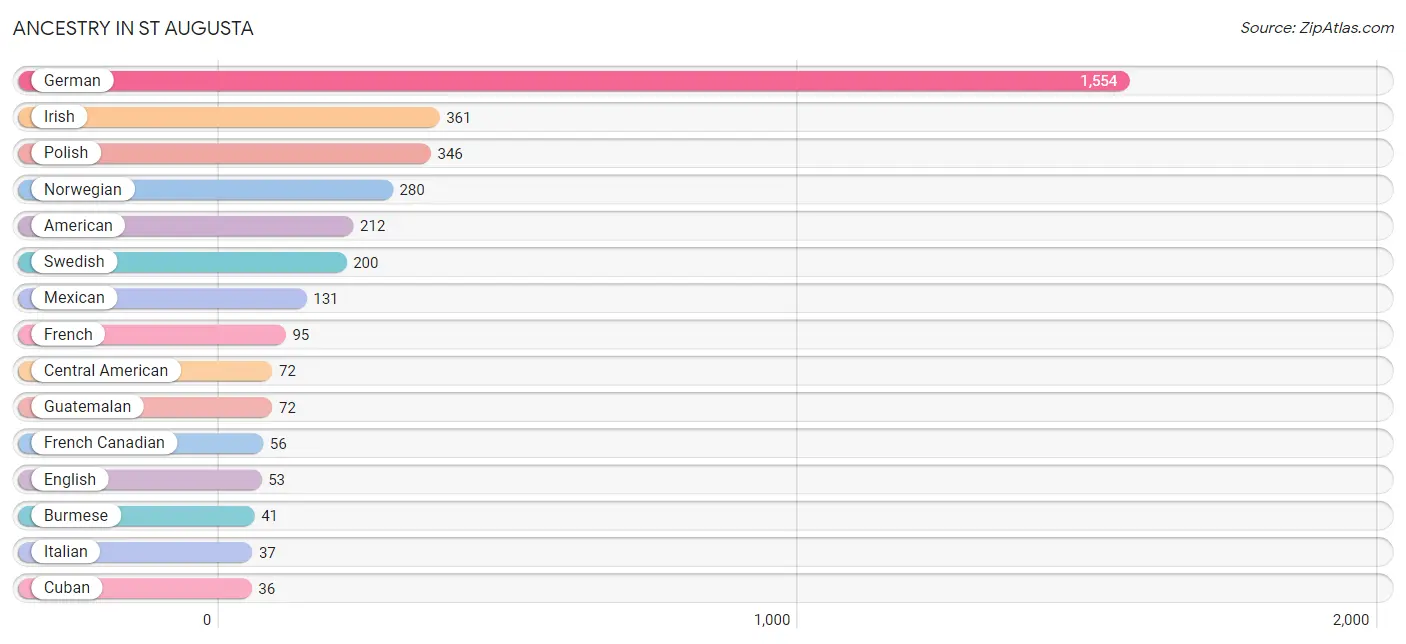
| Ancestry | # Population | % Population |
| American | 212 | 6.0% |
| Austrian | 14 | 0.4% |
| British | 30 | 0.9% |
| Burmese | 41 | 1.2% |
| Central American | 72 | 2.1% |
| Chippewa | 12 | 0.3% |
| Cuban | 36 | 1.0% |
| Czech | 7 | 0.2% |
| Danish | 12 | 0.3% |
| Dutch | 31 | 0.9% |
| Eastern European | 7 | 0.2% |
| English | 53 | 1.5% |
| European | 23 | 0.6% |
| French | 95 | 2.7% |
| French Canadian | 56 | 1.6% |
| German | 1,554 | 44.2% |
| Guatemalan | 72 | 2.1% |
| Irish | 361 | 10.3% |
| Italian | 37 | 1.1% |
| Jamaican | 36 | 1.0% |
| Lithuanian | 1 | 0.0% |
| Malaysian | 21 | 0.6% |
| Mexican | 131 | 3.7% |
| Norwegian | 280 | 8.0% |
| Polish | 346 | 9.8% |
| Scottish | 8 | 0.2% |
| Sioux | 12 | 0.3% |
| Slovene | 3 | 0.1% |
| Swedish | 200 | 5.7% |
| Ukrainian | 1 | 0.0% |
| Welsh | 19 | 0.5% | View All 31 Rows |
Immigrants in St Augusta
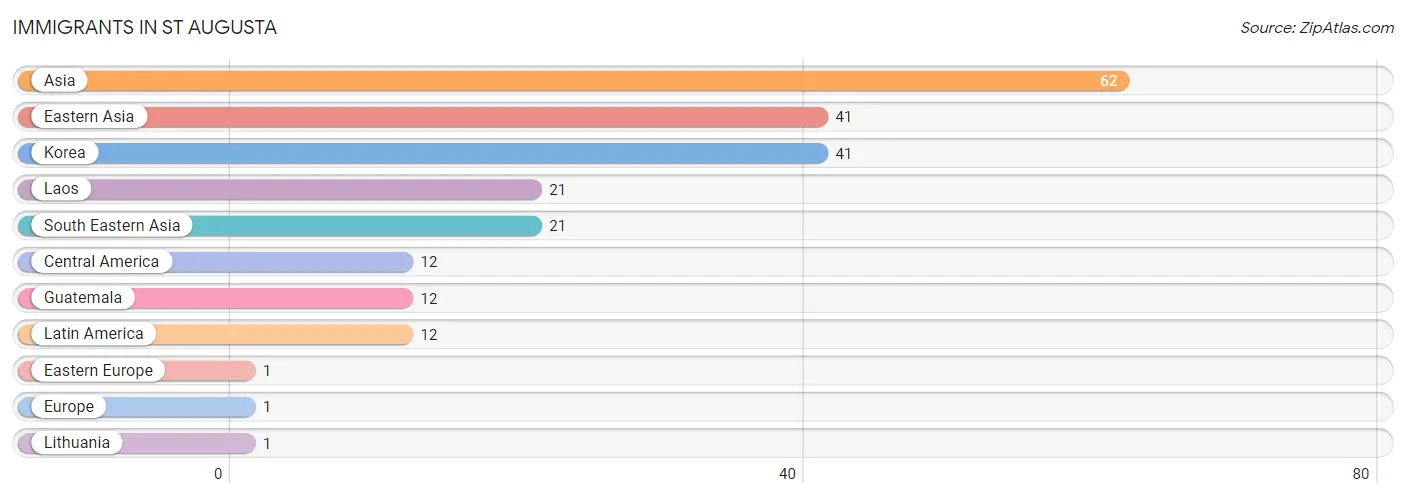
The most numerous immigrant groups reported in St Augusta came from Asia (62 | 1.8%), Eastern Asia (41 | 1.2%), Korea (41 | 1.2%), Laos (21 | 0.6%), and South Eastern Asia (21 | 0.6%), together accounting for 5.3% of all St Augusta residents.
| Immigration Origin | # Population | % Population |
| Asia | 62 | 1.8% |
| Central America | 12 | 0.3% |
| Eastern Asia | 41 | 1.2% |
| Eastern Europe | 1 | 0.0% |
| Europe | 1 | 0.0% |
| Guatemala | 12 | 0.3% |
| Korea | 41 | 1.2% |
| Laos | 21 | 0.6% |
| Latin America | 12 | 0.3% |
| Lithuania | 1 | 0.0% |
| South Eastern Asia | 21 | 0.6% | View All 11 Rows |
Sex and Age in St Augusta
Sex and Age in St Augusta
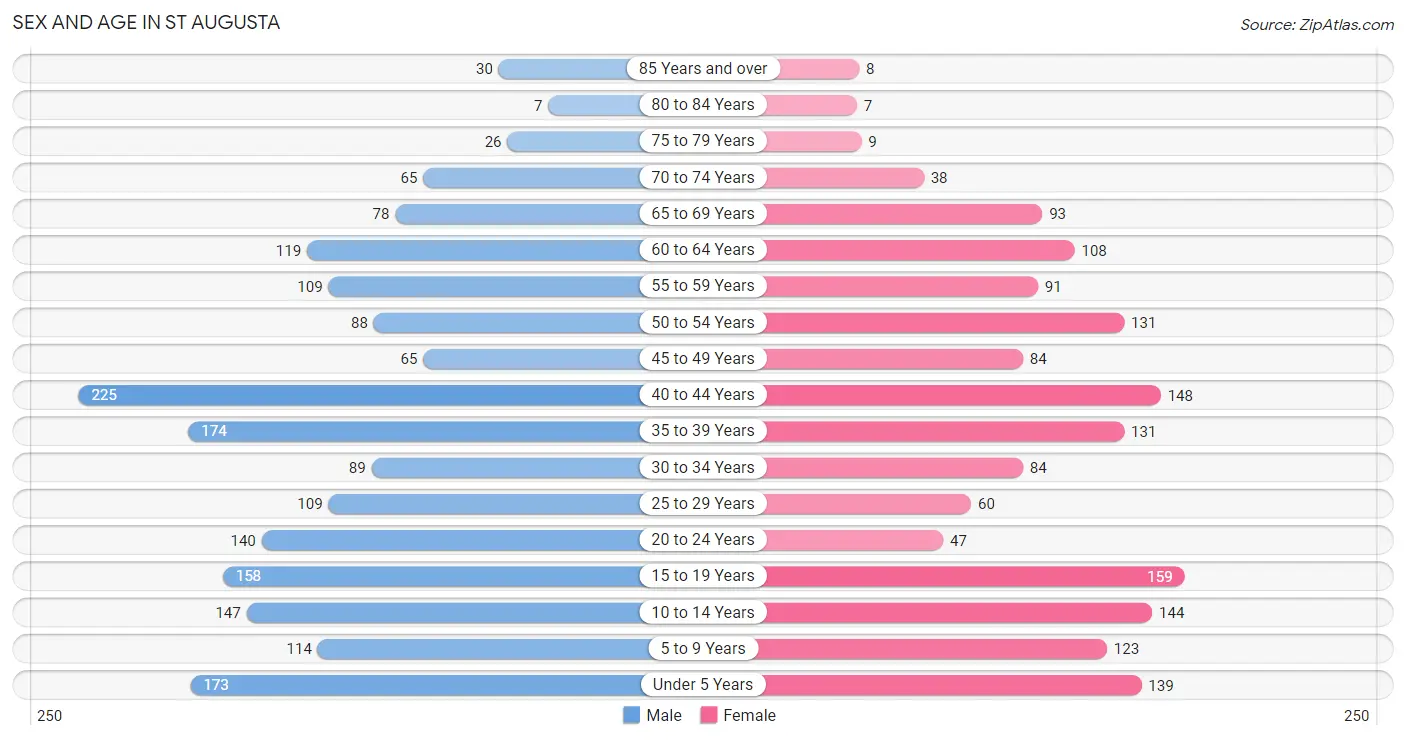
The most populous age groups in St Augusta are 40 to 44 Years (225 | 11.7%) for men and 15 to 19 Years (159 | 9.9%) for women.
| Age Bracket | Male | Female |
| Under 5 Years | 173 (9.0%) | 139 (8.7%) |
| 5 to 9 Years | 114 (5.9%) | 123 (7.7%) |
| 10 to 14 Years | 147 (7.7%) | 144 (9.0%) |
| 15 to 19 Years | 158 (8.3%) | 159 (9.9%) |
| 20 to 24 Years | 140 (7.3%) | 47 (2.9%) |
| 25 to 29 Years | 109 (5.7%) | 60 (3.7%) |
| 30 to 34 Years | 89 (4.6%) | 84 (5.2%) |
| 35 to 39 Years | 174 (9.1%) | 131 (8.2%) |
| 40 to 44 Years | 225 (11.7%) | 148 (9.2%) |
| 45 to 49 Years | 65 (3.4%) | 84 (5.2%) |
| 50 to 54 Years | 88 (4.6%) | 131 (8.2%) |
| 55 to 59 Years | 109 (5.7%) | 91 (5.7%) |
| 60 to 64 Years | 119 (6.2%) | 108 (6.7%) |
| 65 to 69 Years | 78 (4.1%) | 93 (5.8%) |
| 70 to 74 Years | 65 (3.4%) | 38 (2.4%) |
| 75 to 79 Years | 26 (1.4%) | 9 (0.6%) |
| 80 to 84 Years | 7 (0.4%) | 7 (0.4%) |
| 85 Years and over | 30 (1.6%) | 8 (0.5%) |
| Total | 1,916 (100.0%) | 1,604 (100.0%) |
Families and Households in St Augusta
Median Family Size in St Augusta
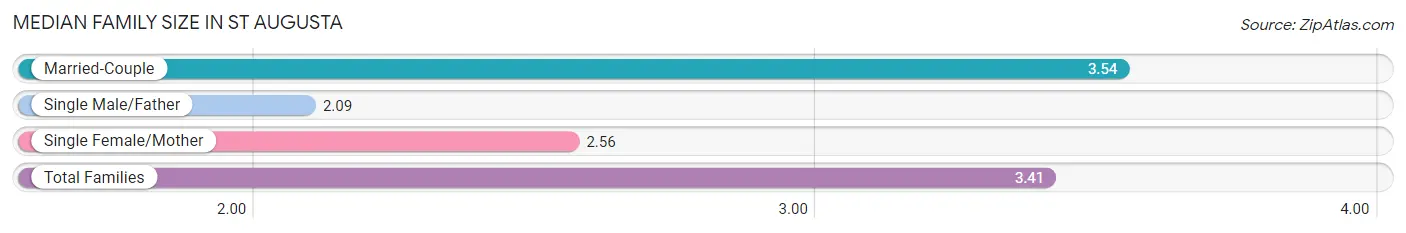
The median family size in St Augusta is 3.41 persons per family, with married-couple families (827 | 89.9%) accounting for the largest median family size of 3.54 persons per family. On the other hand, single male/father families (54 | 5.9%) represent the smallest median family size with 2.09 persons per family.
| Family Type | # Families | Family Size |
| Married-Couple | 827 (89.9%) | 3.54 |
| Single Male/Father | 54 (5.9%) | 2.09 |
| Single Female/Mother | 39 (4.2%) | 2.56 |
| Total Families | 920 (100.0%) | 3.41 |
Median Household Size in St Augusta
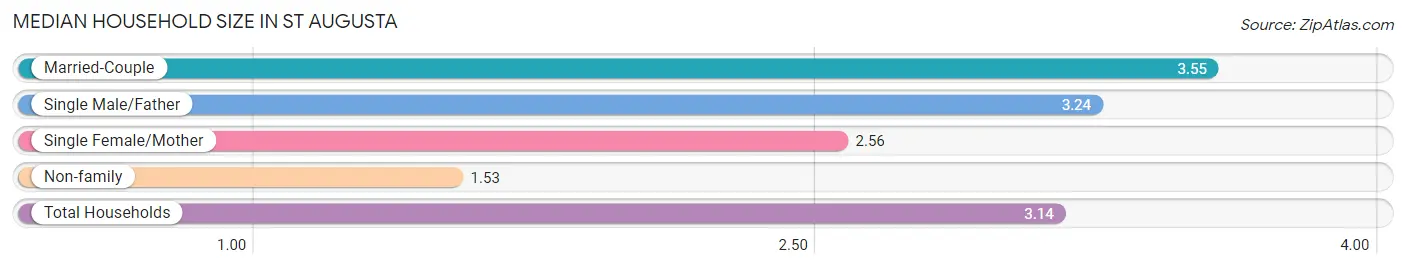
The median household size in St Augusta is 3.14 persons per household, with married-couple households (827 | 74.1%) accounting for the largest median household size of 3.55 persons per household. non-family households (196 | 17.6%) represent the smallest median household size with 1.53 persons per household.
| Household Type | # Households | Household Size |
| Married-Couple | 827 (74.1%) | 3.55 |
| Single Male/Father | 54 (4.8%) | 3.24 |
| Single Female/Mother | 39 (3.5%) | 2.56 |
| Non-family | 196 (17.6%) | 1.53 |
| Total Households | 1,116 (100.0%) | 3.14 |
Household Size by Marriage Status in St Augusta
Out of a total of 1,116 households in St Augusta, 920 (82.4%) are family households, while 196 (17.6%) are nonfamily households. The most numerous type of family households are 2-person households, comprising 350, and the most common type of nonfamily households are 1-person households, comprising 120.
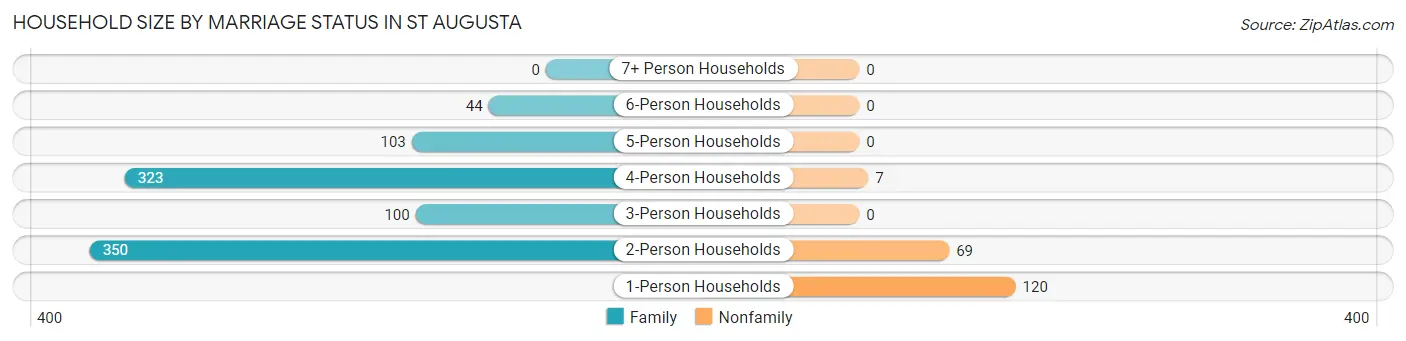
| Household Size | Family Households | Nonfamily Households |
| 1-Person Households | - | 120 (10.7%) |
| 2-Person Households | 350 (31.4%) | 69 (6.2%) |
| 3-Person Households | 100 (9.0%) | 0 (0.0%) |
| 4-Person Households | 323 (28.9%) | 7 (0.6%) |
| 5-Person Households | 103 (9.2%) | 0 (0.0%) |
| 6-Person Households | 44 (3.9%) | 0 (0.0%) |
| 7+ Person Households | 0 (0.0%) | 0 (0.0%) |
| Total | 920 (82.4%) | 196 (17.6%) |
Female Fertility in St Augusta
Fertility by Age in St Augusta
Average fertility rate in St Augusta is 103.0 births per 1,000 women. Women in the age bracket of 20 to 34 years have the highest fertility rate with 194.0 births per 1,000 women. Women in the age bracket of 20 to 34 years acount for 50.0% of all women with births.
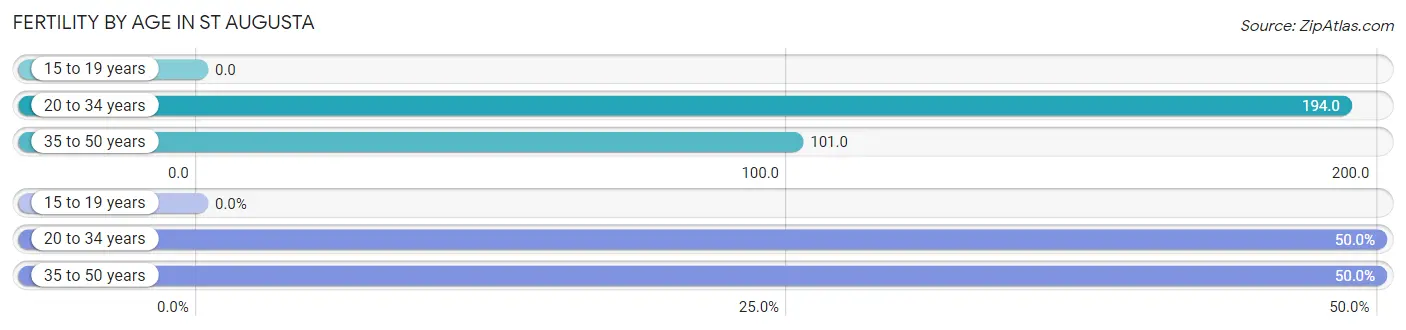
| Age Bracket | Women with Births | Births / 1,000 Women |
| 15 to 19 years | 0 (0.0%) | 0.0 |
| 20 to 34 years | 37 (50.0%) | 194.0 |
| 35 to 50 years | 37 (50.0%) | 101.0 |
| Total | 74 (100.0%) | 103.0 |
Fertility by Age by Marriage Status in St Augusta
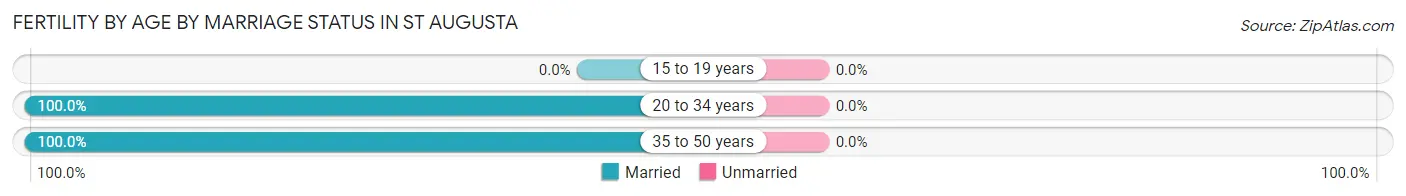
| Age Bracket | Married | Unmarried |
| 15 to 19 years | 0 (0.0%) | 0 (0.0%) |
| 20 to 34 years | 37 (100.0%) | 0 (0.0%) |
| 35 to 50 years | 37 (100.0%) | 0 (0.0%) |
| Total | 74 (100.0%) | 0 (0.0%) |
Fertility by Education in St Augusta
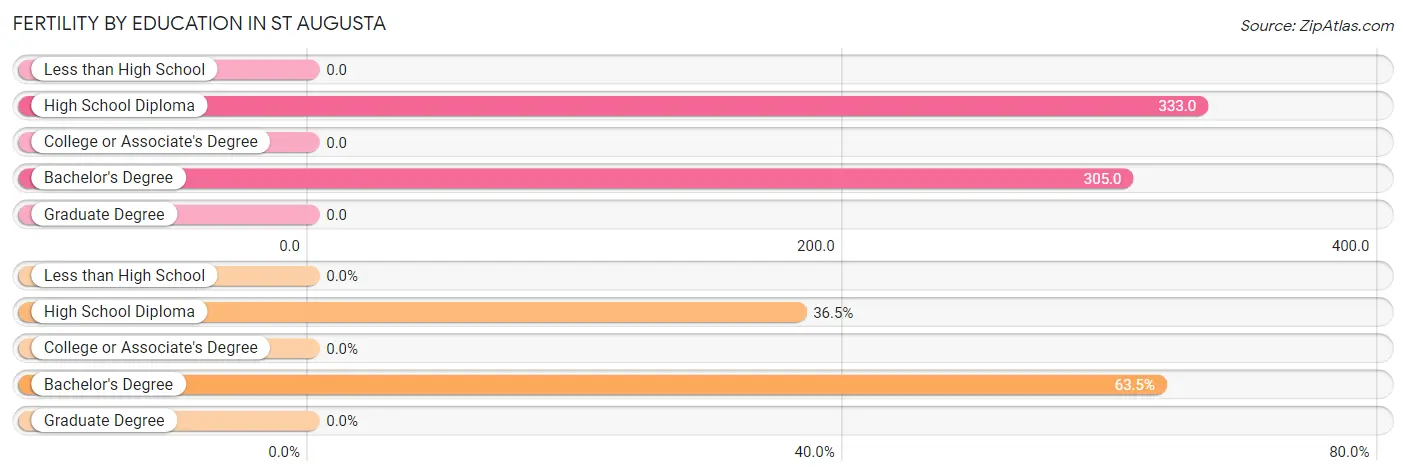
| Educational Attainment | Women with Births | Births / 1,000 Women |
| Less than High School | 0 (0.0%) | 0.0 |
| High School Diploma | 27 (36.5%) | 333.0 |
| College or Associate's Degree | 0 (0.0%) | 0.0 |
| Bachelor's Degree | 47 (63.5%) | 305.0 |
| Graduate Degree | 0 (0.0%) | 0.0 |
| Total | 74 (100.0%) | 103.0 |
Fertility by Education by Marriage Status in St Augusta
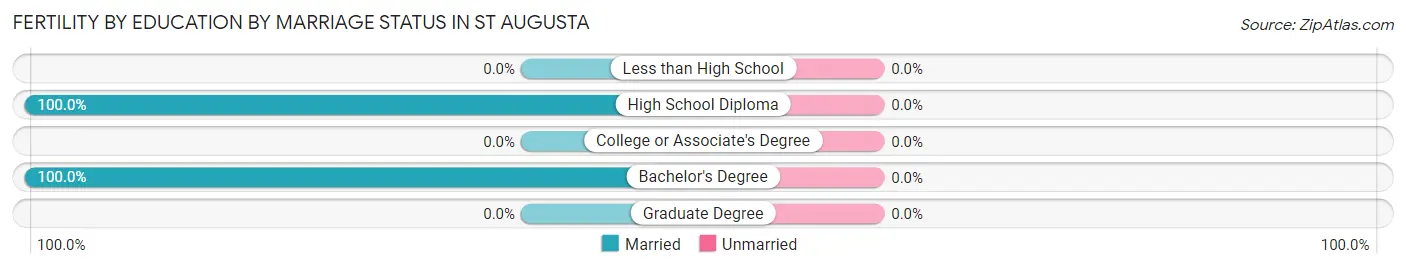
| Educational Attainment | Married | Unmarried |
| Less than High School | 0 (0.0%) | 0 (0.0%) |
| High School Diploma | 27 (100.0%) | 0 (0.0%) |
| College or Associate's Degree | 0 (0.0%) | 0 (0.0%) |
| Bachelor's Degree | 47 (100.0%) | 0 (0.0%) |
| Graduate Degree | 0 (0.0%) | 0 (0.0%) |
| Total | 74 (100.0%) | 0 (0.0%) |
Employment Characteristics in St Augusta
Employment by Class of Employer in St Augusta
Among the 1,901 employed individuals in St Augusta, private company employees (1,225 | 64.4%), not-for-profit organizations (253 | 13.3%), and self-employed (not incorporated) (139 | 7.3%) make up the most common classes of employment.
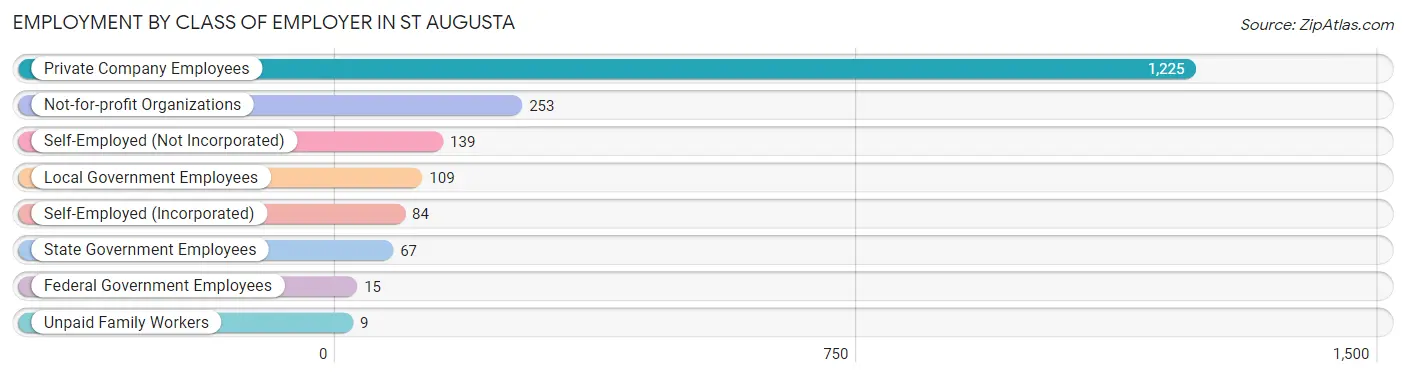
| Employer Class | # Employees | % Employees |
| Private Company Employees | 1,225 | 64.4% |
| Self-Employed (Incorporated) | 84 | 4.4% |
| Self-Employed (Not Incorporated) | 139 | 7.3% |
| Not-for-profit Organizations | 253 | 13.3% |
| Local Government Employees | 109 | 5.7% |
| State Government Employees | 67 | 3.5% |
| Federal Government Employees | 15 | 0.8% |
| Unpaid Family Workers | 9 | 0.5% |
| Total | 1,901 | 100.0% |
Employment Status by Age in St Augusta
According to the labor force statistics for St Augusta, out of the total population over 16 years of age (2,632), 75.5% or 1,987 individuals are in the labor force, with 3.6% or 72 of them unemployed. The age group with the highest labor force participation rate is 20 to 24 years, with 100.0% or 187 individuals in the labor force. Within the labor force, the 45 to 54 years age range has the highest percentage of unemployed individuals, with 10.9% or 36 of them being unemployed.
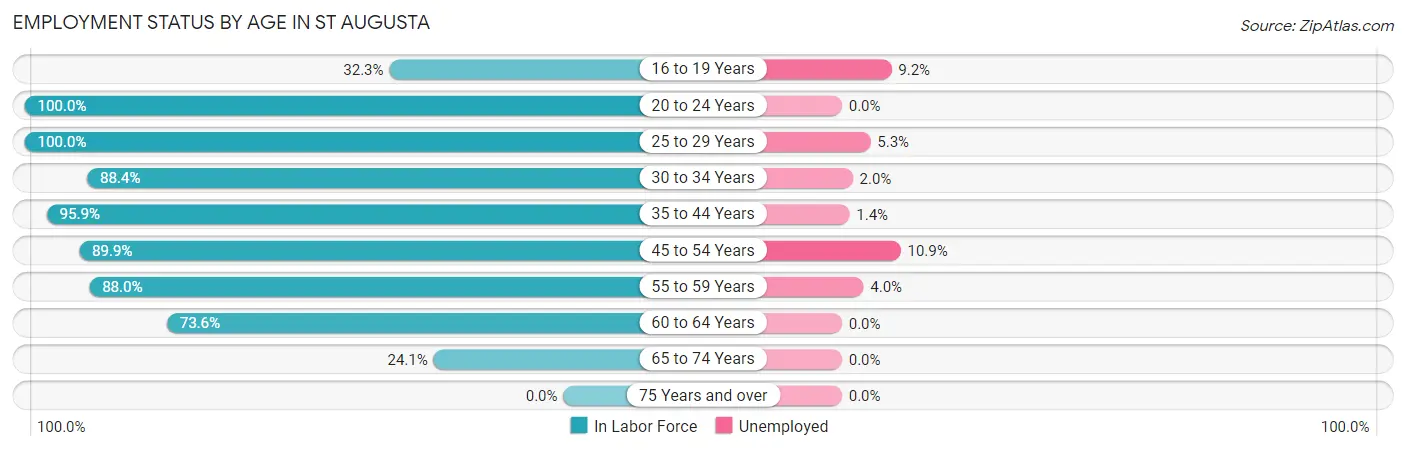
| Age Bracket | In Labor Force | Unemployed |
| 16 to 19 Years | 87 (32.3%) | 8 (9.2%) |
| 20 to 24 Years | 187 (100.0%) | 0 (0.0%) |
| 25 to 29 Years | 169 (100.0%) | 9 (5.3%) |
| 30 to 34 Years | 153 (88.4%) | 3 (2.0%) |
| 35 to 44 Years | 650 (95.9%) | 9 (1.4%) |
| 45 to 54 Years | 331 (89.9%) | 36 (10.9%) |
| 55 to 59 Years | 176 (88.0%) | 7 (4.0%) |
| 60 to 64 Years | 167 (73.6%) | 0 (0.0%) |
| 65 to 74 Years | 66 (24.1%) | 0 (0.0%) |
| 75 Years and over | 0 (0.0%) | 0 (0.0%) |
| Total | 1,987 (75.5%) | 72 (3.6%) |
Employment Status by Educational Attainment in St Augusta
According to labor force statistics for St Augusta, 90.7% of individuals (1,646) out of the total population between 25 and 64 years of age (1,815) are in the labor force, with 3.9% or 64 of them being unemployed. The group with the highest labor force participation rate are those with the educational attainment of college / associate degree, with 91.5% or 569 individuals in the labor force. Within the labor force, individuals with less than high school education have the highest percentage of unemployment, with 65.5% or 36 of them being unemployed.
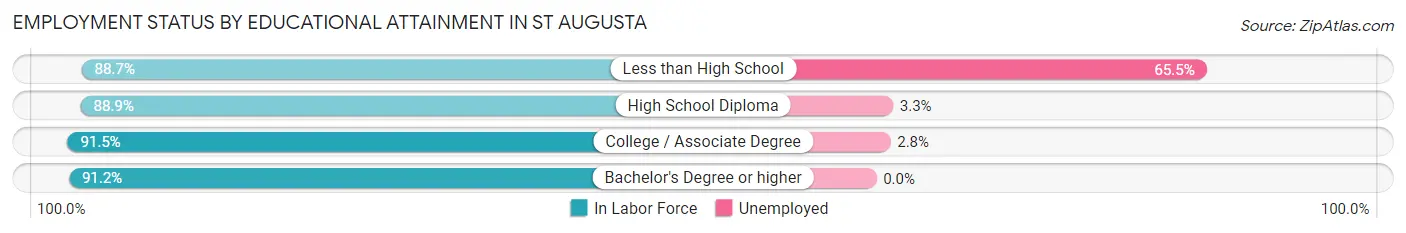
| Educational Attainment | In Labor Force | Unemployed |
| Less than High School | 55 (88.7%) | 41 (65.5%) |
| High School Diploma | 361 (88.9%) | 13 (3.3%) |
| College / Associate Degree | 569 (91.5%) | 17 (2.8%) |
| Bachelor's Degree or higher | 661 (91.2%) | 0 (0.0%) |
| Total | 1,646 (90.7%) | 71 (3.9%) |
Employment Occupations by Sex in St Augusta
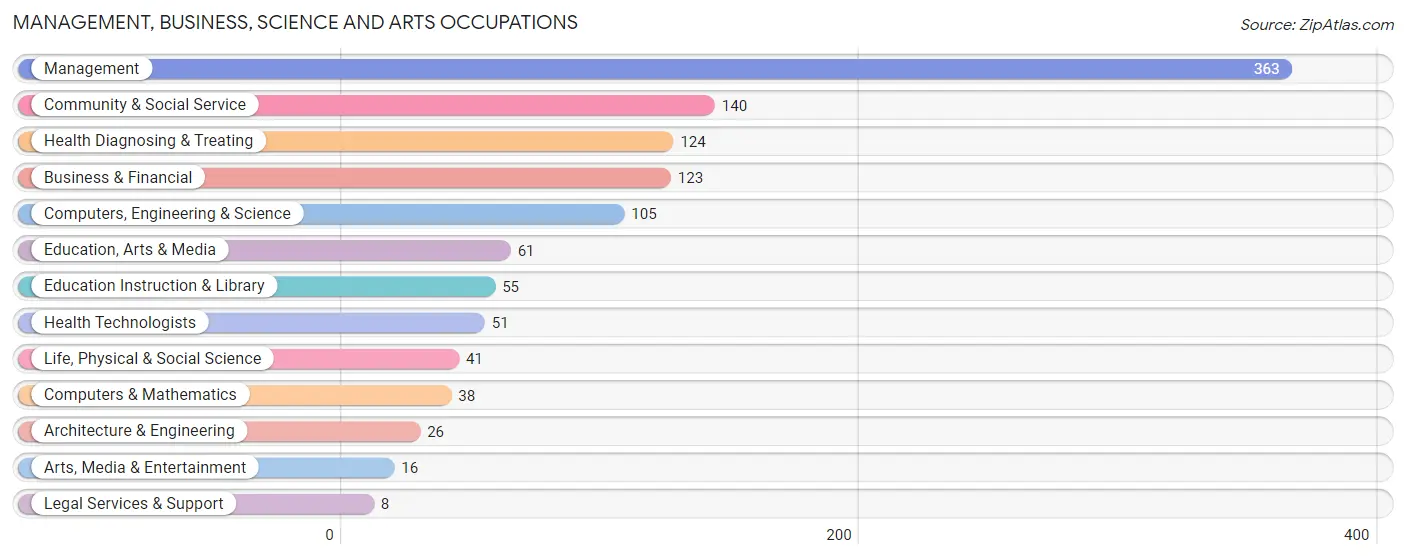
Management, Business, Science and Arts Occupations
The most common Management, Business, Science and Arts occupations in St Augusta are Management (363 | 19.0%), Community & Social Service (140 | 7.3%), Health Diagnosing & Treating (124 | 6.5%), Business & Financial (123 | 6.4%), and Computers, Engineering & Science (105 | 5.5%).
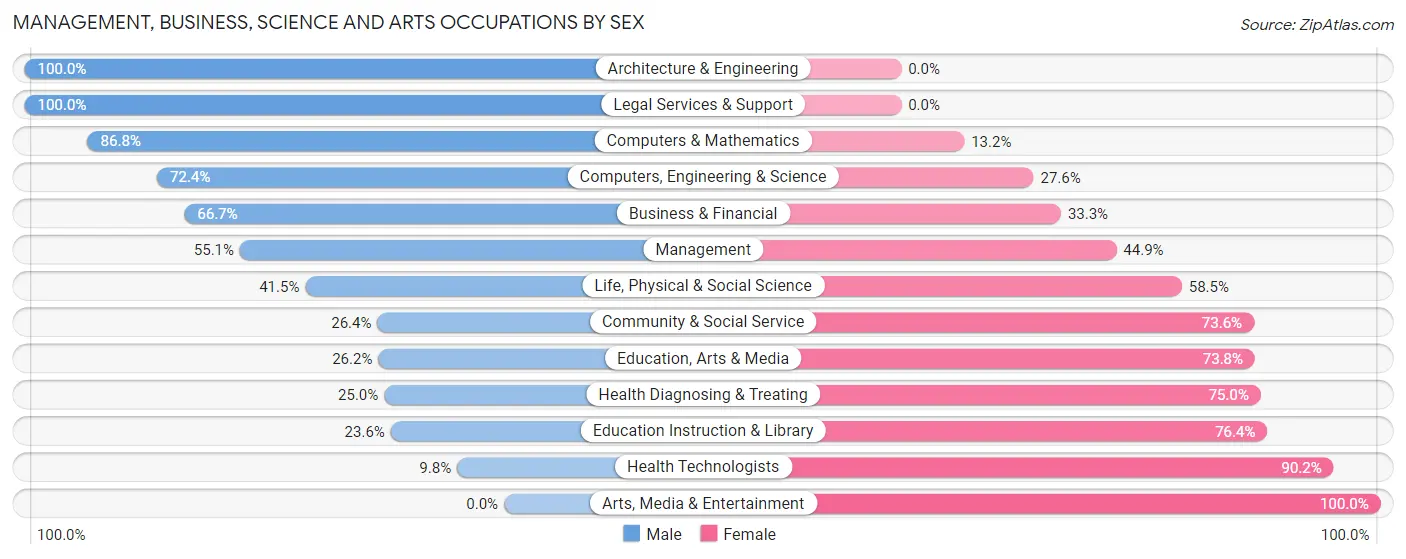
Management, Business, Science and Arts Occupations by Sex
Within the Management, Business, Science and Arts occupations in St Augusta, the most male-oriented occupations are Architecture & Engineering (100.0%), Legal Services & Support (100.0%), and Computers & Mathematics (86.8%), while the most female-oriented occupations are Arts, Media & Entertainment (100.0%), Health Technologists (90.2%), and Education Instruction & Library (76.4%).
| Occupation | Male | Female |
| Management | 200 (55.1%) | 163 (44.9%) |
| Business & Financial | 82 (66.7%) | 41 (33.3%) |
| Computers, Engineering & Science | 76 (72.4%) | 29 (27.6%) |
| Computers & Mathematics | 33 (86.8%) | 5 (13.2%) |
| Architecture & Engineering | 26 (100.0%) | 0 (0.0%) |
| Life, Physical & Social Science | 17 (41.5%) | 24 (58.5%) |
| Community & Social Service | 37 (26.4%) | 103 (73.6%) |
| Education, Arts & Media | 16 (26.2%) | 45 (73.8%) |
| Legal Services & Support | 8 (100.0%) | 0 (0.0%) |
| Education Instruction & Library | 13 (23.6%) | 42 (76.4%) |
| Arts, Media & Entertainment | 0 (0.0%) | 16 (100.0%) |
| Health Diagnosing & Treating | 31 (25.0%) | 93 (75.0%) |
| Health Technologists | 5 (9.8%) | 46 (90.2%) |
| Total (Category) | 426 (49.8%) | 429 (50.2%) |
| Total (Overall) | 1,121 (58.6%) | 793 (41.4%) |
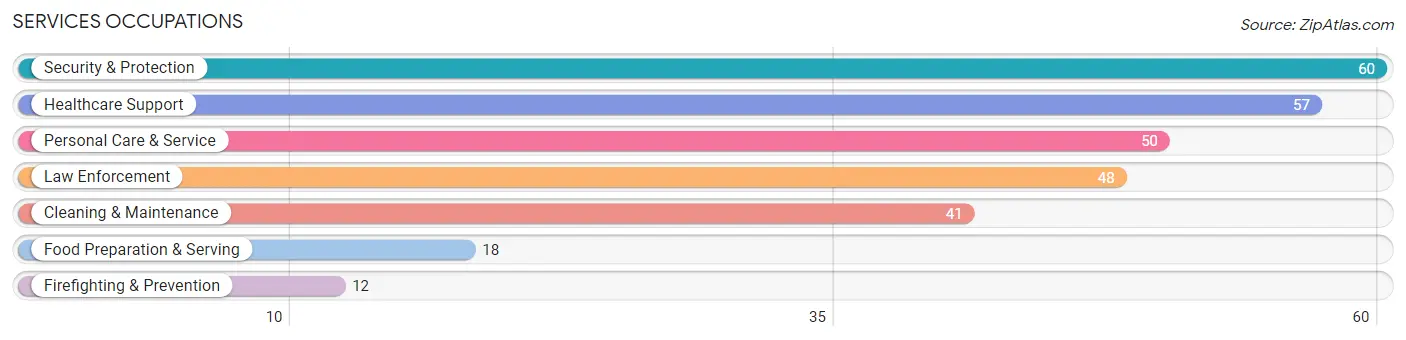
Services Occupations
The most common Services occupations in St Augusta are Security & Protection (60 | 3.1%), Healthcare Support (57 | 3.0%), Personal Care & Service (50 | 2.6%), Law Enforcement (48 | 2.5%), and Cleaning & Maintenance (41 | 2.1%).
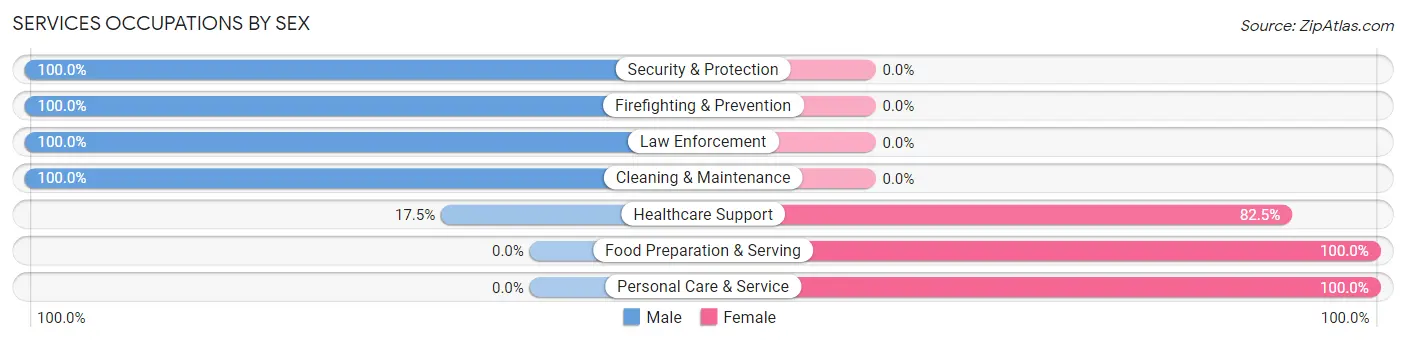
Services Occupations by Sex
Within the Services occupations in St Augusta, the most male-oriented occupations are Security & Protection (100.0%), Firefighting & Prevention (100.0%), and Law Enforcement (100.0%), while the most female-oriented occupations are Food Preparation & Serving (100.0%), Personal Care & Service (100.0%), and Healthcare Support (82.5%).
| Occupation | Male | Female |
| Healthcare Support | 10 (17.5%) | 47 (82.5%) |
| Security & Protection | 60 (100.0%) | 0 (0.0%) |
| Firefighting & Prevention | 12 (100.0%) | 0 (0.0%) |
| Law Enforcement | 48 (100.0%) | 0 (0.0%) |
| Food Preparation & Serving | 0 (0.0%) | 18 (100.0%) |
| Cleaning & Maintenance | 41 (100.0%) | 0 (0.0%) |
| Personal Care & Service | 0 (0.0%) | 50 (100.0%) |
| Total (Category) | 111 (49.1%) | 115 (50.9%) |
| Total (Overall) | 1,121 (58.6%) | 793 (41.4%) |
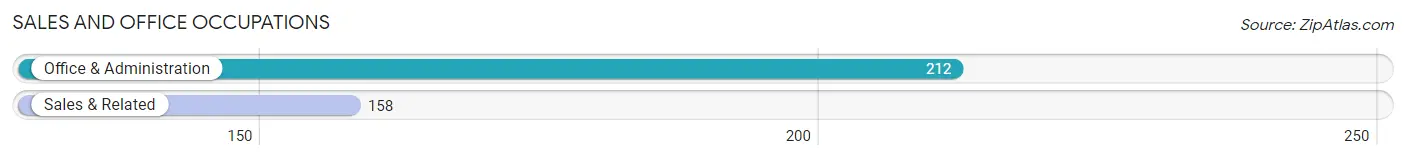
Sales and Office Occupations
The most common Sales and Office occupations in St Augusta are Office & Administration (212 | 11.1%), and Sales & Related (158 | 8.3%).
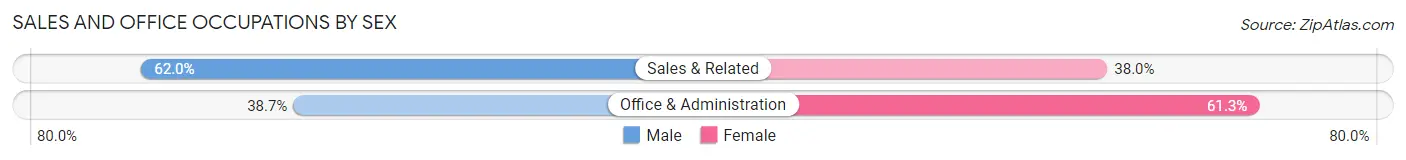
Sales and Office Occupations by Sex
| Occupation | Male | Female |
| Sales & Related | 98 (62.0%) | 60 (38.0%) |
| Office & Administration | 82 (38.7%) | 130 (61.3%) |
| Total (Category) | 180 (48.6%) | 190 (51.3%) |
| Total (Overall) | 1,121 (58.6%) | 793 (41.4%) |
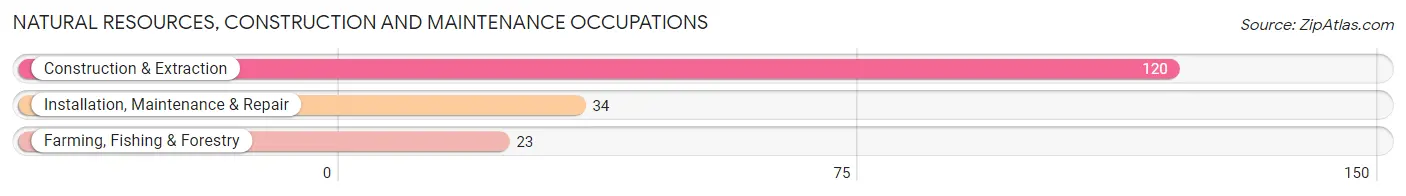
Natural Resources, Construction and Maintenance Occupations
The most common Natural Resources, Construction and Maintenance occupations in St Augusta are Construction & Extraction (120 | 6.3%), Installation, Maintenance & Repair (34 | 1.8%), and Farming, Fishing & Forestry (23 | 1.2%).
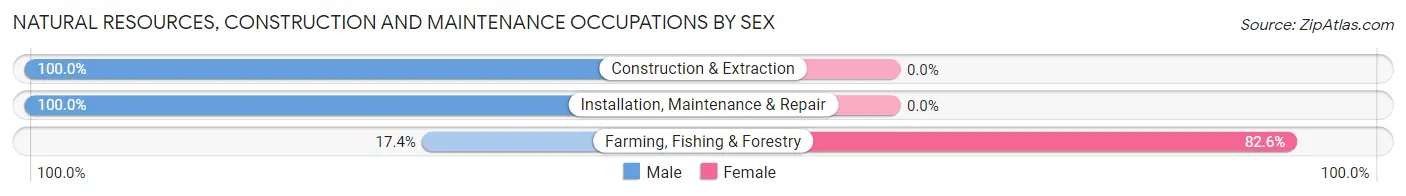
Natural Resources, Construction and Maintenance Occupations by Sex
| Occupation | Male | Female |
| Farming, Fishing & Forestry | 4 (17.4%) | 19 (82.6%) |
| Construction & Extraction | 120 (100.0%) | 0 (0.0%) |
| Installation, Maintenance & Repair | 34 (100.0%) | 0 (0.0%) |
| Total (Category) | 158 (89.3%) | 19 (10.7%) |
| Total (Overall) | 1,121 (58.6%) | 793 (41.4%) |
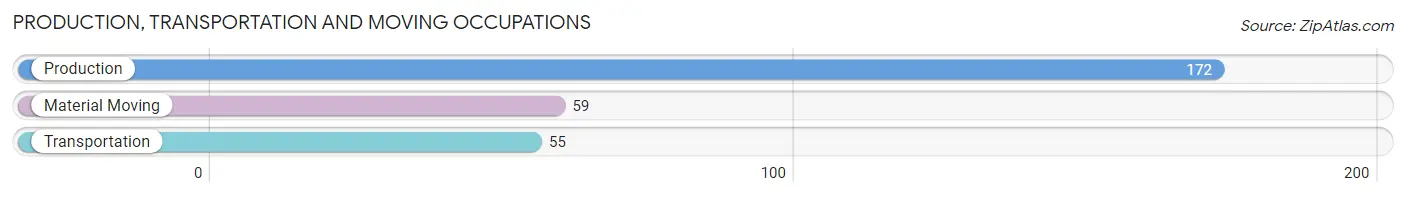
Production, Transportation and Moving Occupations
The most common Production, Transportation and Moving occupations in St Augusta are Production (172 | 9.0%), Material Moving (59 | 3.1%), and Transportation (55 | 2.9%).
Production, Transportation and Moving Occupations by Sex
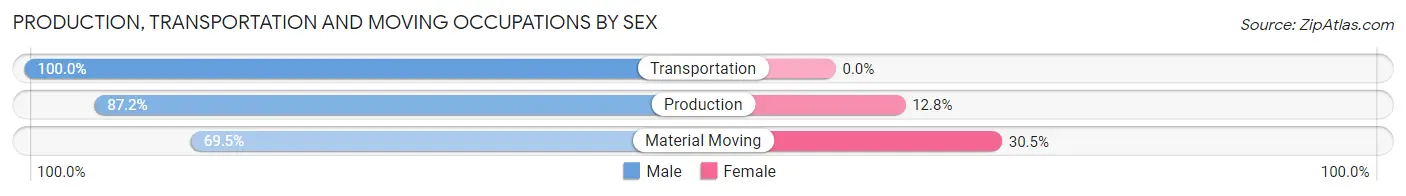
| Occupation | Male | Female |
| Production | 150 (87.2%) | 22 (12.8%) |
| Transportation | 55 (100.0%) | 0 (0.0%) |
| Material Moving | 41 (69.5%) | 18 (30.5%) |
| Total (Category) | 246 (86.0%) | 40 (14.0%) |
| Total (Overall) | 1,121 (58.6%) | 793 (41.4%) |
Employment Industries by Sex in St Augusta
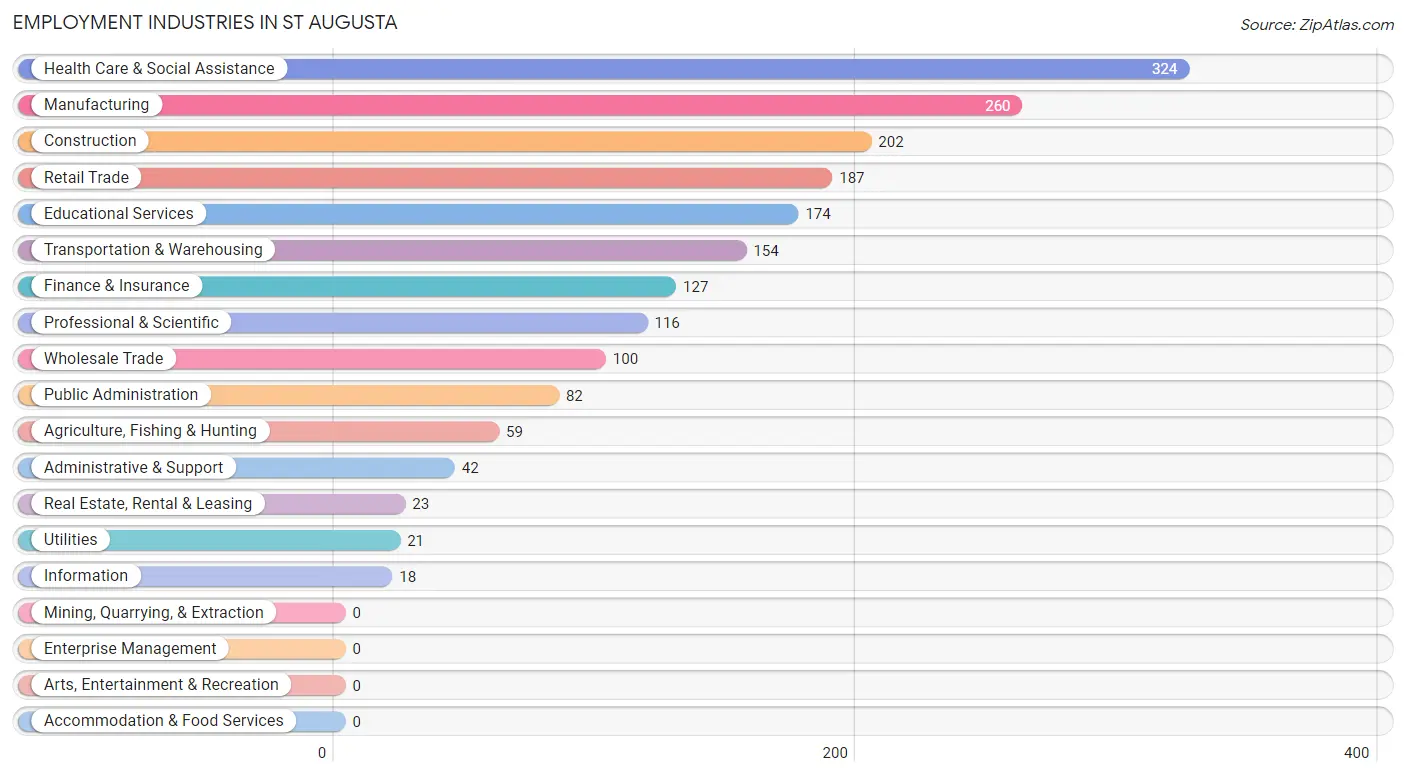
Employment Industries in St Augusta
The major employment industries in St Augusta include Health Care & Social Assistance (324 | 16.9%), Manufacturing (260 | 13.6%), Construction (202 | 10.5%), Retail Trade (187 | 9.8%), and Educational Services (174 | 9.1%).
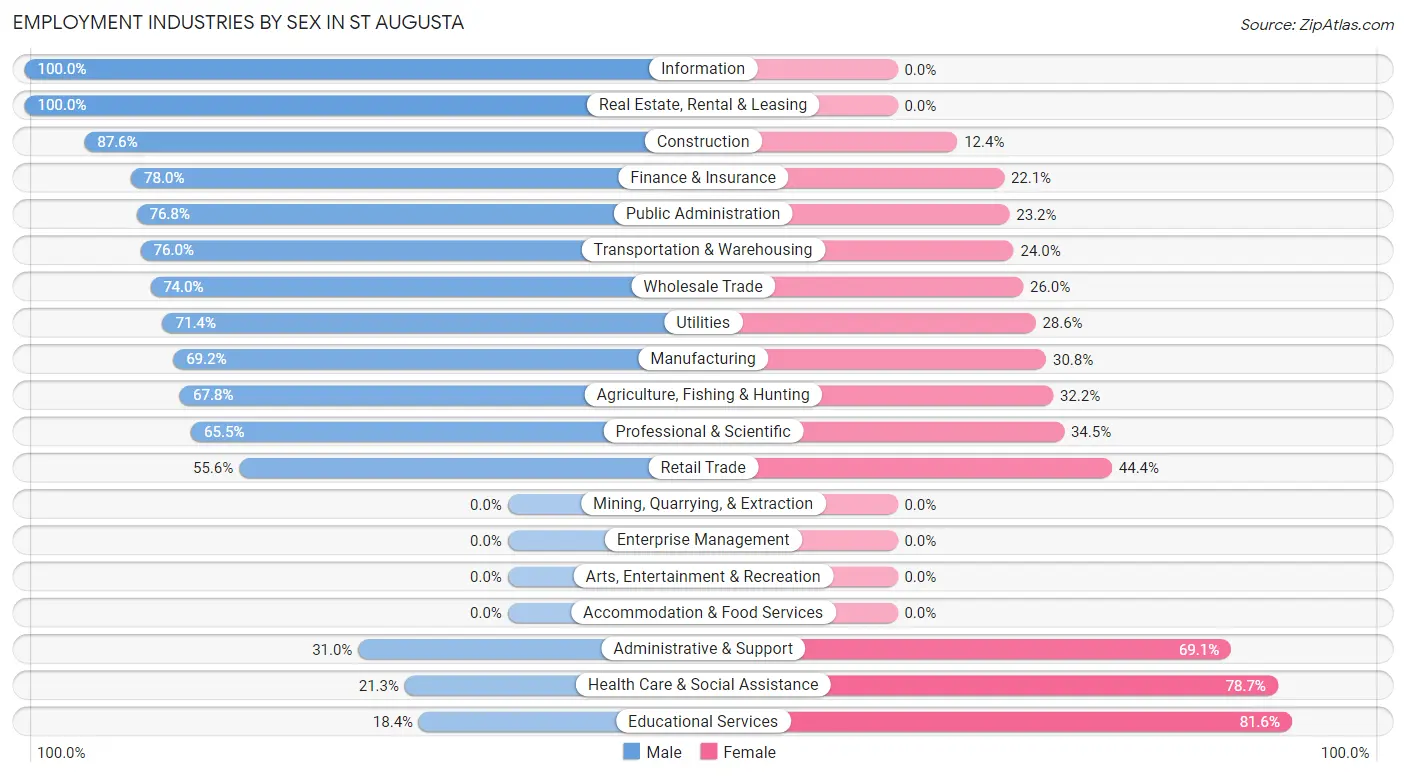
Employment Industries by Sex in St Augusta
The St Augusta industries that see more men than women are Information (100.0%), Real Estate, Rental & Leasing (100.0%), and Construction (87.6%), whereas the industries that tend to have a higher number of women are Educational Services (81.6%), Health Care & Social Assistance (78.7%), and Administrative & Support (69.1%).
| Industry | Male | Female |
| Agriculture, Fishing & Hunting | 40 (67.8%) | 19 (32.2%) |
| Mining, Quarrying, & Extraction | 0 (0.0%) | 0 (0.0%) |
| Construction | 177 (87.6%) | 25 (12.4%) |
| Manufacturing | 180 (69.2%) | 80 (30.8%) |
| Wholesale Trade | 74 (74.0%) | 26 (26.0%) |
| Retail Trade | 104 (55.6%) | 83 (44.4%) |
| Transportation & Warehousing | 117 (76.0%) | 37 (24.0%) |
| Utilities | 15 (71.4%) | 6 (28.6%) |
| Information | 18 (100.0%) | 0 (0.0%) |
| Finance & Insurance | 99 (77.9%) | 28 (22.1%) |
| Real Estate, Rental & Leasing | 23 (100.0%) | 0 (0.0%) |
| Professional & Scientific | 76 (65.5%) | 40 (34.5%) |
| Enterprise Management | 0 (0.0%) | 0 (0.0%) |
| Administrative & Support | 13 (30.9%) | 29 (69.1%) |
| Educational Services | 32 (18.4%) | 142 (81.6%) |
| Health Care & Social Assistance | 69 (21.3%) | 255 (78.7%) |
| Arts, Entertainment & Recreation | 0 (0.0%) | 0 (0.0%) |
| Accommodation & Food Services | 0 (0.0%) | 0 (0.0%) |
| Public Administration | 63 (76.8%) | 19 (23.2%) |
| Total | 1,121 (58.6%) | 793 (41.4%) |
Education in St Augusta
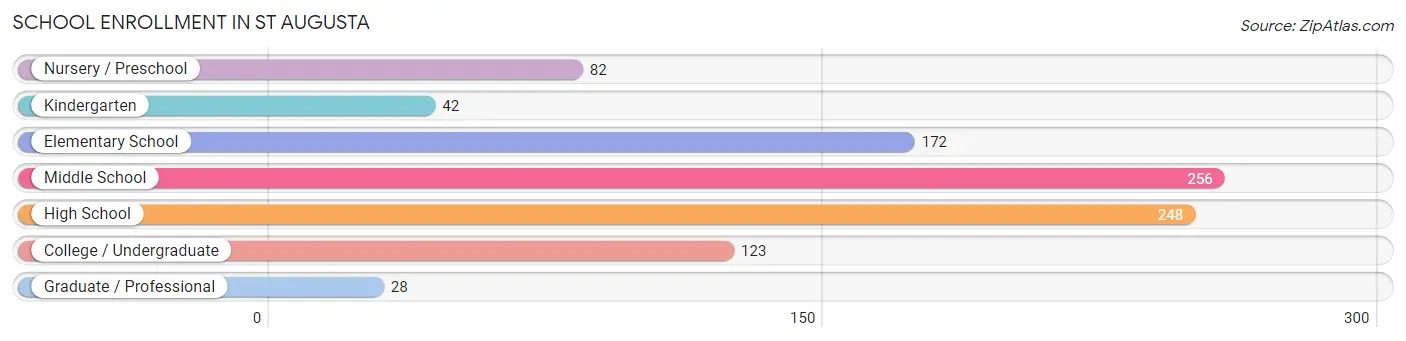
School Enrollment in St Augusta
The most common levels of schooling among the 951 students in St Augusta are middle school (256 | 26.9%), high school (248 | 26.1%), and elementary school (172 | 18.1%).
| School Level | # Students | % Students |
| Nursery / Preschool | 82 | 8.6% |
| Kindergarten | 42 | 4.4% |
| Elementary School | 172 | 18.1% |
| Middle School | 256 | 26.9% |
| High School | 248 | 26.1% |
| College / Undergraduate | 123 | 12.9% |
| Graduate / Professional | 28 | 2.9% |
| Total | 951 | 100.0% |
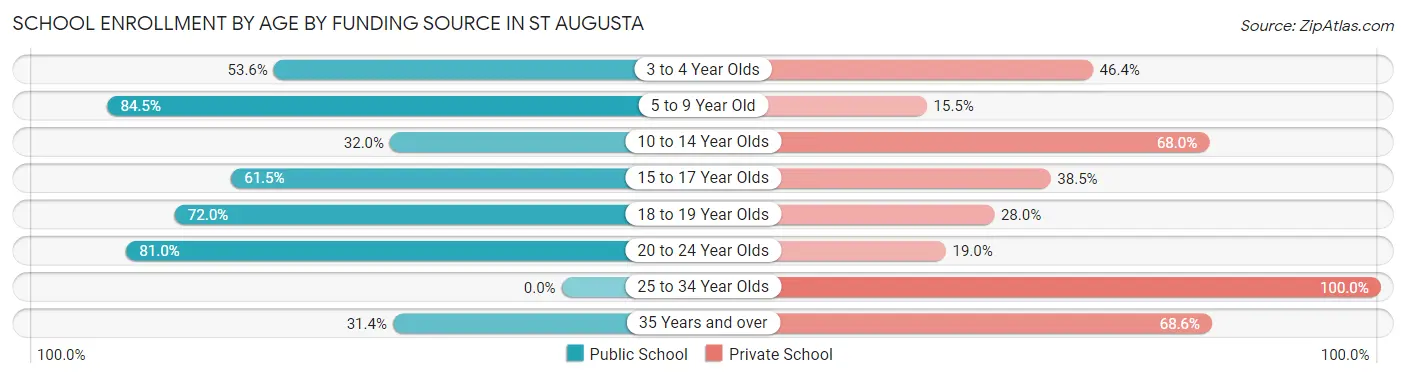
School Enrollment by Age by Funding Source in St Augusta
Out of a total of 951 students who are enrolled in schools in St Augusta, 409 (43.0%) attend a private institution, while the remaining 542 (57.0%) are enrolled in public schools. The age group of 25 to 34 year olds has the highest likelihood of being enrolled in private schools, with 17 (100.0% in the age bracket) enrolled. Conversely, the age group of 5 to 9 year old has the lowest likelihood of being enrolled in a private school, with 175 (84.5% in the age bracket) attending a public institution.
| Age Bracket | Public School | Private School |
| 3 to 4 Year Olds | 37 (53.6%) | 32 (46.4%) |
| 5 to 9 Year Old | 175 (84.5%) | 32 (15.5%) |
| 10 to 14 Year Olds | 93 (32.0%) | 198 (68.0%) |
| 15 to 17 Year Olds | 107 (61.5%) | 67 (38.5%) |
| 18 to 19 Year Olds | 72 (72.0%) | 28 (28.0%) |
| 20 to 24 Year Olds | 47 (81.0%) | 11 (19.0%) |
| 25 to 34 Year Olds | 0 (0.0%) | 17 (100.0%) |
| 35 Years and over | 11 (31.4%) | 24 (68.6%) |
| Total | 542 (57.0%) | 409 (43.0%) |
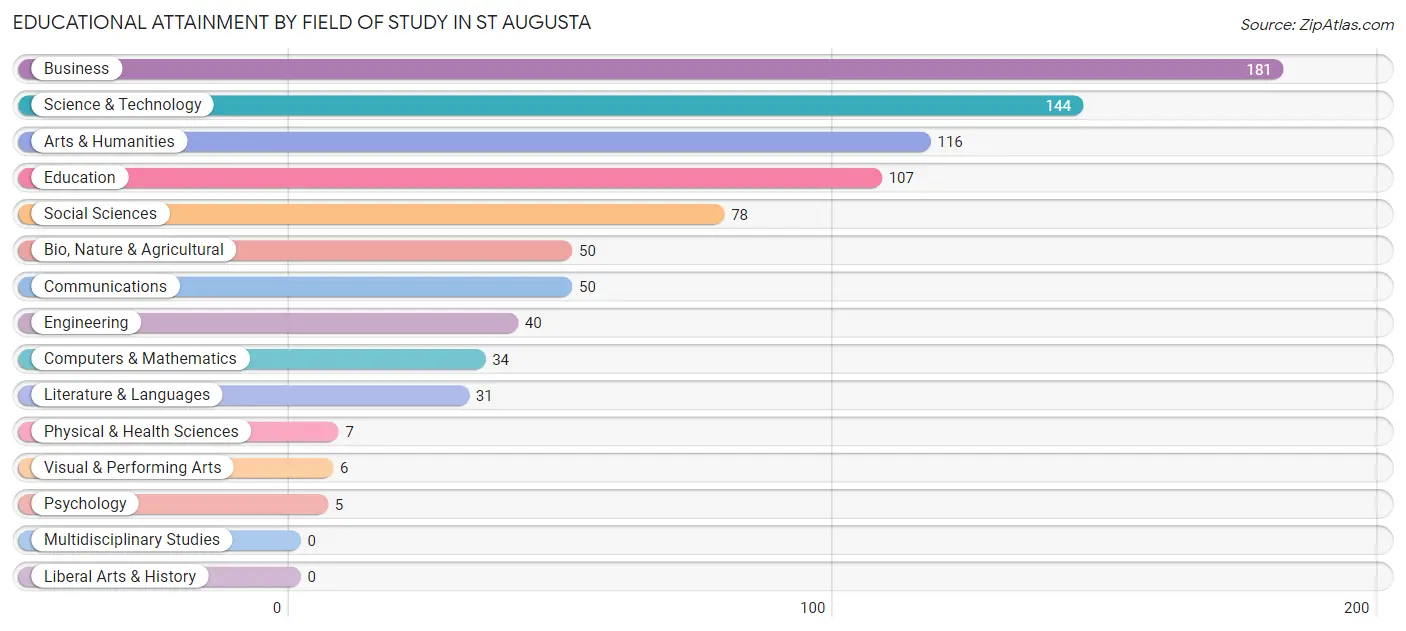
Educational Attainment by Field of Study in St Augusta
Business (181 | 21.3%), science & technology (144 | 17.0%), arts & humanities (116 | 13.7%), education (107 | 12.6%), and social sciences (78 | 9.2%) are the most common fields of study among 849 individuals in St Augusta who have obtained a bachelor's degree or higher.
| Field of Study | # Graduates | % Graduates |
| Computers & Mathematics | 34 | 4.0% |
| Bio, Nature & Agricultural | 50 | 5.9% |
| Physical & Health Sciences | 7 | 0.8% |
| Psychology | 5 | 0.6% |
| Social Sciences | 78 | 9.2% |
| Engineering | 40 | 4.7% |
| Multidisciplinary Studies | 0 | 0.0% |
| Science & Technology | 144 | 17.0% |
| Business | 181 | 21.3% |
| Education | 107 | 12.6% |
| Literature & Languages | 31 | 3.6% |
| Liberal Arts & History | 0 | 0.0% |
| Visual & Performing Arts | 6 | 0.7% |
| Communications | 50 | 5.9% |
| Arts & Humanities | 116 | 13.7% |
| Total | 849 | 100.0% |
Transportation & Commute in St Augusta
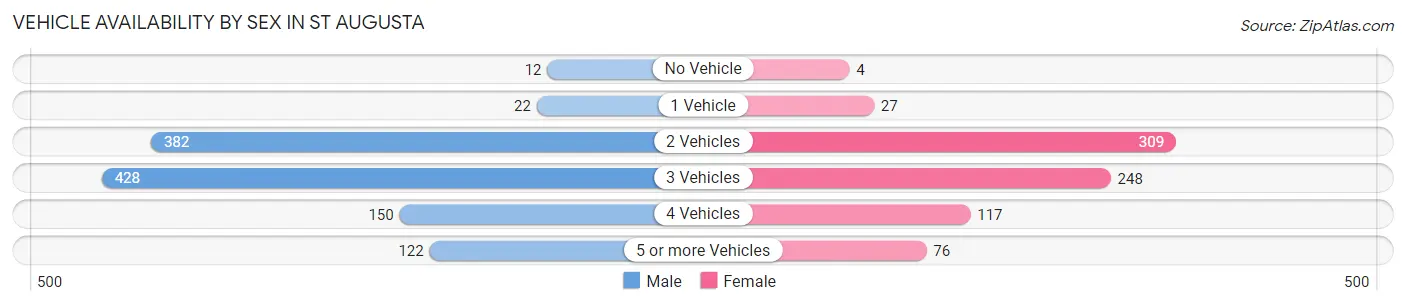
Vehicle Availability by Sex in St Augusta
The most prevalent vehicle ownership categories in St Augusta are males with 3 vehicles (428, accounting for 38.4%) and females with 3 vehicles (248, making up 54.8%).
| Vehicles Available | Male | Female |
| No Vehicle | 12 (1.1%) | 4 (0.5%) |
| 1 Vehicle | 22 (2.0%) | 27 (3.5%) |
| 2 Vehicles | 382 (34.2%) | 309 (39.6%) |
| 3 Vehicles | 428 (38.4%) | 248 (31.8%) |
| 4 Vehicles | 150 (13.4%) | 117 (15.0%) |
| 5 or more Vehicles | 122 (10.9%) | 76 (9.7%) |
| Total | 1,116 (100.0%) | 781 (100.0%) |
Commute Time in St Augusta
The most frequently occuring commute durations in St Augusta are 20 to 24 minutes (462 commuters, 26.6%), 15 to 19 minutes (322 commuters, 18.5%), and 10 to 14 minutes (227 commuters, 13.1%).
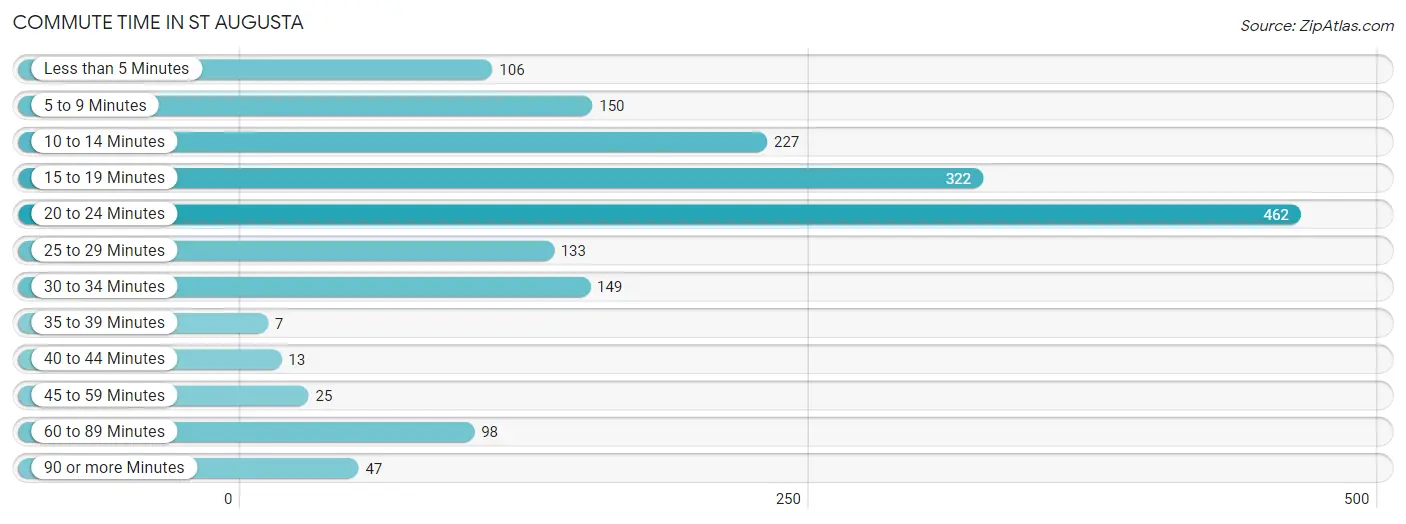
| Commute Time | # Commuters | % Commuters |
| Less than 5 Minutes | 106 | 6.1% |
| 5 to 9 Minutes | 150 | 8.6% |
| 10 to 14 Minutes | 227 | 13.1% |
| 15 to 19 Minutes | 322 | 18.5% |
| 20 to 24 Minutes | 462 | 26.6% |
| 25 to 29 Minutes | 133 | 7.6% |
| 30 to 34 Minutes | 149 | 8.6% |
| 35 to 39 Minutes | 7 | 0.4% |
| 40 to 44 Minutes | 13 | 0.7% |
| 45 to 59 Minutes | 25 | 1.4% |
| 60 to 89 Minutes | 98 | 5.6% |
| 90 or more Minutes | 47 | 2.7% |
Commute Time by Sex in St Augusta
The most common commute times in St Augusta are 20 to 24 minutes (237 commuters, 22.3%) for males and 20 to 24 minutes (225 commuters, 33.3%) for females.
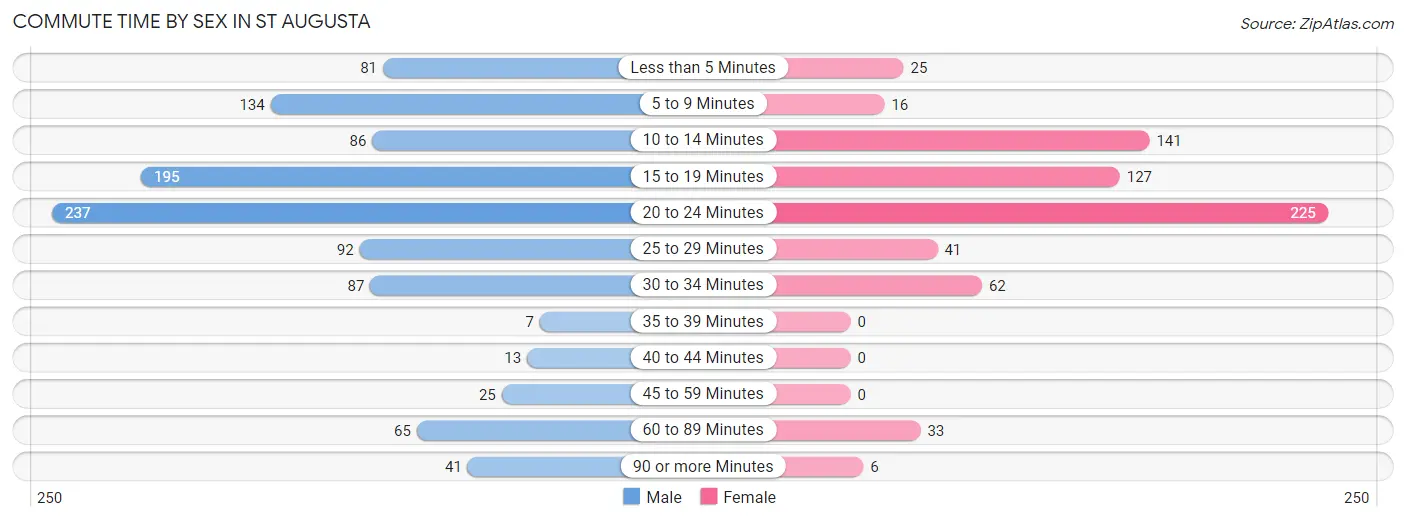
| Commute Time | Male | Female |
| Less than 5 Minutes | 81 (7.6%) | 25 (3.7%) |
| 5 to 9 Minutes | 134 (12.6%) | 16 (2.4%) |
| 10 to 14 Minutes | 86 (8.1%) | 141 (20.9%) |
| 15 to 19 Minutes | 195 (18.3%) | 127 (18.8%) |
| 20 to 24 Minutes | 237 (22.3%) | 225 (33.3%) |
| 25 to 29 Minutes | 92 (8.6%) | 41 (6.1%) |
| 30 to 34 Minutes | 87 (8.2%) | 62 (9.2%) |
| 35 to 39 Minutes | 7 (0.7%) | 0 (0.0%) |
| 40 to 44 Minutes | 13 (1.2%) | 0 (0.0%) |
| 45 to 59 Minutes | 25 (2.4%) | 0 (0.0%) |
| 60 to 89 Minutes | 65 (6.1%) | 33 (4.9%) |
| 90 or more Minutes | 41 (3.9%) | 6 (0.9%) |
Time of Departure to Work by Sex in St Augusta
The most frequent times of departure to work in St Augusta are 7:00 AM to 7:29 AM (188, 17.7%) for males and 7:30 AM to 7:59 AM (210, 31.1%) for females.
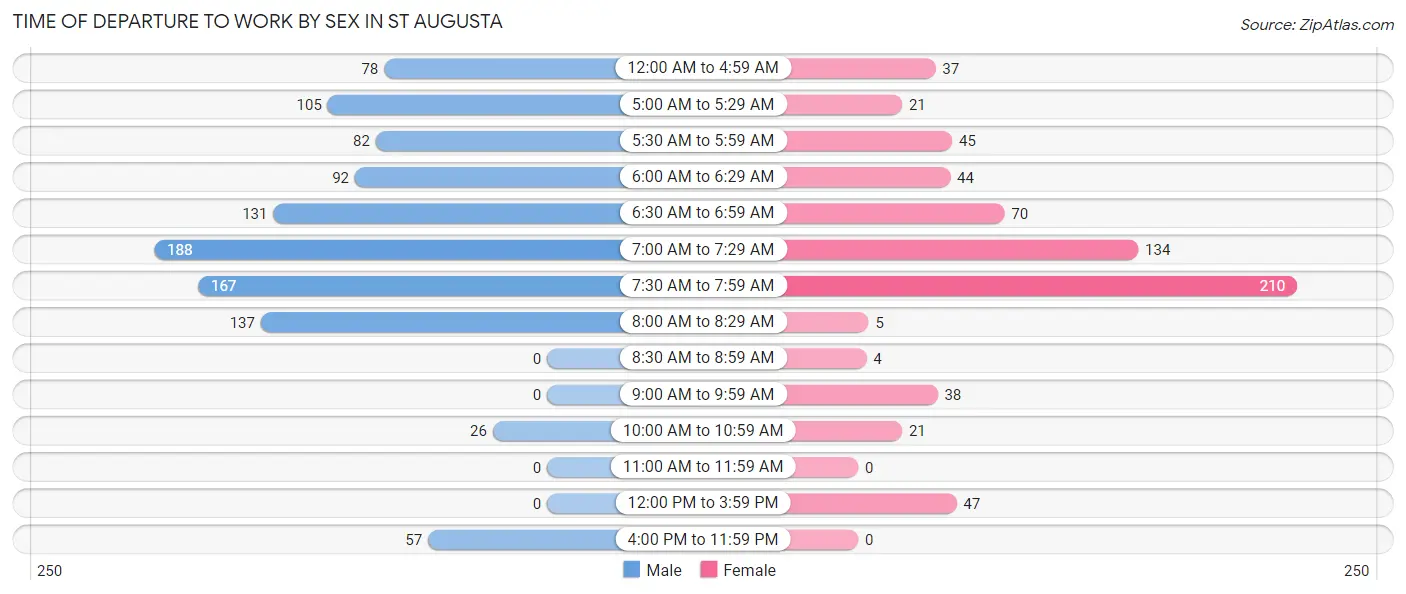
| Time of Departure | Male | Female |
| 12:00 AM to 4:59 AM | 78 (7.3%) | 37 (5.5%) |
| 5:00 AM to 5:29 AM | 105 (9.9%) | 21 (3.1%) |
| 5:30 AM to 5:59 AM | 82 (7.7%) | 45 (6.7%) |
| 6:00 AM to 6:29 AM | 92 (8.6%) | 44 (6.5%) |
| 6:30 AM to 6:59 AM | 131 (12.3%) | 70 (10.4%) |
| 7:00 AM to 7:29 AM | 188 (17.7%) | 134 (19.8%) |
| 7:30 AM to 7:59 AM | 167 (15.7%) | 210 (31.1%) |
| 8:00 AM to 8:29 AM | 137 (12.9%) | 5 (0.7%) |
| 8:30 AM to 8:59 AM | 0 (0.0%) | 4 (0.6%) |
| 9:00 AM to 9:59 AM | 0 (0.0%) | 38 (5.6%) |
| 10:00 AM to 10:59 AM | 26 (2.5%) | 21 (3.1%) |
| 11:00 AM to 11:59 AM | 0 (0.0%) | 0 (0.0%) |
| 12:00 PM to 3:59 PM | 0 (0.0%) | 47 (7.0%) |
| 4:00 PM to 11:59 PM | 57 (5.4%) | 0 (0.0%) |
| Total | 1,063 (100.0%) | 676 (100.0%) |
Housing Occupancy in St Augusta
Occupancy by Ownership in St Augusta
Of the total 1,116 dwellings in St Augusta, owner-occupied units account for 1,036 (92.8%), while renter-occupied units make up 80 (7.2%).
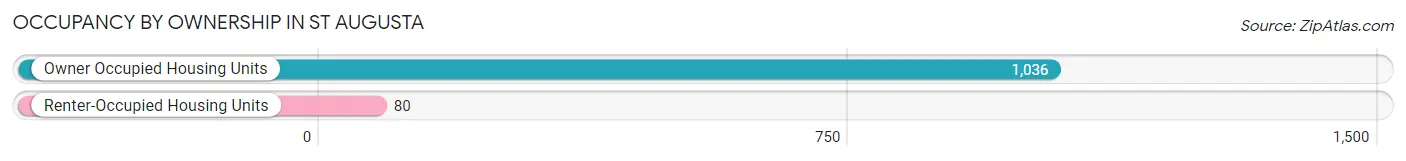
| Occupancy | # Housing Units | % Housing Units |
| Owner Occupied Housing Units | 1,036 | 92.8% |
| Renter-Occupied Housing Units | 80 | 7.2% |
| Total Occupied Housing Units | 1,116 | 100.0% |
Occupancy by Household Size in St Augusta
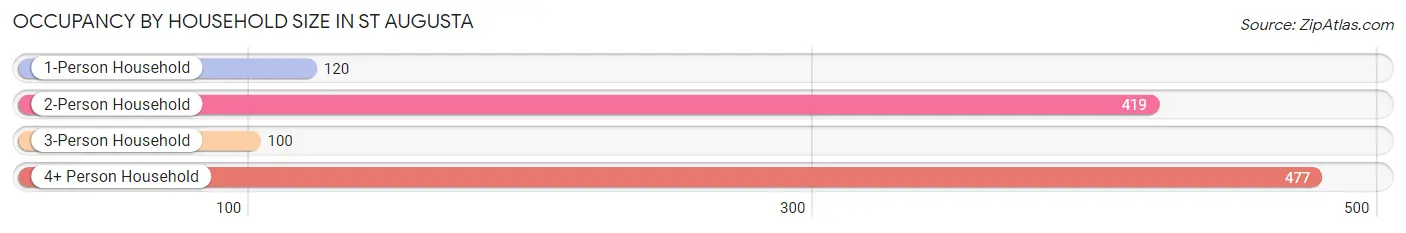
| Household Size | # Housing Units | % Housing Units |
| 1-Person Household | 120 | 10.7% |
| 2-Person Household | 419 | 37.5% |
| 3-Person Household | 100 | 9.0% |
| 4+ Person Household | 477 | 42.7% |
| Total Housing Units | 1,116 | 100.0% |
Occupancy by Ownership by Household Size in St Augusta
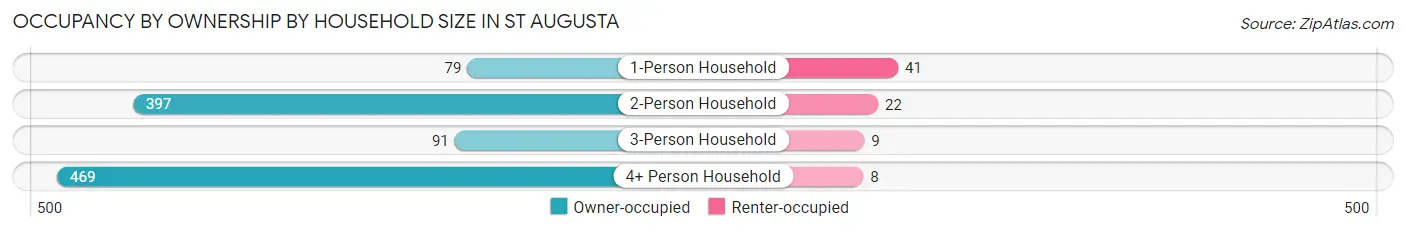
| Household Size | Owner-occupied | Renter-occupied |
| 1-Person Household | 79 (65.8%) | 41 (34.2%) |
| 2-Person Household | 397 (94.8%) | 22 (5.2%) |
| 3-Person Household | 91 (91.0%) | 9 (9.0%) |
| 4+ Person Household | 469 (98.3%) | 8 (1.7%) |
| Total Housing Units | 1,036 (92.8%) | 80 (7.2%) |
Occupancy by Educational Attainment in St Augusta
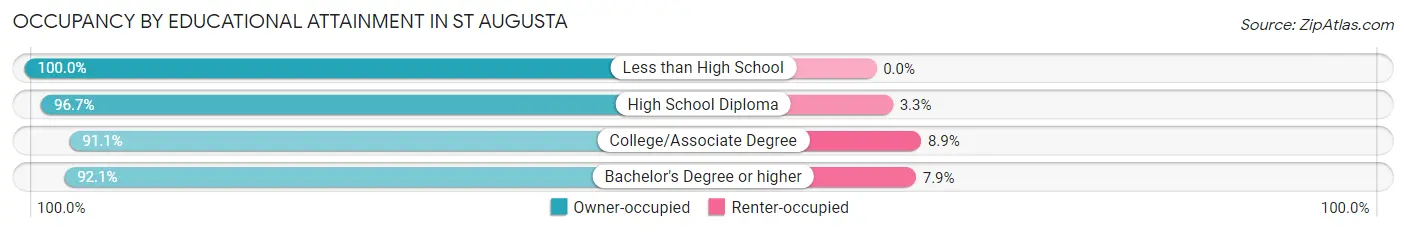
| Household Size | Owner-occupied | Renter-occupied |
| Less than High School | 7 (100.0%) | 0 (0.0%) |
| High School Diploma | 236 (96.7%) | 8 (3.3%) |
| College/Associate Degree | 359 (91.1%) | 35 (8.9%) |
| Bachelor's Degree or higher | 434 (92.1%) | 37 (7.9%) |
Occupancy by Age of Householder in St Augusta
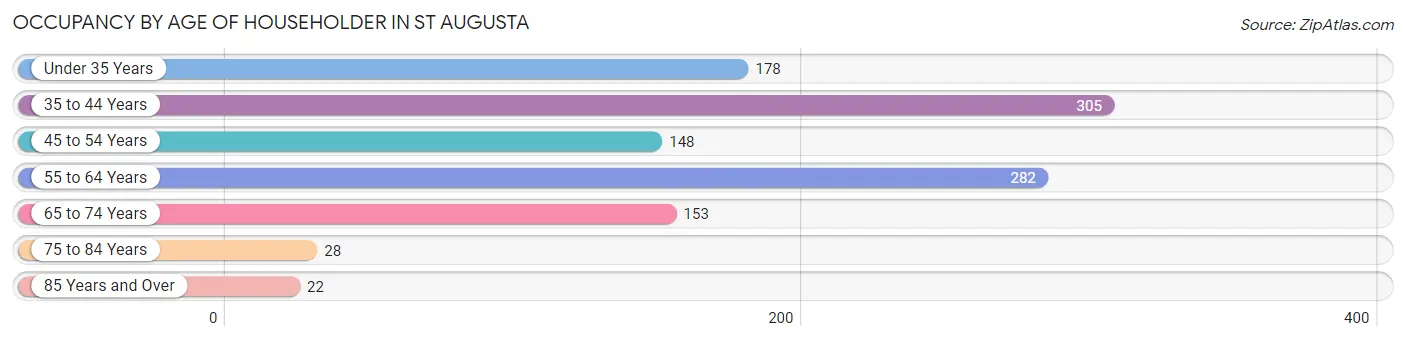
| Age Bracket | # Households | % Households |
| Under 35 Years | 178 | 16.0% |
| 35 to 44 Years | 305 | 27.3% |
| 45 to 54 Years | 148 | 13.3% |
| 55 to 64 Years | 282 | 25.3% |
| 65 to 74 Years | 153 | 13.7% |
| 75 to 84 Years | 28 | 2.5% |
| 85 Years and Over | 22 | 2.0% |
| Total | 1,116 | 100.0% |
Housing Finances in St Augusta
Median Income by Occupancy in St Augusta
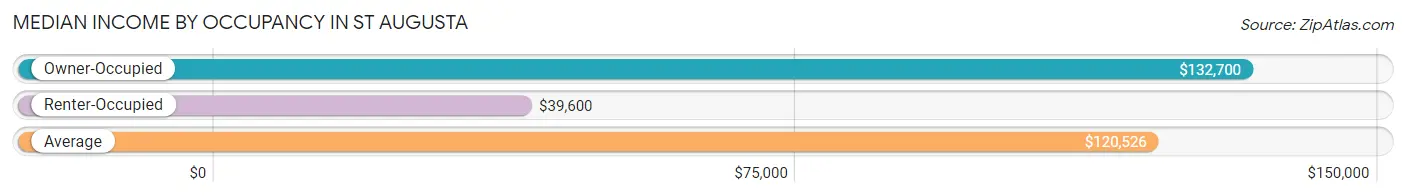
| Occupancy Type | # Households | Median Income |
| Owner-Occupied | 1,036 (92.8%) | $132,700 |
| Renter-Occupied | 80 (7.2%) | $39,600 |
| Average | 1,116 (100.0%) | $120,526 |
Occupancy by Householder Income Bracket in St Augusta
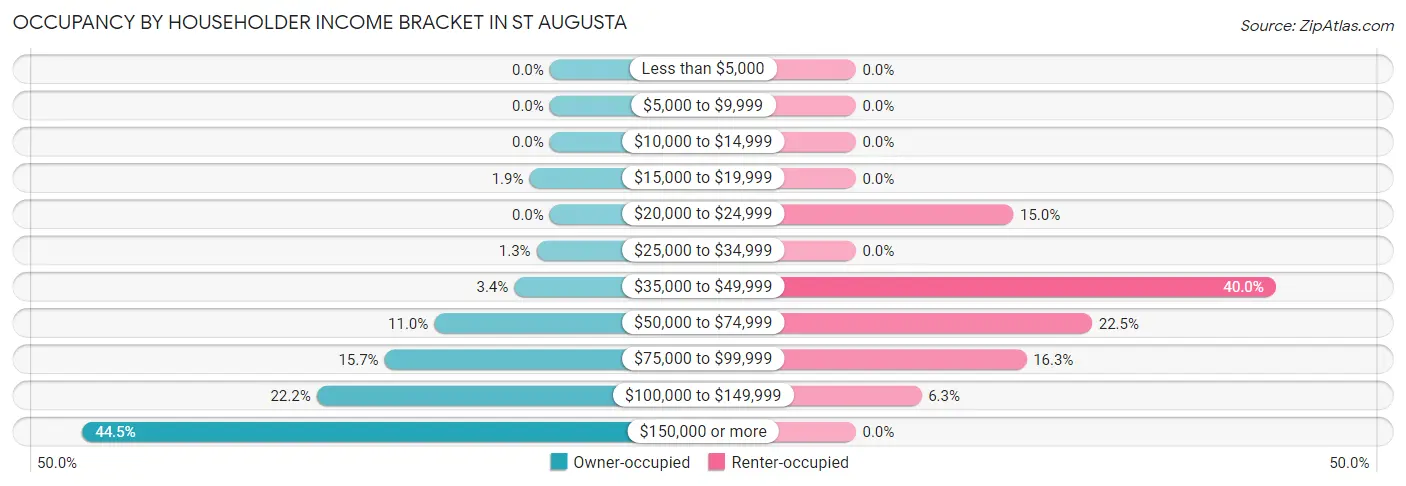
| Income Bracket | Owner-occupied | Renter-occupied |
| Less than $5,000 | 0 (0.0%) | 0 (0.0%) |
| $5,000 to $9,999 | 0 (0.0%) | 0 (0.0%) |
| $10,000 to $14,999 | 0 (0.0%) | 0 (0.0%) |
| $15,000 to $19,999 | 20 (1.9%) | 0 (0.0%) |
| $20,000 to $24,999 | 0 (0.0%) | 12 (15.0%) |
| $25,000 to $34,999 | 13 (1.3%) | 0 (0.0%) |
| $35,000 to $49,999 | 35 (3.4%) | 32 (40.0%) |
| $50,000 to $74,999 | 114 (11.0%) | 18 (22.5%) |
| $75,000 to $99,999 | 163 (15.7%) | 13 (16.3%) |
| $100,000 to $149,999 | 230 (22.2%) | 5 (6.2%) |
| $150,000 or more | 461 (44.5%) | 0 (0.0%) |
| Total | 1,036 (100.0%) | 80 (100.0%) |
Monthly Housing Cost Tiers in St Augusta
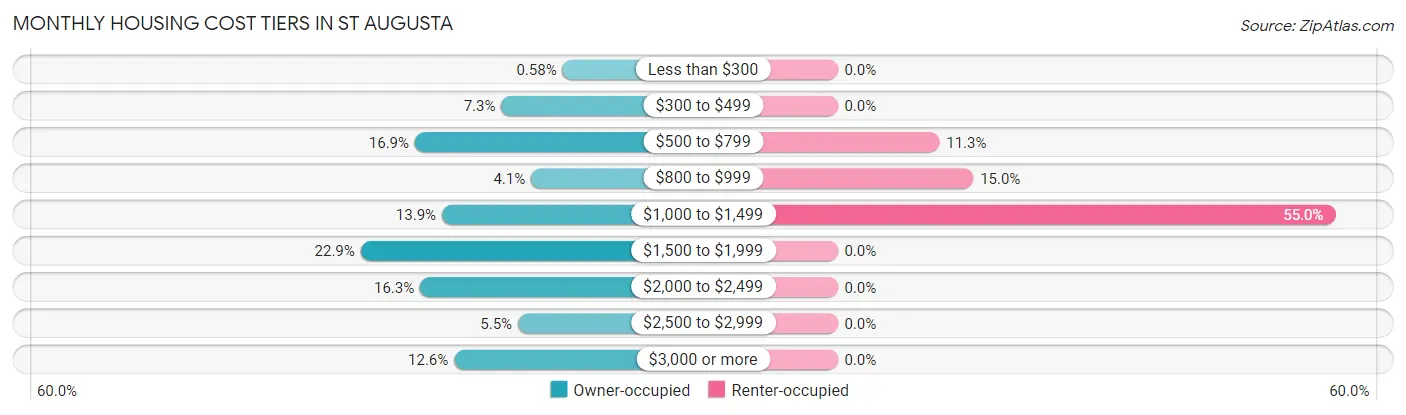
| Monthly Cost | Owner-occupied | Renter-occupied |
| Less than $300 | 6 (0.6%) | 0 (0.0%) |
| $300 to $499 | 76 (7.3%) | 0 (0.0%) |
| $500 to $799 | 175 (16.9%) | 9 (11.3%) |
| $800 to $999 | 42 (4.1%) | 12 (15.0%) |
| $1,000 to $1,499 | 144 (13.9%) | 44 (55.0%) |
| $1,500 to $1,999 | 237 (22.9%) | 0 (0.0%) |
| $2,000 to $2,499 | 169 (16.3%) | 0 (0.0%) |
| $2,500 to $2,999 | 57 (5.5%) | 0 (0.0%) |
| $3,000 or more | 130 (12.6%) | 0 (0.0%) |
| Total | 1,036 (100.0%) | 80 (100.0%) |
Physical Housing Characteristics in St Augusta
Housing Structures in St Augusta
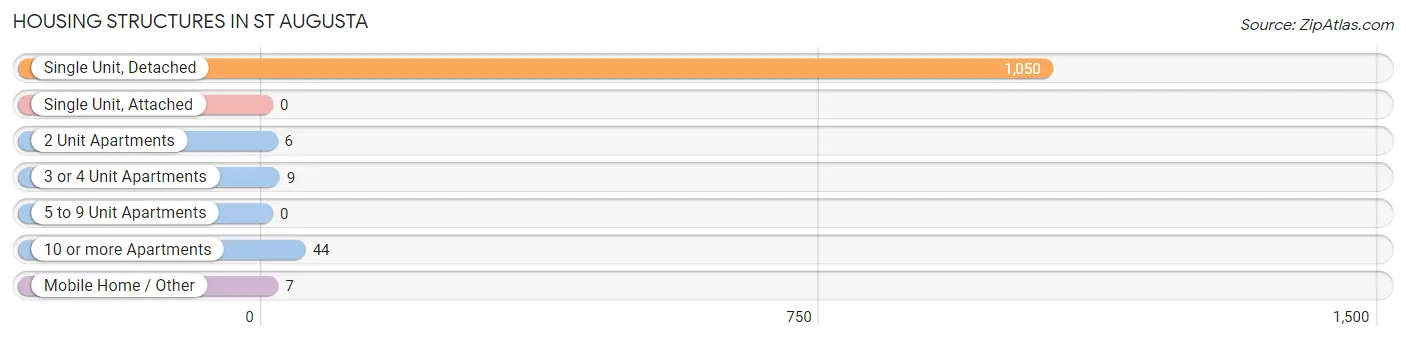
| Structure Type | # Housing Units | % Housing Units |
| Single Unit, Detached | 1,050 | 94.1% |
| Single Unit, Attached | 0 | 0.0% |
| 2 Unit Apartments | 6 | 0.5% |
| 3 or 4 Unit Apartments | 9 | 0.8% |
| 5 to 9 Unit Apartments | 0 | 0.0% |
| 10 or more Apartments | 44 | 3.9% |
| Mobile Home / Other | 7 | 0.6% |
| Total | 1,116 | 100.0% |
Housing Structures by Occupancy in St Augusta
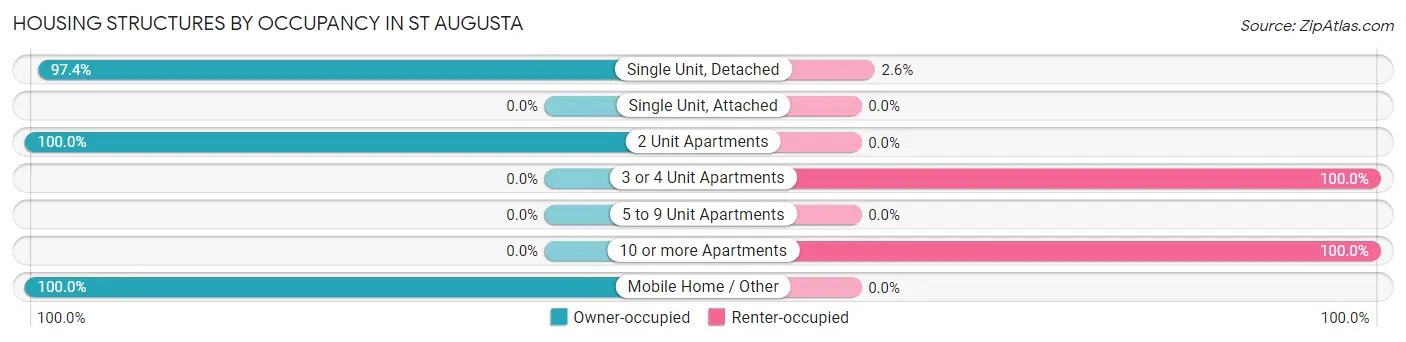
| Structure Type | Owner-occupied | Renter-occupied |
| Single Unit, Detached | 1,023 (97.4%) | 27 (2.6%) |
| Single Unit, Attached | 0 (0.0%) | 0 (0.0%) |
| 2 Unit Apartments | 6 (100.0%) | 0 (0.0%) |
| 3 or 4 Unit Apartments | 0 (0.0%) | 9 (100.0%) |
| 5 to 9 Unit Apartments | 0 (0.0%) | 0 (0.0%) |
| 10 or more Apartments | 0 (0.0%) | 44 (100.0%) |
| Mobile Home / Other | 7 (100.0%) | 0 (0.0%) |
| Total | 1,036 (92.8%) | 80 (7.2%) |
Housing Structures by Number of Rooms in St Augusta
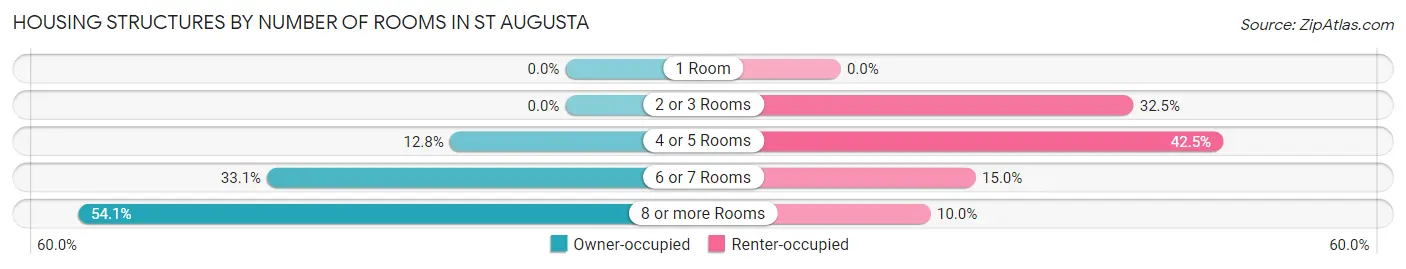
| Number of Rooms | Owner-occupied | Renter-occupied |
| 1 Room | 0 (0.0%) | 0 (0.0%) |
| 2 or 3 Rooms | 0 (0.0%) | 26 (32.5%) |
| 4 or 5 Rooms | 133 (12.8%) | 34 (42.5%) |
| 6 or 7 Rooms | 343 (33.1%) | 12 (15.0%) |
| 8 or more Rooms | 560 (54.0%) | 8 (10.0%) |
| Total | 1,036 (100.0%) | 80 (100.0%) |
Housing Structure by Heating Type in St Augusta
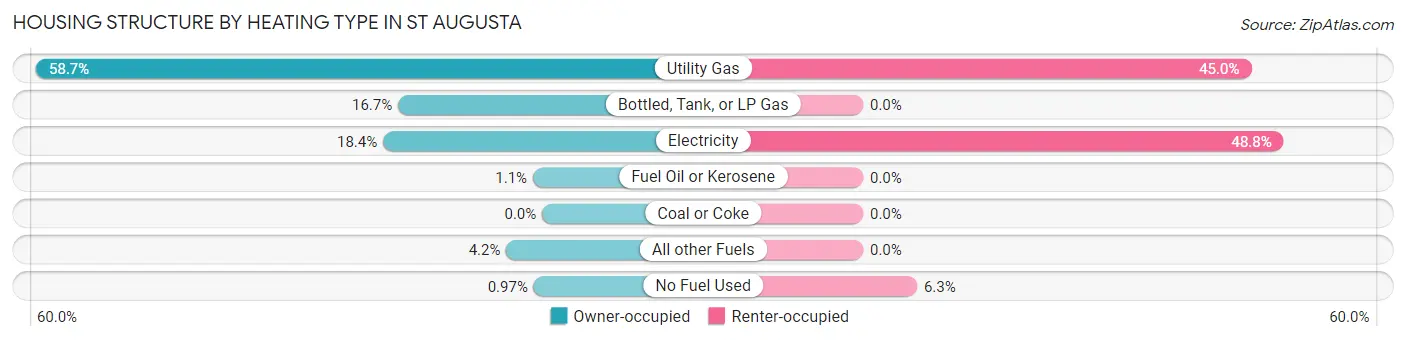
| Heating Type | Owner-occupied | Renter-occupied |
| Utility Gas | 608 (58.7%) | 36 (45.0%) |
| Bottled, Tank, or LP Gas | 173 (16.7%) | 0 (0.0%) |
| Electricity | 191 (18.4%) | 39 (48.7%) |
| Fuel Oil or Kerosene | 11 (1.1%) | 0 (0.0%) |
| Coal or Coke | 0 (0.0%) | 0 (0.0%) |
| All other Fuels | 43 (4.2%) | 0 (0.0%) |
| No Fuel Used | 10 (1.0%) | 5 (6.2%) |
| Total | 1,036 (100.0%) | 80 (100.0%) |
Household Vehicle Usage in St Augusta
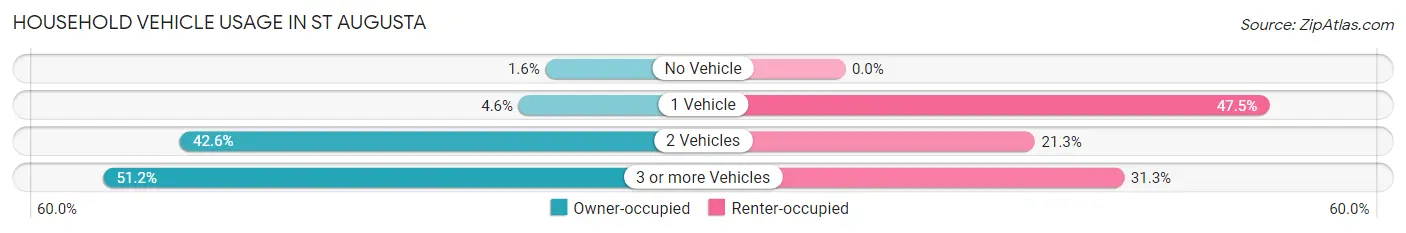
| Vehicles per Household | Owner-occupied | Renter-occupied |
| No Vehicle | 17 (1.6%) | 0 (0.0%) |
| 1 Vehicle | 48 (4.6%) | 38 (47.5%) |
| 2 Vehicles | 441 (42.6%) | 17 (21.2%) |
| 3 or more Vehicles | 530 (51.2%) | 25 (31.2%) |
| Total | 1,036 (100.0%) | 80 (100.0%) |
Real Estate & Mortgages in St Augusta
Real Estate and Mortgage Overview in St Augusta
| Characteristic | Without Mortgage | With Mortgage |
| Housing Units | 317 | 719 |
| Median Property Value | $280,900 | $343,400 |
| Median Household Income | $94,219 | $376 |
| Monthly Housing Costs | $620 | $130 |
| Real Estate Taxes | $2,661 | $14 |
Property Value by Mortgage Status in St Augusta
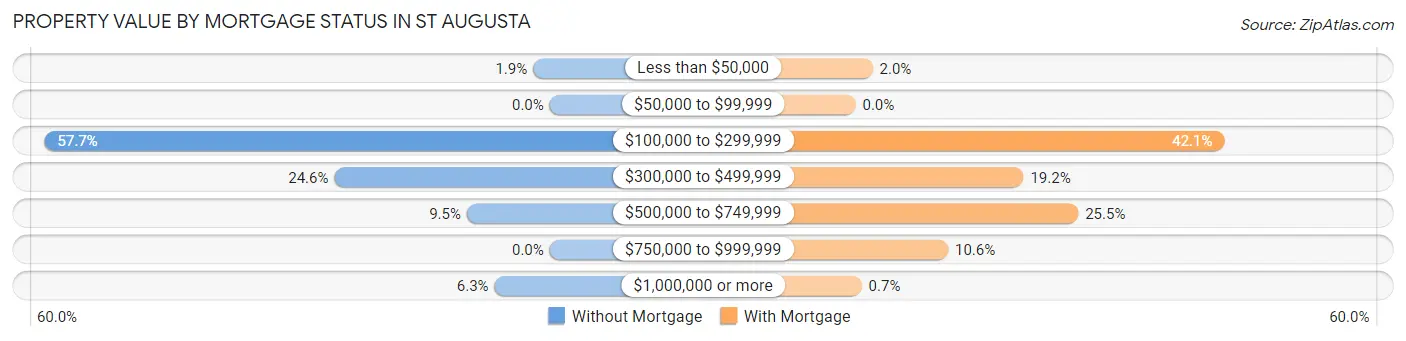
| Property Value | Without Mortgage | With Mortgage |
| Less than $50,000 | 6 (1.9%) | 14 (1.9%) |
| $50,000 to $99,999 | 0 (0.0%) | 0 (0.0%) |
| $100,000 to $299,999 | 183 (57.7%) | 303 (42.1%) |
| $300,000 to $499,999 | 78 (24.6%) | 138 (19.2%) |
| $500,000 to $749,999 | 30 (9.5%) | 183 (25.5%) |
| $750,000 to $999,999 | 0 (0.0%) | 76 (10.6%) |
| $1,000,000 or more | 20 (6.3%) | 5 (0.7%) |
| Total | 317 (100.0%) | 719 (100.0%) |
Household Income by Mortgage Status in St Augusta
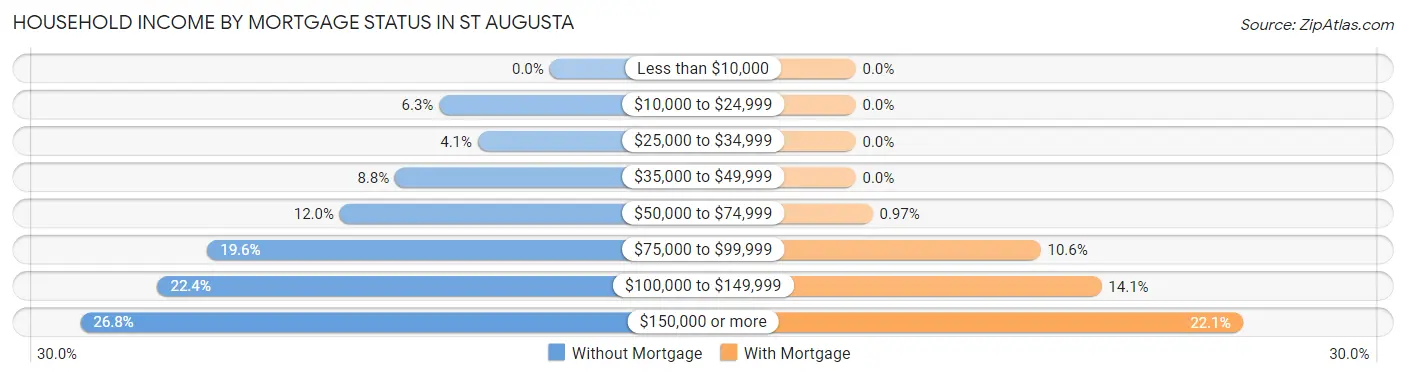
| Household Income | Without Mortgage | With Mortgage |
| Less than $10,000 | 0 (0.0%) | 0 (0.0%) |
| $10,000 to $24,999 | 20 (6.3%) | 0 (0.0%) |
| $25,000 to $34,999 | 13 (4.1%) | 0 (0.0%) |
| $35,000 to $49,999 | 28 (8.8%) | 0 (0.0%) |
| $50,000 to $74,999 | 38 (12.0%) | 7 (1.0%) |
| $75,000 to $99,999 | 62 (19.6%) | 76 (10.6%) |
| $100,000 to $149,999 | 71 (22.4%) | 101 (14.1%) |
| $150,000 or more | 85 (26.8%) | 159 (22.1%) |
| Total | 317 (100.0%) | 719 (100.0%) |
Property Value to Household Income Ratio in St Augusta
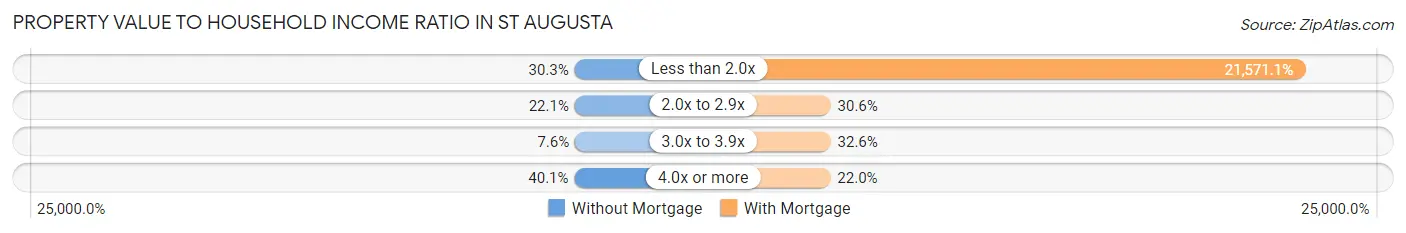
| Value-to-Income Ratio | Without Mortgage | With Mortgage |
| Less than 2.0x | 96 (30.3%) | 155,096 (21,571.1%) |
| 2.0x to 2.9x | 70 (22.1%) | 220 (30.6%) |
| 3.0x to 3.9x | 24 (7.6%) | 234 (32.6%) |
| 4.0x or more | 127 (40.1%) | 158 (22.0%) |
| Total | 317 (100.0%) | 719 (100.0%) |
Real Estate Taxes by Mortgage Status in St Augusta
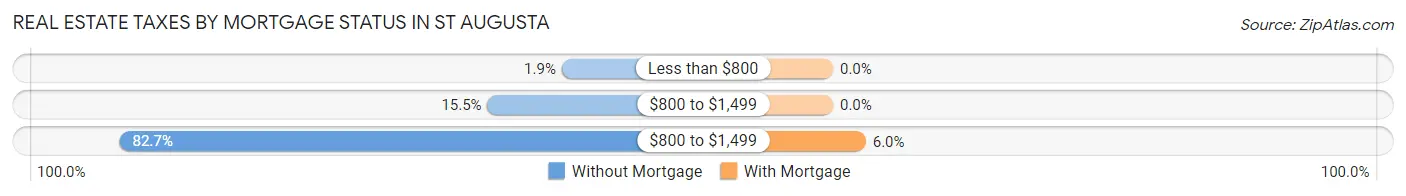
| Property Taxes | Without Mortgage | With Mortgage |
| Less than $800 | 6 (1.9%) | 0 (0.0%) |
| $800 to $1,499 | 49 (15.5%) | 0 (0.0%) |
| $800 to $1,499 | 262 (82.7%) | 43 (6.0%) |
| Total | 317 (100.0%) | 719 (100.0%) |
Health & Disability in St Augusta
Health Insurance Coverage by Age in St Augusta

| Age Bracket | With Coverage | Without Coverage |
| Under 6 Years | 348 (100.0%) | 0 (0.0%) |
| 6 to 18 Years | 762 (100.0%) | 0 (0.0%) |
| 19 to 25 Years | 271 (96.8%) | 9 (3.2%) |
| 26 to 34 Years | 287 (97.6%) | 7 (2.4%) |
| 35 to 44 Years | 604 (89.1%) | 74 (10.9%) |
| 45 to 54 Years | 361 (98.1%) | 7 (1.9%) |
| 55 to 64 Years | 421 (98.6%) | 6 (1.4%) |
| 65 to 74 Years | 272 (100.0%) | 0 (0.0%) |
| 75 Years and older | 86 (100.0%) | 0 (0.0%) |
| Total | 3,412 (97.1%) | 103 (2.9%) |
Health Insurance Coverage by Citizenship Status in St Augusta
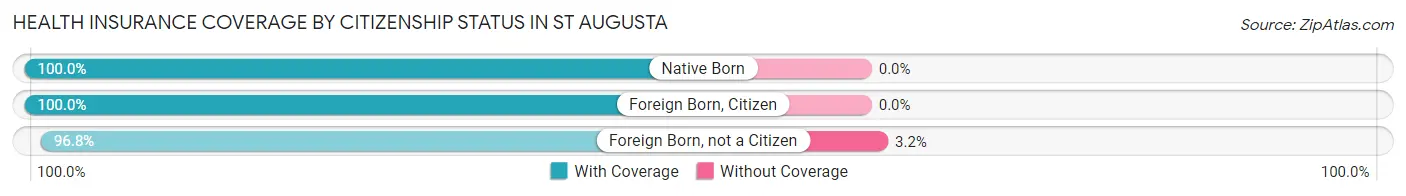
| Citizenship Status | With Coverage | Without Coverage |
| Native Born | 348 (100.0%) | 0 (0.0%) |
| Foreign Born, Citizen | 762 (100.0%) | 0 (0.0%) |
| Foreign Born, not a Citizen | 271 (96.8%) | 9 (3.2%) |
Health Insurance Coverage by Household Income in St Augusta
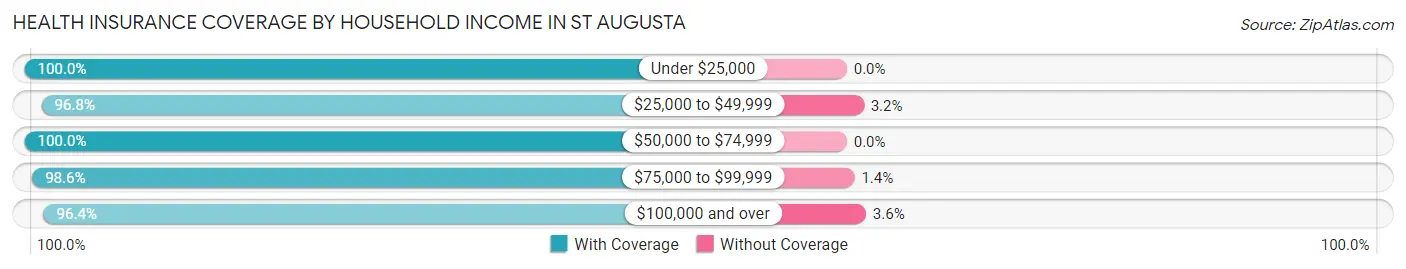
| Household Income | With Coverage | Without Coverage |
| Under $25,000 | 41 (100.0%) | 0 (0.0%) |
| $25,000 to $49,999 | 214 (96.8%) | 7 (3.2%) |
| $50,000 to $74,999 | 318 (100.0%) | 0 (0.0%) |
| $75,000 to $99,999 | 411 (98.6%) | 6 (1.4%) |
| $100,000 and over | 2,421 (96.4%) | 90 (3.6%) |
Public vs Private Health Insurance Coverage by Age in St Augusta
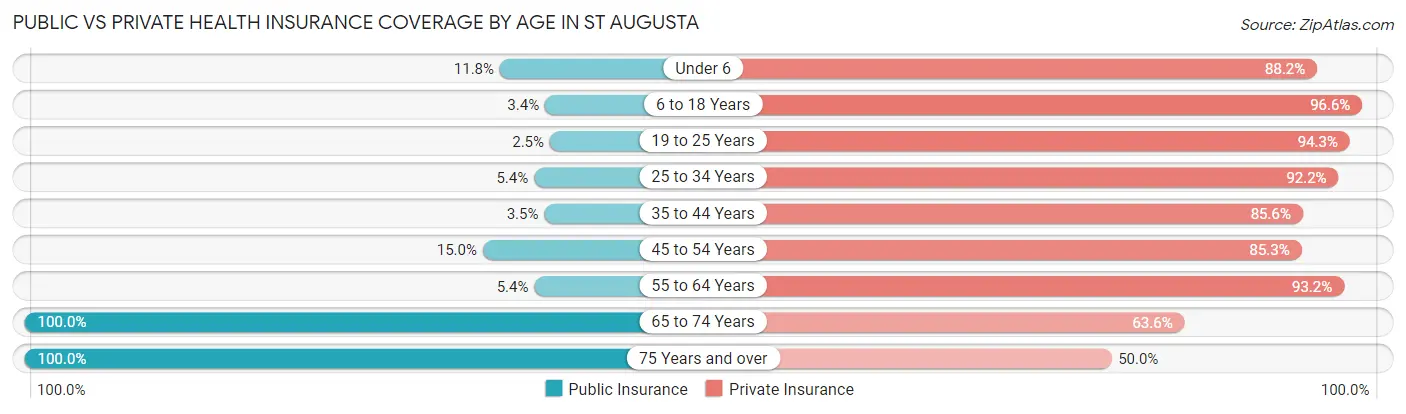
| Age Bracket | Public Insurance | Private Insurance |
| Under 6 | 41 (11.8%) | 307 (88.2%) |
| 6 to 18 Years | 26 (3.4%) | 736 (96.6%) |
| 19 to 25 Years | 7 (2.5%) | 264 (94.3%) |
| 25 to 34 Years | 16 (5.4%) | 271 (92.2%) |
| 35 to 44 Years | 24 (3.5%) | 580 (85.6%) |
| 45 to 54 Years | 55 (14.9%) | 314 (85.3%) |
| 55 to 64 Years | 23 (5.4%) | 398 (93.2%) |
| 65 to 74 Years | 272 (100.0%) | 173 (63.6%) |
| 75 Years and over | 86 (100.0%) | 43 (50.0%) |
| Total | 550 (15.7%) | 3,086 (87.8%) |
Disability Status by Sex by Age in St Augusta
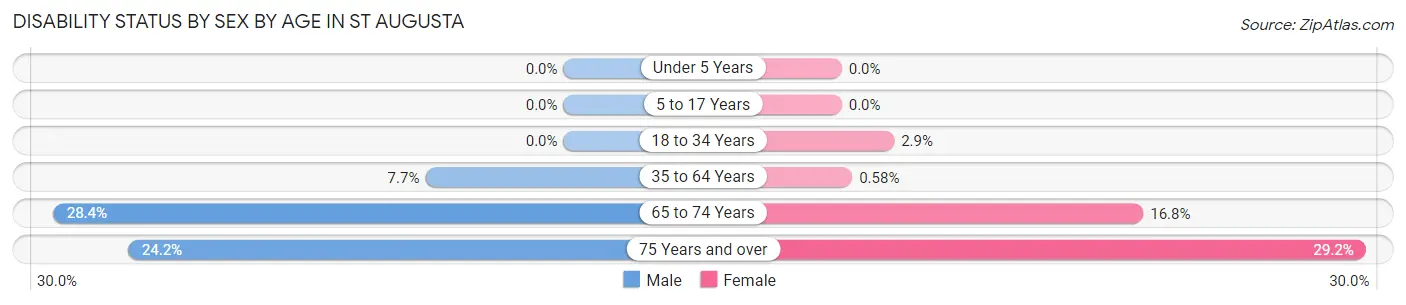
| Age Bracket | Male | Female |
| Under 5 Years | 0 (0.0%) | 0 (0.0%) |
| 5 to 17 Years | 0 (0.0%) | 0 (0.0%) |
| 18 to 34 Years | 0 (0.0%) | 8 (2.9%) |
| 35 to 64 Years | 60 (7.7%) | 4 (0.6%) |
| 65 to 74 Years | 40 (28.4%) | 22 (16.8%) |
| 75 Years and over | 15 (24.2%) | 7 (29.2%) |
Disability Class by Sex by Age in St Augusta
Disability Class: Hearing Difficulty
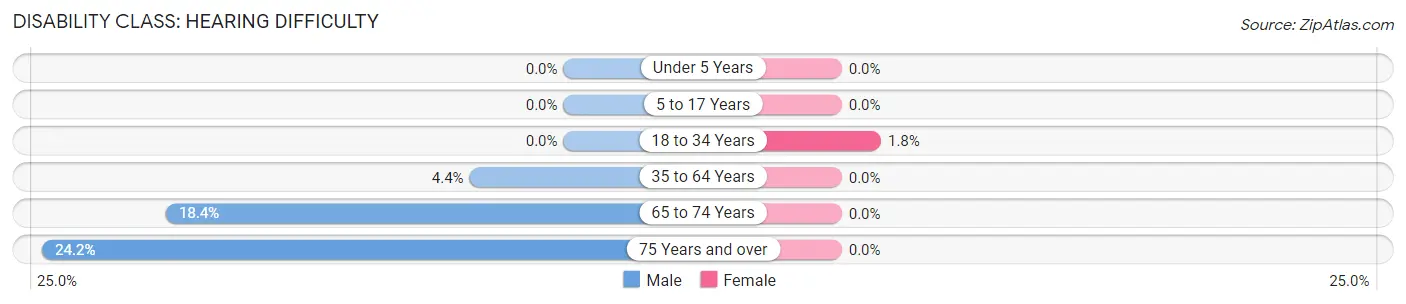
| Age Bracket | Male | Female |
| Under 5 Years | 0 (0.0%) | 0 (0.0%) |
| 5 to 17 Years | 0 (0.0%) | 0 (0.0%) |
| 18 to 34 Years | 0 (0.0%) | 5 (1.8%) |
| 35 to 64 Years | 34 (4.4%) | 0 (0.0%) |
| 65 to 74 Years | 26 (18.4%) | 0 (0.0%) |
| 75 Years and over | 15 (24.2%) | 0 (0.0%) |
Disability Class: Vision Difficulty
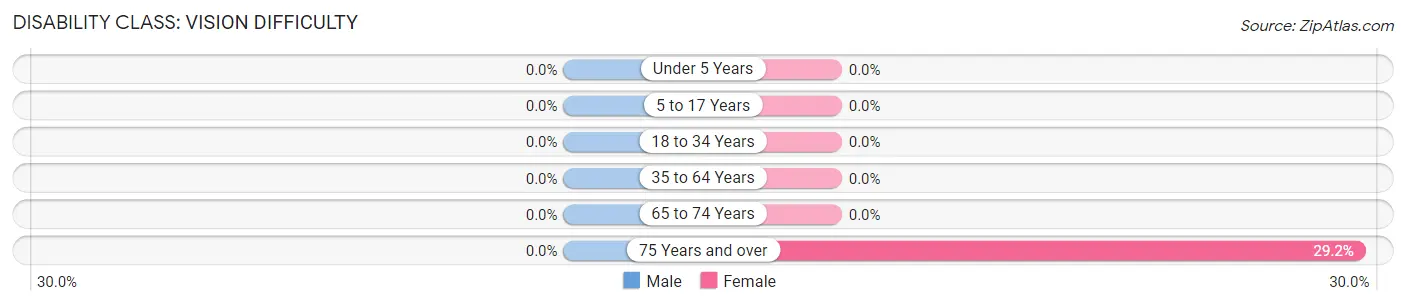
| Age Bracket | Male | Female |
| Under 5 Years | 0 (0.0%) | 0 (0.0%) |
| 5 to 17 Years | 0 (0.0%) | 0 (0.0%) |
| 18 to 34 Years | 0 (0.0%) | 0 (0.0%) |
| 35 to 64 Years | 0 (0.0%) | 0 (0.0%) |
| 65 to 74 Years | 0 (0.0%) | 0 (0.0%) |
| 75 Years and over | 0 (0.0%) | 7 (29.2%) |
Disability Class: Cognitive Difficulty
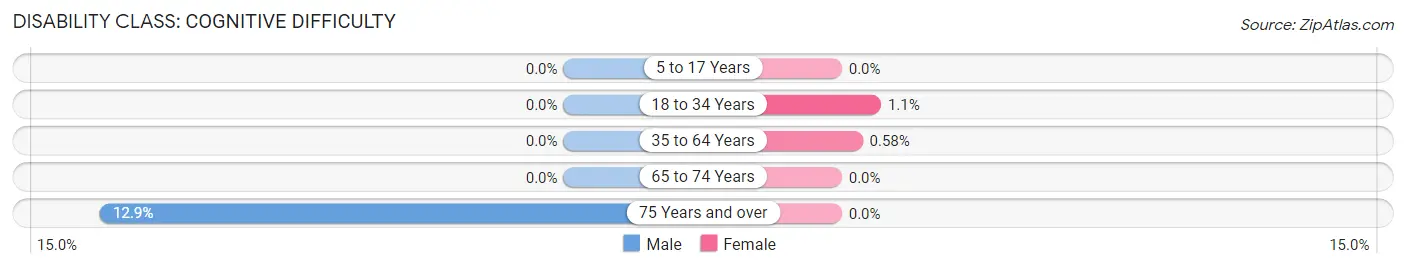
| Age Bracket | Male | Female |
| 5 to 17 Years | 0 (0.0%) | 0 (0.0%) |
| 18 to 34 Years | 0 (0.0%) | 3 (1.1%) |
| 35 to 64 Years | 0 (0.0%) | 4 (0.6%) |
| 65 to 74 Years | 0 (0.0%) | 0 (0.0%) |
| 75 Years and over | 8 (12.9%) | 0 (0.0%) |
Disability Class: Ambulatory Difficulty
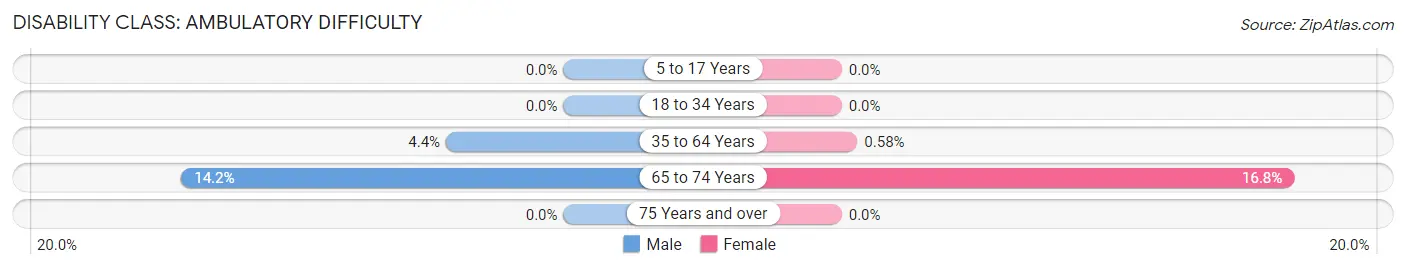
| Age Bracket | Male | Female |
| 5 to 17 Years | 0 (0.0%) | 0 (0.0%) |
| 18 to 34 Years | 0 (0.0%) | 0 (0.0%) |
| 35 to 64 Years | 34 (4.4%) | 4 (0.6%) |
| 65 to 74 Years | 20 (14.2%) | 22 (16.8%) |
| 75 Years and over | 0 (0.0%) | 0 (0.0%) |
Disability Class: Self-Care Difficulty
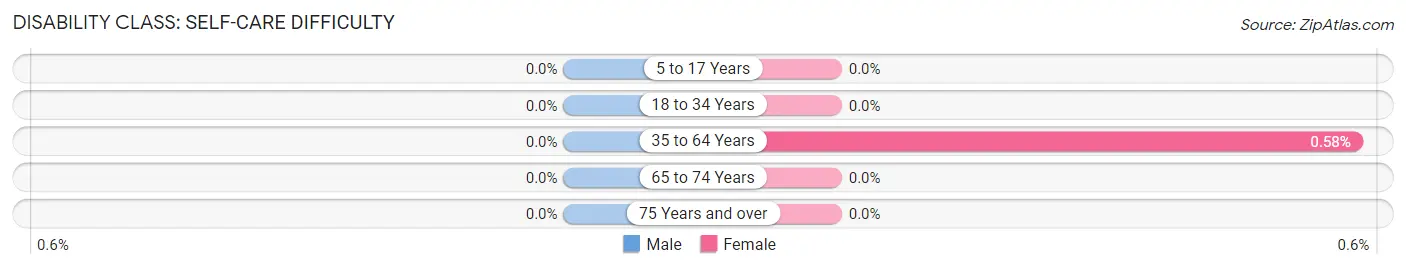
| Age Bracket | Male | Female |
| 5 to 17 Years | 0 (0.0%) | 0 (0.0%) |
| 18 to 34 Years | 0 (0.0%) | 0 (0.0%) |
| 35 to 64 Years | 0 (0.0%) | 4 (0.6%) |
| 65 to 74 Years | 0 (0.0%) | 0 (0.0%) |
| 75 Years and over | 0 (0.0%) | 0 (0.0%) |
Technology Access in St Augusta
Computing Device Access in St Augusta
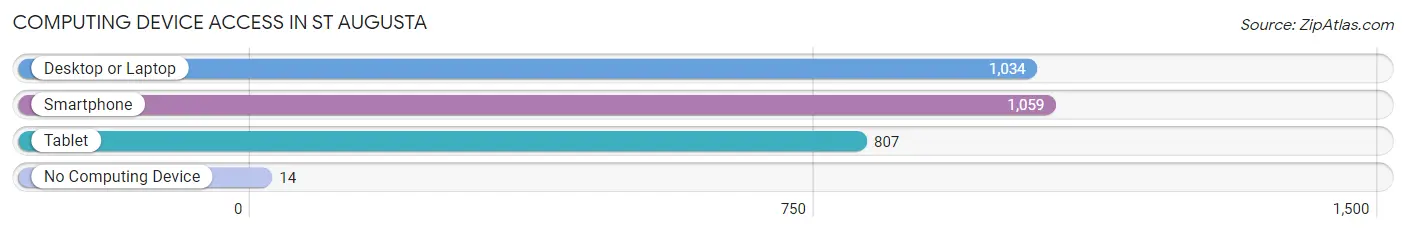
| Device Type | # Households | % Households |
| Desktop or Laptop | 1,034 | 92.6% |
| Smartphone | 1,059 | 94.9% |
| Tablet | 807 | 72.3% |
| No Computing Device | 14 | 1.3% |
| Total | 1,116 | 100.0% |
Internet Access in St Augusta
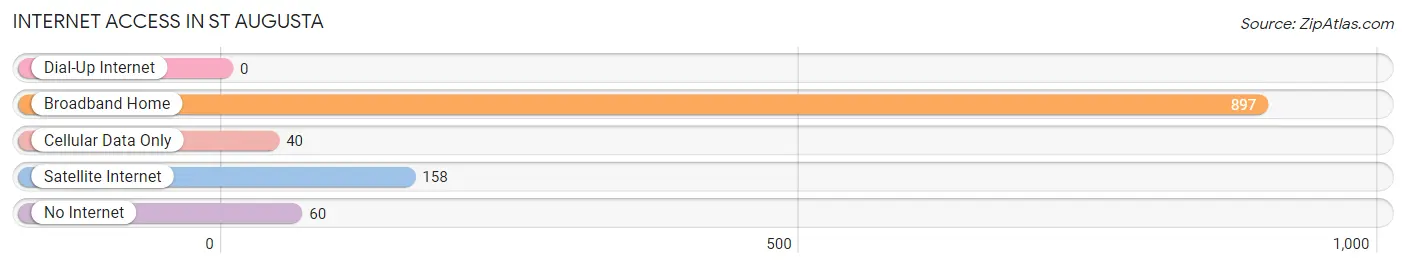
| Internet Type | # Households | % Households |
| Dial-Up Internet | 0 | 0.0% |
| Broadband Home | 897 | 80.4% |
| Cellular Data Only | 40 | 3.6% |
| Satellite Internet | 158 | 14.2% |
| No Internet | 60 | 5.4% |
| Total | 1,116 | 100.0% |
St Augusta Summary
Augusta, Minnesota is a small city located in Stearns County, Minnesota, United States. It is situated on the Sauk River, approximately 10 miles (16 km) northwest of St. Cloud. The population was 1,845 at the 2010 census.
History
Augusta was founded in 1856 by German immigrants who were looking for a place to settle and farm. The city was named after Augusta, Wisconsin, which was the hometown of one of the settlers. The first settlers built a log cabin and a sawmill, and the town quickly grew. By 1858, the town had a post office, a school, a store, and a blacksmith shop.
In the late 1800s, Augusta was a thriving community with a variety of businesses, including a flour mill, a creamery, a brewery, a brickyard, and a furniture factory. The town also had a hotel, a bank, and a newspaper.
In the early 1900s, the town began to decline as the railroad bypassed it and the businesses moved away. However, the town was able to survive and in the 1950s, it began to experience a resurgence. The town was able to attract new businesses and industries, and the population began to grow again.
Geography
Augusta is located at 45°37′N 94°45′W (45.619, -94.749). According to the United States Census Bureau, the city has a total area of 1.2 square miles (3.1 km2), all of it land.
Economy
Augusta’s economy is largely based on agriculture and manufacturing. The city is home to several large farms, as well as a variety of small businesses. The city also has a number of manufacturing companies, including a plastics factory, a metal fabrication plant, and a food processing plant.
Demographics
As of the census of 2010, there were 1,845 people, 717 households, and 486 families residing in the city. The population density was 1,539.2 inhabitants per square mile (594.3/km2). There were 767 housing units at an average density of 639.2 per square mile (246.6/km2). The racial makeup of the city was 97.2% White, 0.2% African American, 0.3% Native American, 0.3% Asian, 0.2% from other races, and 1.8% from two or more races. Hispanic or Latino of any race were 1.2% of the population.
There were 717 households, of which 33.2% had children under the age of 18 living with them, 51.2% were married couples living together, 9.7% had a female householder with no husband present, 4.7% had a male householder with no wife present, and 34.4% were non-families. 29.2% of all households were made up of individuals, and 14.2% had someone living alone who was 65 years of age or older. The average household size was 2.48 and the average family size was 3.06.
The median age in the city was 37.7 years. 25.7% of residents were under the age of 18; 8.2% were between the ages of 18 and 24; 24.3% were from 25 to 44; 24.3% were from 45 to 64; and 17.5% were 65 years of age or older. The gender makeup of the city was 48.7% male and 51.3% female.
Conclusion
Augusta, Minnesota is a small city located in Stearns County, Minnesota, United States. It is situated on the Sauk River, approximately 10 miles (16 km) northwest of St. Cloud. The population was 1,845 at the 2010 census. The city was founded in 1856 by German immigrants and has since grown to become a thriving community with a variety of businesses and industries. The economy is largely based on agriculture and manufacturing, and the population is largely White with a small percentage of other races.
Common Questions
What is Per Capita Income in St Augusta?
Per Capita income in St Augusta is $51,604.
What is the Median Family Income in St Augusta?
Median Family Income in St Augusta is $131,000.
What is the Median Household income in St Augusta?
Median Household Income in St Augusta is $120,526.
What is Income or Wage Gap in St Augusta?
Income or Wage Gap in St Augusta is 22.1%.
Women in St Augusta earn 77.9 cents for every dollar earned by a man.
What is Inequality or Gini Index in St Augusta?
Inequality or Gini Index in St Augusta is 0.39.
What is the Total Population of St Augusta?
Total Population of St Augusta is 3,520.
What is the Total Male Population of St Augusta?
Total Male Population of St Augusta is 1,916.
What is the Total Female Population of St Augusta?
Total Female Population of St Augusta is 1,604.
What is the Ratio of Males per 100 Females in St Augusta?
There are 119.45 Males per 100 Females in St Augusta.
What is the Ratio of Females per 100 Males in St Augusta?
There are 83.72 Females per 100 Males in St Augusta.
What is the Median Population Age in St Augusta?
Median Population Age in St Augusta is 35.8 Years.
What is the Average Family Size in St Augusta
Average Family Size in St Augusta is 3.4 People.
What is the Average Household Size in St Augusta
Average Household Size in St Augusta is 3.1 People.
How Large is the Labor Force in St Augusta?
There are 1,987 People in the Labor Forcein in St Augusta.
What is the Percentage of People in the Labor Force in St Augusta?
75.5% of People are in the Labor Force in St Augusta.
What is the Unemployment Rate in St Augusta?
Unemployment Rate in St Augusta is 3.6%.