St Marys Point, MN Map & Demographics
St Marys Point Map
St Marys Point Overview
$56,550
PER CAPITA INCOME
$130,000
AVG FAMILY INCOME
$105,625
AVG HOUSEHOLD INCOME
58.7%
WAGE / INCOME GAP [ % ]
41.3¢/ $1
WAGE / INCOME GAP [ $ ]
0.48
INEQUALITY / GINI INDEX
467
TOTAL POPULATION
254
MALE POPULATION
213
FEMALE POPULATION
119.25
MALES / 100 FEMALES
83.86
FEMALES / 100 MALES
45.3
MEDIAN AGE
3.3
AVG FAMILY SIZE
2.8
AVG HOUSEHOLD SIZE
228
LABOR FORCE [ PEOPLE ]
56.2%
PERCENT IN LABOR FORCE
3.1%
UNEMPLOYMENT RATE
St Marys Point Area Codes
Income in St Marys Point
Income Overview in St Marys Point
Per Capita Income in St Marys Point is $56,550, while median incomes of families and households are $130,000 and $105,625 respectively.
| Characteristic | Number | Measure |
| Per Capita Income | 467 | $56,550 |
| Median Family Income | 120 | $130,000 |
| Mean Family Income | 120 | $168,826 |
| Median Household Income | 169 | $105,625 |
| Mean Household Income | 169 | $149,009 |
| Income Deficit | 120 | $0 |
| Wage / Income Gap (%) | 467 | 58.72% |
| Wage / Income Gap ($) | 467 | 41.28¢ per $1 |
| Gini / Inequality Index | 467 | 0.48 |
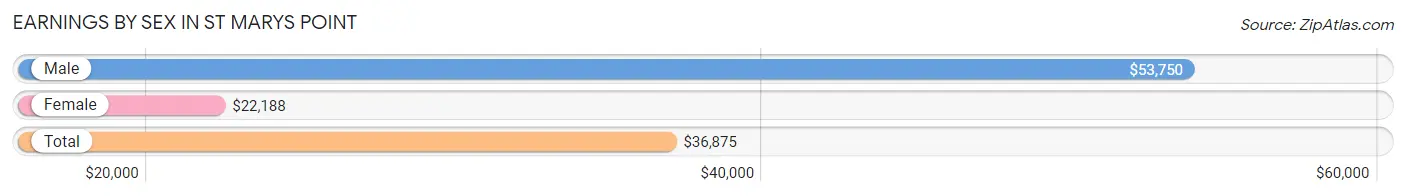
Earnings by Sex in St Marys Point
Average Earnings in St Marys Point are $36,875, $53,750 for men and $22,188 for women, a difference of 58.7%.
| Sex | Number | Average Earnings |
| Male | 138 (50.2%) | $53,750 |
| Female | 137 (49.8%) | $22,188 |
| Total | 275 (100.0%) | $36,875 |
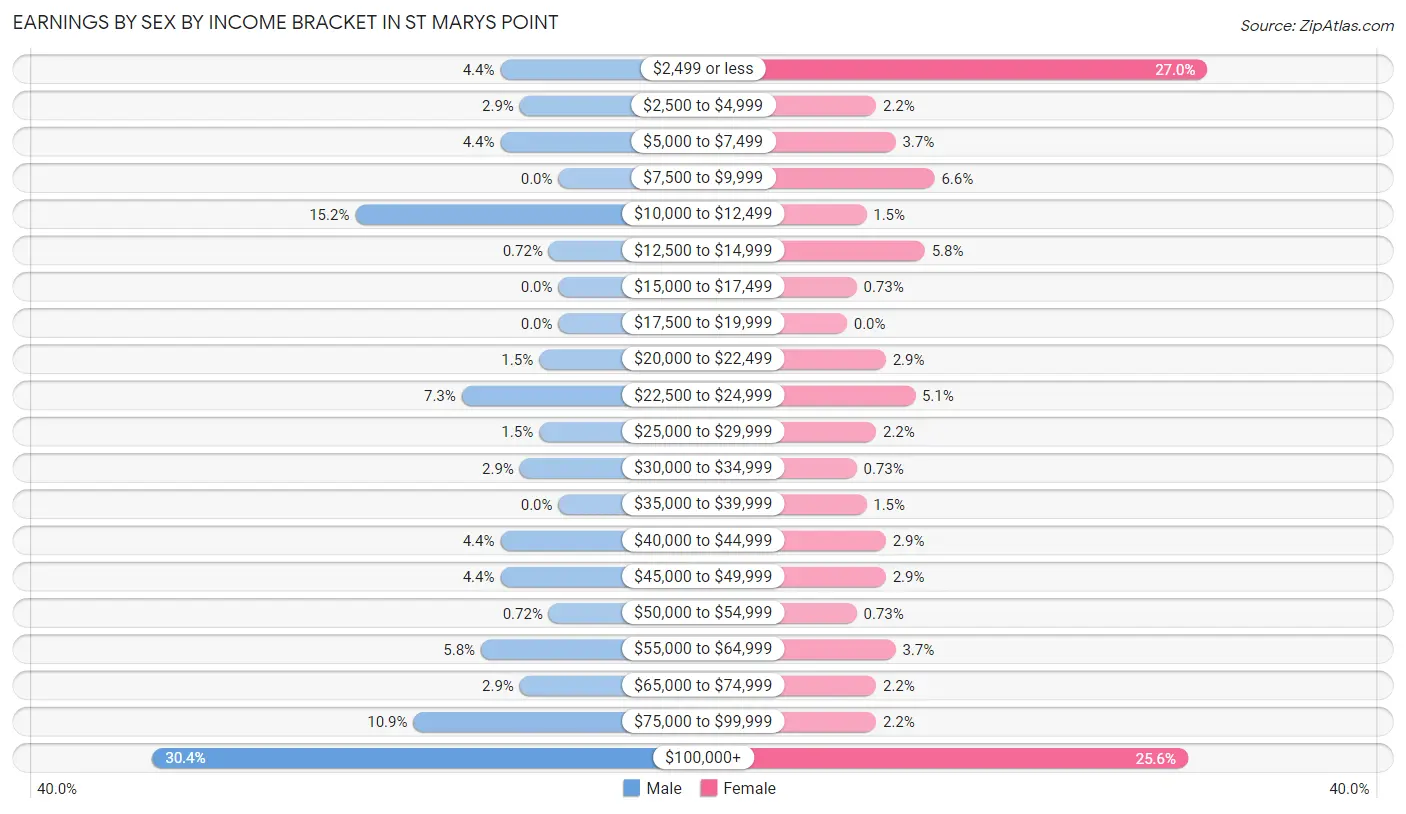
Earnings by Sex by Income Bracket in St Marys Point
The most common earnings brackets in St Marys Point are $100,000+ for men (42 | 30.4%) and $2,499 or less for women (37 | 27.0%).
| Income | Male | Female |
| $2,499 or less | 6 (4.3%) | 37 (27.0%) |
| $2,500 to $4,999 | 4 (2.9%) | 3 (2.2%) |
| $5,000 to $7,499 | 6 (4.3%) | 5 (3.6%) |
| $7,500 to $9,999 | 0 (0.0%) | 9 (6.6%) |
| $10,000 to $12,499 | 21 (15.2%) | 2 (1.5%) |
| $12,500 to $14,999 | 1 (0.7%) | 8 (5.8%) |
| $15,000 to $17,499 | 0 (0.0%) | 1 (0.7%) |
| $17,500 to $19,999 | 0 (0.0%) | 0 (0.0%) |
| $20,000 to $22,499 | 2 (1.5%) | 4 (2.9%) |
| $22,500 to $24,999 | 10 (7.2%) | 7 (5.1%) |
| $25,000 to $29,999 | 2 (1.5%) | 3 (2.2%) |
| $30,000 to $34,999 | 4 (2.9%) | 1 (0.7%) |
| $35,000 to $39,999 | 0 (0.0%) | 2 (1.5%) |
| $40,000 to $44,999 | 6 (4.3%) | 4 (2.9%) |
| $45,000 to $49,999 | 6 (4.3%) | 4 (2.9%) |
| $50,000 to $54,999 | 1 (0.7%) | 1 (0.7%) |
| $55,000 to $64,999 | 8 (5.8%) | 5 (3.6%) |
| $65,000 to $74,999 | 4 (2.9%) | 3 (2.2%) |
| $75,000 to $99,999 | 15 (10.9%) | 3 (2.2%) |
| $100,000+ | 42 (30.4%) | 35 (25.6%) |
| Total | 138 (100.0%) | 137 (100.0%) |
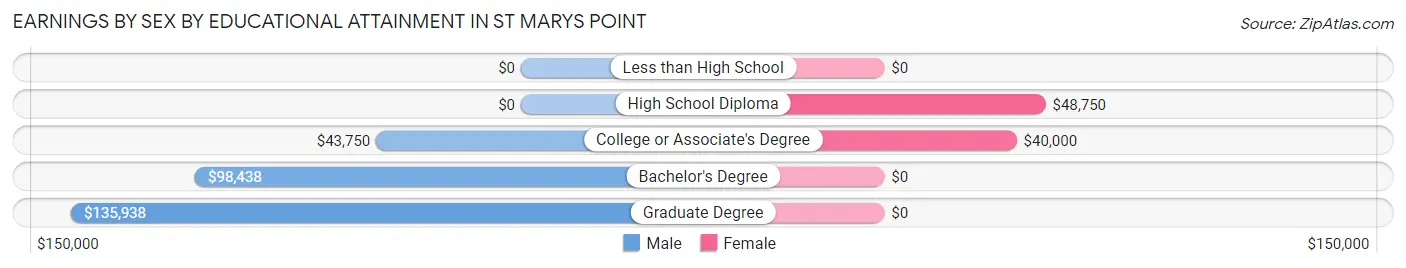
Earnings by Sex by Educational Attainment in St Marys Point
Average earnings in St Marys Point are $81,875 for men and $43,125 for women, a difference of 47.3%. Men with an educational attainment of graduate degree enjoy the highest average annual earnings of $135,938, while those with college or associate's degree education earn the least with $43,750. Women with an educational attainment of high school diploma earn the most with the average annual earnings of $48,750, while those with college or associate's degree education have the smallest earnings of $40,000.
| Educational Attainment | Male Income | Female Income |
| Less than High School | - | - |
| High School Diploma | - | - |
| College or Associate's Degree | $43,750 | $40,000 |
| Bachelor's Degree | $98,438 | $0 |
| Graduate Degree | $135,938 | $0 |
| Total | $81,875 | $43,125 |
Family Income in St Marys Point
Family Income Brackets in St Marys Point
According to the St Marys Point family income data, there are 42 families falling into the $200,000+ income range, which is the most common income bracket and makes up 35.0% of all families.
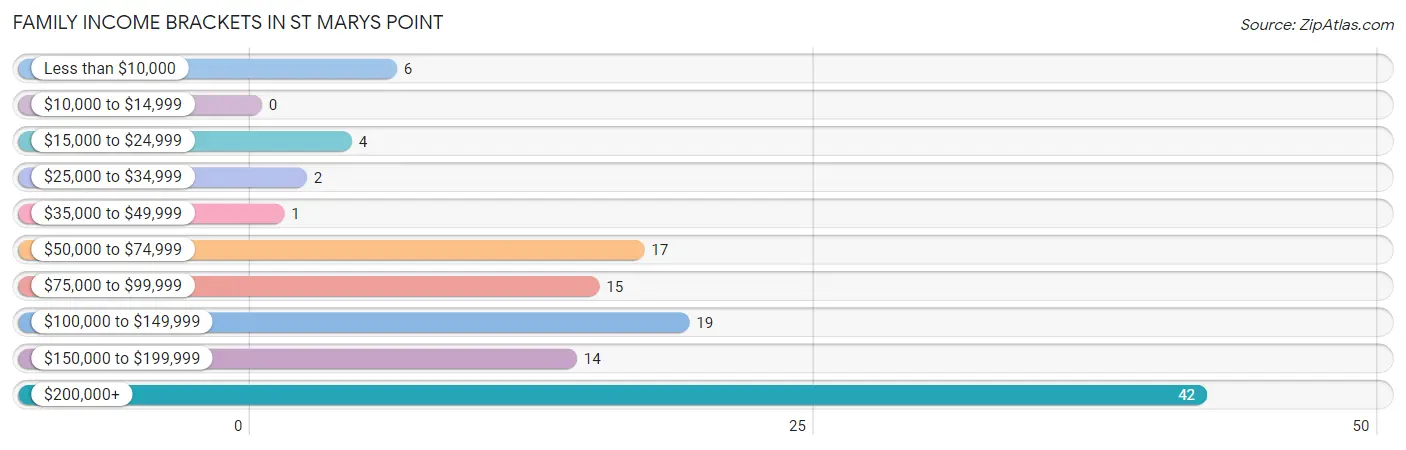
| Income Bracket | # Families | % Families |
| Less than $10,000 | 6 | 5.0% |
| $10,000 to $14,999 | 0 | 0.0% |
| $15,000 to $24,999 | 4 | 3.3% |
| $25,000 to $34,999 | 2 | 1.7% |
| $35,000 to $49,999 | 1 | 0.8% |
| $50,000 to $74,999 | 17 | 14.2% |
| $75,000 to $99,999 | 15 | 12.5% |
| $100,000 to $149,999 | 19 | 15.8% |
| $150,000 to $199,999 | 14 | 11.7% |
| $200,000+ | 42 | 35.0% |
Family Income by Famaliy Size in St Marys Point
5-person families (21 | 17.5%) account for the highest median family income in St Marys Point with $250,001 per family, while 2-person families (66 | 55.0%) have the highest median income of $64,375 per family member.
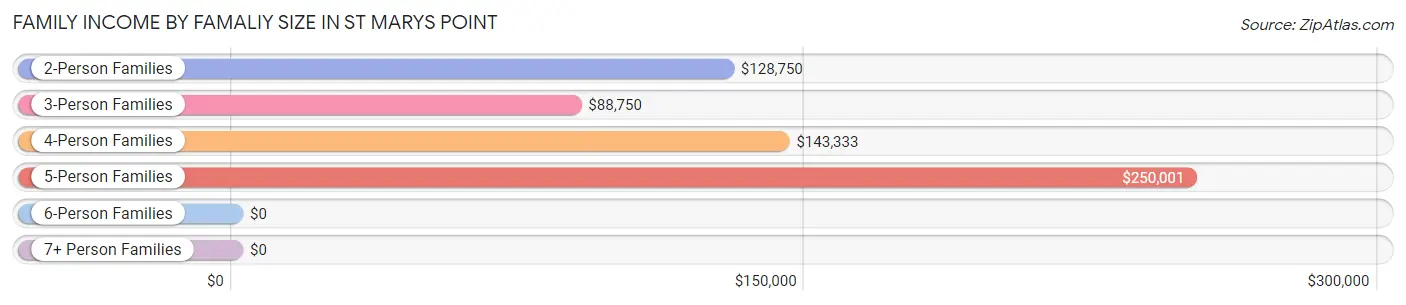
| Income Bracket | # Families | Median Income |
| 2-Person Families | 66 (55.0%) | $128,750 |
| 3-Person Families | 17 (14.2%) | $88,750 |
| 4-Person Families | 16 (13.3%) | $143,333 |
| 5-Person Families | 21 (17.5%) | $250,001 |
| 6-Person Families | 0 (0.0%) | $0 |
| 7+ Person Families | 0 (0.0%) | $0 |
| Total | 120 (100.0%) | $130,000 |
Family Income by Number of Earners in St Marys Point
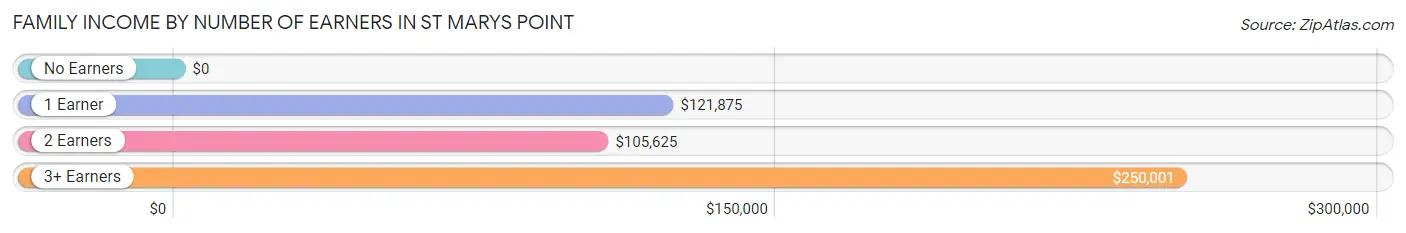
| Number of Earners | # Families | Median Income |
| No Earners | 19 (15.8%) | $0 |
| 1 Earner | 27 (22.5%) | $121,875 |
| 2 Earners | 53 (44.2%) | $105,625 |
| 3+ Earners | 21 (17.5%) | $250,001 |
| Total | 120 (100.0%) | $130,000 |
Household Income in St Marys Point
Household Income Brackets in St Marys Point
With 45 households falling in the category, the $200,000+ income range is the most frequent in St Marys Point, accounting for 26.6% of all households. In contrast, only 4 households (2.4%) fall into the $25,000 to $34,999 income bracket, making it the least populous group.
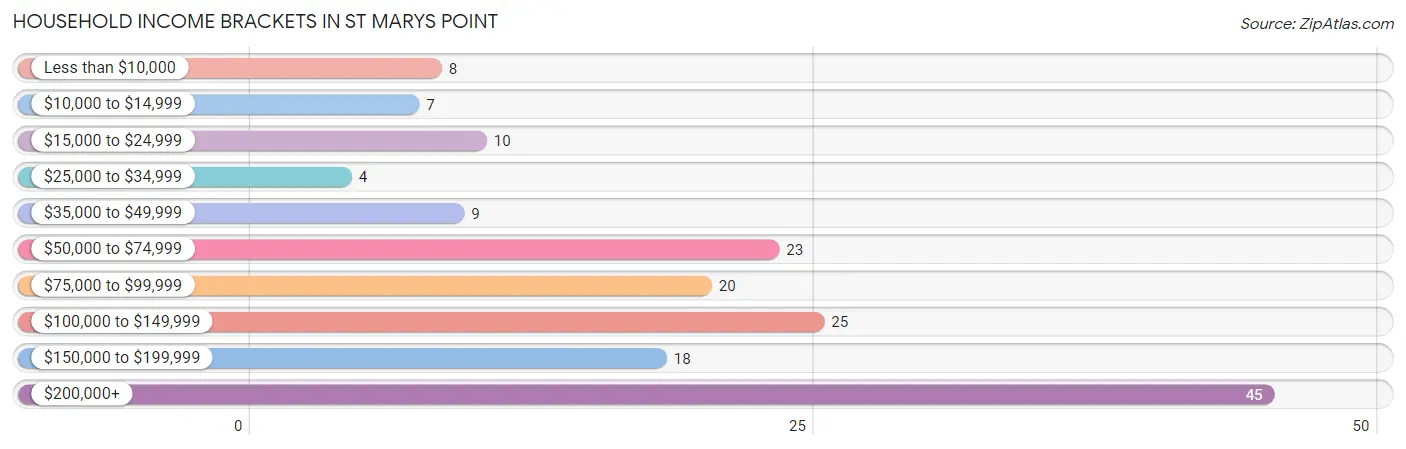
| Income Bracket | # Households | % Households |
| Less than $10,000 | 8 | 4.7% |
| $10,000 to $14,999 | 7 | 4.1% |
| $15,000 to $24,999 | 10 | 5.9% |
| $25,000 to $34,999 | 4 | 2.4% |
| $35,000 to $49,999 | 9 | 5.3% |
| $50,000 to $74,999 | 23 | 13.6% |
| $75,000 to $99,999 | 20 | 11.8% |
| $100,000 to $149,999 | 25 | 14.8% |
| $150,000 to $199,999 | 18 | 10.7% |
| $200,000+ | 45 | 26.6% |
Household Income by Householder Age in St Marys Point
The median household income in St Marys Point is $105,625, with the highest median household income of $160,625 found in the 45 to 64 years age bracket for the primary householder. A total of 71 households (42.0%) fall into this category.
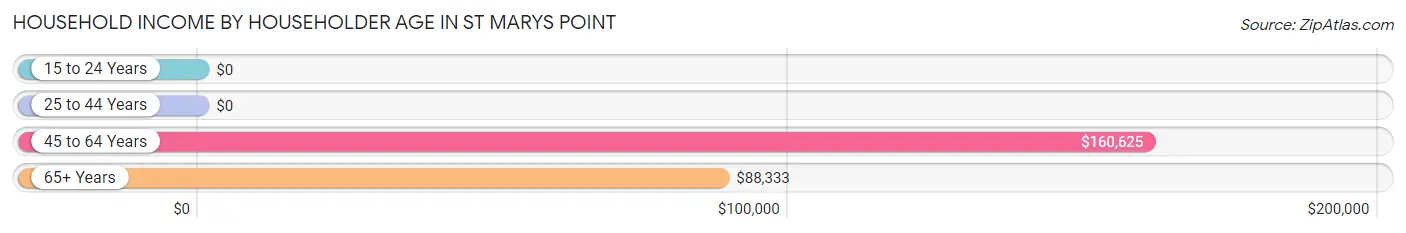
| Income Bracket | # Households | Median Income |
| 15 to 24 Years | 0 (0.0%) | $0 |
| 25 to 44 Years | 30 (17.7%) | $0 |
| 45 to 64 Years | 71 (42.0%) | $160,625 |
| 65+ Years | 68 (40.2%) | $88,333 |
| Total | 169 (100.0%) | $105,625 |
Poverty in St Marys Point
Income Below Poverty by Sex and Age in St Marys Point
With 10.2% poverty level for males and 12.7% for females among the residents of St Marys Point, 35 to 44 year old males and 12 to 14 year old females are the most vulnerable to poverty, with 5 males (29.4%) and 4 females (66.7%) in their respective age groups living below the poverty level.
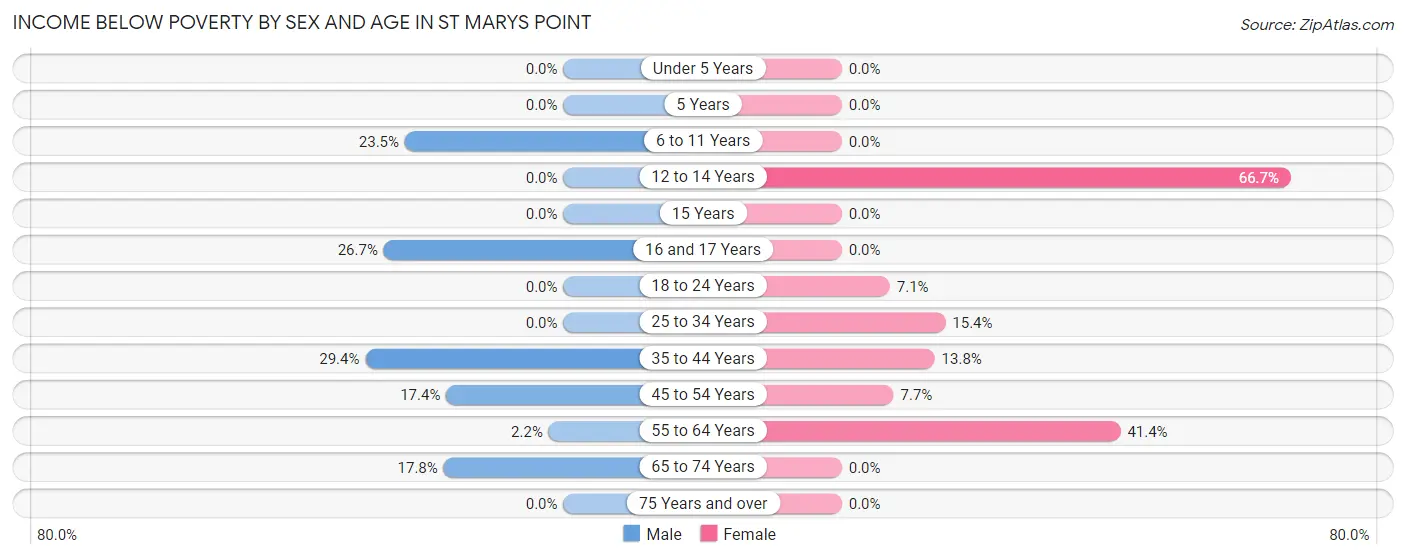
| Age Bracket | Male | Female |
| Under 5 Years | 0 (0.0%) | 0 (0.0%) |
| 5 Years | 0 (0.0%) | 0 (0.0%) |
| 6 to 11 Years | 4 (23.5%) | 0 (0.0%) |
| 12 to 14 Years | 0 (0.0%) | 4 (66.7%) |
| 15 Years | 0 (0.0%) | 0 (0.0%) |
| 16 and 17 Years | 4 (26.7%) | 0 (0.0%) |
| 18 to 24 Years | 0 (0.0%) | 2 (7.1%) |
| 25 to 34 Years | 0 (0.0%) | 2 (15.4%) |
| 35 to 44 Years | 5 (29.4%) | 4 (13.8%) |
| 45 to 54 Years | 4 (17.4%) | 3 (7.7%) |
| 55 to 64 Years | 1 (2.2%) | 12 (41.4%) |
| 65 to 74 Years | 8 (17.8%) | 0 (0.0%) |
| 75 Years and over | 0 (0.0%) | 0 (0.0%) |
| Total | 26 (10.2%) | 27 (12.7%) |
Income Above Poverty by Sex and Age in St Marys Point
According to the poverty statistics in St Marys Point, males aged under 5 years and females aged under 5 years are the age groups that are most secure financially, with 100.0% of males and 100.0% of females in these age groups living above the poverty line.
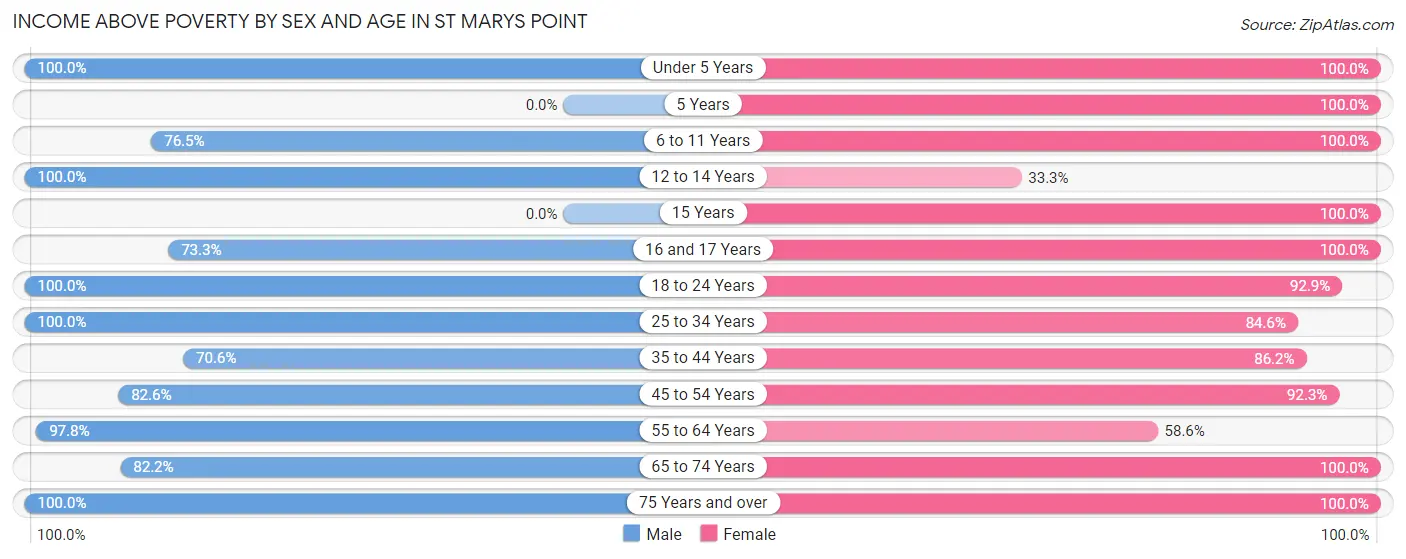
| Age Bracket | Male | Female |
| Under 5 Years | 12 (100.0%) | 10 (100.0%) |
| 5 Years | 0 (0.0%) | 2 (100.0%) |
| 6 to 11 Years | 13 (76.5%) | 10 (100.0%) |
| 12 to 14 Years | 2 (100.0%) | 2 (33.3%) |
| 15 Years | 0 (0.0%) | 2 (100.0%) |
| 16 and 17 Years | 11 (73.3%) | 4 (100.0%) |
| 18 to 24 Years | 51 (100.0%) | 26 (92.9%) |
| 25 to 34 Years | 13 (100.0%) | 11 (84.6%) |
| 35 to 44 Years | 12 (70.6%) | 25 (86.2%) |
| 45 to 54 Years | 19 (82.6%) | 36 (92.3%) |
| 55 to 64 Years | 45 (97.8%) | 17 (58.6%) |
| 65 to 74 Years | 37 (82.2%) | 21 (100.0%) |
| 75 Years and over | 13 (100.0%) | 20 (100.0%) |
| Total | 228 (89.8%) | 186 (87.3%) |
Income Below Poverty Among Married-Couple Families in St Marys Point
The poverty statistics for married-couple families in St Marys Point show that 9.3% or 10 of the total 107 families live below the poverty line. Families with 3 or 4 children have the highest poverty rate of 57.1%, comprising of 4 families. On the other hand, families with 1 or 2 children have the lowest poverty rate of 0.0%, which includes 0 families.
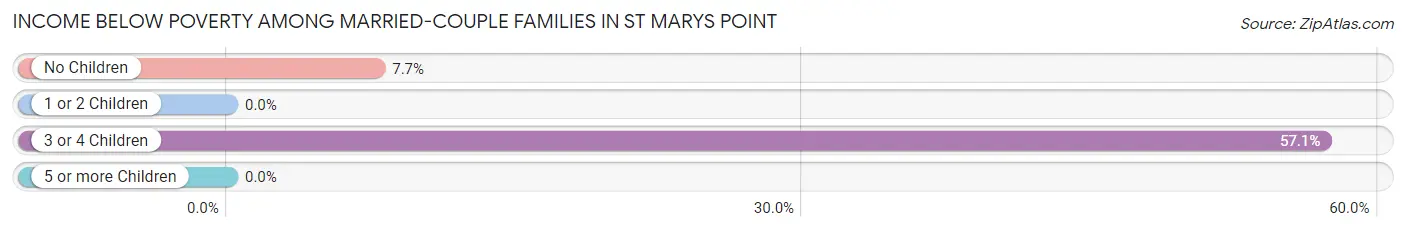
| Children | Above Poverty | Below Poverty |
| No Children | 72 (92.3%) | 6 (7.7%) |
| 1 or 2 Children | 22 (100.0%) | 0 (0.0%) |
| 3 or 4 Children | 3 (42.9%) | 4 (57.1%) |
| 5 or more Children | 0 (0.0%) | 0 (0.0%) |
| Total | 97 (90.6%) | 10 (9.3%) |
Income Below Poverty Among Single-Parent Households in St Marys Point
| Children | Single Father | Single Mother |
| No Children | 0 (0.0%) | 0 (0.0%) |
| 1 or 2 Children | 0 (0.0%) | 0 (0.0%) |
| 3 or 4 Children | 0 (0.0%) | 0 (0.0%) |
| 5 or more Children | 0 (0.0%) | 0 (0.0%) |
| Total | 0 (0.0%) | 0 (0.0%) |
Income Below Poverty Among Married-Couple vs Single-Parent Households in St Marys Point
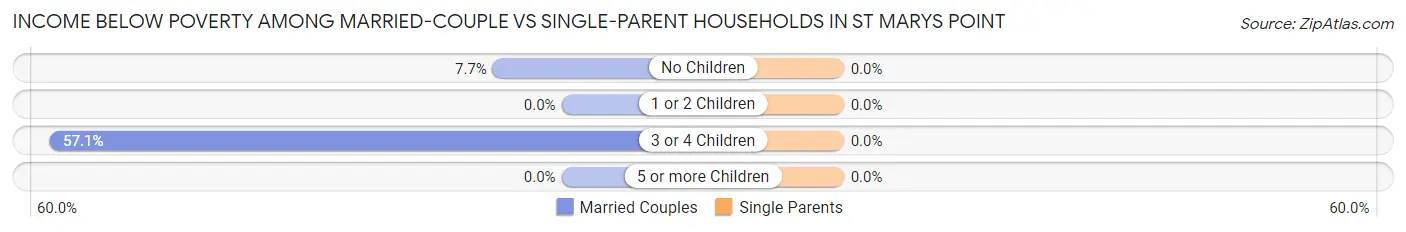
| Children | Married-Couple Families | Single-Parent Households |
| No Children | 6 (7.7%) | 0 (0.0%) |
| 1 or 2 Children | 0 (0.0%) | 0 (0.0%) |
| 3 or 4 Children | 4 (57.1%) | 0 (0.0%) |
| 5 or more Children | 0 (0.0%) | 0 (0.0%) |
| Total | 10 (9.3%) | 0 (0.0%) |
Race in St Marys Point
The most populous races in St Marys Point are White / Caucasian (421 | 90.1%), Two or more Races (25 | 5.3%), and Some other Race (16 | 3.4%).
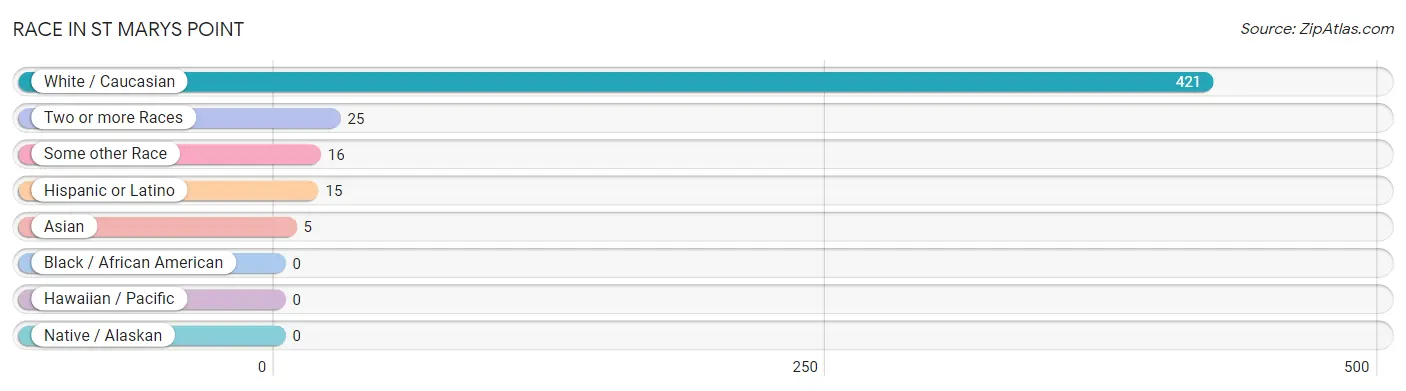
| Race | # Population | % Population |
| Asian | 5 | 1.1% |
| Black / African American | 0 | 0.0% |
| Hawaiian / Pacific | 0 | 0.0% |
| Hispanic or Latino | 15 | 3.2% |
| Native / Alaskan | 0 | 0.0% |
| White / Caucasian | 421 | 90.1% |
| Two or more Races | 25 | 5.3% |
| Some other Race | 16 | 3.4% |
| Total | 467 | 100.0% |
Ancestry in St Marys Point
The most populous ancestries reported in St Marys Point are German (129 | 27.6%), Irish (120 | 25.7%), French (76 | 16.3%), English (55 | 11.8%), and Swedish (23 | 4.9%), together accounting for 86.3% of all St Marys Point residents.
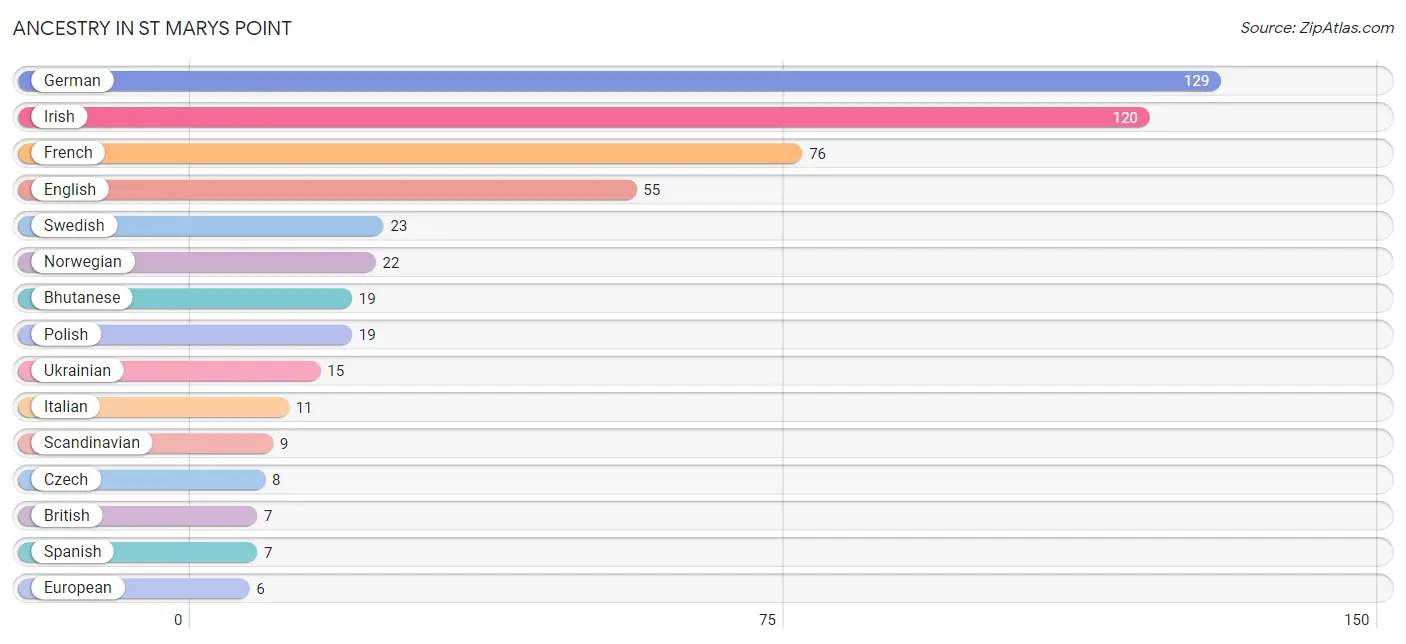
| Ancestry | # Population | % Population |
| American | 4 | 0.9% |
| Bhutanese | 19 | 4.1% |
| British | 7 | 1.5% |
| Burmese | 3 | 0.6% |
| Cherokee | 1 | 0.2% |
| Colombian | 4 | 0.9% |
| Czech | 8 | 1.7% |
| Danish | 4 | 0.9% |
| Dutch | 4 | 0.9% |
| English | 55 | 11.8% |
| European | 6 | 1.3% |
| Finnish | 3 | 0.6% |
| French | 76 | 16.3% |
| French Canadian | 1 | 0.2% |
| German | 129 | 27.6% |
| Greek | 1 | 0.2% |
| Hungarian | 6 | 1.3% |
| Indian (Asian) | 3 | 0.6% |
| Irish | 120 | 25.7% |
| Italian | 11 | 2.4% |
| Lithuanian | 2 | 0.4% |
| Mexican | 4 | 0.9% |
| Northern European | 3 | 0.6% |
| Norwegian | 22 | 4.7% |
| Polish | 19 | 4.1% |
| Russian | 6 | 1.3% |
| Scandinavian | 9 | 1.9% |
| Scotch-Irish | 3 | 0.6% |
| Scottish | 6 | 1.3% |
| South American | 4 | 0.9% |
| Spanish | 7 | 1.5% |
| Swedish | 23 | 4.9% |
| Ukrainian | 15 | 3.2% |
| Yugoslavian | 1 | 0.2% | View All 34 Rows |
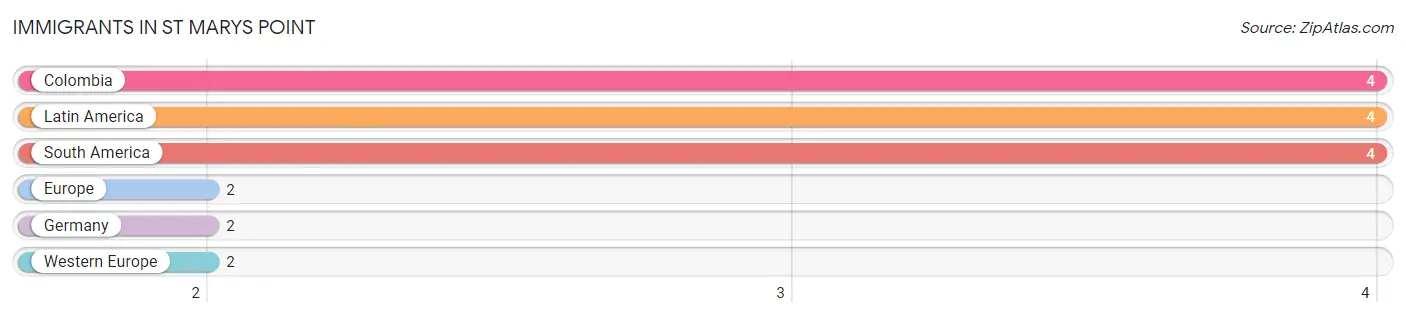
Immigrants in St Marys Point
The most numerous immigrant groups reported in St Marys Point came from Colombia (4 | 0.9%), Latin America (4 | 0.9%), South America (4 | 0.9%), Europe (2 | 0.4%), and Germany (2 | 0.4%), together accounting for 3.4% of all St Marys Point residents.
| Immigration Origin | # Population | % Population |
| Colombia | 4 | 0.9% |
| Europe | 2 | 0.4% |
| Germany | 2 | 0.4% |
| Latin America | 4 | 0.9% |
| South America | 4 | 0.9% |
| Western Europe | 2 | 0.4% | View All 6 Rows |
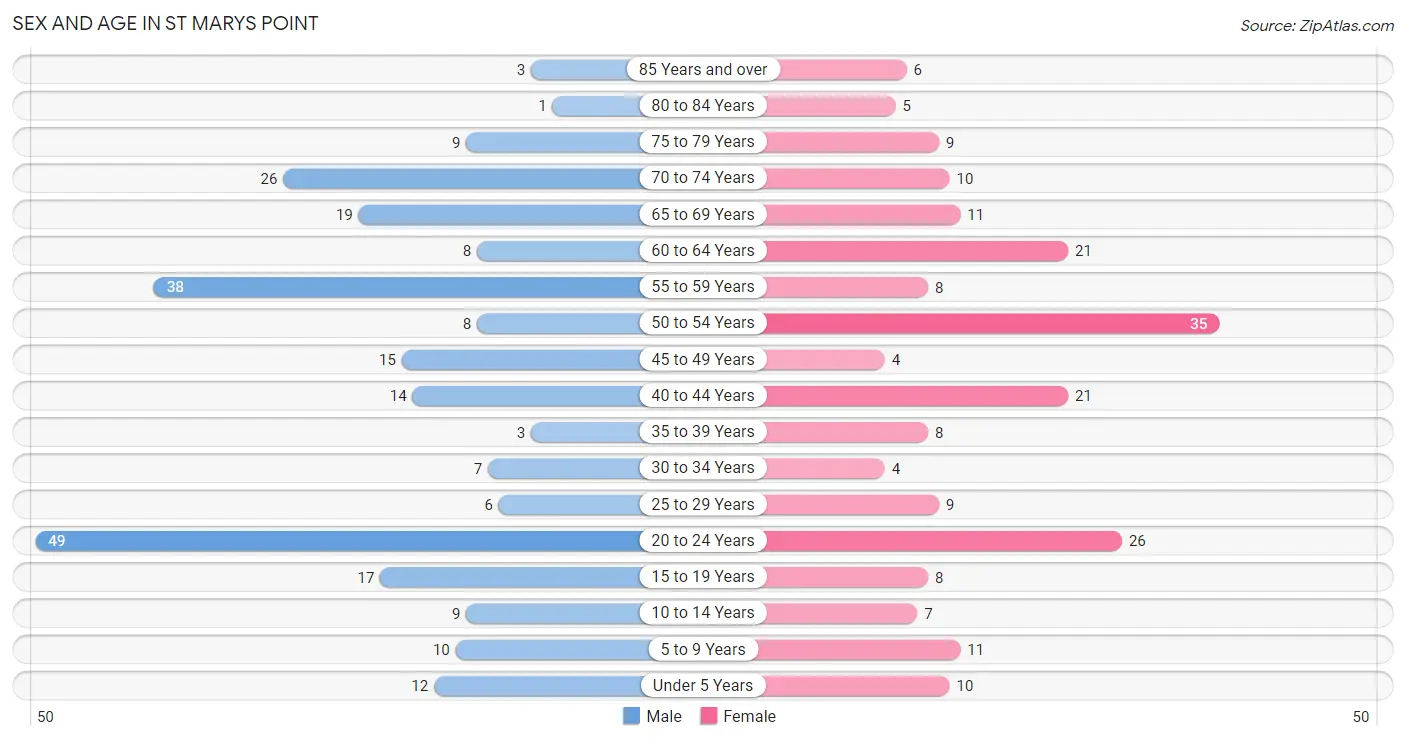
Sex and Age in St Marys Point
Sex and Age in St Marys Point
The most populous age groups in St Marys Point are 20 to 24 Years (49 | 19.3%) for men and 50 to 54 Years (35 | 16.4%) for women.
| Age Bracket | Male | Female |
| Under 5 Years | 12 (4.7%) | 10 (4.7%) |
| 5 to 9 Years | 10 (3.9%) | 11 (5.2%) |
| 10 to 14 Years | 9 (3.5%) | 7 (3.3%) |
| 15 to 19 Years | 17 (6.7%) | 8 (3.8%) |
| 20 to 24 Years | 49 (19.3%) | 26 (12.2%) |
| 25 to 29 Years | 6 (2.4%) | 9 (4.2%) |
| 30 to 34 Years | 7 (2.8%) | 4 (1.9%) |
| 35 to 39 Years | 3 (1.2%) | 8 (3.8%) |
| 40 to 44 Years | 14 (5.5%) | 21 (9.9%) |
| 45 to 49 Years | 15 (5.9%) | 4 (1.9%) |
| 50 to 54 Years | 8 (3.2%) | 35 (16.4%) |
| 55 to 59 Years | 38 (15.0%) | 8 (3.8%) |
| 60 to 64 Years | 8 (3.2%) | 21 (9.9%) |
| 65 to 69 Years | 19 (7.5%) | 11 (5.2%) |
| 70 to 74 Years | 26 (10.2%) | 10 (4.7%) |
| 75 to 79 Years | 9 (3.5%) | 9 (4.2%) |
| 80 to 84 Years | 1 (0.4%) | 5 (2.4%) |
| 85 Years and over | 3 (1.2%) | 6 (2.8%) |
| Total | 254 (100.0%) | 213 (100.0%) |
Families and Households in St Marys Point
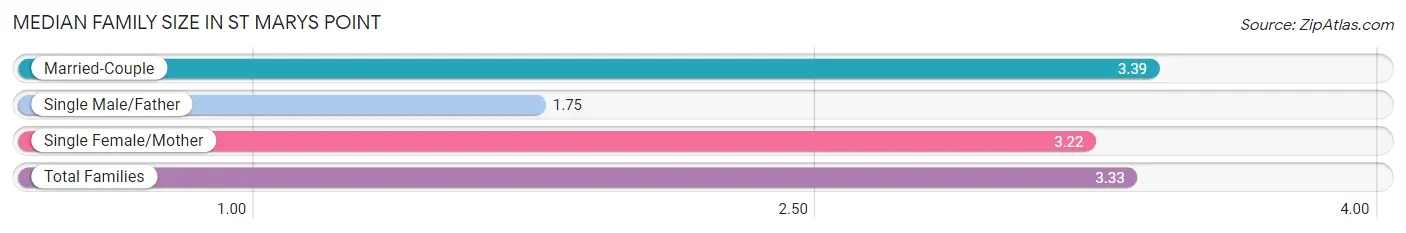
Median Family Size in St Marys Point
The median family size in St Marys Point is 3.33 persons per family, with married-couple families (107 | 89.2%) accounting for the largest median family size of 3.39 persons per family. On the other hand, single male/father families (4 | 3.3%) represent the smallest median family size with 1.75 persons per family.
| Family Type | # Families | Family Size |
| Married-Couple | 107 (89.2%) | 3.39 |
| Single Male/Father | 4 (3.3%) | 1.75 |
| Single Female/Mother | 9 (7.5%) | 3.22 |
| Total Families | 120 (100.0%) | 3.33 |
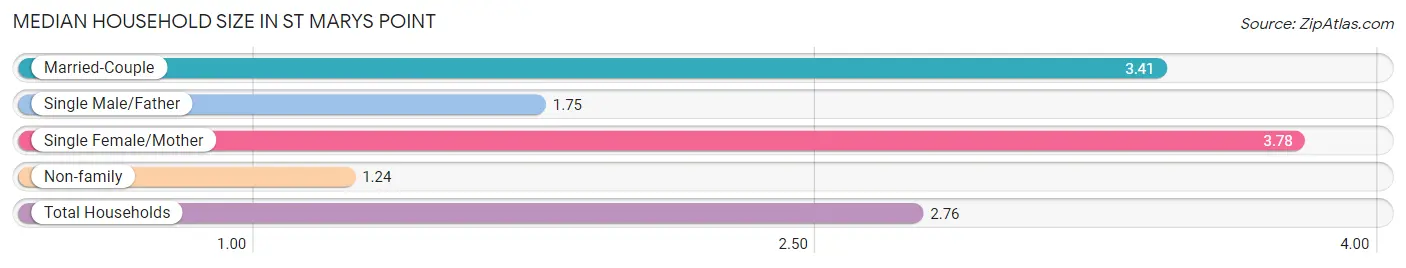
Median Household Size in St Marys Point
The median household size in St Marys Point is 2.76 persons per household, with single female/mother households (9 | 5.3%) accounting for the largest median household size of 3.78 persons per household. non-family households (49 | 29.0%) represent the smallest median household size with 1.24 persons per household.
| Household Type | # Households | Household Size |
| Married-Couple | 107 (63.3%) | 3.41 |
| Single Male/Father | 4 (2.4%) | 1.75 |
| Single Female/Mother | 9 (5.3%) | 3.78 |
| Non-family | 49 (29.0%) | 1.24 |
| Total Households | 169 (100.0%) | 2.76 |
Household Size by Marriage Status in St Marys Point
Out of a total of 169 households in St Marys Point, 120 (71.0%) are family households, while 49 (29.0%) are nonfamily households. The most numerous type of family households are 2-person households, comprising 66, and the most common type of nonfamily households are 1-person households, comprising 40.
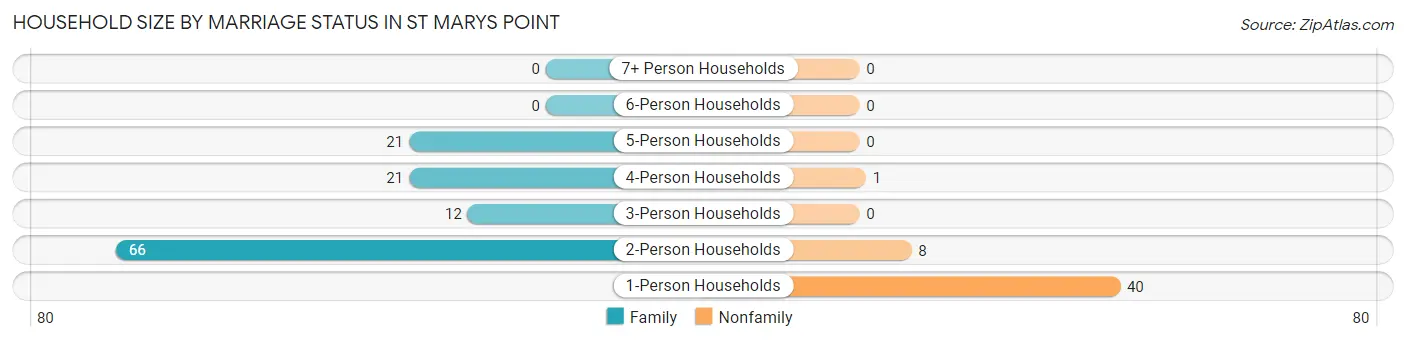
| Household Size | Family Households | Nonfamily Households |
| 1-Person Households | - | 40 (23.7%) |
| 2-Person Households | 66 (39.1%) | 8 (4.7%) |
| 3-Person Households | 12 (7.1%) | 0 (0.0%) |
| 4-Person Households | 21 (12.4%) | 1 (0.6%) |
| 5-Person Households | 21 (12.4%) | 0 (0.0%) |
| 6-Person Households | 0 (0.0%) | 0 (0.0%) |
| 7+ Person Households | 0 (0.0%) | 0 (0.0%) |
| Total | 120 (71.0%) | 49 (29.0%) |
Female Fertility in St Marys Point
Fertility by Age in St Marys Point
| Age Bracket | Women with Births | Births / 1,000 Women |
| 15 to 19 years | 0 (0.0%) | 0.0 |
| 20 to 34 years | 0 (0.0%) | 0.0 |
| 35 to 50 years | 0 (0.0%) | 0.0 |
| Total | 0 (0.0%) | 0.0 |
Fertility by Age by Marriage Status in St Marys Point
| Age Bracket | Married | Unmarried |
| 15 to 19 years | 0 (0.0%) | 0 (0.0%) |
| 20 to 34 years | 0 (0.0%) | 0 (0.0%) |
| 35 to 50 years | 0 (0.0%) | 0 (0.0%) |
| Total | 0 (0.0%) | 0 (0.0%) |
Fertility by Education in St Marys Point
| Educational Attainment | Women with Births | Births / 1,000 Women |
| Less than High School | 0 (0.0%) | 0.0 |
| High School Diploma | 0 (0.0%) | 0.0 |
| College or Associate's Degree | 0 (0.0%) | 0.0 |
| Bachelor's Degree | 0 (0.0%) | 0.0 |
| Graduate Degree | 0 (0.0%) | 0.0 |
| Total | 0 (0.0%) | 0.0 |
Fertility by Education by Marriage Status in St Marys Point
| Educational Attainment | Married | Unmarried |
| Less than High School | 0 (0.0%) | 0 (0.0%) |
| High School Diploma | 0 (0.0%) | 0 (0.0%) |
| College or Associate's Degree | 0 (0.0%) | 0 (0.0%) |
| Bachelor's Degree | 0 (0.0%) | 0 (0.0%) |
| Graduate Degree | 0 (0.0%) | 0 (0.0%) |
| Total | 0 (0.0%) | 0 (0.0%) |
Employment Characteristics in St Marys Point
Employment by Class of Employer in St Marys Point
Among the 215 employed individuals in St Marys Point, private company employees (124 | 57.7%), self-employed (not incorporated) (48 | 22.3%), and self-employed (incorporated) (17 | 7.9%) make up the most common classes of employment.
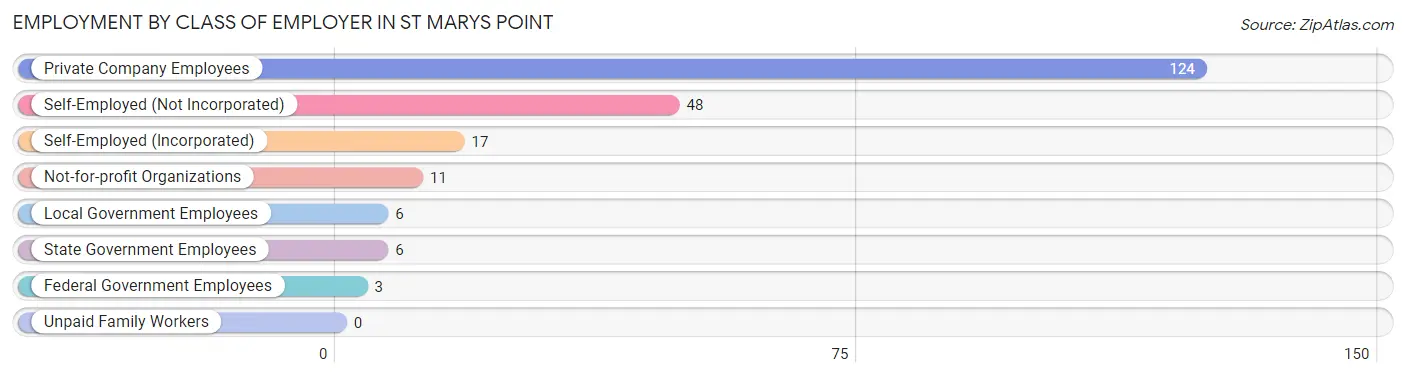
| Employer Class | # Employees | % Employees |
| Private Company Employees | 124 | 57.7% |
| Self-Employed (Incorporated) | 17 | 7.9% |
| Self-Employed (Not Incorporated) | 48 | 22.3% |
| Not-for-profit Organizations | 11 | 5.1% |
| Local Government Employees | 6 | 2.8% |
| State Government Employees | 6 | 2.8% |
| Federal Government Employees | 3 | 1.4% |
| Unpaid Family Workers | 0 | 0.0% |
| Total | 215 | 100.0% |
Employment Status by Age in St Marys Point
According to the labor force statistics for St Marys Point, out of the total population over 16 years of age (406), 56.2% or 228 individuals are in the labor force, with 3.1% or 7 of them unemployed. The age group with the highest labor force participation rate is 30 to 34 years, with 100.0% or 11 individuals in the labor force. Within the labor force, the 16 to 19 years age range has the highest percentage of unemployed individuals, with 20.0% or 2 of them being unemployed.
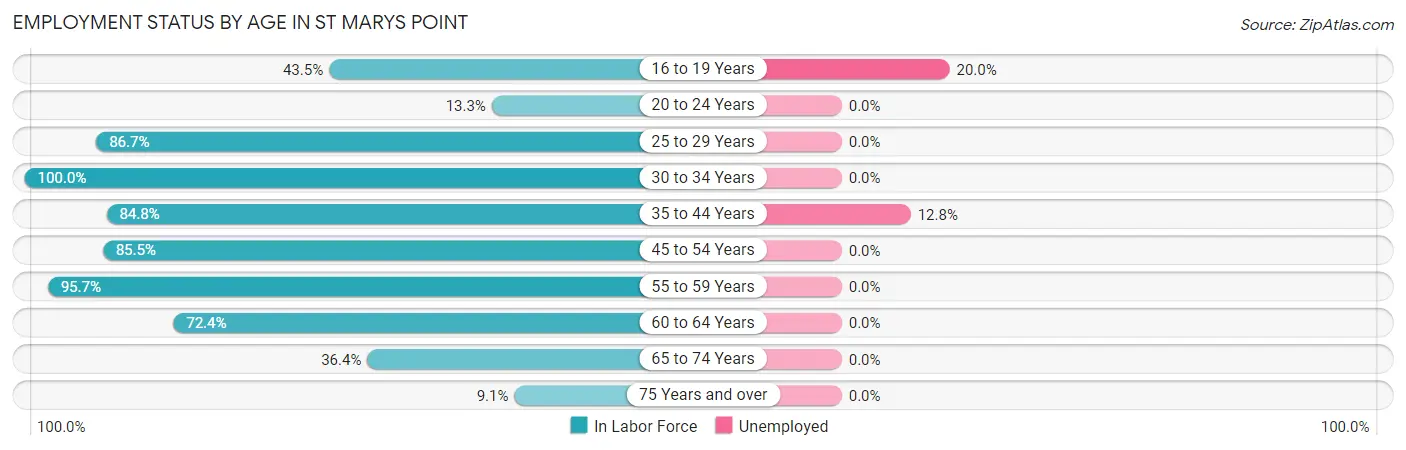
| Age Bracket | In Labor Force | Unemployed |
| 16 to 19 Years | 10 (43.5%) | 2 (20.0%) |
| 20 to 24 Years | 10 (13.3%) | 0 (0.0%) |
| 25 to 29 Years | 13 (86.7%) | 0 (0.0%) |
| 30 to 34 Years | 11 (100.0%) | 0 (0.0%) |
| 35 to 44 Years | 39 (84.8%) | 5 (12.8%) |
| 45 to 54 Years | 53 (85.5%) | 0 (0.0%) |
| 55 to 59 Years | 44 (95.7%) | 0 (0.0%) |
| 60 to 64 Years | 21 (72.4%) | 0 (0.0%) |
| 65 to 74 Years | 24 (36.4%) | 0 (0.0%) |
| 75 Years and over | 3 (9.1%) | 0 (0.0%) |
| Total | 228 (56.2%) | 7 (3.1%) |
Employment Status by Educational Attainment in St Marys Point
According to labor force statistics for St Marys Point, 86.6% of individuals (181) out of the total population between 25 and 64 years of age (209) are in the labor force, with 2.8% or 5 of them being unemployed. The group with the highest labor force participation rate are those with the educational attainment of high school diploma, with 94.4% or 17 individuals in the labor force. Within the labor force, individuals with college / associate degree education have the highest percentage of unemployment, with 8.9% or 5 of them being unemployed.
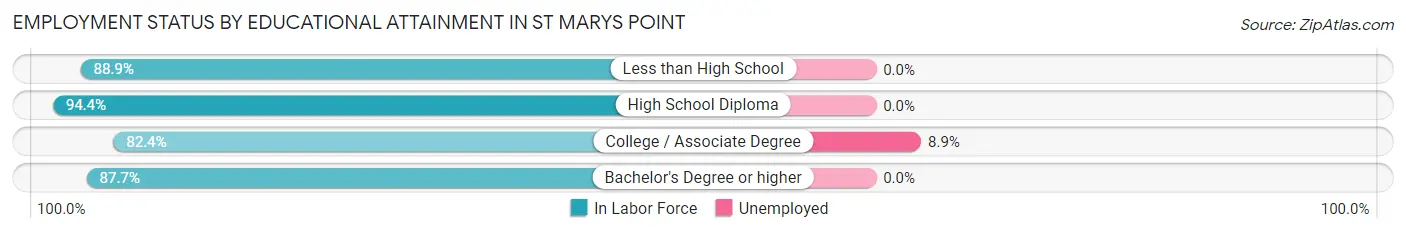
| Educational Attainment | In Labor Force | Unemployed |
| Less than High School | 8 (88.9%) | 0 (0.0%) |
| High School Diploma | 17 (94.4%) | 0 (0.0%) |
| College / Associate Degree | 56 (82.4%) | 6 (8.9%) |
| Bachelor's Degree or higher | 100 (87.7%) | 0 (0.0%) |
| Total | 181 (86.6%) | 6 (2.8%) |
Employment Occupations by Sex in St Marys Point
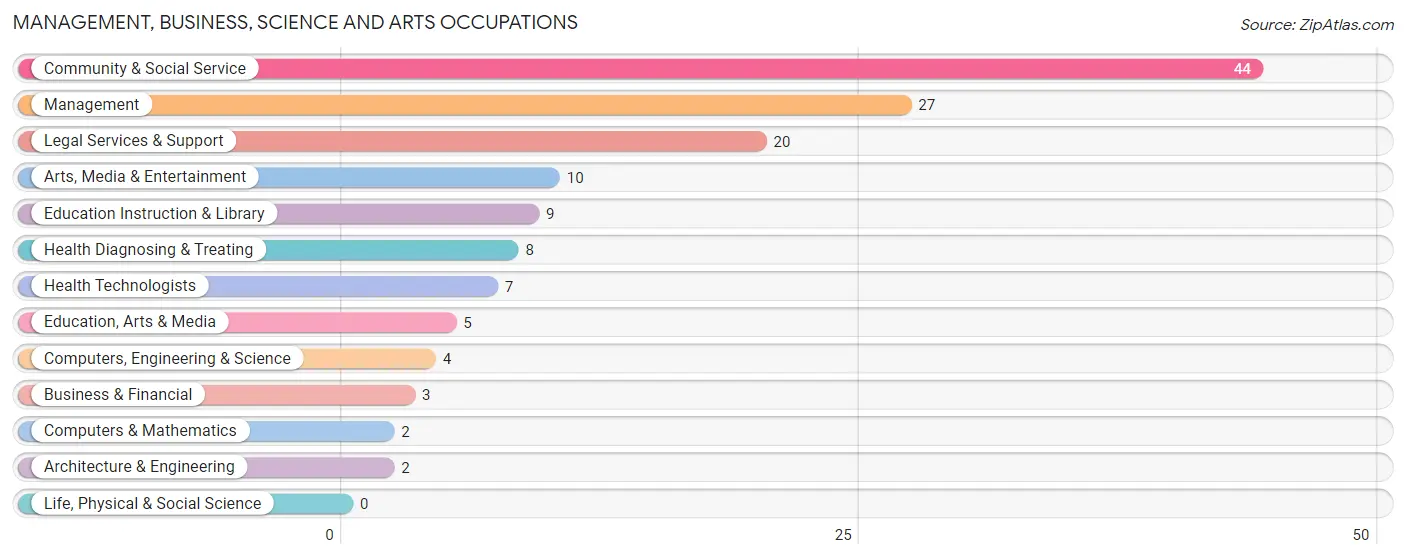
Management, Business, Science and Arts Occupations
The most common Management, Business, Science and Arts occupations in St Marys Point are Community & Social Service (44 | 19.9%), Management (27 | 12.2%), Legal Services & Support (20 | 9.0%), Arts, Media & Entertainment (10 | 4.5%), and Education Instruction & Library (9 | 4.1%).
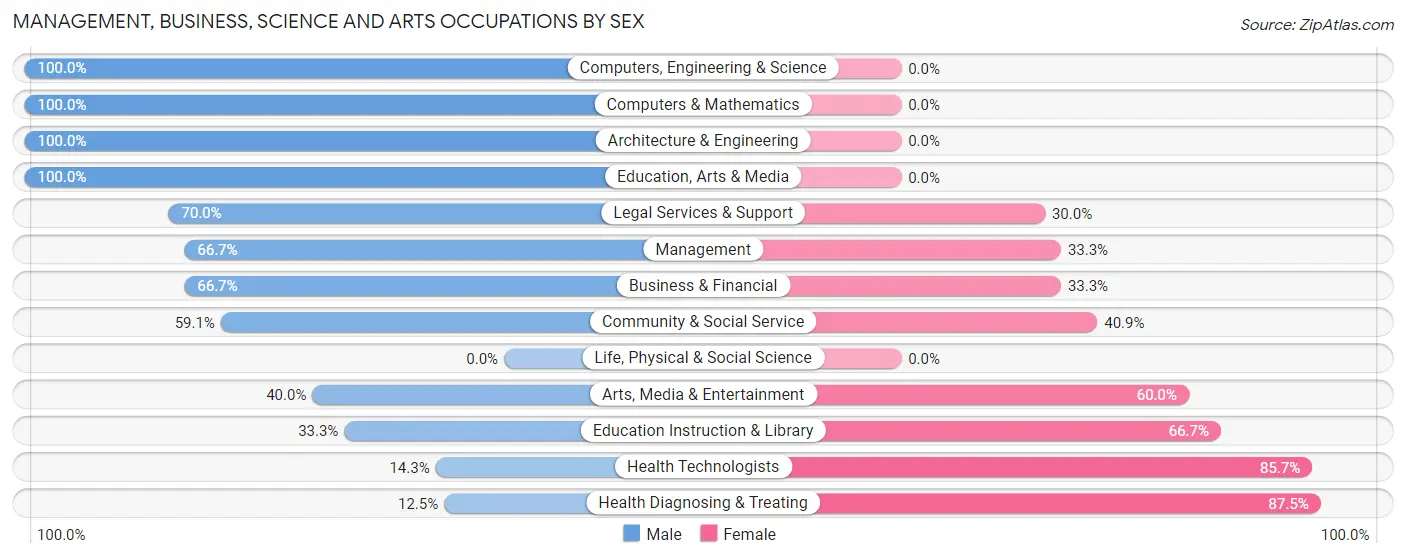
Management, Business, Science and Arts Occupations by Sex
Within the Management, Business, Science and Arts occupations in St Marys Point, the most male-oriented occupations are Computers, Engineering & Science (100.0%), Computers & Mathematics (100.0%), and Architecture & Engineering (100.0%), while the most female-oriented occupations are Health Diagnosing & Treating (87.5%), Health Technologists (85.7%), and Education Instruction & Library (66.7%).
| Occupation | Male | Female |
| Management | 18 (66.7%) | 9 (33.3%) |
| Business & Financial | 2 (66.7%) | 1 (33.3%) |
| Computers, Engineering & Science | 4 (100.0%) | 0 (0.0%) |
| Computers & Mathematics | 2 (100.0%) | 0 (0.0%) |
| Architecture & Engineering | 2 (100.0%) | 0 (0.0%) |
| Life, Physical & Social Science | 0 (0.0%) | 0 (0.0%) |
| Community & Social Service | 26 (59.1%) | 18 (40.9%) |
| Education, Arts & Media | 5 (100.0%) | 0 (0.0%) |
| Legal Services & Support | 14 (70.0%) | 6 (30.0%) |
| Education Instruction & Library | 3 (33.3%) | 6 (66.7%) |
| Arts, Media & Entertainment | 4 (40.0%) | 6 (60.0%) |
| Health Diagnosing & Treating | 1 (12.5%) | 7 (87.5%) |
| Health Technologists | 1 (14.3%) | 6 (85.7%) |
| Total (Category) | 51 (59.3%) | 35 (40.7%) |
| Total (Overall) | 117 (52.9%) | 104 (47.1%) |
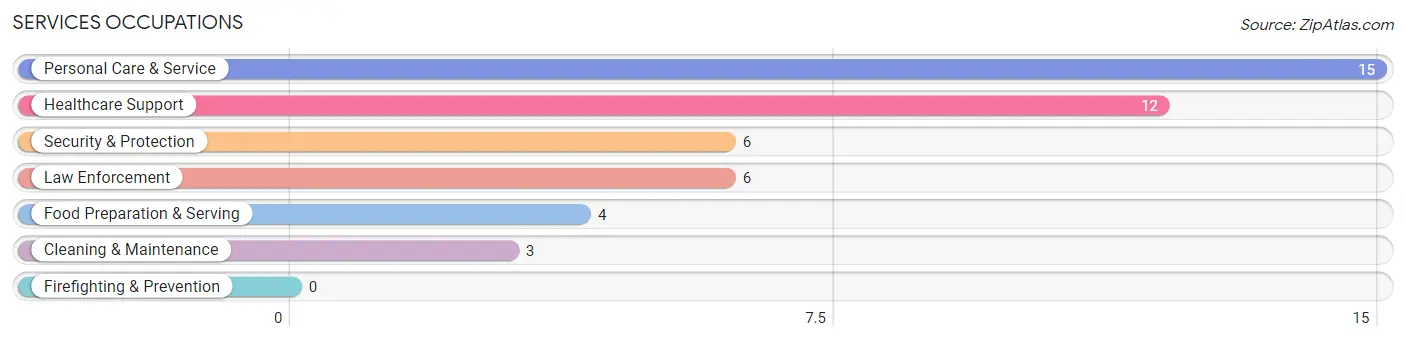
Services Occupations
The most common Services occupations in St Marys Point are Personal Care & Service (15 | 6.8%), Healthcare Support (12 | 5.4%), Security & Protection (6 | 2.7%), Law Enforcement (6 | 2.7%), and Food Preparation & Serving (4 | 1.8%).
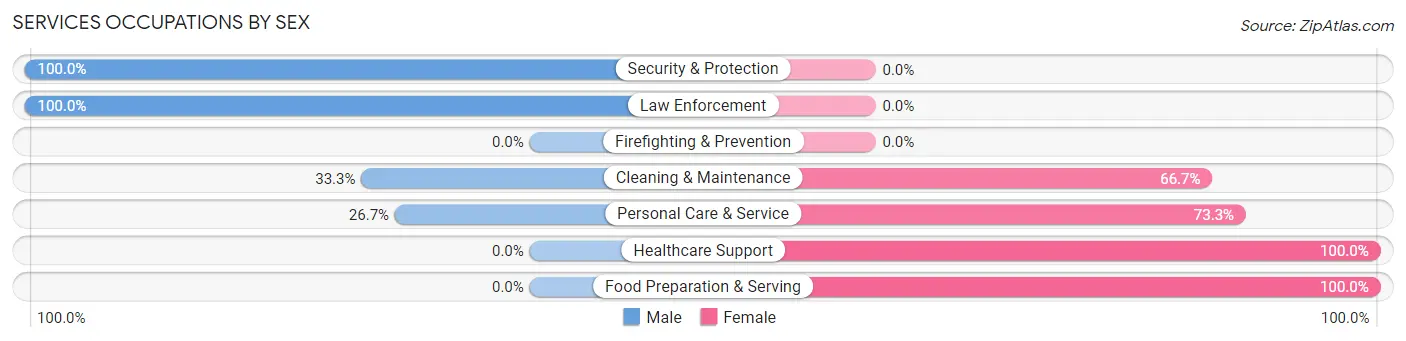
Services Occupations by Sex
Within the Services occupations in St Marys Point, the most male-oriented occupations are Security & Protection (100.0%), Law Enforcement (100.0%), and Cleaning & Maintenance (33.3%), while the most female-oriented occupations are Healthcare Support (100.0%), Food Preparation & Serving (100.0%), and Personal Care & Service (73.3%).
| Occupation | Male | Female |
| Healthcare Support | 0 (0.0%) | 12 (100.0%) |
| Security & Protection | 6 (100.0%) | 0 (0.0%) |
| Firefighting & Prevention | 0 (0.0%) | 0 (0.0%) |
| Law Enforcement | 6 (100.0%) | 0 (0.0%) |
| Food Preparation & Serving | 0 (0.0%) | 4 (100.0%) |
| Cleaning & Maintenance | 1 (33.3%) | 2 (66.7%) |
| Personal Care & Service | 4 (26.7%) | 11 (73.3%) |
| Total (Category) | 11 (27.5%) | 29 (72.5%) |
| Total (Overall) | 117 (52.9%) | 104 (47.1%) |
Sales and Office Occupations
The most common Sales and Office occupations in St Marys Point are Sales & Related (30 | 13.6%), and Office & Administration (29 | 13.1%).
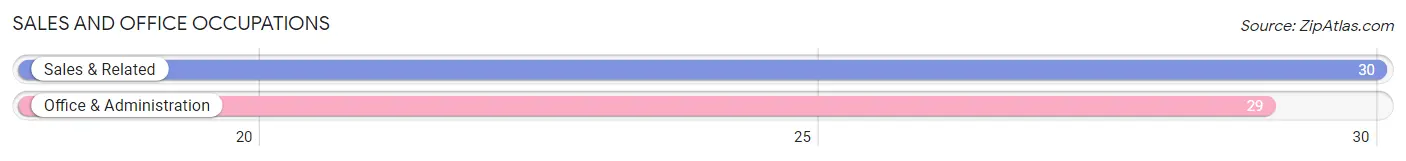
Sales and Office Occupations by Sex
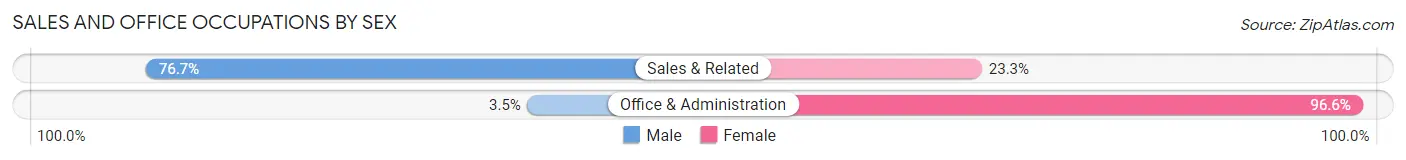
| Occupation | Male | Female |
| Sales & Related | 23 (76.7%) | 7 (23.3%) |
| Office & Administration | 1 (3.5%) | 28 (96.6%) |
| Total (Category) | 24 (40.7%) | 35 (59.3%) |
| Total (Overall) | 117 (52.9%) | 104 (47.1%) |
Natural Resources, Construction and Maintenance Occupations
The most common Natural Resources, Construction and Maintenance occupations in St Marys Point are Construction & Extraction (6 | 2.7%), and Installation, Maintenance & Repair (4 | 1.8%).
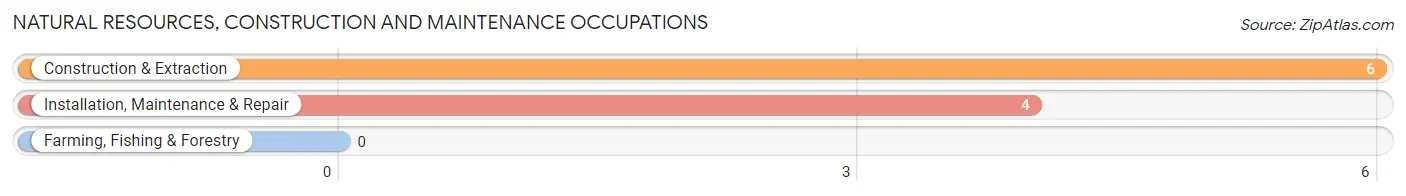
Natural Resources, Construction and Maintenance Occupations by Sex
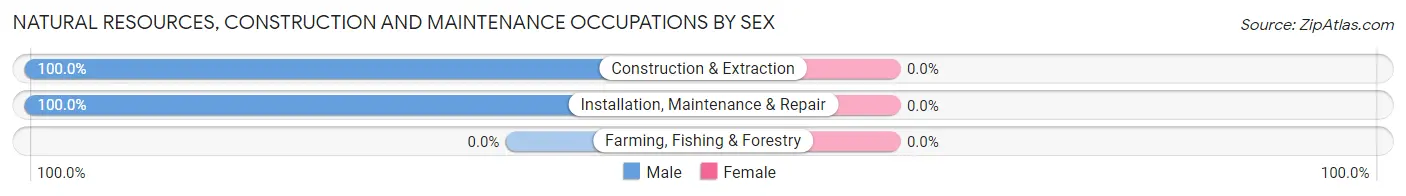
| Occupation | Male | Female |
| Farming, Fishing & Forestry | 0 (0.0%) | 0 (0.0%) |
| Construction & Extraction | 6 (100.0%) | 0 (0.0%) |
| Installation, Maintenance & Repair | 4 (100.0%) | 0 (0.0%) |
| Total (Category) | 10 (100.0%) | 0 (0.0%) |
| Total (Overall) | 117 (52.9%) | 104 (47.1%) |
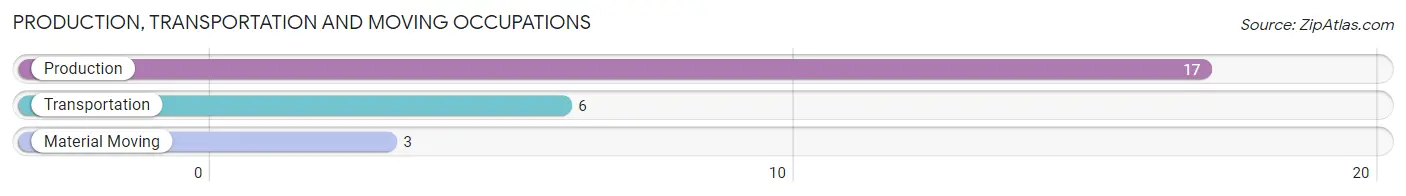
Production, Transportation and Moving Occupations
The most common Production, Transportation and Moving occupations in St Marys Point are Production (17 | 7.7%), Transportation (6 | 2.7%), and Material Moving (3 | 1.4%).
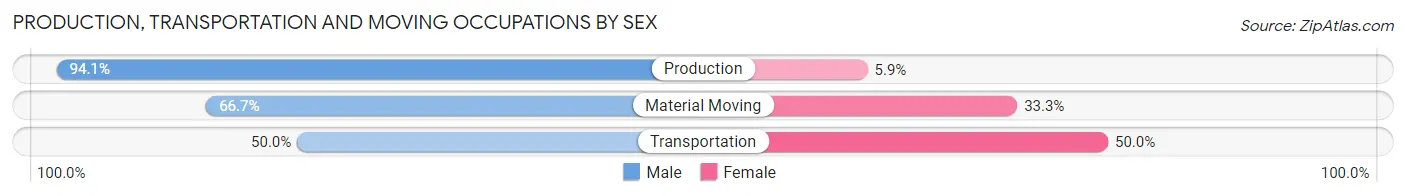
Production, Transportation and Moving Occupations by Sex
| Occupation | Male | Female |
| Production | 16 (94.1%) | 1 (5.9%) |
| Transportation | 3 (50.0%) | 3 (50.0%) |
| Material Moving | 2 (66.7%) | 1 (33.3%) |
| Total (Category) | 21 (80.8%) | 5 (19.2%) |
| Total (Overall) | 117 (52.9%) | 104 (47.1%) |
Employment Industries by Sex in St Marys Point
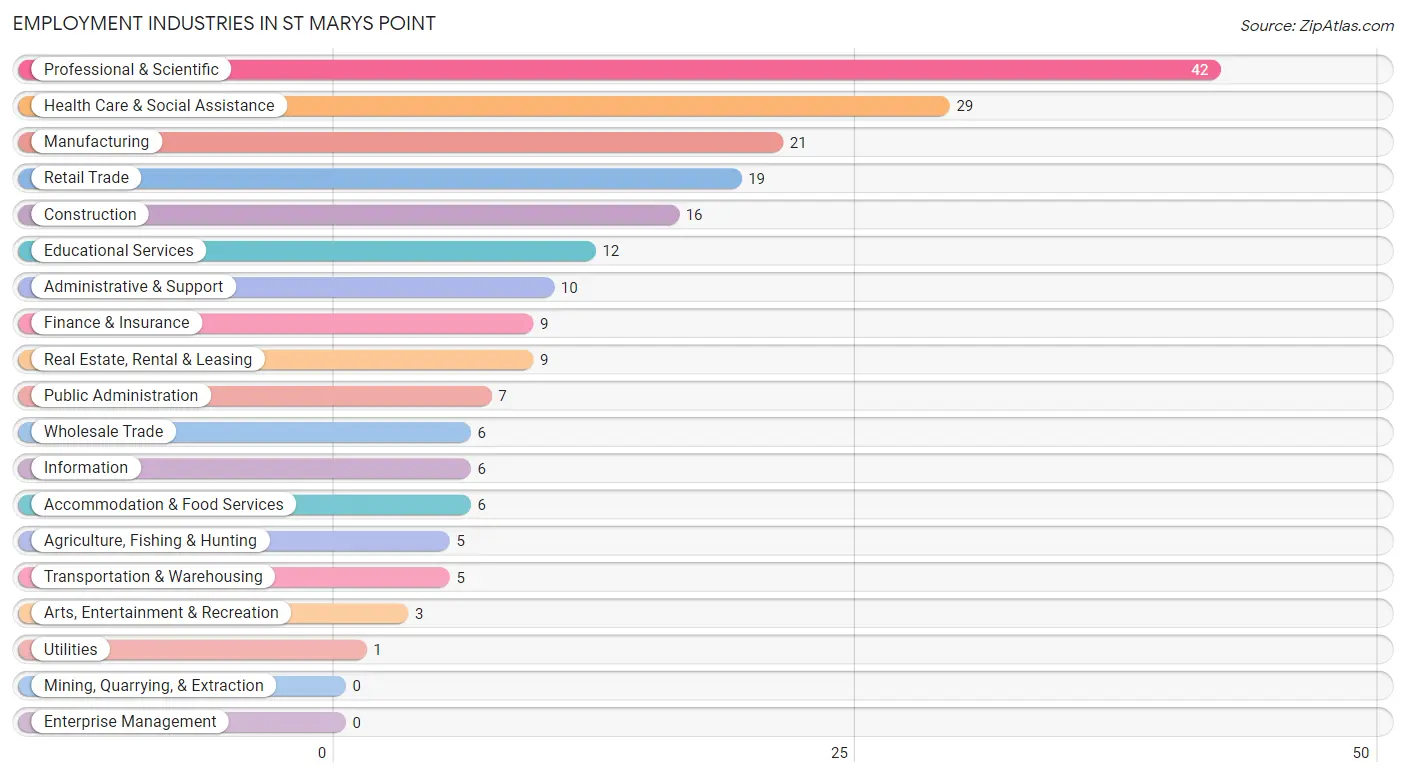
Employment Industries in St Marys Point
The major employment industries in St Marys Point include Professional & Scientific (42 | 19.0%), Health Care & Social Assistance (29 | 13.1%), Manufacturing (21 | 9.5%), Retail Trade (19 | 8.6%), and Construction (16 | 7.2%).
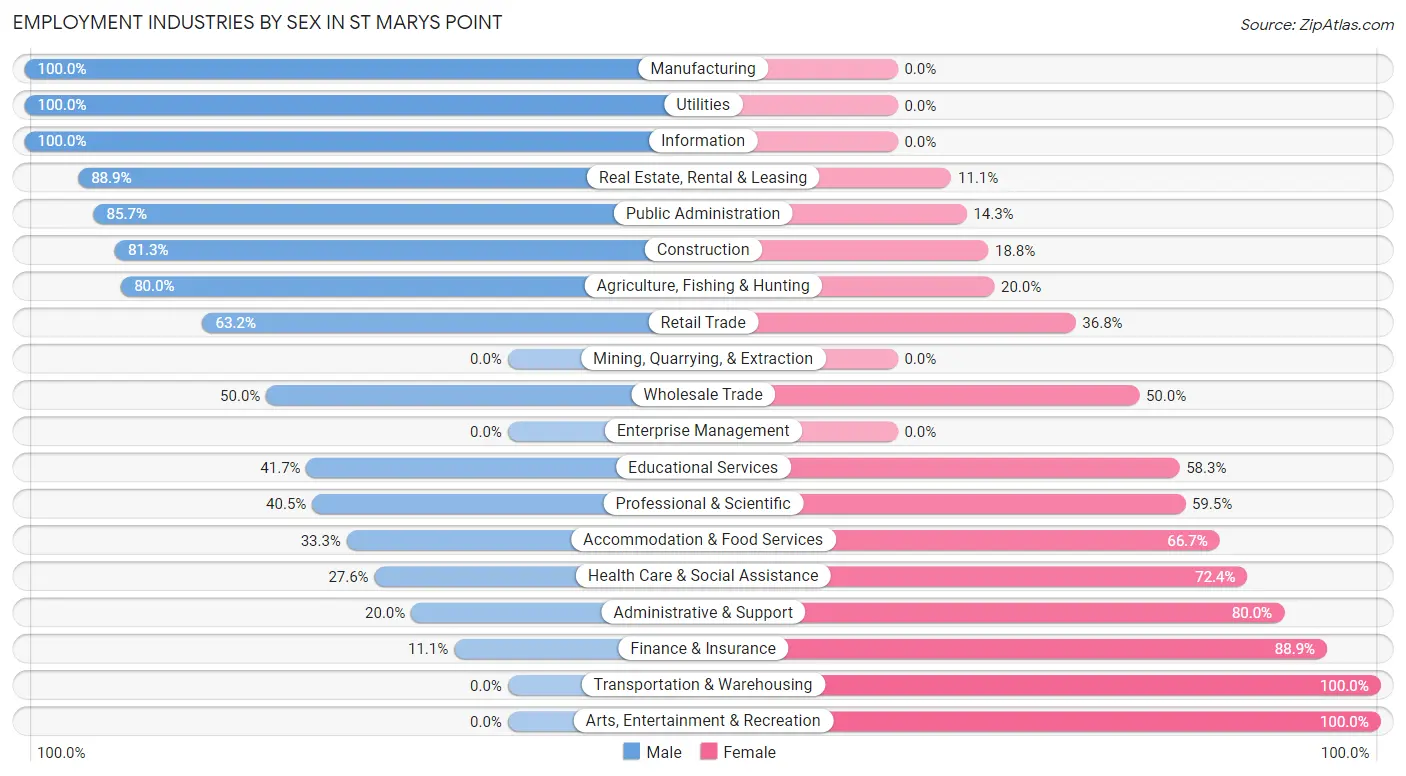
Employment Industries by Sex in St Marys Point
The St Marys Point industries that see more men than women are Manufacturing (100.0%), Utilities (100.0%), and Information (100.0%), whereas the industries that tend to have a higher number of women are Transportation & Warehousing (100.0%), Arts, Entertainment & Recreation (100.0%), and Finance & Insurance (88.9%).
| Industry | Male | Female |
| Agriculture, Fishing & Hunting | 4 (80.0%) | 1 (20.0%) |
| Mining, Quarrying, & Extraction | 0 (0.0%) | 0 (0.0%) |
| Construction | 13 (81.2%) | 3 (18.8%) |
| Manufacturing | 21 (100.0%) | 0 (0.0%) |
| Wholesale Trade | 3 (50.0%) | 3 (50.0%) |
| Retail Trade | 12 (63.2%) | 7 (36.8%) |
| Transportation & Warehousing | 0 (0.0%) | 5 (100.0%) |
| Utilities | 1 (100.0%) | 0 (0.0%) |
| Information | 6 (100.0%) | 0 (0.0%) |
| Finance & Insurance | 1 (11.1%) | 8 (88.9%) |
| Real Estate, Rental & Leasing | 8 (88.9%) | 1 (11.1%) |
| Professional & Scientific | 17 (40.5%) | 25 (59.5%) |
| Enterprise Management | 0 (0.0%) | 0 (0.0%) |
| Administrative & Support | 2 (20.0%) | 8 (80.0%) |
| Educational Services | 5 (41.7%) | 7 (58.3%) |
| Health Care & Social Assistance | 8 (27.6%) | 21 (72.4%) |
| Arts, Entertainment & Recreation | 0 (0.0%) | 3 (100.0%) |
| Accommodation & Food Services | 2 (33.3%) | 4 (66.7%) |
| Public Administration | 6 (85.7%) | 1 (14.3%) |
| Total | 117 (52.9%) | 104 (47.1%) |
Education in St Marys Point
School Enrollment in St Marys Point
The most common levels of schooling among the 93 students in St Marys Point are college / undergraduate (27 | 29.0%), high school (21 | 22.6%), and elementary school (19 | 20.4%).
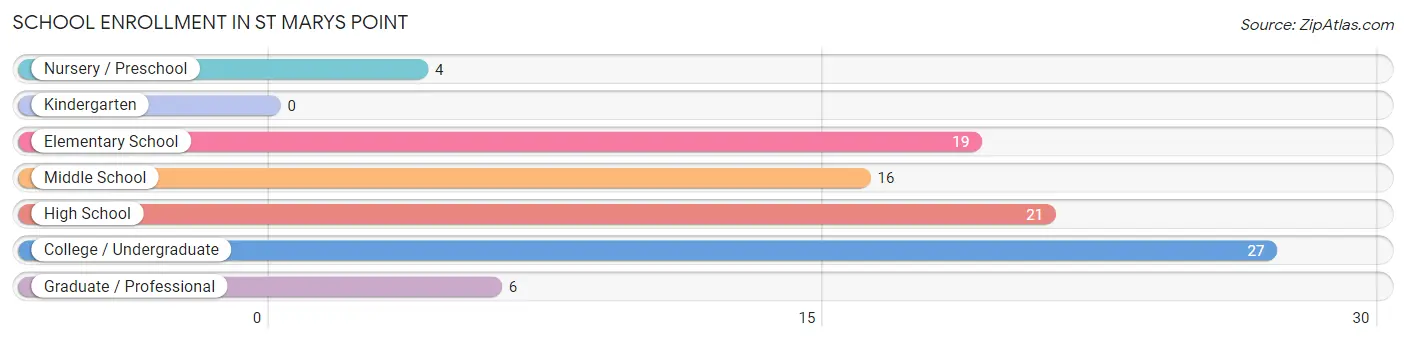
| School Level | # Students | % Students |
| Nursery / Preschool | 4 | 4.3% |
| Kindergarten | 0 | 0.0% |
| Elementary School | 19 | 20.4% |
| Middle School | 16 | 17.2% |
| High School | 21 | 22.6% |
| College / Undergraduate | 27 | 29.0% |
| Graduate / Professional | 6 | 6.5% |
| Total | 93 | 100.0% |
School Enrollment by Age by Funding Source in St Marys Point
Out of a total of 93 students who are enrolled in schools in St Marys Point, 22 (23.7%) attend a private institution, while the remaining 71 (76.3%) are enrolled in public schools. The age group of 3 to 4 year olds has the highest likelihood of being enrolled in private schools, with 2 (100.0% in the age bracket) enrolled. Conversely, the age group of 18 to 19 year olds has the lowest likelihood of being enrolled in a private school, with 3 (100.0% in the age bracket) attending a public institution.
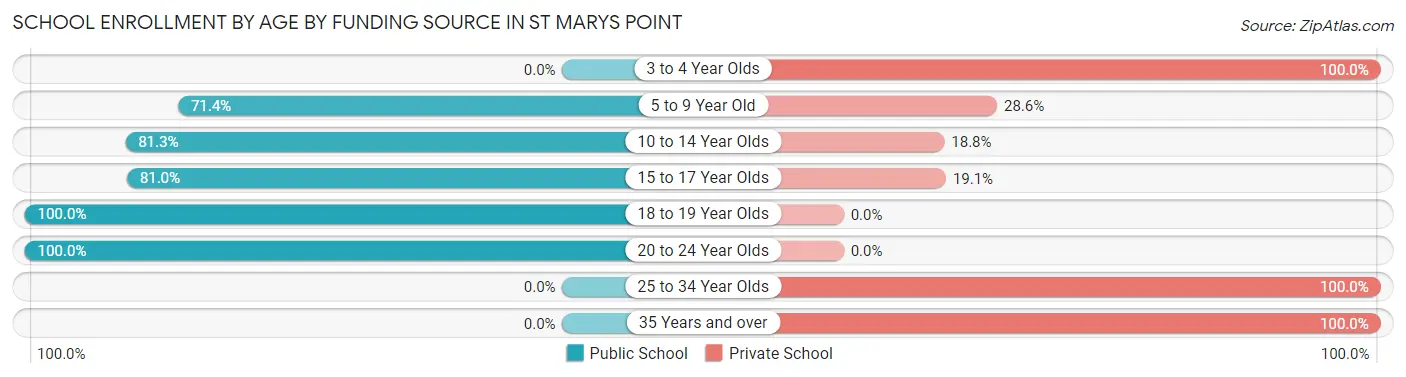
| Age Bracket | Public School | Private School |
| 3 to 4 Year Olds | 0 (0.0%) | 2 (100.0%) |
| 5 to 9 Year Old | 15 (71.4%) | 6 (28.6%) |
| 10 to 14 Year Olds | 13 (81.2%) | 3 (18.8%) |
| 15 to 17 Year Olds | 17 (80.9%) | 4 (19.1%) |
| 18 to 19 Year Olds | 3 (100.0%) | 0 (0.0%) |
| 20 to 24 Year Olds | 23 (100.0%) | 0 (0.0%) |
| 25 to 34 Year Olds | 0 (0.0%) | 1 (100.0%) |
| 35 Years and over | 0 (0.0%) | 6 (100.0%) |
| Total | 71 (76.3%) | 22 (23.7%) |
Educational Attainment by Field of Study in St Marys Point
Business (37 | 20.8%), visual & performing arts (32 | 18.0%), science & technology (18 | 10.1%), liberal arts & history (18 | 10.1%), and education (17 | 9.6%) are the most common fields of study among 178 individuals in St Marys Point who have obtained a bachelor's degree or higher.
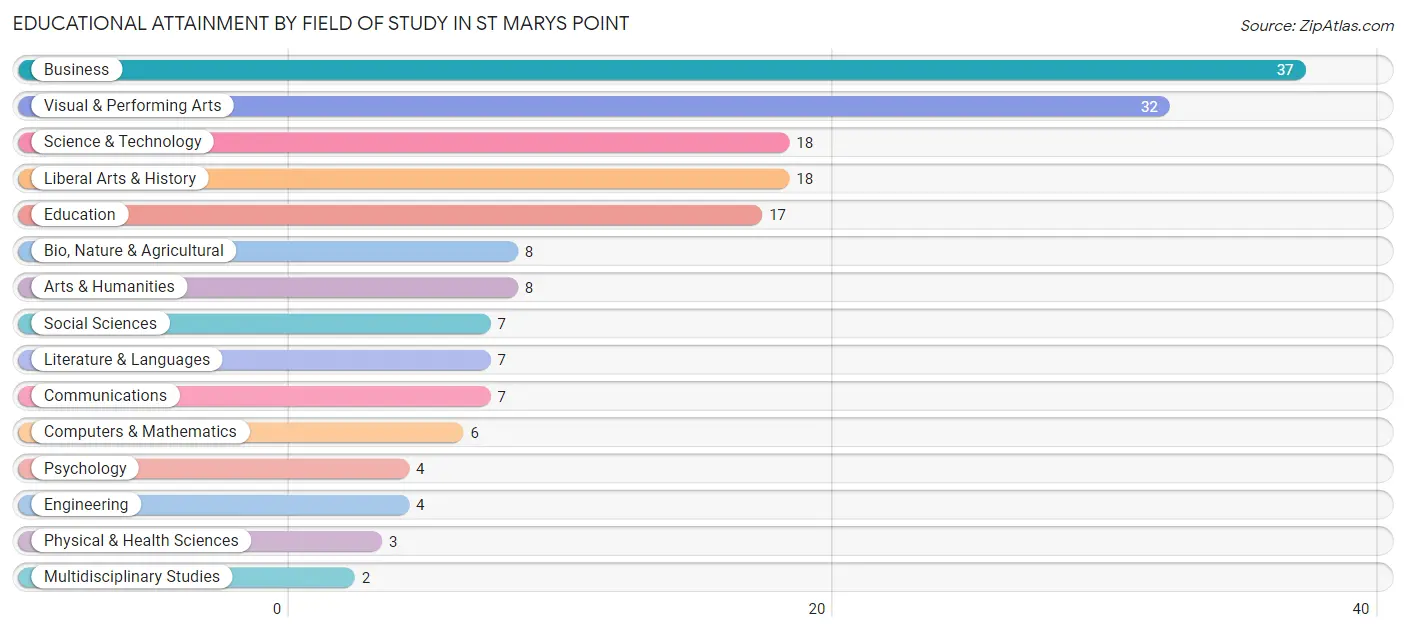
| Field of Study | # Graduates | % Graduates |
| Computers & Mathematics | 6 | 3.4% |
| Bio, Nature & Agricultural | 8 | 4.5% |
| Physical & Health Sciences | 3 | 1.7% |
| Psychology | 4 | 2.2% |
| Social Sciences | 7 | 3.9% |
| Engineering | 4 | 2.2% |
| Multidisciplinary Studies | 2 | 1.1% |
| Science & Technology | 18 | 10.1% |
| Business | 37 | 20.8% |
| Education | 17 | 9.6% |
| Literature & Languages | 7 | 3.9% |
| Liberal Arts & History | 18 | 10.1% |
| Visual & Performing Arts | 32 | 18.0% |
| Communications | 7 | 3.9% |
| Arts & Humanities | 8 | 4.5% |
| Total | 178 | 100.0% |
Transportation & Commute in St Marys Point
Vehicle Availability by Sex in St Marys Point
The most prevalent vehicle ownership categories in St Marys Point are males with 2 vehicles (39, accounting for 35.1%) and females with 2 vehicles (38, making up 37.5%).
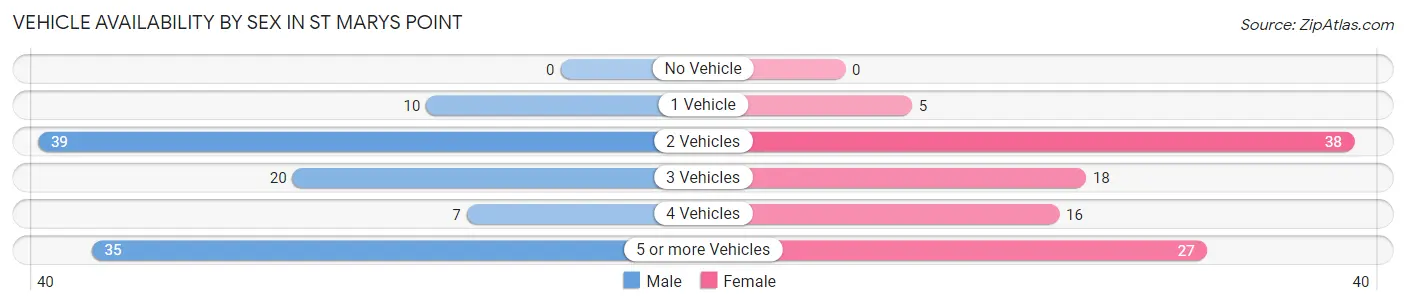
| Vehicles Available | Male | Female |
| No Vehicle | 0 (0.0%) | 0 (0.0%) |
| 1 Vehicle | 10 (9.0%) | 5 (4.8%) |
| 2 Vehicles | 39 (35.1%) | 38 (36.5%) |
| 3 Vehicles | 20 (18.0%) | 18 (17.3%) |
| 4 Vehicles | 7 (6.3%) | 16 (15.4%) |
| 5 or more Vehicles | 35 (31.5%) | 27 (26.0%) |
| Total | 111 (100.0%) | 104 (100.0%) |
Commute Time in St Marys Point
The most frequently occuring commute durations in St Marys Point are 10 to 14 minutes (33 commuters, 17.6%), 20 to 24 minutes (28 commuters, 15.0%), and 25 to 29 minutes (26 commuters, 13.9%).
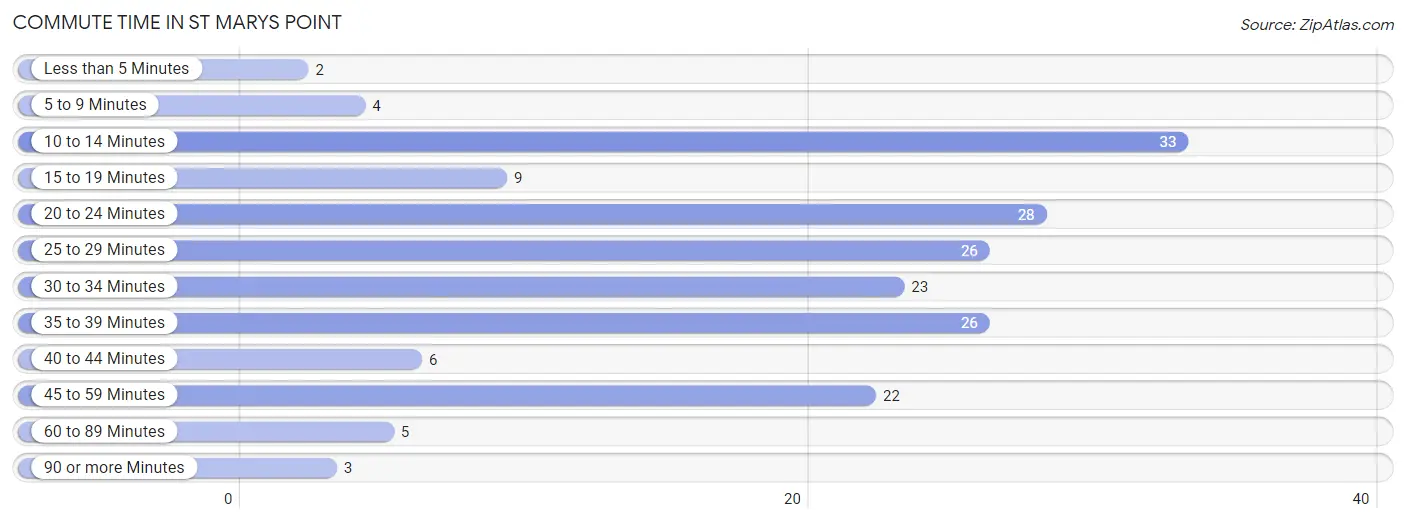
| Commute Time | # Commuters | % Commuters |
| Less than 5 Minutes | 2 | 1.1% |
| 5 to 9 Minutes | 4 | 2.1% |
| 10 to 14 Minutes | 33 | 17.6% |
| 15 to 19 Minutes | 9 | 4.8% |
| 20 to 24 Minutes | 28 | 15.0% |
| 25 to 29 Minutes | 26 | 13.9% |
| 30 to 34 Minutes | 23 | 12.3% |
| 35 to 39 Minutes | 26 | 13.9% |
| 40 to 44 Minutes | 6 | 3.2% |
| 45 to 59 Minutes | 22 | 11.8% |
| 60 to 89 Minutes | 5 | 2.7% |
| 90 or more Minutes | 3 | 1.6% |
Commute Time by Sex in St Marys Point
The most common commute times in St Marys Point are 35 to 39 minutes (26 commuters, 24.5%) for males and 25 to 29 minutes (21 commuters, 25.9%) for females.
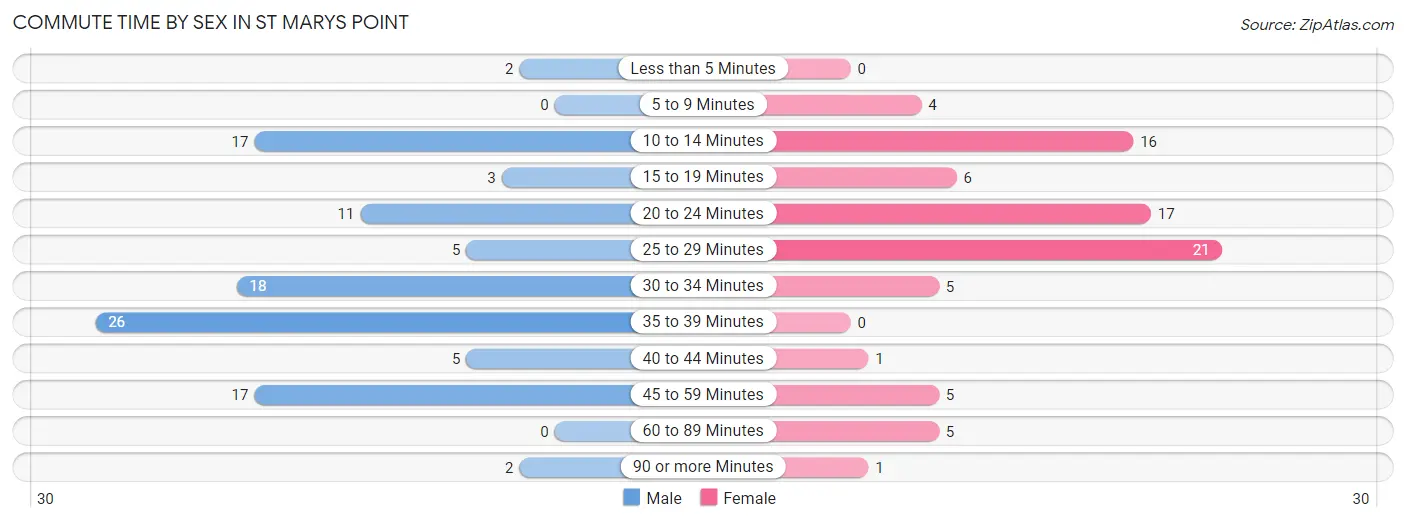
| Commute Time | Male | Female |
| Less than 5 Minutes | 2 (1.9%) | 0 (0.0%) |
| 5 to 9 Minutes | 0 (0.0%) | 4 (4.9%) |
| 10 to 14 Minutes | 17 (16.0%) | 16 (19.8%) |
| 15 to 19 Minutes | 3 (2.8%) | 6 (7.4%) |
| 20 to 24 Minutes | 11 (10.4%) | 17 (21.0%) |
| 25 to 29 Minutes | 5 (4.7%) | 21 (25.9%) |
| 30 to 34 Minutes | 18 (17.0%) | 5 (6.2%) |
| 35 to 39 Minutes | 26 (24.5%) | 0 (0.0%) |
| 40 to 44 Minutes | 5 (4.7%) | 1 (1.2%) |
| 45 to 59 Minutes | 17 (16.0%) | 5 (6.2%) |
| 60 to 89 Minutes | 0 (0.0%) | 5 (6.2%) |
| 90 or more Minutes | 2 (1.9%) | 1 (1.2%) |
Time of Departure to Work by Sex in St Marys Point
The most frequent times of departure to work in St Marys Point are 8:30 AM to 8:59 AM (20, 18.9%) for males and 9:00 AM to 9:59 AM (24, 29.6%) for females.
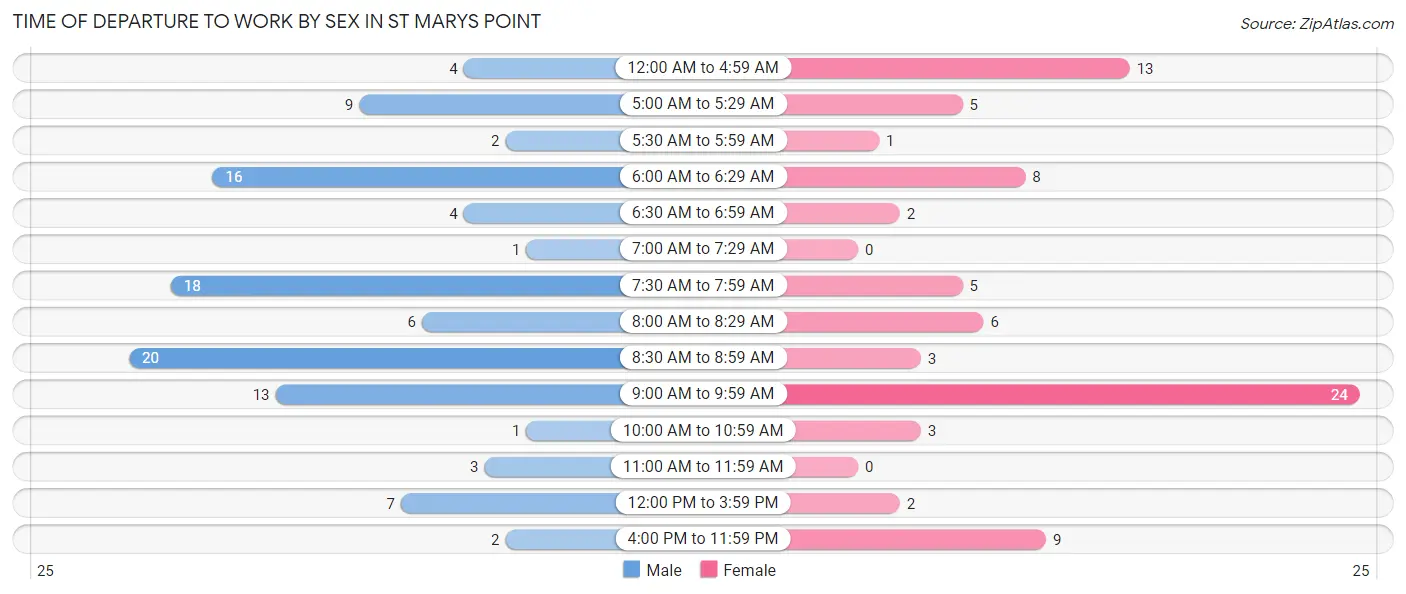
| Time of Departure | Male | Female |
| 12:00 AM to 4:59 AM | 4 (3.8%) | 13 (16.1%) |
| 5:00 AM to 5:29 AM | 9 (8.5%) | 5 (6.2%) |
| 5:30 AM to 5:59 AM | 2 (1.9%) | 1 (1.2%) |
| 6:00 AM to 6:29 AM | 16 (15.1%) | 8 (9.9%) |
| 6:30 AM to 6:59 AM | 4 (3.8%) | 2 (2.5%) |
| 7:00 AM to 7:29 AM | 1 (0.9%) | 0 (0.0%) |
| 7:30 AM to 7:59 AM | 18 (17.0%) | 5 (6.2%) |
| 8:00 AM to 8:29 AM | 6 (5.7%) | 6 (7.4%) |
| 8:30 AM to 8:59 AM | 20 (18.9%) | 3 (3.7%) |
| 9:00 AM to 9:59 AM | 13 (12.3%) | 24 (29.6%) |
| 10:00 AM to 10:59 AM | 1 (0.9%) | 3 (3.7%) |
| 11:00 AM to 11:59 AM | 3 (2.8%) | 0 (0.0%) |
| 12:00 PM to 3:59 PM | 7 (6.6%) | 2 (2.5%) |
| 4:00 PM to 11:59 PM | 2 (1.9%) | 9 (11.1%) |
| Total | 106 (100.0%) | 81 (100.0%) |
Housing Occupancy in St Marys Point
Occupancy by Ownership in St Marys Point
Of the total 169 dwellings in St Marys Point, owner-occupied units account for 147 (87.0%), while renter-occupied units make up 22 (13.0%).
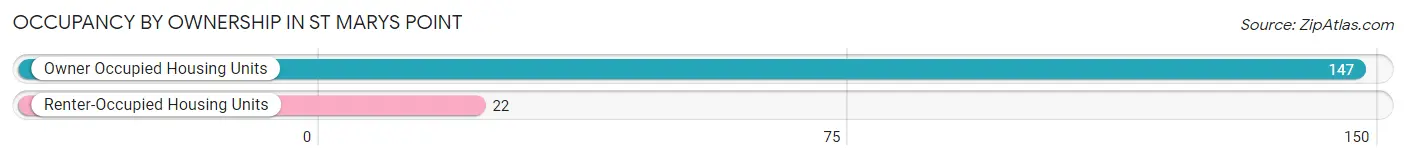
| Occupancy | # Housing Units | % Housing Units |
| Owner Occupied Housing Units | 147 | 87.0% |
| Renter-Occupied Housing Units | 22 | 13.0% |
| Total Occupied Housing Units | 169 | 100.0% |
Occupancy by Household Size in St Marys Point
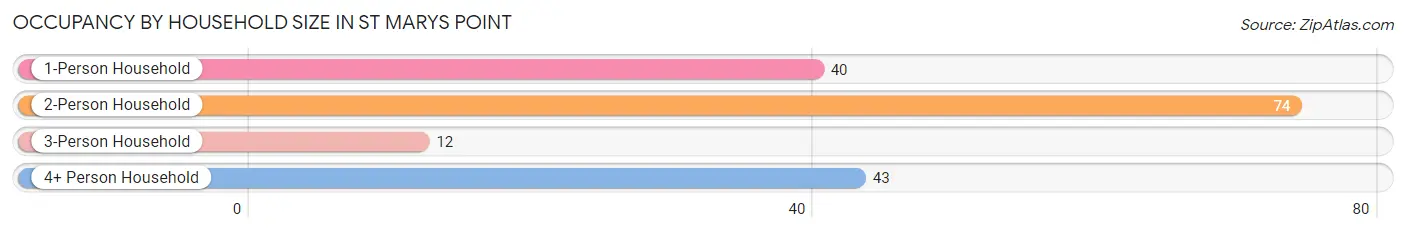
| Household Size | # Housing Units | % Housing Units |
| 1-Person Household | 40 | 23.7% |
| 2-Person Household | 74 | 43.8% |
| 3-Person Household | 12 | 7.1% |
| 4+ Person Household | 43 | 25.4% |
| Total Housing Units | 169 | 100.0% |
Occupancy by Ownership by Household Size in St Marys Point
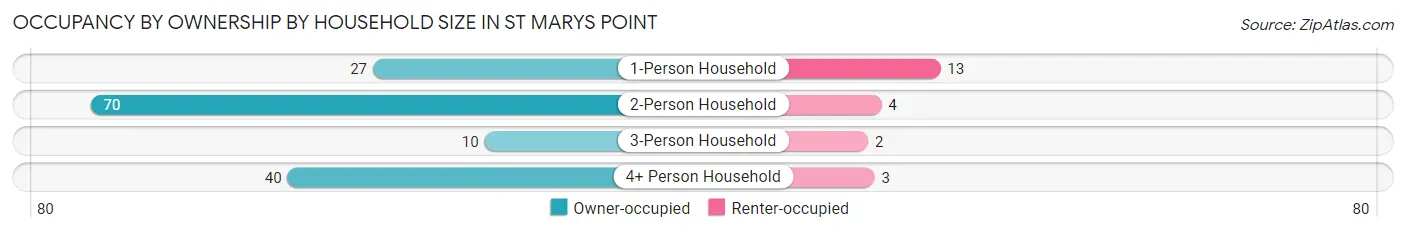
| Household Size | Owner-occupied | Renter-occupied |
| 1-Person Household | 27 (67.5%) | 13 (32.5%) |
| 2-Person Household | 70 (94.6%) | 4 (5.4%) |
| 3-Person Household | 10 (83.3%) | 2 (16.7%) |
| 4+ Person Household | 40 (93.0%) | 3 (7.0%) |
| Total Housing Units | 147 (87.0%) | 22 (13.0%) |
Occupancy by Educational Attainment in St Marys Point
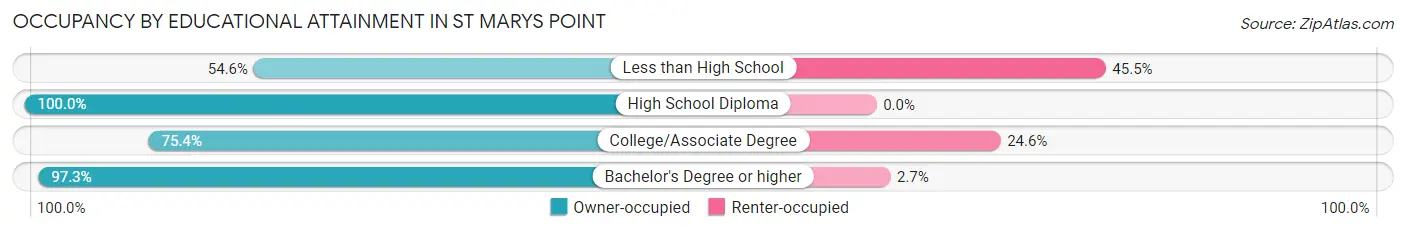
| Household Size | Owner-occupied | Renter-occupied |
| Less than High School | 6 (54.5%) | 5 (45.5%) |
| High School Diploma | 24 (100.0%) | 0 (0.0%) |
| College/Associate Degree | 46 (75.4%) | 15 (24.6%) |
| Bachelor's Degree or higher | 71 (97.3%) | 2 (2.7%) |
Occupancy by Age of Householder in St Marys Point
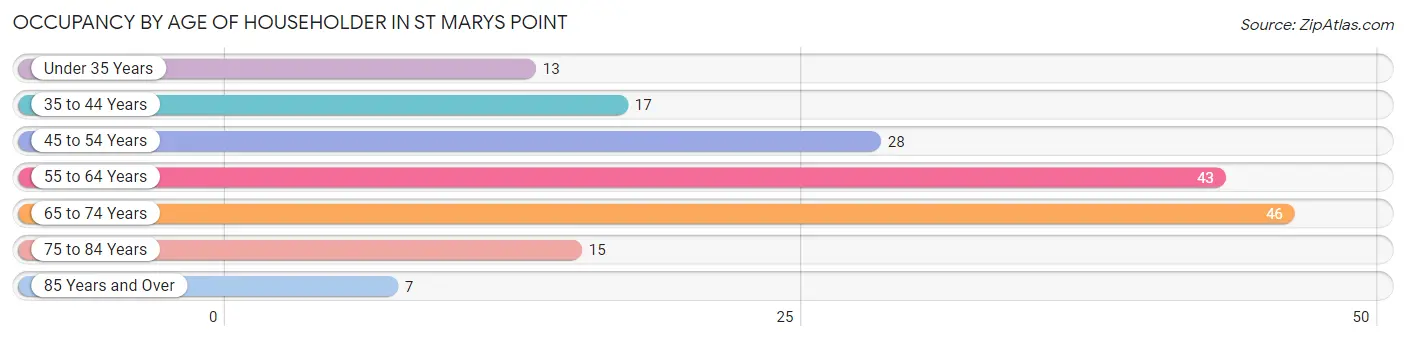
| Age Bracket | # Households | % Households |
| Under 35 Years | 13 | 7.7% |
| 35 to 44 Years | 17 | 10.1% |
| 45 to 54 Years | 28 | 16.6% |
| 55 to 64 Years | 43 | 25.4% |
| 65 to 74 Years | 46 | 27.2% |
| 75 to 84 Years | 15 | 8.9% |
| 85 Years and Over | 7 | 4.1% |
| Total | 169 | 100.0% |
Housing Finances in St Marys Point
Median Income by Occupancy in St Marys Point
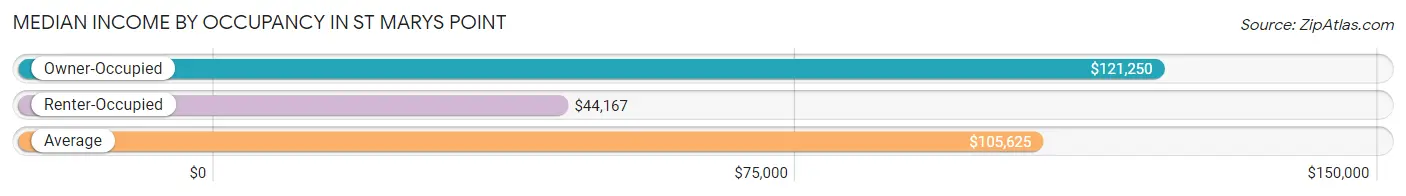
| Occupancy Type | # Households | Median Income |
| Owner-Occupied | 147 (87.0%) | $121,250 |
| Renter-Occupied | 22 (13.0%) | $44,167 |
| Average | 169 (100.0%) | $105,625 |
Occupancy by Householder Income Bracket in St Marys Point
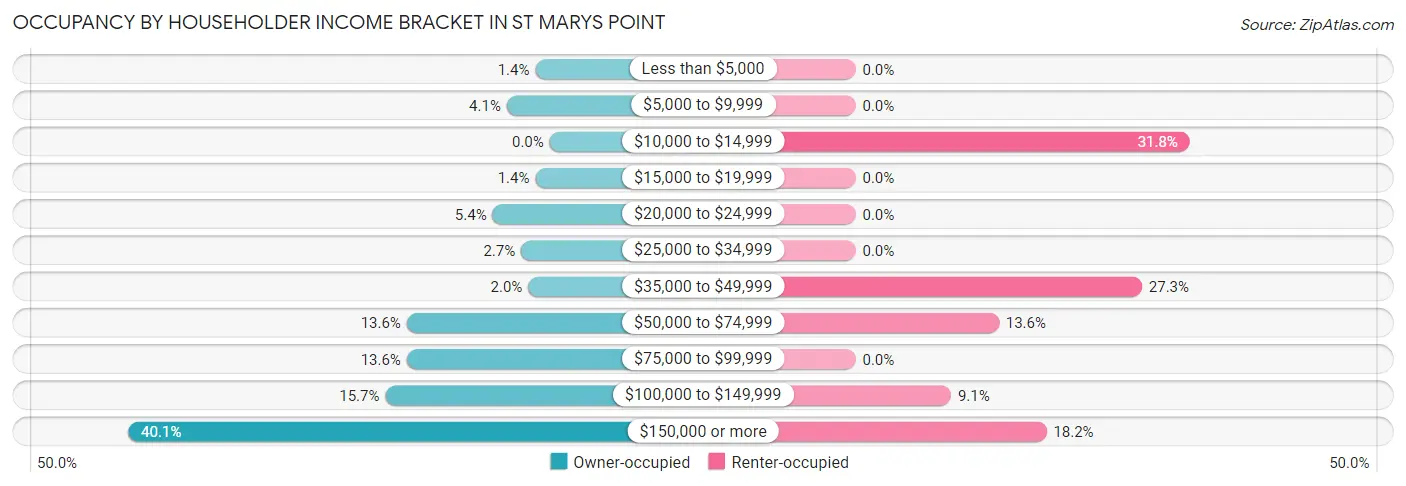
| Income Bracket | Owner-occupied | Renter-occupied |
| Less than $5,000 | 2 (1.4%) | 0 (0.0%) |
| $5,000 to $9,999 | 6 (4.1%) | 0 (0.0%) |
| $10,000 to $14,999 | 0 (0.0%) | 7 (31.8%) |
| $15,000 to $19,999 | 2 (1.4%) | 0 (0.0%) |
| $20,000 to $24,999 | 8 (5.4%) | 0 (0.0%) |
| $25,000 to $34,999 | 4 (2.7%) | 0 (0.0%) |
| $35,000 to $49,999 | 3 (2.0%) | 6 (27.3%) |
| $50,000 to $74,999 | 20 (13.6%) | 3 (13.6%) |
| $75,000 to $99,999 | 20 (13.6%) | 0 (0.0%) |
| $100,000 to $149,999 | 23 (15.7%) | 2 (9.1%) |
| $150,000 or more | 59 (40.1%) | 4 (18.2%) |
| Total | 147 (100.0%) | 22 (100.0%) |
Monthly Housing Cost Tiers in St Marys Point
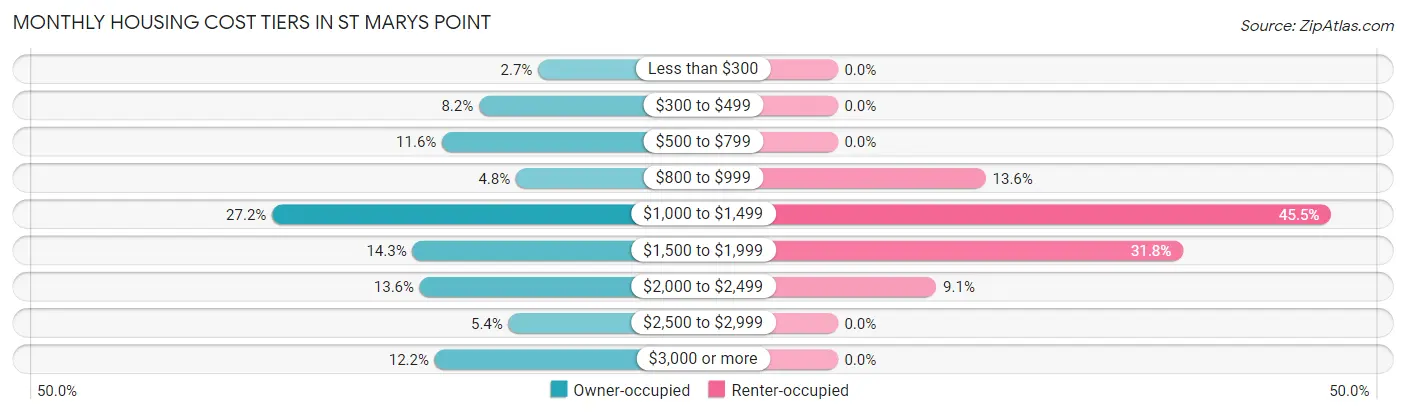
| Monthly Cost | Owner-occupied | Renter-occupied |
| Less than $300 | 4 (2.7%) | 0 (0.0%) |
| $300 to $499 | 12 (8.2%) | 0 (0.0%) |
| $500 to $799 | 17 (11.6%) | 0 (0.0%) |
| $800 to $999 | 7 (4.8%) | 3 (13.6%) |
| $1,000 to $1,499 | 40 (27.2%) | 10 (45.5%) |
| $1,500 to $1,999 | 21 (14.3%) | 7 (31.8%) |
| $2,000 to $2,499 | 20 (13.6%) | 2 (9.1%) |
| $2,500 to $2,999 | 8 (5.4%) | 0 (0.0%) |
| $3,000 or more | 18 (12.2%) | 0 (0.0%) |
| Total | 147 (100.0%) | 22 (100.0%) |
Physical Housing Characteristics in St Marys Point
Housing Structures in St Marys Point
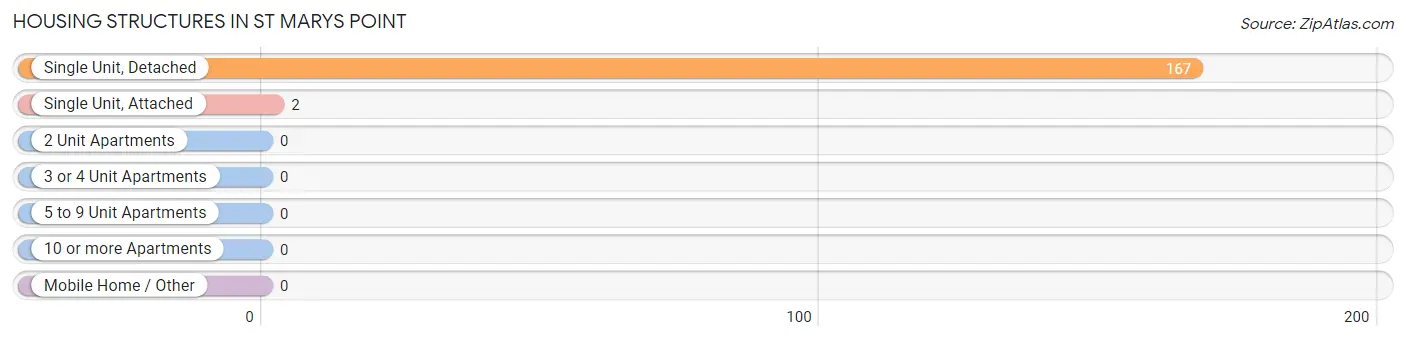
| Structure Type | # Housing Units | % Housing Units |
| Single Unit, Detached | 167 | 98.8% |
| Single Unit, Attached | 2 | 1.2% |
| 2 Unit Apartments | 0 | 0.0% |
| 3 or 4 Unit Apartments | 0 | 0.0% |
| 5 to 9 Unit Apartments | 0 | 0.0% |
| 10 or more Apartments | 0 | 0.0% |
| Mobile Home / Other | 0 | 0.0% |
| Total | 169 | 100.0% |
Housing Structures by Occupancy in St Marys Point
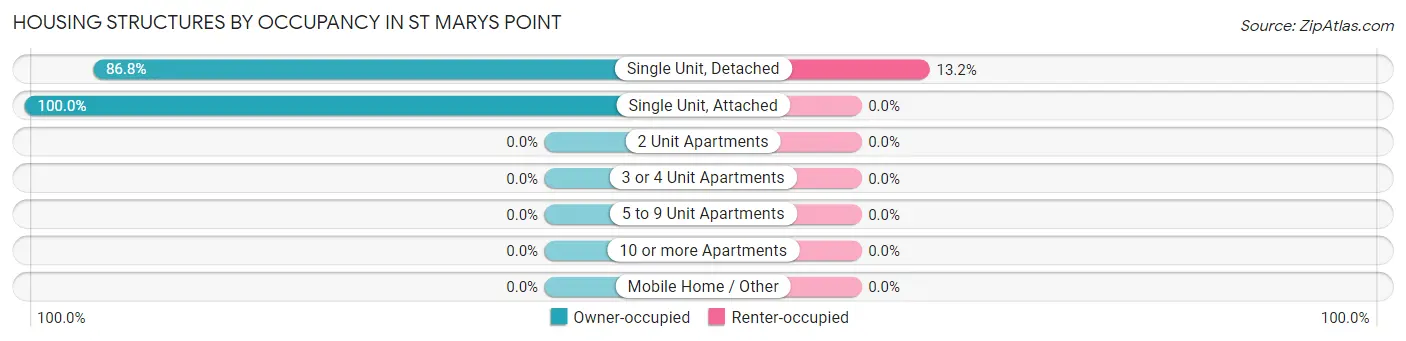
| Structure Type | Owner-occupied | Renter-occupied |
| Single Unit, Detached | 145 (86.8%) | 22 (13.2%) |
| Single Unit, Attached | 2 (100.0%) | 0 (0.0%) |
| 2 Unit Apartments | 0 (0.0%) | 0 (0.0%) |
| 3 or 4 Unit Apartments | 0 (0.0%) | 0 (0.0%) |
| 5 to 9 Unit Apartments | 0 (0.0%) | 0 (0.0%) |
| 10 or more Apartments | 0 (0.0%) | 0 (0.0%) |
| Mobile Home / Other | 0 (0.0%) | 0 (0.0%) |
| Total | 147 (87.0%) | 22 (13.0%) |
Housing Structures by Number of Rooms in St Marys Point
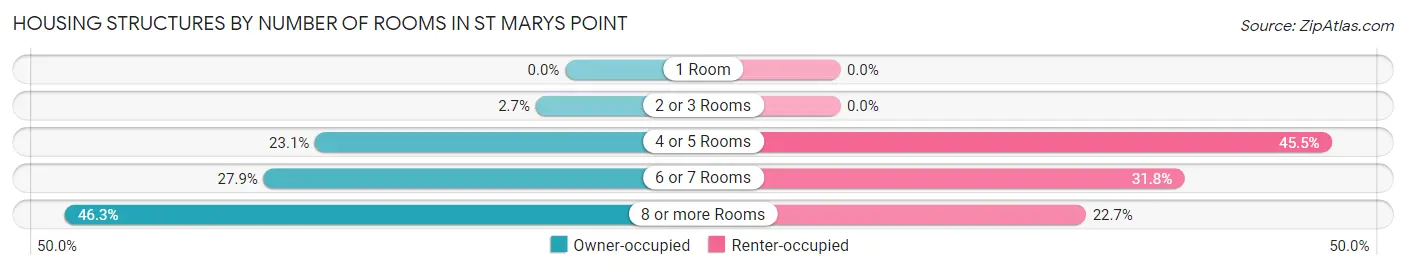
| Number of Rooms | Owner-occupied | Renter-occupied |
| 1 Room | 0 (0.0%) | 0 (0.0%) |
| 2 or 3 Rooms | 4 (2.7%) | 0 (0.0%) |
| 4 or 5 Rooms | 34 (23.1%) | 10 (45.5%) |
| 6 or 7 Rooms | 41 (27.9%) | 7 (31.8%) |
| 8 or more Rooms | 68 (46.3%) | 5 (22.7%) |
| Total | 147 (100.0%) | 22 (100.0%) |
Housing Structure by Heating Type in St Marys Point
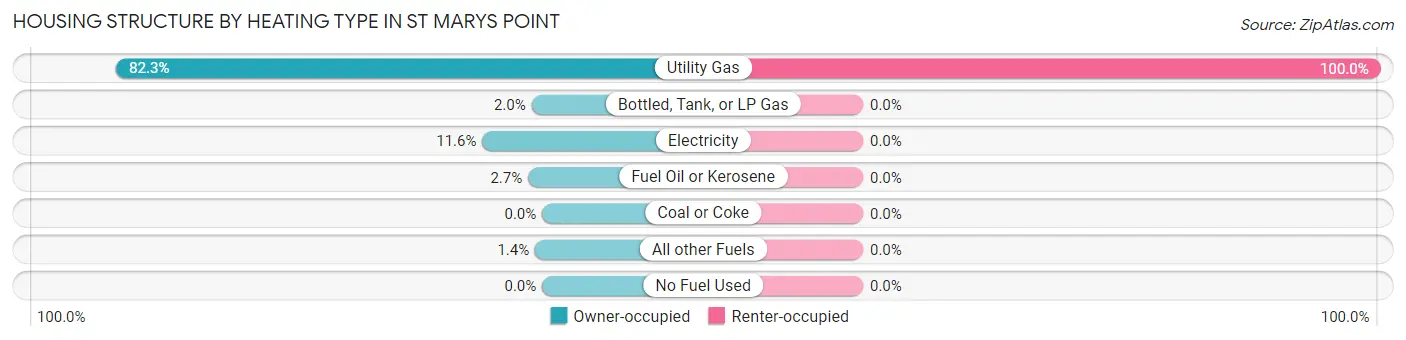
| Heating Type | Owner-occupied | Renter-occupied |
| Utility Gas | 121 (82.3%) | 22 (100.0%) |
| Bottled, Tank, or LP Gas | 3 (2.0%) | 0 (0.0%) |
| Electricity | 17 (11.6%) | 0 (0.0%) |
| Fuel Oil or Kerosene | 4 (2.7%) | 0 (0.0%) |
| Coal or Coke | 0 (0.0%) | 0 (0.0%) |
| All other Fuels | 2 (1.4%) | 0 (0.0%) |
| No Fuel Used | 0 (0.0%) | 0 (0.0%) |
| Total | 147 (100.0%) | 22 (100.0%) |
Household Vehicle Usage in St Marys Point
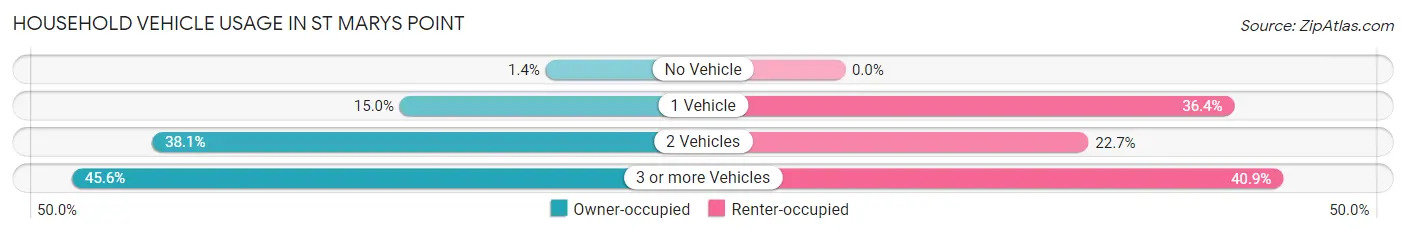
| Vehicles per Household | Owner-occupied | Renter-occupied |
| No Vehicle | 2 (1.4%) | 0 (0.0%) |
| 1 Vehicle | 22 (15.0%) | 8 (36.4%) |
| 2 Vehicles | 56 (38.1%) | 5 (22.7%) |
| 3 or more Vehicles | 67 (45.6%) | 9 (40.9%) |
| Total | 147 (100.0%) | 22 (100.0%) |
Real Estate & Mortgages in St Marys Point
Real Estate and Mortgage Overview in St Marys Point
| Characteristic | Without Mortgage | With Mortgage |
| Housing Units | 55 | 92 |
| Median Property Value | $412,500 | $446,200 |
| Median Household Income | $67,917 | $44 |
| Monthly Housing Costs | $690 | $16 |
| Real Estate Taxes | $2,964 | $6 |
Property Value by Mortgage Status in St Marys Point
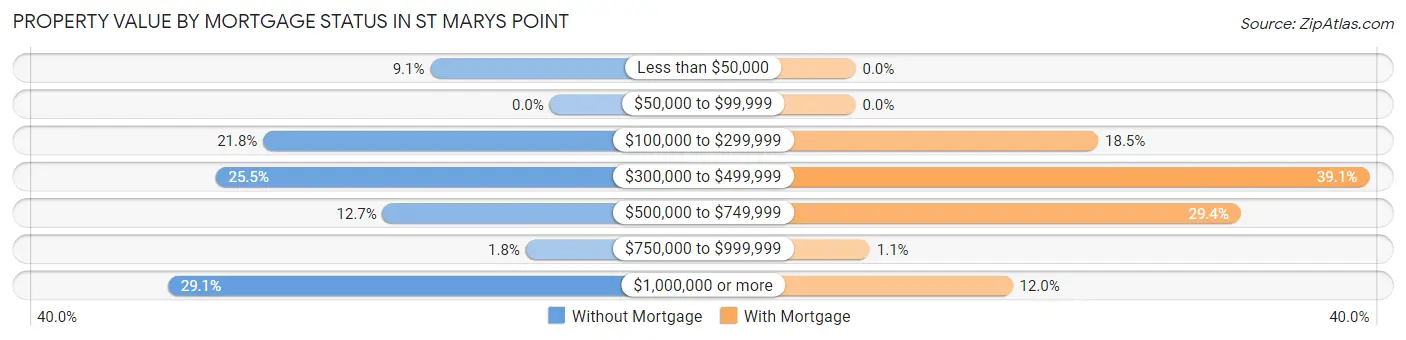
| Property Value | Without Mortgage | With Mortgage |
| Less than $50,000 | 5 (9.1%) | 0 (0.0%) |
| $50,000 to $99,999 | 0 (0.0%) | 0 (0.0%) |
| $100,000 to $299,999 | 12 (21.8%) | 17 (18.5%) |
| $300,000 to $499,999 | 14 (25.5%) | 36 (39.1%) |
| $500,000 to $749,999 | 7 (12.7%) | 27 (29.3%) |
| $750,000 to $999,999 | 1 (1.8%) | 1 (1.1%) |
| $1,000,000 or more | 16 (29.1%) | 11 (12.0%) |
| Total | 55 (100.0%) | 92 (100.0%) |
Household Income by Mortgage Status in St Marys Point
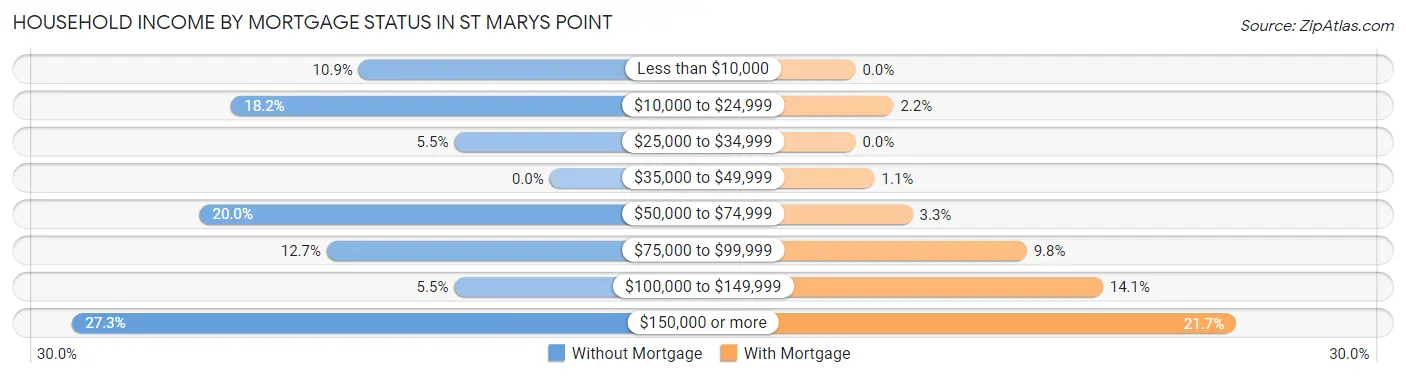
| Household Income | Without Mortgage | With Mortgage |
| Less than $10,000 | 6 (10.9%) | 0 (0.0%) |
| $10,000 to $24,999 | 10 (18.2%) | 2 (2.2%) |
| $25,000 to $34,999 | 3 (5.4%) | 0 (0.0%) |
| $35,000 to $49,999 | 0 (0.0%) | 1 (1.1%) |
| $50,000 to $74,999 | 11 (20.0%) | 3 (3.3%) |
| $75,000 to $99,999 | 7 (12.7%) | 9 (9.8%) |
| $100,000 to $149,999 | 3 (5.4%) | 13 (14.1%) |
| $150,000 or more | 15 (27.3%) | 20 (21.7%) |
| Total | 55 (100.0%) | 92 (100.0%) |
Property Value to Household Income Ratio in St Marys Point
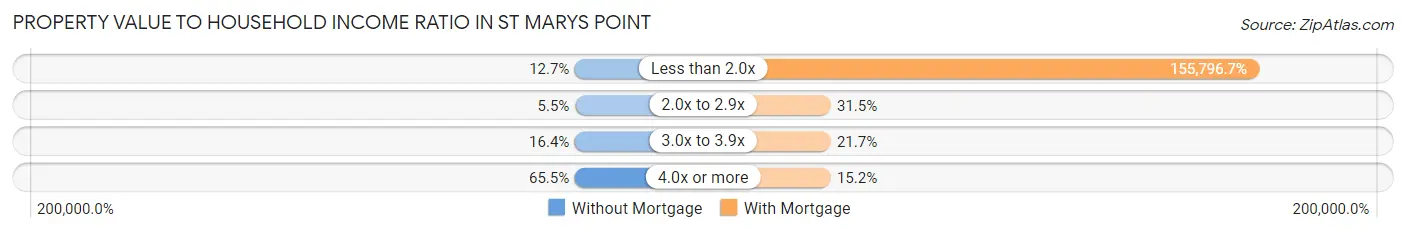
| Value-to-Income Ratio | Without Mortgage | With Mortgage |
| Less than 2.0x | 7 (12.7%) | 143,333 (155,796.7%) |
| 2.0x to 2.9x | 3 (5.4%) | 29 (31.5%) |
| 3.0x to 3.9x | 9 (16.4%) | 20 (21.7%) |
| 4.0x or more | 36 (65.4%) | 14 (15.2%) |
| Total | 55 (100.0%) | 92 (100.0%) |
Real Estate Taxes by Mortgage Status in St Marys Point
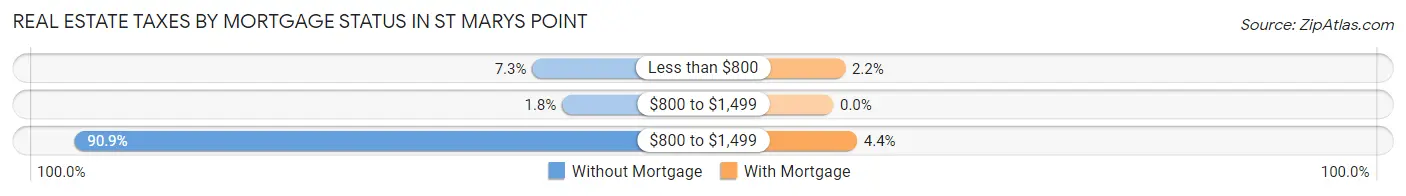
| Property Taxes | Without Mortgage | With Mortgage |
| Less than $800 | 4 (7.3%) | 2 (2.2%) |
| $800 to $1,499 | 1 (1.8%) | 0 (0.0%) |
| $800 to $1,499 | 50 (90.9%) | 4 (4.3%) |
| Total | 55 (100.0%) | 92 (100.0%) |
Health & Disability in St Marys Point
Health Insurance Coverage by Age in St Marys Point
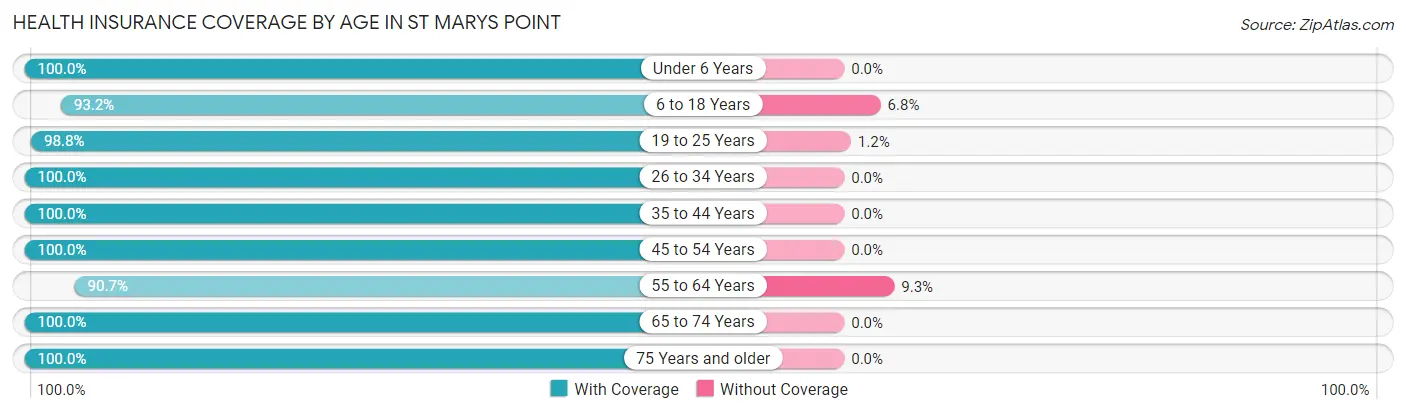
| Age Bracket | With Coverage | Without Coverage |
| Under 6 Years | 24 (100.0%) | 0 (0.0%) |
| 6 to 18 Years | 55 (93.2%) | 4 (6.8%) |
| 19 to 25 Years | 80 (98.8%) | 1 (1.2%) |
| 26 to 34 Years | 21 (100.0%) | 0 (0.0%) |
| 35 to 44 Years | 46 (100.0%) | 0 (0.0%) |
| 45 to 54 Years | 62 (100.0%) | 0 (0.0%) |
| 55 to 64 Years | 68 (90.7%) | 7 (9.3%) |
| 65 to 74 Years | 66 (100.0%) | 0 (0.0%) |
| 75 Years and older | 33 (100.0%) | 0 (0.0%) |
| Total | 455 (97.4%) | 12 (2.6%) |
Health Insurance Coverage by Citizenship Status in St Marys Point
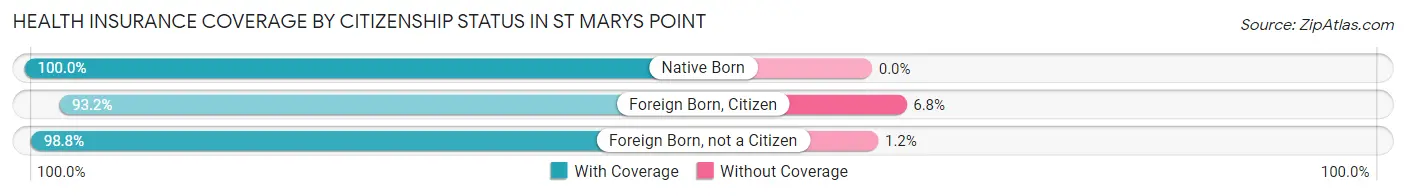
| Citizenship Status | With Coverage | Without Coverage |
| Native Born | 24 (100.0%) | 0 (0.0%) |
| Foreign Born, Citizen | 55 (93.2%) | 4 (6.8%) |
| Foreign Born, not a Citizen | 80 (98.8%) | 1 (1.2%) |
Health Insurance Coverage by Household Income in St Marys Point
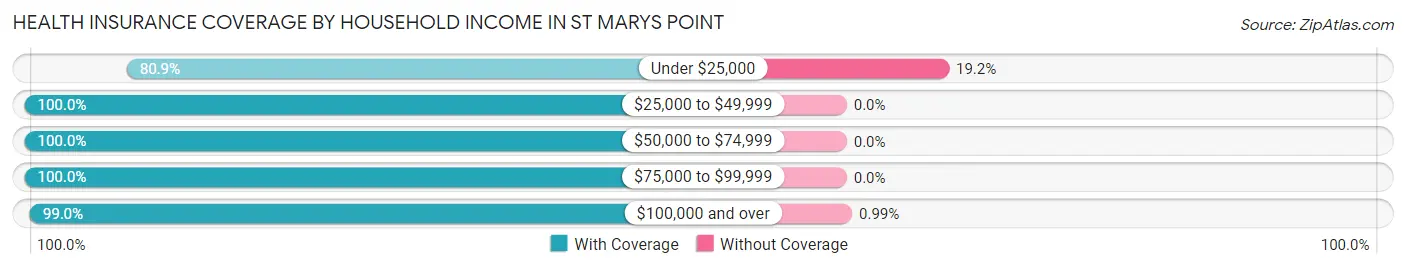
| Household Income | With Coverage | Without Coverage |
| Under $25,000 | 38 (80.8%) | 9 (19.2%) |
| $25,000 to $49,999 | 21 (100.0%) | 0 (0.0%) |
| $50,000 to $74,999 | 57 (100.0%) | 0 (0.0%) |
| $75,000 to $99,999 | 39 (100.0%) | 0 (0.0%) |
| $100,000 and over | 300 (99.0%) | 3 (1.0%) |
Public vs Private Health Insurance Coverage by Age in St Marys Point
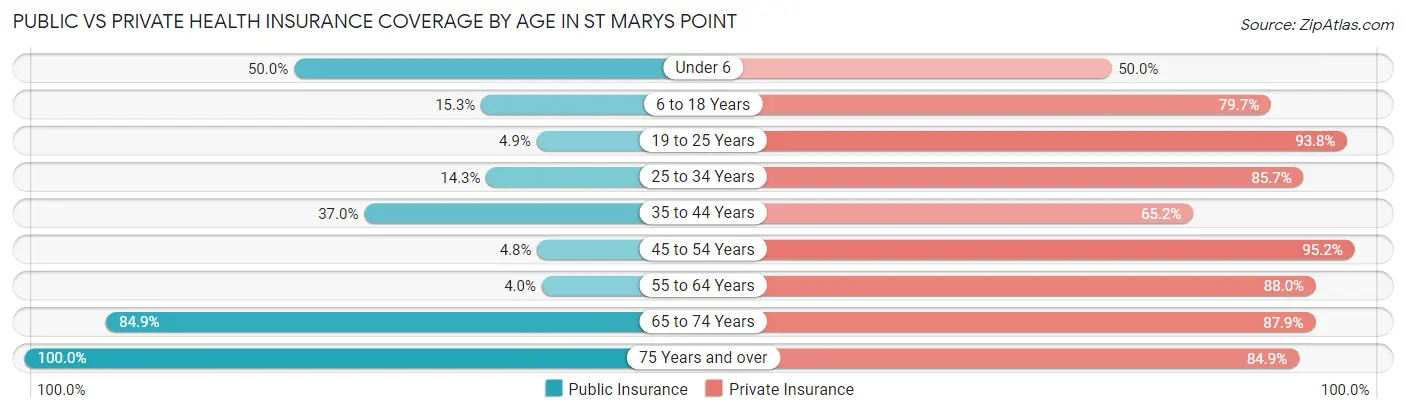
| Age Bracket | Public Insurance | Private Insurance |
| Under 6 | 12 (50.0%) | 12 (50.0%) |
| 6 to 18 Years | 9 (15.2%) | 47 (79.7%) |
| 19 to 25 Years | 4 (4.9%) | 76 (93.8%) |
| 25 to 34 Years | 3 (14.3%) | 18 (85.7%) |
| 35 to 44 Years | 17 (37.0%) | 30 (65.2%) |
| 45 to 54 Years | 3 (4.8%) | 59 (95.2%) |
| 55 to 64 Years | 3 (4.0%) | 66 (88.0%) |
| 65 to 74 Years | 56 (84.9%) | 58 (87.9%) |
| 75 Years and over | 33 (100.0%) | 28 (84.9%) |
| Total | 140 (30.0%) | 394 (84.4%) |
Disability Status by Sex by Age in St Marys Point
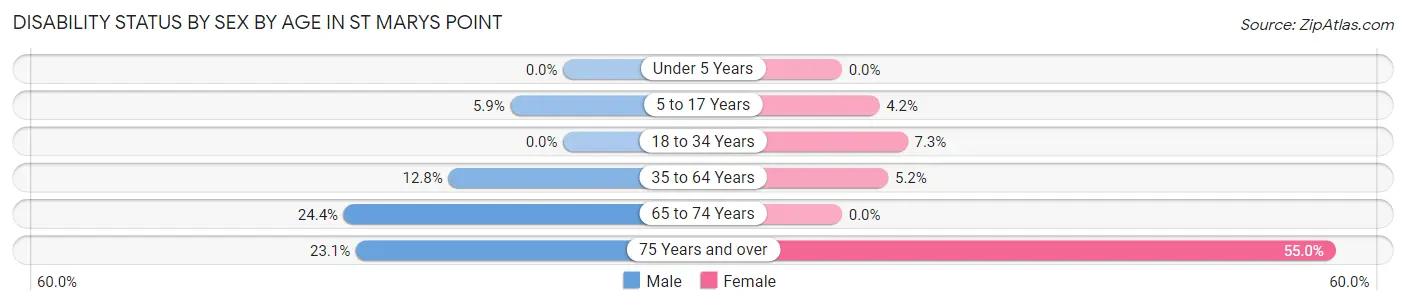
| Age Bracket | Male | Female |
| Under 5 Years | 0 (0.0%) | 0 (0.0%) |
| 5 to 17 Years | 2 (5.9%) | 1 (4.2%) |
| 18 to 34 Years | 0 (0.0%) | 3 (7.3%) |
| 35 to 64 Years | 11 (12.8%) | 5 (5.1%) |
| 65 to 74 Years | 11 (24.4%) | 0 (0.0%) |
| 75 Years and over | 3 (23.1%) | 11 (55.0%) |
Disability Class by Sex by Age in St Marys Point
Disability Class: Hearing Difficulty
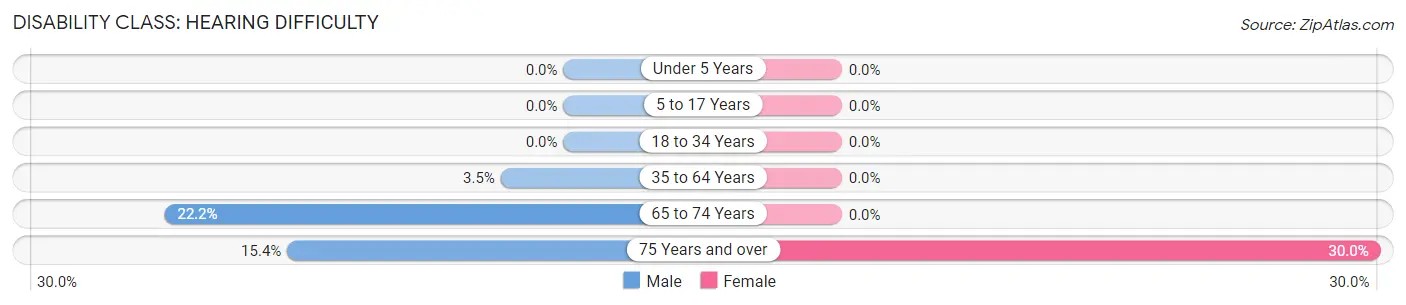
| Age Bracket | Male | Female |
| Under 5 Years | 0 (0.0%) | 0 (0.0%) |
| 5 to 17 Years | 0 (0.0%) | 0 (0.0%) |
| 18 to 34 Years | 0 (0.0%) | 0 (0.0%) |
| 35 to 64 Years | 3 (3.5%) | 0 (0.0%) |
| 65 to 74 Years | 10 (22.2%) | 0 (0.0%) |
| 75 Years and over | 2 (15.4%) | 6 (30.0%) |
Disability Class: Vision Difficulty
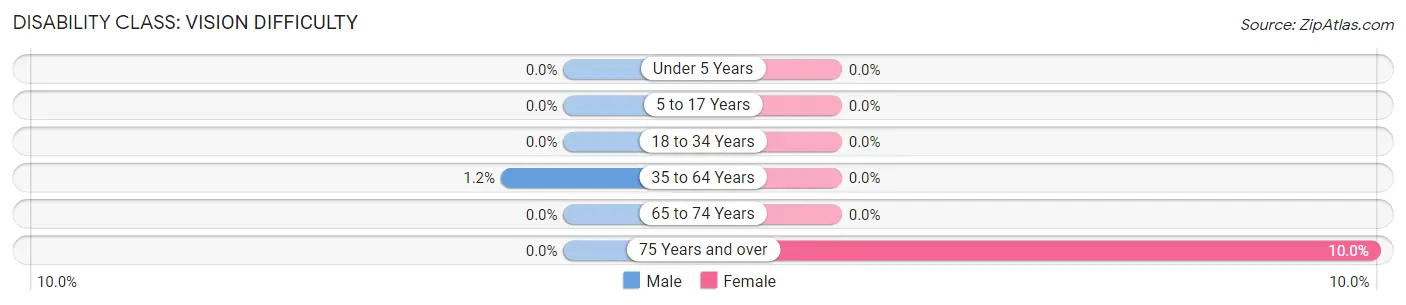
| Age Bracket | Male | Female |
| Under 5 Years | 0 (0.0%) | 0 (0.0%) |
| 5 to 17 Years | 0 (0.0%) | 0 (0.0%) |
| 18 to 34 Years | 0 (0.0%) | 0 (0.0%) |
| 35 to 64 Years | 1 (1.2%) | 0 (0.0%) |
| 65 to 74 Years | 0 (0.0%) | 0 (0.0%) |
| 75 Years and over | 0 (0.0%) | 2 (10.0%) |
Disability Class: Cognitive Difficulty
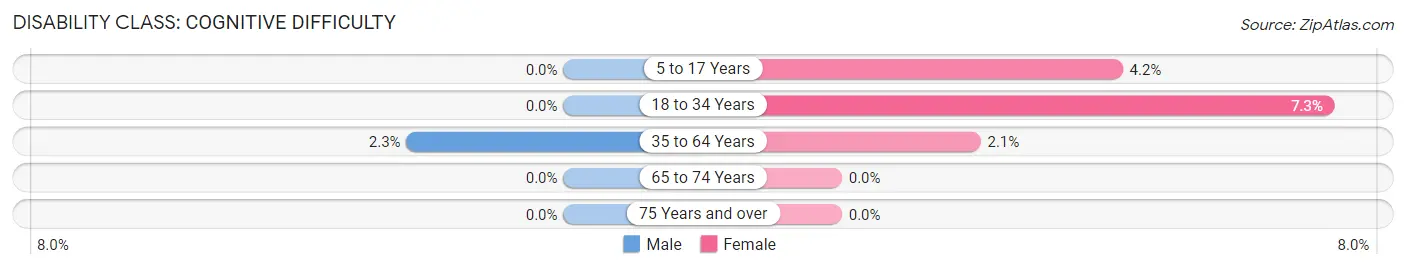
| Age Bracket | Male | Female |
| 5 to 17 Years | 0 (0.0%) | 1 (4.2%) |
| 18 to 34 Years | 0 (0.0%) | 3 (7.3%) |
| 35 to 64 Years | 2 (2.3%) | 2 (2.1%) |
| 65 to 74 Years | 0 (0.0%) | 0 (0.0%) |
| 75 Years and over | 0 (0.0%) | 0 (0.0%) |
Disability Class: Ambulatory Difficulty
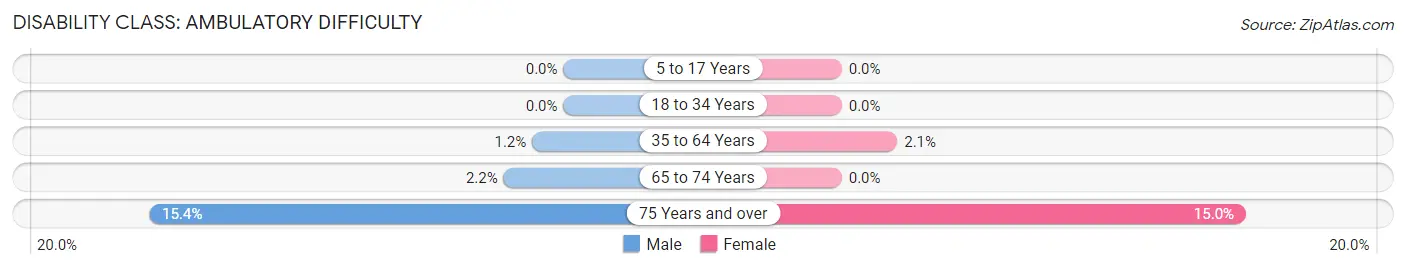
| Age Bracket | Male | Female |
| 5 to 17 Years | 0 (0.0%) | 0 (0.0%) |
| 18 to 34 Years | 0 (0.0%) | 0 (0.0%) |
| 35 to 64 Years | 1 (1.2%) | 2 (2.1%) |
| 65 to 74 Years | 1 (2.2%) | 0 (0.0%) |
| 75 Years and over | 2 (15.4%) | 3 (15.0%) |
Disability Class: Self-Care Difficulty
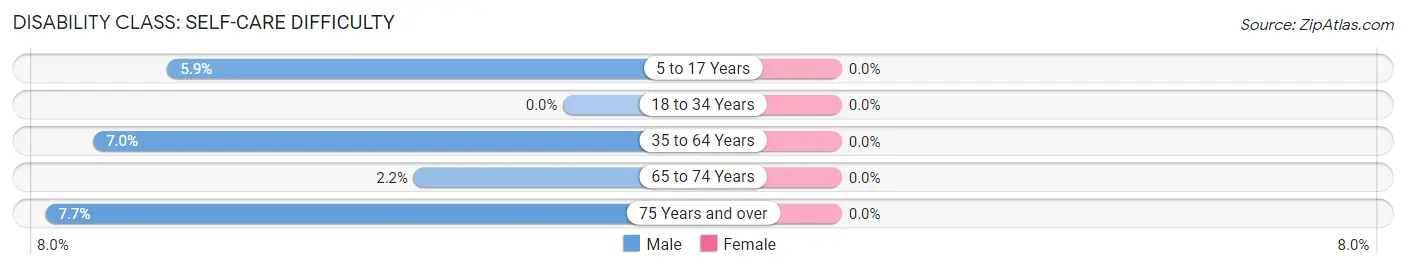
| Age Bracket | Male | Female |
| 5 to 17 Years | 2 (5.9%) | 0 (0.0%) |
| 18 to 34 Years | 0 (0.0%) | 0 (0.0%) |
| 35 to 64 Years | 6 (7.0%) | 0 (0.0%) |
| 65 to 74 Years | 1 (2.2%) | 0 (0.0%) |
| 75 Years and over | 1 (7.7%) | 0 (0.0%) |
Technology Access in St Marys Point
Computing Device Access in St Marys Point
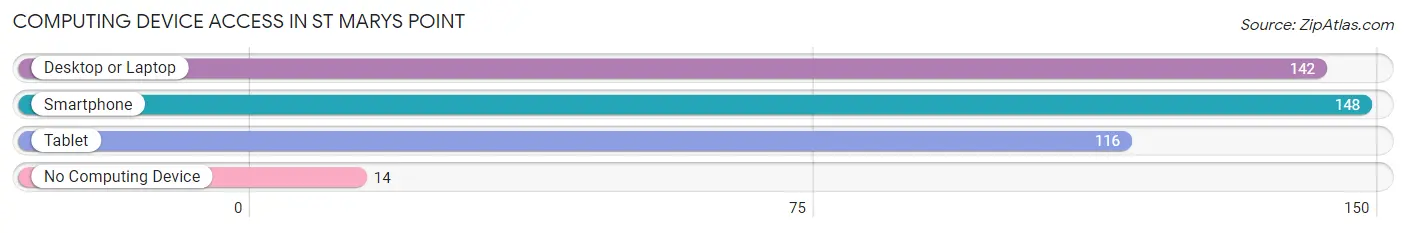
| Device Type | # Households | % Households |
| Desktop or Laptop | 142 | 84.0% |
| Smartphone | 148 | 87.6% |
| Tablet | 116 | 68.6% |
| No Computing Device | 14 | 8.3% |
| Total | 169 | 100.0% |
Internet Access in St Marys Point
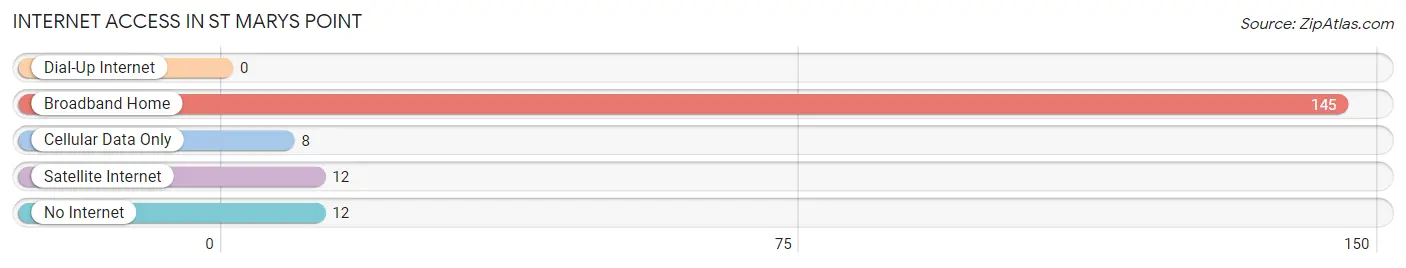
| Internet Type | # Households | % Households |
| Dial-Up Internet | 0 | 0.0% |
| Broadband Home | 145 | 85.8% |
| Cellular Data Only | 8 | 4.7% |
| Satellite Internet | 12 | 7.1% |
| No Internet | 12 | 7.1% |
| Total | 169 | 100.0% |
St Marys Point Summary
St Marys Point is a small unincorporated community located in Washington County, Minnesota, United States. It is situated on the banks of the St. Croix River, just south of the city of Stillwater. The population of St Marys Point was estimated to be around 1,000 in 2020.
History
St Marys Point was first settled in the early 1800s by French-Canadian fur traders. The area was originally known as “Pointe St. Marie” and was part of the original St. Croix River Valley settlement. The first permanent settlers arrived in the area in 1844 and the community was officially established in 1848.
The town was named after the nearby St. Mary’s Catholic Church, which was built in 1851. The church was the first Catholic church in the area and served as a focal point for the community.
The town grew steadily throughout the 19th century and by the early 20th century, it had become a popular summer resort destination. The town was home to several resorts, including the St. Mary’s Point Hotel, which was built in 1891.
The town was also home to a number of businesses, including a general store, a blacksmith shop, a sawmill, and a grist mill. The town also had a post office, which was established in 1887.
Geography
St Marys Point is located in the St. Croix River Valley, just south of the city of Stillwater. The town is situated on the banks of the St. Croix River and is surrounded by rolling hills and wooded areas. The town is located approximately 25 miles northeast of Minneapolis and is part of the Twin Cities metropolitan area.
The town has a total area of 0.7 square miles, all of which is land. The town is located at an elevation of 845 feet above sea level.
Economy
The economy of St Marys Point is largely based on tourism and recreation. The town is home to several resorts, including the St. Mary’s Point Hotel, which is a popular destination for visitors. The town is also home to a number of businesses, including a general store, a blacksmith shop, a sawmill, and a grist mill.
The town is also home to a number of small businesses, including restaurants, cafes, and shops. The town is also home to a number of art galleries and studios, which attract visitors from all over the region.
Demographics
As of the 2020 census, the population of St Marys Point was estimated to be around 1,000. The town has a median age of 44.7 years and a median household income of $60,000. The town is predominantly white, with 95.3% of the population identifying as white. The town also has a small Hispanic population, with 4.7% of the population identifying as Hispanic or Latino.
Conclusion
St Marys Point is a small unincorporated community located in Washington County, Minnesota. The town was first settled in the early 1800s by French-Canadian fur traders and was officially established in 1848. The town is situated on the banks of the St. Croix River and is surrounded by rolling hills and wooded areas. The economy of St Marys Point is largely based on tourism and recreation, and the town is home to several resorts, businesses, and art galleries. The population of St Marys Point was estimated to be around 1,000 in 2020.
Common Questions
What is Per Capita Income in St Marys Point?
Per Capita income in St Marys Point is $56,550.
What is the Median Family Income in St Marys Point?
Median Family Income in St Marys Point is $130,000.
What is the Median Household income in St Marys Point?
Median Household Income in St Marys Point is $105,625.
What is Income or Wage Gap in St Marys Point?
Income or Wage Gap in St Marys Point is 58.7%.
Women in St Marys Point earn 41.3 cents for every dollar earned by a man.
What is Inequality or Gini Index in St Marys Point?
Inequality or Gini Index in St Marys Point is 0.48.
What is the Total Population of St Marys Point?
Total Population of St Marys Point is 467.
What is the Total Male Population of St Marys Point?
Total Male Population of St Marys Point is 254.
What is the Total Female Population of St Marys Point?
Total Female Population of St Marys Point is 213.
What is the Ratio of Males per 100 Females in St Marys Point?
There are 119.25 Males per 100 Females in St Marys Point.
What is the Ratio of Females per 100 Males in St Marys Point?
There are 83.86 Females per 100 Males in St Marys Point.
What is the Median Population Age in St Marys Point?
Median Population Age in St Marys Point is 45.3 Years.
What is the Average Family Size in St Marys Point
Average Family Size in St Marys Point is 3.3 People.
What is the Average Household Size in St Marys Point
Average Household Size in St Marys Point is 2.8 People.
How Large is the Labor Force in St Marys Point?
There are 228 People in the Labor Forcein in St Marys Point.
What is the Percentage of People in the Labor Force in St Marys Point?
56.2% of People are in the Labor Force in St Marys Point.
What is the Unemployment Rate in St Marys Point?
Unemployment Rate in St Marys Point is 3.1%.